Idaho Oil and Gas 101 Bobby Johnson, P.G. Oil and Gas Program Manager Idaho Department of Lands.

IDAHO DEPARTMENT OF LANDS
YEAR-END
FIRE REPORT
CALENDAR YEAR
2014
2008
Governor C. L. “Butch” Otter and CDA Helitac on the Whiskey Complex


2014 YEAR-END FIRE REPORT
TABLE OF CONTENTS
SEASON IN REVIEW
FIRE WEATHER ..................................................................................... 2 FIRES IN THE WILDLAND URBAN INTERFACE ................................... 3 LARGE FIRES ........................................................................................ 5 MULTIPLE FIRES ................................................................................... 6 INCIDENT MANAGEMENT TEAM PARTICIPATION AND USE ............ 7 FIRE COSTS ........................................................................................... 8
PROGRAMS
AVIATION PROGRAM .......................................................................... 13 FIRE TRAINING .................................................................................... 17 STATE FIRE ASSISTANCE PROGRAM .............................................. 18 RANGELAND FIRE PROTECTION ASSOCIATIONS……………………19 FEDERAL EXCESS PERSONAL PROPERTY ..................................... 20 WILDLAND FIRE PREVENTION .......................................................... 23 COEUR D’ALENE INTERAGENCY FIRE CACHE ................................ 24
APPENDICES.................................................................................................. 29


IDAHO DEPARTMENT OF LANDS
YEAR-END FIRE REPORT
FOR CALENDAR YEAR (CY) 2014
SEASON IN REVIEW
The 2014 fire season was below average in terms of fire occurrence, but acres
burned were far above average, on the Idaho Department of Lands Protection
Area. Firefighters responded to 351 fires (95 percent of 32 year average) on
lands protected by the Idaho Department of Lands (IDL), Clearwater-Potlatch
Timber Protective Association (CPTPA), and Southern Idaho Timber Protective
Association (SITPA). These fires burned 82,525 acres, which is 685 percent of
the 32 year average acreage burned.
Quick response by dedicated teams
of firefighters kept 92 percent of the
fires in the IDL Protection Area to
less than 10 acres. This is slightly
below the IDL suppression goal of 94
percent.
Human activity ignited 134 fires (38
percent of the year’s total) that
burned 8,422 acres. Human-caused
fires accounted for 10 percent of the
burned area. The miscellaneous
category accounted for the most
human-caused fires; burned the
largest area, and was also the most expensive human-caused category.

2
Lightning started 217 fires (62 percent of the year’s total) and burned 74,104
acres, or 90 percent of the total area.
The average fire size was 235 acres, which is 717 percent of average. The
median fire size was 0.1 acres, which is the usual. The average cost per fire was
$63,028, and the cost per acre was $268.
FIRE WEATHER
The winter of 2014 was
colder and drier than
normal in Idaho. Early
spring brought above
normal precipitation
and provided a heavy
snowpack. Ample soil
moisture caused good
grass growth in the low
elevations. The heavy
snowpack did not melt until early summer. July was six degrees above normal
and cured the abundant grass for very active August fire activity in the low
elevations. The delayed snow melt caused the high elevation fire season to be
minimal. An early August thunderstorm started numerous fires that stretched
available resources.
2014 217 74,104 134 8,421 351 82,525
2013 212 2,554 110 4,654 322 7,208
2012 81 295 106 4,460 187 4,755
2011 113 289 136 727 249 1,016
2010 86 1,729 97 1,736 183 3,465
10 Yr Ave. 152 15,557 139 3,470 291 19,027
20 Yr Ave. 167 13,179 146 3,009 313 16,188
32-Yr Ave. 201 9,079 167 2,969 368 12,048
2014 LIGHTNING VS HUMAN FIRES
Year
Minor discrepancies exist due to rounding
# of
Lightning
Fires
Total
Acres
Burned
Lightning
Acres
Burned
# of
Human
Fires
Human
Acres
Burned
Total #
of Fires

3
FIRES IN THE WILDLAND URBAN INTERFACE
The wildland urban interface (WUI) consists of areas where human habitation
adjoins, or is mixed with, the wildland and wildland fuels. The character of the
WUI ranges from urban areas adjoining wildlands to isolated ranches or cabins.
Using county WUI designations, approximately 78 percent of the lands IDL
protects from wildfire fall within the WUI.
When a fire occurs within the WUI,
the job of firefighting becomes
more complex. Since 1993, the
number of structures in the WUI
has nearly doubled. As the
number of structures in the WUI
continues to increase, concerns
over public safety and the
protection of improvements
increases.
In 2014, 42 percent of IDL fires
started in the WUI, burned 4 percent
of the acreage, and accounted for 17
percent of the total cost of
suppression. Of the WUI fires, 49
percent were human-caused.
The highest human-caused ignition
sources in the WUI were
miscellaneous and debris burning. Equipment-use fires burned the most area,
but campfire-caused fires were the most expensive.
General # of % of Total % of Cost/
Cause Fires Fires Cost Cost Fire
Miscellaneous 30 41% $132,270 23.5% $4,409
Debris Burning 19 26% $65,160 11.6% $3,429
Campfire 14 19% $290,201 51.6% $20,729
Equipment Use 7 10% $71,867 12.8% $10,267
Arson 2 3% $3,383 0.6% $1,691
Children 1 1% $50 0.0% $50
Smoking 0 0% $0 0.0% $0Railroad 0 0% $0 0.0% $0
Total Human 73 100% $562,931 100% $7,711
Lightning 75 51% $3,293,323 85% $43,911
Human 73 49% $562,931 15% $7,711
Grand Total 148 100% $3,856,254 100% $26,056
NUMBER OF WUI FIRES BY CAUSE WITH COSTS
Human-Caused
Human and Lightning
Minor discrepancies exist due to rounding
General # of % of Total % of Cost/
Cause Fires Fires Cost Cost Fire
Miscellaneous 16 26% $2,034,552 73.6% $127,159
Equipment Use 12 20% $99,476 3.6% $8,290
Campfire 12 20% $8,652 0.3% $721
Debris Burning 11 18% $161,891 5.9% $14,717
Arson 9 15% $457,315 16.6% $50,813
Children 1 2% $952 0.0% $952
Smoking 0 0% $0 0% $0
Railroad 0 0% $0 0% $0
Total Human 61 100% $2,762,839 100% $45,292
Lightning 142 70% $15,503,709 85% $109,181
Human 61 30% $2,762,839 15% $45,292
Grand Total 203 100% $18,266,548 100% $89,983
Human and Lightning
Minor discrepancies exist due to rounding
Human-Caused
NUMBER OF NON WUI FIRES BY CAUSE WITH COSTS

4
In comparison, fires outside the WUI
accounted for 58 percent of the ignitions,
and burned 96 percent of the total acres.
Of the total suppression bill, 83
percent was spent outside the
WUI.
Lightning started the most fires outside
the WUI, burned the largest area, and
cost the most. Miscellaneous was the
most expensive human-caused
category.
Deer near a house on the Big Cougar Fire
Equipment Use 632.8 63% $71,867 13% $114
Debris Burning 141.8 14% $65,160 12% $460
Miscellaneous 129.8 13% $132,270 23% $1,019
Campfire 95.2 10% $290,201 52% $3,047
Arson 0.3 0.0% $3,383 0.6% $11,276
Children 0.1 0.0% $50 0.0% $500
Smoking 0.0 0.0% $0 0.0% $0
Railroad 0.0 0.0% $0 0.0% $0
Total Human 1,000.1 100% $562,931 100% $563
Lightning 1,935.9 66% $3,293,323 85% $1,701
Human 1,000.1 34% $562,931 15% $563
Grand Total 2,936 100% $3,856,254 100% $1,313
WUI ACRES BURNED BY CAUSE WITH COSTS
General Cause Acres
Burned
% of
AcreageTotal Cost
% of
Cost
Cost/
Acre
Human-Caused
Human and Lightning
Minor discrepancies exist due to rounding
Miscellaneous 6,958.6 94% $2,034,552 74% $292
Debris Burning 253.4 3% $161,891 6% $639
Equipment Use 116.3 2% $99,476 4% $855
Arson 91.8 1% $457,315 17% $4,982
Campfire 1.3 0% $8,652 0% $6,656
Children 0.1 0% $952 0% $9,517
Smoking 0.0 0% $0 0% $0Railroad 0.0 0% $0 0% $0
Total Human 7,421.5 100% $2,762,839 100% $372
Lightning 72,167.9 91% $15,503,709 85% $215
Human 7,421.5 9% $2,762,839 15% $372
Grand Total 79,589.4 100% $18,266,548 100% $230
Human-Caused
Human and Lightning
Minor discrepancies exist due to rounding
NON WUI ACRES BURNED BY CAUSE WITH COSTS
General Cause Acres
Burned
% of
AcreageTotal Cost
% of
Cost
Cost/
Acre

5
LARGE FIRES
In 2014, IDL had 14 fires that exceeded 100 acres. Craig Mountain FPD had six,
Southwest Idaho FPD had four, West St. Joe FPD had two, and Maggie Creek
and Mica FPD’s had one each. Six structures were lost in the Big Cougar fire.
Fire Whirl on the Upper Mica Complex-West St. Joe FPD-Tim Tevebaugh
Fire Name District Size Cost
Big Cougar Craig Mountain FPD 65,200 $5,511,089
Timber Butte Southwest Idaho FPD 6,796 $1,853,000
Highrange Craig Mountain FPD 4,748 $3,645,128
Pittsburg Craig Mountain FPD 1,800 $657,773
Calder Southwest Idaho FPD 904 $1,176,385
Grimes Southwest Idaho FPD 756 $968,300
Gifford Craig Mountain FPD 630 $59,744
Mack Southwest Idaho FPD 229 $675,000
Big Butte Maggie Creek FPD 172 $1,004
Coddington 1 West St. Joe FPD 131 $1,594,950
Weller Mica FPD 121 $19,000
Frei Hill Craig Mountain FPD 119 $8,557
Almost Craig Mountain FPD 110 $3,034
Midnight Mica West St. Joe FPD 109 $1,334,550
81,825 $17,507,514
FIRES OVER 100 ACRES
Total

6
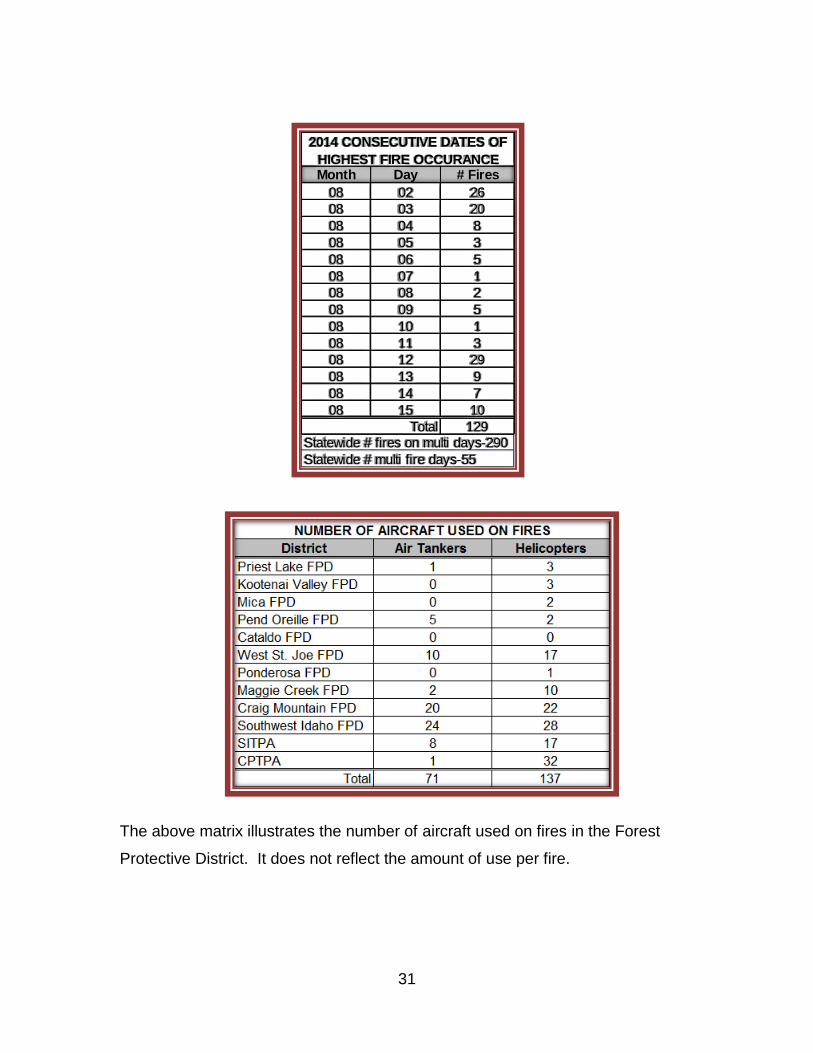
MULTIPLE FIRES
The 2014 fire season saw 55 days of more than one fire per day (multiple fire
days) on a Forest Protective District (FPD). CPTPA had 12 fires reported in a
single day. During the 14 days between August 2 and August 15, there were 129
new fire reports in the State’s protection area; 111 of these (86 percent) were
caused by lightning. August 12 had 29 fires reported, the most in any one day.
A total of 181 fires (52 percent of
the year’s total) occurred on
District multiple fire days.
Chimney Fire - Craig Mountain FPD
Total # # of Days with Most Fires
Multi Fires Multi Fires in 1 Day
CPTPA 57 14 12
West St. Joe FPD 33 9 8
SITPA 21 7 6
Craig Mountain FPD 14 4 7
Southwest Idaho FPD 14 5 4
Priest Lake FPD 11 4 5
Maggie Creek FPD 10 4 3
Pend Oreille FPD 9 3 5
Ponderosa FPD 8 3 3
Cataldo FPD 4 2 2
Kootenai Valley FPD 0 0 1
Mica FPD 0 0 1
Total 181 55 12
2014 MULTIPLE FIRES PER DAY BY DISTRICT
District

7
INCIDENT MANAGEMENT TEAM PARTICIPATION AND USE
In addition to IDL’s fire suppression responsibilities, IDL provided reimbursable
assistance to other agencies nationally. This assistance was in the form of
overhead, firefighters, IDL contracted aircraft, cache supplies, and rolling stock.
The Idaho Department of Lands supported Type 1 and 2 Interagency Incident
Management Teams (IMT) with 14 employees serving as primary team
members. In the Northern Rockies Geographic Area, IDL personnel held 10
positions on teams, and 4 positions on teams in the Great Basin Geographic
Area. Additionally, IDL personnel assisted the national effort by holding 12
positions as alternates, job share, or trainees. Type 3 Team support included ten
primary and nine alternate, job share, or trainee positions.
Morning briefing at 0600, on the Big Cougar Fire-Craig Mountain FPD
IDL not only assists the national fire effort by participating on IMTs, but personnel
also contributed by accepting 335 off-unit fire assignments in a variety of
positions. Resources were sent to ten states ranging from Alaska to California to
Colorado. Additionally, 142 man days were spent in Line Officer positions,
supervising IMT’s predominantly on IDL fires. IDL had Line Officers on two fires
on federal protection, which involved state or private forested lands. In these
cases, Line Officers represent IDL interests and assist local entities in dealing
with the federal agencies.

8
Eleven IDL fires required the use of IMTs. Craig Mountain, Southwest Idaho and
West St. Joe FPD’s utilized three IMT’s each and SITPA used two. Six Teams
were in place concurrently. IDL broke a record this year for the most IMT’s used
on IDL fires, and the most teams in place at one time.
The following table illustrates the use of Incident Management Teams on IDL
fires.
FIRE COSTS
State fire reports estimate 2014 suppression costs for IDL fires at $22,122,802.
This is the second most expensive year since 1983. The 2007 cost was
$471,000 more. The expenses in this report are based on a Calendar Year (CY)
fire season in order to accommodate most fire reporting systems. The ten most
expensive fires of the year are shown in the following table. These fires
represent only 3 percent of the total fires, 98 percent of the total acreage, and 83
percent of the total cost.
Big Cougar 65,200 Craig Mountain FPD $5,511,089 X
Timber Butte 6,796 Southwest Idaho FPD $1,853,000 X
Highrange 4,748 Craig Mountain FPD $3,645,128 X
Pittsburg 1,800 Craig Mountain FPD $657,773 X
Whiskey Complex* 1,662 Southwest Idaho FPD $2,223,235 X
Upper Mica Complex** 265 West St. Joe FPD $3,258,500 X
Mack 229 Southwest Idaho FPD $675,000 X
Wilson Piles 74 West St. Joe FPD $346,492 X
White Cloud 63 SITPA $139,444 X
St. Joe IA*** 52 West St. Joe FPD $599,681 X
East Mountain 36 SITPA $996,886 X
Totals 80,925 $19,906,227 4 5 2
INCIDENT MANAGEMENT TEAM USE
Fire Size DistrictEstimated
Cost
Type 3
Team
Type 2
Team
Type 1
Team
*The Whiskey Complex included three fires in IDL protection.
**The Upper Mica Complex included six fires.
*** The St. Joe IA Complex included 23 fires.
All burning concurently

9
Fire Name District Size Total Cost
Big Cougar Craig Mountain FPD 65,200 $5,511,089
Highrange Craig Mountain FPD 4,748 $3,645,128
Timber Butte Southwest Idaho FPD 6,796 $1,853,000
Coddington 1 West St. Joe FPD 131 $1,594,950
Midnight Mica West St. Joe FPD 109 $1,334,550
Calder Southwest Idaho FPD 904 $1,176,385
East Mountain SITPA 36 $996,886
Grimes Southwest Idaho FPD 756 $968,300
Mack Southwest Idaho FPD 229 $675,000
Pittsburg Craig Mountain FPD 1,800 $657,773
80,709 $18,413,061
TEN MOST EXPENSIVE FIRES IN 2014
Total
General Cause # of Fires % of Fires Cost % of Cost Cost/Fire
Miscellaneous 46 34% $2,166,822 65.2% $47,105
Debris Burning 30 22% $227,052 6.8% $7,568
Campfire 26 19% $298,853 9.0% $11,494
Equipment Use 19 14% $171,343 5.2% $9,018
Arson 11 8% $460,698 13.9% $41,882
Children 2 1% $1,002 0.0% $501
Smoking 0 0% $0 0.0% $0
Railroad 0 0% $0 0.0% $0
Total Human 134 100% $3,325,770 100% $24,819
Lightning 217 62% $18,797,032 85% $86,622
Human 134 38% $3,325,770 15% $24,819
Grand Total 351 100% $22,122,802 100% $63,028
Human-Caused
Human and Lightning
Minor discrepancies exist due to rounding
NUMBER OF FIRES BY CAUSE, WITH COSTS

10
Upper Mica Complex-West St. Joe FPD
Lightning started the largest number of fires and cost the most. In the human-
caused category, miscellaneous represented the most fires, and was the most
expensive. The average cost per fire was $63,028, with average lightning fire
expenses being $86,622, and human-caused fires costing an average $24,819.
Lightning fires burned 90 percent of the acreage in 2014. Miscellaneous-caused
fires burned the highest number of acres within the human-caused category.
Human-caused fires cost a total of $3,325,770 (15 percent of the total). Of this
amount, $180,229 (5 percent of human-caused) of the costs was from fires
attributable to negligence, and responsible parties have been billed. Some
investigations are ongoing and additional amounts may be billed, based on final
investigation findings.

11
As of December 1, when the fire reports were completed, IDL had collected
$178,741 (or 99 percent) of the amount billed. Typically, payment is received
from fire billings after December 1. IDL collected $1,075,079 from prior years’
billings, some of which were negligent payments.
Fire expense estimates must be used for this report instead of actual costs. IDL
has not received a bill for assistance from federal agencies that detail costs for
suppression assistance on IDL fires and reimbursable endowment land fires.
The federal bill is usually received in late spring.
In addition to the above estimated expenses for individual fires, fire suppression
costs were incurred in support of fire suppression, but not attributable to a
specific fire. Examples of these costs are: prepositioning resources to areas of
high fire danger or activity, fire simulation exercises, fire suppression aircraft
availability, and Fire Bureau and dispatch center support.
Miscellaneous 7,088 84% $2,166,822 $306
Equipment Use 749 9% $171,343 $229
Debris Burning 395 5% $227,052 $575 $180,229 $178,741
Campfire 97 1% $298,853 $3,096
Arson 92 1% $460,698 $5,002
Children 0.2 0% $1,002 $5,008
Smoking 0 0% $0 $0 Railroad 0 0% $0 $0
Total Human 8,422 100% $3,325,770 $395 $180,229 $178,741
Lightning 74,104 90% $18,797,032 $254
Human 8,422 10% $3,325,770 $395 $180,229 $178,741
Grand Total 82,525 100% $22,122,802 $268 $180,229 $178,741
$1,075,079
$1,253,820
Bill
Amount
ACRES BURNED BY CAUSE, WITH COSTS
Collections From Prior Years Negligent Fires
Total Calendar Year Collections
Minor discrepancies exist due to rounding
Human-Caused
Amount
Collected
General
Cause
Acres
Burned
% of
Acreage Cost
Cost/
Acre
Human and Lightning

12
Midnight Mica Fire-part of the Upper Mica Complex-West St. Joe FPD
Losses to the State
endowments, in resource
damage, are estimated at
$1,389,770. These losses
were primarily incurred on
the Johnson Bar Fire,
located near Lowell. Most
of the timber will be sold.
The values shown are due
to the reduced value of
burned timber.
District Timber
Loss
Reproduction
Loss
West St. Joe FPD $61,500 $17,750
CPTPA $12,670 $2,750
Mica FPD $3,200 $100
Priest Lake FPD $2,000 $0
Pend Oreille FPD $1,500 $300
Cataldo FPD $1,050 $1,250
Maggie Creek FPD $200 $0
IDL Protection Total $82,120 $22,150
Rush Fire-Payette Lakes $500 $0
Johnson Bar Fire-Maggie Creek $1,285,000 $0
Federal Protection Total $1,285,500 $0
Timber/Reproduction Total $1,367,620 $22,150
Grand Total
RESOURCE LOSS ON ENDOWMENT LANDS
$1,389,770
IN IDL PROTECTION
IN FEDERAL PROTECTION
13
PROGRAMS
AVIATION PROGRAM
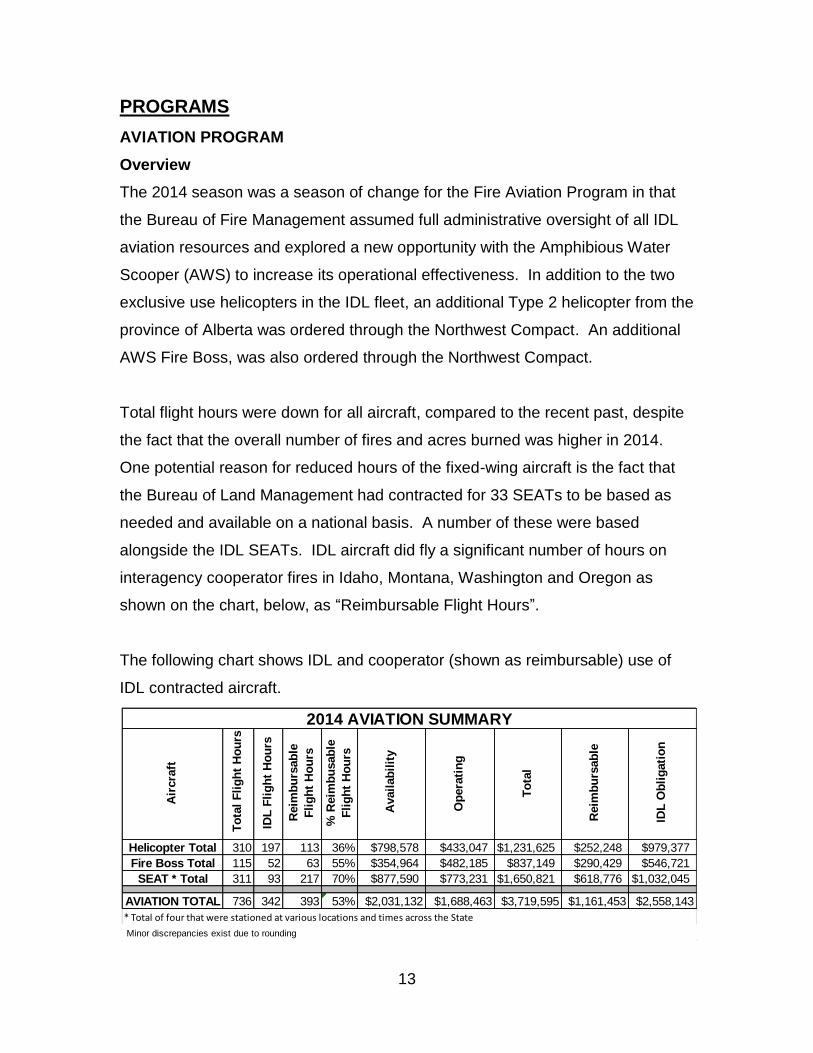
Overview
The 2014 season was a season of change for the Fire Aviation Program in that
the Bureau of Fire Management assumed full administrative oversight of all IDL
aviation resources and explored a new opportunity with the Amphibious Water
Scooper (AWS) to increase its operational effectiveness. In addition to the two
exclusive use helicopters in the IDL fleet, an additional Type 2 helicopter from the
province of Alberta was ordered through the Northwest Compact. An additional
AWS Fire Boss, was also ordered through the Northwest Compact.
Total flight hours were down for all aircraft, compared to the recent past, despite
the fact that the overall number of fires and acres burned was higher in 2014.
One potential reason for reduced hours of the fixed-wing aircraft is the fact that
the Bureau of Land Management had contracted for 33 SEATs to be based as
needed and available on a national basis. A number of these were based
alongside the IDL SEATs. IDL aircraft did fly a significant number of hours on
interagency cooperator fires in Idaho, Montana, Washington and Oregon as
shown on the chart, below, as “Reimbursable Flight Hours”.
The following chart shows IDL and cooperator (shown as reimbursable) use of
IDL contracted aircraft.
Air
cra
ft
To
tal
Fli
gh
t H
ou
rs
IDL
Fli
gh
t H
ou
rs
Reim
bu
rsab
le
Fli
gh
t H
ou
rs
% R
eim
bu
sab
le
Fli
gh
t H
ou
rs
Avail
ab
ilit
y
Op
era
tin
g
To
tal
Reim
bu
rsab
le
IDL
Ob
lig
ati
on
Helicopter Total 310 197 113 36% $798,578 $433,047 $1,231,625 $252,248 $979,377
Fire Boss Total 115 52 63 55% $354,964 $482,185 $837,149 $290,429 $546,721
SEAT * Total 311 93 217 70% $877,590 $773,231 $1,650,821 $618,776 $1,032,045
AVIATION TOTAL 736 342 393 53% $2,031,132 $1,688,463 $3,719,595 $1,161,453 $2,558,143
2014 AVIATION SUMMARY
Minor discrepancies exist due to rounding
* Total of four that were stationed at various locations and times across the State

14
Single Engine Air Tankers (SEATs)
The Idaho Department of Lands continues to contract four SEATs based
throughout the State to provide coverage for IDL protection responsibilities and
also to assist as needed and available on other lands. The Air Tractor 802F is a
fast and maneuverable aircraft that is both operationally effective and
economical. Queen Bee Air Specialties of Rigby, ID, is the contractor that
provides the SEAT aircraft and the US Forest Service continues to provide the
tanker base support for IDL SEATs. Overall, total flight hours of the SEATs was
down from the 2013 fire season.
The US Forest Service has three Air Tanker Bases that IDL utilizes as the
designated bases for the SEAT aircraft. IDL has one SEAT based in McCall, two
based in Grangeville, and one in Coeur d’Alene, along with the Fire Boss. These
are the designated bases, however; the aircraft can be moved as needed and
supported at alternate bases. In 2014, IDL conducted training at three of the four
alternate bases (Shoshone County Airport, Bonners Ferry Airport and the
Sandpoint Airport), missing only the St. Maries Airport alternate base. During the
course of the fire season the Bonners Ferry and Sandpoint alternate bases were
used to support fire operations in those Forest Protective Districts.
A SEAT Working the Bodenstein Piles Fire Pend Oreille FPD

15
Amphibious Water Scooper (AWS)/ Fire Boss
All aircraft began and ended the season at their designated bases except for the
Fire Boss (FB-851) which started and ended the season at the base in McCall in
support of fire operations in the southwestern part of the State. As the fire
season moved northward the Fire Boss was also moved as well. Despite the
absence of suitable lakes the Fire Boss was used on the Big Cougar Fire on the
Craig Mountain Forest Protective District, scooping out of the Snake River near
the confluence of the Grand Ronde River.
Built on the same AT-802F frame as the SEAT the Fire Boss is equipped with
Wipaire amphibious floats, can scoop 800 gallons of water in 12–15 seconds,
and be off the water in as few as 20–30 seconds. Upon dispatch from base it
can carry an initial load of retardant and then work close to the fire, scooping
from nearby lakes and rivers.
Fire Boss Refilling on the Snake River, on the Big Cougar Fire-Craig Mountain FPD

16
Total flight hours for the Fire Boss were down from 206 total flight hours in 2013
to 115 in 2014, with over half of those hours being flown on fires for interagency
partners. Following the end of the contract period in late September there was
further need in mid-October for use of an AWS. Aero-Spray, the vendor that
provides the Department with the Fire Boss, was able to fill the need with a Fire
Boss stationed at the Deer Park, WA airport. This aircraft flew almost nine hours
over the course of two days on a late-season fire in northern Idaho.
Helicopters
Previously managed by the Craig Mountain Forest Protective District, the Type 3
helicopter and booster crew based in Craigmont, transitioned this year to
oversight by the Fire Bureau, similar to the Coeur d’Alene-based Type 2
helicopter. As statewide resources, these aircraft spent time in both Regions 1
and 4, and slipped in to support Region 6 on the Freezeout Ridge Fire, burning
on the Wallowa-Whitman National Forest on the Idaho side of the Snake River.
While on Assignment in Montana - A Bear Finding Shade

17
FIRE TRAINING
The Training and Safety Specialist, within the Fire Bureau, coordinates and
tracks the fire training for approximately 450+ full-time and part-time Idaho
Department of Lands (IDL) employees.
At the local level, fire staff provides specific training to seasonal personnel for
local district fires. In June, the North Idaho Interagency Guard School took place
at Camp Lutherhaven near Coeur d’Alene. This guard school provided basic
wildland firefighting training to 183 participants (IDL, USFS, and BIA). There
were two Interagency Fire Academies in southern Idaho that also provided
training for seasonal firefighters.
Portable Pump Training at Cataldo FPD
The Training & Safety Specialist coordinates training for wildland personnel in the
Northern Rockies and Great Basin Geographic Areas, under the National Wildfire

18
Coordination Group (NWCG), which gives training beyond the basics of wildland
firefighting. During the 2014 training season, 10,000+ hours of training were
accomplished by IDL fire personnel.
The Fire Bureau is also responsible for tracking fire personnel through a
computerized data base, Incident Qualification System (IQS), and issues Incident
Qualification Cards (Red Cards) to those personnel who meet NWCG standards.
Approximately 400+ IDL, 80 Association (CPTPA & SITPA), 100 Fire Service
Organization, 11 Idaho Department of Parks & Recreation, 4 Idaho Department
of Corrections, 22 Casual (AD) personnel, and 250 Rangeland Fire Protection
Associations were issued Incident Qualification Cards through the Fire Bureau,
or in conjunction with the Area Offices.
In addition, in 2014, 109 personnel completed Position Task Books for advanced
qualifications beyond basic firefighter. This breaks down to 28 IDL permanent full
time employees, 52 IDL seasonal employees, and 29 Fire Service Organization
personnel completing advanced Position Task Books.
STATE FIRE ASSISTANCE PROGRAM
Preparedness
The State Fire Assistance (SFA) program helps protect lives, property, and
natural resources through the cooperative efforts of the State, local, and federal
entities. This program assists with preparedness by training and equipping
firefighters for national deployment and by supporting an interagency fire cache
and four interagency dispatch centers. IDL leads the Idaho wildland fire
community as it works together through State and county working groups,
interagency after-action reviews, mock fire exercises, and extensive networking
and dialogue.

19
Volunteer Fire Assistance
Volunteer Fire Assistance (VFA) provides financial assistance to organize, train,
and equip Fire Service Organizations (FSOs) and Rangeland Fire Protection
Associations (RFPAs) in rural areas and rural communities. There is a
continuous effort among fire districts and agencies to strengthen their
coordination and communication. In 2014, Idaho Department of Lands received
67 VFA grant applications with a total request of $537,131; of these, 51 rural
FSOs and RFPAs received VFA awards totaling $134,999.
RANGELAND FIRE PROTECTION ASSOCIATIONS (RFPA)
IN IDAHO
A total of five RFPAs were operational for the 2014 fire season.
The five groups are in southern Idaho, located in Ada, Boise
Elmore, Gem, Owyhee, Twin Falls, and Washington Counties.
To date, 250 RFPA members have been trained. The five
RFPAs combined protect 686,000 acres of private rangeland that was previously
unprotected, as well as providing secondary protection on 2.9 million acres of
federal and State land.
This year was again a success for all five RFPAs: Mountain Home, Owyhee,
Saylor Creek, Three Creek, and Black Canyon. Between them, they played a
vital role in actively suppressing and limiting acres burned on 21 fires. These
fires ranged from a small one-tenth of an acre, to just less than 7,000 acres.
While they were critical in helping suppress fires, the relationships that continue
to develop along the way were just as important. This is a testament to the
commitment and dedication that the members and leaders from all RFPAs, and
the Boise and Twin Falls Districts of the Bureau of Land Management (BLM), put
in to making it successful. RFPA member’s knowledge of the rangeland is
invaluable. They know access routes, water resources, fences, old burn scars,
etc., which helps wildland agencies’ resources arrive on scene quickly, make

20
sound decisions, and actively engage in suppressing these fires. There were
numerous times the RFPAs were ready and willing with tractor disks, dozers, and
other equipment to lend a hand in the suppression efforts. Strong leadership is a
key factor in making an RFPA a success. The leadership in all five RFPAs run
very good programs and maintain good communication with the Idaho
Department of Lands (IDL), the BLM, and their association membership.
Currently, there are six additional areas where landowners have begun to have
the conversation of starting an RFPA. At this point, one RFPA might be ready for
the 2015 fire season.
FEDERAL EXCESS PERSONAL PROPERTY and
FIREFIGHTER PROPERTY PROGRAMS
The Federal Excess Personal Property (FEPP) program is authorized by the
Federal Property and Administrative Services Act of 1949, as amended (P.L. 94-
519), and Section 7 of the Cooperative Forestry Assistance Act of 1978 (P.L. 95-
313). The Fire Fighter Property (FFP) program is authorized under 10 U.S.C.
2576b.
The FEPP and FFP programs enable the Idaho Department of Lands (hereafter
referred to as IDL) to acquire federal vehicles and equipment for fire protection
use by IDL Forest Protective Districts, Timber Protective Associations (hereafter
referred to as TPAs), and for fire and other emergency use by Fire Service
Organizations (FSOs) i.e., local city, county, and rural fire districts/departments.
The US Forest Service administers these programs nationally, and the Idaho
Department of Lands administers these programs within the state of Idaho. The
privilege to acquire and use FEPP and FFP vehicles and equipment is a
significant benefit to the citizens of the state of Idaho because it represents a

21
substantial savings for the end user, compared to the cost of purchasing new
vehicles or equipment.
The Idaho Department of Lands Vehicle Maintenance Shop in Coeur d’Alene
plays a major role in the FEPP and FFP programs. When vehicles and
equipment are acquired, they are often refurbished and/or retrofitted by the shop
into usable firefighting apparatus. It is common practice for the shop to inspect,
repair, and paint the vehicles and equipment before being distributed within the
IDL fire program or provided to the eligible FSOs.
REVIEW
2014 FEPP Program
Assets Acquired: 14
Original Acquisition Value: $95,728
Acquisition Value- for IDL: $0
Acquisition Value- for FSOs: $95,728
Secured Asset Highlights:
3 Type 5 Engines
4 Pumps & Tanks
1 Slip-in Unit
Misc. Firefighting
2014 FFP Program
Assets Acquired: 57
Original Acquisition Value: $5,119,479
Acquisition Value- for IDL: $1,170,482
Acquisition Value- for FSOs: $3,948,997
Secured Asset Highlights:
13 M939 Series 6X6 5-ton trucks
18 M915A1 4X6 Tractors
21 Trailer Floodlight Sets

22
1 M978A2 HEMTT Tanker
4 Dozers/Forklifts/Loaders
Shop Equipment & Supply
FEPP Disposals: 58
Original Acquisition Value: $1,653,115
Disposal Highlights:
Gama Goats
60, 70, 80’s Vintage 6X6, 2 ½ & 5 ton trucks
Mobile Homes & Wood Structures
Idaho’s FEPP and FFP inventory is in a constant state of change due to continual
screening, acquisitioning, surplus declarations and disposals. However, Idaho
currently has over 500 vehicles and pieces of equipment which have been
acquired through the FEPP and FFP programs. These assets are distributed
between IDL Area and Forest Protective Districts, Timber Protective
Associations, Rangeland Fire Protection Associations, and FSOs throughout
Idaho as follows:
The total original acquisition value for all FEPP managed by the IDL:
$10,597,624
The total original acquisition value for all FFP managed by the IDL:
$9,959,876
The cumulative total original acquisition value of all FEPP and FFP:
$20,557,500

23
WILDLAND FIRE PREVENTION
Early spring saw the production and distribution of the most recent “Don’t Be a
Guberif” coloring book to Idaho’s Forest Protective Districts and city, county and
rural fire departments. Thanks to Idaho Firewise for providing this opportunity.
As we continued to move forward towards the fire season each of the Forest
Protective Districts and the two Timber Protective Associations responded
proactively with fire prevention messaging. As a whole, they conducted over 90
presentations at more than 40 schools. Through that tremendous effort over
7,300 students were reached.
The Idaho Fire Prevention team spent
time working on and introducing the
“One Less Spark” campaign. With a
goal of reducing the number of
human-caused fires through
development of a central message,
and instilling positive change in
behavior where individuals take

24
responsibility to reduce the risks and effects of wildfire, this program is being
successfully utilized in five other states. The Idaho campaign will include
outreach efforts on fire causes, graphics, and the use of social media to spread
the word. This “One Less Spark” campaign is aimed at decreasing the number
of those fires that threaten private residences and Idaho’s natural resources.
One other important desired “end result” of this program is to increase the public
awareness of the importance of protecting Sage Grouse habitat, and one
adaptable means of doing so is through prevention of human-caused fires. For
further information and to learn how you can help to protect Idaho’s sagebrush
ecosystem from destructive wildfires please visit www.idahofireblogspot.com.
The City of Eagle is home to the
new Eagle Firewise Garden, with
ribbon cutting held by Eagle Parks
and Recreation. As described in
their posting, “the Firewise
Garden demonstrates landscape
beauty, smart environmental
safety choices and efficient use of
resources to our Eagle residents
and Treasure Valley community”.
Brett Van Paepeghem, pictured, is the South Idaho Project Manager for Idaho
Firewise and provided the leadership to make this project come to fruition. The
garden is a collaborative effort of the City of Eagle’s Park and Recreation
Department, the Eagle Fire Department, the Bureau of Land Management, Idaho
Firewise, and the Healthy Hills Initiative.
COEUR D’ALENE INTERAGENCY FIRE CACHE
The role of the Coeur d’Alene Interagency Fire Cache (Cache or CDK) is to
provide logistical support to requesting state, federal, and cooperating agencies.
Although the Cache is primarily oriented toward supporting wildland fire

25
suppression activities, it also provides assistance to the Bureau of Homeland
Security, declared state and federal emergencies, and other natural disasters, as
well as large projects such as prescribed burns.
The Cache found the 2014 fire season to above average, with considerable
complexity. Geographically, CDK experienced minimal supply movement in the
northern portion of the Idaho Panhandle, and heavy supply movement into the
southern portion of the support zone.
CDK was also heavily engaged with supporting many of the National Interagency
Support Caches (NISC) across the United States. This support was
predominately associated with shipping federal supply assets, valued at
approximately $8 million, which were preemptively purchased by the Washington
Office of the USFS, then shipped and stored within the NISC community before
fire season. These supplies were strategically placed at three predetermined
Caches across the country: Coeur d’Alene, ID, Denver, CO, and Ontario, CA.
This was done in an effort to buffer any unforeseen issues arising as a result of
the General Services Administration (GSA), Wildfire Supply & Equipment Supply
Program moving to the Department of Defense, Defense Logistics Agency (DLA).
Of this pre-purchased federal inventory, CDK received and stored approximately
$2.1 million worth of wildfire fighting assets (hose, nozzles, valves, Nomex
clothing, etc.) to assist with the 2014 national wildfire efforts.
Supply Support
The Cache supported five Type 2 and eight Type 3 Incident Management Teams
(IMT). Additionally, CDK directly outfitted one helitack crew and four engine
modules from Canada, which were provided through the Northwest Compact.
Supply movement, state to state, was extensive in 2014. CDK honored supply
requests, especially early on in the season. Supply resources were shipped to
NISC units and Incident Management Teams to assist local and regional

26
suppression efforts in Montana, Oregon, Washington, Colorado, Alaska,
Northern and Southern California. When Idaho’s fire season kicked off, CDK
received supplies to support IMT efforts from twelve of the fifteen NISC’s across
the US, including Alaska. This logistical ebb and flow of the collective NISC
Inventory, valued at approximately $120 million, is key to the successful support
of firefighters locally and abroad.
Staffing and Transportation
The magnitude of the local and national fire suppression efforts created a
substantial workload for CDK. To compensate, the Cache organized overlapping
split-shifts (day/night), and hired 46 additional casual employees to assist with
the shipment, return, and refurbishment of fire supplies. CDK also brought in
three detailers from within the NISC community. Montana provided a qualified
Assistant Cache Manager (ACMR) to help with database management. Alaska
provided a Small Engine Mechanic (SMEC) to assist in the Small Engine Repair
Shop and Colorado sent a qualified Materials Handler Leader Trainee (WHLR-T)
to help manage supply operations. Additionally, CDK rented a total of 17 box
trucks, 4x4 pickups and cargo vans. CDK also brought in two USFS vehicles to
augment the existing fleet and meet workload requirements. By season’s end,
CDK staff
members had
transported
supplies and
equipment,
exceeding
55,000 miles.
A hot day in California.
CDK resources
deployed on the Happy
Camp Complex

27
Data Administration
The 2014 fire season generated the greatest business volume experienced at
CDK since bringing on the Incident Cache Business System (ICBS-R) database
back in June of 2010. To assist with managing the large volumes of data, two
additional clerks were trained to assist the ACMR. CDK also employed a NISC
specialist to audit all project Type 2 and 3 fire packages.
Small Engine Repair Shop (Pump Shop)
The Pump Shop was heavily impacted during the 2014 season. Mechanics
received, diagnosed and repaired more than 390 pieces of equipment, i.e.,
pumps, chainsaws, generators, etc. To help with the excessive work load, CDK
ordered and received a senior Small Engine Mechanic from the Alaska Cache.
The Pump Shop continues to work on residual equipment related to the 2014 fire
season at the time of this report.
2014 Basic Business Summary
Managed Shelf Stock $8,060,121
Managed Field Inventory* $828,053
Current Cache Value (Pre-inventory) $8,888,174
*Cache supplies prepositioned to Areas, Districts, and Associations Wildland Fire Incidents Served 163 each
Total Issues - 1122 $5,667,259
Total Returns - 486 $2,507,769
Total Transfers Cache to Cache - 95 $4,202,029 Total Supply Movement $12,377,057

28
2014 Routine Supply Orders
2014 Sales Total $542,412 vs. 2013 Sales Total $382,580
CATALDO, $15,532
BLM, $6,951
IPNF, $102,015
TRIBES, $72,447
ST. JOE, $2,164
SOUTHWEST, $30,558 EASTERN, $68,611 CLEARWATER, $1,070
OTHER, $61,553
SITPA, $1,461
CPTPA, $25,706
PRIEST LAKE, $4,693
CRAIG MTN, $7,796
KOOTENAI VALLEY, $3,963
MAGGIE CREEK, $9,459
RFPA'S, $67,515
MICA, $14,979
PEND ORELLE, $39,523
PONDEROSA, $6,416

29
APPENDICES

30
District # Fires A B C D E F G
CPTPA 81 70 11
West St. Joe FPD 55 39 9 5 2
SITPA 44 33 9 2
Pend Oreille FPD 32 24 8
Southwest Idaho FPD 28 11 12 1 1 1 1 1
Craig Mountain FPD 27 10 8 3 2 1 2 1
Ponderosa FPD 19 10 9
Maggie Creek FPD 19 9 6 3 1
Priest Lake FPD 16 13 2 1
Mica FPD 15 5 7 2 1
Cataldo FPD 8 8
Kootenai Valley FPD 7 6 1
Total 351 238 82 17 7 2 3 2
Class A Fires
Class B Fires
Class C Fires
Class D Fires
Class E Fires
Class F Fires
Class G Fires
300-999.9 ac.
1,000-4,999.9 ac.
5,000+ ac.
NUMBER OF FIRES IN EACH SIZE CLASS, BY DISTRICT
0-.25 ac.
.26-9.9 ac.
10-99.9 ac.
100-299.9 ac.
31
The above matrix illustrates the number of aircraft used on fires in the Forest
Protective District. It does not reflect the amount of use per fire.
Month Day # Fires
08 02 26
08 03 20
08 04 8
08 05 3
08 06 5
08 07 1
08 08 2
08 09 5
08 10 1
08 11 3
08 12 29
08 13 9
08 14 7
08 15 10
129
2014 CONSECUTIVE DATES OF
HIGHEST FIRE OCCURANCE
Total
Statewide # fires on multi days-290
Statewide # multi fire days-55

32
AFTER SHIFT
Just About Pumpkin Time on the Big Cougar Fire - Craig Mountain FPD