IDAHO DEPARTMENT OF FISH AND GAME · 1 . IDAHO DEPARTMENT OF FISH AND GAME . FISHERY MANAGEMENT...
194
IDAHO DEPARTMENT OF FISH AND GAME FISHERY MANAGEMENT ANNUAL REPORT Cal Groen, Director PANHANDLE REGION 2009 Ryan Hardy, Regional Fishery Biologist Rob Ryan, Regional Fishery Biologist Mark Liter, Regional Fishery Biologist Melo Maiolie, Regional Fishery Biologist Jim Fredericks, Regional Fishery Manager December 2010 IDFG 10-112
Transcript of IDAHO DEPARTMENT OF FISH AND GAME · 1 . IDAHO DEPARTMENT OF FISH AND GAME . FISHERY MANAGEMENT...

1
IDAHO DEPARTMENT OF FISH AND GAME FISHERY MANAGEMENT ANNUAL REPORT
Cal Groen, Director
PANHANDLE REGION
2009
Ryan Hardy, Regional Fishery Biologist Rob Ryan, Regional Fishery Biologist Mark Liter, Regional Fishery Biologist
Melo Maiolie, Regional Fishery Biologist Jim Fredericks, Regional Fishery Manager
December 2010
IDFG 10-112

i
Table of Contents Page
High Mountain Lake Investigations ABSTRACT ................................................................................................................................. 1 INTRODUCTION ........................................................................................................................ 2 OBJECTIVES ............................................................................................................................. 2 METHODS .................................................................................................................................. 3
Fish and Amphibian Sampling of Panhandle Region Mountain lakes ....................................... 3 Stocking Evaluation ................................................................................................................. 3 Stocking Model Evaluation ....................................................................................................... 4
RESULTS ................................................................................................................................... 4 Fish Sampling .......................................................................................................................... 4 Westslope Cutthroat Trout Growth and Elevation ..................................................................... 5 Golden Trout and Arctic Grayling Growth and Elevation .......................................................... 5 Amphibian Sampling ................................................................................................................ 5
DISCUSSION.............................................................................................................................. 5 Fish Sampling .......................................................................................................................... 5 Westslope Cutthroat Trout Growth and Elevation ..................................................................... 6 Golden Trout and Arctic Grayling Growth and Elevation .......................................................... 6 Amphibian Sampling ................................................................................................................ 7
MANAGEMENT RECOMMENDATIONS ..................................................................................... 7 Tables ................................................................................................................................ 8 Figure ............................................................................................................................... 10
Bull Trout Redd Counts
ABSTRACT ............................................................................................................................... 11 INTRODUCTION ...................................................................................................................... 12 STUDY SITES .......................................................................................................................... 12 OBJECTIVES ........................................................................................................................... 12 METHODS ................................................................................................................................ 13
Bull Trout Spawning Surveys ................................................................................................. 13 RESULTS ................................................................................................................................. 14
Priest Lake Core Area ............................................................................................................ 14 Lake Pend Oreille Core Area ................................................................................................. 14 Kootenai River Core Area ...................................................................................................... 15 Coeur d’Alene Lake Core Area .............................................................................................. 15 North Fork Clearwater River Core Area ................................................................................. 16
DISCUSSION............................................................................................................................ 16 Priest Lake Core Area ............................................................................................................ 16 Pend Oreille Lake Core Area ................................................................................................. 17 Kootenai River Core Area ...................................................................................................... 18 Coeur d’Alene Lake Core Area .............................................................................................. 18 North Fork Clearwater River Core Area ................................................................................. 19
2009 Panhandle Region Fishery Management Annual Report

ii
Table of Contents (cont.) Page MANAGEMENT RECOMMENDATIONS ................................................................................... 19
Tables .............................................................................................................................. 20 Figures ............................................................................................................................ 30
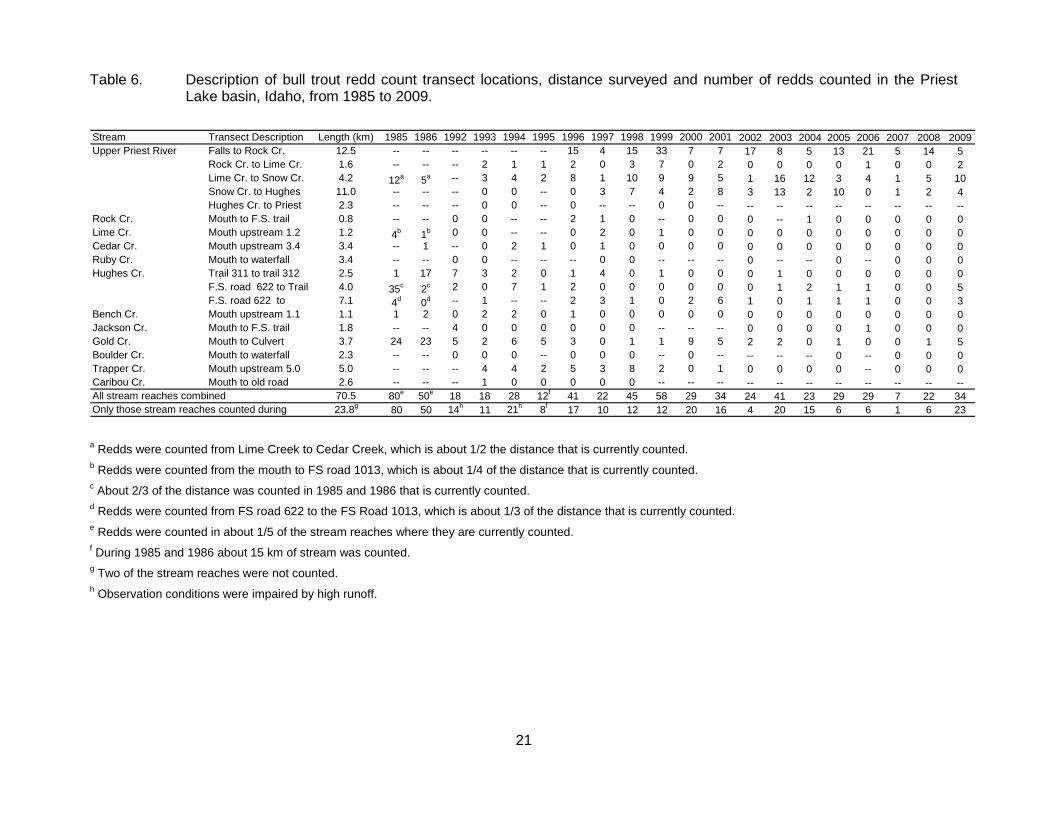
Coeur d'Alene Lake Fishery Investigation ABSTRACT ............................................................................................................................... 43 INTRODUCTION ...................................................................................................................... 44 OBJECTIVES ........................................................................................................................... 44 STUDY AREA ........................................................................................................................... 45 METHODS ................................................................................................................................ 45
Kokanee Estimates by Trawling ............................................................................................. 45 Kokanee Estimates by Hydroacoustics .................................................................................. 46 Chinook Salmon to Kokanee Correlations .............................................................................. 47 Chinook Salmon Redd Counts ............................................................................................... 48 Creel Survey .......................................................................................................................... 48
RESULTS ................................................................................................................................. 49 Kokanee Estimates by Trawling ............................................................................................. 49 Kokanee Estimates by Hydroacoustics .................................................................................. 50 Chinook Salmon to Kokanee Correlations .............................................................................. 50 Chinook Salmon Redd Counts and Stocking .......................................................................... 51 Creel Survey .......................................................................................................................... 51
DISCUSSION............................................................................................................................ 52 Kokanee Population Estimates .............................................................................................. 52 Chinook Salmon to Kokanee Correlations .............................................................................. 54 Kokanee Mortality .................................................................................................................. 55 Creel Survey .......................................................................................................................... 55
MANAGEMENT RECOMMENDATIONS ................................................................................... 56 Tables .............................................................................................................................. 57 Figures ............................................................................................................................. 74
Lateral Lakes Bass Investigations
ABSTRACT ............................................................................................................................... 83 INTRODUCTION ...................................................................................................................... 84 OBJECTIVES ........................................................................................................................... 84 STUDY SITES .......................................................................................................................... 84 METHODS ................................................................................................................................ 85 RESULTS ................................................................................................................................. 86 DISCUSSION............................................................................................................................ 87 MANAGEMENT RECOMMENDATIONS ................................................................................... 88
Tables .............................................................................................................................. 89 Figures ............................................................................................................................. 91

iii
Table of Contents (cont.) Page
Spirit Lake Kokanee Population Investigation ABSTRACT ............................................................................................................................... 96 INTRODUCTION ...................................................................................................................... 97 OBJECTIVE .............................................................................................................................. 97 STUDY SITE ............................................................................................................................. 97 METHODS ................................................................................................................................ 97
Trawling ................................................................................................................................. 97 Hydroacoustics ...................................................................................................................... 98 Limnology .............................................................................................................................. 99
RESULTS ................................................................................................................................. 99 Trawling ................................................................................................................................. 99 Hydroacoustics .................................................................................................................... 100 Spawner Counts .................................................................................................................. 100 Limnology ............................................................................................................................ 100
DISCUSSION.......................................................................................................................... 100 Kokanee Abundance ............................................................................................................ 100 Kokanee Production ............................................................................................................. 102 Limnology ............................................................................................................................ 102
MANAGEMENT RECOMMENDATIONS ................................................................................. 102 Tables ............................................................................................................................ 103 Figures ........................................................................................................................... 105
Priest Lake Investigations
ABSTRACT ............................................................................................................................. 109 INTRODUCTION .................................................................................................................... 110 STUDY AREA ......................................................................................................................... 110 OBJECTIVES ......................................................................................................................... 110 METHODS .............................................................................................................................. 110
Kokanee Spawner Counts ................................................................................................... 110 Lake Trout Tagging .............................................................................................................. 111
RESULTS ............................................................................................................................... 111 Priest Lake Kokanee ............................................................................................................ 111 Lake Trout Tag Returns ....................................................................................................... 111
DISCUSSION.......................................................................................................................... 111 Priest Lake Kokanee ............................................................................................................ 111
MANAGEMENT RECOMMENDATION ................................................................................... 112 Tables ............................................................................................................................ 113 Figure ............................................................................................................................. 115
Upper Priest Lake Bull Trout Enhancement
ABSTRACT ............................................................................................................................. 116 INTRODUCTION .................................................................................................................... 117 METHODS .............................................................................................................................. 117

iv
Table of Contents (cont.) Page
Lake Trout Removal ............................................................................................................. 117 Thorofare Netting Evaluation ................................................................................................ 117
RESULTS ............................................................................................................................... 118 Lake Trout Removal ............................................................................................................. 118 Thorofare Netting Evaluation ................................................................................................ 119
DISCUSSION.......................................................................................................................... 119 Lake Trout Removal ............................................................................................................. 119 Thorofare Netting Evaluation ................................................................................................ 120
MANAGEMENT RECOMMENDATIONS ................................................................................. 121 Tables ............................................................................................................................ 122 Figures ........................................................................................................................... 123
Lowland Lakes Hatchery Trout Exploitation Study
ABSTRACT ............................................................................................................................. 126 INTRODUCTION .................................................................................................................... 127 OBJECTIVE ............................................................................................................................ 127 STUDY SITE ........................................................................................................................... 127 METHODS .............................................................................................................................. 127 RESULTS ............................................................................................................................... 128 DISCUSSION.......................................................................................................................... 128 MANAGEMENT RECOMMENDATION ................................................................................... 129
Figures ........................................................................................................................... 130
Keokee Creek Brook Trout Removal Evaluation ABSTRACT ............................................................................................................................. 132 INTRODUCTION .................................................................................................................... 133 OBJECTIVE ............................................................................................................................ 133 STUDY SITE ........................................................................................................................... 133 METHODS .............................................................................................................................. 133 RESULTS ............................................................................................................................... 134 DISCUSSION.......................................................................................................................... 134 MANAGEMENT RECOMMENDATIONS ................................................................................. 135
Figures ........................................................................................................................... 136
Spokane River Drainage Snorkel Surveys ABSTRACT ............................................................................................................................. 139 INTRODUCTION .................................................................................................................... 140 OBJECTIVE ............................................................................................................................ 140 STUDY SITES ........................................................................................................................ 140

v
Table of Contents (cont.) Page
St. Joe River ........................................................................................................................ 140 North Fork Coeur d’Alene River ........................................................................................... 140
METHODS .............................................................................................................................. 140 Field Work ............................................................................................................................ 140 Data Analysis ....................................................................................................................... 141
RESULTS ............................................................................................................................... 141 St. Joe River ........................................................................................................................ 141 North Fork Coeur d’Alene River ........................................................................................... 142 St. Joe River Versus the North Fork Coeur d’Alene River System ........................................ 142
DISCUSSION.......................................................................................................................... 143 Cutthroat Trout ..................................................................................................................... 143 St. Joe River .................................................................................................................. 143 North Fork Coeur d’Alene River System ......................................................................... 143 St. Joe River Versus the North Fork Coeur d’Alene River System .................................. 144 Mountain Whitefish .............................................................................................................. 144 Rainbow Trout...................................................................................................................... 145 Bull Trout ............................................................................................................................. 145
MANAGEMENT RECOMMENDATION ................................................................................... 145 Tables ............................................................................................................................ 146 Figures ........................................................................................................................... 154
Little North Fork Clearwater River Fishery Assessment ABSTRACT ............................................................................................................................. 160 INTRODUCTION .................................................................................................................... 161 OBJECTIVES ......................................................................................................................... 161 STUDY SITES ........................................................................................................................ 161 METHODS .............................................................................................................................. 162
Snorkel Surveys ................................................................................................................... 162 Snorkel Survey Data Analysis .............................................................................................. 163 Angler Exploitation ............................................................................................................... 164
RESULTS ............................................................................................................................... 164 Snorkel Surveys ................................................................................................................... 164 Angler Exploitation ............................................................................................................... 165
DISCUSSION.......................................................................................................................... 165 Snorkel Surveys ................................................................................................................... 165 Angler Exploitation ............................................................................................................... 166
MANAGEMENT RECOMMENDATIONS ................................................................................. 166 Tables ............................................................................................................................ 167 Figures ........................................................................................................................... 172
APPENDICES......................................................................................................................... 174 LITERATURE CITED .............................................................................................................. 180

1
2009 PANHANDLE REGION ANNUAL FISHERY MANAGEMENT REPORT
HIGH MOUNTAIN LAKE INVESTIGATIONS
ABSTRACT
We sampled a total of 15 lakes from June 29 to Sept. 1, 2009 in an effort to evaluate our Arctic grayling Thymallus arcticus and golden trout Oncorhynchus aguabonita stocking program and add more lakes to our westslope cutthroat trout O. clarkii stocking model. Surveyed lakes ranged from 1,634 to 2,044 m in elevation and 0.8 to 7.6 ha in size. Maximum depths of sampled lakes ranged from 3 to 28 m. No Arctic grayling were found in Dismal, Lower Glidden, or Little Ball Creek Lakes, despite regular stocking since 2001. All of these lakes are stocked with trout on a regular basis or have naturally reproducing trout populations. We found abundant golden trout or Arctic grayling in Callahan, Crater, Forage, Long Canyon, Parker, and Steamboat lakes. The largest mean length of Arctic grayling was in Forage and Callahan lakes, and the largest golden trout were in Forage and Parker lakes. Of the six lakes sampled for westslope cutthroat trout, we only found evidence of natural reproduction in Callahan Lake. Westslope cutthroat trout have not been stocked in Callahan Lake since 1995, yet were abundant in the sample in 2009. We saw evidence of winterkill in Noseeum and Long Mountain lakes. Noseeum is typically stocked with westslope cutthroat trout and Long Mountain with Arctic grayling. Noseeum and Long Mountain lakes had no fish or nearly none sampled in 2009. Additional lakes (Roman Nose #3, Callahan, Halo, and Northbound lakes) sampled provided information showing age at 250 mm was similar in relation to elevation for other lakes sampled in 2008. This further confirms that stocking guidelines developed in 2002 improved the quality and efficiency of the mountain lake fish-stocking program.
Two brook trout/bull trout hybrids (Salvelinus fontinalis x S. confluentus) (424 and 512
mm TL) were sampled in Roman Nose #1 on July 22, 2009. Genotyping the two fish showed both fish exhibited genotypes indicative of F1 bull/brook hybrids (similar to what was found for seven fish captured in the same lake in 2008). Authors: Ryan Hardy Regional Fishery Biologist Jim Fredericks Regional Fishery Manager

2
INTRODUCTION
There are around 140 mountain lakes in northern Idaho. The Idaho Department of Fish and Game (IDFG) currently stocks 51 of them to provide fishing opportunities for the public. Species stocked include westslope cutthroat trout, domestic Kamloops rainbow trout O. mykiss, golden trout and Arctic grayling. Of the remaining 87 un-stocked lakes, approximately 15-20 have known brook trout populations.
The majority of lakes are stocked with rainbow and/or westslope cutthroat trout fry on a two year cycle with densities of approximately 750 fish/ha depending on lake elevation. In addition, the seven lakes in the Panhandle managed for Arctic grayling and/or golden trout are stocked with 500 – 1,235 fish/ha depending on species. A change in stocking density for westslope cutthroat trout was implemented following an assessment by Fredericks et al. (2002) who found a strong relationship between fish growth and elevation and stocking density. Prior to Fredericks et al. (2002) study, stocking rates in the Panhandle Region were generally on the upper end of the range used by other regions or found in literature (Der Hovanisian 1997). In many cases, stocking densities were much higher or in some cases lower than the target of 600 fish/ha, due to a lack of accurate size estimates on many lakes. Prior to 2000, mountain lake surveys indicated stocking rates were generally sufficient to provide high yield fisheries. However, these surveys also demonstrated that most lakes had an abundance of older and smaller fish in the population, suggesting the lack of larger fish is more of a function of slow growth than the result of high exploitation (Fredericks et al. 2002). This lead to stocking densities being refined as a function of elevation, where higher elevation lakes would have the lowest stocking densities in order to maximize growing potential.
Since the modifications to the mountain lake stocking program in 2000, we found that in
many of the alpine lakes where stocking densities were changed, the time to attain a certain length at age for westslope cutthroat trout was significantly reduced (Fredericks et al. 2009). Although this change was made for cutthroat, little information has been collected to determine if refinement in the stocking schedule may be necessary for lakes that are currently stocked with Arctic grayling and/or golden trout. We, therefore, completed a similar evaluation of Panhandle lakes stocked with these species to determine if adjustments to the stocking schedule could optimize growth and density.
OBJECTIVES
1. Evaluate stocking rates in the ten Arctic grayling and/or golden trout lakes to determine if
stocking rates should be modified. 2. Evaluate stocking rates in additional lakes that were not included in the 2008 study to
determine whether changes implemented in 2000 have helped optimize fish growth.
3. Identify if any of these lakes may have naturally producing populations of westslope cutthroat trout.
4. Resample bull trout lakes identified in 2008 to determine extent of hybridization, spawning
and persistence.

3
METHODS
Fish and Amphibian Sampling of Panhandle Region Mountain lakes
Fish sampling
We determined the presence of fish using gill netting and visual observation. Gill nets
were set over-night for approximately 12 hours. Gill nets were approximately 46 m in length made up of six, 7.5 m panels. Stretched mesh sizes of the various panels ranged from 25 to 100 mm. We recorded species, length and weight of all fish netted, and we collected otoliths for age analysis. We categorically assessed the quality and quantity of spawning habitat in the inlets and outlets of lakes, and we recorded any observed spawning activity. Physical characteristics surveyed included the type of lake, aspect, and depth profile and inlet/outlet documentation. Chemical characteristics surveyed were TDS, conductivity, pH, and air and water temperature. The recreational use survey included the quality, and level of use of access and camping facilities.
Amphibian sampling
We conducted amphibian surveys using a modified version of the visual encounter
survey (VES) technique (Crump and Scott 1994, Schriever and Rhodes 2002). Two trained observers conducted a search of the entire perimeter of each sampled lake by walking and wading along the lake shoreline typically between 1000 and 1600 hours. Amphibians were identified to species and classified within the following life stage classes: adult, sub-adult, larvae, egg mass.
Stocking Evaluation
Westslope Cutthroat Trout Lake Selection
Fredericks et al. (2002) sampled 14 lakes in 1999 and used available data from two
additional lakes surveyed in previous years. To evaluate the effectiveness of stocking recommendations set forth by the study, 16 of these lakes were re-sampled in 2008. These lakes were originally selected utilizing the following criteria: 1) lakes without a reproducing population of brook trout, 2) lakes stocked with fry only (no catchables), and 3) lakes stocked primarily with westslope cutthroat trout.
In 2009, we re-sampled Pyramid, Roman Nose #3, and Noseeum lakes to follow up on 2008 surveys when we found too few fish to run growth analysis. In addition Callahan, Halo, and Northbound lakes were also sampled to add to the trout stocking evaluation tables provided by Fredericks et al. (2009).
We sampled 10 lakes in the region that are stocked with Arctic grayling and/or golden
trout. These lakes include Callahan, Forage, Steamboat, Long Canyon, Long Mountain, Little Ball, Dismal, Lower Glidden, Crater, and Parker lakes. Little Ball, Crater, and Lower Glidden
4
lakes, sampled in 2008, were included in this evaluation. In total, we sampled 15 lakes from June 29 to Sept. 1, 2009.
In addition to evaluating westslope cutthroat trout and golden trout/Arctic grayling lakes
we re-sampled Roman Nose #1 and #2 and Upper Glidden lakes in order to confirm the presence/ absence and genotype of bull trout. This was a continuation of our assessment in 2008 (Fredericks et al. 2009) showing that bull trout persist in at least two of these lakes. Any bull trout sampled, were photographed in order to make a detailed comparison with dorsal fin identification chart for genotyping bull trout, brook trout, or their hybrids (USFS; IDFG unpublished data). In addition to netting, a person snorkeled the entire shoreline in order to identify possible spawning activity in September.
Stocking Model Evaluation
Fredericks et al. (2002) stocking model was based on the relationship between growth
rates and measurable factors potentially affecting growth rates such as conductivity, elevation, and stocking density. Since conductivity explained less variation than elevation and stocking density it was dropped from the comparisons. The dependent variable tested was age-at-length. We used whole otolith analysis to estimate fish length-at-age at time of capture, and then converted the relationship to estimate the age at which fish in the lake could be expected to achieve a length of 250 mm. We utilized stocking records to aid in ageing as well as determine if natural reproduction was occurring.
Since no stocking model was available to evaluate Arctic grayling and golden trout
growth in relation to abiotic factors, we evaluated each of these lakes on a case by case basis. Each lake was compared with each other to determine if size of fish in relation to stocking rates could be modified.
RESULTS
Fish Sampling
Surveyed lakes ranged from 1,634 to 2,044 meters in elevation and 0.8 to 7.6 hectares
in size. Maximum depths of sampled lakes ranged from 3 to 28 meters (Table 1).
We found no Arctic grayling in Dismal, Lower Glidden, or Little Ball Creek lakes, despite stocking every other year since 2001. Callahan, Crater, Forage, Long Canyon, Parker, and Steamboat lakes all contain abundant populations of either golden trout or Arctic grayling. Sampling showed the largest (avg. TL) Arctic grayling were in Forage and Callahan Lake, and the largest golden trout (avg. TL) were sampled in Forage and Parker Lake (Table 2).
Of the six lakes sampled for westslope cutthroat trout (because of past or present
stocking history), only Callahan Lake showed some level of natural reproduction. Westslope cutthroat trout have not been stocked in Callahan Lake since 1995, yet were abundant in the sample in 2009. Of these additional lakes sampled for westslope cutthroat trout, Northbound Lake showed the greatest average and maximum total length of trout sampled (Table 2).

5
We sampled no fish in Noseeum and only one fish (104 mm golden trout) in Long Mountain lakes in 2009. This is the second season that we did not sample fish in Noseeum Lake.
No bull trout were sampled in Roman Nose #1 and #2 and Upper Glidden lakes in 2009.
Two brook/bull trout hybrids (424 and 512 mm TL; Table 2) were sampled in Roman Nose #1 on July 22, 2009. Both fish possessed adipose fins indicative of being naturally produced in the lake. Digital photographs of their dorsal fins matched what would phenotypically be considered brook x bull trout hybrids (USFS and IDFG Identification Key). Genotyping the two fish with diagnostic microsatellite loci showed that both fish exhibited genotypes indicative of F1 bull/brook hybrids (similar to what was found for seven fish captured in this lake in 2008).
Westslope Cutthroat Trout Growth and Elevation
As with the 2008 evaluation of westslope cutthroat trout growth, we conducted simple
linear regression analyses using age-at-250 mm as the dependent variable and stocking rate and elevation as the dependent variables. Estimated ages at 250 mm of westslope ranged from 3.1 – 3.4 in the four lakes sampled (Roman Nose #3, Callahan, Halo, and Northbound lakes; Table 3). Adding these lakes surveyed with westslope cutthroat trout to the regression performed in 2008 with 16 stocked westslope cutthroat trout lakes, the coefficient of determination (r2) for elevation was 0.40. This indicates that, at established stocking rates, around half of the variability in growth is related to elevation (Figure 1).
Golden Trout and Arctic Grayling Growth and Elevation
The average TL of Arctic grayling in Steamboat Lake was significantly smaller than in Callahan Lake, which has an abundant population of westslope cutthroat trout present. Fish in Callahan Lake primarily look to be age-3, while ages in Steamboat Lake ranged from 2-6 (Table 3). Age at 250 mm for golden trout ranged from 3.4 - 4.2 years (Table 3).
Amphibian Sampling
VES surveys documented: Columbia spotted frogs Rana luteiventris and long-toed
salamanders Ambystoma macrodactylum. Columbia spotted frogs were found in five (36%) and long-toed salamanders found in two (10%) of the lakes sampled. We found no western toads Bufo boreas in any of the lakes surveyed (Table 4) and no amphibians in seven of the lakes surveyed.
DISCUSSION
Fish Sampling
We saw evidence of winterkill in Noseeum and Long Mountain lakes. Noseeum is typically stocked with westslope and Long Mountain with Arctic grayling. Increased winter mortality has occurred during periods of low oxygen when ice and snow cover have persisted

6
for long periods (Barton and Taylor 1996). The Panhandle Region experienced excessive snowfall over the past two winters, which may have contributed to this occurrence.
As in 2008, two large char were sampled in Roman Nose #1. Both fish possessed
adipose fins indicative of being naturally produced in the lake. These two fish were also hybrids (as seen in 2008), suggesting that although natural production occurs, it is occurring across species. Bull trout were previously stocked in 1993 in several high mountain lakes across Idaho to reduce brook trout abundance and indirectly improve brook trout length at age. The unexpected persistence of these bull trout allowed us to not only examine the long term efficacy of their original experiment on brook trout growth (Fredericks et al. 2009), but also the possible utility of these lakes as “gene banks”. Evaluation of bull trout reproduction in lakes w/out brook trout may help assess the feasibility of using mountain lakes for gene banking.
Westslope Cutthroat Trout Growth and Elevation
Adding the four lakes sampled from 2009, it was evident that age at 250 mm was similar
in relation to elevation for other lakes sampled in 2008. We believe the stocking guidelines developed by Fredericks et al. (2002) improved the quality and efficiency of the mountain lake fish-stocking program. Although there are other factors acting on growth that limit the model’s predictive ability such as natural reproduction or excessive angling pressure, the model provides guidelines for stocking density to optimize trout growth. Nelson (1988) concluded that stocking rates should be adjusted for elevation and angling pressure, and where possible, alkalinity. In general, he recommended a 28% decrease in stocking rate for each increase in elevation of 305 m. The only metric available for angling pressure was accessibility and therefore it was left out of the model (Fredericks et al. 2002). In the future, a better idea of how to survey these lakes for angling pressure should be explored.
We recognize that the relationship between elevation and growth is also a function of
growing season and temperature. The short growing season and low overall productivity of regional waters ultimately limits growth potential. At some point, no matter how we change stocking densities, elevation and productivity limit fish growth, especially in high elevation lakes.
Golden Trout and Arctic Grayling Growth and Elevation
Unlike westslope cutthroat trout lakes, there were simply too few lakes with enough fish
to evaluate the effect of elevation and stocking density on growth of golden trout and Arctic grayling. The sampling demonstrated that both species grow and survive well in Panhandle Region lakes; however, there is some evidence suggesting intense predation by other stocked salmonids may suppress or altogether eliminate Arctic grayling populations. For example, Arctic grayling were not found in Dismal, Lower Glidden, or Little Ball Creek lakes, each of which either have naturally reproducing trout populations or are stocked on a regular basis. Dismal and Lower Glidden lakes were originally stocked with Arctic grayling in an effort to establish a more accessible population where more people could experience this type of fishery. Our survey suggests they were stocked at too low of density (450-500 fish / ha) to off-set the predation mortality from established trout populations.
Our sampling showed evidence of overstocking in Steamboat Lake; yet, it is these same
high stocking rates that may allow Arctic grayling to persist in Callahan Lake in the presence of trout predation. Although these two lakes are being stocked at the same density, the average size of grayling was significantly smaller in Steamboat Lake. Examination of the growth curve

7
for Arctic grayling in Steamboat Lake suggests that they would not be able to attain 250 mm in their lifespan at the current stocking rate. This, along with multiple year classes, is evidence that high densities limit growth in Steamboat Lake. Conversely, predation by westslope cutthroat trout in Callahan Lake may decrease density and increase growth of Arctic grayling. Slower growth of Arctic grayling at increasing densities has also been described by Byorth and Magee (1998). Reducing stocking density of Arctic grayling in Steamboat Lake may allow fish to attain a maximum length of at least 250 mm.
Based on age and growth of golden trout and Arctic grayling in 2008 and 2009 we
recommend (Appendix A) eliminating stocking of Arctic grayling fry in Little Ball Creek, Lower Glidden, and Dismal lakes since predation seems to be stifling Arctic grayling persistence. In addition, a 50% reduction in stocking in Steamboat Lake may increase growth. A final recommendation is to eliminate the regional substitution of Arctic grayling for golden trout or vice versa. In the past, when Arctic grayling are not available, golden trout are often substituted and stocked at the same density as Arctic grayling. This may result in overstocking of golden trout in some of these lakes (1,235/ha) when westslope cutthroat trout are typically stocked and grow well at around 500 - 750/ha at similar elevations.
Amphibian Sampling
Amphibian surveys showed amphibians were present in lakes that are regularly stocked
as well as lakes that are fishless. The importance of leaving a portion of the state’s mountain lakes fishless has been recognized and is specified as a guiding principle in the 2007-2012 Fisheries Management Plan (IDFG 2007). Amphibian surveys indicated the mountain lake stocking program in the Panhandle Region is consistent with IDFG objectives for preserving healthy native fauna.
MANAGEMENT RECOMMENDATIONS
1. Discontinue stocking of Arctic grayling fry in Little Ball Creek, Lower Glidden, and
Dismal lakes.
2. Continue stocking of Noseeum and Long Mountain lakes to rebuild fish populations. Periodic evaluation should be performed every three years.
3. Reduce stocking of Arctic grayling in Steamboat Lake by half in order to reduce stunting.
4. Locate additional lakes where Arctic grayling and or golden trout can be easily accessible by the public.

8
Table 1. Mountain lakes surveyed in the Idaho Panhandle during 2009. Golden trout/Arctic grayling lakes sampled in 2008 are included here for evaluation as well.
Lake Max Depth (m) Conductivity pH Water Temp(oC) Time Surface area (ha) Elevation (m) Secchi (m)Callahan 3.0 3.2 8.1 17.7 11:00 3.2 1,732 3.05Dismal 21.1 27.0 7.3 19.0 12:42 2.6 1,634 5.49Forage 21.9 4.2 8.0 15.5 15:00 2.9 1,756 4.57Halo 9.8 2.6 8.4 16.5 17:00 4.0 1,865 7.62Long Mountain 4.7 6.8 7.7 18.7 16:25 0.8 2,044 4.73Long Canyon 3.4 8.0 8.4 14.5 16:23 1.8 1,936 3.35Northbound 14.6 5.9 7.7 20.5 18:00 4.7 1,657 8.54Noseeum 11.6 8.8 7.9 16.3 10:30 1.9 1,682 3.96Parker Lake 4.1 12.4 8.4 18.1 15:30 1.9 1,926 4.15Pyramid 4.4 6.0 7.2 18.5 9:20 3.2 1,844 4.42Roman Nose 1 18.2 4.4 NA NA NA 6.6 1,907 NARoman Nose 2 9.1 3.5 7.2 18.5 18:45 3.3 1,805 2.74Roman Nose 3 9.4 6.0 8.1 18.9 16:55 4.8 1,796 NASteamboat 9.1 7.6 7.9 15.0 14:30 3.0 1,804 5.34Upper Glidden 27.7 3.4 8.0 NA NA 7.5 1,797 6.71
Sampled in 2008:Crater 10.8 11.3 7.7 11.5 8:20 1.6 1,764 NALower Glidden 4.5 0.8 7.7 16.0 9:20 7.6 1,710 NALittle Ball 3.5 8.4 7.6 21.4 15:30 0.6 2,016 NA
Table 2. Fish average total length (TL) and maximum TL from high mountain lakes sampled in 2009 that are regularly stocked.
Golden Grayling WCT RBT BLT BKTLake Avg TL Max TL Avg TL Max TL Avg TL Max TL Avg TL Max TL Avg TL Max TL Avg TL Max TLCalahan 269 286 310 363Crater ** 222 410Dismal ***Forage * 315 386 380 380Halo 283 314Little Ball Creek** 215 251Long Canyon 222 249Long Mountain 109 109Lower Glidden ** 207 282Northbound 313 390NoseeumParker 314 350Pyramid 270 270 338 338Roman Nose 1 468 512 220 315Roman Nose 2 171 190Roman Nose 3 263 300Steamboat *** 187 219Upper Glidden
Stocking of Arctic grayling in Forage Lake was discontinued in 2003 (predation presumably not an issue).
** lakes that were only sampled in 2008.
*** lakes that were sampled in both 2008 and 2009. Data represented what was sampled in 2009.
Species Key: GNT: golden trout; AGR: Arctic grayling; WCT: westslope cutthroat trout; RBT: rainbow trout; BLT bull trout; BKT:
brook trout.

9
Table 3. Age structure of fish species sampled in high mountain lakes in 2009.
Lake Elevation Species Max Age Age @ 250 Stocking DensitySteamboat 1,804 Arctic Grayling 6 NA (small sample) 1235Callahan 1,724 Arctic Grayling 3 NA (1 age class) 1249
Forage 1,756 Golden Trout 5 NA (1 age class) 727Long Canyon 1,936 Golden Trout 5 4.2 1357Parker 1,926 Golden Trout 7 3.4 451
Halo 1,865 Westslope Cutthroat Trout 6 3.2 491Roman Nose 3 1,796 Westslope Cutthroat Trout 5 3.1 833Callahan 1,732 Westslope Cutthroat Trout 6 3.4 Natural Repro.Northbound 1,657 Westslope Cutthroat Trout 8 3.1 774
Table 4. Amphibians observed during visual encounter surveys in 2009 from mountain lakes in the Panhandle Region.
Date Lake Name CSF WT LTS7/20/2009 Calahan6/29/2009 Dismal X7/7/2009 Forage 7/7/2009 Halo X7/28/2009 Long Mountain X8/3/2009 Northbound X7/1/2009 Noseeum X9/1/2009 Parker X7/28/2009 Pyramid X7/22/2009 Roman Nose 17/21/2009 Roman Nose 27/21/2009 Roman Nose 36/30/2009 Steamboat8/5/2009 Upper Glidden
5 0 2Total Number of Amphibians Per Lake
CSF : columbia spotted frogs Rana luteiventris,
WT: western toads Bufo boreas
LTS: long-toed salamanders Ambystoma macrodactylum.

10
Figure 1. The relationship between elevation and westslope cutthroat trout growth rates in high mountain lakes of the Panhandle. Black data points indicate lakes sampled in 2008, while light gray represent the four lakes sampled in 2009. Line was fit using a non-linear exponential regression.
y = 0.7123e0.001x
R² = 0.4086
0.00
1.00
2.00
3.00
4.00
5.00
6.00
7.00
8.00
9.00
900 1,100 1,300 1,500 1,700 1,900 2,100 2,300
Age
@ 2
50m
m
Elevation

11
2009 PANHANDLE REGION ANNUAL FISHERY MANAGEMENT REPORT BULL TROUT REDD COUNTS
ABSTRACT
In September and October 2009, multiple agency personnel conducted bull trout redd counts in the Priest, Kootenai, Pend Oreille, and Little North Fork (LNF) of the Clearwater River basins. Counts were added to trend data sets used to track changes in bull trout spawning escapement numbers throughout the Panhandle Region. Redd count totals were: 34 redds in tributaries to Upper Priest Lake, 3 in Lower Priest Lake basin, 866 redds in the Pend Oreille Lake basin, 10 redds in tributaries to the Kootenai River, 57 redds in the St. Joe River drainage, and 61 redds in tributaries to the LNF of the Clearwater River.
In 2009, none of these core bull trout areas met any of the four recovery criteria identified in
the U.S. Fish and Wildlife Service (USFWS) Bull Trout Draft Recovery Plan for the population to be considered “recovered.” Authors: Ryan Hardy Regional Fisheries Biologist Rob Ryan Regional Fisheries Biologist Jim Fredericks Regional Fisheries Manager

12
INTRODUCTION
Due to anthropogenic influences (habitat degradation, exotic species introduction, and over harvest), bull trout populations across the Pacific Northwest have experienced widespread declines (Rieman and Myers 1997). As a result, bull trout were listed as “threatened” in 1998 under the Endangered Species Act (ESA).
Soon after the listing, the following five core recovery areas, which are located within or
at least partially within the Idaho Panhandle, were identified: Priest Lake, Lake Pend Oreille (LPO), Kootenai River, Coeur d’Alene Lake, and the North Fork (NF) Clearwater River (USFWS 2002).
The recovery goal for bull trout, as identified in the Bull Trout Draft Recovery Plan, is to
ensure the overall longevity of self-sustaining, complex, and interacting groups of bull trout in order that they may one day be de-listed (2002). In order to accomplish this goal, recovery criteria addressing distribution, abundance, habitat and connectivity were identified for each of these core areas (Table 5; USFWS 2002).
In order to evaluate the status of bull trout populations in the core recovery areas, redd counts have been historically used as an index of population strength. In addition, since work from Baxter and Westover (1999) and Downs and Jakubowski (2003) found that repeat spawning is common for adfluvial bull trout, the expansion of redd counts to number of adults in the population may be relatively similar.
Bull trout red surveys are conducted in each of the core recovery areas to monitor long
term trends in these populations. Redd counts not only allow us to evaluate the status of the populations as they pertain to recovery criteria, but they also help in directing future management and recovery activities.
STUDY SITES
Bull trout redds were counted in tributaries of the Priest River, LPO, Kootenai River, St.
Joe River, and LNF Clearwater River drainages where bull trout were believed to spawn (Figures 2-7). These watersheds make up all or part of five different core areas that occur in the Idaho Dept. of Fish and Game (IDFG) Panhandle Region (USFWS 2002). Selection of survey streams was dependent on available time and results of previous surveys. Streams where no redds were found for several consecutive years were often discontinued to allow more time to investigate new streams.
OBJECTIVES
1. Quantify bull trout redds and spawning escapement in Priest Lake, LPO, Kootenai River,
Coeur d’Alene Lake and NF Clearwater River core areas. 2. Assess whether bull trout abundance in each of the core areas meets recovery criteria
outlined in the federal draft recovery plan. 3. Survey additional streams to assess occurrence of bull trout spawning.

13
METHODS
Bull Trout Spawning Surveys
Bull trout redds were counted in selected tributaries of the Priest Lake, Priest River,
LPO, Kootenai River, St. Joe River, and LNF Clearwater basins where bull trout were known or believed to occur. Redd counts in the Middle Fork (MF) East River, NF East River and Uleda Creek (tributaries of Priest River) were added to the Pend Oreille Lake Core Area in 2003 when bull trout from these drainages were documented to spend their adult life in Pend Oreille Lake (Dupont et al. 2009). Redds are counted annually in September and October. Survey techniques and identification of bull trout redds followed the methodology described by Pratt (1984). Research has demonstrated the level of observer training and experience may influence the accuracy of redd counts (Bonneau and LaBar 1997; Dunham et al. 2001). To reduce observer variability in bull trout redd counts, we held a bull trout redd count training exercise on September 22, 2008. We used only observers who attended this session or a similar session in recent years. To add to our knowledge on preferred bull trout spawning areas and to help evaluate recovery efforts, the location of redds was recorded on maps and/or Global Positioning System (GPS) units during redd counts. Sections of the Kootenai River and NF Clearwater core areas occurred outside the Panhandle Region. Redds count data for these areas were obtained from the personnel from partner agencies responsible for conducting these surveys.
Data Analysis
To estimate the spawning escapement or population abundance (depending on recovery area) of bull trout in streams, we used Downs and Jakubowski (2006) findings where on average, 3.2 adult bull trout entered tributaries of LPO for every redd that was counted during annual surveys. We decided to use this adult to redd ratio because this estimation came from one of the core areas in the Panhandle Region, and because it is consistent with that found in the Flathead Lake system (Fraley and Shepherd; 1998). Baxter and Westover (1999) and Downs and Jakubowski (2003) found that repeat spawning is common for adfluvial bull trout where 90-100% of the surviving bull trout spawned in consecutive years. For this reason we decided to use the total spawning escapement calculated from redd counts from the Priest, Pend Oreille and Coeur d’Alene Lake core areas as an estimate for the total number of adult bull trout. We recognize this will give us a conservative estimate, as bull trout in every tributary in the Panhandle do not spawn every year (Downs and Jakubowski 2006). The one exception is for the LNF Clearwater, where research by Schriever and Schiff (2002) found 50-75% of adult bull trout return to spawning grounds in consecutive years. Consequently, for the LNF Clearwater we multiplied the spawning escapement by 1.33 (75% repeat spawners) to estimate the number of adults in the core area. To estimate the total spawning escapement in the LNF Clearwater River, we added 10% to the total redd count to account for streams not surveyed in 2009. This was based on a 2003 survey suggesting other streams accounted for 10% of the total redds.
To evaluate population trends of adult bull trout in each core area, we used linear
regression with sample year as the independent variable and the number of redds as the dependent variable. When a statistically significant relationship (P < 0.10) does not occur, interpretation and professional judgment must be used to determine if the amount of variation seen around a regression line is too great for a particular population to be considered stable or increasing.

14
RESULTS
Priest Lake Core Area
A total of 34 bull trout redds were counted in the Upper Priest River basin on October 1,
2009 (Figure 2 and Table 6). The majority of these redds were counted in Upper Priest River (21 out of 34). In the lower Priest Lake, the NF Indian Creek and NF Granite Creek, tributaries of Priest Lake were also surveyed, and 3 total bull trout redds were observed (2 in NF Indian and 1 in NF Granite). The number of redds counted in Upper Priest basin were 1.5 times lower than what was counted in 1985 when similar reaches were compared (Figure 3; Table 6). Counts were 4 times lower in 2008. By expanding the number of redds observed by 3.2 fish/redd, we estimated the spawning escapement of bull trout at 108 fish for the Upper Priest Lake basin and 10 for the lower lake (118 total). Since 1985, a significant (P = < 0.001) downward trend across consistently surveyed sites is evident in the abundance of spawning bull trout in the Priest Lake Core Area (Figure 3; Table 6). The long term trend in bull trout redd counts in the Upper Priest Basin appears to be in decline over the past 10 years; however, in the short term redd numbers have been improving over the past couple of years.
One man-made barrier was noted during our survey that we believe blocks upstream
migration of bull trout. This barrier is a U. S. Forest Service (USFS) culvert located where F.S. road 1013 crosses Gold Creek (T63N, R5W, section 17).
Lake Pend Oreille Core Area
Bull trout redd counts were completed between October 9 and 17 in 20 tributaries to
LPO and the Clark Fork River spawning channel (Figure 4). Bull trout redds were also counted in Pend Oreille River tributaries including the MF East River and Uleda Creek of the Priest River drainage. Redd counts ranged from a low of zero redds in the Twin Creek to a high of 279 redds in Trestle Creek (Table 8). A total of 866 bull trout redds were observed across all sample locations. Index streams surveyed since 1983, accounted for 597 of the total observed redds in 2009. Based on 2009 LPO drainage redd counts the expanded adult bull trout spawning population consisted of at least an estimated 2,771 fish (Table 9). Seven local populations were estimated to have more than 100 adult spawning fish.
A bull trout migration barrier (old log crossing) on Uleda Creek was removed in 2004 by
the Idaho Department of Lands. Removal of this barrier significantly increased the amount of available spawning and rearing habitat. Since its removal, four bull trout redds were counted upstream of this barrier in 2004 and one in 2009 (Figure 5).
Regression analysis of bull trout redd counts from the LPO core area across years
continued to demonstrate an increasing trend in relative abundance of LPO bull trout. Positive population trends were observed collectively in both index streams and all streams surveyed from 1983 to 2009 (Figure 6). However, a significant trend (α ≤ 0.1, P = 0.02) in LPO bull trout redd counts was only observed in analysis including counts in surveyed streams from 1992 to 2009 (Table 7). A separate analysis of all streams surveyed was included for survey years from 1992 to 2008 because a data gap in the time series existed where only index streams were surveyed during the period from 1988 to 1991 (Table 8). Redd count values from 1995 were excluded from analysis because counts in most reaches were compromised by high turbid water in that year.

15
Kootenai River Core Area
Three tributaries (North Callahan, South Callahan and Boulder creeks) were surveyed
on October 13 and 19 for bull trout redds in the Idaho portion of the Kootenai River Core Area, and a total of 10 redds were counted (Figure 7; Table 10). This was the eighth year surveys were conducted in all three of these tributaries. Redd counts were down from 2008 (17 redds counted), and below average when compared to the past 8 years of sampling. By expanding the number of redds observed by 3.2 fish/redd, we calculated the spawning escapement of bull trout for the Idaho portion of the Kootenai River Core Area to be 32 fish. The long term trend in bull trout redds counts in the Upper Priest Basin appears to be in decline over the past 8 years (Figure 8; Table 10).
In the Montana portion of the Kootenai River Core Area, 94 redds were counted during
2009 (Table 10). This is the lowest count in the Montana portion since 1996. Redds counts in this section of the Kootenai currently exhibit a declining trend (Figure 9). The total redd count of this section converts to an estimated spawning escapement to 301 fish. When combined with the Idaho spawning escapement (32 fish), the total spawning escapement for the Kootenai River Core Area is 333 fish.
Coeur d’Alene Lake Core Area
The IDFG and USFS counted 50 redds in the three index reaches of the St. Joe River
drainage on September 23, 2009 (Figure 10; Table 11). The USFS along with the Coeur d’Alene Indian Tribe surveyed another 12 streams and counted seven additional redds bringing the total number of redds counted in the St. Joe River to 57 (Table 11). This is the lowest count of redds in the St. Joe since 2003. The majority (88%) of all the redds were counted in the three index streams (Medicine Creek, Wisdom Creek, St. Joe River from Heller Creek to upstream barrier). As in previous years, no attempts were made to search for bull trout redds in the Coeur d’Alene River basin. Expanding the number of redds observed by 3.2 fish/redd, the spawning escapement of bull trout for the Coeur d’Alene Lake Core Area was estimated to be 182 fish. One bull trout redd was observed downstream of Red Ives Creek in Fly Creek.
Combined data from all streams showed an upward significant (P = 0.019) trend in the
abundance of bull trout redds counted since 1992 (increasing by 2.55 redds/year) for the Coeur d’Alene Lake Core Area (Figure 11; Table 11). Evaluating only those streams that have been consistently surveyed by experienced counters (the three index streams), an even greater significant (P = 0.002) upward trend (increasing by 3.3 redds/year) was also evident (Figure 11; Table 11). Although we saw a decline in redd counts from 2008, trends still demonstrate the bull trout population in the Coeur d’Alene Lake Core Area is stable or increasing.
We believe that the diversion dam within 2 km of the mouth of Red Ives Creek may block
upstream migration of most bull trout. Entente Creek has a culvert barrier just upstream from where bull trout redds have been reported in the past, and there appears to be suitable habitat upstream of the culvert. Other barriers may occur in streams that have the potential to support spawning and rearing bull trout populations.

16
North Fork Clearwater River Core Area
IDFG and USFS crews counted 61 redds in the upper LNF Clearwater River basin on
September 23, 2009 (Figure 12 and Table 12). Counts were 51% lower this year than in 2006 and 2007.
Adding the 10% (6.7 redds) to account for streams not surveyed in 2009 and expanding this corrected number of redds (68) by 3.2 fish/redd, the spawning escapement of bull trout for the upper LNF Clearwater River was estimated to be 217 fish.
The USFS and IDFG counted 90 redds in the NF Clearwater River and Breakfast Creek
drainages in 2009 (Figure 14; Table 13). As with the LNF Clearwater River, not all streams were surveyed in the NF drainage due to their remoteness. Based on projections from previous years’ redd counts (Table13), we believe approximately 24% of redds were not counted in basin streams due to reduced survey efforts. By expanding this corrected number of redds (119) by 3.2 fish/redd, the spawning escapement of bull trout for the NF Clearwater River and Breakfast Creek drainages was estimated to be 380 fish. When combined with the upper LNF Clearwater River, this gives us a total spawning escapement of 597 bull trout for the NF Clearwater River core area. We multiplied the spawning escapement by 1.33 (at least 25% are not repeat spawners), which gives us a total of 794 adult bull trout that occurred in the NF Clearwater core area during 2009.
Evaluating only those stream reaches that have been counted consistently in the LNF
Clearwater (Lund Creek, Little Lost Lake Creek, Lost Lake Creek and the LNF upstream of Lund Creek), a significant (P < 0.001) increasing trend was evident (Figure 13; Table 12).
Evaluating the total LNF and NF Clearwater redd counts from 2001 to 2009, redds are
increasing at a rate of approximately 12 redds/year over 28 streams (Figure 12; Table 12 and 13).
The only migration barriers that were consistently identified were located in the NF
Clearwater River Basin. Surveys in the Clearwater Region have identified barriers in the NF Clearwater River that are thought to block upstream movement in Isabella Creek (unknown cause), Quartz Creek (land slide), and Slate Creek (culvert).
DISCUSSION
Priest Lake Core Area
It is well documented that the bull trout population in the Priest Lake Core Area are in
decline and at risk of collapse (Mauser 1986; Fredericks et al. 2002; Dupont et al. 2009). This year’s redd counts in the Priest Lake basin were the highest they have been since counts in 2003 and above the average counts since we began recording surveys in 1983. The current adult number in the Upper Lake of 109 fish falls well short of the recovery goal of 1,000 fish with at least five local populations having over 100 adults, as identified in the draft recovery plan (Tables 5 and 14).

17
The primary cause for the decline in the bull trout population in the basin is likely the expanding population of lake trout S. namaycush which continually poses an overwhelming threat to the adfluvial bull trout population (Fredericks et al. 2002; Donald and Alger 1993). In addition to predation by lake trout of sub-adults entering the lake, juvenile bull trout also face predation and competition by non-native brook trout in all the rearing tributaries to both the upper and lower Priest Lake.
Few of the tributaries of Priest Lake have been surveyed for redds since 1986 when
Mauser (1986) documented the collapse of this population. Bull trout are known to still occur in some of the tributaries of Priest Lake (Dupont et al. 2009), but probably contribute few adult fish to the entire core area. Several attempts at redd counts were made in the mid-1990s in the lower lake tributaries; however, this is the first year that redds had been counted in NF Indian and NF Gold Creek since 1985. These tributaries yielded a total of 3 redds, which is a considerably less than what they produced in the mid-1986.
One man-made barrier (USFS culvert on FS rd 1013 crosses Gold Creek; T63N, R5W,
Section 17) was noted during our survey that we believe blocks upstream migration of bull trout. Though bull trout habitat below this culvert is not fully utilized, access to spawning and rearing habitat should be restored for this depressed population.
Pend Oreille Lake Core Area
LPO bull trout redd surveys provided evidence that recovery objectives described in the
draft recovery plan were met in 2009. Survey results collectively identified more than six local populations with greater than 100 individuals in each, estimated adult escapement of 2,500 or more individuals, and increasing relative abundance measured as the trend in adult escapement. In addition, efforts continue throughout the recovery area to maintain the current distribution of bull trout and restore their distribution in previously occupied areas. Recovery objectives were met for five years between 2002 and 2006, but estimated adult escapement was less than 2,500 in both 2007 and 2008 and represented below average counts in several highly influential tributary spawning populations including Trestle Creek, Granite Creek, and Gold Creek. Redd counts in all three of these tributaries increased in 2009.
LPO bull trout redd surveys in 2009 were likely impacted by in stream conditions in
several locations, possibly resulting in minimum counts in these locations. Survey conditions in the Lighting Creek drainage were potentially impacted by surface ice which made counts difficult especially in Wellington Creek, upper Rattle Creek, and upper Lighting Creek. Disturbed substrates resulting from abundant early spawner kokanee in eastside LPO tributaries including North Gold, Gold, and Granite creeks as well as Sullivan Springs limited identification of bull trout redds where kokanee and bull trout spawning overlapped. In addition, adult bull trout were abundant in Gold Creek during the time the survey was completed suggesting a significant portion of the spawning population may not have spawned prior to the survey. Cumulatively these factors resulted in redd counts representing a minimum estimate in these affected locations.
Numerous factors other than survey conditions influence variations in estimated LPO
adult bull trout abundance as measured by annual redd surveys. Although clearly identifying direct impacts is often difficult some potential influential factors may be described from observations in 2009. For example, isolated incidents of decline in redd counts observed during

18
the 2009 surveys may be associated with impaired passage conditions in some locations such as in Savage Creek, Char Creek, and Twin Creek. All observed redds in both Savage and Char creeks were located below large alluvial deposits resulting from high flow events. These areas have likely impacted counts for several years. Large beaver complexes in lower Twin Creek were also observed during the survey possibly impairing passage. In contrast to potential negative impacts, efforts to reduce competition for food resources which benefit lake conditions for bull trout in LPO are ongoing through predator removal programs. In addition, efforts to improve tributary habitat and access to tributary habitat for bull trout continue throughout the drainage. Despite the difficulties in clearly identifying the direct impacts from various factors, redd counts provide the only mechanism for long-term evaluation of variation in adult bull trout abundance.
Kootenai River Core Area
In the Idaho portion of the Kootenai River Core Area, North and South Callahan Creeks
and to a lesser extent Boulder creek are the only streams identified as important bull trout spawning tributaries in the Idaho portion of the Kootenai River Core Area. Counts in the Kootenai River Core Area were the second lowest recorded since they began the surveys in 2002.
In terms of the entire Kootenai River Core Area, the majority of the bull trout population
is located in Montana tributaries. During 2009, 90% of the total redds were counted in Montana. Previous radio tracking data indicates that fish spawning downstream of the falls in North and South Callahan Creeks and O’Brien Creek are mostly adfluvial coming from Kootenay Lake, B.C. Canada (Jody Walters, personal communication, IDFG). Bull trout spawning upstream of the falls in Montana (Quartz Creek, Bear Cree, Pipe Creek and West Fisher River) appear to have a fluvial life cycle where they overwinter in Kootenai River (Jody Walters, IDFG, personal communication, IDFG). This suggests we may not see the same trends in bull trout abundance between these two populations. In addition, Canada allows harvest of bull trout in Kootenay Lake, which may also influence trends in the lower Kootenai River tributaries.
None of the recovery goals were met in the Kootenai River Core Area in 2009 (Table
14). The adult population size was 531 in 2008 and 333 in 2009. The current count is less than half of the recovery goal of 1,000 fish with at least five local populations having over 100 adults, as identified in the draft recovery plan. Past telemetry work indicates that many bull trout below Libby Dam do not spawn every year; consequently, many more adults may have been in the core area than redd counts indicated.
Coeur d’Alene Lake Core Area
Although multiple streams were sampled in the St. Joe in 2009, only a few streams
(Medicine Creek, Wisdom Creek, Heller Creek and the upper St. Joe River) are responsible for producing the majority of bull trout in the entire core area (88% of redds were counted in these streams during 2009). The current population size of 182 fish (about half of 2008) in the core area is considerably lower that the recovery population size of 1,100. We are not aware of any spawning and rearing of bull trout currently occurring in the Coeur d’ Alene River drainage.

19
With these few streams producing the mass majority of the redds in the core area, there is a significant risk to extirpation should a catastrophic event take place in the near future. Efforts by the USFS should remain in place to protect these habitats at all costs. The USFS recently completed habitat improvements to reduce the impacts of mining to sections of Sherlock Creek, which is approximately 6.4 rkm downstream from the Medicine Creek confluence.
The bull trout recovery goal is to have a spawning escapement of 300 bull trout
downstream of Red Ives Creek. With the exception of this year and 2008, no bull trout redds were counted below Red Ives Creek since 2002. In 2008, a single bull trout redd was counted in Simmons Creek, which is approximately 12 rkm below Red Ives Creek confluence. In 2009 one redd was counted in Fly Creek which was approximately 11 rkm below Red Ives Creek confluence. We hope that this possible expansion to streams such as Sherlock, Simmons, and Fly creeks will continue thereby reducing the risk of losing a subpopulation should a catastrophic event occur in our core streams.
North Fork Clearwater River Core Area
There were an estimated 794 adult bull trout that occurred in the NF Clearwater River
Core Area, which is considerably lower than the recovery goal of 5,000 adults (Table 5). The core area currently meets 2 of the 4 recovery criteria in the draft recovery plan which is that the population appears to be stable or increasing and that it meets the minimum number of local populations (USFWS 2002). The 151 redds counted this year was slightly lower than the 175 counted in 2008 and noticeably lower than the 221 redds counted in 2007. This reduction in redds counted was primarily in the LNF Clearwater River. Even with this in mind, the redd counts in the LNF Clearwater River are increasing annually in these index streams.
A number of streams in this core area are not counted on an annual basis due to their
remoteness, and as a results, the spawning escapement in this core area is likely higher than the redd counts indicate. In addition, in several tributaries of the NF only short stream segments are surveyed which possibly further limits the final counts. Despite these limitations, bull trout redd counts have remained steady for the past five years in the NF Clearwater River core area. If the current rate of increase, all recovery goals for this core area will be met in approximately 10 years.
MANAGEMENT RECOMMENDATIONS
1. Continue to monitor bull trout spawning escapement through redd counts in the Priest
Lake Pend Oreille Lake, Kootenai River, St. Joe River and LNF Clearwater River watersheds. This includes counting the remote sections of the LNF every 3-5 years.
2. Using redd counts; continue to evaluate the status of bull trout in each of the core areas
as it relates to recovery criteria identified by the draft recovery plan.

20
Table 5. Abundance criteria required before bull trout can be considered as recovered in the following basins of Northern Idaho (USFWS 2002).
Core Area
Recovery Criteria
Minimum number
local of populations
with more than 100
adults
Minimum number of
adults in the entire
core area.
Trend in
abundance
Priest Lake basin 5 1,000 Stable or
Increasing
Pend Oreille Lake basin 6 2,500 Stable or
Increasing
Kootenai River basin A 5 1,000 Stable or
Increasing
Coeur d’Alene Lake basin NA 1,100 B Stable or
Increasing
North Fork Clearwater
River basin C
11 (> 100 adults not
required)
5,000 Stable or
Increasing
A Core area includes tributaries in Idaho and Montana. B This value is the desired annual spawning escapement - not the total number of adults in the
core area. At least 800 must occur in the St. Joe River watershed (300 must occur
downstream of Red Ives Creek) and 300 in the Coeur d’Alene River watershed.
C Only the Little North Fork Clearwater River, a tributary of the North Fork Clearwater River
basin, is located in the Panhandle Region.
21
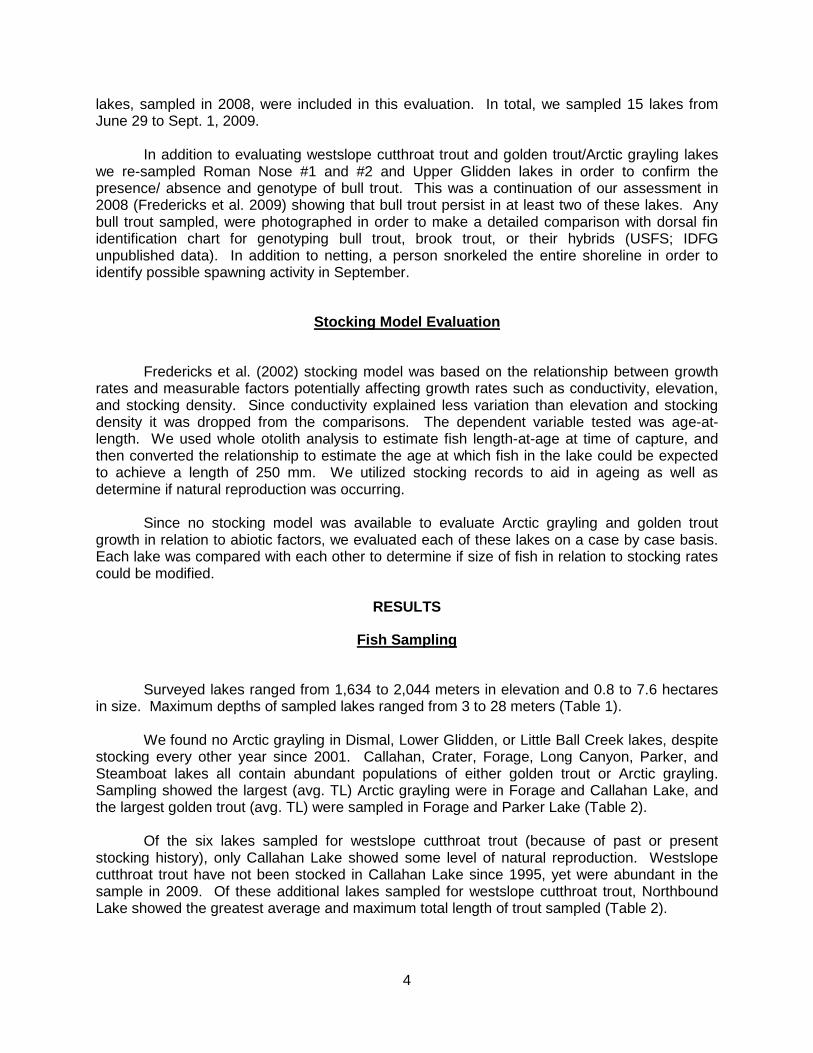
Table 6. Description of bull trout redd count transect locations, distance surveyed and number of redds counted in the Priest Lake basin, Idaho, from 1985 to 2009.
Stream Transect Description Length (km) 1985 1986 1992 1993 1994 1995 1996 1997 1998 1999 2000 2001 2002 2003 2004 2005 2006 2007 2008 2009Upper Priest River Falls to Rock Cr. 12.5 -- -- -- -- -- -- 15 4 15 33 7 7 17 8 5 13 21 5 14 5
Rock Cr. to Lime Cr. 1.6 -- -- -- 2 1 1 2 0 3 7 0 2 0 0 0 0 1 0 0 2Lime Cr. to Snow Cr. 4.2 12a 5a -- 3 4 2 8 1 10 9 9 5 1 16 12 3 4 1 5 10Snow Cr. to Hughes 11.0 -- -- -- 0 0 -- 0 3 7 4 2 8 3 13 2 10 0 1 2 4Hughes Cr. to Priest 2.3 -- -- -- 0 0 -- 0 -- -- 0 0 -- -- -- -- -- -- -- -- --
Rock Cr. Mouth to F.S. trail 0.8 -- -- 0 0 -- -- 2 1 0 -- 0 0 0 -- 1 0 0 0 0 0Lime Cr. Mouth upstream 1.2 1.2 4b 1b 0 0 -- -- 0 2 0 1 0 0 0 0 0 0 0 0 0 0Cedar Cr. Mouth upstream 3.4 3.4 -- 1 -- 0 2 1 0 1 0 0 0 0 0 0 0 0 0 0 0 0Ruby Cr. Mouth to waterfall 3.4 -- -- 0 0 -- -- -- 0 0 -- -- -- 0 -- -- 0 -- 0 0 0Hughes Cr. Trail 311 to trail 312 2.5 1 17 7 3 2 0 1 4 0 1 0 0 0 1 0 0 0 0 0 0
F.S. road 622 to Trail 4.0 35c 2c 2 0 7 1 2 0 0 0 0 0 0 1 2 1 1 0 0 5F.S. road 622 to 7.1 4d 0d -- 1 -- -- 2 3 1 0 2 6 1 0 1 1 1 0 0 3
Bench Cr. Mouth upstream 1.1 1.1 1 2 0 2 2 0 1 0 0 0 0 0 0 0 0 0 0 0 0 0Jackson Cr. Mouth to F.S. trail 1.8 -- -- 4 0 0 0 0 0 0 -- -- -- 0 0 0 0 1 0 0 0Gold Cr. Mouth to Culvert 3.7 24 23 5 2 6 5 3 0 1 1 9 5 2 2 0 1 0 0 1 5Boulder Cr. Mouth to waterfall 2.3 -- -- 0 0 0 -- 0 0 0 -- 0 -- -- -- -- 0 -- 0 0 0Trapper Cr. Mouth upstream 5.0
5.0 -- -- -- 4 4 2 5 3 8 2 0 1 0 0 0 0 -- 0 0 0
Caribou Cr. Mouth to old road 2.6 -- -- -- 1 0 0 0 0 0 -- -- -- -- -- -- -- -- -- -- --70.5 80e 50e 18 18 28 12f 41 22 45 58 29 34 24 41 23 29 29 7 22 3423.8g 80 50 14h 11 21h 8f 17 10 12 12 20 16 4 20 15 6 6 1 6 23
All stream reaches combinedOnly those stream reaches counted during
a Redds were counted from Lime Creek to Cedar Creek, which is about 1/2 the distance that is currently counted. b Redds were counted from the mouth to FS road 1013, which is about 1/4 of the distance that is currently counted. c About 2/3 of the distance was counted in 1985 and 1986 that is currently counted. d Redds were counted from FS road 622 to the FS Road 1013, which is about 1/3 of the distance that is currently counted. e Redds were counted in about 1/5 of the stream reaches where they are currently counted. f During 1985 and 1986 about 15 km of stream was counted. g Two of the stream reaches were not counted. h Observation conditions were impaired by high runoff.

22
Table 7. Statistics for the linear regression of bull trout redds counted in different watershed in bull trout recovery core areas included in the Idaho Panhandle Region during 2009.
Streams/Core Area Years
evaluatedNo. of
observations R value R square P valueSlope (Redd Coefficient)
Redd Standard Error
Upper Priest - 1985 sites 1985-2009 16 0.75 0.56 0.00 -2.06 0.48Upper Priest - all streams 1996-2009 13 0.48 0.23 0.08 -1.43 0.75Kootenai River - Idaho streams 2002-2009 8 0.57 0.32 0.14 -2.76 1.63Kootenai River - three MT streams 1990-2009 20 0.30 0.09 0.20 2.03 1.52Kootenai River - all MT streams 1996-2009 14 0.32 0.10 0.27 -3.37 2.90Pend Oreille - index streams 1983-2009 25 0.12 0.01 0.57 1.55 2.72Pend Oreille - index streams 1992-2009 17 0.31 0.10 0.22 6.82 5.38Pend Oreille - all streams 1983-2009 21 0.19 0.03 0.42 4.15 5.05Pend Oreille - all streams 1992-2009 17 0.56 0.32 0.02 19.77 7.49Lightning Creek - all tribs 1992-2009 17 0.59 0.35 0.01 4.66 1.63St Joe River - index streams 1992-2009 18 0.69 0.47 0.00 3.34 0.88St Joe River - all streams 1992-2009 18 0.55 0.30 0.02 2.55 0.98LNF Clearwater - five streams 1994-2009 15 0.83 0.69 0.00 5.75 1.07LNF Clearwater - all streams 2001-2009 9 0.62 0.38 0.08 7.95 3.84NF Clearwater - all streams 2001-2009 9 0.55 0.30 0.13 3.58 2.06NF and LNF Clearwater 2001-2009 9 0.69 0.48 0.04 11.53 4.53

23
Table 8. Number of bull trout redds counted per stream in the Pend Oreille Lake, Idaho, Core Area, from 1983 to 2009. Stream 1983a 1984 1985 1986b 1987c 1988 1989 1990 1991d 1992 1993 1994 1995e 1996 1997 1998 1999 2000f 2001f ,g 2002g 2003h 2004 2005 2006i 2007j 2008L 2009LO
CLARK FORK R. -- -- -- -- -- -- -- -- -- 2 8 17 18 3 7 8 5 5 6 7 8 1 -- 3 2 0 1 Lightning Cr. 28 9 46 14 4 -- -- -- -- 11 2 5 0 6 0 3 16 4 7 8 8 9 22 9 3 10 11 East Fork 110 24 132 8 59 79 100 29 -- 32 27 28 3 49 22 64 44 54 36 58 38 77 50 51 34 38 85 Savage Cr. 36 12 29 -- 0 -- -- -- -- 1 6 6 0 0 0 0 4 2 4 15 7 15 7 25 0 8 5 Char Cr. 18 9 11 0 2 -- -- -- -- 9 37 13 2 14 1 16 17 11 2 8 7 14 15 20 1 5 1 Porcupine Cr. 37 52 32 1 9 -- -- -- -- 4 6 1 2 0 0 0 4 4 0 0 5 10 14 8 8 8 15 Wellington Cr. 21 18 15 7 2 -- -- -- -- 9 4 9 1 5 2 1 22 8 7 7 8 7 6 29 9 10 4 Rattle Cr. 51 32 21 10 35 -- -- -- -- 10 8 0 1 10 2 15 13 12 67 33 37 34 34 21 2 24 62 Johnson Cr. 13 33 23 36 10 4 17 33 25 16 23 3 4 5 27 17 31 4 34 31 0 32 45 28 32 40 47 Twin Cr. 7 25 5 28 0 -- -- -- -- 3 4 0 5 16 6 10 19 10 1 8 3 6 7 11 0 4 0 Morris Cr. -- -- -- -- -- -- -- -- -- -- -- -- -- -- -- -- 1 1 0 7 1 1 3 16 0 6 6 Strong Creek -- -- -- -- -- -- -- -- -- -- -- -- -- 2 -- -- -- -- -- 0 -- 0 -- -- -- 7 6NORTH SHORE Trestle Cr. 298 272 298 147 230 236 217 274 220 134 304 276 140 243 221 330 253 301 335 333 361 102 174 395 145 183 279 Pack River 34 37 49 25 14 -- -- -- -- 65 21 22 0 6 4 17 0 8 28 22 24 31 53 44 16 11 4 Grouse Cr. 2 108 55 13 56 24 50 48 33 17 23 18 0 50 8 44 50 77 18 42 45 28 77 55 38 31 51EAST SHORE Granite Cr. 3 81 37 37 30 -- -- -- -- 0 7 11 9 47 90 49 41 25 7 57 101 149 132 166 104 52 106 Sullivan Springs 9 8 14 -- 6 -- -- -- -- 0 24 31 9 15 42 10 22 19 8 15 12 14 15 28 17 7 2 North Gold Cr. 16 37 52 8 36 24 37 35 41 41 32 27 31 39 19 22 16 19 16 24 21 56 34 30 28 17 28 Gold Cr. 131 124 111 78 62 111 122 84 104 93 120 164 95 100 76 120 147 168 127 203 126 167 200 235 179 73 107 West Gold Cr. -- -- -- -- -- -- -- -- -- -- -- -- -- -- -- -- -- -- -- -- -- -- -- 4 0 7 5PRIEST RIVER M.F. East River -- -- -- -- -- -- -- -- -- -- -- -- -- -- -- -- -- -- 4 8 21 20 48 71 34 36 25 Uleda Creek -- -- -- -- -- -- -- -- -- -- -- -- -- -- -- -- -- -- 3 4 3 7 4 7 2 7 16 N.F. East River -- -- -- -- -- -- -- -- -- -- -- -- -- -- -- -- -- -- -- -- -- 1 0 0 -- 0 --Total 6 index streamsk 570 598 671 290 453 478 543 503 423 333 529 516 273 486 373 597 541 623 566 691 591 462 580 794 456 382 597Total of all streams 814 881 930 412 555 478 543 503 423 447 656 631 320 610 527 726 705 732 710 890 836 781 940 1256 654 584 866Lightning Cr.-Total 301 156 286 40 111 79 100 29 0 76 90 62 9 84 27 99 120 95 123 129 110 166 148 163 57 103 183 a Incomplete surveys occurred on Porcupine and Grouse creeks.
b Incomplete surveys occurred on Grouse, Rattle, and East Fork Lightning creeks. c Incomplete surveys occurred on Granite Creek. d Early snow fall prevented counts in many streams (East Fork of Lightning Creek was not included in index counts). e Observations were impaired by high runoff in all streams except Sullivan Springs, N. Gold and S. Gold creeks, and the Clark Fork River. f A headcut barrier prevented access to most spawning areas on Johnson creek in 2000, and also potentially on Granite Creek in 2001. g Incomplete surveys occurred on M.F. East River. h Observation were impaired by high runoff in Trestle Creek. i Large early spawning kokanee made it difficult to distinguish bull trout redds from kokanee redds in Sullivan Springs. j Observation impaired by high water in Uleda and Savage creeks. k Index streams include Trestle, East Fork Lightning, Gold, North Gold, Johnson, and Grouse creeks. L large early spawning kokanee made it difficult to distinguish bull trout redds from kokanee redds. M Flows were up and counting conditions were difficult in Savage and Uleda creeks. N Severe flooding in the Lightning Creek drainage in Nov. 2006 had significant adverse impacts on some stream channels. O Portions of Wellington, Upper Rattle and Lightning Creeks were ice covered, possibly impairing counts.

24
Table 9. The estimated number of adult bull trout associated with each tributary where redds were counted in the Pend Oreille Lake, Idaho, Core Area from 1983 to 2009. Stream counts shaded in gray indicate when over 100 adults were associated with it. Total counts shaded in gray indicate when the entire population exceeded 2,500 fish. Footnotes same as Table 4.
Stream 1983a 1984 1985 1986b 1987c 1988 1989 1990 1991d 1992 1993 1994 1995e 1996 1997 1998 1999 2000f 2001f ,g 2002g 2003h 2004 2005 2006i 2007j 2008L 2009LO
CLARK FORK R. -- -- -- -- -- -- -- -- -- 6 26 54 58 10 22 26 16 16 19 22 26 3 -- 10 6 0 3 Lightning Cr. 90 29 147 45 13 -- -- -- -- 35 6 16 0 19 0 10 51 13 22 26 26 29 70 29 10 32 35 East Fork 352 77 422 26 189 253 320 93 -- 102 86 90 10 157 70 205 141 173 115 186 122 246 160 163 109 122 272 Savage Cr. 115 38 93 -- 0 -- -- -- -- 3 19 19 0 0 0 0 13 6 13 48 22 48 22 80 0 26 16 Char Cr. 58 29 35 0 6 -- -- -- -- 29 118 42 6 45 3 51 54 35 6 26 22 45 48 64 3 16 3 Porcupine Cr. 118 166 102 3 29 -- -- -- -- 13 19 3 6 0 0 0 13 13 0 0 16 32 45 26 26 26 48 Wellington Cr. 67 58 48 22 6 -- -- -- -- 29 13 29 3 16 6 3 70 26 22 22 26 22 19 93 29 32 13 Rattle Cr. 163 102 67 32 112 -- -- -- -- 32 26 0 3 32 6 48 42 38 214 106 118 109 109 67 6 77 198 Johnson Cr. 42 106 74 115 32 13 54 106 80 51 74 10 13 16 86 54 99 13 109 99 0 102 144 90 102 128 150 Twin Cr. 22 80 16 90 0 -- -- -- -- 10 13 0 16 51 19 32 61 32 3 26 10 19 22 35 0 13 0 Morris Cr. -- -- -- -- -- -- -- -- -- -- -- -- -- -- -- -- 3 3 0 22 3 3 10 51 0 19 19 Strong Creek -- -- -- -- -- -- -- -- -- -- -- -- -- 6 -- -- -- -- -- 0 -- 0 -- -- -- 22 19NORTH SHORE 0 0 Trestle Cr. 954 870 954 470 736 755 694 877 704 429 973 883 448 778 707 1056 810 963 1072 1066 1155 326 557 1264 464 586 893 Pack River 109 118 157 80 45 -- -- -- -- 208 67 70 0 19 13 54 0 26 90 70 77 99 170 141 51 35 13 Grouse Cr. 6 346 176 42 179 77 160 154 106 54 74 58 0 160 26 141 160 246 58 134 144 90 246 176 122 99 163EAST SHORE 0 0 Granite Cr. 10 259 118 118 96 -- -- -- -- 0 22 35 29 150 288 157 131 80 22 182 323 477 422 531 333 166 339 Sullivan Springs 26 23 41 -- 19 -- -- -- -- 0 77 99 29 48 134 32 70 61 26 48 38 45 48 90 54 22 6 North Gold Cr. 51 118 166 26 115 77 118 112 131 131 102 86 99 125 61 70 51 61 51 77 67 179 109 96 90 54 90 Gold Cr. 419 397 355 250 198 355 390 269 333 298 384 525 304 320 243 384 470 538 406 650 403 534 640 752 573 234 342 West Gold Cr. -- -- -- -- -- -- -- -- -- -- -- -- -- -- -- -- -- -- -- -- -- -- -- 13 0 22 16PRIEST RIVER 0 0 M.F. East River -- -- -- -- -- -- -- -- -- -- -- -- -- -- -- -- -- -- 13 26 67 64 154 227 109 115 80 Uleda Creek -- -- -- -- -- -- -- -- -- -- -- -- -- -- -- -- -- -- 10 13 10 22 13 22 6 22 51 N.F. East River -- -- -- -- -- -- -- -- -- -- -- -- -- -- -- -- -- -- -- -- -- 3 0 0 -- 0 --Trap and Transport -- -- -- -- -- -- -- -- -- -- -- -- -- -- -- -- -- -- 35 35 35 40 29 19 25 -- --Total 6 index streamsk 1824 1914 2147 928 1450 1530 1738 1610 1354 1066 1693 1651 874 1555 1194 1910 1731 1994 1811 2211 1891 1478 1856 2541 1459 1222 1910Total of all streams 2602 2817 2972 1318 1776 1530 1738 1610 1354 1430 2099 2019 1024 1951 1686 2323 2256 2342 2307 2883 2710 2539 3037 4038 2118 1869 2771Lightning Cr.-Total 873 452 829 116 322 229 290 84 0 220 261 180 26 244 78 287 348 276 357 374 319 481 429 522 182 330 586

25
Table 10. The number of bull trout redds counted per stream in the Idaho and Montana sections of the Kootenai River Core Area from 1990 to 2009.
StreamLength (km) 1990 1991 1992 1993 1994 1995 1996 1997 1998 1999 2000 2001 2002 2003 2004 2005 2006 2007 2008 2009
IDAHO North Callahan Creek 3.3 -- -- -- -- -- -- -- -- -- -- -- -- 13 30 17 12 29 3 17 10 South Callahan Creek 4.3 -- -- -- -- -- -- -- -- -- -- -- -- 4 10 8 8 4 0 0 0 Boulder Creek 1.8 -- -- -- -- -- -- -- -- -- -- -- 2 2 0 0 1 0 0 0 0MONTANA Quartz Creek 16.1 76 77 17 89 64 67 47 69 105 102 91 154 62d 55 49 71 51 35 46 31 O’Brien Creek 6.9 -- 25 24 6 7 22 12 36 47 37 34 47 45 46 51 81 65 77 79 40 Pipe Creek 12.9 6 5 11 6 7 5 17 26 34 36 30 6a 11 10 8 2 6 0 4 9 Bear Creek 6.9 -- -- -- -- -- 6 10 13 22 36b 23 4c 17 14 6 3 14 9 14 6 West Fisher Creek 16.1 -- -- -- 2 0 3 4 0 8 18 23 1 1 1 21 27 4 18 6 8Idaho Total 9.4 0 0 0 0 0 0 0 0 0 0 0 2 19 40 25 21 33 3 17 10Montana Total 58.9 82 107 52 103 78 103 90 144 216 229 201 212 136 126 135 184 140 139 149 94Quartz/O'Brien/Pipe 35.9 82 107 52 101 78 94 76 131 186 175 155 207 118 111 108 154 122 112 129 80Total all streams 68.3 82 107 52 103 78 103 90 144 216 229 201 214 155 166 160 205 173 142 166 104
a A human built dam (stacked up cobble) was constructed downstream of the traditional spawning area. b This count includes redds constructed by resident and migratory fish. c Libby Creek was dewatered at the Highway 2 bridge, downstream of Bear Creek spawning sites, during the bull trout spawning run. d A log jam may have been a partial barrier.

26
Table 11. The number of bull trout redds counted by stream in the St. Joe River basin, Idaho, from 1992 to 2009. The Idaho Department of Fish and Game has counted the index streams since 1995. All other stream reaches were counted by the U.S. Forest Service and/or volunteers.
Stream Name 1992 1993 1994 1995 1996 1997 1998 1999 2000 2001 2002 2003 2004 2005 2006 2007 2008 2009Aspen Cr. -- -- -- -- -- -- -- -- -- -- 0 -- -- -- -- -- -- --Bacon Cr. 0 -- -- -- -- -- -- -- -- -- -- -- -- -- -- -- -- 0Bad Bear Cr. -- 0 0 -- -- -- -- -- -- -- -- 0 -- -- -- -- -- --Bean Cr. 14 -- -- 0 -- -- -- -- -- -- -- -- -- -- -- -- -- 1Beaver Cr. 2 2 0 0 0 0 1 0 -- 0 0 0 0 0 0 0 0 0Bluff Cr.- East Fork 0 -- -- -- -- -- -- -- -- -- -- -- -- -- -- -- -- --California Cr. 2 4 0 2 3 0 -- -- 0 0 0 0 0 0 0 0 0 2Copper Cr. -- -- 0 -- 0 -- -- -- -- -- 0 0 0 -- -- 0 0 --Entente Cr. -- -- -- -- -- -- -- 0 -- -- 1 0 -- -- -- -- -- --Fly Cr. 1 -- -- 0 0 0 2 0 -- -- 1 0 0 0 -- 0 2 1Gold Cr. Lower mile -- 0 -- -- -- 0 -- 0 -- -- -- 0 -- -- -- -- -- --Gold Cr. Midde -- -- -- 0 -- -- -- 0 -- -- -- -- -- -- -- -- -- --Gold Cr. Upper -- 2 -- -- 1 1 0 -- -- -- -- -- -- -- -- -- -- --Gold Cr. All -- -- -- -- -- -- -- -- -- 1 0 -- 0 -- -- -- -- --Heller Cr. 0 0 0 0 -- 1 0 0 0 -- 0 0 7 1 5 0 0 3Indian Cr. 0 0 -- -- -- -- -- -- -- -- -- -- -- -- -- -- -- --Medicine Cr. 11 33 48 17a 23a 13a 11a 48a 43 16 42 28 52 62 71 55 71 41Mosquito Cr. 0 -- 0 0 4 0 2 -- -- -- -- -- 0 0 -- -- -- --Quartz Cr. -- -- -- -- -- -- -- -- -- -- 0 -- -- -- -- -- -- --Red Ives Cr. -- 0 1 1 0 1 0 0 0 0 0 0 0 1 0 1 1 --Ruby Cr. 0 1 -- 8 -- -- -- -- -- -- -- -- -- -- -- -- -- --Sherlock Cr. 0 3 0 2 1 1 0 1 0 -- -- 0 0 0 0 0 3 --Simmons Cr. - Lower -- 0 0 0 -- -- -- -- -- 0 -- -- -- -- -- -- 1 0Simmons Cr. - NF to Three Lakes -- 5 0 -- -- -- -- -- -- -- -- -- -- -- 0 -- -- 0Simmons Cr. - Three Lakes to Rd 1278 -- 3 5 5 0 0 0 0 -- -- -- -- -- -- 0 -- -- 0Simmons Cr. - Rd 1278 to Washout -- 0 0 0 1 0 1 0 -- -- -- -- -- -- -- -- -- 0Simmons Cr. - Upstream of Washout -- 0 -- -- -- 0 -- -- -- -- -- -- -- -- -- -- -- 0Simmons Cr. - East Fork -- -- 0 -- -- -- -- -- -- -- -- -- -- -- -- -- -- 0St. Joe River - below Tento Creek -- -- -- -- 0 -- -- -- -- -- -- -- -- -- -- -- -- --St. Joe River - Spruce Tree CG to St. J. Lod -- -- -- 0 -- -- -- -- -- -- -- -- -- -- -- -- -- --St. Joe River - St. Joe Lodge to Broken Leg -- -- -- 4 -- -- -- -- -- -- -- -- -- -- -- -- -- --St. Joe River - Broken Leg Cr upstream -- -- -- 0 -- -- -- -- -- -- -- -- -- -- -- -- -- --St. Joe River - Bean to Heller Cr. 0 0 -- -- -- -- -- -- -- -- -- -- -- -- -- -- -- --St. Joe River - Heller to St. Joe Lake 10b 14b 3b 20 14 6 0 10 2 11 3 9 9 10 0 6 8 1Three Lakes Creek -- -- -- -- 0 -- -- -- -- -- -- -- -- -- -- -- -- --Timber Cr. -- 0 1 0 -- -- -- -- -- -- -- -- -- -- -- -- -- --Wampus cr -- 0 0 -- -- -- -- -- -- -- -- -- -- -- -- -- -- --Washout cr. -- 3 0 0 0 0 -- -- -- -- -- -- -- -- -- -- -- --Wisdom Cr 1 1 4 5 1 0 4 11 3 13 9 9 11 19 12 32 27 8Yankee Bar 1 0 -- -- -- 0 -- -- 1 0 0 0 0 0 3 0 0 --Total - Index Streams C 12 34 52 25 15 6 4 21 48 40 54 46 72 91 83 93 106 50Total - All Streams 32 57 59 47 25 10 10 22 49 41 56 46 79 93 91 94 113 57
a These counts differed from what the U.S. Forest Service counted. b These counts did not include from California Creek to Medicine Creek, a reach where bull trout
spawning typically occurs. c Index streams include Medicine Creek, St. Joe River from Heller Creek to St. Joe Lake, and Wisdom
Creek.

27
Table 12. Number of bull trout redds counted per stream in the Little North Fork Clearwater River basin, Idaho, from 1994 to 2009. Numbers in parentheses are redds smaller than 300 mm in diameter.
Stream Length (km) 1994a 1996 1997 1998 1999 2000 2001 2001b 2002 2003 2004 2005 2006 2007 2008 2009Buck Creek 4.8 -- -- -- -- -- -- -- -- -- 5 -- -- -- -- -- --Canyon Creek 5.5 -- -- -- -- -- -- -- -- -- 0 -- -- -- -- -- --Butte Creek 1.2 -- -- -- -- -- -- -- 5 0 -- -- -- -- -- -- --Rutledge Creek -- -- -- -- -- -- -- -- -- 1 1 6 0 -- -- --Rocky Run Creek 1.5 -- -- -- -- -- -- -- -- 5 1 3 21 13 6 (2) -- 8Lund Creek 3.9 0 7 2 2 1 1 13 5 7 7 (1) 5 19 7 30 22 11Little Lost Lake Creek 3.9 0 1 1 1 7 3 1 -- 2 (4) 4 (3) 15 (1) 1 34 (4) 31 (5) 14 5Lost Lake Creek 3.0 0 0 0 0 -- 1 -- -- 0 -- 1 -- 10 13 8 9Little North Fork Clearwater River
1268 Bridge to Lund Cr. 7.0 -- -- -- -- -- -- -- 17 6 13 8 16 18 20 13 3Lund Cr. to Lost Lake Cr. 3.8 -- -- 3 1 9 8 3 12 5 (2) 7 5 8 16 21 9 11Lost Lake Cr. to headwaters 5.4 0 2 0 0 -- 5 1 -- 5 5 (1) 5 11 13 8 20 14
Total for all streams 40.0 0 10 6 4 17 18 18 39 30 (6) 43 (5) 43 (1) 82 111 (4) 129 (7) 86 61 a Streams were surveyed between 9/16/1994 and 9/19/1994 - one week earlier than surveys in following years. b These redds were counted by personnel from the Clearwater Region.

28
Table 13. Number of bull trout redds counted per stream in the North Fork Clearwater River and Breakfast Creek basins, Idaho, from 1994 to 2009. These streams all occur in the IDFG Clearwater Region and were counted by IDFG personnel from the Clearwater Region or the U.S. Forest Service.
Stream Surveyed Length (km) 1994 1995 1996 1997 1998 1999 2000 2001 2002 2003 2004 2005 2006 2007 2008 2009North Fork Clearwater River -- -- -- -- -- -- -- -- 0 -- -- -- -- -- -- --
Black Canyon -- -- -- -- -- -- -- -- 1 -- -- -- -- -- -- --Bostonia Creek 0 0 0 0 0 4 1 1 1 18 12 15 14 26 13 15Boundary Creek -- -- -- -- -- -- -- -- -- 2 3 10 -- -- -- 0Collins Creek -- -- -- -- -- -- -- 0 -- -- -- -- -- -- -- --Goose Creek -- -- -- -- -- -- 1 0 2 1 12 8 1 0 2Hidden Creek -- -- -- -- -- -- -- -- 1 0 -- -- -- -- -- --Isabella Creek -- -- -- -- -- -- -- -- 1 1 0 0 -- 1 1Kelley Creek - North Fork -- -- -- -- -- -- -- 14 -- -- -- -- -- -- -- 6Lake Creek -- -- -- -- -- -- 19 7 20 14 5 2 5 3 0 2Little Moose Creek -- -- -- -- -- -- -- 0 -- -- -- -- -- -- -- --Long Creek -- -- -- -- -- -- 5 0 8 10 1 6 10 11Moose Creek -- -- -- -- -- -- 0 0 0 0 0 0 0 0 0Niagra Gulch -- -- -- -- -- -- 2 5 6 10 3 4 2 2 2 4Orogrande Creek -- -- -- -- -- -- -- -- -- -- -- 0 -- -- -- --Osier Creek -- -- -- -- -- -- 3 0 2 0 -- -- -- -- -- --Placer Creek 3 1 2 2 2 7 4 2 4 6 2 3 5 2 3 1Pollock Creek -- -- -- -- -- -- -- -- -- 1 -- -- -- -- -- --Quartz Creek -- -- -- -- -- -- -- 4 0 0 0 0 -- -- 8 --Ruby Creek -- -- -- -- -- 0 0 -- -- -- -- -- -- -- -- --Skull Creek -- -- -- -- -- -- -- -- 0 6 5 3 -- 4 9 --Slate Creek -- -- -- -- -- -- -- -- -- -- -- 3 -- -- -- 0Swamp Creek -- -- -- -- -- -- 2 0 1 0 0 2 -- 1 -- --Upper NF -- -- -- -- -- -- -- -- -- 7 3 6 -- -- -- 0Vanderbilt Gulch -- -- -- -- -- -- 24 18 13 12 41 35 39 43 49Weitas Creek -- -- -- -- -- -- 1 -- -- -- -- -- -- -- -- --Windy Creek -- -- -- -- -- 2 -- -- -- -- -- -- -- -- -- --Breakfast Creek -- -- -- -- -- -- -- -- -- -- -- -- -- -- -- --Floodwood Creek -- -- -- -- -- -- -- -- 4 0 0 -- -- -- -- --Gover Creek -- -- -- -- -- -- -- -- -- 1 0 -- -- -- -- --Stony Creek -- -- -- -- -- -- -- -- 4 0 0 -- -- -- -- --
Total for all streams 3 1 2 2 2 13 32 58 68 81 54 111 70 85 89 90

29
Table 14. The status of bull trout populations during 2009 in each of the cores areas that occur in the Idaho Panhandle Region.
Core Area
2009 adult bull trout
population estimate
Recovery goal
No. of local populations that have more than 100 adults
Recovery goal
Is this population stable or
increasing?
Have 10 or more years of data been collected?
Are there streams that have known man-made barriers that block bull trout migrations?
Priest Lake 109 1,000 0 5 no yes yes - Gold CreekKootenai River 333 1,000 1 5 no no none in IdahoPend Oreille Lake 2,771 2,500 7 6 yes yes yes - Clark Fork and Pend Oreille riversCoeur d'Alene Lake 182 1,100 1 NA yes yes yes - Red Ives, Entente, Cascade and Bluebell N.F. Clearwater River 794 5,000 15a 11a yes no None in L.N.F. Clearwater
a A total of 100 adults or more are not required.

30
Figure 2. Stream reaches surveyed for bull trout redds in the Upper Priest Lake basin,
Idaho, during October 1, 2009 and the locations of where redds were observed.

31
Figure 3. Linear regressions depicting trends in bull trout redd counts (all streams combined
and only those sites surveyed during 1985) over time in the Priest Lake Core Area (Upper Priest Lake basin only), Idaho.
y = -1.433x + 42.033R² = 0.233
0
10
20
30
40
50
60
70
1996
1997
1998
1999
2000
2001
2002
2003
2004
2005
2006
2007
2008
2009
Num
ber o
f red
ds
All Streams
y = -2.065x + 51.093R² = 0.556
0
10
20
30
40
50
60
70
80
90
1985
1986
1987
1988
1989
1990
1991
1992
1993
1994
1995
1996
1997
1998
1999
2000
2001
2002
2003
2004
2005
2006
2007
2008
2009
Num
ber o
f red
ds
1985 Survey Sites

32
Figure 4. Stream reaches surveyed for bull trout redds in the Pend Oreille Lake basin, Idaho,
on October 9-17, 2009.

33
Figure 5. Stream reaches surveyed for bull trout redds in the Middle Fork East River basin, Idaho on October 6, 2009 and the locations of where redds were observed.

34
Figure 6. Linear regressions depicting trends in bull trout redd counts (six index streams and all streams combined) over time in the Pend Oreille Lake Core Area, Idaho. Dashed trend lines are for redd counts between 1983 and 2009, whereas solid trend lines are for redd counts between 1992 and 2009.
y = 1.5549x + 511.79R² = 0.014
0
100
200
300
400
500
600
700
800
900
1983
1984
1985
1986
1987
1988
1989
1990
1991
1992
1993
1994
1995
1996
1997
1998
1999
2000
2001
2002
2003
2004
2005
2006
2007
2008
2009
Num
ber o
f red
ds
Index Streams
R2 = 0.097 (1992 to 2009)
R2 = 0.014 (1983 to 2009)
0
200
400
600
800
1000
1200
1400
1983
1984
1985
1986
1987
1988
1989
1990
1991
1992
1993
1994
1995
1996
1997
1998
1999
2000
2001
2002
2003
2004
2005
2006
2007
2008
2009
Num
ber o
f red
ds
All Streams
R2 = 0.298 (1992 to 2009)
R2 = 0.022 (1983 to 2009)

35
Figure 7. Stream reaches surveyed for bull trout redds in the Kootenai River watershed, Idaho, on October 13th and 19th, 2009 and the locations of where redds were observed.

36
Figure 8. Linear regressions depicting trends in bull trout redd counts in tributaries in the Idaho section of the Kootenai River Core Area from 2002 to 2009.
y = -2.7619x + 33.429R² = 0.3249
05
1015202530354045
2002
2003
2004
2005
2006
2007
2008
2009
Num
ber o
f Red
ds
Idaho Tributaries

37
Figure 9. Linear regressions depicting trends in bull trout redd counts in select tributaries (Quartz, O’Brien, and Pipe Creeks) and all tributaries in the Montana section of the Kootenai River Core Area.
y = 2.0256x + 97.632R² = 0.0898
0
50
100
150
200
250
1990
1991
1992
1993
1994
1995
1996
1997
1998
1999
2000
2001
2002
2003
2004
2005
2006
2007
2008
2009
Num
ber o
f Red
ds
Quartz/O'Brien/Pipe
y = -3.3736x + 182.09R² = 0.1014
0
50
100
150
200
250
1996
1997
1998
1999
2000
2001
2002
2003
2004
2005
2006
2007
2008
2009
Num
ber o
f Red
ds
All Montana Tributaries

38
Figure 10. Stream reaches surveyed for bull trout redds in the St. Joe River basin, Idaho, on September 23, 2009 and the locations
where redds were observed.

39
Figure 11. Linear regressions depicting trends in bull trout redd counts (three index streams and all
streams combined) in the St. Joe River section of the Coeur d’Alene Lake Core Area, Idaho, from 1992 to 2009.
y = 3.345x + 23.281R² = 0.472
0
20
40
60
80
100
120
1992
1993
1994
1995
1996
1997
1998
1999
2000
2001
2002
2003
2004
2005
2006
2007
2008
2009
Num
ber o
f red
dsIndex Streams
y = 2.549x + 38.007R² = 0.297
0
20
40
60
80
100
120
1992
1993
1994
1995
1996
1997
1998
1999
2000
2001
2002
2003
2004
2005
2006
2007
2008
2009
Num
ber o
f red
ds
All Streams

40
Figure 12. Stream reaches surveyed for bull trout redds in the Little North Fork Clearwater River basin, Idaho, on September 23, 2009 and
the locations where redds were observed.

41
y = 5.751x - 17.241R² = 0.691
0
20
40
60
80
100
120
1994
1995
1996
1997
1998
1999
2000
2001
2002
2003
2004
2005
2006
2007
2008
2009
Num
ber o
f red
dsFive LNFCW Streams
y = 7.950x + 32.361R² = 0.380
0
20
40
60
80
100
120
140
2001
2002
2003
2004
2005
2006
2007
2008
2009
Num
ber o
f red
ds
All LNFCW Streams
Figure 13. Linear regressions depicting trends in bull trout redd counts (five consistently counted streams and all streams combined) over time in the Little North Fork Clearwater River basin, Idaho.

42
y = 3.583x + 60.528R² = 0.302
0
20
40
60
80
100
120
2001
2002
2003
2004
2005
2006
2007
2008
2009
Num
ber o
f Red
dsNorth Fork Clearwater Streams
y = 11.533x + 92.889R² = 0.481
0
50
100
150
200
250
2001
2002
2003
2004
2005
2006
2007
2008
2009
Nu
mb
er o
f Red
ds
North Fork and Little North Fork Clearwater Streams
Figure 14. Linear regressions depicting trends in bull trout redd counts from 2001 to 2009 in the North Fork Clearwater River and the Little North Fork Clearwater River, Idaho, combined.

43
2009 PANHANDLE REGION ANNUAL FISHERY MANAGEMENT REPORT COEUR D’ALENE LAKE FISHERY INVESTIGATION
ABSTRACT
Coeur D’Alene Lake has provided one of Idaho’s most popular kokanee O. nerka fisheries with harvests ranging from 100,000 to 600,000 fish. However for the last 14 years, age 3 (adult) kokanee density has declined to critically low levels (generally < 10/ha) forcing the closure of the fishery during some falls to protect spawning fish. During July 2009 we surveyed the kokanee population in Coeur d’Alene Lake using both trawling and hydroacoustic methodologies. By trawling, we found that age 3 kokanee densities increased ten-fold from the previous year to 35 fish/ha. Hydroacoustic surveys indicated a 15-fold increase to 61 age-3 kokanee/ha. The kokanee fishery remained open year-round during 2009 with the improvement in kokanee densities. We attribute this increase in kokanee to the lack of Chinook salmon O. tshawytscha stocking during 2007 and 2008, efforts to control wild Chinook salmon spawning, and a good year for kokanee production calculated at 20 kg/ha/yr.
We counted Chinook salmon redds in the Coeur d'Alene River and St. Joe River drainages. A total of 117 redds were counted. We excavated 17 redds to limit wild spawning to our goal of 100 redds producing an estimated 40,000 smolts. Fortunately, spawning by wild Chinook salmon has not increased exponentially and we appear to be able to limit the natural recruitment of this population by excavating redds and having a harvest oriented fishery in the lake. In addition, 21,500 age-0 hatchery Chinook salmon were stocked in Lake Coeur d’Alene in 2009 to take advantage of the increase in the kokanee population. A creel survey was conducted on Coeur d’Alene Lake and the Lateral Lakes in 2009. We estimated anglers fished 154,000 hours in the two systems and caught 29,000 largemouth bass Micropterus salmoides, 22,000 kokanee, 16,000 smallmouth bass M. dolomieu, 3,400 northern pike Esox lucius, 3,400 yellow perch Perca flavescens, 2,500 Chinook salmon, 500 black crappie Pomoxis nigromaculatus, 430 westslope cutthroat trout, 4 bull trout, and 590 fish of other species. This survey indicated a growing importance in warmwater species and Chinook salmon, a decline in kokanee harvest, and a reduction in fishing effort on Coeur d’Alene Lake. Authors: Melo Maiolie Regional Fishery Biologist Mark Liter Regional Fishery Biologist Ryan Hardy Regional Fishery Biologist Jim Fredericks Regional Fishery Manager

44
INTRODUCTION
Kokanee are one of the most important sport fish species in the Panhandle Region. Populations have been established in all the larger lakes in the Region and several of the smaller lakes are stocked annually. Kokanee first established in LPO in the 1930’s by emigrating down the Clark Fork River from Flathead Lake, Montana. Kokanee were stocked into Flathead Lake in 1916 and were originally from wild stocks from Lake Whatcom, Washington. Once kokanee were established in LPO, IDFG transplanted them to Coeur d’Alene, Spirit, and Priest Lakes in the 1930’s and 1940’s. Self sustaining populations were soon established and kokanee fisheries typically provided 50% to 90% of the angling effort in the large northern Idaho lakes. The Lake Whatcom stock of kokanee are described as “late spawners” typically using shoreline gravel rather than tributary streams and spawn from November through early January.
The kokanee fishery in Coeur d’ Alene Lake peaked in 1979 with 578,000 fish harvested
and remained at 120,000 to 239,000 kokanee harvested during the 1980’s (Rieman and LaBolle 1980; Fredericks et al. 1997). Fall Chinook salmon were introduced into Coeur d’Alene Lake in 1982 as a biological tool to reduce kokanee abundance and increase their size at harvest. Fall Chinook salmon were chosen as the preferred predator to reduce kokanee numbers for a variety of reasons: their relatively short and semelparous life cycle compared to other species (lake trout, Kamloops rainbow trout, walleye Sander vitreus, brown trout Salmo trutta); ability to manage the predators numbers; and the benefit provided by a Chinook salmon fishery. Chinook salmon have established a naturally reproducing population by spawning in the Coeur d’Alene and St. Joe river systems. Both naturally produced and hatchery stocked Chinook salmon are used to achieve the desired density of these predators.
Adult kokanee densities have remained below the desired range of 30 to 50 fish/ha since
the high run-off year of 1997 (Maiolie et al, in press). Based on trawling, age 3 kokanee densities were below 10 fish/ha in 8 of the last 10 years, and were at 3 fish/ha in 2006, 2007 and 2008. Our concern was that Chinook salmon predation is impacting, rather than benefiting, the kokanee fishery. This report covers IDFG’s efforts to monitor kokanee and Chinook salmon in 2009, and manage both populations to improve the sport fishery in Coeur d’Alene Lake. We also conducted a creel survey in cooperation with the Coeur d’Alene Tribal fisheries program on Coeur d’Alene Lake and the Lateral Lakes (also known as Chain Lakes) to monitor the sport fishery and determine if the fishery goals were being met.
OBJECTIVES
IDFG has several objectives for the management of Coeur d’Alene Lake depending on species. One objective is to manage Coeur d’Alene Lake “for a kokanee yield fishery and limited Chinook salmon trophy fishery” (IDFG 2008). Chinook salmon management direction called for greater catches of 1.5-9 kg fish rather than fewer but larger fish (11+ kg) (IDFG 2008). IDFG’s management objectives for the lateral lakes include managing Blue Lake and Anderson Lake for quality bass, and maintaining general bass regulations on the other lakes. The majority of lakes are to be managed for year-round consumptive fisheries on warmwater species. An additional objective is to manage northern pike densities at low levels to maintain rapid growth while reducing predation on bass and cutthroat trout (IDFG 2008).
45
STUDY AREA
Coeur d’Alene Lake is located in northern Idaho near the town of Coeur d’Alene. It is a
natural lake of 12,742 ha with 9,648 ha of pelagic habitat used by kokanee. The native sportfish within the lake are bull trout, westslope cutthroat trout, and mountain whitefish Prosopium williamsoni. Introduced fish species include kokanee, Chinook salmon, rainbow trout, brook trout, largemouth bass, smallmouth bass, pumpkinseed Lepomis gibbosus, bluegill L. macrochirus, green sunfish L. cyanellus, yellow perch, black crappie, brown bullhead Ameiurus nebulosus, black bullhead A. melas, channel catfish Ictalurus punctatus, and northern pike.
The lateral lakes (also known as the “Chain Lakes”) examined in this creel survey
included 12 bodies of water; Anderson, Thompson, Blue, Black, Swan, Cave, Medicine, Killarney, Chatcolet, Benewah, Round, and Hepton lakes. These lakes are located along the lower ends of the Coeur d’Alene and St. Joe rivers. They are in the flood plains of the rivers and connect to the river by channels.
METHODS
Kokanee Estimates by Trawling
We used a midwater trawl, as described by Bowler et al. (1979), and Rieman (1992), to estimate the kokanee populations in Coeur d’Alene Lake. Twenty-one transects were trawled on Coeur d’Alene Lake during the dark phase of the moon on July 22 and 23, 2009. Trawl transects were in the same locations as previous years with one exception. One transect at the northern end of the lake was repositioned so that it did not cross another transect (Figure 15). Data were analyzed as a stratified systematic sampling design. Densities of kokanee within each lake section were averaged to determine an arithmetic mean and multiplied by the area of that section to determine the section’s abundance. Ninety percent confidence limits were placed around the estimates based on techniques for stratified systematic sampling. Kokanee total lengths were measured within a 10 mm size group, weighed, and scales were collected from representative length groups for age analysis. Trawling of the lake was not conducted in 2005. To roughly estimate the number of age-3 kokanee that year, we multiplied the number of age-2 kokanee the previous year by the mean age 2-to-3 survival rate in 2004 and 2006 (39%). This yielded an estimate of 55,000 age-3 kokanee in 2005 that could be used in the construction of a stock-recruitment curve. Because trawling was conducted in July and because Coeur d’Alene Lake kokanee may grow substantially between August and late November when they spawn, experimental gill nets were used to capture adults during spawning. Kokanee were netted on December 1, 2009. The gill net was set near Higgins Point for about 20 minutes. Potential egg deposition (PED) was estimated as the number of female kokanee spawners (half the mature population based on midwater trawling) multiplied by the average number of eggs produced per female. The average number of eggs produced per female kokanee was calculated using the following length to fecundity regression (Rieman 1992): Y = 3.98x – 544 Where: x =mean length of female kokanee spawners (mm)
Y =mean number of eggs per female

46
We used the trawl estimates to calculate the mean annual mortality rate of kokanee in Coeur d’Alene Lake. A catch curve was built using trawl abundance estimates of each cohort of kokanee as it grew from age-0 to age-3. FAST software was used to calculate the average mortality rate for the specific cohort. We also plotted similar data for the kokanee in LPO for comparison. Data for LPO used the mean annual mortality from age-0 to age-4 since these kokanee live a year longer. We also used the trawl data to construct a stock-recruitment plot of kokanee in Coeur d’Alene Lake. Data from 1979 to 1996 was plotted separately from data from 1997 to 2009 to note any changes in the relationship. The “stock” was a year class of age-3 kokanee. The “recruits” were the resulting year class of kokanee 4 years later.
Kokanee Estimates by Hydroacoustics
We conducted lake-wide, mobile, hydroacoustic survey on Coeur d’Alene Lake to
monitor the kokanee population. This was the second such survey done on this lake. Survey was made at night on July 29 and 30, 2009. We used a Simrad EK60 split-beam, scientific echosounder with a 120 kHz transducer to estimate kokanee abundance. Ping rate was set at 0.3 s/ping. A pole-mounted transducer was located 0.52 m below the surface, off the port side of the boat, and pointed downward. The echosounder was calibrated prior to the survey using a 23 mm copper calibration sphere to set the gain and to adjust for signal attenuation to the sides of the acoustic axis. We used Simrad’s ER60 software to determine, and input, the calibration settings.
The lake was divided into four sections for this survey. Wolf Lodge Bay was separated
into its own section this year since past surveys showed it contained unusually high densities of kokanee fry. We followed a uniformly spaced, zigzag pattern of 21 transects traveling from shoreline to shoreline (Figure 15) (MacLennan and Simmonds 1992). The starting point of the first transect in each section was chosen randomly. Boat speed was approximately 1.3 m/s (boat speed did not affect our calculations of fish density).
We determined kokanee abundance using echo integration techniques. SonarData’s
Echoview software, version 4.70.40, was used to view and analyze the collected data. A box was drawn around the kokanee layer on each of the echograms and integrated to obtain the nautical area scattering coefficient (NASC) and analyzed to obtain the mean target strength of all returned echoes. This integration accounted for fish that were too close together to detect as a single target (MacLennan and Simmonds 1992). Densities were then calculated by the equation:
Density (fish/ha) = (NASC /4π10TS/10) 0.00292 where: NASC is the total backscattering in m2/nautical mile2, and TS is the mean target strength in dB for the area sampled.
Separate density estimates were made for kokanee fry. In Sections 1A and 1B, fry were split from older age classes of kokanee based on in-situ target strengths. A clear break in the target strength – frequency distribution was seen at -47 dB [approximately 80 mm total length (Love 1971)] and this value was used as the separation point. In the middle section of the lake

47
(Section 2), fry comprised only 3.1% of the trawl catch. We therefore used this percentage times the density estimate for all fish to calculate fry abundance. No kokanee fry were caught in the southern section (Section 3) of the lake while trawling. We therefore did not include an estimate for fry for this section of the lake even though some targets down to -60 dB were recorded.
Kokanee of age classes 1 to 3 were defined as those targets between -46.9 and -32.0
dB in the northern section of the lake (Sections 1A and 1B). In Section 2, ages 1 to 3 kokanee were defined as 96.9% of the total fish estimate between -60 and -32 dB based on the fact that the trawl catch in this section was 3.1% fry. In Section 3, age 1 to 3 kokanee were defined as all kokanee targets between -60 and -32 dB, since no kokanee fry were caught in this section of the lake by trawling. We did not include the rare targets over -32 dB to minimize the chance of including other species in our kokanee estimate.
We then partitioned the estimates of kokanee ages 1-3 into estimates of each age class based on the trawl catch. We multiplied the acoustic estimate within each lake section by the percentage of each age class in that section that was caught in the trawl. Section estimates were totaled to obtain a population estimate for the entire lake for each year class.
To determine a population estimate for kokanee, we averaged (arithmetic mean) the density estimates in each section and multiplied the resulting mean density times the area of each section. Abundance in each of the three sections was summed to estimate the total population. To determine a confidence interval on the density estimates, we first log transformed [log (x+1)] the density estimates and calculated the confidence interval for a systematic stratified sampling design. The anti-log of the result was used to place a confidence interval around the arithmetic mean so as not to underestimate the true population mean (Elliott 1977).
The results of the hydroacoustic surveys in 2008 and 2009 were used to calculate a
production estimate of the kokanee population by two different methods. The methods were the Summation Method and the Instantaneous Growth Rate Method as described in Hayes et al. (2007). The calculation interval for both methods was between the hydroacoustic sampling in July 2008 to the sampling in July 2009. Population estimates were based on hydroacoustics divided into age classes based on trawling and both estimates used arithmetic means.
Chinook Salmon to Kokanee Correlations
We attempted to define a relationship between the number of salmon stocked and the
effects on the adult population of kokanee to help guide our program of stocking Chinook salmon. Several correlations were plotted including using the number of Chinook stocked, and also using the average of two years of Chinook salmon stocking, against the abundance of kokanee two or three years later. We concentrated on only the recent data, since 1996, to allow for potential changes to the system in recent years. Data plots and correlation coefficients and were made using Window’s Office PowerPoint 2007.

48
Chinook Salmon Redd Counts
During 2009, Department personnel monitored the spawning of wild Chinook salmon. We used a helicopter (Hughes H500 C) to conduct redd surveys in the Coeur d'Alene River, North Fork Coeur d'Alene River, South Fork Coeur d'Alene River, Little North Fork Coeur d'Alene River and St. Joe River on October 7, 2009. We estimated the natural smolt production from these redds by assuming an estimate of 4,000 eggs per redd, and a mean egg-to-smolt survival of 10%. In an effort to reduce natural production, we dug with shovels to excavate and destroy redds to reduce the number to 100.
Creel Survey
We conducted a year-long creel survey on Coeur d’Alene Lake, and the Lateral Lakes, between January 3, 2009 and January 2, 2010. The survey was a cooperative effort between IDFG and the Coeur d’Alene Tribe. Field work was conducted by one technician from IDFG and one technician from the Tribe on most days. Coeur d’Alene Lake was divided into three sections with the southern section roughly being the tribal waters of the Coeur d’Alene Reservation (Figure 15). The lateral lakes included 12 bodies of water; Anderson, Thompson, Blue, Black, Swan, Cave, Medicine, Killarney, Chatcolet, Benewah, Round, and Hepton lakes. Interstate Aviation was hired to do aerial counts of fishing boats. They flew a high wing Cessna CE-172 single engine plane with fixed landing gear and one person on-board. Aerial flight days were chosen by random selection of two weekdays and two weekend days for every two week period (26 periods in survey). Each flight day included two flights, one morning flight and one afternoon flight. The flight times were also scheduled randomly with the earliest starting at 0515 hours and the latest starting at 2045 hours. Each flight time was chosen at random to start at 0, 15, 30, or 45 min past the hour. If the start time was before daylight, the pilot started his count as soon as it became light enough to see. The pilot flew the same route each time he surveyed the lake. When bad weather kept the plane grounded, the pilot made up the flight by randomly selecting another day within the same period, using the same start times that were scheduled for the cancelled day. We conducted interviews of anglers during each survey interval. We boated the lake, waited at boat ramps, or traveled by vehicle to interview fishermen. From January to May, anglers were interviewed on the same days that the plane flew, so we interviewed many of the same anglers that were counted during the aerial survey. Between Memorial Day and October, we interviewed anglers 4-5 days per week, including the flight days, since this was the time of highest lake use. Interview days lasted from 6 to 10 hours depending on the number of anglers fishing.
We conducted interviews on the lakes by using a 5.5 m boat with a 115 hp motor. When the anglers were trolling, interviews were conducted on the move. We pulled our boat alongside the fishermen. One technician drove the boat while the other technician interviewed anglers as they continued to fish. If they had fish, we measured them or had the anglers measure them for us. If the anglers were fishing from shore, we pulled our boat as close as possible without intruding on their fishing, and then conducted the interview. During the ice fishing season, we travel by truck to the lateral lakes and the accessible southern end of Coeur d’Alene Lake, and walked onto the ice to interview anglers.

49
Calculations of fishing pressure, harvest and catch rates were made using Creel Application Software, version 2.0, from South Dakota State University.
RESULTS
Kokanee Estimates by Trawling
Based on trawling, we estimated Coeur d’Alene Lake contained 745,800 (± 104%), 1,614,200 (± 44%), 2,119,200 (± 23%), and 337,200 (± 29%) kokanee of ages 0,1, 2, and 3, respectively (Table 15). Density of age-3 kokanee was calculated at 35 fish/ha. Standing stock was estimated at 13.69 kg/ha with a total population biomass of 132 metric tons (t); (Table 16). Survival rates from 2008 to 2009 were 53%, 59%, and 19% for age 0 to 1, 1 to 2 and 2 to 3, respectively. Kokanee fry collected in the trawl were in the 20 to 50 mm total length groups with a modal length of 30 mm (Figure 16). Age-1 kokanee ranged from 80 to 140 mm with a modal length of 110 mm. Age-2 fish ranged from 150 to 190 mm with a modal length of 170 mm. Size of the age-3 kokanee in the trawl catch ranged from 190 mm to 230 mm (Figure 16). Mean weights were 0.4, 13, 41, and 68 g for kokanee age classes 0 to 3, respectively. We collected 45 kokanee spawners near Higgins Point in Wolf Lodge Bay in two 10 minute gill net sets on December 1, 2009 and collected several additional mortalities along the shoreline. Mean length of female kokanee was 268.4 mm (TL), (n=5). Males averaged 291 mm (n=40). Total length of both sexes was smaller than the previous three years, but remained larger than the sizes seen between 1976 and 1996 (Figure 17). Mean fecundity was estimated at 524 eggs per female based on a mean female spawner length of 268.4 mm (Rieman 1992). Based on the trawl catch, kokanee over 210 mm were mature. We calculated a population estimate of 97,081 adult kokanee over 210 mm in total length. Assuming a 50:50 male to female ratio, the lake contained 48,541 mature females. At a fecundity of 524 eggs/female, potential egg deposition was estimated at 25.4 million eggs. Survival from kokanee eggs in 2008 to fry in 2009 was calculated at 7.8% (Table 17). Mean annual mortality rate for the cohort of kokanee that reached age 3 in 2009 was estimated at 62% (Figure 18). This was a sharp improvement from the 87% mean annual mortality of the preceding cohort, and was the lowest annual mortality of the preceding five cohorts. A plot of mean mortality rates from kokanee in LPO showed a similar pattern. Both systems showed a pronounced increase in mortality in the mid-1990’s that remained high through 2008. Stock recruitment plots for Coeur d’Alene Lake appeared to show the pattern of two separate relationships, one for all recruits produced before 1997 and one after (Figure 19). Data from pre-1997 depicted a more resilient population, with at its peak, a stock of 1.3 million fish producing 2.8 million recruits. Post-1997 the population appeared much less capable of replacing itself with a stock of 1.4 million adults producing only 75,000 recruits (this was the cohort that were eggs in the gravel during the 1997 flood year).
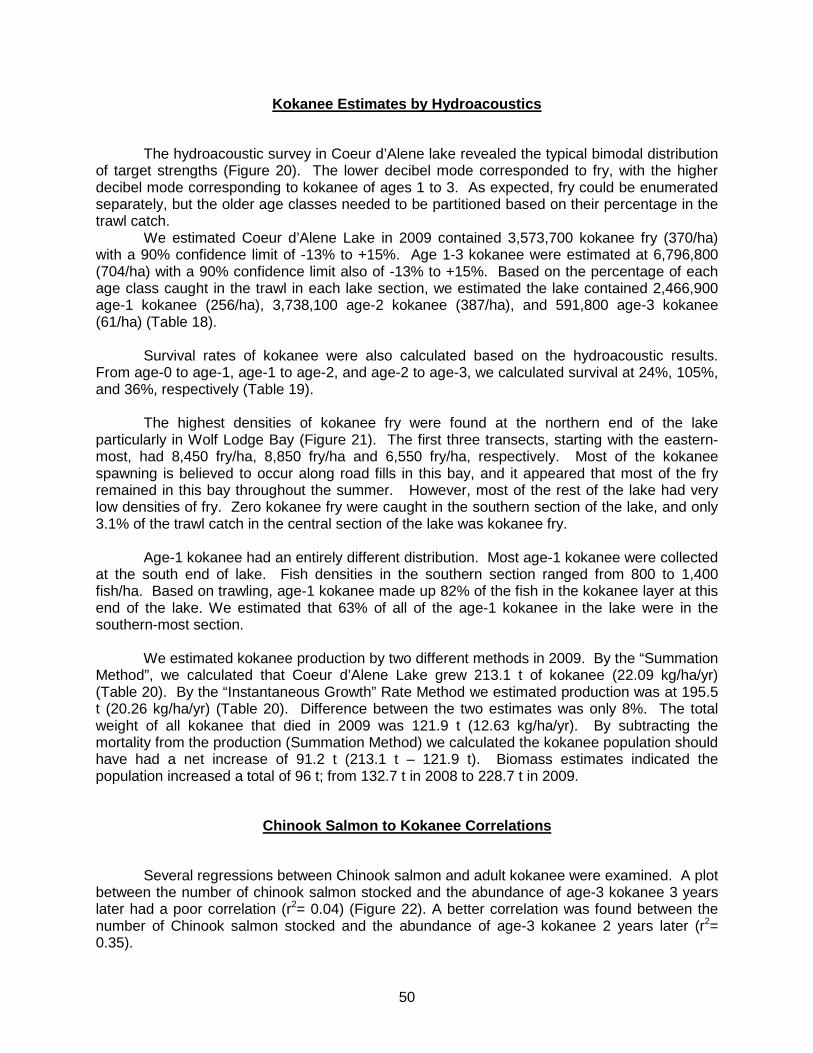
50
Kokanee Estimates by Hydroacoustics
The hydroacoustic survey in Coeur d’Alene lake revealed the typical bimodal distribution
of target strengths (Figure 20). The lower decibel mode corresponded to fry, with the higher decibel mode corresponding to kokanee of ages 1 to 3. As expected, fry could be enumerated separately, but the older age classes needed to be partitioned based on their percentage in the trawl catch.
We estimated Coeur d’Alene Lake in 2009 contained 3,573,700 kokanee fry (370/ha) with a 90% confidence limit of -13% to +15%. Age 1-3 kokanee were estimated at 6,796,800 (704/ha) with a 90% confidence limit also of -13% to +15%. Based on the percentage of each age class caught in the trawl in each lake section, we estimated the lake contained 2,466,900 age-1 kokanee (256/ha), 3,738,100 age-2 kokanee (387/ha), and 591,800 age-3 kokanee (61/ha) (Table 18).
Survival rates of kokanee were also calculated based on the hydroacoustic results.
From age-0 to age-1, age-1 to age-2, and age-2 to age-3, we calculated survival at 24%, 105%, and 36%, respectively (Table 19).
The highest densities of kokanee fry were found at the northern end of the lake
particularly in Wolf Lodge Bay (Figure 21). The first three transects, starting with the eastern-most, had 8,450 fry/ha, 8,850 fry/ha and 6,550 fry/ha, respectively. Most of the kokanee spawning is believed to occur along road fills in this bay, and it appeared that most of the fry remained in this bay throughout the summer. However, most of the rest of the lake had very low densities of fry. Zero kokanee fry were caught in the southern section of the lake, and only 3.1% of the trawl catch in the central section of the lake was kokanee fry.
Age-1 kokanee had an entirely different distribution. Most age-1 kokanee were collected
at the south end of lake. Fish densities in the southern section ranged from 800 to 1,400 fish/ha. Based on trawling, age-1 kokanee made up 82% of the fish in the kokanee layer at this end of the lake. We estimated that 63% of all of the age-1 kokanee in the lake were in the southern-most section.
We estimated kokanee production by two different methods in 2009. By the “Summation
Method”, we calculated that Coeur d’Alene Lake grew 213.1 t of kokanee (22.09 kg/ha/yr) (Table 20). By the “Instantaneous Growth” Rate Method we estimated production was at 195.5 t (20.26 kg/ha/yr) (Table 20). Difference between the two estimates was only 8%. The total weight of all kokanee that died in 2009 was 121.9 t (12.63 kg/ha/yr). By subtracting the mortality from the production (Summation Method) we calculated the kokanee population should have had a net increase of 91.2 t (213.1 t – 121.9 t). Biomass estimates indicated the population increased a total of 96 t; from 132.7 t in 2008 to 228.7 t in 2009.
Chinook Salmon to Kokanee Correlations
Several regressions between Chinook salmon and adult kokanee were examined. A plot between the number of chinook salmon stocked and the abundance of age-3 kokanee 3 years later had a poor correlation (r2= 0.04) (Figure 22). A better correlation was found between the number of Chinook salmon stocked and the abundance of age-3 kokanee 2 years later (r2= 0.35).
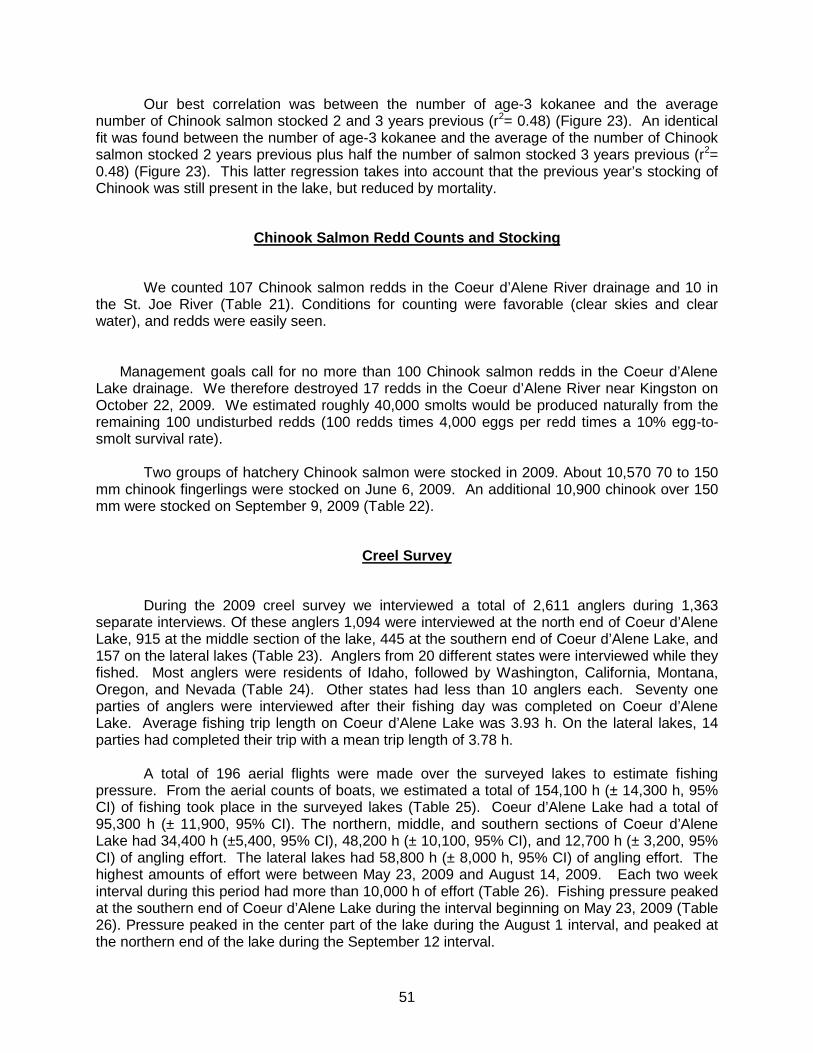
51
Our best correlation was between the number of age-3 kokanee and the average number of Chinook salmon stocked 2 and 3 years previous (r2= 0.48) (Figure 23). An identical fit was found between the number of age-3 kokanee and the average of the number of Chinook salmon stocked 2 years previous plus half the number of salmon stocked 3 years previous (r2= 0.48) (Figure 23). This latter regression takes into account that the previous year’s stocking of Chinook was still present in the lake, but reduced by mortality.
Chinook Salmon Redd Counts and Stocking
We counted 107 Chinook salmon redds in the Coeur d’Alene River drainage and 10 in
the St. Joe River (Table 21). Conditions for counting were favorable (clear skies and clear water), and redds were easily seen.
Management goals call for no more than 100 Chinook salmon redds in the Coeur d’Alene
Lake drainage. We therefore destroyed 17 redds in the Coeur d’Alene River near Kingston on October 22, 2009. We estimated roughly 40,000 smolts would be produced naturally from the remaining 100 undisturbed redds (100 redds times 4,000 eggs per redd times a 10% egg-to-smolt survival rate).
Two groups of hatchery Chinook salmon were stocked in 2009. About 10,570 70 to 150 mm chinook fingerlings were stocked on June 6, 2009. An additional 10,900 chinook over 150 mm were stocked on September 9, 2009 (Table 22).
Creel Survey
During the 2009 creel survey we interviewed a total of 2,611 anglers during 1,363
separate interviews. Of these anglers 1,094 were interviewed at the north end of Coeur d’Alene Lake, 915 at the middle section of the lake, 445 at the southern end of Coeur d’Alene Lake, and 157 on the lateral lakes (Table 23). Anglers from 20 different states were interviewed while they fished. Most anglers were residents of Idaho, followed by Washington, California, Montana, Oregon, and Nevada (Table 24). Other states had less than 10 anglers each. Seventy one parties of anglers were interviewed after their fishing day was completed on Coeur d’Alene Lake. Average fishing trip length on Coeur d’Alene Lake was 3.93 h. On the lateral lakes, 14 parties had completed their trip with a mean trip length of 3.78 h.
A total of 196 aerial flights were made over the surveyed lakes to estimate fishing
pressure. From the aerial counts of boats, we estimated a total of 154,100 h (± 14,300 h, 95% CI) of fishing took place in the surveyed lakes (Table 25). Coeur d’Alene Lake had a total of 95,300 h (± 11,900, 95% CI). The northern, middle, and southern sections of Coeur d’Alene Lake had 34,400 h (±5,400, 95% CI), 48,200 h (± 10,100, 95% CI), and 12,700 h (± 3,200, 95% CI) of angling effort. The lateral lakes had 58,800 h (± 8,000 h, 95% CI) of angling effort. The highest amounts of effort were between May 23, 2009 and August 14, 2009. Each two week interval during this period had more than 10,000 h of effort (Table 26). Fishing pressure peaked at the southern end of Coeur d’Alene Lake during the interval beginning on May 23, 2009 (Table 26). Pressure peaked in the center part of the lake during the August 1 interval, and peaked at the northern end of the lake during the September 12 interval.

52
During our interviews we observed the harvest of 2,408 fish, with anglers stating they had released another 1,368 fish. Catch per unit effort for anglers targeting a particular species ranged from 0.00 to 2.86 fish/h (Table 27). The highest catch rate was for bluegill, however, only two anglers said they were targeting this species. The next highest catch rates were for yellow perch (2.76 fish/h), brown bullheads (1.60 fish/h), largemouth bass (1.50 fish/h), kokanee (1.48 fish/h), and smallmouth bass (1.45 fish/h). Chinook salmon anglers had a catch rate of 0.14 fish/h or 7.1 h/fish. Harvest rates were considerably lower than the catch rate for some species of fish. For example, largemouth bass anglers caught bass at a rate of 1.50 fish/h, but harvested them at a rate of 0.28 fish/h; indicating a high degree of catch-and-release fishing. Kokanee, Chinook salmon, black crappie, and yellow perch anglers kept most of their catch (Table 27).
We examined the catch rates of several key species of fish throughout the year to look
for trends in catchability (Table 28). Chinook salmon anglers had their best catch rates between late September and the end of the year. Kokanee angling peaked during their spawning season, but remained over 1 fish/h from the end of May through their spawning season.
The total harvest of fish was based on the interview data and the fishing pressure
estimates. From these, we estimated a total catch of 78,900 fish with a harvest of 25,200 fish from Coeur d’Alene Lake and the lateral lakes in 2009 (Table 29). Catch in the lateral lakes (37,600 fish) nearly equaled the catch in all of Coeur d’Alene Lake (41,300 fish). However, harvest in the lateral lakes (4,600 fish) was much lower than Coeur d’Alene Lake (20,600 fish) largely due to the release of largemouth and smallmouth bass. The most numerous species caught in Coeur d’Alene Lake included: kokanee (22,300), smallmouth bass (14,100), Chinook salmon (2,500) and northern pike (1,200). In the lateral lakes the catch was dominated by: largemouth bass (28,600), yellow perch (3,300), smallmouth bass (2,300), and northern pike (2,200) (Table 29). Catch and harvest of each species in each section of Coeur d’Alene Lake and the lateral lakes are included in Appendix B.
Sizes of fish were recorded during the survey interviews. Length frequency distributions
were drawn for Chinook salmon, kokanee, and northern pike (Figure 24). Chinook salmon had a bimodal distribution with modes at 450 and 650 mm in total length and a mean size of 563 mm. Most kokanee ranged in size from 200 to 325 mm, but a few larger fish were recorded. Mean size of kokanee was 248 mm. We measured northern pike that ranged from the 450 mm to the 925 mm size groups, with a mean size of 652 mm.
We examined Chinook salmon for the presence of fin clips during the survey and during
the weigh-in for the Big One Chinook Derby. One hundred eighty were thought to be wild fish and five (3%) were fin clipped; four with right ventral clips denoting the 2006 stocking and one with an adipose clip denoting the 2004 stocking.
DISCUSSION
Kokanee Population Estimates
Most age classes of kokanee in Coeur d’Alene Lake greatly increased in abundance during 2009. Estimates of age-3 kokanee increased 10 fold based on trawling and 15 fold based on hydroacoustics from 2008 (Tables 15 and 16). Abundance of age-2 kokanee was more than double the previous year’s estimate based on hydroacoustics. Total kokanee biomass increased 72% from the previous year. We attribute this pronounced increase in the

53
population to reduced predation resulting from the lack of Chinook salmon stocking in 2007 and 2008, and to some extent, the limiting of wild Chinook salmon spawning by our excavation of redds. It is also quite possible that 2009 was an exceptional growth year for kokanee and helped to boost this population to higher levels of abundance. Since this was the first year that production and mortality by weight were calculated for this lake, it is difficult to say whether production was up, or mortality was down. In the future, it will be clearer once a statistical trend has been established. Unfortunately, kokanee fry abundance dropped to almost record lows. Our estimate of 745,800 fry by trawling was well below the 3 to 7 million fry estimated in recent years, and was the second lowest on record. However, this estimate had a 90% confidence limit of plus or minus 104% (Table 16). The wide confidence limits were due to the contagious spatial distribution with most fry grouped in Wolf Lodge Bay. By hydroacoustics, the estimate of fry abundance was down, but considerably higher than the trawl estimate. We calculated the lake contained 3.6 million fry in 2009 by hydroacoustics, down from 10.5 million fry the previous year. Low fry abundance may have been due to the exceedingly low adult kokanee densities last year (2.9 fish/ha, Table 15). The adult population of kokanee had been low, and dropping, since 1996, but fry abundance had been sufficient to keep the next generation of kokanee well seeded. By 2009 we may have reached the point where low adult abundance was having a sharp effect on the next generation of kokanee by limiting recruitment. Our hope was that the potential for impacting the next generation has largely been averted with the current improvement in adult abundance. Chinook salmon stocking in 2009 was deliberately reduced (21,500 age-0 stocked) to reduce predation on this weak year class of kokanee fry. Future monitoring of this year class is recommended. Although it was not planned as an adaptive management test, the low abundance of the kokanee fry in 2009 may have been an indicator of how far the system can be stretched by stocking predators. High Chinook salmon stocking in 2005 (26,300) and 2006 (47,600) along with strong wild production of an estimated 62,300 and 71,200 smolts, respectively, reduced adult kokanee to their lowest point on record in 2008 and appeared to have impacted fry production in 2009. Up until this point, even low numbers of kokanee adults produced good numbers of fry for the next generation of kokanee. The amount of Chinook salmon stocked and produced in the wild during 2005 and 2006 appear to have exceeded the capacity of the system even with reduction in the kokanee sport fishery. This may represent the limit above which the kokanee population can no longer sustain itself. This “breaking point” for Coeur d’Alene Lake may have implications for other lake systems. Coeur d’Alene Lake is fairly productive by northern Idaho standards. It also it thought to have high quality spawning areas producing excellent egg-to-fry survival rates. Even with this quality of habitat, 3 adult kokanee/ha (by trawling) appeared to be a likely demarcation for a critically low level of kokanee abundance verging on recruitment failure. For many years we have suggested that 30-50 adult kokanee per ha was a good guideline for optimizing the fishery (Rieman and Maiolie 1995). We also knew that high levels of kokanee on the order of 100 to 300 adults/ha still provided a fishery but the yield to anglers was small owing to the small size of the fish. These data from the last three years may be our closest example of how low a kokanee population can get before a recruitment failure occurs. Our catch of no kokanee fry at the southern end of the lake was a strong indication that very little or no spawning occurs in the Coeur d’Alene River, St. Joe River, or shorelines on the southern end of the lake. Trawling in previous years gave similar results (only two fry were caught in three trawl hauls in this section in 2008). This has an important implication to the

54
analysis of the hydroacoustic survey. Analysis of target strengths of fish at the southern end produced many targets in the typical range of kokanee fry. Simply defining all targets below -47 dB (76 mm, Love 1971) would give erroneous results. Examining the target strength frequency distribution showed only a unimodal distribution. Small targets should be interpreted as the left-side tail of the distribution of mostly age-1 kokanee.
Chinook Salmon to Kokanee Correlations
A reasonably good trend was found in two of the correlations we examined (Figure 23). Adult kokanee were inversely proportional to the mean of the number of Chinook salmon stocked 2 and 3 years earlier, and also to the mean of the number of Chinook salmon stocked 2 years earlier and one half the number stocked 3 years previous. This latter correlation was meant to take into account that mortality would be a factor on the older group of chinook. The two and three year lag time is an important point. A year class of kokanee appeared to be affected by both the year class of chinook that were the same age, and also the year class of chinook that were a year younger. Therefore the low year class of kokanee fry in 2009 would be influenced by the Chinook salmon stocking in 2009 and 2010. This gives managers one additional year to decide on an appropriate Chinook salmon stocking level. During 2009, we tested a fall stocking of Chinook salmon that were released in Wolf Lodge Bay. Results of this stocking will not be available for a year or two as these fish enter the fishery. If fall stocking proves successful, we could then monitor the kokanee population in July, and decide on the appropriate number of Chinook salmon to stock in October. This would help to balance Chinook salmon and kokanee even in the first year that a weak year class of kokanee was detected.
A reasonable objective for this lake would be to have 30-50 adult kokanee/ha present in the July trawl sampling (Rieman and Maiolie 1995). This translates to an adult year class of 290,000 to 480,000 kokanee. Both of these two correlations indicate that Chinook salmon stocking would need to be held fairly low in 2010 to reach the desired kokanee density.
Before 1996, there was almost no discernable trend between stocking Chinook salmon and adult kokanee abundance. We found good numbers of adult kokanee even in some years of high Chinook salmon stocking. After 1996, it appeared the system changed. The changes could include several factors. Wild Chinook salmon that naturally spawn in the drainage could be more successful than in the earlier years. Evidence for this includes the finding that wild Chinook salmon supported most of the harvest of 2,500 fish in 2009. Secondly, post 1996 kokanee were starting from a lower number of eggs. This may have allowed the Chinook salmon to have a more pronounced influence on adult kokanee numbers. The point for 2009 in Figure 23 was well above expectations based on the number of Chinook salmon stocked. Why kokanee did better than expected in 2009 was unknown, but the authors suspect that the previous two winters with high snow pack could have boosted lake productivity and benefitted kokanee survival. Kokanee production in Coeur d’Alene Lake of 22 kg/ha/yr was twice the production of LPO at 10 kg/ha/yr (mean production from 1995 to 2007, agency files). Future estimates of production should show whether or not this was an unusually high increase in Coeur d’Alene fish production.

55
Kokanee Mortality
One finding noted during this study was a synchrony of the mortality rates of the Coeur d’Alene and LPO kokanee populations (Figure 18). Coeur d’Alene Lake and LPO are in two separate drainages. Both lakes have different predator species. Both lakes also have very different conditions of kokanee spawning habitat. One lake has opossum shrimp Mysis relicta and one lake does not. Yet both populations have had a similar pattern of kokanee mortality since the mid-1990’s. We recommend continuing to compare these two lakes in the future to note factors which could affect both systems such as weather, runoff, management changes, or other over-reaching effects.
Creel Survey
The 2009 creel survey on Coeur d’Alene Lake showed a substantial decline in the amount of fishing effort (Table 16). Prior creel surveys between 1967 and 1996 averaged 238,000 h of fishing effort. We estimated only 95,000 h of fishing, a decline to only 40% of the previous average. We attribute much of the decline in fishing effort to a reduction in the kokanee fishery. Catch rates in the kokanee fishery remained a reasonably high 1.5 fish/h (Table 13) and the size of kokanee was better than many previous years (Figures 17 and 24). However, the harvest limit for kokanee in the northern and middle sections of the lake was 6 fish/angler/day during this survey. We suspect this limit did not attract many anglers. With the low effort, harvest of kokanee dropped to 17,200 fish, well below the 96,000 to 578,000 estimated in past surveys (Table 17). We recommend considering a regulation change to allow more kokanee harvest now that kokanee abundance has increased. The southern section of the lake required a Tribal license for fishing on the Coeur d’Alene Tribal Reservation. Fishing licenses sold for $25 for non-Indian adults in 2009. This may partially explain the low fishing pressure in the southern section where anglers fished only an estimated 12,700 h (Table 25). The northern and middle sections had 34,400 h and 48,200 h, respectively. Kokanee catch rates were somewhat better at the southern end of the lake (1.90 kokanee/h) than at the middle (1.17 kokanee/h) or northern ends of the lake (1.40 kokanee/h). The tribal waters also had a 25 kokanee/angler daily limit. Interestingly kokanee catch was similar in all sections with 8,600, 6,700 and 7,000 kokanee caught in the northern, middle, and southern sections, respectively (Appendix B). It appeared that better catch rates and higher limits balanced with the lower amount of fishing pressure to keep kokanee harvest in the southern section fairly similar to harvest in other sections of the lake. We therefore do not consider the higher limit in tribal waters as an impediment to restoring kokanee abundance to higher levels.
Harvest of 2,200 Chinook salmon in Coeur d’Alene Lake was down 33% from the previous creel survey in 1996 when 3,300 were harvested (Tables 31 and 32). This was a reasonably good fishery considering that no Chinook salmon were stocked in 2007 or 2008 so all of the age 1 and age 2 Chinook salmon were of wild origin. Hatchery produced fish were rare even among the older age classes with only 3% of all Chinook salmon having a fin clip. This shows the importance of wild fish to the fishery, or conversely the lack of importance of the hatchery fish. One unanswered question is how the fishery could be so dependent on wild fish and yet the kokanee population showed such a pronounced response to the stocking of hatchery produced Chinook salmon (Figure 23 A and B).

56
Lengths of Chinook salmon harvested in 2009 formed a bimodal frequency distribution with peaks at 450 mm and 650 mm (Figure 24). Although we did not age these fish, we suspected the peaks corresponded to Chinook salmon at age-1 and age-2. This would indicate that age-1 salmon were an important part of the fishery and comprised 57% of the harvest. The mean size of Chinook salmon, at 563 mm, has declined from the mean length of 800 mm seen in 1987 (Table 24). If anglers desire larger salmon, then reducing the harvest of these smaller fish would allow more to grow to a larger size.
Smallmouth bass have colonized many of the suitable shorelines around Coeur d’Alene Lake. Maiolie et al (in press) collected smallmouth bass without much difficulty at both ends of the lake during spring and fall electrofishing. In our creel survey in 2009 we estimated the catch of 14,000 smallmouth bass and the harvest of 880. This is a substantial increase from the 1995-96 creel survey when only 240 smallmouth bass were estimated in the catch and 0 were harvested (Fredericks et al 1997). The impact of this growing population of smallmouth bass is likely dependant on their ultimate abundance. Potentially they could compete with, and prey on, other fish species particularly in the near-shore areas of the lake. We advise continued monitoring of smallmouth bass and their effects.
MANAGEMENT RECOMMENDATIONS
1. Continue a limited amount of Chinook salmon stocking in 2009. We recommend
stocking 10,000 fingerlings in the spring and 10,000 fingerlings in the fall to allow for further recovery of kokanee and to continue to test the importance of the timing of the release.
2. Stock Chinook salmon fingerlings into Wolf Lodge Bay in order place them near the highest density of kokanee forage.
3. Continue to limit the wild spawning of Chinook salmon to 100 redds.
4. Examine the angler acceptance of a Region-wide 15 kokanee limit.
5. Continue efforts to manage kokanee densities toward an adult abundance of 30 to
50 kokanee/ha based on trawling.

57
Table 15. Estimated abundance of kokanee made by midwater trawl in Coeur d’Alene Lake, Idaho, from 1979-2007. To follow a particular year class of kokanee, read right one column and up one row.
Sampling
Year Age Class
Total Age 3+/ha Age 0+ Age 1+ Age 2+
Age 3/4+
2009 745,800 1,614,200 2,119,200 337,200 4,816,400 35 2008 3,035,000 3,610,000 1,755,000 28,000 8,428,000 3 2007 3,603,000 2,367,000 136,000 34,000 6,140,000 3 2006 7,343,000 1,532,000 91,000 33,900 8,999,000 3 2005 - - - - - - 2004 7,379,000 1,064,000 141,500 202,400 8,787,000 21 2003 3,300,000 971,000 501,400 182,300 4,955,000 19 2002 3,507,000 934,000 695,200 70,800 5,207,000 7 2001 7,098,700 929,900 193,100 25,300 8,247,000 3 2000 4,184,800 783,700 168,700 75,300 5,212,600 8 1999 4,091,500 973,700 269,800 55,100 5,390,100 6 1998 3,625,000 355,000 87,000 78,000 4,145,000 8 1997 3,001,100 342,500 97,000 242,300 3,682,000 25 1996 4,019,600 30,300 342,400 1,414,100 5,806,400 146 1995 2,000,000 620,000 2,900,000 2,850,000 8,370,000 295 1994 5,950,000 5,400,000 4,900,000 500,000 12,600,000 51 1993 5,570,000 5,230,000 1,420,000 480,000 12,700,000 50 1992 3,020,000 810,000 510,000 980,000 5,320,000 102 1991 4,860,000 540,000 1,820,000 1,280,000 8,500,000 133 1990 3,000,000 590,000 2,480,000 1,320,000 7,390,000 137 1989 3,040,000 750,000 3,950,000 940,000 8,680,000 98 1988 3,420,000 3,060,000 2,810,000 610,000 10,900,000 63 1987 6,880,000 2,380,000 2,920,000 890,000 13,070,000 93 1986 2,170,000 2,590,000 1,830,000 720,000 7,310,000 75 1985 4,130,000 860,000 1,860,000 2,530,000 9,370,000 263 1984 700,000 1,170,000 1,890,000 800,000 4,560,000 83 1983 1,510,000 1,910,000 2,250,000 810,000 6,480,000 84 1982 4,530,000 2,360,000 1,380,000 930,000 9,200,000 97 1981 2,430,000 1,750,000 1,710,000 1,060,000 6,940,000 110 1980 1,860,000 1,680,000 1,950,000 1,060,000 6,500,000 110 1979 1,500,000 2,290,000 1,790,000 450,000 6,040,000 46
Mean 1979 -2006 3,856,285 1,552,078 1,516,930 762,574 7,568,930 79

58
Table16. Kokanee population estimates and standing crop (kg/ha) in each section of Coeur d'Alene Lake based on trawl sampling on July 22 and 23, 2009.
Section Age 0 Age 1 Age 2 Age 3 Kg/ha
1 683,000 113,900 482,800 104,600 13.08 2 62,800 383,200 1,418,400 209,100 13.60 3 0 1,117,100 218,000 23,500 14.75
Whole lake total 745,800 1,614,200 2,119,200 337,200 13.69 90% confidence limits as
a percent 104% 44% 23% 29%

59
Table 17. Estimates of female kokanee spawning escapement, potential egg deposition, fall abundance of kokanee fry, and their subsequent survival rates in Coeur d'Alene Lake, Idaho, 1979-2007. All data were based on trawl sampling.
Year
Estimated female escapement
Estimated potential number
of eggs (x106)
Fry estimate the following year
(x106)
Percent egg to fry survival
2009 48,540 25 2008 13,852 10 0.75 7.8 2007 17,100 13 3.04 23.4 2006 16,900 12 3.60 28.9 2005 -a -a 7.34 -a
2004 101,000 76 -a -a
2003 91,000 62 7.38 12.0 2002 35,000 25 3.30 13.2 2001 12,650 10 3.50 34.0 2000 37,700 32 7.10 22.2 1999 28,000 19 4.18 22.6 1998 39,000 26 4.09 15.7 1997 90,900 54 3.60 6.67 1996 707,000 358 3.00 0.84 1995 1,425,000 446 4.02 0.90 1994 250,000 64 2.00 0.31 1993 240,000 92 5.95 6.46 1992 488,438 198 5.57 2.81 1991 631,500 167 3.03 1.81 1990 657,777 204 4.86 1.96 1989 516,845 155 3.00 1.94 1988 362,000 119 3.04 2.55 1987 377,746 126 3.42 2.71 1986 368,633 103 6.89 6.68 1985 530,631 167 2.17 1.29 1984 316,829 106 4.13 3.90 1983 441,376 99 0.70 0.71 1982 358,200 120 1.51 1.25 1981 550,000 184 4.54 2.46 1980 501,492 168 2.43 1.45 1979 256,716 86 1.86 2.20
a No estimate could be made due to missing trawl data in 2005.

60
Table 18. Kokanee population estimates in each section of Coeur d’Alene Lake based on
hydroacoustic sampling on July 29 and 30, 2009.
Section Age 0 Age 1 Age 2 Age 3 1A 1,963,000 24,200 99,600 10,800 1B 1,486,200 134,900 556,600 151,800 2 124,500 743,100 2,776,600 391,100 3 0 1,564,700 305,300 38,100
Whole lake total 3,573,700 2,466,900 3,738,100 591,800
Table 19. Kokanee population estimates for Coeur d’Alene Lake made by hydroacoustics
during 2008 and 2009. Both years’ data were based on arithmetic mean densities. Survival rate is calculated between years.
Year Age 0 Age 1 Age 2 Age 3
2009 3,573,700 2,466,900 3,738,100 591,800
Survival rate 24% 105% 36%
2008 10,478,900 3,571,900 1,650,200 39,200

61
Table 20. Estimates of kokanee production in Coeur d’Alene Lake by the Summation Method and the Instantaneous Growth Rate Method (Hayes et al. 2007).
1 Production calculated by the Summation Method (multiplying mean population estimate by weight gain. 2 Production calculated by the Instantaneous Growth Rate Method (multiplying instantaneous growth rate by mean biomass).
Kokanee year class
Weight (g)
Weight gain (g)
Instantaneous growth rate
Population Estimate
Mean Population Estimate
Biomass (t) Production1
(t) Production2
(t)
New Fry – 2009 0.15
11,912,290
1.79
0.27 1.0296
7,742,989 2.1 1.7 Age 0 2009 0.42
3,573,687
1.50
Age 0
2008 0.70
10,478,925
7.34
12.75 2.9557
6,472,894 82.5 59.9
Age 1 2009 13.45
2,466,863
33.18
Age 1
2008 15.09
3,571,945
53.90
26.11 1.0044
3,655,046 95.4 104.4
Age 2 2009 41.20
3,738,147
154.01
Age 2
2008 38.02
1,650,193
62.74
29.51 0.5745
1,121,004 33.1 29.5
Age 3 2009 67.53
591,814
39.97
Total
213.1
195.5

62
Table 21. Chinook salmon redd counts in the Coeur d’Alene (Cd’A) River drainage, St. Joe River and Wolf Lodge Creek, Idaho, 1990-2008.
Dat
e
Cat
alal
do M
issi
on to
S.F
. Cd’
A R
iver
Sou
th F
ork
Cd’
A to
L.N
.F. C
d’A
Riv
er
L.N
.F. C
d’A
to S
team
boat
Cre
ek
Ste
ambo
at C
reek
to S
teel
Brid
ge
Ste
el B
ridge
to B
eave
r Cre
ek
Sou
th F
ork
Cd’
A R
iver
Littl
e N
orth
For
k C
d’A
Riv
er
Coe
ur d
’Ale
ne R
iver
Sub
tota
l
St.
Joe
City
to C
alde
r
Cal
der t
o H
uckl
eber
ry C
ampg
roun
d
Huc
kleb
erry
Cam
pgro
und
to M
arbl
e C
reek
Mar
ble
Cre
ek to
Ave
ry
St. J
oe R
iver
Sub
tota
l
Wol
f Lod
ge C
reek
Tota
l
1990 41 10 - - - - - 51 4 3 3 0 10 -- 66 1991 11 0 2 - - - - 13 0 1 0 0 1 - 14 1992 29 5 3 1 - - - 21 18 1 2 0 21 - 63 1993 80 11 6 0 - - - 97 20 4 0 0 24 - 121 1994 82 14 1 0 0 13 0 110 6 0 1 1 8 - 118 1995 45 14 1 2 0 - 2 64 1 0 0 0 1 - 65 1996 54 13 13 0 0 4 0 84 59 5 7 0 71 - 155 1997 18 5 6 3 1 0 0 33 20 2 2 0 24 - 57 1998 11 3 1 0 0 0 0 15 3 1 0 2 6 4 25 1999 7 5 0 0 0 0 0 12 0 0 0 0 0 5 17 2000 16 20 3 0 0 5 1 45 5 0 0 0 5 3 53 2001 18 13 2 1 0 4 0 38 21 15 - - 36 4 78 2002 14 10 6 0 0 3 0 33 14 4 0 0 18 0 51 2003 27 17 2 0 0 5 0 51 15 9 3 0 27 0 78 2004 24 36 4 2 0 4 1 71 15 3 0 0 18 1 90 2005 30 7 3 0 0 8 1 49 7 3 0 0 10 1 60 2006 30 80 14 7 0 10 0 141 15 1 0 0 16 - 157 2007 63 20 4 1 0 13 0 101 23 4 0 0 26 - 127 2008 79 6 1 2 0 4 0 92 13 3 1 0 17 - 109 2009 70 23 1 0 0 13 0 107 9 1 0 0 10 - 117
Coeur d’Alene River St. Joe River Wolf Lodge Creek

63
Table 22. Number of Chinook salmon stocked and estimated number of naturally produced Chinook salmon entering Coeur d'Alene Lake, Idaho, 1982-2007. The number of Chinook salmon redds is the count from the previous fall.
Year
Hatchery Produced Naturally Produced
Number Stock Rearing
Hatchery Fin Clip
Previous year
redd counts
Estimated Smolts Total
1982 34,400 Bonneville Hagerman -- -- -- 34,400 1983 60,100 Bonneville Mackay -- -- -- 60,100 1984 10,500 L. Michigan Mackay -- -- -- 10,500 1985 18,300 L. Michigan Mackay Left Ventral -- -- 18,300 1986 30,000 L. Michigan Mackay Right Ventral -- -- 30,000 1987 59,400 L. Michigan Mackay Adipose -- -- 59,400 1988 44,600 Coeur d’Alene Mackay Left Ventral -- -- 44,600 1989 35,400 Coeur d’Alene Mackay Right Ventral -- -- 35,400 1990 36,400 Coeur d’Alene Mackay Adipose 52 20,800 57,200 1991 42,600 Coeur d’Alene Mackay Left Ventral 70 28,000 70,600 1992 10,000 Coeur d’Alene Mackay Right Ventral 14 5,600 15,600 1993 0 -- -- -- 63 25,200 25,200 1994 17,300 Coeur d’Alene Nampa Adipose 100 40,000 57,300 1995 30,200 Coeur d’Alene Nampa Left Ventral 100 40,000 70,200 1996 39,700 Coeur d’Alene Nampa Right Ventral 65 26,000 65,700 1997 12,600 Coeur d’Alene Nampa Adipose 84 33,600 46,200 1998 52,300 Priest Rapids Cabinet G. Left Ventral 57 22,800 75,100 1999 25,500 Big Springs Cabinet G. Right Ventral 25 10,000 35,500 2000 28,000 Big Springs Nampa Adipose 17 6,800 34,800 2001 0 -- -- -- 53 21,200 21,200 2002 41,000 Big Springs Nampa Left Ventral 78 31,200 72,200 2003 44,800 Big Springs Nampa Right Ventral 51 20,400 65,200 2004 2005 2006
46,000 26,300 47,600
Big Springs L. Sacajawea L. Sacajawea
Nampa Nampa Nampa
Adipose Left Ventral Right Ventral
78 90 59
31,000 36,000 23,600
77,000 62,300 71,200
2007 0 100 40,000 40,000 2008 0 65 26,000 26,000
2009 21,500 Big Creek Nampa Adipose + coded wire tag 100 40,000 61,500

64
Table 23. Numbers of anglers interviewed on three sections of Coeur d’Alene (CdA) Lake and the lateral lakes, Idaho, during 2009.
Interval start date
North end CdA Lake
Mid CdA Lake
South end CdA
Lake Lateral Lakes
Total for Interval
1/3/2009 5 2
7 1/17/2009 1
1
1/31/2009 1 10 22 33 2/14/2009 8 26 8 42 2/28/2009 4 14
18
3/14/2009 26 39 9
74 3/28/2009 73 36 9 3 121 4/11/2009 39 27
66
4/25/2009 27 35 20 22 104 5/9/2009 41 36 38
115
5/23/2009 18 49 100 41 208 6/6/2009 44 75 46 2 167
6/20/2009 24 19 47 33 123 7/4/2009 31 25 31
87
7/18/2009 48 32 20
100 8/1/2009 70 48 20 6 144
8/15/2009 115 69 41 5 230 8/29/2009 174 101 41 8 324 9/12/2009 137 29 12 4 182 9/26/2009 113 18 7
138
10/10/2009 31 10 3
44 10/24/2009 37 43
80
11/7/2009 2 14 1
17 11/21/2009 18 51 3 72 12/5/2009 3 87
90
12/19/2009 5 19
24 Total 1094 915 445 157 2611

65
Table 24. State of residency of anglers fishing Coeur d’Alene Lake and the Lateral Lakes
during 2009.
State Residency Number of
anglers Idaho 2160 Washington 336 California 26 Montana 20 Oregon 18 Nevada 13 Texas 6 Arizona 5 Canada 4 Illinois 4 Minnesota 3 Colorado 3 Indiana 3 Maryland 2 Virginia 2 South Dakota 2 Arkansas 1 Hawaii 1 Tennessee 1 Utah 1 Total 2611

66
Table 25. Estimates of total fishing pressure (P, h), standard error (SE) and confidence
intervals (+/- % CI) for three sections of Coeur d'Alene Lake (CdA) and the lateral lakes during the 2009 creel survey.
Lake section P SE 90% CI 95% CI Northern section CdA Lake 34,382 2,757 4,535 5,403 Central section CdA Lake 48,245 5,171 8,507 10,136 Southern section CdA Lake 12,667 1,615 2,657 3,166 CdA Lake combined 95,294 6,079 9,999 11,913 Lateral lakes 58,839 4,064 6,685 7,965 Total fishing pressure 154,133 7,312 12,028 14,331

67
Table 26. Estimated total fishing pressure (angler hours) on three sections of Coeur d’Alene
(CdA) Lake and the Lateral Lakes, Idaho, during the 2009 creel survey.
Interval start date
Lateral lakes
North end CdA Lake
Mid CdA Lake
South end CdA Lake
Total for interval
1/3/2009 0 168 286 0 454 1/17/2009 2,055 392 125 258 2,830 1/31/2009 49 105 38 0 192 2/14/2009 4,046 267 1,067 579 5,959 2/28/2009 913 44 419 0 1,376 3/14/2009 91 181 1,697 0 1,969 3/28/2009 499 620 2,054 176 3,349 4/11/2009 1,501 1,213 4,013 533 7,260 4/25/2009 3,467 575 533 442 5,017 5/9/2009 3,348 1,986 3,492 712 9,538 5/23/2009 6,280 2,148 4,080 2,486 14,994 6/6/2009 6,185 2,835 3,078 1,239 13,337 6/20/2009 5,822 3,317 5,352 1,277 15,768 7/4/2009 5,017 2,063 3,083 788 10,951 7/18/2009 5,455 2,642 3,466 951 12,514 8/1/2009 3,561 3,135 5,901 1,250 13,847 8/15/2009 2,160 2,058 2,426 434 7,078 8/29/2009 2,077 1,835 963 147 5,022 9/12/2009 2,119 4,207 1,760 434 8,520 9/26/2009 1,411 1,851 805 522 4,589 10/10/2009 1,485 1,152 636 41 3,314 10/24/2009 580 1,057 657 254 2,548 11/7/2009 296 81 507 45 929 11/21/2009 79 150 669 0 898 12/5/2009 26 128 870 56 1,080 12/19/2009 317 171 269 42 799
Total 58,839 34,382 48,245 12,667 154,133

68
Table 27. Catch and harvest rates for anglers targeting various species of fish during the 2009 creel survey on Coeur d’Alene Lake and the Lateral Lakes, Idaho.
Species
Catch rate
(fish/h)
95% CI on Catch rate
Harvest rate (fish/h)
95 % CI on Harvest
rate Coeur d’Alene Lake
Kokanee salmon 1.48 0.33 1.13 0.24 Chinook salmon 0.14 0.06 0.11 0.06
Largemouth bass 0.40 0.00 0.04 0.00 Smallmouth bass 1.45 0.37 0.10 0.06
Northern pike 0.17 0.03 0.10 0.03 Black crappie 0.27 --- 0.27 --- Yellow perch 0.09 --- 0.00 ---
Cutthroat Trout 0.09 --- 0.00 --- Rainbow Trout 0.00 --- 0.00 ---
Targeting Anything 0.12 0.03 0.03 0.01 Overall 0.43 0.10 0.22 0.05
Lateral Lakes
Kokanee salmon 0.50 --- 0.50 --- Largemouth bass 1.50 1.64 0.28 0.20 Smallmouth bass 0.53 --- 0.04 ---
Northern pike 0.16 0.05 0.06 0.05 Black crappie 0.41 0.59 0.37 0.50 Yellow perch 2.76 0.00 2.27 0.00
Brown Bullhead 1.60 0.96 0.60 0.53 Channel Catfish 0.00 0.00 0.00 0.00
Tench 0.17 --- 0.00 --- Bluegill 2.86 --- 2.86 ---
Targeting Anything 1.16 0.79 0.58 0.99 Overall 0.64 0.20 0.08 0.02
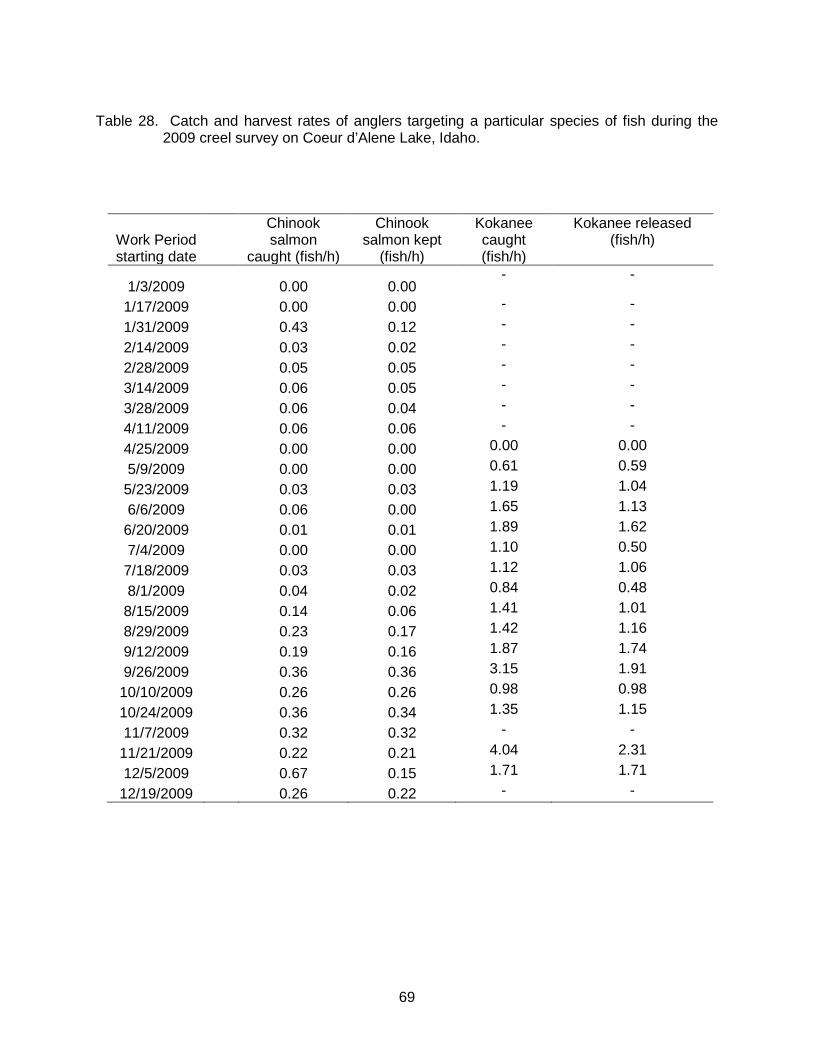
69
Table 28. Catch and harvest rates of anglers targeting a particular species of fish during the
2009 creel survey on Coeur d’Alene Lake, Idaho.
Work Period starting date
Chinook salmon
caught (fish/h)
Chinook salmon kept
(fish/h)
Kokanee caught (fish/h)
Kokanee released (fish/h)
1/3/2009
0.00 0.00 - -
1/17/2009
0.00 0.00 - - 1/31/2009
0.43 0.12 - -
2/14/2009
0.03 0.02 - - 2/28/2009
0.05 0.05 - -
3/14/2009
0.06 0.05 - - 3/28/2009
0.06 0.04 - -
4/11/2009
0.06 0.06 - - 4/25/2009
0.00 0.00 0.00 0.00
5/9/2009
0.00 0.00 0.61 0.59 5/23/2009
0.03 0.03 1.19 1.04
6/6/2009
0.06 0.00 1.65 1.13 6/20/2009
0.01 0.01 1.89 1.62
7/4/2009
0.00 0.00 1.10 0.50 7/18/2009
0.03 0.03 1.12 1.06
8/1/2009
0.04 0.02 0.84 0.48 8/15/2009
0.14 0.06 1.41 1.01
8/29/2009
0.23 0.17 1.42 1.16 9/12/2009
0.19 0.16 1.87 1.74
9/26/2009
0.36 0.36 3.15 1.91 10/10/2009
0.26 0.26 0.98 0.98
10/24/2009
0.36 0.34 1.35 1.15 11/7/2009
0.32 0.32 - -
11/21/2009
0.22 0.21 4.04 2.31 12/5/2009
0.67 0.15 1.71 1.71
12/19/2009
0.26 0.22 - -

70
Table 29. Estimated numbers of each species of fish caught and harvested in Coeur d’Alene (CdA) Lake and the lateral lakes during the 2009 creel survey.
Species CdA Lake Lateral lakes Total
Catch Harvest Catch Harvest Catch Harvest
Kokanee salmon 22,262 17,186 2 2 22,264 17,188 Chinook salmon 2,548 2,164 0 0 2,548 2,164 Largemouth bass 653 90 28,659 3,616 29,312 3,706 Smallmouth bass 14,091 880 2,311 0 16,402 880 Northern pike 1,214 228 2,200 368 3,414 596 Black crappie 28 24 510 74 538 98 Yellow perch 70 1 3,306 268 3,376 269 Cutthroat Trout 428 0 2 0 430 0 Brown Bullhead
277 257 277 257
Northern pikeminnow 18 0 0 18 0 Bull Trout 4 0 0 4 0 Bluegill
2 2 2 2
Pumpkinseed
288 0 288 0 Total 41,316 20,573 37,557 4,587 78,873 25,160

71
Table 30. Estimates of angling effort (h) on Coeur d’Alene Lake, Idaho, for various years from 1968 to 2009 (Fredericks et al. 1997).
Section Total
Year Northern Middle Southern fishing effort 1967a 73,284 24,647 71,976 169,908 1979b 85,039 86,344 111,454 282,837 1980c 92,944 85,400 69,595 247,939 1985d 192,200
1986e 172,452 1987f 128,699
110,882i 239,581 1995-96g 141,949 43,293 65,111 250,371
2009h 34,382 48,245 12,667 95,294
a April 29 to November 30, 1967. b April 15 to November 10, 1979. c April 27 to November 8, 1980. d April 27 to September 30, 1985, northern section of the lake only. e April 27 to October 30, 1986, northern section of the lake only. f April 27 to September 30, 1987. g July 1, 1995 to June 30, 1996. h January 3, 2009 to January 2, 2010. i Includes section 2 and 3

72
Table 31. Estimates of sport fish harvest on Coeur d’Alene Lake, Idaho, for various years from
1967 to 2009.
Year Kokanee Chinook salmon
Westslope cutthroat
trout
Largemouth bass
Northern pike
Smallmouth bass
Other
1967a 242,207 - 889 35 - 3,015
1979b 578,034 - 595 - - 1,150
1980c 465,302 - - - - -
1985d 119,755 240 - - - - 1986e 164,275 76 - - - -
1987f 238,903 350 - - - 9,980
1991g - - - - 672 - 1993h - - - - 81 - 1995-
96i 93,381 3,313 4 250 523 0 986
2009j 17,186 2,164 0 (428
caught) 90 228 880 25
a April 29 to November 30, 1967. Mallet 1968. b April 15 to November 10, 1979. Rieman and LaBolle 1980. c April 27 to November 8, 1980. Rieman and Ward 1981. d April 27 to September 30, 1985, northern section of the lake only. LaBolle and Horner 1986. e April 27 to October 30, 1986, northern section of the lake only. LaBolle and Horner 1987. f April 27 to September 30, 1987. LaBolle 1988. g March 24 to April 14,1991. Horner and Davis 1995. h March 13 to April 30, 1993. Nelson et al. 1996. i July 1, 1995 to June 30, 1996. Fredericks et al. 1997. j January 3, 2009 to January 2, 2010.

73
Table 32. Comparison of creel survey results from Coeur d’Alene Lake, Idaho by survey year. Results for 2009 do not include the lateral lakes.
Estimate 1967a 1979b 1980c 1987d 1995-96e 2009 Residents 81% 82% Rod hours 131,175 Angler hours 169,908 282,837 247,939 228,331 250,371 95,294 Angler days 49,620 45,080 24,248 Interviewed anglers 1,287 2,611 Total Catch 246,111 41,316 Kokanee Caught 95,606 22,262 Harvest 242,207 578,034 465,302 238,903 93,381 17,186 Mean length (mm) 205f 204f 248 Catch rate (fish/h) 2.04 1.89 1.12 1.48 Chinook salmon Caught 0 0 0 4,803 2,548 Harvest 0 0 0 350 3,313 2,163 Mean length (mm) 800 563 Catch rate (fish/h) 0.03 0.03 0.14 Largemouth bass Caught 1,212 653 Harvest 35 250 90 Mean length (mm) 400 Catch rate (fish/h) 0.4 Smallmouth bass Caught 0 240 14,091 Harvest 0 0 880 Mean length (mm) 319 Catch rate (h/fish) 1.45 Northern pike Caught 0 753 1,214 Harvest 0 523 228 Mean length (mm) 652 Catch rate (h/fish) 0.17 a Mallet 1968. b Rieman and LaBolle 1980. c Rieman and Ward 1981. d LaBolle 1988. e Fredericks et al. 1997. f Lengths of kokanee in May 1979 and May 1980.

74
Section 1
Section 2
Section 1
Section 2
Section 3
Figure 15. Location of 21 midwater trawling transects (top left), and 21 hydroacoustic transects
(top right), in three sections of Coeur d’Alene Lake, Idaho, used to estimate kokanee population abundance in 2009. Lower map shows the location of sections used in Coeur d’Alene creel survey. Note the slight difference in the southern section boundary.

75
Figure 16. Length-frequency distribution of kokanee sampled in Coeur d’Alene Lake while
trawling during 2009.
0
20
40
60
80
100
120
140
20 60 100
140
180
220
260
300
Age 3
Age 0 Age 2
Age 1
Num
ber c
augh
t in
traw
l
Total length (mm)

76
Figure 17. Mean total length of male and female kokanee spawners in Coeur d’Alene Lake,
Idaho, from 1954 to 2008. Years where mean lengths were identical between sexes were a result of averaging male and female lengths together.
200
250
300
350
400
450
1954
1958
1961
1964
1973
1977
1980
1983
1986
1989
1992
1995
1998
2001
2004
2007
Spaw
ner L
engt
h (m
m)
males females

77
Figure 18. Mean annual mortality of a cohort of kokanee from age-0 to age-3 in Coeur d’Alene
Lake and from age-0 to age-4 in Lake Pend Oreille.

78
Figure 19. Stock-recruitment plot for Coeur d’Alene Lake kokanee. Figure was based on age-3
kokanee to age-3 kokanee four years later. Pre-flood data (circles) included data before 1997, post-flood data (squares) was for 1997 to 2008. Diamond is the data point for 2009.
0
1,000,000
2,000,000
3,000,000
0 1,000,000 2,000,000 3,000,000
Stock
Pre-flood Post-flood 2009R
ecru
its

79
Figure 20. Target strength-frequency distribution of all fish within the kokanee layer sampled while conducting hydroacoustic surveys on Coeur d’Alene Lake during 2009.
0
1000
2000
3000
4000
5000
6000
7000
-59.
5
-56.
5
-53.
5
-50.
5
-47.
5
-44.
5
-41.
5
-38.
5
-35.
5
-32.
5
-29.
5
-26.
5
Num
ber o
f tra
ces
Target strength
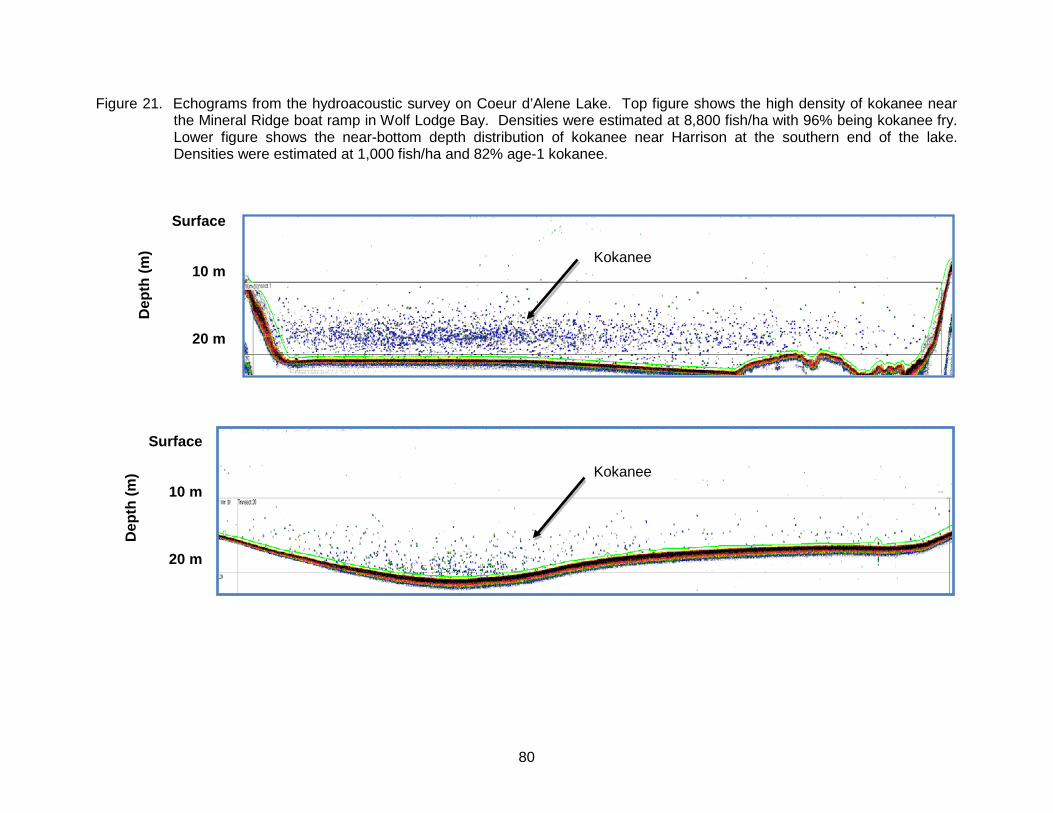
80
Figure 21. Echograms from the hydroacoustic survey on Coeur d’Alene Lake. Top figure shows the high density of kokanee near the Mineral Ridge boat ramp in Wolf Lodge Bay. Densities were estimated at 8,800 fish/ha with 96% being kokanee fry. Lower figure shows the near-bottom depth distribution of kokanee near Harrison at the southern end of the lake. Densities were estimated at 1,000 fish/ha and 82% age-1 kokanee.
Surface
10 m
20 m
Surface
10 m
20 m
Kokanee
Kokanee
Dep
th (m
) D
epth
(m)

81
Figure 22. Correlations between the number of Chinook salmon stocked in Coeur d’Alene Lake
and the numbers of age 3 kokanee two (A) and three years later (B). Data are from 1996 to 2009.
Figure 23. Correlations between the number of Chinook salmon stocked in Coeur d’Alene Lake
and the resulting number of age 3 kokanee as estimated by trawling. Figure A uses the mean of two years of Chinook salmon stocking, and Figure B uses the mean of the number stocked plus half the previous year’s stocking. Data are from 1996 to 2009.
7
B
A B
A
2009
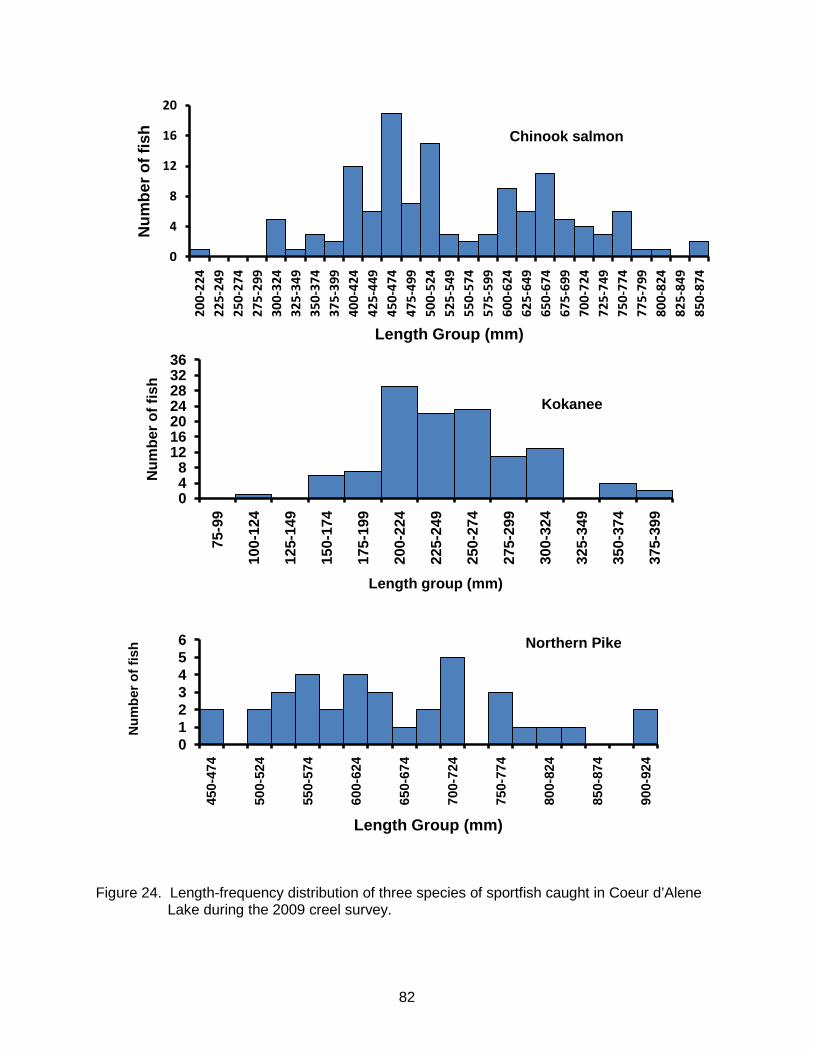
82
Figure 24. Length-frequency distribution of three species of sportfish caught in Coeur d’Alene
Lake during the 2009 creel survey.
0
4
8
12
16
20
200-
224
225-
249
250-
274
275-
299
300-
324
325-
349
350-
374
375-
399
400-
424
425-
449
450-
474
475-
499
500-
524
525-
549
550-
574
575-
599
600-
624
625-
649
650-
674
675-
699
700-
724
725-
749
750-
774
775-
799
800-
824
825-
849
850-
874
Num
ber o
f fis
h
Length Group (mm)
048
12162024283236
75-9
9
100-
124
125-
149
150-
174
175-
199
200-
224
225-
249
250-
274
275-
299
300-
324
325-
349
350-
374
375-
399
Num
ber o
f fis
h
Length group (mm)
0123456
450-
474
500-
524
550-
574
600-
624
650-
674
700-
724
750-
774
800-
824
850-
874
900-
924
Length Group (mm)
Num
ber o
f fis
h
Chinook salmon
Kokanee
Northern Pike

83
2009 PANHANDLE REGION ANNUAL FISHERY MANAGEMENT REPORT LATERAL LAKES BASS INVESTIGATIONS
ABSTRACT
We surveyed largemouth bass populations in the lateral lakes to compare fish density and
angler exploitation with estimates from past decades. We collected 1,041 largemouth bass in Anderson, Blue, Cave, Medicine, Killarney, and Thompson Lakes in May and June, 2009. Of these bass, we tagged and released 626 largemouth bass to determine population size and exploitation. Calculated proportional stock density (PSDs) for largemouth bass ranged from 57 in Blue Lake to 91 in Medicine Lake. Calculated relative stock density (RSD-16) ranged from 22 in Blue Lake to 51 in Anderson Lake, both of which have quality bass restrictions. Population estimates for largemouth bass ranged from 363 in Thompson Lake to 1,180 in Blue Lake, and density ranged from 1.6 fish/ha in Killarney Lake to 8.4 fish/ha in Blue Lake. Mean relative weights of largemouth bass collected ranged from 98 in Thompson Lake to 109 in Medicine Lake. Pooling the entire sample, total lengths of all the bass sampled ranged from 110 mm to 572 mm, PSD was 72, and RSD-16 was 32. As of December 31, 2009, 63 tags were reported by anglers, of which, 68% were released. The majority (73%) of the tags reported were captured between May and June. Mean exploitation of largemouth bass in the lateral system in 2009 was estimated at 10.5%. Overall, the populations of largemouth bass in the lateral lakes in 2009 were well above the generally accepted stock density index ranges, indicating balanced largemouth bass populations. Density and size structure of largemouth bass in the lateral lakes has remained relatively unchanged over the past 11 years. Similar densities in Cave, Medicine, and Killarney lakes were reported in 1998. This was similar to the 7.5% exploitation seen in 1998, and considerably lower than the 57% exploitation seen in 1982. Authors: Ryan Hardy Regional Fishery Biologist Mark Liter Regional Fishery Biologist Jim Fredericks Regional Fishery Manager

84
INTRODUCTION
Waterbodies in the northwestern part of the United States have historically been known for their salmonid fisheries with less interest in warm water species (Wydoski and Bennett 1981). It wasn’t until the early 1980’s when fishing for largemouth bass and smallmouth bass had become popular in the northwest. Over the past two decades, there has been an increasing interest by the angling public in these warmwater fisheries of the Idaho Panhandle. This trend is evident from the formation of competitive fishing clubs and an increasing presence of bass tournaments throughout the region (Rieman 1987; Willard et al. 2007).
Historically, bass management embraced the theory that exploitation had little serious
effect on populations and their fisheries (Bennett 1974). This theory was based on the lack of relationship between recruitment and spawning stock (Johnson and MacCrimmon 1967). Therefore, managers believed that heavy exploitation would not limit the ability of a population to replace itself (Bennett 1974). Others have since then determined that increasing exploitation can dramatically alter population structure, reducing yield and the number of large fish available for harvest (Paragamian 1984; Rieman 1987). Although increased mortality of largemouth bass through exploitation will not cause the population to collapse, it will likely result in fewer large fish in the population (Paragamian 1984). Rieman (1987) concluded that exploitation rates of 15-30% provide quality fisheries whereas rates > 40% would result in overexploitation and the cropping off of larger sized fish.
The eight lateral lakes or “chain lakes”, are adjacent and connected to Coeur d’ Alene
Lake via the Coeur d’ Alene River, are well known for their largemouth bass fisheries, which take advantage of the warm and relatively shallow waters. Two lakes (Blue and Anderson lakes) had quality bass regulations implemented in the mid 1980s to provide a higher quality size structure. The lateral lakes and their largemouth bass populations have been the focus of several studies (Bowles 1985; Rieman 1987; and Fredericks et al. 2002), which have evaluated exploitation, annual mortality, and size structure. However, none of these studies have evaluated the effect of quality size restrictions on Blue and Anderson Lakes. In addition, increased tournament fishing, changing demographics of bass fisherman, and the elimination of the minimum size restriction on largemouth bass in 2008, warranted a closer look at the dynamics of this fishery.
OBJECTIVES
1. Evaluate size structure, density, and total population size of largemouth bass populations in Cave, Medicine, Blue, Anderson, Thompson, and Killarney Lakes and compare with past studies.
2. Estimate exploitation of largemouth bass in these lakes and compare with past studies.
3. Evaluate the effectiveness of quality size regulations for largemouth bass on Anderson and Blue Lakes.
STUDY SITES
The lateral lakes are a series of eight low-lying, shallow lakes approximately 24 km southeast of Coeur d’Alene, Idaho (Figure 25). The lakes are connected to the Coeur d’Alene River and, like Coeur d’Alene Lake itself, are maintained at a greater depth through the summer by Post Falls Dam. Access to the lakes varies. Most have improved boat ramps, cement

85
outhouses and camping areas, while a few are accessible only by boat. Surface area of the lakes sampled ranged from 70 ha (Thompson Lake) to 339 ha (Cave Lake).
METHODS
To evaluate the largemouth bass populations in the lateral lakes and compare fish density and angler exploitation with surveys from past decades, we collected largemouth bass and smallmouth bass in six of the eight lakes in 2009. Bass were initially collected and marked using boat electrofishing on Anderson, Blue, Cave, Medicine, Killarney, and Thompson lakes from May 3 - 5. To estimate the populations, a second “recapture” effort was conducted approximately 10 days later (May 12 - 14). This allowed the fish to redistribute evenly throughout the lakes. All bass ≥ 305 mm were marked with colored Floy tags inserted below the dorsal fin. Floy tags were labeled with a specific ID number and telephone reporting number for anglers to call and report information about the fish captured. IDFG operates this toll free automated hotline and website through which anglers can report tags. Additionally IDFG distributes posters and stickers to license vendors, regional offices and sporting goods outlets that publicize the tagging efforts and explain how to report tags and what the information is used for.
To estimate population size, we utilized Chapman’s modification of the Petersen Method
(Ricker 1975; Krebs 1999):
N = ([M+1]*[C+1] / [R+1]) – 1
Where: N = population estimate M = number of marked fish C = number of fish captured during the recapture sample R = number of recapture marks in the recapture sample
Confidence intervals (95%) were calculated based on the Poisson distribution was obtained following Ricker (1975) and Seber (1982).
Additionally, we calculated bass relative weights (Wr), which compares weights of
largemouth bass found in the lateral lakes to that of a standard developed from multiple populations. Relative weight was calculated using the formula:
Wr = (W/Ws) x 100,
where W is the actual fish weight, and Ws is a standard weight for fish of the same length. Minimum total lengths to calculate Ws were 150 mm for largemouth bass as specified by (Wege and Anderson 1978). Statistical differences in relative weights were tested by using 1-way ANOVAs (GLM, general linear models; SYSTAT 7.0 1997). We used a p-value ≤ 0.10 to denote when a significant difference in density occurred between stream reaches (see Anderson et al. 2000 for justification). Once a difference was detected, pairwise comparisons were made to determine which specific lakes were different.
To determine angler exploitation, the number of fish harvested by anglers (determined by tags returns) was divided by the number of fish we tagged. We assumed a 36% reporting rate, which is typical of largemouth bass non- reward tags (Meyer et al. 2009), and adjusted the return rate accordingly to provide an exploitation estimate. Tag loss was assumed to be 5.3% based on work conducted on largemouth bass by Meyer et al (2009). The unadjusted exploitation rate was calculated according to Ricker (1975) as the number of fish with tags caught by anglers that were harvested, divided by the total number of fish tagged and released into the system.
86
PSD and RSD, which are numerical descriptors of length-frequency data (Anderson 1976), were calculated for bass sampled. PSD is calculated as number of fish ≥ minimum quality length/ number of fish ≥ minimum stock length. In our case, quality length (% related to world record size; Anderson 1980) was set at 300 mm and stock length (approx. size recruited to the sampling gear; Gabelhouse 1984 ) was set at 200 mm. RSD is calculated similarly only substituting quality length in the aforementioned equation for a specified length to be examined. In our case, we defined this length as 406 mm, since it matches up with the quality regulation on Anderson and Blue. This is denoted as RSD-16.
RESULTS
Sampling of Killarney Lake in May resulted in too few largemouth bass to do population statistics, so we repeated the effort on June 11, resulting in adequate numbers of bass. During our total sampling events, we sampled 1,041 largemouth bass, 34 smallmouth, and 27 northern pike. Of the bass we sampled, we tagged 626 largemouth bass and 10 smallmouth bass with non-reward Floy tags.
Population statistics were only calculated for largemouth bass since too few smallmouth
bass were captured during sampling. Calculated PSDs for largemouth bass ranged from 57 in Blue Lake to 91 in Medicine Lake (Table 33). Calculated RSD-16 ranged from 22 in Blue Lake to 51 in Anderson Lake, both of which have quality bass restrictions. Population estimates for largemouth bass ranged from 363 in Thompson Lake to 1,180 in Blue Lake. Taking into account size of each waterbody, density of largemouth bass ranged from 1.6 fish/ha in Killarney Lake to 8.4 fish/ha in Blue Lake. Mean relative weights collected ranged from 98 in Thompson Lake to 109 in Medicine Lake (Table 34). Cave, Medicine, and Anderson were significantly higher in relative weight than Blue, Thompson, and Killarney lakes (Table 34 and 35). Reflected somewhat in the PSD and RSDs, length frequencies of bass varied between lakes sampled as well (Figures 26 - 31). Examining all of these lakes as one population, total lengths of all the bass sampled ranged from 110 mm to 572 mm, PSD was 72, and RSD-16 was 32 (Figure 32).
Comparison of mean total length in lakes with no minimum size (general regulations;
Cave, Killarney, Medicine, and Thompson lakes; 361.4 mm) to those with quality regulations (Anderson and Blue lakes; 362.2 mm) showed no significant difference (p = 0.44).
As of December 31, 2009, 63 tags were reported by anglers, of which, 68% were
released. The majority (73%) of the tags reported were captured between May and June. Exploitation for the lateral lakes was relatively low and ranged from no harvest in Anderson Lake to 21% in Thompson Lake (Table 33). Only 3% (n=2) of the tags returned were from non-resident anglers. According to tag returns, several fish made movements (or were transported by anglers) between lakes during May and June (Table 36). Distance of movements ranged from approximately 500 m from Cave to Medicine Lake to 7.3 rkm from Blue to Anderson Lake.
Comparisons of 2009 population estimates with those made in 1998 show similar size and
density estimates for Killarney Lake and about a 19% reduction in size and density in Cave and Medicine (Table 33). Size and density estimates from 1981 and 1982 are not directly comparable since estimates were calculated for fish >150 mm, whereas 1998 and 2009 were calculated for fish > 300 mm. Mean exploitation comparisons show a slight and insignificant increase in Cave, Medicine, and Killarney from 7% in 1998 to 10.5% in 2009. However, 2009 estimates show notable reduction from what was seen in only Thompson and Cave in the early 1980s of 57%. Exploitation estimates in Medicine Lake for 2009 increased approximately 10% from estimates in 1998 (Table 33). Comparisons with PSDs and RSDs from 1998 show a 2 fold increase in PSD and 4-6 fold increase in RSD in Cave and Medicine in the 2009 sample.
87
DISCUSSION The size structure of largemouth bass in the lateral lakes in 2009 was well above the
generally accepted stock density index ranges (Gabelhouse 1984), that indicate balanced populations. The density and size structure of largemouth bass in the lateral lakes have remained relatively unchanged over the past 11 years. Fredericks et al. (2002) reported similar densities in Cave, Medicine, and Killarney lakes in 1998, and showed that exploitation was generally low at 7.5%. Similarly, based on our tagging assessment, anglers did not overharvest largemouth bass in the lateral lake system in 2009. This reduction in exploitation from the early 1980s is not unexpected given the change in regulations and the increase in catch-and-release oriented anglers. One notable difference in the 2009 samples as compared to 1998, however, is the increased proportion (4-6 fold) of fish > 406 mm in Cave and Medicine lakes. As reflected in our two temporally separated samples in Killarney Lake, it is very possible that the 1998 sample of Cave and Medicine lakes were performed prior to these fish moving into shallow habitats to spawn.
In 2009, those lakes without quality regulations were similar to each other in largemouth
bass size structure and densities. We may, however, have underestimated the densities in lakes such as Thompson and Killarney because much of the shallow flooded areas were not accessible to our electrofishing boat. Although mean length was not statistically different, Anderson and Blue lakes, which have quality regulations in place, show somewhat different size structure and density than other lakes sampled. Blue Lake had a high proportion of largemouth bass in smaller size classes between 200 and 305 mm represented in the sample. In Anderson Lake, the proportion of fish greater than 406 mm was twice as high as other lakes sampled. The quality regulations in both lakes appear to be having a positive effect; however, the lack of data on additional confounding factors may lend further investigation. On a final note, we originally considered that age class analysis of these two lakes may be useful in determining if survival in these quality regulation lakes is better than in those lakes with general regulations in place. Accurate estimates of survival based on age-structure analysis, however, may not be possible since recruitment in the lateral lakes has been shown to be highly variable (Fredericks et al. 2002).
Based on our tag returns, several fish made movements between lakes during May and
June. As acknowledged by Fredericks et al. 2002, movement between Cave and Medicine lakes is to be expected since they are connected via a year round channel. It is possible that movement between Anderson, Thompson, and Blue lakes was via live-well transport; however, if this was significant, at least some of them should have been reported multiple occasions in the tag database. The Coeur d’ Alene River, a common connection between the lateral lakes, allows largemouth bass to move unimpeded throughout the system in search of food or spawning opportunity. Regardless of how movements between lakes are occurring, it may be more appropriate to look at the lateral lakes as a single system, rather than multiple closed populations. One thing to consider, however, is that most largemouth bass have a relatively small home range (< 20 ha; Ridgway 2002), which suggest a portion of those fish may not intermix. Anderson and Blue lakes could be very beneficial to the lateral lakes as a whole by providing larger fish to other lakes, such as Thompson Lake, that experience higher harvest mortality. Since movement within and between lakes are presumably occurring continuously, it is difficult to put stock into a single sampling event. It is suggested that comparison sampling should be standardized not only time but also by water temperature as well. Although more time consuming, it would be beneficial to analyze lake data from at least two sampling events within a season.

88
MANAGEMENT RECOMMENDATIONS
1. Maintain current quality bass regulations on Blue and Anderson lakes. 2. Continue to monitor exploitation rates periodically in the future to determine if further
protection is needed.

89
Table 33. Proportional Stock Density (PSD), Relative Stock Density at 16 inches (RSD-16), Population estimates, and exploitation of largemouth bass in six lakes sampled in May, 2009. Comparisons with lakes sampled in 1981, 1982, and 1998 are also given.
Population Lower 95% Upper 95% Density Annual Largemouth Bass
Sample Year Lake PSD RSD-16 Estimate Confidnece Limit Confidnece Limit fish/ha Exploitation Regulation2009 Anderson 82 51 543 341 1,104 2.5 0.0 2 fish; none under 16"
Blue 57 22 1185 484 2,966 8.4 4.0 2 fish; none under 16"
Cave 79 23 898a 558 1,531 2.0a 11.7 6 fish; any sizeMedicine 91 35 17.3 6 fish; any sizeKillarney 76 33 424 211 930 2.1 2.6 6 fish; any sizeThompson 71 27 440 227 773 1.9 21.0 6 fish; any size
1998b Cave 45 4 736 224 1,248 2.6 13% 6 fish; none under 12"Medicine 56 9 490 34 946 5.3 7% 6 fish; none under 12"Killarney 89 67 538 118 958 2.6 0 6 fish; none under 12"
1982c Thompson 4200d 21d 61% 10 fish; any size; only 3 > 17"
1981c Medicine 2200d 23d 66% 10 fish; any size; only 3 > 17"
Thompson 3700d 18d 45% 10 fish; any size; only 3 > 17"
a: Estimates were combined due to low number of recaps in Medicine. b: Data from Fredericks et al. (2002). c: Data from Reiman (1987). d: Population estimates and densities were determined for fish 150mm and greater.
Table 34. Relative weight (Wr) for largemouth bass sampled in six lateral lakes May-June, 2009.
Wr
Lake Mean Min MaxAnderson 105.4 80.5 130.3Blue 98.5 81.4 131.5Cave 105.9 82.4 135.2Medicine 109.1 89.8 127.3Killarney 101.4 81.9 126.3Thompson 97.9 82.6 132.6

90
Table 35. Tukey’s pairwise comparison matrix showing probabilities of relative weights between
the six lakes sampled in the Idaho Panhandle during 2009. Shaded cells indicate which lakes were significantly different (p ≤ 0.10) in largemouth bass relative weights.
Thompson Medicine Kilarney Cave Blue Anderson
Thompson 1Medicine 0.000 1Kilarney 0.070 0.001 1Cave 0.000 0.491 0.003 1Blue 0.997 0.000 0.111 0.000 1Anderson 0.000 0.425 0.082 0.999 0.00 1
Table 36. Tagged fish movement between lateral lakes sampled. Movements took place
between May and June, 2009. Distance units: m = meters; rkm = river kilometer.
Tagged Recaptured # of FishApproximate
Disatance Cave Medicine 1 500 m Medicine Cave 3 500 m Anderson Thompson 1 4 rkm Blue Anderson 1 7.3 rkm
Lake

91
Figure 25. Locations of the Lateral Lakes in the Idaho Panhandle.

92
Figure 26. Length frequency distribution of largemouth bass collected in Cave Lake, Idaho in May, 2009.
Figure 27. Length frequency distribution of largemouth bass collected in Medicine Lake, Idaho in May, 2009.
0
2
4
6
8
10
12
14
16
18
20
22
24
26
110-119
250-259
270-279
290-299
310-319
330-339
350-359
370-379
390-399
410-419
430-439
450-459
470-479
490-499
510-519
530-539
550-559
Num
ber o
f Fis
h
Length Groups (mm)
Cave Lake RSD (16)=23PSD=79
02468
101214161820222426
240-249
260-269
280-289
300-309
320-329
340-349
360-369
390-399
410-419
440-449
460-469
480-489
500-509
520-529
540-549
560-569
Num
ber o
f Fis
h
Length Groups (mm)
PSD=91RSD (16)=35Medicine Lake
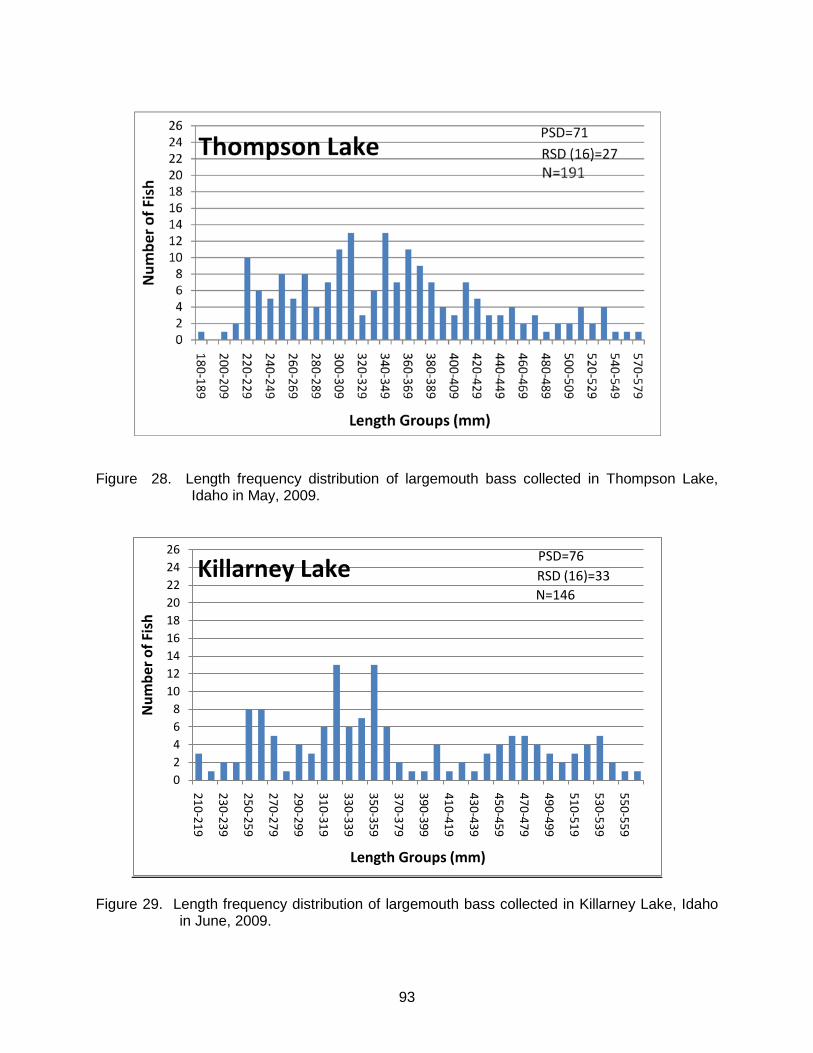
93
Figure 28. Length frequency distribution of largemouth bass collected in Thompson Lake, Idaho in May, 2009.
Figure 29. Length frequency distribution of largemouth bass collected in Killarney Lake, Idaho in June, 2009.
02468
101214161820222426
210-219
230-239
250-259
270-279
290-299
310-319
330-339
350-359
370-379
390-399
410-419
430-439
450-459
470-479
490-499
510-519
530-539
550-559
Num
ber o
f Fis
h
Length Groups (mm)
PSD=76RSD (16)=33N=146
Killarney Lake

94
Figure 30. Length frequency distribution of largemouth bass collected in Anderson Lake, Idaho in May, 2009. Dashed vertical line denotes quality bass regulation of no harvest below 406 mm (16 inches).
Figure 31. Length frequency distribution of largemouth bass collected in Blue Lake, Idaho in May, 2009. Dashed vertical line denotes quality bass regulation of no harvest below 406 mm (16 inches).
02468
101214161820222426
180-189
200-209
220-229
240-249
260-269
280-289
300-309
320-329
340-349
360-369
380-389
400-409
420-429
440-449
460-469
480-489
500-509
520-529
540-549
560-569
Num
ber o
f Fis
h
Length Groups (mm)
N=239
PSD=57RSD (16)=22Blue Lake

95
Figure 32. Length frequency distribution of largemouth bass collected in six lateral lakes (Blue,
Anderson, Medicine, Cave, Killarney, and Thompson Lakes, Idaho in May and June, 2009.
0
10
20
30
40
50
60
110-119
130-139
150-159
170-179
190-199
210-219
230-239
250-259
270-279
290-299
310-319
330-339
350-359
370-379
390-399
410-419
430-439
450-459
470-479
490-499
510-519
530-539
550-559
570-579
Num
ber o
f Fis
h
Length Groups (mm)
RSD (16) = 32PSD = 72
N=1041

96
2009 PANHANDLE REGION ANNUAL FISHERY MANAGEMENT REPORT SPIRIT LAKE KOKANEE POPULATION INVESTIGATION
ABSTRACT We monitored the kokanee population in Spirit Lake on July 24, 2009 using a midwater trawl. Data collected, estimated the lake contained 260,700 fry (446/ha), 182,600 age-1 kokanee (312/ha), 75,900 age-2 kokanee (130/ha) and 30,000 age-3 kokanee (51/ha) for a total population estimate of 549,200 kokanee. The standing stock of kokanee was estimated at 26 kg/ha which would yield a potential egg deposition at 6.5 million eggs. The winter of 2008-09 provided good ice cover for ice fishermen and they contributed to the 84% mortality of kokanee from age-2 to age-3. Sufficient mature adults remained for starting the next generation of kokanee. Monitoring of the kokanee population using a split beam echosounder was conducted on July 28. We estimated the lake contained 567,500 (970/ha), 345,100 (590/ha), 142,400 (243/ha), and 60,200 (103/ha) kokanee of ages 0 - 3, respectively. Hydroacoustic estimates were about double the trawl estimates – which are likely due to the increased efficiency of the gear (no net avoidance, ability to sample closer to the bottom and in shallow bays and near-shore areas). We also estimated the lake contained a standing stock of 49 kg/ha with a production rate of 55 kg/ha/year. Potential egg deposition was estimated at 12.4 million eggs. Survival from last year’s eggs to this year’s fry was estimated at 5.6%. Significant numbers of the early spawning strain of kokanee were seen in the trawl catch, based on the dark red color of their flesh. Early spawners were larger than late spawners within the same cohort of fish and matured at age-2 instead of age-3. We counted early spawners in Brickle Creek during September 2009. Counts were 186 fish in the lower 2.0 km of the creek on September 21, 136 on September 26, and 0 on September 30. Temperature and oxygen profiles were recorded under the ice cover on February 3, 2009. Temperature ranged from 1.0 oC at the surface to 3.2 oC at 14.6 m deep. Oxygen ranged from 14.98 mg/l at the surface to 8.25 mg/l at 14.6 m deep. Thus, the ice cover during the winter did not appear to cause problems with dissolved oxygen. Authors: Melo Maiolie Regional Fishery Biologist Jim Fredericks Regional Fishery Manager

97
INTRODUCTION
Idaho Department of Fish and Game transplanted kokanee from Lake Pend Oreille to Spirit Lake in the 1930’s and 1940’s. These fish originated from Lake Whatcom, Washington, and are “late spawners” that typically spawn during November through early January on shoreline gravel rather than in tributary streams (Winans et al 1996). In addition, early spawning strains of kokanee were stocked in 2000, 2001, 2004, 2007 and 2008 to insure adequate recruitment of kokanee fry. Spirit Lake had the highest yield of kokanee (12.7 kg/ha) of any of the 28 kokanee fisheries in northern Idaho, Washington, Oregon, Montana, Utah, Colorado, and British Columbia listed by Rieman and Meyers (1990). Concerns were raised by anglers during the winter of 2007-08 and the spring of 2008 that the kokanee fishery had declined because of their limited catch. Monitoring during July 2008 showed good numbers of kokanee with adult abundance at 35 fish/ha. Spirit Lake had a good, prolonged ice cover during the winter of 2008-09. Groups of ice fishermen were having limit catches (15 fish/person/day) on most mornings. Summer anglers during 2009 also appeared to be doing well, although no creel data was available. We monitored kokanee abundance during July 2009 to see if kokanee were being overharvested and determine the appropriateness of the 15 fish limit.
OBJECTIVE
Maintain a high yield kokanee fishery in Spirit Lake.
STUDY SITE
Spirit Lake is located near the town of Spirit Lake in the northern panhandle of Idaho. It has a surface area of 598 ha, with 585 ha of kokanee habitat. Maximum depth of the lake is about 27 m. For northern Idaho, Spirit Lake is a fairly rich body of water. Chlorophyll ‘a’ was measured at 5.3 µg/l (Soltero and Hall 1984), total phosphorus was 18 µg/l, Secchi transparency was 3.9 m, conductance was 240 µmhos/cm2, and the morphoedaphic index was 22.0 (Rieman and Myers 1990). This lake also was known to carry the highest biomass of kokanee in northern Idaho at 54.5 kg/ha (Rieman and Myers 1991). Kokanee in Spirit Lake are mostly naturally reproducing. However, during the last decade, early spawning kokanee were stocked in 2000 (200,000 fry), 2001 (198,000 fingerlings), 2004 (200,000 fry), 2007 (163,000 fry) and 2008 (169,000 fry). No additional kokanee were stocked in Spirit Lake in 2009.
METHODS
Trawling
We used a midwater trawl, as described by Bowler et al. (1979), Rieman and Meyers (1990), and Rieman (1992), to estimate the kokanee populations in Spirit Lake. Five trawl hauls were made in Spirit Lake on July 24, 2009. Trawl transects were selected using a systematic sample design and were in similar locations as those used in previous years (Figure 33). Kokanee were measured and weighed, and scales were collected from representative length groups for age analysis. The average number of eggs produced per female kokanee was calculated using the regression of kokanee length to fecundity found in Rieman (1992). Ninety

98
percent confidence intervals (C.I.) were placed on the arithmetic mean density estimates using a Student’s t distribution. We calculated a separate abundance estimate for early spawning kokanee based on the color of their flesh. Using flesh color to differential stocks is an unproven technique that needs to be validated; however, the lake contained some kokanee that had dark red flesh when compared to most of the kokanee from the lake. Evidence that these fish were early spawning kokanee included that they were the largest fish within a cohort and that they matured mostly at age-2. Kokanee fry did not appear to have pronounced color differences upon examination. No early spawning kokanee were stocked in 2009 so they may have been rare or absent in the trawl catch.
Hydroacoustics
A hydroacoustic survey was conducted on Spirit Lake on July 28, 2009. This was the fourth time that a hydroacoustic survey was conducted on this water body. We used a Simrad EK 60 scientific echosounder with a 6.5o transducer. The transducer was mounted on a pole on the port side of the boat and pointed straight down. The boat traveled at 5.1 km/hr while surveying the lake. Ten evenly spaced transects were established perpendicular to the long axis of the lake, with the starting point of the first transect chosen at random (Figure 1). This was a change in the survey design from the seven transects arranged in a zigzag pattern that were used in 2004, 2007, and 2008. The design used in 2009 was more labor intensive, but should give better statistical confidence and eliminate concerns over autocorrelation at the beginning and end of transects (Simmonds and MacLennan, 2005). Kokanee densities were estimated by echo integration. We used EchoView software version 4.70 to calculate nautical area scattering coefficients (NASC) and mean target strengths (in situ). NASC values were calculated by drawing a box around the kokanee layer on the volume backscattering (Sv) file set and having the software integrate backscattering in this region on echoes with a minimum target strength threshold of -66 dB and a maximum threshold of -20 dB. Age 0 kokanee densities were calculated directly from the echograms by including all targets between -60.0 dB and -48.0 dB. To calculate the density of age 1 to 3 kokanee, we multiplied the hydroacoustic density estimate of targets between -47.9 dB and -33.0 dB by the percentage of kokanee in each age class in the trawl catch. We calculated the geometric mean density estimates (log x+1) for each age class and used the log transformed data for the population estimate and confidence interval.
We calculated the biomass, production, and mortality (by weight) of the kokanee population in Spirit Lake based on the 2008 and 2009 annual hydroacoustic estimates split into age classes based on trawl catch. Biomass was the total weight of kokanee within the lake at the time of our population estimate. It was calculated by multiplying the population estimate of each kokanee year class by the mean weight of kokanee in that year class as determined in the trawl catch. The year class weights were summed to determine the lake’s overall kokanee biomass and divided by the area of kokanee habitat to determine standing stock.
Kokanee production was defined as the weight of flesh grown by the kokanee population
regardless of whether the fish was alive or dead at the end of the year (Ricker 1975). We used the Summation Method developed by Newman and Martin (1983) and presented in Hayes et al. (2007), where:
^P = N Δ w
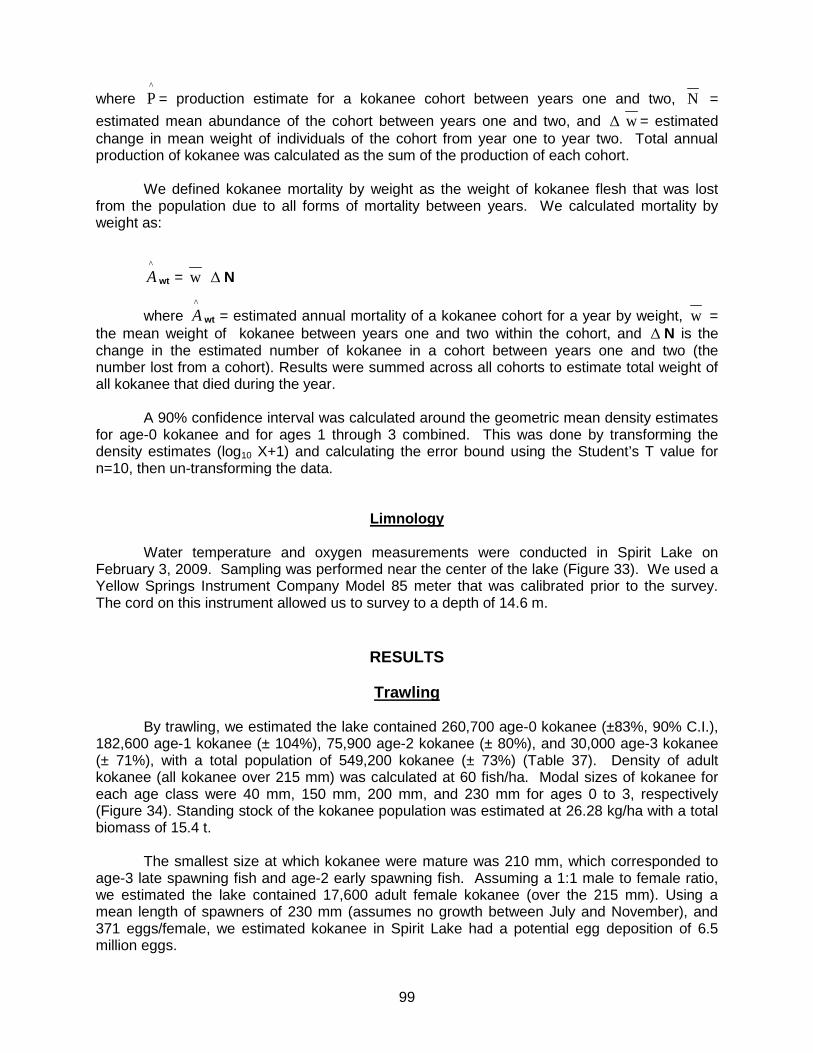
99
where ^P = production estimate for a kokanee cohort between years one and two, N =
estimated mean abundance of the cohort between years one and two, and Δ w = estimated change in mean weight of individuals of the cohort from year one to year two. Total annual production of kokanee was calculated as the sum of the production of each cohort.
We defined kokanee mortality by weight as the weight of kokanee flesh that was lost from the population due to all forms of mortality between years. We calculated mortality by weight as:
^A wt = w Δ N
where ^A wt = estimated annual mortality of a kokanee cohort for a year by weight, w =
the mean weight of kokanee between years one and two within the cohort, and Δ N is the change in the estimated number of kokanee in a cohort between years one and two (the number lost from a cohort). Results were summed across all cohorts to estimate total weight of all kokanee that died during the year.
A 90% confidence interval was calculated around the geometric mean density estimates
for age-0 kokanee and for ages 1 through 3 combined. This was done by transforming the density estimates (log10 X+1) and calculating the error bound using the Student’s T value for n=10, then un-transforming the data.
Limnology
Water temperature and oxygen measurements were conducted in Spirit Lake on February 3, 2009. Sampling was performed near the center of the lake (Figure 33). We used a Yellow Springs Instrument Company Model 85 meter that was calibrated prior to the survey. The cord on this instrument allowed us to survey to a depth of 14.6 m.
RESULTS
Trawling By trawling, we estimated the lake contained 260,700 age-0 kokanee (±83%, 90% C.I.), 182,600 age-1 kokanee (± 104%), 75,900 age-2 kokanee (± 80%), and 30,000 age-3 kokanee (± 71%), with a total population of 549,200 kokanee (± 73%) (Table 37). Density of adult kokanee (all kokanee over 215 mm) was calculated at 60 fish/ha. Modal sizes of kokanee for each age class were 40 mm, 150 mm, 200 mm, and 230 mm for ages 0 to 3, respectively (Figure 34). Standing stock of the kokanee population was estimated at 26.28 kg/ha with a total biomass of 15.4 t. The smallest size at which kokanee were mature was 210 mm, which corresponded to age-3 late spawning fish and age-2 early spawning fish. Assuming a 1:1 male to female ratio, we estimated the lake contained 17,600 adult female kokanee (over the 215 mm). Using a mean length of spawners of 230 mm (assumes no growth between July and November), and 371 eggs/female, we estimated kokanee in Spirit Lake had a potential egg deposition of 6.5 million eggs.

100
Separate population estimates were made for kokanee believed to be of the early spawning strain. We estimated the lake contained 16,400 (± 135%, 90% C.I.) age-1 kokanee and 6,800 (± 131%) age-2 kokanee. No estimates were made for early spawning kokanee fry. The biomass of both age classes was estimated at 1.4 t with a standing stock of 2.54 kg/ha. Survival estimates from stocking in 2008 to age-1 kokanee in 2009 was 10% and stocking in 2007 to age 2 kokanee in 2009 was 4%.
Hydroacoustics
By hydroacoustics, we estimated the lake contained 567,500 age-0 kokanee (90% C.I. +33% to -25%). We calculated the lake contained 547,700 age 1 through 3 kokanee (90% C.I. from +24% to -19%). We then estimated the lake contained 334,100 age-1 kokanee, 142,400 age-2 kokanee, and 60,200 age-3 kokanee based on the percentage of each age class in the trawl catch (Table 38). Density of age-3 kokanee was calculated at 103 kokanee/ha.
Two size groups of kokanee were noted based on target strengths, which corresponded
to fry and all other age classes (Figure 35). Based on this distribution, and the size break between fry and age-1 kokanee in the trawl catch, we divided fry from older age classes of kokanee at -48.0 dB. The modal length of fry was -52 dB or about 40 mm (Love (1971). This agreed with the modal size of fry in the trawl catch, which was also 40 mm.
Kokanee production was estimated at 32 t (55.0 kg/ha/yr) for the lake. Biomass of
kokanee was 29 t, standing stock was 49 kg/ha, and mortality by weight was 29 t (49 kg/ha/yr). Based on these numbers, a production to biomass ratio was 1.1:1. Mean NASC estimate for the lake was 448 m2/nautical mile2 (Figure 37), with a mean target strength of -43.0dB.
Spawner Counts
We counted early spawners in Brickle Creek during September 2009. Counts were 186 fish in the lower 2.0 km of the creek on September 21, 136 on September 26, and 0 on September 30. Three beaver dams appeared to slow their upstream passage and were temporarily breached for fish passage during each spawner count.
Limnology
During our February 2, 2009 survey, we found that oxygen under the ice cover in Spirit Lake ranged from 14.98 mg/l at the surface to 8.25 mg/l at the 14.6 m depth (Table 39). Temperature ranged from 1.0 oC at the surface to 3.2 oC at the 14.6 m depth (Table 39).
DISCUSSION
Kokanee Abundance
Kokanee fisheries seem to optimize at 30 to 50 adults/ha based on trawl catch (Rieman and Maiolie 1995). Within this range, kokanee density and size-dependant catchability tend to maximize the angling effort, catch rate, and yield. Using trawling during 2009, we estimated Spirit Lake contained 51 age-3 kokanee/ha (± 71%) (60 fish/ha if adult early spawning kokanee of age-2 are included). This would indicate kokanee densities were very near the desired range. The good ice fishery and summer fishery would also indicate the kokanee densities were within an acceptable range.

101
Hydroacoustic results indicated a somewhat different trend than trawling results. By hydroacoustics, adult kokanee densities were almost identical to last year at 103 fish/ha (114 fish/ha if adult early spawning kokanee of age-2 are included) (Table 38). This is in contrast to the trawl data that indicated adult kokanee had dropped from 96 to 51 fish/ha (Table 37). Considering the larger sample size of the hydroacoustics, the larger volume sampled on each transect, and the tighter confidence interval of the results, it would be reasonable to believe the more stable trend of the hydroacoustic data and be less worried about the decline in adult kokanee abundance seen in the trawl catch. Kokanee regulations were reduced from 25 fish to 15 fish in 2000. This seemed to have the desired effect as kokanee numbers rebounded by the next population estimate in 2005 (Table 37). During the winter of 2008-09 and the summer of 2009, Spirit Lake had a very popular sport fishery. Kokanee mortality from age-2 to age-3 was 84% based on trawling and 70% based on hydroacoustics. This high mortality was likely due to increased angler harvest. In this case the reduced creel limit should have helped prevent overharvest, while still allowing a very popular fishery. Therefore the 15 kokanee limit maybe about right for this lake. Both trawling and hydroacoustics indicated a weaker year class of age-2 kokanee. Age- 2 kokanee were mostly 190 to 200 mm in total length, which was about 10 mm larger than last year, but still smaller than the 210 to 240 mm lengths measured between 1981 and 1991 (Rieman and Meyers 1990, Rieman 1992). These fish will be the bulk of the fishery in 2010. Based on size and abundance of age-2 kokanee, we would expect to have a good fishery again in 2010. Kokanee fry abundance remained high in Spirit Lake at over a half million fry (970 fry/ha) based on hydroacoustics (Table 38). Last year we recommended supplemental stocking be considered when two conditions were met. First, when fry abundance drops below 500 fry/ha as measured by hydroacoustics (at a conservatively high mortality rate of 60%, 500 fry/ha would yield an adult population of 32 age-3 kokanee/ha). Secondly, when the lake’s standing stock is less than about 30 kg/ha (by hydroacoustics), giving the additional kokanee room to grow without impacting other age classes. Neither of these condition occurred in 2009. Therefore, no supplemental stocking of kokanee appeared to be needed. The stocking of early spawning strain of kokanee fry was successful in that it added 6,800 fish to the adult population. Survival rates from stocking to age-1 (10%) and age-2 (4%) were similar to survival rates of hatchery kokanee stocked into Lake Pend Oreille in the late 1980’s that were considered to meet the project’s goals (Bowles et al. 1989). We do not know, however, whether this stocking contributed to an increase in kokanee abundance or whether they replaced a similar amount of natural production. The establishment of a naturally reproducing run of early spawning kokanee could be beneficial to the lake. A second source for recruitment may be helpful should the late spawning kokanee have poor egg survival in shoreline spawning areas. The redder flesh color is also welcomed by some anglers. Lastly, we suspect that early spawning kokanee may have a higher vulnerability to angling. An admittedly cursory look at anglers catch at times showed a higher percentage of early spawning kokanee than were seen in the trawl catch. Enhancing the spawning run up Brickle Creek would require the breaching of three small beaver dams during the September spawning run.

102
Kokanee Production Kokanee production for Spirit Lake was estimated at 55 kg/ha/yr between 2008 and
2009. For comparison, this is about 5 to 7 times the kokanee production of Lake Pend Oreille (8 to 11 kg/ha/yr between 1995 and 2007, agency files). Spirit Lake therefore remained a very productive lake for growing kokanee.
Mortality by weight was estimated at 49 kg/ha/yr. This was 6 t less than production, and
so explains the increase in biomass from 24.4 t in 2008 to 28.6 t in 2009. NASC (nautical area scattering coefficients) values are a sum of the areal backscattering
of fish in the analyzed kokanee layer and should correlate to fish biomass especially if sizes of fish are fairly constant (Simmonds and MacLennan 2005). Figure 37 compares NASC values for kokanee surveys for several lakes in Idaho. These data suggested Spirit Lake had a relatively high biomass for waters in northern Idaho (Figure 37). Only Anderson Ranch Reservoir in southern Idaho had a higher NASC value during our recent surveys. However, NASC values are a measurement of area of the targets, and so do not directly correlate with biomass if the mean sizes of fish change in a given body of water. We found that the NASC value can explain 90% of the variability in biomass estimates from three kokanee populations in Idaho (Figure 38). This correlation could be helpful when only hydroacoustic data is available for a survey. We suggest calculating kokanee biomass solely by hydroacoustics and comparing this to biomass estimates made by trawling.
Limnology We documented dissolved oxygen values in the hypolimnion of Spirit Lake that were
below 4 mg/l during the summer of 2008 (Maiolie and Fredericks, in press). Our concern was that dissolved oxygen may also be low under the ice cover during winter. Fortunately, this did not appear to be the case as dissolved oxygen remained above 8.25 mg/l on our February 3, 2009 survey.
The low hypolimnetic oxygen reading may be a sign of the lake’s continued
utrophication. We are therefore concerned that nutrient inputs to the lake may be increasing to beyond what is best for the fish.
MANAGEMENT RECOMMENDATIONS
1. We recommend monitoring dissolved oxygen levels in Spirit Lake to determine if increased nutrient loading is affecting fish habitat. As appropriate, the Department should provide information and comments to regulatory agencies relative to the decreased oxygen levels and the implications to the coldwater fishery.
2. We also recommend periodic breaching of the beaver dams in Brickle Creek during
the September spawning run to give early spawning kokanee a chance to migrate upstream.
3. Both early and late spawning kokanee should be sampled at their spawning times to
see if their flesh color is a defining characteristic between the two strains.
4. The angler’s catch of kokanee from Spirit Lake should be sampled and compared to the trawl catch to see if the early spawning strain shows a higher catchability.
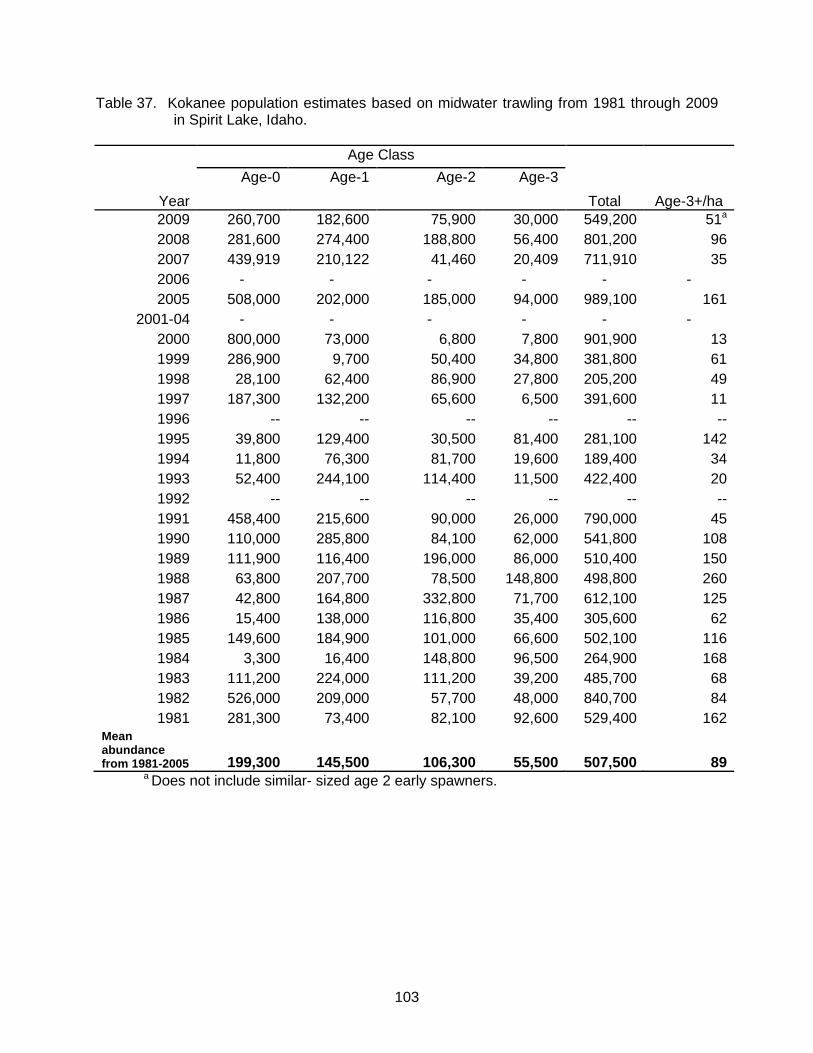
103
Table 37. Kokanee population estimates based on midwater trawling from 1981 through 2009
in Spirit Lake, Idaho.
Age Class
Year Age-0 Age-1 Age-2 Age-3
Total Age-3+/ha 2009 260,700 182,600 75,900 30,000 549,200 51a
2008 281,600 274,400 188,800 56,400 801,200 96 2007 439,919 210,122 41,460 20,409 711,910 35 2006 - - - - - - 2005 508,000 202,000 185,000 94,000 989,100 161
2001-04 - - - - - - 2000 800,000 73,000 6,800 7,800 901,900 13 1999 286,900 9,700 50,400 34,800 381,800 61 1998 28,100 62,400 86,900 27,800 205,200 49 1997 187,300 132,200 65,600 6,500 391,600 11 1996 -- -- -- -- -- -- 1995 39,800 129,400 30,500 81,400 281,100 142 1994 11,800 76,300 81,700 19,600 189,400 34 1993 52,400 244,100 114,400 11,500 422,400 20 1992 -- -- -- -- -- -- 1991 458,400 215,600 90,000 26,000 790,000 45 1990 110,000 285,800 84,100 62,000 541,800 108 1989 111,900 116,400 196,000 86,000 510,400 150 1988 63,800 207,700 78,500 148,800 498,800 260 1987 42,800 164,800 332,800 71,700 612,100 125 1986 15,400 138,000 116,800 35,400 305,600 62 1985 149,600 184,900 101,000 66,600 502,100 116 1984 3,300 16,400 148,800 96,500 264,900 168 1983 111,200 224,000 111,200 39,200 485,700 68 1982 526,000 209,000 57,700 48,000 840,700 84 1981 281,300 73,400 82,100 92,600 529,400 162
Mean abundance from 1981-2005 199,300 145,500 106,300 55,500 507,500 89
a Does not include similar- sized age 2 early spawners.

104
Table 38. Kokanee population estimates based on hydroacoustic surveys in Spirit Lake, Idaho.
Age Class
Year Age-0 Age-1 Age-2 Age-3
Total NASC Age 3/ha 2009 567,500 345,100 142,400 60,200 1,115,200 448 103b
2008 553,500 292,500 198,700 60,700 1,105,400 505 103 2007 495,900 266,900 52,500 25,900 841,200 494 44 2004 279,000 -a -a -a 916,800 458 -
a No trawling was conducted in 2004 to delineate kokanee in age classes 1 to 3. b Does not include mature age 2 kokanee that were of similar-size to age 3 late spawners.
Table 39. Temperature and dissolved oxygen readings near the center of Spirit Lake, Idaho,
February 3, 2009.
Depth (m) Temp (oC) Dissolved oxygen (mg/l)
Surface 1.0 14.98 0.9 2.1 13.51 1.8 2.4 11.18 2.7 2.4 10.14 3.7 2.5 9.84 4.6 2.6 9.56 5.5 2.7 9.48 6.4 2.7 9.45 7.3 2.8 9.38 8.2 2.9 9.30 9.1 3.0 9.13 10.1 3.0 9.21 11.0 3.0 9.19 11.9 3.1 9.13 12.8 3.2 9.06 13.7 3.2 8.85 14.6 3.2 8.25

105
Figure 33. Location of five midwater trawling transects (solid lines) and ten hydroacoustic
transects (dashed lines) used to estimate kokanee population abundance in Spirit Lake, Idaho during 2008. Star indicates the location of the limnological sampling.

106
Figure 34 . Length-frequency distribution of kokanee caught while trawling Spirit Lake, Idaho, July 24, 2009.

107
Figure 35. Target-strength frequency distribution of kokanee in Spirit Lake, Idaho, on July 28,
2009.

108
Figure 36. Nautical area scattering coefficients (NASC) for several lake and reservoirs in Idaho.
Figure 37. Correlation between the Nautical Area Scattering Coefficient (NASC) and the resulting estimates of kokanee biomass. Data were obtained from Spirit Lake, Coeur d’Alene Lake and Lake Pend Oreille.
0
200
400
600
800
1000
1200
And
erso
n R
anch
07
Spi
rit L
ake
04
Spi
rit L
ake
07
Spi
rit L
ake
08
Spi
rit L
ake
09
CdA
Lak
e 08
CdA
Lak
e 09
Lake
Pen
d O
reill
e07
Pay
ette
Lak
e 07
Pay
ette
Lak
e 09
Pri
est L
ake
04
NA
SC (m
2 /nau
tical
mile
2 )

109
2009 PANHANDLE REGION ANNUAL FISHERY MANAGEMENT REPORT PRIEST LAKE INVESTIGATIONS
ABSTRACT
Kokanee spawners were counted at five historic shoreline sites in Priest Lake. A total of
2,637 kokanee spawners were observed on November 2, 2009. This is slightly down from the mean count since 2001 of 2,990 spawners.
We continued to collect tags from angler-caught lake trout in 2009 to evaluated growth,
movement, and exploitation. Seven tags from previous lake trout tagging efforts were returned in 2009. Annual growth of tagged fish, as reported by anglers, ranged from 1 to 40 mm, with an average of 17 mm. Mark Liter Regional Fishery Biologist Jim Fredericks Regional Fishery Manager

110
INTRODUCTION
A self sustaining population of kokanee was established in Priest Lake in the early
1940’s, and they soon became the most abundant game fish. Harvest of kokanee in 1956 was estimated at 100,000 fish (Bjornn 1957). Kokanee in Priest Lake are classified as “late spawners” typically using shoreline gravel rather than tributary streams and spawn from November through early January.
From the early 1950’s to the early 1970’s kokanee provided most of the fishing in Priest
Lake with an annual harvest of 30,000-100,000 fish. The introduction of opossum shrimp in the mid-1960’s lead to dramatic increases in lake trout numbers and elimination of the popular kokanee fishery in the late 1970’s. In 1978 only 4,500 kokanee were harvested in Priest Lake. Based on trawling estimates the population of age-3 kokanee in Priest Lake in 1987 was only 2,776 fish (Mauser and Ellis1985).
Until around 2000 the Priest Lake kokanee population had been considered all but extirpated. We have been counting kokanee spawners at five historic sites since 2001, averaging 2,990 fish per year
STUDY AREA
Priest Lake is a glacial lake located in the northwest corner of the Idaho Panhandle
about 30 km south of the Canadian border (Figure 38). The lake is in the Selkirk Mountain range amid a coniferous forest watershed of 1600 km2. Priest Lake has about 100 km of shoreline, a surface area of 9,454 ha, a mean depth of 38 m, and a maximum depth of 112 m. The lake is known for its low productivity and clear water.
OBJECTIVES
1. Manage Priest Lake to provide both a yield and a trophy fishery for lake trout.
2. Provide a limited consumptive harvest of kokanee in Priest Lake.
METHODS
Kokanee Spawner Counts
Kokanee spawner counts were conducted in fives historic spawning areas on Priest Lake on November 2, 2009. Surveys were conducted using a boat with two observers standing on the bow while a third person drove the boat contouring the shoreline at a depth of about 3 m. Each observer counted spawners and an average of the two counts was used as the estimate for each of the five sites. Our efforts were concentrated on the area between the Granite Creek delta and Copper Bay, Indian Creek campground and marina, Cavanaugh Bay Marina, Hunt Creek delta and Huckleberry Bay (Figure 38).

111
Lake Trout Tagging.
From 1995 through 2006 nearly 1,600 lake trout were tagged in an effort to estimate angler exploitation and help define the population dynamics of lake trout in Priest Lake. All fish were caught and tagged by Randy Phelps, a volunteer angler. Spaghetti tags were placed in the dorsal musculature beneath the dorsal fin. Catch location, date, fish length and weight, and any comments regarding the health or release of the fish were recorded at the time of tagging along with the tag number. Fish were released back to the same water from where they were captured. In 2009, we continued to collect information from lake trout reported by anglers. We summarized total and annual growth and distance from original capture.
RESULTS
Priest Lake Kokanee A total of 2,637 kokanee spawners were counted at five shoreline sites in Priest Lake (Table 40). Number of kokanee spawners observed at each of the five sites on Priest Lake were as follows; Copper Bay 308, Huckleberry Bay 38, Cavanaugh Bay 463, Hunt Creek beach 1,296, and Indian Creek beach 40 (Table 40). Few dead kokanee were observed and were too deep to retrieve, therefore, no mean length of spawners was obtained. Mean lengths of spawners appeared to be similar to past years.
Lake Trout Tag Returns
A total of 7 tagged lake trout were recaptured in 2009. All had been tagged in Priest Lake between 1999 and 2005. Growth, as reported in angler tag returns, ranged from 1 to 40 mm/year, with a mean annual growth of 17 mm/year. This compares to a reported mean annual growth of 13 mm/yr in 1999 and 25 mm/year in 1998. Lake trout were caught from 0 to 21 km from their original capture site, with an average distance from original capture of approximately 5.2 km (Table 38). Past estimates of lake trout exploitation have ranged from 2%-7% (Fredericks and Horner 2001, Fredericks et al. 2008).
DISCUSSION
Priest Lake Kokanee
Priest Lake spawning kokanee numbers were up from 2008, which was the lowest number counted since we began monitoring spawners. We counted 2,637 kokanee spawners in 2009 at the five sites compared to 1,480 in 2008.
The slight increase in kokanee spawners since 2002 is attributed to a change in water level management. Prior to 2002, timing of winter draw down adversely affected spawning success and survival of beach spawned eggs and fry in redds. In 2001 Idaho Water Resources Board (IWRB) and IDFG proposed several amendments to the 1996 kokanee recovery plan suggesting the lake level be lowered starting October 1 in order to reach the 0.0 feet goal at the

112
outlet gauge by November 1. Lower lake levels ensure a higher success rate for kokanee redds because the water is at its lowest level before kokanee initiate spawning. Kokanee spawning activity in Priest Lake peaks in mid-November. Since 2002 Priest Lake has been drafted to near the 0.0 goal on October 31. We will continue monitor kokanee spawner numbers and we may be able to offer anglers limited kokanee angling opportunity again on Priest Lake in the future.
MANAGEMENT RECOMMENDATION
1. Continue to monitor kokanee spawner numbers on Priest and Upper Priest Lakes.

113
Table 40. Counts of shoreline spawning kokanee salmon in Priest Lake and Upper Priest Lake, Idaho, 2001- 2009.
Location 2001 2002 2003 2004 2005 2006 2007 2008 2009 PRIEST LAKE
Copper Bay 588 549 1237 1584 906 1288 308 223 400 Cavanaugh Bay 523 921 933 1673 916 972 463 346 550 Huckleberry Bay 200 49 38 359 120 43 38 0 37 Indian Crk Bay 222 0 0 441 58 0 40 27 15 Hunt Crk Mouth 232 306 624 2060 2961 842 1296 884 1635 UPPER PRIEST
LAKE
West shoreline 10 ---1 ---1 ---1 ---1 ---1 ---1 ---1 ---1
Total 1775 1825 2832 6117 4961
3145 2145 1480 2637
1 Upper Priest Lake was not included in the spawner counts due to low water in the Thorofare and no access to Upper Priest Lake.
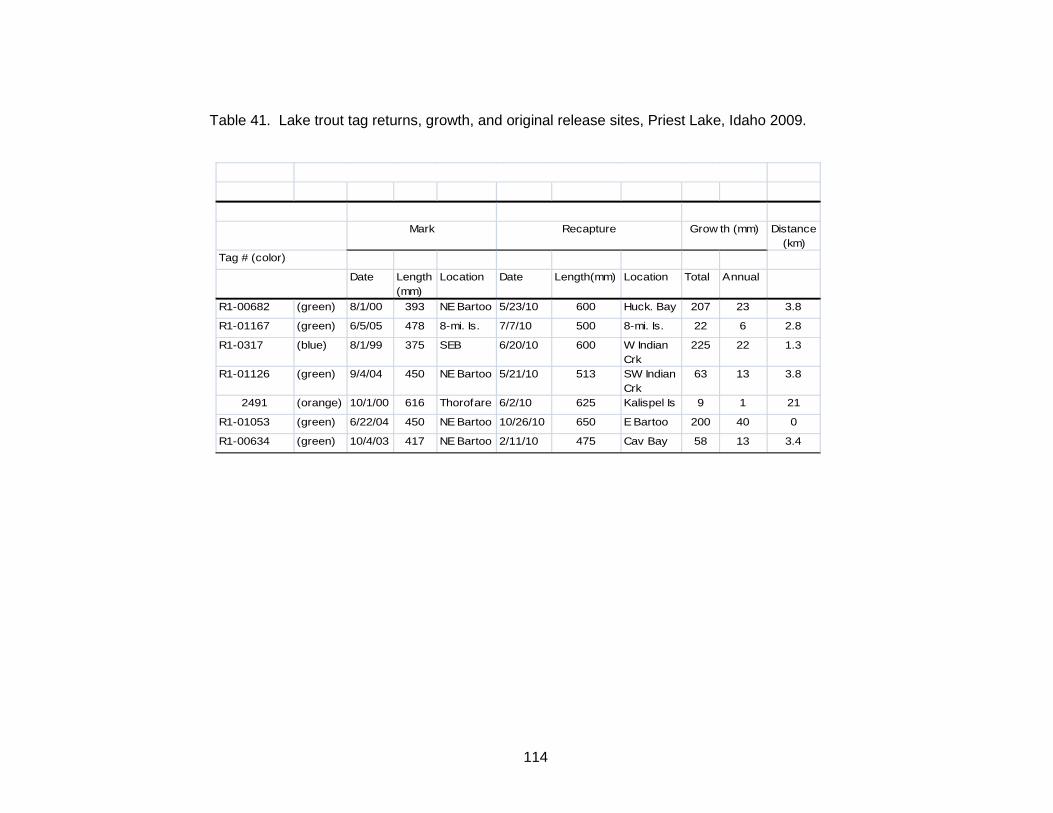
114
Table 41. Lake trout tag returns, growth, and original release sites, Priest Lake, Idaho 2009.
Distance (km)
Date Length (mm)
Location Length(mm) Location Annual
R1-00682 (green) 8/1/00 393 NE Bartoo 600 Huck. Bay 23 3.8
R1-01167 (green) 6/5/05 478 8-mi. Is. 500 8-mi. Is. 6 2.8
R1-0317 (blue) 8/1/99 375 SEB 600 W Indian Crk
22 1.3
R1-01126 (green) 9/4/04 450 NE Bartoo 513 SW Indian Crk
13 3.8
2491 (orange) 10/1/00 616 Thorofare 625 Kalispel Is 1 21
R1-01053 (green) 6/22/04 450 NE Bartoo 650 E Bartoo 40 0
R1-00634 (green) 10/4/03 417 NE Bartoo 475 Cav Bay 13 3.4
Mark Recapture Grow th (mm)
Tag # (color)
Date Total
5/23/10 207
7/7/10 22
6/20/10 225
2/11/10 58
5/21/10 63
6/2/10 9
10/26/10 200

115
Figure 38. Location of kokanee spawner counts on Priest Lake, Idaho, 2009.

116
2009 PANHANDLE REGION ANNUAL FISHERY MANAGEMENT REPORT
UPPER PRIEST LAKE BULL TROUT ENHANCEMENT
ABSTRACT
Harbor Fisheries, Inc. of Baileys Harbor, Wisconsin was contracted to use gill nets to remove lake trout from Upper Priest Lake in 2009 using their 36 foot commercial gill net boat with funding from the USFWS. Gill nets were fished from May 30 through June 5, 2009. Catch rates of lake trout varied among locations and days in Upper Priest Lake. Catch rates were generally higher along shorelines and lower in deeper mid-lake sets. Catch rates were generally higher at the start of the effort, and tapered off over the seven day effort. We fished a total of 41.5 km of gill net (25.8 mi) averaging 5,930 m net/day. A total of 1,353 lake trout were caught and removed. Processed lake trout were given to various food banks throughout the Idaho Panhandle.
Abundance of lake trout was estimated using a Leslie Depletion Model (Ricker 1975).
We estimated lake trout population abundance at the beginning of the effort to be 1,348 fish. With funding from USFWS, IDFG contracted with Hickey Bros. Fisheries, Inc. in 2009 to
evaluate potential netting methods to minimize lake trout movement into Upper Priest Lake from Priest Lake. From September 30 to October 23, 2009, we used hoop nets, gill nets, and trap nets to capture fish in the Thorofare. We used monofilament, sinking gill nets to evaluate effectiveness of a commercial trap net as well as several hoop net configurations. The initial D-ring hoop net design failed to capture any lake trout, and after several alterations, it was concluded that the D-ring hoop nets were too confining and lake trout were reluctant to pass through the hoop net throat. On October 21, we deployed a commercial trap net similar to trap nets used on LPO but on a smaller scale. After several modifications six lake trout, one cutthroat trout, a smallmouth bass, a mountain whitefish, and 12 northern pikeminnow Ptychocheilus oregonensis were captured.
Unfortunately, decreasing water levels resulted in termination of this experiment prior to
refining methods to increase capture efficiency. The trap net was removed on October 23 when water levels in Priest Lake reached low-pool, eliminating boat access to the Thorofare.
A seasonal, passive fish barrier, such as a large trap net set at either end of the
Thorofare from September through mid- November, may prove to be an effective means of minimizing lake trout immigration while not harming native fish species.
Authors: Mark Liter Regional Fishery Biologist Jim Fredericks Regional Fishery Manager

117
INTRODUCTION It has been well documented that introduced lake trout have the tendency to suppress
other native and non-native species through predation and/or competition (Donald and Alger 1993, Fredenberg 2002, Hansen et al. 2008.) Historically native bull trout provided a trophy fishery in Upper Priest Lake with an annual catch of 1,800 fish in the 1950’s (Bjorn 1957). Bull trout harvest was eliminated in 1984, but no positive response in the fishery ensued (Mauser et al. 1988). The bull trout population in Priest Lake is considered functionally extinct while the population in Upper Priest Lake is severely depressed (DuPont et al. 2005).
Native westslope cutthroat trout were also historically abundant in Priest Lake and Upper
Priest Lakes with 30 fish limits common in the 1940’s (Mauser et al. 1988). Over harvest, interspecific competition, and degradation of spawning habitat all led to the decline of cutthroat trout in the Priest Lakes. Cutthroat trout were closed to harvest in 1988.
In Upper Priest Lake the lake trout population appears to have grown rapidly in the past
25 years. Lake trout were not known to be present in Upper Priest Lake until mid-1980s at which time they were thought to have begun migrating from Priest Lake (Mauser 1986). In 1998 the Upper Priest Lake lake trout population was estimated at 859 fish (Fredericks and Vernard 1999). In an effort to reduce threats to dwindling bull trout and cutthroat populations, IDFG has been using gill nets to reduce lake trout abundance in Upper Priest Lake since 1998. Between 150 and 2,200 lake trout have been removed nearly every year from Upper Priest Lake (Liter et al. 2009 in press). The netting efforts demonstrated that Upper Priest Lake is not a closed system. It has become increasingly evident that without a migration barrier in the Thorofare to limit immigration from Priest Lake, Upper Priest Lake will likely be dominated by lake trout (Fredericks and Vernard 2001).
METHODS
Lake Trout Removal Harbor Fisheries, Inc. of Baileys Harbor, Wisconsin was contracted to use gill nets to
remove lake trout from Upper Priest Lake in 2009 using their 36 foot commercial gill net boat. Funding for this contract was provided by the USFWS. Gill nets used in Upper Priest Lake were 91 m long by 2.7 high designed with multiple panels of graded mesh sizes ranging from 64 mm to 89 mm randomly arranged in each net. Individual gill nets were tied together end to end to create a continuous net ranging from 1,645 m to 6,644 m.
Gill nets were fished from May 30 through June 6, 2009. Nets were set throughout the
lake and were moved based on catch rates at a particular site and the discretion of the netting crew. Gill nets were set perpendicular to shore when fishing shoreline areas and at various angles when fishing deeper offshore areas. Nets were set at depths ranging from 10-31 m. A concerted effort was made to avoid incidental bull trout captures by avoiding areas known to hold concentrations of bull trout.
Thorofare Netting Evaluation
From September 30 to October 23, 2009, we used hoop nets, gill nets and trap nets to
capture fish in the Thorofare. We used monofilament, sinking gill nets to evaluate effectiveness of a commercial trap net as well as several hoop net configurations. We used 91.4 x 2.4 m
118
gillnets with 3 panels ranging from 2.5 to 5.1 cm bar measured mesh. Gill nets were set perpendicular to the flow upstream and downstream of each hoop net or trap net to monitor effectiveness. Because the gill nets spanned nearly the entire width of the Thorofare, an 8-10 meter wide section of float line was submerged to create a passage-way near the thalweg to allow boat traffic movement
Hoop nets were tested approximately 200 m upstream of Priest Lake and approximately 400 m downstream of Upper Priest Lake. These sites were selected due to their narrow width, relatively flat streambeds and lack of debris. Two D-ring hoop nets were set in the Thorofare facing opposite directions to capture fish moving in either direction. Hoop nets were positioned with the pot parallel to the shoreline and wings angled at approximately 300 approaching each shoreline. Hoop nets were constructed of #15 nylon netting and had 2.54 cm square mesh. Each net consisted of a 4.88 m long hoop net portion with a 1.22 m diameter front hoop and two 30.5 x 1.83 m wings.
On October 21 we deployed a commercial trap net similar to the trap nets used on Lake
Pend Oreille but on a smaller scale. The trap net sat on the bottom of the Thorofare approximately 400 m upstream of Priest Lake. Leads constructed of thick 200 mm mesh extended from the trap net to near the shoreline on each side, extending from the bottom to the surface. These visible leads divert fish into an enclosure called the heart. The heart has wings or net sections that form a V-shape and are supported by floats and anchors. Once inside the heart, fish swim through a tunnel and become trapped in a boxlike receptacle called a pot. (Figure 1). Fish trapped in the pot remain alive, until it is raised up to the boat where lake trout are dipped out with a long handled net and removed. Captured lake trout were examined for sexual maturity, measured (mm total length); and removed. Captured bull trout and Westslope cutthroat were measured and transported away from the net site before release.
Since stationary nets can pose navigation obstacles to boaters, we used multiple orange
floats spaced 6 m apart and attached to the top of the leads to help boaters recognize and avoid the trap nets.
RESULTS
Lake Trout Removal
During our seven day effort we averaged 5,930 m net/day. A total of 1,353 lake trout were caught and removed. Daily catch of lake trout ranged from 84 - 351 fish. Lake trout ranged from 118 - 870 mm with a mean of 388 mm total length (Figure 40).
A total of 22 bull trout were captured and 20 were released alive (Figure 41). Bull trout
ranged from 180 - 745 mm with a mean length of 408 mm. Catch rates of lake trout varied among locations and days in Upper Priest Lake during
June, 2009. Catch rates were generally higher along shorelines and lower in deeper mid-lake sets. Daily catch was generally higher at the start of the effort and tapered off over the 7 day effort (Figure 42).
Using a Leslie Depletion Model (Ricker 1975) we estimated the lake trout population to be 1,348 fish at the beginning of the effort (Figure 43).
119
Thorofare Netting Evaluation The initial D-ring hoop net design failed to capture any lake trout. After several
alterations, including the addition of a mesh floor, numerous modifications of the throat, increased wing length, and the addition of a heavier lead line to form a better seal on the streambed, several largescale and longnose suckers, Catostomus spp., northern pikeminnow and one bull trout were captured. After several nights of netting it became apparent through gill net catches upstream and/or downstream of the hoop nets, that lake trout were avoiding the hoop nets. Wing extensions were added allowing us to span nearly the entire width of the Thorofare. A passage-way to allow boat traffic movement was constructed near the thalweg by submerging one of the leads approximately 1 m. Despite these changes, only one lake trout was captured in a D-ring hoop net.
Lake trout may have avoided capture by swimming through the boat passage opening,
by swimming under the lead line on the bottom of the wings or by swimming through the small gaps immediately adjacent to each stream bank. It was the opinion of Hickey Bros. Fisheries, Inc, that due to the shallow depth and clear water of the Thorofare, lake trout were reluctant to pass through the hoop net throat. It was concluded that the D-ring hoop nets were too confining and lake trout would not enter them. On October 19, 2009 both hoop nets were removed from the Thorofare and we focused our efforts on a trap net design.
On October 20 we deployed the commercial trap net, and no lake trout were caught
overnight. Several modifications were immediately made, including longer lead lines and a bottom sewn into the heart area. With the longer leads extending nearly the entire width of the Thorofare, a passage-way to allow boat traffic movement was constructed near the thalweg. Unfortunately, this opening also allowed lake trout to move around the trap net. On October 22 the trap net was checked, resulting in a catch of six lake trout, one cutthroat trout, a smallmouth bass, a mountain whitefish and 12 northern pikeminnow. However, gill nets set upstream and downstream of the trap net again verified avoidance by lake trout. Eight lake trout and two cutthroat trout were caught upstream of the trap net while 13 lake trout were captured downstream. Unfortunately, decreasing water levels resulted in termination of this experiment prior to being able to refine methods to effectively capture more lake trout. The trap net was removed on October 23. When water levels reach low-pool, boat traffic through the Thorofare is eliminated as water depth is reduced to 100 - 200 mm in the first 100 m above Priest Lake.
We caught 164 lake trout and five bull trout during this effort. Lake trout ranged from 470
mm to 910 mm (TL); 158 were sexually mature and 41% were males. Bull trout ranged from 210 mm to 715 mm. We also captured 51 cutthroat trout ranging from 280 to 510 mm (Table 42). Other species caught include smallmouth bass, largescale and longnose suckers, mountain whitefish, northern pikeminnow, and tench tinca tinca (Table 43.)
DISCUSSION
Lake Trout Removal
Duplicating our 2007 and 2008 efforts and comparing results of the three studies
provides us with an estimate of how many lake trout are immigrating into Upper Priest Lake on yearly basis. In 2007 we captured and removed 1,982 lake trout from Upper Priest Lake and using a Leslie Depletion Model estimated the lake trout population abundance to be 2,307 fish.

120
With the identical technique and identical effort in 2008 we captured and removed 2,207 lake trout and estimated the population abundance at 2,278. In 2009 we used the same estimator; however, effort was reduced to seven days of netting. We removed 1,353 lake trout and estimated lake trout population abundance at 1,348 fish. This would suggest we may have removed all of the lake trout in Upper Priest Lake. It is possible that some lake trout were pelagic or in areas of the lake not vulnerable to our gill net sets explaining why the number of lake captured exceeded the total population estimate. Obviously, this is not possible, but as in 2007 and 2008 it suggests that we are able to remove a very high percentage of the lake trout from Upper Priest Lake in a short amount of time. The past three years of lake trout removal has demonstrated that we are effective at removing a significant portion of the lake trout population in a very short amount of time, and that Upper Priest Lake is being re-populated annually by mature fish from Priest Lake, as well as juvenile fish recruiting to the population from within Upper Priest Lake.
Despite less effort in 2009, bull trout catch was up again from the previous years’ effort.
After three years of using Hickey Bros. Fisheries Inc. to remove lake trout, the number of bull trout captured and released during this project has increased annually, perhaps reflecting increased survival. By comparison, seven bull trout were captured in 11 days of netting in 2007, while 22 bull trout were captured in only seven days of netting in 2009. Bull trout ranged from 180-745 mm. The 180 mm bull trout is the smallest bull trout collected in recent years. Bull trout redd counts in the Upper Priest River and tributaries have also increased over the last two years and the 2009 total was slightly above the ten year average. Having used the identical technique and less effort in 2009 and the fact that we are seeing juvenile bull trout suggests that we are improving bull trout recruitment in Upper Priest Lake.
The USFWS has provided IDFG with funding to hire Hickey Bros. Fisheries Inc. to
remove lake trout from Upper Priest Lake in 2010. Additionally, work continues to secure funding to further evaluate potential netting methods to minimize lake trout movement into Upper Priest Lake from Priest Lake.
Thorofare Netting Evaluation
Results of this study indicate the Thorofare is a passage corridor for lake trout as well as
westslope cutthroat, bull trout, mountain whitefish, and other species. These results are consistent with other studies suggesting extensive fish movement between the lakes, especially in the fall (Fredericks 1998; Fredericks and Vernard 2001). A total blocking of fish movement between the lakes could be detrimental to native fish, and any migration barrier will have to be evaluated relative to negative impacts to species other than lake trout.
Over the past few years IDFG has researched the use of strobe lights and an electric
weir as a means of minimizing immigration by lake trout to Upper Priest Lake. Effectiveness, financial constraints, and social implications make either of these options unrealistic. In addition to initial costs, as well as maintenance and operating costs, variable flows, floating debris, and limited access for maintenance are factors needing consideration when discussing potential fish barriers. Additionally, any structure inhibiting boat passage would conflict with the popular use of the Thorofare by boaters.
A seasonal, passive fish barrier, such as large trap nets, may prove to be an effective
means of minimizing lake trout immigration through the Thorofare. Fredericks and Vernard (2001) reported lake trout movement through the Thorofare is greatest during October and

121
November, coinciding with the timing of spawning. Trap nets set at either end of the Thorofare from September through mid- November could significantly reduce movement of lake trout while not harming native fish species. It’s our observation that boat traffic is greatly reduced during the fall months, and with proper signage and lighted buoys boaters could easily recognize and avoid the trap nets.
At the conclusion of our fall 2009 trap net effort, Harbor Fisheries Inc. made several
recommendations to increase efficacy of trap nets. Measurements (stream width, depth, and bottom profile) were made at sites selected for future research. It was their opinion that with leads custom made to fit between the trap net and each shoreline as well as from the stream bottom to surface, fish avoidance could be greatly reduced or potentially eliminated. They also felt heavier lead lines on the bottom of each lead would seal off any potential for lake trout to “burrow under” the leads. Additionally, scuba divers would be used to firmly secure the lead lines to the bottom and inspect for low areas where lake trout could burrow under. Because of the shallow, clear water in the Thorofare, Harbor Fisheries Inc. also felt that longer heart and pot sections would result in less avoidance buy reducing the feeling of confinement as lake trout approach the pot.
MANAGEMENT RECOMMENDATIONS 1. Continue annual netting to reduce lake trout abundance.
2. Continue to investigate methods to minimize lake trout immigration from Priest Lake
to increase effectiveness of annual suppression efforts.

122
Table 42. Number of lake trout, bull trout and cutthroat trout captured during 2009 Priest Lake Thorofare net evaluation effort.
Lake Trout Bull Trout Cutthroat Trout Sample Date
Net Type *
Capture Size Range (mm)
Capture Size Range (mm)
Capture Size Range (mm)
Sept 30-Oct 1
GN 16 510-910 1 300 42 320-460
Oct 8-9 GN 13 530-641 1 715 0 --- Oct 12-13 GN 37 470-830 0 --- 1 420 Oct 14-15 HN &
GN 51 520-700 2 222-495 5 280-375
Oct 19-20 HN & GN
20 520-730 1 210 0 ---
Oct 21-23 TN & GN
27 515-825 0 --- 3 355-510
Total 164 5 51 *Net Type, GN = gillnet, HN = D-ring hoop net, TN = trap net
Table 43. Total number of fishes captured using gill nets and trap nets from September 29
through October 21, 2009 in the Thorofare between Priest and Upper Priest Lakes, Idaho.
Species Caught in gill nets
Caught in trap nets
Caught in hoop
nets
Total caught
Lake Trout 157 6 1 164
Mountain Whitefish 7 1 8 Bull Trout 3 2 5 Cutthroat Trout 50 1 51 Kokanee 3 3 Pikeminnow 19 12 18 49 Smallmouth Bass 2 1 3 Suckers sp. 66 3 69 Tench 1 1

123
Figure 39. Illustration of a trap net used in Priest Lake Thorofare. Image redrawn from one
provided by the University of Wisconsin Sea Grant Advisory Services.
Figure 40. Length frequency of lake trout caught in gill nets in Upper Priest Lake, Idaho,
from May 30 through June 5, 2009.
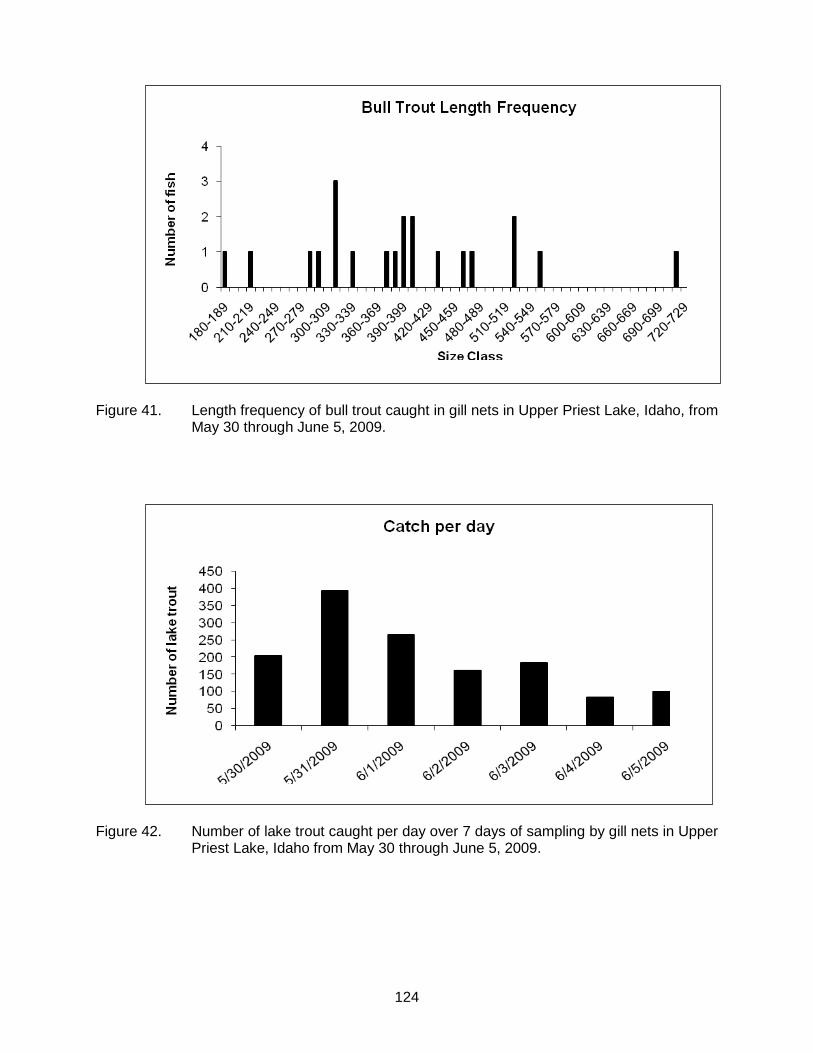
124
Figure 41. Length frequency of bull trout caught in gill nets in Upper Priest Lake, Idaho, from May 30 through June 5, 2009.
Figure 42. Number of lake trout caught per day over 7 days of sampling by gill nets in Upper Priest Lake, Idaho from May 30 through June 5, 2009.

125
Figure 43. Leslie Depletion Model (Ricker 1975) abundance estimate for lake trout captured
by gill nets in Upper Priest Lake, Idaho from May 30 through June 5, 2009.
0.000
0.005
0.010
0.015
0.020
0.025
0.030
0.035
0.040
0 500 1,000 1,500
Catc
h Ra
te (l
ake
trou
t/ 1
00m
/h)
Cummulative total of lake trout
CPUE
N=1348
y = -0.000024x + 0.0324R2 = .813
N=1348
y = -0.000024x + 0.0324R2 = .813

126
2009 PANHANDLE REGION ANNUAL FISHERY MANAGEMENT REPORT LOWLAND LAKES HATCHERY TROUT EXPLOITATION STUDY
ABSTRACT
In 2009 we evaluated the harvest rate of stocked, catchable-sized trout in Kelso and
Round lakes. Two hundred rainbow trout were tagged with Floy T-bar anchor tags and released in each lake with each lake receiving 100 fish in April and 100 in June. As of December 31, 2009, angler harvest rates for stocked rainbow trout were estimated to be 24% and 61% for Round and Kelso lakes respectively Authors: Mark Liter Regional Fishery Biologist Jim Fredericks Regional Fishery Manager

127
INTRODUCTION
In Idaho, approximately 15 million trout are produced by IDFG per year in 13 hatcheries for resident trout angling. Rainbow trout and cutthroat trout are most often stocked in Idaho’s lakes and reservoirs and in 2009. Roughly 16% were of catchable size (≥150 mm). Hatchery trout are used primarily in habitats not capable of supporting wild production sufficient to meet angler demand (IDFG 2007). Catchable rainbow trout raised for put-and-take use in the Panhandle Region are usually Trout Lodge or Hayspur strain raised at IDFG’s Mackay, Grace or Nampa Hatcheries and distributed by Cabinet Gorge Hatchery. The Trout Lodge strain is used throughout the Panhandle Region for a variety of reasons including, availability, growth, feed conversion and disease resistance. Only triploid (i.e. sterile) rainbow trout were stocked in the Panhandle Region in 2009. The cost of production and distribution averaged $1.08/fish per catchable trout stocked in the Panhandle Region in 2009.
OBJECTIVE
To be both effective and efficient in our stocking of hatchery produced trout.
STUDY SITE
Kelso Lake is a 22 ha lake located in Bonner County, 7 km north of Athol, Idaho (Figure 44). Road access is good and the shoreline is dotted with numerous homes and summer cabins. IDFG maintains an “unimproved” boat ramp, picnic area and outhouse on the north shore. Kelso Lake has an average depth of 7.6 m. Kelso Lake is currently managed as a family fishing water, (year round season, limit of six trout and six bass, and no length limits) and is an “electric motors only” waterbody. Five to ten thousand triploid rainbow trout are stocked annually as catchables in Kelso Lake. Kelso was stocked four times in 2009 with a total of 5,785 catchables. Other species present in Kelso Lake include black crappie, bluegill, largemouth bass, pumpkinseed L gibbosus, tench, and yellow perch with bluegill being the most abundant species by number (Fredericks et al. 2008). Fourteen hatchery rainbow trout were captured and appeared to represent only two size classes. The mean length of rainbow trout was 281 mm with a range of 247 - 392 mm indicating some trout survived from the previous year.
Round Lake is a 22 ha lake located in Bonner County, 14 km south of Sandpoint, Idaho
(Figure 45). Access is limited to the northwest corner of the lake as the lake is situated in 57 ha Round Lake State Park. The State Park offers 51 campsites with modern restrooms, a boat ramp, showers, a dump station and picnic tables. Round Lake has maximum depth of 4.7 m. Round Lake is also managed as a family fishing water, and is an “electric motors only” waterbody. Generally, Round Lake is stocked each year with 8,000 to 10,000 triploid rainbow trout of catchable size. During 2009 Round Lake was stocked six times with a total of 10,060 catchables. Other gamefish species present in Round Lake include largemouth bass, pumpkinseed, and yellow perch.
METHODS
Two hundred Trout Lodge strain rainbow trout were tagged with Floy T-bar anchor tags and released in Kelso and Round Lakes with each lake receiving 100 fish in April and 100 in June. Rainbow trout averaged 1.5 fish per kg (3.3 fish per pound) with a mean length of 225 mm at the time fish were stocked.

128
All fish used in this study were raised at the IDFG Nampa Hatchery, then transferred to and distributed by the Sandpoint Hatchery. On the day of stocking, trout were crowded, randomly removed from the raceway, and loaded into the fish transport truck for stocking. Rainbow trout were tagged with orange Floy T-bar anchor tags with the tag inserted just below the dorsal fin. Tags were labeled on two sides with one side stating “IDFG 1-866-258-0338” and the other side with a tag number. IDFG operates a toll free automated hotline and website through which anglers can report tags. Additionally IDFG distributes posters and stickers to license vendors, regional offices and sporting goods outlets that publicize the tagging efforts and explain how to report tags and what the information is used for. To determine angler exploitation, the number of fish harvested by anglers (determined by tags returns) was divided by the number of fish we tagged. We assumed a 45% reporting rate, which is typical of non- reward tags (Meyer et al. 2009), and adjusted the return rate accordingly to provide an exploitation estimate. Tag loss was assumed to be 6% based on work conducted on rainbow trout by Meyer et al (2009).
RESULTS
Through December 31, 2009, 62 of the 200 tagged rainbow trout in Kelso Lake were reported as being harvested. Through the same time period, anglers reported harvesting 24 of the 200 tagged rainbow trout in Round Lake. After correcting for the angler report rate, tag loss, and tagging mortality, angler exploitation was estimated to be 24% and 61% for Round and Kelso Lakes respectively. Statewide, in 2009 tags were returned using the tag return 1-800 hotline (48%), website (45%), by mail (2%) or returned to the Regional office in person (5%).
DISCUSSION
Angler tag return rates for Kelso and Round lakes are in the upper end of values reported in other Idaho lakes and reservoirs. On average, exploitation for hatchery rainbow trout across Idaho lakes and reservoirs from 2006-08 was 18%, and ranged from 5-53% (Meyers et al. 2009).
The difference in return rates between Kelso and Round lakes may be explained by
water-specific influences. Round Lake has an overflow spillway that prevents fish from returning once they are flushed out. The winter of 2008-09 was one of the harshest on record and heavy run off during the spring of 2009 may have allowed more trout to leave Round Lake.
The difference in return rates may also be a function of pressure as Kelso Lake has
more development and better road access than Round Lake. Kozfkay and Megargle (2002) reported return to creel rates in variety of waters were significantly influenced by differences in productivity, thermal and oxygen refugia, depth, and angling pressure.
In 2010 we will continue our systematic assessment of catchable rainbow trout return-rates in Panhandle Region lakes and adjust planting priorities based on established stocking criteria. This may require eliminating lightly fished lakes or increase the frequency of stocking in heavily fished lakes. It is important to note that harvest estimates in this report do not reflect season-long estimates and as more tags are reported we will refine our 2009 angler exploitation estimates.

129
MANAGEMENT RECOMMENDATION
1. Continue lowland lakes stocking evaluations: In 2010 evaluate Hauser, Fernan, Jewel, Stoneridge and Upper Twin Lakes.

130
Figure 44. Location of Kelso Lake in the Panhandle Region.

131
Figure 45. Location of Round Lake in the Panhandle Region.

132
2009 PANHANDLE REGION ANNUAL FISHERY MANAGEMENT REPORT KEOKEE CREEK BROOK TROUT REMOVAL EVALUATION
ABSTRACT
We conducted depletion electrofishing in Keokee Creek, a tributary of the Middle Fork
East River, in 2009 to determine the effectiveness of brook trout removal efforts initiated in 2005 and completed in 2007. We captured westslope cutthroat trout, bull trout, brook trout, and sculpin in Keokee Creek. We captured 455 westslope cutthroat, 4 sculpin, 2 bull trout, and 1 brook trout on the first pass of electrofishing. Based on the 2009, efforts to reduce brook trout densities in Keokee Creek appear to have been successful after the three years of removal. Densities of brook trout were reduced more than seven fold. We did not see a notable increase in bull trout juveniles in 2009. Length frequency of westslope cutthroat trout captured on the first pass in 2009 was significantly different (T-test evaluation; P < 0.001) than what was captured in 2005, with more small fish in the 2009 sample. This difference was mainly represented by younger age classes (1 and 2), which comprised a greater proportion (19% increase in fish < 100 mm) following the initial brook trout removal process. Idaho Department of Lands (IDL) stream temperature data suggested that throughout the summer month’s water temperatures in Keokee Creek remained within or below the thermal optimum (12 -16°C) for bull trout.
Authors: Ryan Hardy Regional Fishery Biologist Jim Fredericks Regional Fishery Manager
133
INTRODUCTION
The Middle Fork (MF) East River is the only tributary of Priest River known to support a population of bull trout. The drainage also supports an abundant population of brook trout that appear to be increasing in numbers and expanding their range (Robertson and Horner 1987, DuPont and Horner 2002). Brook trout may have displaced bull trout (out competed and/or hybridized with) from some of the tributaries. An isolated brook trout population was identified in Keokee Creek during a 2000 survey.
Depletions through multi-pass electrofishing in were performed in Keokee Creek, a tributary of the MF East River, in 2005, 2006, and 2007, to remove an isolated brook trout population. The removal was viewed as a success in 2007 with zero brook trout remaining following the final removal efforts. The recommendation was put forth to evaluate population numbers of westslope cutthroat trout, bull trout, and the potential return of brook trout in 2-3 years.
OBJECTIVE
1. Evaluate westslope cutthroat trout, bull trout, and brook trout densities following removal efforts conducted from 2005 - 2007.
STUDY SITE
Keokee Creek is a major tributary of the MF East River of Priest River, located in the Idaho Panhandle (Figure 46). The creek flows approximately 4 km from its headwaters to where it joins the MF East River. The Middle Fork East River flows about 15 km to join the North Fork East River and form the East River, which flows an additional 4 km where it enters Priest River. Priest Lake is located about 37 river km upstream from this confluence and the Pend Oreille River is located about 34 river km downstream. A dam operated by Avista Corporation is located at the mouth of Priest Lake and is a barrier to upstream fish passage a majority of the time. Albeni Falls Dam, operated by the Army Corps of Engineers, is located about 7 river kilometers downstream of the confluence of the Pend Oreille River and Priest River and is a permanent barrier to fish passage. Lake Pend Oreille is located about 37 river km upstream of the confluence of the Pend Oreille River and Priest River, and no barriers to fish migration exist between these points. The bull trout population spawning in the MF East River drainage appears to be a unique adfluvial stock which utilizes Lake Pend Oreille in their life history (DuPont et al. 2007).
Keokee Creek ranges in elevation from 975-1150 m and is characterized by relatively
high gradient. Width of the creek averages 7 m with multiple, braided channels throughout the sampling reach. Keokee Creek and the uppermost reach of the MF East River are entirely within land managed by the State of Idaho (IDL). The riparian zone vegetation includes alder and mountain maple with mixed conifers higher upslope.
METHODS
We electrofished the identical transect of Keokee Creek in 2009 (from its mouth
upstream) as determined by Dupont et al. (in Press) in the previous studies. Electrofishing was conducted using two a Smith-Root SR 15 backpack electrofishers and 3 person crews. All fish were netted, counted, and measured (mm) to compare length frequencies. All fish were released (except brook trout) below the area of shocking in order not to be counted twice on the

134
first pass. Brook trout were removed entirely during these sampling events. A rangefinder was used to measure the stream distance sampled as well as selected stream widths to estimate the area sampled (m2). A second electrofish pass was done in order to reaffirm that no brook trout remained. Although the same data were collected, only data from the first pass were used to compare population structure with previous years.
Temperature data from IDL was investigated to determine if bull trout water temperatures could have affected the results of the study for bull trout numbers.
RESULTS We captured westslope cutthroat trout, bull trout, brook trout, and sculpin in Keokee
Creek. 455 westslope cutthroat, 4 sculpin, 2 bull trout, and 1 brook trout were captured on the first pass of electrofishing (Figure 47). No bull trout or brook trout were captured on the second pass and a third was not performed.
The brook trout population estimate in Keokee Creek decreased from 346 in 2005, to 176
in 2006, and then to 39 in 2007. The depletion indicated that numbers after the first year of removal resulted in a remaining population of 75 fish, after 2006 sampling 35 fish remained, and after 2007, 0 fish remained. A depletion estimate was not performed in 2009 since only two passes were made. However, with only one brook trout being captured, the population is again assumed to be at zero.
Bull trout numbers increased slightly from 2006 to 2007 and were sampled further
upstream (100 - 200 m) in the creek in 2007 than in previous years. The number of bull trout captured on the first pass increased from 1 fish in 2005, to 2 fish in 2006, and 10 fish in 2007. In 2009 only two bull trout were captured within 50 m of the confluence.
Length frequency of westslope cutthroat trout captured on the first pass in 2009 was significantly different (T-test evaluation; P < 0.001) than what was captured in 2005. This difference was mainly represented by younger age classes (1 and 2), which comprised a greater proportion (19% increase in fish < 100 mm) following the initial brook trout removal process (Figure 48).
IDL stream temperature data throughout the summer months showed water temperatures
in Keokee Creek remained within or below 14oC (Figure 49).
DISCUSSION
Efforts to reduce brook trout densities in Keokee Creek appear to have been successful after the three years of removal. Densities of brook trout were reduced more than seven fold. Although we did not see a notable increase in bull trout juveniles in 2009, it is still possible densities will increase in the future. Brook trout removal efforts in other streams have proven effective in increasing bull trout populations where simple stream habitat occurs (Buktenica 2000). A study of three small Rocky Mountain streams showed that densities of brook trout were reduced from 11.3 to 0.6 fish/100 m2 in Nameless Creek, from 3.4 to 0.3 fish/100 m2 in Nylander Creek, and from 2.3 to 0.2 in Irene Creek, following 3 pass depletion-removal electrofishing (Thompson and Rahel 1996). These streams had barriers in place and after 1-2 years following removal, recruitment was reported as being virtually nonexistent. Complete removal of brook trout in streams likely requires the use of ichthyocides, extensive long-term electrofishing

135
removal efforts (Greswell 1991, Thompson and Rahel 1996, Buktenica 2000), and/or construction of a barrier (Thompson and Rahel 1998).
As seen in the prior three years of removal, in 2009, age-0 westslope cutthroat trout were
not captured as effectively as age-1+ fish. After the first year of removal in 2005, we saw a noticeable increase in the numbers of age-1 westslope cutthroat trout, which likely indicates that we missed these individuals as age-0 fish, yet were able to capture them the following year. Thompson and Rahel (1996) similarly reported that age-0 fish were not captured as effectively as larger fish, particularly in streams with extensive overhanging cover and woody debris.
Stream temperature data suggested that throughout the summer months water temperatures in Keokee Creek remained within or below the bull trout’s thermal optimum (12 -16°C) as determined by McMahon et al. (1999). Temperatures peaked during the first week in August in 2009. Research and surveys suggest that where stream temperatures exceed 10-12°C brook trout have a competitive advantage over bull trout (Dambacher et al. 1992; Riehle 1993; McMahon et al. 1999).
A very small change in temperature may be all it takes to increase the spread of brook
trout to Keokee creek or other neighboring streams. In Uleda Creek, which does not support brook trout, average daily temperature did not exceed 10°C throughout the removal period. DuPont et al. (2002) reported that surrounding streams had daily average water temperatures only 1°C warmer than Uleda Creek, and brook trout were present. Tarlac Creek, which had temperatures about 1°C warmer than Uleda Creek, was dominated by bull trout in 1986, yet in 2002 had only brook trout. Other factors such as stream grade, size and habitat condition may also have an influence in species distribution.
In order to determine whether stream temperature or competition is driving the density of
bull trout in Keokee Creek, brook trout removal on a neighboring stream (such as Tarlac Creek) would serve as a comparison stream to investigate in the future.
MANAGEMENT RECOMMENDATIONS
1. Conduct three pass electrofishing in 2012 2. Consider expanding brook trout removal to Tarlac Creek for comparison. 3. Continue to conduct redd count surveys above Keokee Creek.

136
Figure 46. Map showing the Middle Fork East River and Keokee Creek, Idaho.

137
Figure 47. Number of fish captured on the first pass during 2005, 2006, 2007, and
2009 in Keokee Creek, Idaho.
1 2 10 2
78 6928
1
289
386
597
455
0
100
200
300
400
500
600
700
2005 2006 2007 2009
Num
ber o
f Fis
h
Sample Year
BLTBRKTWCT
0
10
20
30
40
50
60
70
80
Num
ber o
f Fis
h
Total Length Group (mm)
2009
2005
Figure 48. Westslope cutthroat trout length frequency for fish captured on the first electrofishing pass in Keokee Creek, Idaho in 2005 and 2009.
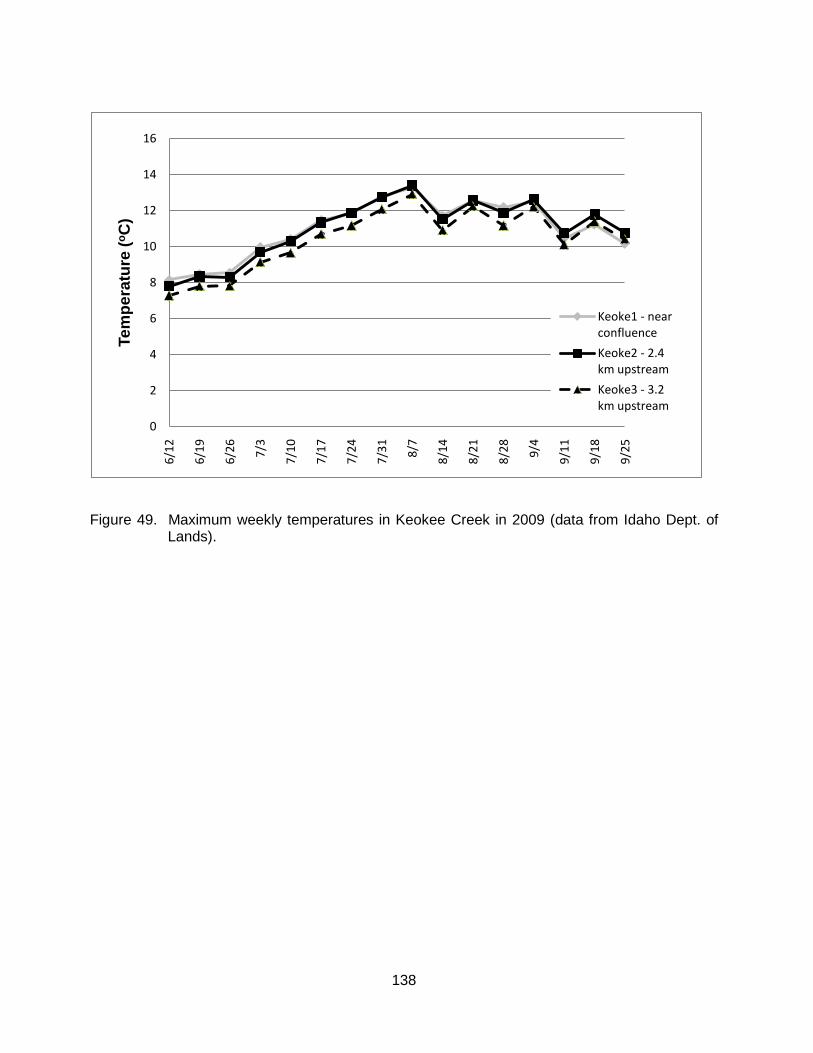
138
Figure 49. Maximum weekly temperatures in Keokee Creek in 2009 (data from Idaho Dept. of Lands).
0
2
4
6
8
10
12
14
16
6/12
6/19
6/26 7/
3
7/10
7/17
7/24
7/31 8/
7
8/14
8/21
8/28 9/
4
9/11
9/18
9/25
Tem
pera
ture
(oC
)
Keoke1 - near confluence
Keoke2 - 2.4 km upstream
Keoke3 - 3.2 km upstream
139
2009 PANHANDLE REGION ANNUAL FISHERY MANAGEMENT REPORT SPOKANE RIVER DRAINAGE SNORKEL SURVEYS
ABSTRACT
In order to estimate fish density and size distribution, IDFG personnel snorkeled a total of 35 transects in the St. Joe River and 43 in the North Fork Coeur d’Alene River system from August 4th to August 12th, 2009. Total densities of age-1 and older westslope cutthroat trout were 0.84 fish/100 m2 in the St. Joe River and 0.90 fish/100 m2 in the North Fork Coeur d’Alene River system. Both rivers showed increasing trends in abundance of cutthroat trout following the declines observed after the 1996 and 1997 flood events. Densities of cutthroat trout ≥ 300 mm in length were 0.35 fish/100 m2 in the St. Joe River and 0.20 fish/100 m2 in the North Fork Coeur d’Alene River. Densities of cutthroat trout ≥ 300 mm in both rivers were up 20 -45% from 2008 counts. Densities of mountain whitefish were 1.31 fish/100 m2 in the St. Joe River and 2.80 fish/100 m2 in the North Fork Coeur d’Alene River during 2009. Similar to cutthroat, both rivers showed higher densities than in 2008, and the overall trend is increasing in abundance of following the declines observed after the 1996 and 1997 flood events. A total of 9 rainbow trout were observed in the St. Joe River and 60 (0.04 fish/100 m2) were observed in the North Fork Coeur d’Alene River during 2009. No rainbow trout were observed upstream of the town of Calder in the St. Joe River. In the North Fork Coeur d’Alene River all the rainbow trout were observed only observed downstream in the reaches below Yellow Dog Creek. One bull trout was observed in the St. Joe River in 2009.
Authors: Ryan Hardy Regional Fisheries Biologist Jim Fredericks Regional Fisheries Manager
140
INTRODUCTION Past research found declines in the fishery were directly related to over harvest in the St.
Joe River and a combination of over harvest, habitat degradation and toxic mine wastes in the Coeur d’Alene River (Rankel 1971; Bowler 1974; Lewynsky 1986; Rabe and Sappington 1970; Mink et al. 1971). Efforts such as habitat improvements and fishing regulation reform were initiated early on to try and mitigate the causes for these declines in the fishery. As a result, cutthroat populations have increased significantly and are now widely renowned fisheries in Idaho.
Snorkel transects for monitoring fish abundance were established in the St. Joe River in
1969 and in the North Fork (NF) Coeur d’Alene River in 1973 (Rankel 1971; Bowler 1974). The long term trend data sets collected from these snorkel transects are very important in documenting how changes in fishing regulations, habitat and weather patterns influence trends in fish populations.
OBJECTIVE
1. Estimate salmonid density and trends in abundance in snorkeling transects in the St. Joe and NF Coeur d’Alene rivers.
STUDY SITES
St. Joe River
A total of 35 transects were snorkeled in the St. Joe River basin during 2009, which spans a total of 115 km of river (Figure 50). Coordinates and photographs as well as a history of site changes for the location of each of these transects are described in DuPont et al. 2009. The photos in DuPont et al. (2009) not only show a picture of transects, but also depict where snorkeling should stop and end and the approximate length of stream that should be snorkeled.
North Fork Coeur d’Alene River In the NF Coeur d’Alene River, 23 snorkel transects were located in the main river system
(85 river km), 13 were in the Little North Fork (LNF) Coeur d’Alene River (45 river km) and five were in Tepee Creek (8 river km). Some of the transect locations have been changed over the years as the river has shifted positions and pools have filled in (see DuPont et al. 2009). Forty-three transects were snorkeled in the Coeur d’Alene basin during 2009, which spans about 138 km of river (Figure 51).
METHODS
Field Work
Snorkeling was used to evaluate trends in fish abundance in the St. Joe and Coeur d’Alene rivers following standardized methods described by DuPont et al. (2009).

141
Transects on the NF Coeur d’Alene River were snorkeled August 4th-6th, and the St. Joe
was sampled August 10th-12th, which is consistent with previous years sampling dates.
Data Analysis
Fish counts for each transect were converted to density (fish/100 m2) to standardize the data and allow comparison within the watershed as well as to other watersheds. Average densities of each salmonid species (all sizes) and for cutthroat trout ≥ 300 mm were calculated for the entire St. Joe River and NF Coeur d’Alene River system as well as for different stream reaches within each watershed. The densities of these fishes were added to the long-term data set to evaluate their trends in abundance.
To evaluate whether densities of cutthroat trout differed between the stream reaches in
the St. Joe River and NF Coeur d’Alene River system we conducted an analysis of variance (ANOVA) on the density of fish in each of the transect sites. We used a p-value ≤ 0.10 to denote when a significant difference in density occurred between stream reaches. This value is often used to show significance when evaluating fish and wildlife populations for management purposes (Peterman 1990; Johnson 1999; Anderson et al. 2000). When an ANOVA showed that a significant difference (p ≤ 0.10) in cutthroat trout density occurred between the stream reaches we used Fisher’s Least-Significance-Difference Test to evaluate which stream reaches differed significantly. Fisher’s Least-Significance-Difference Test was chosen for this analysis as this test tends to maximize the power, which increases that ability to show statistically significant differences with low sample sizes (Milliken and Johnson 1992).
RESULTS
St. Joe River
A total of 848 cutthroat trout, 9 rainbow trout , and 1,320 mountain whitefish were counted (Table 44). One bull trout was also observed near the confluence of Gold Creek. Cutthroat trout were observed in 34 of the 35 transects we snorkeled. Densities of cutthroat trout (all size classes) at these transects ranged from 0.00 to 5.97 fish/100 m2 with an overall average of 0.84 fish/100 m2 (Tables 44 and 45). About 42% of the cutthroat trout observed were estimated to be ≥ 300mm in length (24% in 2008) and their overall density was calculated to be 0.35 fish/100 m2. Total densities of cutthroat trout show an increasing trend since they were first started in 1969 (Table 45; Figure 53).
ANOVA testing indicated significant differences (p value = 0.019) in density of cutthroat
trout (all size classes) between stream reaches in the St. Joe River (Figure 4). Fisher’s LSD test (Table 46) shows significantly higher densities of cutthroat trout upstream of Prospector Creek. ANOVA testing on only cutthroat trout ≥ 300 mm, similarly showed a significant difference (p value = 0.084) in densities between stream reaches (Figure 53). Fisher’s LSD test (Table 46) shows significantly higher densities of cutthroat trout ≥ 300 mm upstream of Prospector Creek.
Mountain whitefish were counted in 33 of the 35 transects snorkeled during 2009 and
were the most numerous fish observed (Table 44). The highest density of mountain whitefish (3.60 fish/100 m2) was observed in the reach between the Red Ives Creek and Ruby Creek

142
(Table 53). The overall mean density of mountain whitefish we observed in 2009 was 1.36 fish/100 m2.
As in 2008, a total of nine rainbow trout were counted during 2009. None of these counts
were of the rainbow trout were observed upstream of the town of the N.F. St. Joe (Table 54).
North Fork Coeur d’Alene River
A total of 1,341 cutthroat trout, 60 rainbow trout, 5 brook trout and 4,140 mountain whitefish were counted (Table 55). Cutthroat trout were observed in 38 of the 43 transects snorkeled. Densities of cutthroat trout (all size classes) in these transects ranged from 0.00 to 8.75 fish/100 m2 with an overall average of 0.90 fish/100 m2 (Tables 56 and 57). About 23% of the cutthroat trout observed were estimated to be ≥ 300 mm in length and their overall density was calculated to be 0.20 fish/100 m2 (Table 56). The overall cutthroat densities in the N.F. Coeur d’Alene River system are on the increase. The last three survey years have been the highest densities of cutthroat recorded since the surveys began in 1973 (Table 56; Figure 54).
ANOVA testing indicated no significant differences (p = 0.88 and 0.69) in density of
cutthroat trout (all size groups or ≥ 300 mm) between any of the stream reaches sampled in the NF Coeur d’Alene River system (Figure 55). As a result, no Fisher’s pair wise comparisons could be interpreted.
Mountain whitefish were observed in 16 snorkel transects in the NF Coeur d’Alene River
system in 2009 and densities ranged from 0.00 to 9.40 fish/100 m2 with a mean density of 2.80 fish/100 m2 (Table 52). The highest densities of mountain whitefish were observed in the lower NF Coeur d’Alene River, with few observed in the LNF Coeur d’Alene and none upstream of Tepee Creek (Table 52).
Rainbow trout were observed in 8 snorkel transects during 2009 and densities ranged
from 0.00 to 0.28 fish/100 m2 with a mean density of 0.04 fish/100 m2 (Table 53). All of the rainbow trout were observed in the most downstream reaches of the NF and LNF (Tables 54). Of the 60 rainbow trout observed, 12 (20%) were estimated to be ≥ 300 mm in length.
St. Joe River Versus the North Fork Coeur d’Alene River System The catch-and-release areas in both the St. Joe River and NF Coeur d’Alene River
systems have been snorkeled consistently since 1993 allowing direct year to year comparisons in density of cutthroat trout. However, since the entire basin has been catch-and-release since 2008, comparisons should now reflect drainage-wide differences in densities.
The average density of cutthroat trout (all size classes) in the NF Coeur d’Alene River
(0.90 fish/100 m2) was higher than we observed in the St. Joe River (0.84 fish/100 m2) during 2009. When statistically tested (T-test evaluation), the densities of cutthroat trout in the St. Joe were not significantly different (p = 0.320) than those found in the NF Coeur d’Alene. However, the mean density of cutthroat trout ≥ 300 mm observed in the St. Joe River (0.62 fish/100 m 2) transects was significantly higher (p = 0.008) than what was observed in the NF Coeur d’Alene River system (0.30 fish/ 100 m2) during 2009.

143
DISCUSSION
Cutthroat Trout
ST. JOE RIVER
Cutthroat trout densities in the St. Joe have increased steadily since snorkel counts were first initiated in 1969. Early research indicated the depressed cutthroat trout fishery was a result of over-fishing (Mallet 1967; Dunn 1968; Rankel 1971). Changes in fishing regulations over the past three decades in combination with habitat improvement programs throughout the basin have provided what is now one of Idaho’s premier trout fisheries.
Total densities of cutthroat trout across all size classes in the St. Joe River were 17%
lower this year compared to 2008. At the same time, however, densities of fish > 300 mm were 44% higher in when looking at the entire river on a spatial scale. The majority of the increase in larger fish occurred in the catch and release section of the river above the NF, with the highest increase in density (73%) occurring from Red Ives to Ruby Creek.
Wide fluctuations in density over the past three decades are difficult to interpret due to
the environmental and human variables involved. Implementation of catch-and-release rules for cutthroat in the drainage eliminates harvest mortality, which may make it easier in the future to related environmental factors such as flood events to changes in fish density.
Once cutthroat trout in the St. Joe River recovered from the floods of 1996, their densities
have remained relatively steady. Overall cutthroat trout densities from 1997 to 2009 on average are still below what was observed before the flood, whereas densities of cutthroat trout ≥ 300 mm have recovered very well. Cutthroat trout ≥ 300 mm represented 21-43% of all fish observed in the St. Joe River (above the North Fork) between 2004 and 2009, which is the highest we have ever recorded. The combination of mild winters and extending the catch-and-release reach of the river by approximately 20rkm, while maintaining a slot between 203 and 406 mm (8 and 16 in) on the remainder of the river, are thought to be responsible for such increases (DuPont et al. 2009).
NORTH FORK COEUR D’ALENE RIVER SYSTEM
As with the St. Joe system, cutthroat trout densities have increased since 1973. Much of this increase can likely be attributed to regulation changes and improved timber management policies throughout the basin. For a detailed breakdown of basin wide changes and how they correlate to changes in fish densities see DuPont et al. (2009).
Westslope cutthroat trout densities in the NF Coeur d’Alene increased by 6% from the
2008 counts. As with the St. Joe, the NF Coeur d’Alene also showed increases in larger size classes; yet unlike the Joe, one of the highest increases in densities (30%) was recorded in the previous limited harvest area located below Yellowdog Creek. It is difficult to fully attribute this increase due to the harvest restrictions placed in 2008 since the entire river did experience a somewhat similar change from last year. Large fluctuations in cutthroat trout densities are not uncommon in Idaho rivers and have even been documented in wilderness rivers (Selway and Middle Fork Salmon) where fishing pressure and habitat degradation are usually not issues (Dupont et al. 2009). Telemetry worked conducted by DuPont et al. (In Press) in the Coeur d’Alene River watershed showed that larger cutthroat trout migrate to thermal refuges during

144
summer months. Taking this into consideration, mean daily temperatures in the NF could and may have significantly affected accuracy of counts depending on the year.
Cutthroat densities in the LNF Coeur d’Alene have also shown notable increases since
first monitoring began. The LNF habitat is considered to be relatively poor (DuPont et al. 2008). Splash damming prior to 1930 (Strong and Webb 1970) seriously degraded the stream channel watershed. Despite the degraded nature of the LNF, the snorkel data do indicate the cutthroat trout population is improving. The density of cutthroat trout ≥ 300 mm also appears to be improving, but at a slower rate than the smaller fish.
Reasons for the increasing trend in densities in the NF Coeur d’Alene are wide ranging
and can include such factors as elimination of very high exploitation, habitat improvements, as well as a possible reduction in rainbow trout (competition). DuPont et al. 2009 showed that exploitation (including illegal harvest) on the NF Coeur d’Alene to be as high as 69% in 2006. Low numbers in 2006 in the limited harvest area were also attributed to relatively high densities (31%) of rainbow trout. The 2009 numbers may reflect the effect of essentially elimination of harvest as well as a possible shift to targeting rainbow in the lower river. Rainbow densities in 2009 were the lowest they have been since 1993.
ST. JOE RIVER VERSUS THE NORTH FORK COEUR D’ALENE RIVER SYSTEM
Overall, cutthroat trout densities in the NF Coeur d’Alene River were lower than we observed in the St. Joe River. However, densities in the NF Coeur d’Alene are approaching that of the St. Joe River. From 1993 to 1997 cutthroat trout densities were usually two to three times higher in the catch-and-release area of the St. Joe River than what was observed in the catch-and-release area of the NF Coeur d’Alene River. Including the entire St. Joe River would be a somewhat unequal comparison since much of the river below this section is reducing in trout habitat, and trend analysis for the entire St. Joe only dates back to 1993. Taking this into account, the comparison of mean density of the entire St. Joe to the entire NF Coeur d’Alene does show that there is no statistical difference (P(T≤t ) one-tail = 0.32) between the two rivers; while the St. Joe shows approximately double the density of trout > 300 mm.
Mountain Whitefish
Estimated densities of mountain whitefish in the NF Coeur d’Alene increased by 26%
from 2008. Since this fluctuation was observed across size groups, it is most likely a reflection of snorkel counter variance from year to year as well as a reflection on how these fish move in and out of counting locations depending on temperature and time of day as shown by DuPont et al. (In Press). Although we kept the general time of year similar, the latter two factors are difficult if not impossible to completely duplicate. Despite this variation, trends over time seem to track well with how other fisheries have recovered over time. As with cutthroat density estimates, it may be worthwhile factoring mean daily temperatures in the NF Coeur d’Alene when interpreting the accuracy of counts across years.
Mountain whitefish in the NF Coeur d’ Alene River have increased in abundance since
1973, though populations exhibit extreme highs and lows in density throughout the past three decades of monitoring. Many of the down years occur immediately after unusually cold winters (1979-1980; 1992-1993) or flood events (1996). Despite drops in density by 75% to 85%, the whitefish population typically rebounded within five years.

145
Our snorkel surveys showed that mountain whitefish densities remained fairly steady in the St. Joe River from 1969 until 1997, followed by a significant decline. In all likelihood, the decrease in mountain whitefish densities in 1997 was a response to flood events during 1996 and 1997. Since then, mountain whitefish densities have rebounded and are now about what was observed before the floods. Mild winters from 1998 to 2003 may have facilitated role in this rapid recovery (DuPont et al. 2009).
Snorkel surveys indicated that mountain whitefish densities in the NF Coeur d’Alene
River system were about 2.1 times higher than what was observed in the St. Joe River during 2009. Most whitefish in the in both systems were observed in the large, deep pools and runs in the more downstream transects.
Rainbow Trout
Rainbow trout densities are down 71% from 2008 counts in the NF Coeur d’ Alene River.
Rainbow trout stocking in the Idaho Panhandle’s rivers or streams (including the NF) ceased in 2002. Not surprising, a decline in the density of rainbow trout was observed in 2003. However, since 2003, the abundance of rainbow trout has remained relatively steady from a low level of natural reproduction in the system. DuPont et al. (2009) speculated that natural reproducing of rainbows exists in the NF downstream of Shoshone Creek and downstream of Laverne Creek in the LNF Coeur d’Alene River.
The current fishing regulations allow six rainbow trout of any size to be harvested from
the Coeur d’Alene River system. These regulations may be causing the rainbow trout population to be declining in abundance; however, it is also possible that rainbow were to some extent misidentified during surveys due in part to reduced visibility.
The rainbow trout population in the St. Joe River looks to be stabilized at an extremely
low level since stocking stopped in 2002. Few rainbows are observed in transects above the NF St. Joe River (none in 2009), which indicates that very little natural reproduction and overwinter survival is occurring upstream of the NF St. Joe River.
Bull Trout
Few bull trout have been observed while conducting surveys in the St. Joe River. In fact,
no more than four bull trout have been observed while conducting these snorkel surveys since 1977. In 2009, we observed one bull trout in the snorkel transect just below the confluence of Gold Creek. Because few bull trout are seen while conducting these snorkel surveys, it is best not to use these counts to speculate on trends in their abundance. For example, a record high number of bull trout redds were counted in the St. Joe watershed during 2007 (redd counts were initiated in 1992).
MANAGEMENT RECOMMENDATION
1. Continue monitoring trends of cutthroat trout abundance in the St. Joe River and NF Coeur d’Alene River through annual snorkel surveys.

146
Rainbow Largescale Northern SalmonidArea (m2) Density trout Number Density sucker pikeminnow density
Reach Transect snorkeled ≥300mm all sizes (No./100 m2) counted counted (No./100 m2) counted counted (No./100 m2)SJ01 3,128 12 14 0.45 0 27 0.86 13 9 0.01SJ02 2,485 7 18 0.72 0 210 8.45 180 225 0.09SJ03 2,888 20 30 1.04 0 65 2.25 1 14 0.03SJ04 980 7 9 0.92 0 4 0.41 0 0 0.01SJ05 3,731 20 44 1.18 0 20 0.54 0 12 0.02SJ06 6,050 6 19 0.31 0 9 0.15 5 25 0.00SJ07 3,728 13 21 0.56 0 17 0.46 0 8 0.01SJ08 2,602 4 20 0.77 0 4 0.15 0 10 0.01SJ09 3,192 17 38 1.19 0 9 0.28 0 31 0.01SJ10 5,241 24 36 0.69 0 50 0.95 0 15 0.02SJ11 2,552 14 36 1.41 0 12 0.47 0 0 0.02SJ12 2,126 13 29 1.36 0 14 0.66 0 18 0.02SJ13 2,761 15 36 1.30 0 16 0.58 0 16 0.02SJ14 2,033 2 28 1.38 0 18 0.89 0 2 0.02SJ15 1,762 2 32 1.82 0 5 0.28 0 1 0.02SJ16 1,019 12 60 5.89 0 2 0.20 0 0 0.06SJ17 1,960 8 30 1.53 0 4 0.20 0 5 0.02SJ18 871 21 52 5.97 0 45 5.17 0 0 0.11SJ19 941 4 20 2.13 0 1 0.11 0 0 0.02SJ20 1,597 8 10 0.63 0 3 0.19 0 0 0.01SJ21 709 10 24 3.39 0 30 4.23 0 2 0.08SJ22 1,428 47 53 3.71 0 30 2.10 0 15 0.06SJ23 838 3 4 0.48 0 0 0.00 0 0 0.00SJ24 980 13 29 2.96 0 6 0.61 0 0 0.04SJ25 762 12 41 5.38 0 10 1.31 0 0 0.07SJ26 1,602 0 0 0.00 0 0 0.00 0 0 0.00SJ27 1,155 19 38 3.29 0 200 17.32 0 0 0.21SJ28 750 4 9 1.20 0 3 0.40 0 0 0.02SJ29 5,950 1 1 0.02 3 25 0.42 120 20 0.00SJ30 7,500 3 3 0.04 0 32 0.43 155 20 0.00SJ31 6,750 4 16 0.24 0 140 2.07 130 2 0.02SJ32 8,100 1 4 0.05 0 50 0.62 70 5 0.01SJ33 6,125 1 4 0.07 1 4 0.07 0 0 0.00SJ34 2,050 6 22 1.07 4 55 2.68 30 0 0.04SJ35 4,518 5 18 0.40 1 200 4.43 210 100 0.05
Total 35 100,861 358 848 0.84 9 1,320 1.31 914 555 2.16
Red
Ives
to
Ruby
Cre
ekCa
lder t
o N.
F. S
t. Jo
eCutthroat trout Mountain whitefish
Number counted
N.F.
St J
oe R
iver
to P
rosp
ecto
r Cr.
Pros
pect
or C
reek
to R
ed Iv
es C
reek
Table 44. Number and density of fishes observed while snorkeling transects in the St. Joe River, Idaho, during August 10-12, 2009.

147
Table 45. Average densities (fish/100 m2) of cutthroat trout (all sizes and only those ≥ 300 mm) count ed by reach during snorkel evaluations from 1969 to 2009 in the St. Joe River, Idaho.
All sizes of cutthroat trout
Cutthroat trout ≥ 300 mm
1976 - transects 1-12 were not counted.
1977 - transects 1-4 were not counted.
2001 - transects 29-35 were in different locations than other years.
Reach 1969 1970 1971 1972 1973 1974 1975 1976 1977 1979 1980 1982 1989 1990 1993 1994 1995 1996 1997 1998 2000 2001 2002 2003 2004 2005 2007 2008 2009Calder to North Fork St. Joe -- -- -- -- -- -- -- -- -- -- -- -- -- -- 0.07 0.23 0.16 0.14 0.15 0.09 -- 0.22 0.11 0.11 -- -- 0.13 0.21 0.17N.F. St. Joe to Prospector Cr. 0.01 0.00 0.07 0.04 0.01 0.11 0.08 -- 0.04 0.08 0.12 0.03 0.18 0.22 0.47 0.33 0.79 0.33 0.18 0.12 0.46 0.52 0.52 0.80 0.50 0.95 0.69 0.94 0.67Prospector Cr. to Red Ives Cr. 0.25 0.31 0.58 0.59 0.76 1.40 1.53 3.59 1.72 1.63 1.50 2.93 2.44 2.79 2.13 1.66 2.56 2.42 2.79 1.05 1.11 1.38 1.46 2.01 1.76 2.15 1.48 2.04 1.64Red Ives Cr. to Ruby Cr. 1.38 1.39 2.07 2.63 2.55 5.01 6.12 1.89 4.62 3.14 1.46 3.31 2.41 4.05 1.17 1.39 2.58 2.57 1.13 1.44 1.06 1.19 0.93 1.76 2.03 1.22 2.33 1.80 1.99All transects - entire river -- -- -- -- -- -- -- -- -- -- -- -- -- -- 0.79 0.76 1.19 1.06 1.09 0.50 -- 0.80 0.64 0.90 -- -- 0.82 1.02 0.84N.F. St. Joe to Ruby Creek 0.27 0.29 0.52 0.58 0.63 1.23 1.40 3.10 1.60 1.11 0.88 1.68 1.43 1.82 1.30 1.18 1.99 1.77 1.74 0.79 0.88 1.02 1.00 1.51 1.29 1.61 1.28 1.59 1.30
Reach 1969 1970 1971 1972 1973 1974 1975 1976 1977 1979 1980 1982 1989 1990 1993 1994 1995 1996 1997 1998 2000 2001 2002 2003 2004 2005 2007 2008 2009Calder to North Fork St. Joe -- -- -- -- -- -- -- -- -- -- -- -- -- -- 0.02 0.05 0.02 0.03 0.00 0.01 -- 0.02 0.00 0.02 -- -- 0.09 0.11 0.05N.F. St. Joe to Prospector Cr. 0.01 0.00 0.00 0.00 0.00 0.00 0.00 -- 0.00 0.00 0.01 0.00 0.02 0.09 0.08 0.02 0.05 0.07 0.01 0.01 0.12 0.04 0.07 0.17 0.20 0.29 0.27 0.24 0.37Prospector Cr. to Red Ives Cr. 0.02 0.02 0.02 0.00 0.10 0.00 0.00 0.00 0.00 0.07 0.12 0.23 0.44 0.95 0.69 0.46 0.40 0.56 0.16 0.08 0.24 0.20 0.30 0.20 0.68 0.77 0.49 0.39 0.65Red Ives Cr. to Ruby Cr. 0.12 0.11 0.00 0.00 0.17 0.00 0.00 0.00 0.00 0.17 0.47 0.40 0.81 0.88 0.72 0.47 0.70 0.76 0.13 0.26 0.18 0.11 0.24 0.41 0.95 0.27 1.15 0.48 0.84All transects - entire river -- -- -- -- -- -- -- -- -- -- -- -- -- -- 0.26 0.20 0.19 0.25 0.06 0.05 -- 0.10 0.12 0.13 -- -- 0.32 0.25 0.35N.F. St. Joe to Ruby Creek 0.03 0.02 0.01 0.00 0.06 0.00 0.00 0.00 0.00 0.05 0.11 0.15 0.30 0.57 0.43 0.31 0.33 0.43 0.11 0.08 0.19 0.13 0.19 0.21 0.52 0.54 0.47 0.34 0.56

148
Table 46. Fishers Least-Significance-Difference Test matrices showing pair wise comparison probabilities of cutthroat trout densities (all sizes) between four stream reaches in the St. Joe River, Idaho, during 2009. Shaded cells indicate which stream reaches had significantly different (p ≤ 0.10) cutthroat trout densities.
All sizes Calder. N.F. St. Joe Prospector Red Ives
Calder 1
N.F. St. Joe 0.546 1
Prospector 0.006 0.034 1
Red Ives 0.022 0.076 0.992 1
≥ 300 mm
Calder. N.F. St. Joe Prospector Red Ives
Calder 1.000
N.F. St. Joe 0.331 1.000
Prospector 0.019 0.196 1
Red Ives 0.035 0.220 0.852 1

149
Table 47. Average density (fish/100 m2) of mountain whitefish counted by reach during snorkel surveys from 1969 to 2009 in the St. Joe River, Idaho.
1976 -transects SJ01-SJ12 were not snorkeled.
1977 - transects SJ01-SJ04 were not snorkeled.
1977 - transects SJ05-SJ16 were only evaluated for presence/absence.
1982 - transects SJ01-SJ25 were only evaluated for presence/absence.
2001 - transect locations differed this year from other years.
Table 48. Average density (fish/100 m2) of rainbow trout counted by reach during snorkel evaluations from 1969 to 2009 in the St. Joe River, Idaho.
1976 - transects SJ01-SJ12 were not snorkeled.
1977 - transects SJ01-SJ04 were not snorkeled.
2001 - transect locations differed this year from other years.
Reach 1969 1970 1971 1972 1973 1974 1975 1976 1977 1979 1980 1982 1989 1990 1993 1994 1995 1996 1997 1998 2000 2001 2002 2003 2004 2005 2007 2008 2009Calder to N.F. St. Joe -- -- -- -- -- -- -- -- -- -- -- -- -- -- 0.60 0.18 0.34 0.88 0.44 0.10 -- 1.25 0.33 0.80 -- -- 0.95 0.96 1.23N.F. St. Joe to Prospector Cr. 0.86 0.90 0.98 0.24 1.09 0.95 1.08 -- -- 1.09 0.77 -- 0.70 1.13 0.40 2.12 1.29 1.03 0.27 1.39 0.51 0.33 0.75 2.38 1.11 1.83 1.33 1.30 1.53Prospector Cr. to Red Ives Cr. 1.24 1.16 1.12 0.82 3.72 1.33 0.97 0.71 0.23 1.69 1.20 -- 2.17 2.01 2.11 0.65 1.67 1.02 0.47 0.80 0.55 1.22 1.22 1.87 1.59 1.15 2.34 1.35 0.79Red Ives Cr. to Ruby Cr. 1.83 1.32 1.89 2.26 1.39 2.28 2.45 1.14 1.56 2.79 1.27 0.94 1.32 2.22 0.66 1.03 1.73 1.60 0.35 0.38 0.47 0.56 0.37 1.12 0.99 0.93 2.66 1.83 3.60Average for all sites -- -- -- -- -- -- -- -- -- -- -- -- -- -- 0.95 0.75 1.03 1.01 0.41 0.60 -- 0.92 0.68 1.47 -- -- 1.59 1.20 1.31NF St Joe to Ruby Creek 1.14 1.06 1.14 0.73 2.29 1.27 1.19 0.84 0.34 1.54 1.01 0.11 1.42 1.65 1.20 1.19 1.56 1.11 0.39 0.94 0.53 0.79 0.92 1.98 1.33 1.37 2.01 1.38 1.36
Reach 1969 1970 1971 1972 1973 1974 1975 1976 1977 1979 1980 1982 1989 1990 1993 1994 1995 1996 1997 1998 2000 2001 2002 2003 2004 2005 2007 2008 2009Calder to N.F. St. Joe -- -- -- -- -- -- -- -- -- -- -- -- -- -- 0.14 0.10 0.21 0.20 0.03 0.15 -- 0.23 0.04 0.03 -- -- 0.02 0.02 0.02N.F. St. Joe to Prospector Cr. 0.07 0.13 0.25 0.25 0.16 0.44 0.86 -- 0.01 0.14 0.10 0.18 0.28 0.43 0.15 0.10 0.07 0.37 0.06 0.46 0.00 0.00 0.01 0.00 0.01 0.00 0.00 0.00 0.00Prospector Cr. to Red Ives Cr. 0.25 0.94 0.82 0.05 0.09 0.18 0.47 0.00 0.04 0.04 0.27 0.01 0.00 0.10 0.01 0.05 0.01 0.03 0.00 0.05 0.00 0.00 0.00 0.00 0.00 0.01 0.01 0.00 0.00Red Ives Cr. to Ruby Cr. 0.11 0.41 0.04 0.01 0.00 0.00 0.00 0.00 0.00 0.00 0.00 0.00 0.00 0.00 0.01 0.00 0.00 0.00 0.00 0.00 0.00 0.00 0.00 0.00 0.00 0.00 0.00 0.00 0.00Average for all sites -- -- -- -- -- -- -- -- -- -- -- -- -- -- 0.10 0.08 0.11 0.17 0.02 0.16 0.00 0.06 0.02 0.01 -- -- 0.01 0.01 0.01NF St Joe to Ruby Creek 0.16 0.52 0.48 0.14 0.11 0.27 0.59 0.00 0.02 0.08 0.16 0.09 0.12 0.23 0.07 0.06 0.03 0.14 0.02 0.17 0.00 0.00 0.00 0.00 0.00 0.01 0.01 0.00 0.00

150
Table 49. Number and density (fish/100 m2) of fishes observed while snorkeling transects in the North Fork Coeur d’Alene River drainage, Idaho, during August 5-7, 2009.
Largescale Northern Brook Sal monid
Density Density Density Sucker Pikeminno Trout Density
Reach Transect Area (m2)<300mm >300mm
Total(No./100
m2) Total(No./100
m2) Total(No./100
m2) Total Total Total(No./100
m2)NF1 4,480 5 0 5 0.11 8 0.18 200 4.46 0 90 0 0.05
NF1slough 1,200 0 0 0 0.00 1 0.08 20 1.67 0 0 0 0.02NF2 9,540 7 0 7 0.07 1 0.01 450 4.72 0 15 0 0.05NF3 10,188 53 15 53 0.52 16 0.16 425 4.17 0 50 0 0.05NF4 7,370 44 7 44 0.60 14 0.19 600 8.14 212 900 0 0.09NF5 5,787 55 19 55 0.95 16 0.28 350 6.05 122 850 0 0.07NF6 7,124 30 2 30 0.42 2 0.03 235 3.30 10 0 0 0.04NF7 6,384 84 15 84 1.32 0 0.00 600 9.40 600 150 0 0.11NF8 2,570 225 37 225 8.75 2 0.08 163 6.34 0 0 0 0.15NF9 8,400 6 2 8 0.10 0 0.00 7 0.08 0 0 0 0.00
NF10 5,506 125 44 125 2.27 0 0.00 315 5.72 0 0 0 0.08NF11 9,048 18 7 18 0.20 0 0.00 0 0.00 0 0 0 0.00NF12 5,315 9 1 10 0.19 0 0.00 0 0.00 0 0 0 0.00NF13 4,813 1 2 3 0.06 0 0.00 15 0.31 0 0 0 0.00NF14 3,510 110 14 110 3.13 0 0.00 115 3.28 0 0 0 0.06NF15 4,381 81 7 81 1.85 0 0.00 345 7.88 0 0 0 0.10NF16 3,591 9 0 9 0.25 0 0.00 0 0.00 0 0 0 0.00NF17 10,382 81 14 95 0.92 0 0.00 254 2.45 0 0 0 0.03NF18 1,674 34 25 59 3.52 0 0.00 45 2.69 0 0 0 0.06NF19 611 32 2 32 5.24 0 0.00 0 0.00 0 0 0 0.05NF20 1,150 4 3 7 0.61 0 0.00 0 0.00 0 0 0 0.01NF21 871 14 6 14 1.61 0 0.00 0 0.00 0 0 0 0.02NF22 1,204 5 15 20 1.66 0 0.00 0 0.00 0 0 0 0.02NF23 531 0 0 0 0.00 0 0.00 0 0.00 0 0 0 0.00TP01 1,486 19 4 19 1.28 0 0.00 0 0.00 0 0 0 0.01TP02 4,568 3 1 4 0.09 0 0.00 0 0.00 0 0 0 0.00TP03 1,310 13 3 16 1.22 0 0.00 0 0.00 0 0 0 0.01TP04 1,425 6 10 16 1.12 0 0.00 0 0.00 0 0 0 0.01TP05 1,801 13 5 18 1.00 0 0.00 1 0.06 0 0 0 0.01TPR1 897 5 3 8 0.89 0 0.00 0 0.00 0 0 0 0.01TPR2 706 0 2 2 0.28 0 0.00 0 0.00 0 0 0 0.00
Mountain Whitefish
Teep
ee C
reek
Rainbow Trout
Low
er N
orth
For
k U
pper
Nor
th F
ork
Number countedCutthroat Trout

151
Table 49. Continued.
Largescale Northern Brook Sal monid
Density Density Density Sucker Pikeminno Trout Density
Reach Transect Area (m2)<300mm >300mm
Total(No./100
m2) Total(No./100
m2) Total(No./100
m2) Total Total Total(No./100
m2)LNF1 1,300 1 0 1 0.08 0 0.00 0 0.00 0 0 0 0.00LNF2 3,081 23 7 23 0.75 0 0.00 0 0.00 0 0 0 0.01LNF3 3,409 0 0 0 0.00 0 0.00 0 0.00 0 0 0 0.00LNF4 463 39 3 39 8.43 0 0.00 0 0.00 0 0 4 0.09LNF5 1,990 2 2 4 0.20 0 0.00 0 0.00 0 0 0 0.00LNF6 1,786 9 2 9 0.50 0 0.00 0 0.00 0 0 0 0.01LNF7 1,364 7 7 14 1.03 0 0.00 0 0.00 0 0 0 0.01LNF8 2,983 40 18 40 1.34 0 0.00 0 0.00 0 0 0 0.01LNF9 1,001 0 0 0 0.00 0 0.00 0 0.00 0 0 0 0.00
LNF10 1,306 15 2 15 1.15 0 0.00 0 0.00 0 0 1 0.01LNF11 1,461 6 4 10 0.68 0 0.00 0 0.00 0 0 0 0.01LNF12 920 0 0 0 0.00 0 0.00 0 0.00 0 0 0 0.00LNF13 630 9 0 9 1.43 0 0.00 0 0.00 0 0 0 0.01
TOTALS 149,513 1,242 310 1,341 0.90 60 0.04 4140 2.77 944 2055 5 3.71
Low
er L
ittle
Nor
th
Fork
U
pper
Litt
le
Nor
th F
ork
Cutthroat Trout Rainbow Trout Mountain WhitefishNumber counted

152
Table 50. Mean density (fish/100 m2) of cutthroat trout (all sizes and only those ≥ 300 mm) counted in reaches of the North Fork Coeur d’Alene River (N.F. Cd’A), Little North Fork Coeur d’Alene River (L.N.F. Cd’A), and Tepee Creek, Idaho, during snorkel evaluations from 1973 to 2009.
All sizes of cutthroat trout River section 1973 1980 1981 1987 1988 1991 1993 1994 1995 1996 1997 1998 2000 2001 2002 2003 2004 2005 2006 2007 2008 2009
N.F. Cd'A - S. F. Cd'A to Prichard Cr. 0.06 0.02 0.02 -- 0.05 0.18 0.56 0.31 0.47 0.51 0.35 0.32 0.41 0.53 0.28 0.41 0.60 0.65 0.49 0.92 1.01 0.92N.F. Cd'A - Prichard Cr to Yellowdog Cr. 0.05 0.00 0.02 -- 0.02 0.14 0.08 0.28 0.19 0.06 0.44 0.41 0.13 0.51 0.49 0.30 0.33 0.66 0.67 0.58 0.46 0.50N.F. Cd'A - Yellowdog Cr to Tepee Cr. 0.24 0.31 0.28 1.05 1.10 1.18 0.35 1.70 1.57 1.71 1.70 0.63 0.63 1.74 0.54 0.78 0.88 1.38 1.71 1.48 1.23 1.50N.F. Cd'A - Tepee Cr. to Jordan Cr. 1.48 0.68 0.74 2.34 0.46 0.11 0.27 1.31 0.46 1.17 1.87 1.18 1.49 1.02 2.40 1.22 1.27 1.78 2.92 4.12 1.56 1.67L.N.F. Cda - Mouth to Laverne Cr. 0.33 0.04 0.02 -- 0.10 0.09 0.18 0.03 0.04 0.12 0.22 0.39 0.36 0.28 0.13 0.30 0.22 0.21 0.14 0.53 0.59 0.79L.N.F. Cda - Laverne Cr. to Deception Cr. 0.79 1.03 1.95 -- 0.90 0.66 0.03 0.47 0.22 0.90 0.00 0.65 0.79 0.12 0.98 0.69 0.97 1.35 0.56 2.26 1.07 0.64Tepee Creek 0.00 0.14 0.43 0.24 0.12 0.24 0.19 0.12 0.13 0.02 0.45 1.24 0.25 0.24 0.84 0.44 0.85 0.54 1.00 1.14 0.53 0.69Entire N.F. Cd'A River 0.13 0.10 0.11 -- 0.33 0.32 0.35 0.54 0.53 0.63 0.69 0.44 0.38 0.76 0.43 0.47 0.58 0.82 0.86 1.05 0.89 0.95Entire L.N.F. Cd'A River 0.38 0.15 0.24 -- 0.27 0.20 0.15 0.13 0.09 0.35 0.17 0.45 0.45 0.25 0.31 0.39 0.44 0.56 0.27 1.06 0.72 0.76All Transects 0.20 0.11 0.14 -- 0.31 0.30 0.31 0.43 0.42 0.50 0.57 0.49 0.38 0.61 0.44 0.46 0.58 0.76 0.800 1.06 0.84 0.90Limited harvest areas * 0.10 0.02 0.02 -- 0.04 0.15 0.32 0.25 0.31 0.28 0.35 0.36 0.28 0.46 0.29 0.36 0.45 0.59 0.51 0.76 0.78 0.77Catch and release areas 0.51 0.41 0.53 1.09 0.81 0.76 0.25 0.94 0.72 0.90 1.08 0.89 0.65 1.05 0.89 0.73 0.92 1.23 1.56 1.75 1.03 1.22Tepee Creek Rehab -- -- -- -- -- -- -- -- -- -- -- -- -- -- 0.87 0.00 1.09 0.48 0.55 0.36 0.29 0.62
* Limited harvest areas for WCT changed to full catch and release in 2008.
Cutthroat trout ≥ 300 mm River section 1973 1980 1981 1987 1988 1991 1993 1994 1995 1996 1997 1998 2000 2001 2002 2003 2004 2005 2006 2007 2008 2009
N.F. Cd'A - S. F. Cd'A to Prichard Cr. 0.00 0.02 0.01 -- 0.01 0.01 0.08 0.01 0.01 0.04 0.00 0.00 0.01 0.03 0.01 0.10 0.13 0.13 0.07 0.20 0.13 0.17N.F. Cd'A - Prichard Cr to Yellowdog Cr. 0.00 0.00 0.00 -- 0.01 0.03 0.02 0.04 0.01 0.01 0.01 0.03 0.01 0.06 0.04 0.09 0.09 0.24 0.21 0.19 0.18 0.17N.F. Cd'A - Yellowdog Cr to Tepee Cr. 0.02 0.12 0.04 0.12 0.08 0.13 0.04 0.31 0.07 0.14 0.11 0.02 0.07 0.07 0.12 0.21 0.25 0.52 0.36 0.32 0.22 0.25N.F. Cd'A - Tepee Cr. to Jordan Cr. 0.07 0.35 0.20 1.25 0.23 0.06 0.23 0.37 0.29 0.30 0.21 0.18 0.38 0.09 0.44 0.24 0.43 0.69 0.74 0.81 0.54 0.60L.N.F. Cda - Mouth to Laverne Cr. 0.02 0.02 0.00 -- 0.05 0.05 0.06 0.00 0.00 0.01 0.00 0.00 0.04 0.00 0.00 0.05 0.04 0.08 0.03 0.06 0.08 0.24L.N.F. Cda - Laverne Cr. to Deception Cr. 0.18 0.37 0.18 -- 0.09 0.00 0.03 0.00 0.00 0.05 0.00 0.00 0.06 0.00 0.11 0.15 0.18 0.16 0.07 0.22 0.04 0.11Tepee Creek 0.00 0.03 0.43 0.20 0.06 0.18 0.08 0.09 0.09 0.00 0.08 0.08 0.05 0.04 0.22 0.16 0.34 0.05 0.29 0.30 0.32 0.22Entire N.F. Cd'A River 0.01 0.05 0.02 -- 0.04 0.04 0.06 0.08 0.03 0.07 0.03 0.02 0.04 0.05 0.05 0.12 0.15 0.24 0.19 0.24 0.17 0.20Entire L.N.F. Cd'A River 0.03 0.05 0.02 -- 0.06 0.04 0.06 0.00 0.00 0.02 0.00 0.00 0.04 0.00 0.02 0.07 0.08 0.10 0.04 0.11 0.07 0.21All Transects 0.01 0.05 0.04 -- 0.05 0.04 0.06 0.06 0.03 0.06 0.03 0.02 0.04 0.03 0.06 0.12 0.15 0.21 0.18 0.23 0.17 0.21Limited harvest areas * 0.00 0.01 0.01 -- 0.01 0.02 0.06 0.02 0.01 0.02 0.00 0.01 0.02 0.03 0.01 0.09 0.10 0.15 0.11 0.18 0.14 0.18Catch and release areas 0.04 0.17 0.15 0.33 0.10 0.11 0.07 0.20 0.10 0.12 0.10 0.06 0.11 0.06 0.18 0.19 0.28 0.37 0.36 0.35 0.27 0.26Tepee Creek Rehab -- -- -- -- -- -- -- -- -- -- -- -- -- -- 0.05 0.00 0.04 0.04 0.19 0.14 0.10 0.31
* Limited harvest areas for WCT changed to full catch and release in 2008.

153
Table 51. Mean density (fish/100 m2) of all size classes of mountain whitefish counted in reaches of the North Fork Coeur d’Alene River (N.F. Cd’A), Little North Fork Coeur d’Alene River (L.N.F. Cd’A), and Tepee Creek, Idaho, during snorkel evaluations from 1973 to 2009.
River section 1973 1980 1981 1987 1988 1991 19935 1994 1995 1996 1997 1998 2000 2001 2002 2003 2004 2005 2006 2007 2008 2009
N.F. Cd'A - S. F. Cd'A to Prichard Cr. 0.75 1.47 0.18 -- 3.09 6.59 0.45 2.42 2.53 5.54 0.69 1.05 7.38 4.36 2.91 6.46 4.90 5.49 6.05 6.49 3.67 5.57N.F. Cd'A - Prichard Cr to Yellowdog Cr. 0.46 0.02 0.12 -- 0.03 1.25 0.29 0.65 0.11 1.13 0.56 0.58 0.23 0.20 0.32 0.83 0.73 2.04 1.48 1.11 1.13 1.02N.F. Cd'A - Yellowdog Cr to Tepee Cr. 3.19 1.18 1.71 1.34 1.09 5.52 1.07 2.60 1.65 5.05 1.45 3.57 2.90 4.00 2.13 2.98 3.16 4.43 4.98 5.56 3.70 3.22N.F. Cd'A - Tepee Cr. to Jordan Cr. 0.00 0.00 0.00 0.00 0.11 0.00 0.00 1.33 2.41 1.12 0.00 2.80 0.13 0.97 0.65 0.14 0.60 0.00 0.09 0.00 0.00 0.00L.N.F. Cda - Mouth to Laverne Cr. 0.59 0.01 0.12 -- 0.03 0 0 0 0 1.88 0 0.02 0 0.04 0.03 0.04 0.01 0.19 0.01 0 0.02011 0L.N.F. Cda - Laverne Cr. to Deception Cr. 0.00 0.00 0.00 -- 0.00 0.00 0.00 0.00 0.00 0.00 0.00 0.00 0.00 0.00 0.00 0.00 0.00 0.00 0.00 0.00 0.00 0.00Tepee Creek 0.00 0.35 0.00 0.00 0.00 0.00 0.06 0.00 0.00 2.68 0.00 0.20 0.36 1.09 0.91 0.63 1.04 0.43 1.41 1.42 0.00 0.01Entire N.F. Cd'A River 1.00 0.80 0.39 -- 1.21 4.07 0.46 1.86 1.70 3.52 0.72 1.35 3.46 3.43 2.33 3.95 3.06 4.21 4.26 4.55 2.76 3.58Entire L.N.F. Cd'A River 0.52 0.01 0.11 -- 0.02 0.00 0.00 0.00 0.00 1.34 0.00 0.02 0.00 0.03 0.02 0.03 0.01 0.13 0.01 0.00 0.01 0.00All Transects 0.87 0.65 0.33 -- 0.96 3.18 0.37 1.35 1.26 3.03 0.52 1.00 2.78 2.49 1.85 3.18 2.52 3.40 3.56 3.83 2.21 2.80Limited harvest areas 0.60 0.63 0.15 -- 1.12 3.29 0.32 1.42 1.37 3.28 0.51 0.70 3.21 2.59 2.02 3.70 2.74 3.75 3.81 3.99 2.41 3.25Catch and release areas 1.77 0.71 0.95 0.80 0.64 2.86 0.52 1.14 0.97 2.61 0.53 1.93 1.53 2.20 1.35 1.73 1.93 2.43 2.91 3.45 1.62 1.73Tepee Creek Rehab -- -- -- -- -- -- -- -- -- -- -- -- -- -- 0.00 0.00 0.00 0.00 0.00 0.00 0.00 0.00
Table 52. Mean density (fish/100 m2) of all size classes of rainbow trout counted in reaches of the North Fork Coeur d’Alene River (N.F. Cd’A), Little North Fork Coeur d’Alene River (L.N.F. Cd’A), and Tepee Creek, Idaho, during snorkel evaluations from 1973 to 2009.
River section 1973 1980 1981 1987 1988 1991 19935 1994 1995 1996 1997 1998 2000 2001 2002 2003 2004 2005 2006 2007 2008 2009
N.F. Cd'A - S. F. Cd'A to Prichard Cr. 0.35 0.45 0.59 -- 3.15 0.22 0.04 0.16 0.61 0.50 0.75 0.42 1.06 0.76 0.52 0.46 0.48 0.39 0.39 0.47 0.26 0.11N.F. Cd'A - Prichard Cr to Yellowdog Cr. 0.48 0.12 0.46 -- 0.14 0.20 0.01 0.08 0.14 0.02 0.12 0.06 0.03 0.11 0.00 0.01 0.08 0.06 0.09 0.21 0.01 0.00N.F. Cd'A - Yellowdog Cr to Tepee Cr. 0.03 0.21 0.34 0.11 0.03 0.04 0.00 0.00 0.02 0.25 0.01 0.01 0.01 0.14 0.00 0.00 0.00 0.00 0.00 0.00 0.00 0.00N.F. Cd'A - Tepee Cr. to Jordan Cr. 0.00 0.00 0.04 0.00 0.00 0.01 0.00 0.00 0.00 0.00 0.00 0.00 0.00 0.00 0.00 0.00 0.00 0.00 0.00 0.00 0.00 0.00L.N.F. Cda - Mouth to Laverne Cr. 1.39 0.55 1.25 -- 1.6 0.99 0.22 0.45 0.02 0.09 0.24 0.54 0.35 0.18 0.46 0.27 0.09 0.17 0.12 0.08 0.30 0.00L.N.F. Cda - Laverne Cr. to Burnt Cabin Cr 0.12 0.06 0.18 -- 0.05 0.03 0.00 0.00 0.00 0.62 0.00 0.00 0.00 0.00 0.13 0.02 0.02 0.00 0.00 0.00 0.00 0.00Tepee Creek 0.00 0.00 0.00 0.00 0.00 0.00 0.00 0.00 0.00 0.00 0.00 0.00 0.00 0.00 0.00 0.00 0.00 0.00 0.00 0.00 0.00 0.00Entire N.F. Cd'A River 0.33 0.26 0.47 -- 1.00 0.17 0.02 0.11 0.37 0.25 0.40 0.24 0.43 0.50 0.34 0.23 0.25 0.22 0.22 0.28 0.14 0.05Entire L.N.F. Cd'A River 1.25 0.49 1.13 -- 1.27 0.80 0.18 0.34 0.02 0.24 0.19 0.43 0.28 0.15 0.39 0.21 0.07 0.11 0.08 0.05 0.22 0.00All Transects 0.46 0.29 0.56 -- 0.99 0.27 0.04 0.14 0.28 0.22 0.32 0.27 0.38 0.39 0.33 0.21 0.21 0.19 0.19 0.24 0.14 0.04Limited harvest areas 0.59 0.34 0.66 -- 1.49 0.35 0.05 0.19 0.37 0.25 0.46 0.35 0.51 0.51 0.43 0.29 0.29 0.27 0.26 0.34 0.19 0.06Catch and release areas 0.03 0.12 0.21 0.06 0.02 0.03 0.00 0.00 0.01 0.16 0.00 0.00 0.00 0.06 0.02 0.00 0.00 0.00 0.00 0.00 0.00 0.00Tepee Creek Rehab -- -- -- -- -- -- -- -- -- -- -- -- -- -- 0.00 0.00 0.00 0.00 0.00 0.00 0.00 0.00

154
Figure 50. Location of 35 transects that were snorkeled on the St. Joe River, Idaho, during August 12-14, 2009.
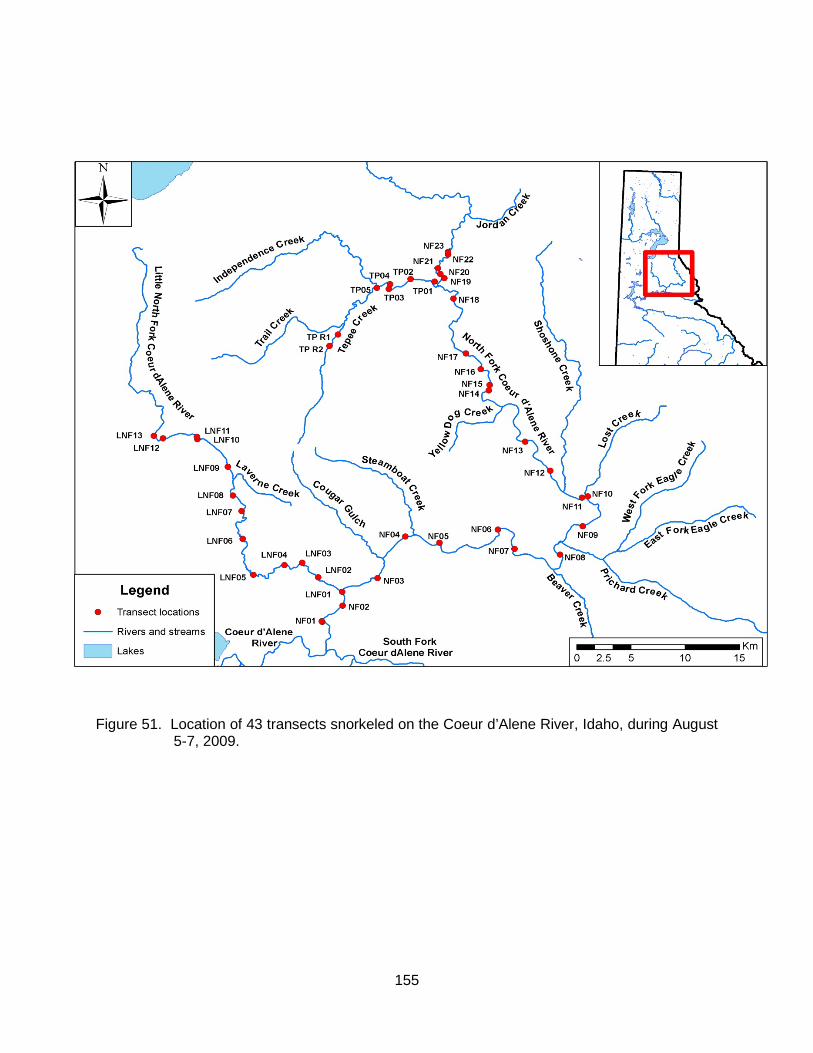
155
Figure 51. Location of 43 transects snorkeled on the Coeur d’Alene River, Idaho, during August 5-7, 2009.

156
Figure 52. Average density (fish/100 m2) of all size classes of cutthroat trout and cutthroat trout ≥ 300 mm observed while snorkeling the St. Joe River, Idaho, between the NF St. Joe River and Ruby Creek from 1969 to 2009. Arrows signify when significant changes occurred in cutthroat trout fishing regulations. Refer to Table 48 to see how regulations changed in these years.
0.00
0.20
0.40
0.60
0.80
1.00
1.20
1.40
1.60
1.80
2.00
1969
1970
1971
1972
1973
1974
1975
1977
1979
1980
1982
1989
1990
1993
1994
1995
1996
1997
1998
2000
2001
2002
2003
2004
2005
2007
2008
2009
fish/
100
m2
St. Joe River (NF to Ruby Crk)All Size Classes
Fish ≥ 300 mm

157
Figure 53. Mean cutthroat trout density and 90% confidence intervals (all sizes and only those ≥ 300 mm) determined from snorkeling four different reaches in the St. Joe River, Idaho, during 2009.
0.0
0.5
1.0
1.5
2.0
2.5
3.0
3.5
4.0
4.5
Calder N.F. St. Joe Prospector Red Ives
fish/
100
m2
Cutthroat trout (all sizes)
0
0.2
0.4
0.6
0.8
1
1.2
1.4
1.6
Calder N.F. St. Joe Prospector Red Ives
fish/
100
m2
Cutthroat trout (≥ 300 mm)

158
Figure 54. Average density (fish/100 m2) of all size classes of cutthroat trout and cutthroat trout
≥ 300 mm observed while snorkeling transects in the NF Coeur d’Alene River (N.F. Cd’A) and Little North Fork Coeur d’Alene River (L.N.F. Cd’A), from 1973 to 2009. Arrows signify when significant changes occurred in the cutthroat trout fishing regulations. Refer to Table 48 to see how regulations changed in these years.
0
0.2
0.4
0.6
0.8
1
1.219
73
1980
1981
1988
1991
1993
1994
1995
1996
1997
1998
2000
2001
2002
2003
2004
2005
2006
2007
2008
2009
fish/
100
m2
Cutthroat trout - all sizes
Entire N.F. Cd'A River Entire L.N.F. Cd'A River
0
0.05
0.1
0.15
0.2
0.25
1973
1980
1981
1988
1991
1993
1994
1995
1996
1997
1998
2000
2001
2002
2003
2004
2005
2006
2007
2008
2009
fish/
100
m2
Cutthroat trout ≥ 300 mm
Entire N.F. Cd'A River Entire L.N.F. Cd'A River

159
Figure 55. Average density (fish/100 m2) of cutthroat trout and 90% confidence intervals (all sizes and only fish ≥ 300 mm) observed while snorkeling transects in seven different reaches in the North Fork Coeur d’Alene River watershed, Idaho, during 2009.
0
1
2
3
4
5
6
S.F. -Prichard
Prichard -YD
YD -Tepee
Tepee - JC LNF lower LNF upper Tepee Cr
fish/
100
m2
Cutthroat trout (all sizes)
0
0.25
0.5
0.75
1
1.25
1.5
S.F. -Prichard
Prichard -YD
YD - Tepee Tepee - JC LNF lower LNF upper Tepee Cr
fish/
100
m2
Cutthroat trout (≥ 300 mm)

160
2009 PANHANDLE REGION ANNUAL FISHERY MANAGEMENT REPORT LITTLE NORTH FORK CLEARWATER RIVER FISHERY ASSESSMENT
ABSTRACT
We snorkeled 48 transects to evaluate trends in fish abundance in the Little North Fork Clearwater River on August 17-19, 2009. A total of 513 westslope cutthroat trout, 153 rainbow trout, 406 mountain whitefish, and 14 bull trout were counted during this survey. Westslope cutthroat trout were observed in every transect we snorkeled. The average density of westslope cutthroat trout observed in 2009 was 30% higher than what was observed in 2005, yet similar to what was observed in 2002. Mean densities of westslope cutthroat trout (all size classes) were significantly higher in the “road accessible” section as compared to the “walk-in” downstream reach. Mean density of westslope cutthroat ≥ 300 mm between walk-in and road accessible reaches was not significantly different. Bull trout were observed in 11 of the 48 transects we snorkeled, and densities were significantly different between the walk-in and road accessible reaches. About 50% of the bull trout were > 375 mm in length and 21% were > 450 mm. Mean density of mountain whitefish was not significantly different between the walk-in and road accessible reaches. About 84% of the whitefish observed were ≥ 300 mm in length. Rainbow trout mean density was not significantly different between the walk-in and road accessible reaches. Only seven rainbow trout were observed that were ≥ 300 mm in length, all of which were in the road accessible section of the sample area. The overall density of rainbow trout between 2005 and 2009 was not significantly different.
We marked 115 westslope cutthroat trout, five rainbow trout, and three rainbow X westslope cutthroat hybrids with Floy tags between July 6 and 22, 2009 in the Little North Fork Clearwater River to evaluate angler exploitation. Anglers reported recapturing 12 of these fish with two of these being harvested. Accounting for tag loss and reporting rate angler exploitation was calculated to be 4%, which is considerably lower than previous year’s studies. Low exploitation was likely related to a lack of access from road closure and late snow melt. Authors: Ryan Hardy Regional Fisheries Biologist Jim Fredericks Regional Fisheries Manager

161
INTRODUCTION
The Little North Fork (LNF) Clearwater River is one of the most remote rivers in the Panhandle Region. This river provides an important fishery for westslope cutthroat trout and habitat for an increasing bull trout population. The LNF Clearwater River is known for quality trout fishing in a backcountry setting. Road access to the LNF Clearwater River is limited to the upper portion of river. Twenty-five km of the river is accessible only by trail and another 25 km of the river without trail access at all. Between 2001 and 2008 the U.S. Forest Service (USFS) has been upgrading the trail system that provides access to the river, improving access especially for motorcycle traffic. This improved trail system may increase fishing pressure and decrease the quality of the fishery if harvest rates increase significantly.
Portions of the LNF Clearwater have little to no information regarding presence/absence of bull trout and westslope cutthroat trout due to the fact that the habitat is isolated and access is difficult. Presence/absence through snorkel and electrofishing surveys and redd counts has been documented for portions of the mainstem and some tributary streams; however, long term population trend data and distribution information is minimal. Identification of distribution, trend, and limiting factors for bull trout and westslope cutthroat trout populations throughout the LNF Clearwater River and some of its larger tributaries will support efforts to maintain healthy fisheries and stable native trout populations. This study focused on evaluating the wild trout population and fishery in the LNF Clearwater River. We also evaluated exploitation of westslope cutthroat trout and rainbow trout to determine if changes in the fishing regulations were warranted to maintain a quality trout fishery.
OBJECTIVES
1. Estimate salmonid density and trends in abundance in snorkeling transects in the Little North Fork Clearwater River.
2. Evaluate angler exploitation of westslope cutthroat and rainbow trout in the Little North
Fork Clearwater River.
STUDY SITES
The majority of the study area is managed by the USFS. Other land managers in the basin are located in the upper third of this watershed and include the Bureau of Land Management (BLM), the IDFG and Forest Capital Partners. Road access to the LNF Clearwater River is limited to the upper portion of the LNF Clearwater River, with over 35 km of the river accessible only by trail.
The LNF Clearwater River is located in the southern portion of the Panhandle Region (Figure 56). The study area covers about 34 km of river, extending 1 km downstream from Foehl Creek upstream to Lund Creek. The size of the watershed is about 53,000 hectares in size at the downstream end of study area. Elevations ranged from 740 m at transect 1 to 1,306 m at the mouth of Lund Creek. We divided the study area into a road-accessible and walk-in reach. The road-accessible reach extended from Rutledge Creek upstream to Lund Creek (about 12 km in length) and access was considered relatively easy. Nowhere in the road-

162
accessible reach did one have to hike more than 2.8 km and gain/lose more than 60 m in elevation to reach the river from a road. The walk-in reach extends from Rutledge Creek downstream to 1 km below Foehl Creek (about 23 km in length) and can be accessed by trail only. Travel to the walk-in reach ranged from 2.8 km of trail and a 60 m elevation drop to reach Rutledge Creek to 5 km of trail and a 540 m drop in elevation to reach Foehl Creek.
METHODS
Snorkel Surveys
We used snorkel surveys to evaluate trends in fish abundance in the LNF Clearwater River. We snorkeled 48 transects in the LNF Clearwater River during August 17-19, 2009. Thirty-five snorkel transects were initially established in 1997 by systematically selecting transects at approximately 800 m intervals (Fredericks et al. 2000). These transects encompassed an entire pool or run habitat type or a 50 m stretch of riffle/pocket water. During 2002, an additional 13 transects were added to better evaluate the bull trout population and the fishery in the more road-accessible section of the river upstream of Adair Creek (DuPont et al. 2007). These 13 transects were selected based on what was considered good habitat for bull trout and westslope cutthroat trout. The total number of transects snorkeled during 2009 was 48 (Figure 56).
In an effort to accurately locate and duplicate snorkel surveys, transect locations were recorded as waypoints using a Global Positioning System (GPS). In addition, photographs of each site were taken with permanent landmarks in the photo including starting and ending points of each transect. Prior to conducting the snorkel surveys, the most up-to-date coordinates were downloaded into a GPS unit and used to navigate to the site (Appendix C). Once near the transect, the most recent photos were used to locate the exact starting and stopping points to snorkel.
The snorkel technique used at each transect was based on sightability, transect width and depth. Our intent was to be reasonably certain that all fish in the transect were visible to the diver and few or no fish were overlooked. Only one snorkeler was used during these surveys as the water was always clear enough to see across the entire river. Transects were snorkeled in a downstream direction except in pocket water and in transects less than 10 m wide. In areas where pocket water was the dominant habitat or shallow turbulent water limited visibility, transects were snorkeled upstream. In these habitats, the snorkeler often moves too fast through the reach to make accurate counts. In addition, when the stream channel was < 10 m in width, the transect was snorkeled upstream. Where woody debris or boulders were common, the snorkeler would often have to swim around them to ensure all fish were counted. Prior to snorkeling, each observer practiced guessing the lengths of plastic pipes underwater to ensure accurate estimates of fishes’ lengths were made. Throughout the snorkel surveys we conducted these practice sessions to maintain our accuracy. We periodically duplicated counts using different divers to check for accuracy and precision. If noticeable differences occurred in fish counts or length estimates between snorkelers, the discrepancy was discussed, and the transect was re-snorkeled.
When snorkeling in calm water, we found it is best to remain fairly motionless and near the surface to reduce fish spooking. Snorkeling near the stream edge or away from where most of the fish are holding can also significantly reduce spooking fish downstream. We have often

163
observed large numbers of fish moving downstream in-front of snorkelers until they reach the end of the transect when it is at a tail-out. At this point, fish will often swim back upstream past the snorkelers. If the snorkeler did not swim to the end of the reach, these fish would remain at the end of the transect and go uncounted. For this reason, no transect ended in the middle of a pool, run or glide.
Estimates of salmonid abundance were limited to age-1 and older fish, as summer counts for young-of-the-year (YOY) westslope cutthroat and rainbow trout are typically unreliable. Most YOY westslope cutthroat trout would be smaller than 80 mm during surveys in August and occupy the shallow stream margins where snorkeling is less effective (Thurow 1994). Fish observations were recorded for each transect by species in 75 mm length groups.
After completing fish counts, we measured length and wetted width at 4 randomly located measurements at each transect with a rangefinder to determine the surface area (m2) surveyed. In addition, at each transect we recorded the habitat type, maximum depth, dominant cover type and amount of dominant cover that occurred in the area snorkeled (Appendix A). These types of measurements can be used to help determine if changes in habitat may be responsible for any future changes in fish density.
Periodically, channel shifting, bed load movement, and/or blow outs will alter a site so that it does not represent the original transect. Many transects were selected because they represented good habitat for westslope cutthroat and/or bull trout.
Snorkel Survey Data Analysis
Fish counts for each transect were converted to density (fish/100 m2) to standardize the data and make it possible to compare counts within the watershed as well as to other watersheds. Average densities of each salmonid species greater than YOY and for westslope cutthroat trout ≥ 300 mm were calculated for the entire LNF Clearwater River as well as for designated stream reaches including areas considered to be walk in (downstream of Rutledge Creek – trail access only) or road-accessible (upstream of Rutledge Creek – road crosses within 3 km). These averages were calculated by summing the total number of fish counted in a particular reach of stream and dividing it by the total area snorkeled, as opposed to calculating an average from the density recorded at each snorkel transect within a particular reach of stream.. The densities of these fishes were added to the long-term data set to evaluate their trends in abundance.
We compared the transect densities of westslope cutthroat trout, rainbow trout, mountain
whitefish and bull trout using a t-test (assumed equal variances) to determine if densities differed between the road-accessible and walk-in stream reaches. We used a p-value ≤ 0.10 to denote when a significant difference in density occurred between these two reaches. This value is often used to show significance when evaluating fish and wildlife populations for management purposes (Peterman 1990; Johnson 1999; Anderson et al. 2000). To determine if densities of fishes differed between years (previous survey dates) we conducted an analysis of variance (ANOVA) on the density of fish in each of the section by year. When an ANOVA showed that a significant difference (p ≤ 0.10) in westslope cutthroat trout density occurred between the stream reaches of year we used Fisher’s Least-Significance-Difference (LSD) Test to evaluate which stream reaches or year differed significantly. Fisher’s LSD was chosen for this analysis as this test tends to maximize the power, which increases that ability to show statistically significant differences with low sample sizes (Milliken and Johnson 1992).

164
Angler Exploitation
We tagged westslope cutthroat trout and rainbow trout in the LNF Clearwater River with Floy T-bar anchor non-reward tags to evaluate angler exploitation. Each tag had “Call IDF&G 866-258-0338” on one side and a unique code on the other side. The westslope cutthroat trout and rainbow trout were captured by angling, and tags were placed in fish ≥ 250 mm. We marked 115 westslope cutthroat trout, five rainbow trout, and three rainbow X cutthroat hybrids with floy tags between July 6 and 22, 2009 in the LNF Clearwater River (Table 4). Took place from Lund Creek downstream to 1 km below Foehl Creek. To determine angler exploitation, the number of fish harvested by anglers (determined by tags returns) was divided by the number of fish we tagged. We assumed a 45% reporting rate, which is typical of non- reward tags (Meyer et al. 2009), and adjusted the return rate accordingly to provide an exploitation estimate. Tag loss was assumed to be 6% based on research by Meyer et al (2009). Previous estimates were corrected for new reporting rate and tag loss information. When comparing exploitation rates from this study to past years, we applied the same reporting and tag loss rates to the past studies.
RESULTS
Snorkel Surveys
A total of 513 westslope cutthroat trout, 153 rainbow trout, 406 mountain whitefish, and 14 bull trout were counted during this survey (Table 53). Westslope cutthroat trout were observed in every transect we snorkeled. The average density of westslope cutthroat trout observed in 2009 was 1.66 fish/100 m2. Mean densities (all size classes) were significantly higher (t-test; p < 0.001) in the road-accessible section (3.64 fish/100 m2) as compared to the walk-in downstream reach (1.33 fish/100 m2; Table 54). For the entire stream, 24% of the westslope cutthroat trout observed were ≥ 300 mm in length, which is significantly down (t -test; p = 0.042) from 2005’s density observation where 46% being above ≥ 300 mm. Mean density of fish ≥ 300 mm between walk-in (0.42 fish/100m2) and road-accessible (0.22 fish/100m2) reaches was not significantly different (t-test; p = 0.43) (Table 54). The average density of westslope cutthroat trout observed in 2009 (1.66 fish/100 m2) was 30% higher (t-test; p = 0.007) than what was observed in 2005 (1.16 fish/100 m2), yet similar to what was observed in 2002 (1.75 fish/100 m2).
Rainbow trout were observed in 31 of 48 transects we snorkeled, and mean density was not significantly different between the walk-in (0.43 fish/100 m2) and road-accessible (0.88 fish/100 m2) reaches (t-test; p = 0.026) (Tables 53 and 54). Only seven rainbow trout were observed that were ≥ 300 mm in length , all of which were in the road-accessible section of the sample area. The overall density of rainbow trout between 2005 and 2009 was not significantly different (paired t-test; p = 0.28; Table 54).
Mountain whitefish were observed in 27 of the 48 transects we snorkeled, and mean density was not significantly different between the walk-in (1.45 fish/100 m2) and road-accessible (0.52 fish/100 m2) reaches (t-test; p = 0.17). About 84% of the whitefish observed were ≥ 300 mm in length. Bull trout were observed in 11 of the 48 transects we snorkeled, and as seen in 2005, densities were again significantly different between the walk-in (0.02 fish/100 m2) and road-accessible (0.20 fish/100 m2) reaches (t-test; p = 0.005) (Tables 54 and 55). About 50% of the bull trout were > 375 mm in length and 21% were > 450 mm. The overall density of mountain whitefish was higher (1.2 times) and bull trout were lower (3.3 times) than in 2005, although differences were not significant (paired t-test; p = 0.51 and 0.21 respectively).

165
Angler Exploitation
Fish were tagged between Lund Creek and Foehl Creek (Figure 57). Anglers reported recapturing 12 of these fish with two of these being harvested. All of these fish were reported being caught within about a one month span from July 22 to August 29. No rainbow or hybrids were reported being caught. Using a 6% tag loss rate and a 45% reporting rate about 16% of the fish were recaptured and 4% of them were harvested (Table 56). Unlike in 2005, there was most likely little fishing pressure prior to the marking date since the main 1268 bridge (which allows major access to the lower sections of the LNF) was closed for repair. Therefore, no corrections were felt necessary for missing the 4th of July weekend. Total estimated exploitation for 2009 was considerably lower than what was reported for previous years (Table 56).
Based on the general capture locations provided by anglers on where they caught their fish is was difficult to determine how much these fish moved from where they were originally tagged. However, it appears that six of them were recaptured within at least 2 km of where they were originally tagged, and the remaining six moved from 5 - 10 rkm downstream from when they were tagged. One fish was captured and reported on two separate occasions.
None of the harvested fish came from road-accessible reach. About 23 of the 123 (19%) fish were tagged from this road-accessible reach (Figure 57).
DISCUSSION
Snorkel Surveys
The overall density of westslope cutthroat trout was 30% higher in 2009 than what was observed in 2005, and 64% higher in the road-accessible access section. Despite this increase, however, density of westslope cutthroat trout ≥ 300 mm observed in 2009 was 30% lower than in 2005. Thus, the higher densities of fish that were observed in 2009 are related to an increase numbers of smaller fish. This differs from 2005 where DuPont et al. 2008 reported a reduction in smaller size classes from previous year’s studies. DuPont et al. (2008) also expressed concern that the lower abundance of small westslope cutthroat may result in fewer large fish in the years to come. Weak year classes from previous years are likely one contributing factor to the reduction in larger fish throughout the system.
In 2009, the densities of westslope cutthroat trout ≥ 300 mm were about twice as high in the walk-in reach as the road-accessible reach. A similar distribution of larger fish was reported in 2005 (DuPont et al. 2008). Angler exploitation does not appear to explain the difference as it was only 4% in 2009, with little to none occurring in the road-accessible section. The distribution may be a function of fish migrations or more suitable habitat for adult fish in the lower reaches of the river. DuPont et al. 2008 reported that this movement occurred due to rapidly retreating water in the road-accessible section (low water year), thereby displacing fish to downstream locations. The utility of starting this type of long term dataset, as seen in the North Fork (NF) Coeur d’Alene and St. Joe Rivers, is that these types of effects may be more pronounced on a long term special scale.
When we compare the densities of westslope cutthroat trout in the LNF Clearwater River to the St. Joe River and NF Coeur d’Alene River, we found them similar to the St. Joe River and

166
about 1.8 times higher than the NF Coeur d’Alene River (Table 57). When we evaluated only those fish ≥ 300 mm the density was similar to the NF Coeur d’Alene River with the St. Joe being two times higher than the LNF Clearwater River. The densities in the St. Joe River and NF Coeur d’Alene River in 2009 were near or exceeded the highest that had been recorded, further indicating the population in the LNF Clearwater is healthy despite allowing harvest.
About 80% fewer bull trout were observed during 2009 as 2005. This somewhat correlates with bull trout redd counts which decreased by 24% from 2005. Bull trout densities and numbers were higher in the upstream road-accessible reach. This is likely due to water temperatures and proximity to most of the known spawning tributaries. Bull trout spawning typically begins in early September in north Idaho two weeks after we conducted our survey.
The overall mountain whitefish density in 2009 was higher than in previous sample years. Most (84%) of the mountain whitefish observed were > 300 mm in length as opposed to 24% of the westslope cutthroat trout being > 300 mm in length. The highest densities and numbers of mountain whitefish were observed in the most downstream reaches. This is typical with other rivers in north Idaho where mountain whitefish congregate in stream reaches with the largest pools and warmer water temperatures (DuPont et al. 2008).
Angler Exploitation
The fishing regulations for westslope cutthroat trout in the LNF Clearwater River are two trout of any size. Many of the other rivers in the Panhandle Region including the Coeur d’Alene and St. Joe Rivers are catch-and-release for westslope cutthroat trout. The more liberal regulations on the LNF Clearwater River are related to relatively low fishing pressure stemming from its remote location, with most of the river accessed only by trail. From 2001 through 2008, the USFS has been upgrading the trail system that provides access to the LNF Clearwater River. These upgrades improved access, especially for motorcycle traffic. This improved trail system may increase fishing pressure may increase in the LNF Clearwater River, which is part of the reason we monitor exploitation estimates every few years.
Our angler exploitation study found that about 7.5% of the westslope cutthroat trout are caught on an annual basis with the annual exploitation estimate to be around 4%. This exploitation rate is much lower than found in past studies. This may be related to the 1268 bridge, which provides ready access to the lower part of the river to Fohel Creek, was closed for repair until the second week in August. In addition to this, the increased amounts of snow experienced in January and February 2009 further limited access prior to the second week in July. Despite the improvements in the trail system, annual exploitation has remained low from 1997 to 2009. In addition, the high densities and size structure of westslope cutthroat trout further indicates harvest is not negatively impacting the fishery.
We found that about 90% of the tagged fish that were captured by anglers were released. This is up from 2005 where DuPont et al. (2008) found half of the fish were released. Without voluntary catch-and-release, it is likely this fishery would show impacts of exploitation.
MANAGEMENT RECOMMENDATIONS
1. Monitor fish abundance and exploitation surveys in the LNF Clearwater River through snorkel surveys in 2012.
2. Maintain current fishing regulations on LNF Clearwater River.

167
Transect Density Number Density Number Density Number DensityReach Number Area (m2) >300mm All sizes (No./100 m2) counted (No./100 m2) counted (No./100 m2) counted (No./100 m2)
1 2055.1 5 10 0.49 8 0.4 0 0.0 0 0.02 1319.7 10 12 0.91 15 1.1 0 0.0 0 0.03 1384.7 3 32 2.31 30 2.2 0 0.0 0 0.04 1059.8 1 5 0.47 8 0.8 0 0.0 0 0.05 856.6 1 7 0.82 3 0.4 0 0.0 0 0.06 1374.8 2 8 0.58 4 0.3 1 0.1 0 0.07 1590.7 22 42 2.64 150 9.4 0 0.0 1 0.18 2108.4 6 9 0.43 10 0.5 0 0.0 0 0.09 617.9 1 7 1.13 5 0.8 0 0.0 0 0.010 1084.2 7 22 2.03 30 2.8 2 0.2 2 0.211 682.4 3 15 2.20 14 2.1 0 0.0 0 0.012 585.6 3 5 0.85 6 1.0 0 0.0 0 0.013 1094.3 4 16 1.46 17 1.6 0 0.0 0 0.014 481.8 11 22 4.57 18 3.7 11 2.3 0 0.015 1067.5 6 9 0.84 5 0.5 5 0.5 0 0.016 460.3 3 18 3.91 25 5.4 0 0.0 0 0.017 766.5 1 11 1.44 0 0.0 1 0.1 0 0.018 474.9 4 15 3.16 0 0.0 5 1.1 0 0.019 633.6 0 1 0.16 0 0.0 5 0.8 1 0.220 622.8 5 26 4.17 0 0.0 4 0.6 0 0.021 708.4 4 13 1.84 18 2.5 6 0.8 0 0.022 609.0 0 2 0.33 0 0.0 2 0.3 0 0.023 1045.5 3 7 0.67 2 0.2 21 2.0 0 0.024 140.0 0 4 2.86 0 0.0 4 2.9 1 0.725 361.7 2 7 1.94 0 0.0 9 2.5 0 0.026 303.3 2 2 0.66 1 0.3 8 2.6 0 0.027 658.7 0 3 0.46 0 0.0 16 2.4 0 0.028 404.2 0 5 1.24 3 0.7 3 0.7 0 0.029 728.0 2 9 1.24 4 0.5 4 0.5 0 0.030 377.0 0 2 0.53 0 0.0 1 0.3 0 0.031 398.7 0 3 0.75 7 1.8 4 1.0 0 0.032 403.0 0 2 0.50 0 0.0 2 0.5 0 0.0
Can
yon
Cre
ek to
Spo
tted
Loui
s C
reek
Spo
tted
Loui
s C
reek
to
Rut
ledg
e C
reek
Cutthroat trout Mountain whitefish Rainbow trout Bull troutNumber counted
Dow
nstr
eam
of C
anyo
n C
reek
Table 53. Number and density (fish/100 m2) of fishes observed while snorkeling transects in the Little North Fork Clearwater River, Idaho, during August 17-19, 2009.

168
Table 53 (continued).
Transect Density Number Density Number Density Number DensityReach Number Area (m2) >300mm All sizes (No./100 m2) counted (No./100 m2) counted (No./100 m2) counted (No./100 m2)
33 659.9 0 8 1.21 0 0.0 3 0.5 0 0.034 505.5 1 15 2.97 1 0.2 3 0.6 1 0.235 266.1 0 4 1.50 0 0.0 0 0.0 0 0.036 355.5 1 15 4.22 15 4.2 3 0.8 0 0.037 150.0 0 2 1.33 0 0.0 3 2.0 0 0.038 217.8 2 32 14.69 3 1.4 5 2.3 0 0.039 207.0 0 16 7.73 3 1.4 0 0.0 1 0.540 130.0 2 11 8.46 0 0.0 6 4.6 0 0.041 185.4 0 7 3.78 1 0.5 2 1.1 3 1.642 215.0 0 7 3.26 0 0.0 4 1.9 1 0.543 271.9 1 11 4.05 0 0.0 7 2.6 1 0.444 540.5 0 12 2.22 0 0.0 2 0.4 0 0.045 212.0 1 9 4.25 0 0.0 1 0.5 0 0.046 225.0 1 3 1.33 0 0.0 0 0.0 1 0.447 214.4 1 4 1.87 0 0.0 0 0.0 0 0.048 90.6 0 6 6.62 0 0.0 0 0.0 1 1.1
Total 48 sites 30,905 121 513 1.66 406 1.3 153 0.5 14 0.0
Ups
tream
of F
.S. R
oad
1268
Cutthroat trout Mountain whitefish Rainbow trout Bull troutNumber counted
Rut
ledg
e C
reek
to
F.S
. Roa
d 12
68

169
Table 54. Average density (fish/100 m2) of westslope cutthroat trout counted by snorkeling during 1997, 2002, 2005, and 2009 in specific reaches of the Little North Fork Clearwater River, Idaho.
Transect All sizes ≥ 300 mm
Stream Reach Number 1997 2002 2005 2009 1997 2002 2005 2009
Downstream of Canyon Creek 1-10 0.27 1.21 1.10 1.14 0.11 0.26 0.49 0.43
Canyon Creek to Spotted Louis Creek 11-21 0.59 2.79 1.27 1.99 0.12 0.94 0.82 0.58
Spotted Louis Creek to Rutledge
Creek 22-32 0.36 0.95 0.94 0.85
0.12 0.32 0.55 0.17
Rutledge Creek to F.S. Road 1268 33-39 0.52 2.93 1.71 3.90 0.35 0.55 0.27 0.17
Upstream of F.S. Road 1268 40-48 -- 3.16 0.92 3.36 -- 0.64 0.16 0.29
Walk-in 1-32 0.38 1.51 1.12 1.33 0.11 0.44 0.61 0.42
Road-accessible 33-48 0.52 3.06 1.31 3.64 0.35 0.60 0.22 0.22
All Sites 1-48 0.39 1.75 1.16 1.66 0.13 0.46 0.53 0.39

170
Table 55. Average density (fish/100 m2) of rainbow trout, mountain whitefish and bull trout counted by snorkeling during 1997, 2002, 2005, and 2009 in specific reaches of the Little North Fork Clearwater River, Idaho.
Transect
Stream Reach Number 1997 2002 2005 2009 1997 2002 2005 2009 1997 2002 2005 2009
Downstream of Canyon Creek 1-10 0.13 0.38 0.04 0.02 1.05 1.11 1.65 1.96 0.00 0.03 0.04 0.02
Canyon Creek to Spotted Louis Creek 11-21 0.98 0.63 0.12 0.49 0.80 1.20 1.27 1.36 0.03 0.12 0.08 0.01
Spotted Louis Creek to Rutledge Creek 22-32 0.58 1.65 0.62 1.36 0.30 0.82 1.01 0.31 0.00 0.03 0.24 0.02
Rutledge Creek to F.S. Road 1268 33-39 1.04 1.10 1.61 0.72 0.43 0.43 0.50 0.93 0.00 0.43 0.20 0.08
Upstream of F.S. Road 1268 40-48 -- 0.94 0.16 1.06 -- 0.21 0.13 0.05 -- 0.64 1.34 0.34
Unroaded 1-32 0.50 0.78 0.21 0.43 0.78 1.05 1.37 1.45 0.01 0.05 0.10 0.02
Roaded 33-48 1.04 1.00 0.88 0.88 0.43 0.30 0.32 0.52 0.00 0.55 0.78 0.20
All Sites 1-48 0.52 0.81 0.34 0.50 0.76 0.94 1.16 1.31 0.01 0.13 0.24 0.05
Rainbow Trout Mountain Whitefish Bull Trout

171
Table 56. Number of westslope cutthroat trout tagged, recaptured and harvested on the Little North Fork Clearwater River, Idaho during 1997, 2002, 2005, and 2009. Percent recaptured and angler exploitation were calculated based on a 6% tag loss rate and a 45% and 55% reporting rate for non reward (2009) and reward tags respectively.
Date Number
Tagged Number
Recaptured Percent
Recaptured
Number
Harvested Annual
Exploitation
2009 119 12 16.4% 2 4.0%
1. 2005 142 16 18.4% 9 12.3%
2. 2005
(corre
cted) 142 20 22.9% 11 15.0%
3. 2002 31 6 31.5 2 12.5%
4. 1997 75 -- -- 6 15.5%
Table 57. Average density (fish/100 m2) of westslope cutthroat trout observed while snorkeling the Little North Fork Clearwater River (LNFCW), St. Joe River (St Joe) and North Fork Coeur d’Alene River (NFCdA), Idaho, during 2009.
All size classes ≥ 300 mm
Stream Reach LNFCW St Joe NFCdA LNFCW St Joe NFCdA
Walk-in 1.33 2.22 1.82 0.42 0.91 0.50
Road-accessible 3.64 1.39 1.20 0.22 0.56 0.26
All Transects 1.66 1.30 0.95 0.39 0.56 0.20

172
Figure 56. Location of transects snorkeled in the Little North Fork Clearwater River, Idaho, on August 15-18, 2009.

173
Figure 57. Locations of where westslope cutthroat trout and rainbow trout were T-bar Floy tagged (July 6-22, 2009) and recaptured for an angler exploitation study in the Little North Fork Clearwater River, Idaho.

174
APPENDICES

175
Appendix A. Recommended stocking schedule for mountain lakes of the Panhandle Region,
Idaho. Recommended changes for the 2009 schedule are highlighted.
Lake CodeSurface acres
Number requested Species
Substitute species
Stocking year
Kootenai DrainageHidden 01-103 45 13,200 KT C2 EvenLake Mtn (Cuttoff) 01-104 5 1,000 C2 KT EvenWest Fork 01-109 11 3,100 C2 KT EvenLong Mountain 01-112 2 900 GR None EvenParker 01-113 4 900 GN None EvenLong Canyon 01-115 5 2,300 GN None EvenBig Fisher 01-117 9 1,900 C2 KT EvenMyrtle 01-122 20 6,000 C2 KT EvenTrout 01-124 7 1,300 KT C2 EvenPyramid 01-125 8 1,500 KT C2 EvenBall 01-126 6 1,300 C2 KT EvenLittle Ball 01-127 2Snow 01-134 9 2,500 C2 KT EvenRoman Nose #3 01-137 12 3,200 KT C2 EvenQueen 01-148 3 700 C2 KT EvenDebt 01-157 3 700 C2 KT EvenSpruce 01-147 5 1,900 KT C2 EvenCopper 01-155 2 400 C2 KT EvenCallahan 01-166 8 4,000 GR None Even
Pend Oreille DrainageHunt 02-101 14 4,200 C2 KT EvenStandard 02-103 13 4,000 C2 KT EvenTwo Mouth #2 02-107 4 1,600 C2 KT EvenTwo Mouth #3 02-108 8 1,000 C2 KT EvenMollies 02-114 2 600 C2 KT EvenFault (Hunt Pk #1) 02-121 6 1,500 C2 KT EvenMcCormick (Hunt Pk #2) 02-122 3 600 C2 KT EvenLittle Harrison 02-126 7 1,200 C2 KT EvenBeehive 02-128 6 1,200 C2 KT EvenHarrison 02-129 29 5,700 C2 KT EvenDennick 02-171 8 3,300 C2 KT EvenSand 02-172 5 2,400 C2 KT EvenCaribou (Keokee Mtn) 02-196 7 1,700 C2 KT Even
Discontinue stocking GR

176
Appendix A. Continued.
Lake CodeSurface acres
Number requested Species
Substitute species
Stocking year
Spokane DrainageLower Glidden 03-123 14Gold 03-125 3 1,100 KT None EvenCrater 03-133 4 1,900 GR None OddDismal 03-138 6Bacon 03-144 9 1,500 C2 KT OddForage 03-146 7 2,100 GN None OddHalo 03-147 10 2,000 C2 KT OddCrystal 03-060 10 2,800 C2 KT Even
Devils Club 06-113 3 800 C2 KT OddBig Talk 06-114 5 1,400 C2 KT OddLarkins 06-117 8 2,400 C2 KT OddMud 06-118 5 1,200 KT C2 OddHero 06-119 5 1,500 C2 KT OddHeart 06-122 33 6,400 KT None OddNorthbound 06-123 12 3,400 C2 KT OddSkyland 06-125 13 6,400 KT None OddFawn 06-126 13 3,500 C2 KT OddNo-see-um 06-130 4 1,400 C2 KT OddSteamboat 06-131 7 1,800 GR None OddSum of Number Requested
C2 K1 GR GN TotalOdd year 17,900 14,000 3,700 2,100 37,700Even year 49,400 22,200 4,900 3,200 79,700Total 67,300 36,200 8,600 5,300 117,400
Little North Fork Clearwater Drainage
Discontinue stocking GR
Discontinue stocking GR

177
Appendix B. Numbers of fish caught, harvested, and released from three sections of Coeur d’Alene Lake (CdA) and the lateral lakes during the 2009 creel survey.
Area
Species
Catch
Harvest
Release
N 95% CI N 95% CI N 95% CI Northern CdA Lake Kokanee 8563 3153 6416 2134 2148 1354
Chinook salmon 485 289 326 227 159 157
Largemouth bass 413 532 1 2 411 532
Smallmouth bass 4816 2837 454 111 4362 2751
Northern pike 7 0 7 0 0 0
Black crappie 0 0 0 0 0 0
Yellow perch 58 0 0 0 58 0
Cutthroat trout 167 15 0 0 167 15
Northern pike minnow 0 --- 0 --- 0 ---
Overall 14509 4489 7204 2280 7305 3197
Mid CdA Lake Kokanee 6676 1484 4657 948 2019 906
Chinook salmon 1973 203 1793 173 180 86
Largemouth bass 120 18 83 18 37 0
Smallmouth bass 8584 5743 295 276 8289 5476
Northern pike 1082 49 141 49 941 0
Black crappie 24 49 24 49 0 0
Cutthroat trout 193 56 0 0 193 56
Northern pike minnow 7 15 0 0 7 15
Bull trout 1 4 0 0 1 4
Overall 18662 5984 6994 1044 11668 5564

178
Appendix B, continued. Numbers of fish caught, harvested, and released from three sections of Coeur d’Alene (CdA) Lake and the lateral lakes during the 2009 creel survey.
Area
Species Catch
Harvest
Release
se
N 95% CI N 95% CI N 95% CI 95% CI Southern CdA Lake Kokanee 7022 2798 6113 2491 909 494
Chinook salmon 91 22 46 22 45 0
Largemouth bass 120 20 6 0 114 20
Smallmouth bass 691 410 130 219 561 335
Northern pike 124 41 80 26 44 23
Black crappie 4 5 0 0 4 5
Yellow perch 12 28 1 0 11 28
Cutthroat trout 68 54 0 0 68 54
Northern pike minnow 11 --- 0 --- 11 ---
Bull trout 3 --- 0 --- 3 ---
Rainbow trout 0 0 0 0 0 0
Overall 8146 2968 6376 2596 1770 671
Lateral lakes Kokanee 2 --- 2 --- 0 ---
Largemouth bass 28659 9544 3616 1090 25043 8464
Smallmouth bass 2311 --- 0 --- 2311 ---
Northern pike 2200 29 368 6 1832 25
Black crappie 510 76 74 66 436 11
Yellow perch 3306 --- 268 --- 3038 ---
Cutthroat trout 2 --- 0 --- 2 ---
Brown bullhead 277 --- 257 --- 20 ---
Sucker 0 --- 0 --- 0 ---
Northern pike minnow 0 --- 0 --- 0 ---
Channel catfish 0 --- 0 --- 0 ---
Tench 0 --- 0 --- 0 ---
Bluegill 2 --- 2 --- 0 ---
Pumkinseed 288 --- 0 --- 288 ---
Overall 37,557 10,624 4,587 1,093 32,970 9575
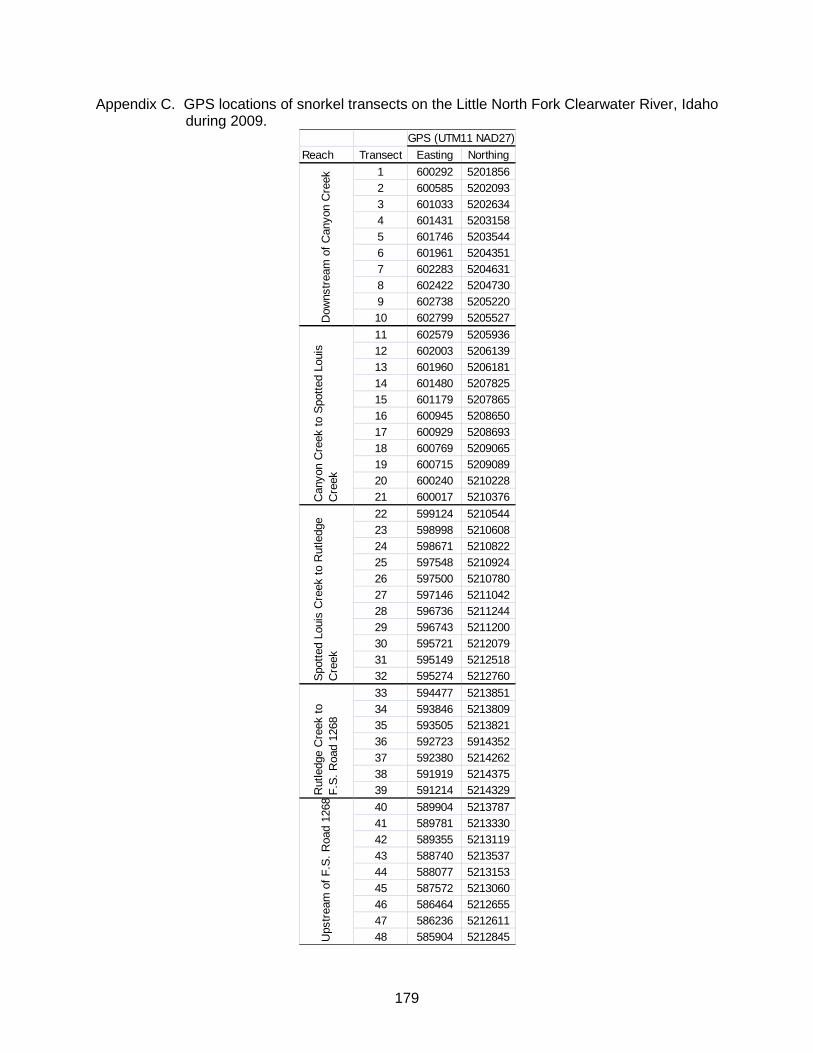
179
Appendix C. GPS locations of snorkel transects on the Little North Fork Clearwater River, Idaho during 2009.
Reach Transect Easting Northing1 600292 52018562 600585 52020933 601033 52026344 601431 52031585 601746 52035446 601961 52043517 602283 52046318 602422 52047309 602738 520522010 602799 520552711 602579 520593612 602003 520613913 601960 520618114 601480 520782515 601179 520786516 600945 520865017 600929 520869318 600769 520906519 600715 520908920 600240 521022821 600017 521037622 599124 521054423 598998 521060824 598671 521082225 597548 521092426 597500 521078027 597146 521104228 596736 521124429 596743 521120030 595721 521207931 595149 521251832 595274 521276033 594477 521385134 593846 521380935 593505 521382136 592723 591435237 592380 521426238 591919 521437539 591214 521432940 589904 521378741 589781 521333042 589355 521311943 588740 521353744 588077 521315345 587572 521306046 586464 521265547 586236 521261148 585904 5212845U
pstre
am o
f F.S
. Roa
d 12
68
GPS (UTM11 NAD27)
Dow
nstre
am o
f Can
yon
Cre
ekC
anyo
n C
reek
to S
potte
d Lo
uis
Cre
ekSp
otte
d Lo
uis
Cre
ek to
Rut
ledg
e C
reek
Rut
ledg
e C
reek
to
F.S.
Roa
d 12
68

180
LITERATURE CITED
Anderson, R.O. 1976. Management of small warm water impoundments. Fisheries 1(6):5-7,
26-28. Anderson, R.O. 1980. Proportional stock density (PSD) and relative weight (Wr): interpretative
indices for fish populations and communities. Pages 27-33 in S. Gloss and B. Shupp, editors. Practical fisheries management: more with less in the 1980’s. Proceedings of the 1st Annual Workshop of the New York Chapter American Fisheries Society. (Available from New York Cooperative Fishery Research Unit, Ithaca, New York).
Anderson, D.R., and K.P. Burnham, and W.L. Thompson. 2000. Null Hypothesis Testing,
Prevalence, and an Alternative. Journal of Wildlife Management 64:912-923. Barton B.A.. and B.R. Taylor. 1996. Oxygen Requirements of Fishes in Northern Alberta Rivers
with a General Review of the Adverse Effects of Low Dissolved Oxygen. Water Quality Research Journal of Canada 31(2): 361-410.
Baxter, J.S., and W.T. Westover. 1999. Wigwam River bull trout. Habitat Conservation Trust
Fund Progress Report (1998). Fisheries Progress Report K054. British Columbia Ministry of Environment, Cranbrook.
Bennett, B.W. Ecology and management of largemouth bass, (Microperus salmoides). 1974.
Pages 10-17 in J.L. Funk, editor. Symposium on overharvest and management of largemouth bass in small impoundments. North Central Division , American Fisheries Society. Special Publication No. 3.
Bjornn, T.C. 1957. A survey of the fishery resources of Priest and Upper Priest Lakes and their
tributaries. Completion Report F-24-R, Idaho Department of Fish and Game, Boise. Bonneau, J.L. and G. LaBar. 1997. Inter-observer and temporal bull trout redd count variability
in tributaries of Lake Pend Oreille, Idaho. Department of Fish and Wildlife Resources, University of Idaho, Moscow. pp.1136.
Bowler, B. 1974. Coeur d’Alene River Study. Idaho Department of Fish and Game, Federal Aid
in Fish Restoration, F-53-R-9, 1974 Job Performance Report, Boise. Bowler, B., B.E. Rieman, and V.L. Ellis. 1979. Pend Oreille Lake fisheries investigations.
Idaho Department of Fish and Game, Job Performance Report, Project F-73-R-1, Boise. Bowles, E.C. 1985. Recruitment and survival of young-of-the-year largemouth bass
(Micropterus salmoides) in the Coeur d’ Alene Lake system. Master’s Thesis, University of Idaho, Moscow.
Bowles, E.C., V.L. Ellis, and B. Hoelscher. 1989. Kokanee stock status and contribution of
Cabinet Gorge Hatchery, Lake Pend Oreille, Idaho. Idaho Department of Fish and Game, Annual Progress Report, Project 85-339, Contract DE-AI79-85BP22493, Boise.
Buktenica, M. 2000. Crater Lake National Park bull trout restoration program. Status Review
and Study Plan, 2000. U.S. Fish and Wildlife Service, Klamath Falls, Oregon.

181
Byorth, P.A. and J.P. Magee 1998 Competitive interactions between Arctic grayling and brook
trout in the Big Hole River drainage, Montana. Trans. Am. Fish. Soc. 127(6):921-931. Crump, M.A. and N.J. Scott Jr. 1994. Visual Encounter Surveys. Pages 84 – 92 in Heyer, W.R., M.A. Donnelly, R.W. McDiarmid, L.C. Hayek and M.S. Foster, editors. 1994. Measuring and monitoring biological diversity: standard methods for amphibians. Smithsonian Institution Press, Washington. Deleray, M., L. Knotek, S. Rumsey, and T. Weaver. 1999. Flathead Lake and River system
fisheries status report. Montana Fish, Wildlife and Parks, Kalispell. Der Hovanisian, J.A. 1997. Synopsis of nationwide strategies for high mountain lake
management. Federal Aid in Fish Restoration; Job Performance Report, Project F-73-R-18. Idaho Fish and Game, Boise.
Donald, D.B. and D.J. Alger. 1993. Geographic distribution, species displacement, and niche
overlap for lake trout and bull trout in mountain lakes. Canadian Journal of Zoology 71:238-247.
Downs, C.C., and R. Jakubowski. 2003. Lake Pend Oreille/Clark Fork River fishery research
and monitoring, 2002 Progress Report. Project 5, 2000-2002 Trestle and Twin Creeks bull trout outmigration and Lake Pend Oreille survival study progress report. Avista Corporation. Spokane, Washington.
Downs, C.C., and R. Jakubowski. 2006. Lake Pend Oreille/Clark Fork River fishery research
and monitoring, 2005 Progress Report. Project 1, 2005 Lake Pend Oreille bull trout counts progress report. Avista Corporation. Spokane, Washington.
Dunham J.B., B.E. Rieman, and K. Davis. 2001. Sources and magnitude of sampling error in
redd counts for bull trout. North American Journal of Fish Management 21:343-352. Dunn, C. 1968. St. Joe River Creel Census – 1968. Idaho Cooperative Fishery Unit,
Completion Report, University of Idaho, Moscow. DuPont J., M. Liter, and N. Horner. 2004. Regional fisheries management investigations.
Idaho Department of Fish and Game, Federal Aid in Fish Restoration, F-71-R-26, Job c, 2001 Job Performance Report, Boise.
DuPont, J., M. Liter, and N. Horner. 2007. Regional fisheries management investigations,
Idaho Department of Fish and Game, Federal Aid in Fish Restoration, F-71-R-27, Subproject I, Job a, 2002 Job Performance Report, Boise.
DuPont J., M. Liter, and N. Horner. 2007. Regional fisheries management investigations.
Idaho Department of Fish and Game, Federal Aid in Fish Restoration, F-71-R-27, Job c-1, 2002 Job Performance Report, Boise.
DuPont, J., M. Liter, and N. Horner. 2007. Regional fisheries management investigations. Idaho
Department of Fish and Game, Federal Aid in Fish Restoration, Upper Priest River Bull Trout Redd Surveys, 2005 Job Performance Report, Boise.

182
DuPont, J., M. Liter, and N. Horner. 2008. Regional fisheries management investigations. Idaho Department of Fish and Game, Federal Aid in Fish Restoration, Movement, Mortality and Habitat Use of Coeur d’Alene River Cutthroat Trout, 2004 Job Performance Report, Boise.
DuPont J., M. Liter, and N. Horner. 2008. Regional fisheries management investigations.
Idaho Department of Fish and Game, Federal Aid in Fish Restoration, F-71-R-30, Job c-1, 2005 Job Performance Report, Boise.
DuPont, J. M. Liter, and N.J. Horner. In Press. Regional fisheries management investigations,
Middle Fork East River bull trout assessment. Idaho Fish and Game. 2007 Job Performance Report, Boise.
DuPont J., M. Liter, and N. Horner. 2009. Regional fisheries management investigations.
Idaho Department of Fish and Game, Federal Aid in Fish Restoration, IDFG 09-109, 2006 Job Performance Report, Boise.
DuPont, J. and N.J. Horner. 2002. Middle Fork East River bull trout assessment.
Regional fisheries management investigations, Idaho Fish and Game. 2002 Job Performance Report, Project F-71-R-27. Boise.
Fraley, J., and B. Shepard. 1998. Life history, ecology, and population status of migratory bull
trout (Salvelinus confluentus) in the Flathead Lake and River system, Montana. Montana Department of Fish, Wildlife, and Parks, Kalispell.
Fredenberg, W. 2002. Further evidence that lake trout displace bull trout in mountain lakes.
Intermountain Journal of Science, Vol. 8, No. 3. Fredericks, J., J. Davis, and N. Horner. 1997. Lowland lake investigations. Idaho Department of
Fish and Game, 1996 Annual Performance Report, Report number IDFG 99-21, Boise. Fredericks, J. 1999. Exotic fish species removal: Upper Priest Lake and Lightning Creek
drainages. Annual Progress Report, Grant Number:E-20, Segment Number:1. Idaho Department of Fish and Game, Coeur d’Alene.
Fredericks, J., Davis, J., N Horner, and C. Corsi. 2000. Regional fisheries management
investigation, Idaho Department of Fish and Game, Federal Aid in Fish Restoration, F-71-R-22, Job c, 1997 Job Performance Report, Boise.
Fredericks, J. and J. Vernard. 2001 Bull Trout Exotic Fish Removal Project Completion Report.
Threatened and Endangered Species Report, Project E-20, Segments 1-3. Idaho Department of Fish and Game, Coeur d’Alene.
Fredericks, J.,and N.Horner. 2001. Regional fisheries management investigations. Idaho
Department of Fish and Game. Federal Aid in Fish Restoration. F-71-R-26. Job c-1 2001 Job Performance Report, Boise.
Fredericks, J. and N. Horner. 2002. Mountain lakes investigations. Idaho Department
of Fish and Game, Annual Performance Report for 1999. Project F-71-R-24. Boise.

183
Fredericks, J., J. Davis, N. Horner, and C. Corsi. 2002. Regional fisheries management investigations, Idaho Department of Fish and Game, Federal Aid in Fish Restoration, F-71-R-23, Subproject IV, 1998 Job Performance Report, Boise.
Fredericks, J., M. Liter, N. Horner, and C. Corsi. 2002. Regional fisheries management
investigations, Idaho Department of Fish and Game, Federal Aid in Fish Restoration, F-71-R-24, Project 1, Job a, 1999 Job Performance Report, Boise.
Fredericks, J., M. Liter, M. Maiolie, R. Hardy, and R. Ryan, 2008. Regional fisheries
management investigations. Idaho Department of Fish and Game. Federal Aid in Fish Restoration. Lowland Lake Surveys. Job Performance Report IDFG 08-125. Boise.
Fredericks, J., M. Liter, M. Maiolie, R. Hardy, R. Ryan, D. Ayers, and C. Gidley. 2009. Regional
fisheries management investigations, Idaho Department of Fish and Game, Federal Aid in Fish Restoration, IDFG 09-125, 2008 Job Performance Report, Boise.
Gabelhouse, D.W., Jr. 1984. A length-categorization system to assess fish stocks. North
American Journal of Fisheries Management 4:273-285. Greswell, R.E. 1991. Use of antimycin for removal of brook trout from a tributary of
Yellowstone Lake. North American Journal of Fisheries Management 11: 83-90.
Hansen, M.J., N.J. Horner, M.D. Liter, M.P. Peterson, and M.A. Maiolie 2008. Dynamics of an Increasing Lake Trout Population in Lake Pend Oreille, Idaho, USA. North American Journal Fisheries Management.
Hayes, D.B., J.R. Bence, T.J. Kwak, and B.E. Thompson. 2007. Abundance, Biomass, and
Production. Pages 327-374 in C.S. Guy and M.L. Brown editors. Analysis and interpretation of freshwater fisheries data. American Fisheries Society, Education Section, Bethesda, Maryland.
Horner, N. and J.A. Davis. 1995. Region 1 lowland lakes investigations. Idaho Department of
Fish and Game, Job Performance Report, Project Number F-71-R-16, Job I-b, Boise. Hunt, J.P. and T.C. Bjornn. 1992. Catchability and vulnerability of westslope cutthroat trout to
angling and movements in relation to seasonal changes in water temperature in northern Idaho rivers. Job Completion Report, Project F-71-R-13, Boise.
Idaho Department of Fish and Game. 2007. Fisheries Management Plan, 2007-2012. Idaho
Department of Fish and Game, Boise.
IDFG (Idaho Department of Fish and Game). 1933. Five year fish and game report, St. Joe National Forest. St. Maries.
Johnson, D.H. 1999. The Insignificance of Statistical Significance Testing. Journal of Wildlife
Management 63:763-772. Johnson, M.G. and H.R. MacCrimmon. 1967. Survival, growth and reproduction of largemouth
bass in southern Ontario ponds. Progressive Fish Culturist 29:216-221.

184
Kozfkay, J. R., and D. J. Megargle. 2002. Hatchery Trout Evaluations. Job Performance Report, Project F-73-R-24. Idaho Department of Fish and Game, Boise.
Krebs, C. J. 1999. Ecological Methodology 2nd edition. Benjamin/Cummings, Menlo Park,
California. LPOBTWAG (Lake Pend Oreille Bull Trout Watershed Advisory Group). 1999. Lake Pend
Oreille bull trout conservation plan. Idaho Department of Environmental Quality. Boise. LaBolle, L. D. and N.J. Horner. 1986. Region 1 lowland lakes investigations. Idaho Department
of Fish and Game, Job Performance Report, Project Number F-71-R-10, Job I-b, Boise. LaBolle, L. D. and N.J. Horner. 1987. Region 1 lowland lakes investigations. Idaho Department
of Fish and Game, Job Performance Report, Project Number F-71-R-11, Job I-b, Boise. LaBolle, L. D. 1988. Region 1 lowland lakes investigations. Idaho Department of Fish and
Game, Job Performance Report, Project Number F-71-R-12, Job I-b, Boise. Lewynsky, V.A. 1986. Evaluation of special angling regulations in the Coeur d’Alene River trout
fishery. Master’s Thesis, University of Idaho. Moscow. Liter, M., R. Hardy, M. Maiolie. and J.Fredericks.2009. In Press. Regional fisheries
management investigation, Idaho Department of Fish and Game, Federal Aid in Fish Restoration, F71-R-34, Job b-2,2009 Job Performance Report, Boise.
Love, R. H. 1971. Dorsal-aspect target strength of an individual fish. Journal of the Acoustic Society of America 49:816-823.
MacLennan, D. N., and E. J. Simmonds. 1992. Fisheries Acoustics. Chapman and Hall. New
York, New York.
Maiolie, M., M. Liter, R. Hardy, J. Fredericks. In press. Lowland lake investigations. Idaho Department of Fish and Game, 2008 Annual Performance Report, Boise.
Mallet, J.L. 1967. St. Joe River fisheries investigations. Idaho Department of Fish and Game,
St. Joe Creel Census Studies, 1967, Boise. Mallet, J. L. 1968. Coeur d’Alene Lake fisheries investigations. Idaho Department of Fish and
Game, Boise. Mauser, G.R. and V. Ellis. 1985. Enhancement of trout in large north Idaho lakes. Idaho
Department of Fish and Game, Job Performance Report, Project F-73-R-6, Boise. Mauser, G.R. 1986. Enhancement of trout in large North Idaho lakes. Idaho Department of
Fish and Game, Job Performance Report, F-73-R-8, Boise. Mauser, G.R, R.W. Vogelsang, and C.L. Smith. 1988. Lake and Reservoir
Investigations: Enhancement of trout in large north Idaho lakes. Federal Aid in Fish Restoration; Job Performance Report, Project F-73-R-9. Idaho Department of Fish and Game, Boise.

185
Maxell, B.A. 1999. A power analysis on the monitoring of bull trout stocks using redd counts. North American Journal of Fisheries Management. 19(3):860-866.
Meyer. K.A., J.A. Lamansky, and F.S. Elle. 2009. Lake and Reservoir research; subproject #3:
Angler exploitation evaluations. Project F-73-R-29. Idaho Department of Fish and Game. Boise.
Milliken, G.A. and D.E. Johnson. 1992. Analysis of messy data, Volume I: Designed
Experiments. Chapman and Hall London UK. Mink, L.L., R.E. Williams, and A.T. Wallace. 1971. Effects of industrial and domestic effluents
on the Coeur d’Alene River basin. Idaho Bureau of Mines and Geology. Pamphlet 140. Moscow.
Nelson, L., J. Davis, and N. Horner. 1996. Lowland lakes investigations. Idaho Department of
Fish and Game, Annual Performance Report, Project Surveys and Inventories, Job b, Boise.
Nelson, W.C. 1988. High lake research and management in Colorado. Colorado Division of
Wildlife, Special Report Number 64. Fort Collins. Newman, R.M., and F.B. Martin. 1983. Estimation of fish production rates and associated
variances. Canadian Journal of Fisheries and Aquatic Sciences 40:1729-1736. Paragamian, V.L. 1984. Population characteristics of smallmouth bass in five Iowa streams and
management recommendations. North American Journal of Fisheries Management 4:497-506.
Peterman, R.M. 1990. Statistical power can improve fisheries research and management.
Canadian Journal of Fisheries and Aquatic Sciences 47:2-15. Plumb, J.A., J.M. Grizzle, and W.A. Rodgers. 1988. Survival of caught and released largemouth
bass after containment in live wells. North American Journal of Fisheries Management 8:325-328.
Pratt, K.L. 1984. Pend Oreille trout and char life history study. Idaho Department of Fish and
Game, Boise. Rabe, F.W. and C.W. Sappington. 1970. Biological productivity of the Coeur d’Alene rivers as
related to water quality. Water Resources Research Institute. Technical Completion Report, Project A-024-IDA. University of Idaho. Moscow.
Rana, K.J. (1995). Cryopreservation of fish spermatozoa. Chapter 6, pp. 151-165. In:
Cryopreservation and Freeze-Drying Protocols. Day, G.D. and McLellan, M.R. (Eds.) Rankel, G. 1971. St. Joe River cutthroat trout and northern squawfish studies. Life History of St.
Joe River Cutthroat Trout. Idaho Department of Fish and Game, Job No. 1, F-60-R-2, Federal Aid in Fish and Wildlife Restoration, Boise.
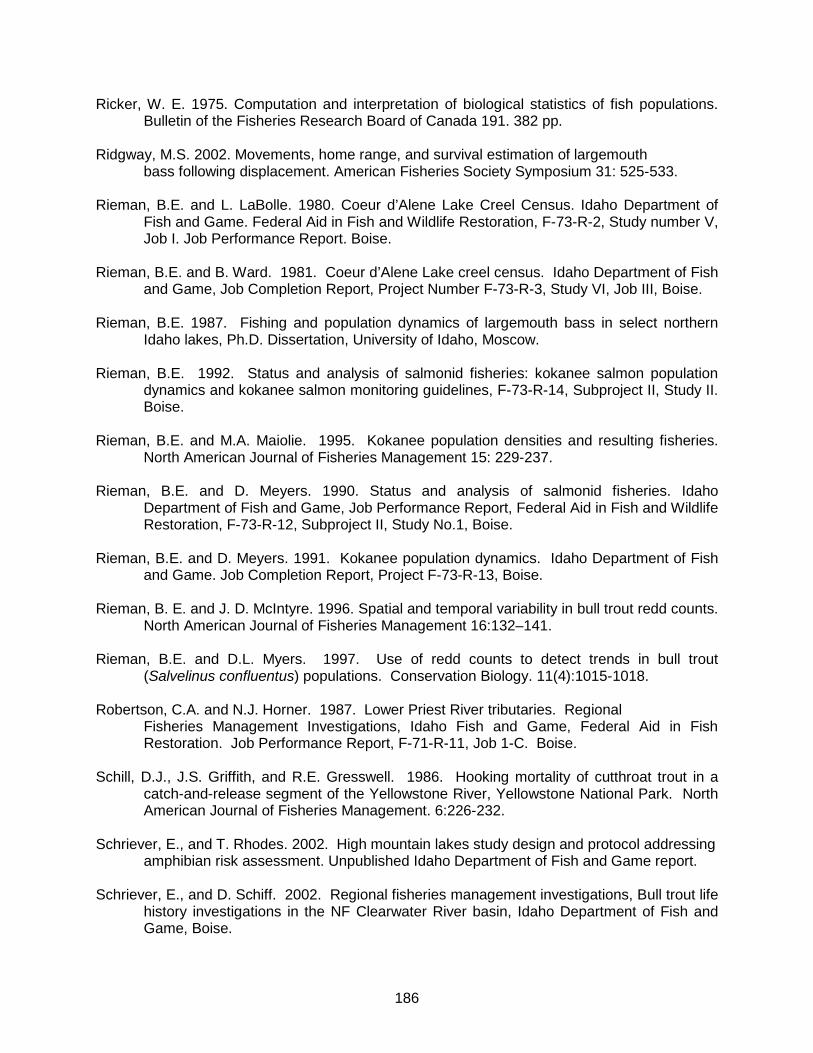
186
Ricker, W. E. 1975. Computation and interpretation of biological statistics of fish populations. Bulletin of the Fisheries Research Board of Canada 191. 382 pp.
Ridgway, M.S. 2002. Movements, home range, and survival estimation of largemouth
bass following displacement. American Fisheries Society Symposium 31: 525-533. Rieman, B.E. and L. LaBolle. 1980. Coeur d’Alene Lake Creel Census. Idaho Department of
Fish and Game. Federal Aid in Fish and Wildlife Restoration, F-73-R-2, Study number V, Job I. Job Performance Report. Boise.
Rieman, B.E. and B. Ward. 1981. Coeur d’Alene Lake creel census. Idaho Department of Fish
and Game, Job Completion Report, Project Number F-73-R-3, Study VI, Job III, Boise.
Rieman, B.E. 1987. Fishing and population dynamics of largemouth bass in select northern Idaho lakes, Ph.D. Dissertation, University of Idaho, Moscow.
Rieman, B.E. 1992. Status and analysis of salmonid fisheries: kokanee salmon population
dynamics and kokanee salmon monitoring guidelines, F-73-R-14, Subproject II, Study II. Boise.
Rieman, B.E. and M.A. Maiolie. 1995. Kokanee population densities and resulting fisheries.
North American Journal of Fisheries Management 15: 229-237. Rieman, B.E. and D. Meyers. 1990. Status and analysis of salmonid fisheries. Idaho
Department of Fish and Game, Job Performance Report, Federal Aid in Fish and Wildlife Restoration, F-73-R-12, Subproject II, Study No.1, Boise.
Rieman, B.E. and D. Meyers. 1991. Kokanee population dynamics. Idaho Department of Fish
and Game. Job Completion Report, Project F-73-R-13, Boise. Rieman, B. E. and J. D. McIntyre. 1996. Spatial and temporal variability in bull trout redd counts.
North American Journal of Fisheries Management 16:132–141. Rieman, B.E. and D.L. Myers. 1997. Use of redd counts to detect trends in bull trout
(Salvelinus confluentus) populations. Conservation Biology. 11(4):1015-1018. Robertson, C.A. and N.J. Horner. 1987. Lower Priest River tributaries. Regional
Fisheries Management Investigations, Idaho Fish and Game, Federal Aid in Fish Restoration. Job Performance Report, F-71-R-11, Job 1-C. Boise.
Schill, D.J., J.S. Griffith, and R.E. Gresswell. 1986. Hooking mortality of cutthroat trout in a
catch-and-release segment of the Yellowstone River, Yellowstone National Park. North American Journal of Fisheries Management. 6:226-232.
Schriever, E., and T. Rhodes. 2002. High mountain lakes study design and protocol addressing amphibian risk assessment. Unpublished Idaho Department of Fish and Game report. Schriever, E., and D. Schiff. 2002. Regional fisheries management investigations, Bull trout life
history investigations in the NF Clearwater River basin, Idaho Department of Fish and Game, Boise.

187
Seber, G.A.F. 1982. The estimation of animal abundance and related parameters, 2nd edition. Oxford University Press, New York, New York.
Simmonds, J. and D. MacLennan. 2005. Fisheries Acoustics Theory and Practice. Second
edition. Blackwell Publishing. 437 pp. Soltero, R.A., and J.A. Hall. 1984. Water quality assessment of Spirit Lake, Idaho. Eastern
Washington University, Cheney.
Strong, C.C., and C.S. Webb. 1970. White pine: king of many waters. Mountain Press Publishing Co. Missoula, Montana.
Swanston, D.N. 1991. Natural processes. American Fisheries Society Special Publication
19:139-179. Thompson, P.D. and F.J. Rahel. 1996. Evaluation of depletion-removal electrofishing of brook
trout in small Rocky Mountain streams. North American Journal of Fisheries Management 16: 332-339.
Thompson, P.D. and F.J. Rahel. 1998. Evaluation of artificial barriers in small Rocky
Mountain streams for preventing upstream movement of brook trout. North American Journal of Fisheries Management 18: 206-210.
Thurow, R.F. 1994. Underwater methods for study of salmonids in the Intermountain West.
General Technical Report. INT-GTR-307. Ogden, UT: USDA Forest Service, Intermountain Research Station. Boise, Idaho.
USFWS (U.S. Fish and Wildlife Service). 2002. U.S. Fish and Wildlife Service Bull Trout
(Salvelinus confluentus) Draft Recovery Pan. Portland, Oregon.
Wege, G. W., and R. O. Anderson. 1978. Relative weight (Wr): a new index of condition for largemouth bass. Pages 79-91 In: Novinger, G. D., and J. G. Dillard editors. New Approaches to the Management of Small Impoundments. North Central Division, American Fisheries Society, Special Publication No. 5, Bethesda, Maryland.
Willard, C., T. McArthur, and S. Grunder. 2007. Opinions and preferences of Idaho anglers. A
report on the 1994, 1999, and 2006 angler opinion surveys. Idaho Department of Fish and Game, Job Completion Report, Report number 07-39.
Winans, G.A., P.B. Aebersold, and R.S. Waples. 1996. Allozyme variability of Oncorhynchus
nerka in the Pacific northwest, with special consideration to populations of Redfish Lake, Idaho. Transactions of the American Fisheries Society, 125:645-663.
Wydoski, R.W. and D.H. Bennett. 1981. Forage species in lakes and reservoirs of the western
United States. Transactions of the American Fisheries Society, 110: 764-771.

188
Prepared by: Approved by: IDAHO DEPARTMENT OF FISH AND GAME Jim Fredericks Regional Fishery Manager _______________________________ Ryan Hardy Edward B. Schriever, Chief Regional Fishery Biologist Fisheries Bureau Rob Ryan Regional Fishery Biologist _______________________________ Bill Horton State Fishery Manager Mark Liter Regional Fishery Biologist Melo Maiolie Regional Fishery Biologist