An Idaho Resource Roadmap Courtney Keith, LMSW Idaho Department of Health & Welfare.

IDAHO DEPARTMENT OF FISH AND GAME
Virgil Moore, Director
Surveys and Inventories
FY2017 Statewide Report
FURBEARER
July 1, 2016 to June 30, 2017 Prepared by: Summer Crea ............................................................................................. Data Coordinator David Smith ............................................................................... Grants/Contracts Specialist Debbie Hribik.............................................................................................. Office Specialist
Compiled and edited by: Cory Mosby, State Furbearer Manager 2017
Boise, Idaho

Idaho Department of Fish and Game (IDFG) adheres to all applicable state and federal laws and regulations related to discrimination on the basis of race, color, national origin, age, gender, disability or veteran’s status. If you feel you have been discriminated against in any program, activity, or facility of IDFG, or if you desire further information, please write to: Idaho Department of Fish and Game, PO Box 25, Boise, ID 83707 or US Fish and Wildlife Service, Division of Wildlife and Sport Fish Restoration Program, 5275 Leesburg Pike, MS: WSFR, Falls Church, VA 22041-3803, Telephone: (703) 358-2156. This publication will be made available in alternative formats upon request. Please contact IDFG for assistance. Please note that IDFG databases containing this information are dynamic. Records are added, deleted, and/or edited on a frequent basis. This information was current as of 12/26/17. Raw data do not have the benefit of interpretation or synthesis by IDFG. IDFG requests that you direct any requests for this information to us rather than forwarding this information to third parties.

i
TABLE OF CONTENTS
STATEWIDE FURBEARER ..........................................................................................................1
ABSTRACT ...............................................................................................................................1
HISTORICAL PERSPECTIVE .......................................................................................................1
MANDATORY TRAPPER HARVEST REPORTS .................................................................1
CITES EXPORT TAGS ............................................................................................................2
NON-TARGET CATCHES.......................................................................................................3
STATEWIDE RESULTS ................................................................................................................3
TRAPPING LICENSE SALES .................................................................................................3
MANDATORY TRAPPER HARVEST REPORTS .................................................................3
CATCH-PER-UNIT-EFFORT ..................................................................................................4
MANDATORY BOBCAT CITES REPORTS ..........................................................................4
MANDATORY RIVER OTTER CITES REPORTS ................................................................4
NON-TARGET AND INCIDENTAL CATCHES TURNED IN FOR REWARD ..................5
FURBEARER DEPREDATION ...............................................................................................5
ADMINISTRATIVE ACTIVITIES AND COORDINATION .................................................5
MANAGEMENT ACTIONS ....................................................................................................6
6BAPPENDIX A ................................................................................................................................16
LIST OF TABLES
Table 1. Trapping license sales and usable harvest reports received from trappers, 2004 to present. .............................................................................................................................................7
Table 2. Statewide furbearers trapped, harvested, and pelt value based on trappers who reported, 2013-2014. ........................................................................................................................8
Table 3. History of statewide rank by total dollar value for animals trapped 2004 to present. .............................................................................................................................................9
Table 4. Distribution of furbearer harvest in Idaho by county, as reported by trappers, 2013-2014. .....................................................................................................................................10
Table 5. Catch-Per-Unit Effort data from trapper report cards, 2013-2014. ................................12
Table 6. Catch-Per-Unit Effort based on trappers reporting they trapped, 2004 to present. ........13 a Wolf trapping seasons began in 2011-2012 .................................................................................13
Table 7. Bobcat pelts tagged with USFWS CITES export tags by IDFG, 2004 to present. .........14

TABLE OF CONTENTS (Continued)
Statewide Furbearer FY2017 ii
Table 8. Bobcat harvest by method of take reported by Region, 2013-2014. ..............................14
Table 9. Otter pelts tagged with USFWS CITES export tags by IDFG during 2013-2014 season. ............................................................................................................................................14
Table 10. Non-target otters caught by trappers and turned in for a reward, 2004 to present. ......15
Table 11. Non-target fisher reported caught by trappers turned in for a reward, 2004 to present. ...........................................................................................................................................15

Statewide Furbearer FY2017 1
STATEWIDE REPORT SURVEYS AND INVENTORY
JOB TITLE: Furbearer Surveys and Inventories
STUDY NAME: Furbearer Population Status, Trends, Use, and Associated Habitat Studies
PERIOD COVERED: July 1, 2016 to June 30, 2017
STATEWIDE FURBEARER
Abstract
The Idaho Department of Fish and Game (Department) sold 1,759 trapping licenses for the 2016-2017 season, down 14% from the previous year (2,047). Mandatory harvest reports for the 2016-2017 season were submitted by 1,144 (65%) of the 1,759 licensed trappers (Table 1). Trappers reported harvesting (trapping and hunting) 15,969 animals, down from 23,677 for 2015-2016 and 43,998 for 2014-2015. A total of 7,545 pelts were reported sold for a value estimated at $195,520.77. Pelts sold and estimated value were down from the 11,052 pelts reported sold for a value estimated at $207,373.56 during 2015-2016, and from 26,874 pelts sold for an estimated $363,837.17 for 2014-2015. Statewide rank by dollar value per species pelt was bobcat, wolf, coyote, otter, marten, red fox, spotted skunk, beaver, and mink respectively. Price per pelt for all harvested species ranged from an average of $271.51 for bobcats to $3.89 for muskrat. The top 5 furbearers based upon total dollar value of pelts sold were coyote, bobcat, muskrat, marten, and red fox (Table 2). Bobcat trappers and hunters checked 921 animals, up slightly from from 907 animals the previous season (Table 7). The lynx season has remained closed since the 1995-1996 season. The Department affixed CITES tags to harvested bobcats and otters. Completion of a trapper education course will be mandatory starting July 1, 2018 for anyone who purchased their first Idaho trapping license on or after July 1, 2011.
HISTORICAL PERSPECTIVE
Mandatory Trapper Harvest Reports
By Idaho law, licensed trappers are required to report to the Department the number of wild animals they catch and kill during the open season (Furbearer Rules, Appendix A) and the amount received for the sale of these pelts. The report must be submitted by 31 July, and the trapper cannot purchase a new license unless the report has been received. A self-addressed, postage-paid reporting card is sent to trappers each spring so they may conform to Idaho law. Additionally, trappers are also able to fill out and electronically submit their trapper report card via the Department’s website. Mandatory trapper reports are used to estimate the statewide harvest of furbearers by licensed trappers, the distribution of the harvest, and the market value of the state’s furbearer harvest. Beginning with the 2002-2003 trapping season, questions were added to include Catch-Per-Unit-Effort (CPUE). CPUE measures the harvest per unit of time and can be useful in identifying
Statewide Furbearer FY2017 2
population trends. CPUE is based on the premise that as populations decline, fewer animals are available to be trapped; therefore, CPUE should decline, or vice versa, as populations increase, CPUE would increase. This measure is especially valuable when trapper numbers are stable. However, the result is less reliable when prices fluctuate and the number of new trappers increases or decreases. CPUE is calculated by multiplying the total number of nights trapped by the average number of traps set per night (for a given species) and then dividing the number of animals trapped by this number. CPUE is recorded as animals trapped per 100 trap nights. CITES Export Tags
Bobcats: By Commission rule, trappers and hunters are required to have all bobcats tagged with CITES export tags by the Department within 10 days after the close of the trapping/hunting season. Mandatory reporting has been in effect since the 1981-1982 season. It is unlawful to possess raw, untagged bobcat pelts after 10 days following close of season, and to sell, offer for sale, purchase, or offer to purchase any raw bobcat pelt which does not have an official export tag attached. Trappers and hunters are required to present the pelts of all bobcats to a regional office or official checkpoint to obtain the appropriate pelt tag and complete a harvest report. Information on the harvest report includes the animal’s sex, harvest location, date harvested, method of take (trapping, calling/hunting, with hounds, incidental hunting) and beginning with the 2002-2003 season, CPUE. Mandatory harvest report data continue to be used to estimate the total statewide bobcat harvest by Department administrative region and big game management unit (GMU). Otters: By Commission rule, trappers are required to have all river otters tagged with CITES export tags within 72 hours of harvest (Appendix A). Trappers unable to comply with tagging requirements due to special or unique circumstances must report their harvest to the appropriate regional office or field personnel within 72 hours and make arrangements for tagging at the regional office in the region in which the animal was harvested. The first river otter trapping season since 1972 was authorized during the 2000-2001 trapping season. Based on Department research, quotas were set at 3% of the population estimate for the region. The Commission originally approved a quota of 100 otters statewide. Once the regional quota was reached, trappers had 48 hours in which to have additional otters tagged, with a maximum allowable harvest statewide set at 121 otters. Harvest quotas have fluctuated over the subsequent years and since the 2011-2012 season the statewide quota has been 155. Non target and other mortality accounted for an additional 1-2 dozen otter being harvested annually. The otter season for a region closes 72 hours after the harvest quota is met. Trappers are allowed to keep otters within this 72-hour period, provided their personal quota of 2 has not been reached, which may cause the total harvest to exceed harvest quotas. River otters harvested after the season is closed, or incidental otters in excess of the trapper’s personal quota of 2 are surrendered to the Department. Pelts from non-target or incidentally-captured river otters are either processed and used for educational purposes within the regions or sold at the state fur auction.

Statewide Furbearer FY2017 3
Non-target Catches
Commission rules (IDAPA 13.01.16.150.03a) defines non-target species as any species caught for which the season is closed. By Commission rule any trapper who captures and kills a non-target species must notify the Department through the local conservation officer or regional office within 72 hours to make arrangements for Department personnel to retrieve the animal. The regulation has been in effect since the 1988-1989 season. Beginning with the 1990-1991 trapping season, the Department paid trappers $5.00 for each accidentally-caught fisher and river otter turned in to the Department. Beginning with the 1996-1997 season, trappers also received $5.00 for each accidentally caught lynx or wolverine. Beginning with the 2004-2005 trapping season, the payment increased to $10.00 for each lynx, wolverine, fisher, otter, or bobcat. Additionally, guidelines to reduce injury and minimize non-target catches such as wolverine, fisher, and lynx are printed in the rules brochure. Trappers are also instructed to contact the Department immediately upon catching a wolverine or lynx. Most non-target animals turned in are sold at the Department’s annual fur and horns auction. Since 1991, the proceeds have been earmarked for use in trapper education and trapping management.
STATEWIDE RESULTS
Trapping License Sales
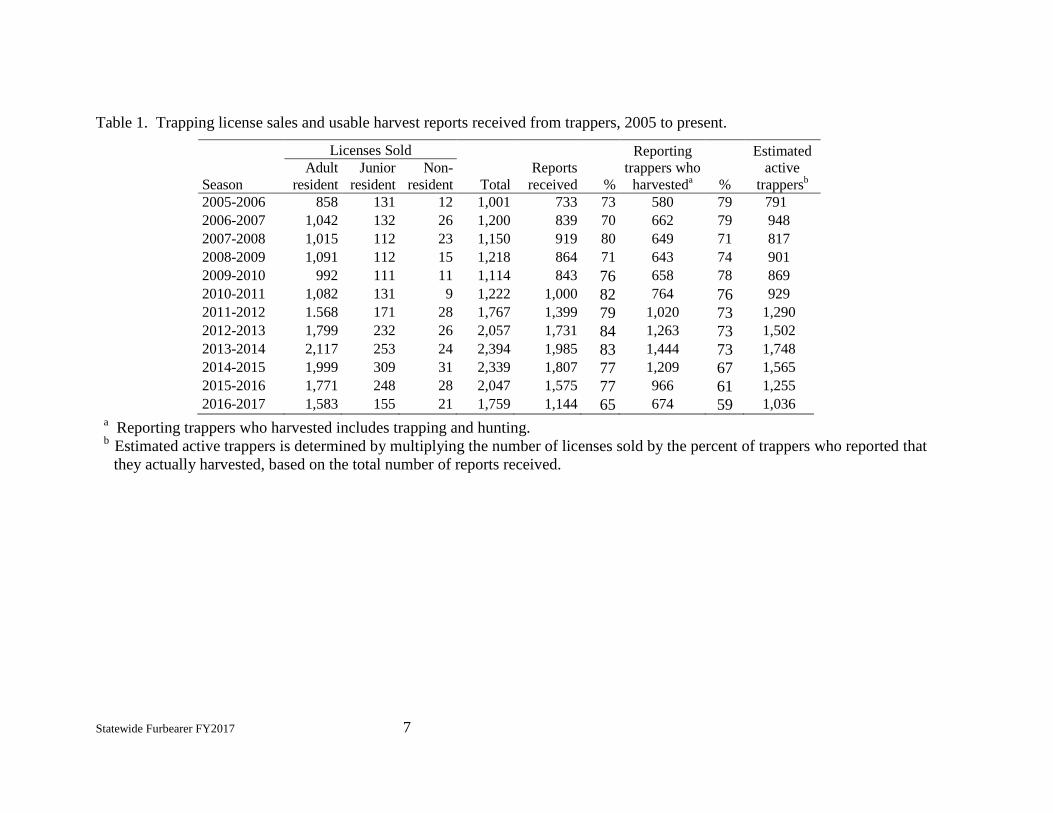
During the 2016-2017 season, 1,759 trapping licenses were sold, including 1,738 residents (1,583 adult and 155 junior residents under 18 years-of-age) and 21 non-residents. The number of licenses sold decreased by 14% from the previous season (Table 1). Mandatory Trapper Harvest Reports
Harvest reports were submitted by 1,144 (65%) of the 1,759 licensed trappers for the 2016-2017 season (Table 1). The fur harvest (trapping and hunting), based on 674 reporting trappers who harvested, was 15,969 animals, down from 23,677 animals in 2015-2016, and 43,998 the previous trapping season (Table 2). The largest decline was with muskrat. There were 7,681 trapped in 2016-2017, 11,979 trapped in 2015-2016, and 30,374 trapped in 2014-2015. These numbers include incidental catches, or those species captured that were not the intended target of the trap. Trappers sold their pelts for an average of $25.88 each, up from $18.76 the previous year. Trappers harvested an average of 24 pelts per trapper and sold an average of 11 pelts. Based on an average pelt price of $25.88 and 11 pelts sold per trapper, trappers earned an average income of $284.68, up from $206.36 the previous season (Table 2). Using an approximation of 65% reporting we can estimate harvest for all trappers, including those who did not submit a report, was 24,568 animals taken and 11,608 pelts sold. We estimate as high as $269,316 in value for pelts sold. The estimated statewide value of pelts sold is $657,501, up from $570,958 previous season (Table 2). Because of human nature and the law requiring a report in order to purchase the next year’s license, those that harvested are more likely to report than those that did not. Therefore, we believe these calculations may be slightly higher than reality.

Statewide Furbearer FY2017 4
Muskrat, coyote, beaver, raccoon, and marten respectively, were the most frequently harvested species. Price per pelt for all harvested species ranged from an average of $271.51 for bobcats ($185.94 in 2015-2016) to $3.89 for muskrats ($2.27 in 2015-2016). The top 5 furbearers based upon total dollar value of pelts sold were coyote, bobcat, muskrat, marten, and red fox (Table 3). Species harvested within a county (Table 4) may be indicative of areas with higher furbearer populations. However, harvest distribution is also partly a function of where trappers live and trap. Catch-Per-Unit-Effort
Catch-Per-Unit-Effort (CPUE) is the number of days the trap is set per number of animals caught as a percentage. It is considered a reflection of population levels because as the ease of capture increases or decreases, it often is an indication of the number of animals available to catch. Trappers trapped more muskrat, beaver, and skunk per 100 trap-nights than other species (Table 5) during the 2016-2017 season. Statewide population trends based on CPUE, based upon animals trapped per 100 trap-nights have fluctuated since implementing the CPUE method; however trends in the past 5 years have mostly stabilized despite increasing numbers of trappers. Statewide population trends based on CPUE over the last five years are stable to increasing for badger, beaver, coyote, marten, mink, otter, raccoon, spotted skunk, stripped skunk, weasel, and wolf. Statewide CPUE over the last five years was slightly decreasing for muskrat, and this species has demonstrated a downward trend for the past 12 years. The 5-year trend in CPUE for bobcats show a marked increase, up from a low of 0.4 in 2014, and 2016 represented the highest reported CPUE in 12 years (Table 6). Badger, skunks, and weasel are usually trapped incidentally to trapping for other species. Some trappers trap specifically for otter, but otters are also trapped incidental to beaver trapping. Many trappers, who report harvest of badger, skunks, weasel, and sometimes otter, do not report trap nights or traps set for these four species since they are trapping for other species. They are not setting traps specifically for these species, thus, CPUE may not be an accurate reflection of population trends for any species due to the number of variables. Mandatory Bobcat CITES Reports
Bobcat harvest based on the CITES tag database provides the data for this report and not the mandatory trapper harvest report. Trappers and hunters checked 921 bobcats for CITES tags in 2016-2017, up from 907 in 2015-2016 (Table 7). The lynx season remained closed. More bobcats were harvested from the panhandle Region (34%) than any other region (Table 8). Trapping accounted for 55% of the statewide bobcat harvest, followed by the use of hounds (29%). Mandatory River Otter CITES Reports
Otter harvest based on the CITES tag database provides the data for this report and not the mandatory trapper harvest report. The Department affixed CITES tags to 81 legally harvested

Statewide Furbearer FY2017 5
otters, including incidental captures, during the 2016-2017 trapping season. Sex ratios of legally harvested river otters were 59% male and 37% female with 4 unknown. No regions met their quota prior to the end of the trapping season. In addition, the Department tagged 17 non-target, illegal, road killed, and unknown cause of mortality otters outside of the season, for a total of 98 otters tagged from July 1, 2016 through June 30, 2017 (Table 9). Otters and Fisher Turned in For Reward
Non-target catches are any species caught for which the season is closed. Incidental catches include captures that were not the intended species. Road killed animals are often collected, tagged when appropriate, and either kept or turned in for a reward depending on species. Trappers were paid $10.00 each for 10 otter (Table 10) and 4 fisher (Table 11) surrendered to the Department for reimbursement. Since the 2004-2005 trapping season, 66 fisher and 156 otter have been turned in for reimbursement. Many of these animals were used for research or sold at the Department’s annual auction with proceeds earmarked for trapper education and related projects. Other animals’ pelts are processed and used for educational purposes. Furbearer Depredation
Beaver continue to be trapped in several regions to address damage complaints. When feasible, these animals are live-trapped and translocated to other areas in attempts to improve riparian habitat or increase the local beaver population. Department conservation officers frequently issue Furbearer Depredation Control Permits (Form WL-2) to individuals as a valuable tool in handling beaver and other furbearer damage complaints quickly and efficiently. Beginning in January 1995, Department administrative regions were required to keep accurate records on the number of permits issued and the number of animals removed. Beaver are typically the most common species in which kill permits are issued, followed by muskrat and raccoon. Magic Valley region staff conducted a habitat suitability survey on Rock Creek to determine the feasibility of releasing beaver within that drainage. Department staff attended the annual meeting of the Wood River RC & D Beaver Committee. Though it is very much a U.S. Forest Service project, Department staff provided technical assistance with the relocation of 14 beaver captured in the Soldier Creek, Little Smoky Creek, and Malad River areas into northeastern portions of the South Hills (Wahlstrom Hollow, Terells Corral, Sawmill Creek, and East Fork Dry Creek). Ten beaver from the same trap locations were released in the Fairfield Ranger District in Willow Creek, Paradise Creek, and Buttercup Creek. Upper Snake region Department employees and volunteers live trapped and relocated 13 beaver to relocation sites on Targhee Caribou National Forest. Department employees and volunteers also assisted the forest service in the installation of 12 Beaver Dam Analogues. Administrative Activities and Coordination
Public input on proposed 2016-2018 furbearer seasons was collected at regional offices and the state office via a survey on the Department’s website. In January 2016, the Commission set

Statewide Furbearer FY2017 6
furbearer harvest rules for the 2016-2018 seasons which were valid from February 1, 2016 through June 30, 2018. Management Actions
1. The Commission decided to gather public input on changing rules to require mandatory trapper education. Negotiated Rule-Making was initiated in April, 2015 and finalized in July 2105, and a proposal to require education was submitted to the commission following public input. The commission voted to accept the proposal to require mandatory trapper education for all new trappers and those purchasing their first trapping license on or after 1 July 2011 to be implemented by 1 July 2018 if the state legislature approves the rules during the 2017 session.
2. The Clearwater region ran 100 plus hair snares surveying for fishers in the Elk City area. They also deployed 3 GPS collars on adult female fisher in the same area, resulting in > 2000 locations. Joel Sauder also developed and deployed 16 steady scent pumps to survey for forest carnivores in remote areas.
3. R3-McCall, in collaboration with the Payette and Boise National Forests, ran 9 baited camera-hair snare stations during winter 2015/16. The primary purpose of this camera survey was to continue to monitor the presence of wolverines (Gulo gulo) marked during the Central Idaho Wolverine–Winter Recreation Study, document appearance of new wolverines, and collect occurrence data on other forest carnivores. We collected photos of wolverines at 8 out of 9 stations. We detected marten (Martes americana) on camera at the same 8 stations as wolverines. No fishers (Martes pennanti) were detected at any station. No wolverines had ear tags from previous handling; thus, individuals were not definitively identified from photos alone. From 28 DNA samples sent to the USFS Rocky Mountain Research Station National Genomics Center for Wildlife and Fish Conservation, we confirmed 4 known wolverines from the winter recreation study: M4, M12, F6, and F10. F6 had not been confirmed since 2011. Using a combination of DNA and photo evidence, we confirmed 2 additional wolverines. F10 was wearing a radio-telemetry collar deployed in April 2014. We installed a portable trap at the Hard Creek camera station in an attempt to capture her and remove the collar, but she did not trigger the trap. Our results from camera stations continue the trend of apparent lower densities of wolverines in the McCall/Warm Lake study area now compared with the initial years of the Central Idaho Wolverine–Winter Recreation Study. The McCall/Warm Lake area is known to support resident wolverines and consistent wolverine activity. Continued monitoring at some level, either every year or every 2–3 years, would enhance our understanding of this important subpopulation.
Statewide Furbearer FY2017 7
Table 1. Trapping license sales and usable harvest reports received from trappers, 2005 to present.
Licenses Sold Reporting trappers who
harvesteda
Estimated active
trappersb Season Adult
resident Junior
resident Non-
resident Total Reports
received % % 2005-2006 858 131 12 1,001 733 73 580 79 791 2006-2007 1,042 132 26 1,200 839 70 662 79 948 2007-2008 1,015 112 23 1,150 919 80 649 71 817 2008-2009 1,091 112 15 1,218 864 71 643 74 901 2009-2010 992 111 11 1,114 843 76 658 78 869 2010-2011 1,082 131 9 1,222 1,000 82 764 76 929 2011-2012 1.568 171 28 1,767 1,399 79 1,020 73 1,290 2012-2013 1,799 232 26 2,057 1,731 84 1,263 73 1,502 2013-2014 2,117 253 24 2,394 1,985 83 1,444 73 1,748 2014-2015 1,999 309 31 2,339 1,807 77 1,209 67 1,565 2015-2016 1,771 248 28 2,047 1,575 77 966 61 1,255 2016-2017 1,583 155 21 1,759 1,144 65 674 59 1,036
a Reporting trappers who harvested includes trapping and hunting. b Estimated active trappers is determined by multiplying the number of licenses sold by the percent of trappers who reported that
they actually harvested, based on the total number of reports received.

Statewide Furbearer FY2017 8
Table 2. Statewide furbearers trapped, harvested, and pelt value based on trappers who reported, 2016-2017.
Species
Trappers reporting a harvest
Animals trapped
Pelts/ trappera
Animals hunted
Total Animals harvested
(a)
Animals sold (b)
% Sold
(b / a)
Money received
(c)
Price/ Peltb
(c / b = d)
Total Dollar value
(a * d = e)
% of total value
Estimated statewide pelt valuec
(e / .65) Badger 63 271 4 9 280 57 20% $1,066.25 $18.71 $5,237.72 1.23% $8,058.03 Beaver 253 1,302 5 0 1,302 261 20% $4,294.59 $16.45 $21,423.59 5.01% $32,959.36 Bobcatd 190 447 2 22 469 220 47% $59,732.59 $271.51 $127,339.02 29.80% $195,906.19 Coyote 334 2,596 8 691 3,287 1,704 52% $89,409.65 $52.47 $172,470.38 40.36% $265,339.04 Marten 75 591 8 0 591 356 60% $12,122.60 $34.05 $20,124.88 4.71% $30,961.35 Mink 106 356 3 0 356 169 47% $2,281.60 $13.50 $4,806.21 1.12% $7,394.17 Muskrat 221 7,681 35 0 7,681 4,280 56% $16,660.88 $3.89 $29,900.05 7.00% $46,000.08 Otterd 47 56 1 0 56 7 13% $290.00 $41.43 $2,320.00 0.54% $3,569.23 Raccoon 165 715 4 15 730 168 23% $1,345.09 $8.01 $5,844.74 1.37% $8,991.90 Red Fox 141 558 4 6 564 186 33% $4,489.65 $24.14 $13,613.78 3.19% $20,944.27 St Skunk 86 522 6 0 522 115 22% $1,313.87 $11.42 $5,963.83 1.40% $9,175.12 Sp Skunk 6 8 1 0 8 4 50% $94.00 $23.50 $188.00 0.04% $289.23 Weasel 24 38 2 0 38 8 21% $35.00 $4.38 $166.25 0.04% $255.77 Wolf 103 78 1 7 85 10 12% $2,115.00 $211.50 $17,977.50 4.21% $27,657.69 Actual Total (65%) 15,219 -- 750 15,969 7,545 -- $195,250.77 $25.88 $427,375.93 Est. Total (100%)c 23,414 1,154 24,568 11,608 $300,385.80 -- 100.00% $657,504.44
a Pelts/trapper is determined by animals trapped only. b Plus and minus reflects upward or downward trends in pelt value. c Estimated totals and statewide pelt values were determined based on the assumption that the harvest reported by trappers
represented65% of actual harvest if all active trappers had submitted a harvest report. d Reflects only the number reported by trappers on the mandatory report card.

Statewide Furbearer FY2017 9
Table 3. History of statewide rank by total dollar value for animals trapped 2005 to present.
Speciesa
Season Badger Beaver Bobcat Coyote Marten Mink Muskrat Otter Raccoon Red fox
Spotted skunk
Striped skunk Weasel Wolfb
2005-2006 11 3 1 2 5 7 4 8 9 6 13 10 12 2006-2007 9 4 1 2 5 8 3 10 7 6 13 11 12 2007-2008 8 3 1 2 4 9 5 10 6 7 11 12 2008-2009 10 2 1 4 5 8 3 9 7 6 13 11 12 2009-2010 10 4 1 3 5 8 2 9 7 6 13 11 12 2010-2011 9 4 1 3 5 8 2 10 7 6 13 11 12 2011-2012 11 5 1 3 4 7 2 10 8 6 14 12 13 9 2012-2013 12 5 1 4 3 9 2 10 8 6 13 11 14 7 2013-2014 12 5 1 3 4 9 2 10 8 6 14 11 13 7 2014-2015 12 5 2 1 4 10 3 11 8 7 13 9 14 6 2015-2016 11 4 2 1 6 12 5 10 9 7 13 8 14 3 2016-2017 11 6 2 1 4 7 3 12 9 5 13 10 14 8
a Non-target “other” species trapped are excluded from this ranking. b Wolves were not trapped until 2011-2012..

Statewide Furbearer FY2017 10
Table 4. Distribution of furbearer harvest in Idaho by county, as reported by trappers*, 2016-2017.
Species
County Badger Beaver Bobcat Coyote Marten Mink Muskrat Otter Raccoon Red Fox
Striped skunk
Spotted skunk Weasel Wolf
Ada 135 77 1 151 28 415 51 33 72 2 Adams 14 4 35 11 88 7 5 1 0 Bannock 0 11 3 24 3 39 0 12 1 2 Bear Lake 3 97 3 38 11 502 5 15 4 5 2 Benewah 1 32 7 25 0 6 165 1 3 13 Bingham 10 26 4 65 3 134 1 13 7 12 Blaine 3 6 5 45 3 7 3 Boise 86 2 4 5 1 11 1 10 7 12 Bonner 63 28 27 44 6 31 6 3 15 2 11 Bonneville 7 95 12 77 52 9 120 20 14 11 0 Boundary 70 11 36 3 301 7 18 1 16 Butte 13 80 3 0 Camas 3 6 62 6 5 1 2 35 3 Canyon 39 94 37 34 344 2 66 24 54 Caribou 1 54 0 35 1 26 437 27 12 4 3 Cassia 1 38 88 3 85 5 32 15 0 Clark 6 4 102 11 20 2 15 3 Clearwater 1 28 12 11 31 13 51 78 5 0 9 Custer 6 106 10 137 39 6 268 5 11 6 1 1 Elmore 2 38 4 210 20 2 903 2 31 92 27 Franklin 2 4 0 9 9 9 90 46 5 Fremont 9 104 63 113 18 294 5 24 54 25 2 Gem 16 2 8 111 1 4 6 6 Gooding 7 27 9 89 10 663 4 10 20 19 4 Idaho 14 61 79 73 60 38 2 8 11 15 2 14 Jefferson 4 5 0 54 4 3 640 107 1 38 Jerome 8 4 38 10 18 4 12 3 Kootenai 34 21 60 8 175 0 35 7 5 0

Statewide Furbearer FY2017 11
Species
County Badger Beaver Bobcat Coyote Marten Mink Muskrat Otter Raccoon Red Fox
Striped skunk
Spotted skunk Weasel Wolf
Latah 12 3 68 0 1 2 11 17 1 Lemhi 5 64 29 159 55 20 400 3 16 74 27 4 Lewis 0 1 1 0 Lincoln 6 5 7 112 2 55 4 5 2 Madison 4 0 10 6 582 0 19 0 14 Minidoka 57 3 216 10 4 15 Nez Perce 6 5 69 1 8 13 1 Oneida 1 1 3 60 1 8 2 Owyhee 13 32 31 77 1 300 3 7 8 19 Payette 1 9 0 6 5 1 0 1 Power 1 7 62 22 0 5 1 Shoshone 54 58 19 9 2 12 4 6 5 19 Teton 7 24 30 101 1 8 1 1 Twin Falls 8 31 36 244 38 155 5 44 30 15 1 Valley 2 8 1 75 6 2 1 1 48 2 0 1 Washington 1 11 6 8 21 2 2 8 0
*Harvest reported by trappers for bobcat and otter are different than harvest recorded with CITES tags which include all harvest.

Statewide Furbearer FY2017 12
Table 5. Catch-Per-Unit Effort data from trapper report cards, 2016-2017.
Species
Number of animals trappeda
(a)
Total number of nights trapped
(b)
Average number of traps set/night
(c) CPUE
a/(b*c) * 100 Badger 271 1,532 9 2.00 Beaver 1,302 4,606 5 5.97 Bobcat 447 5,011 10 0.88 Coyote 2,596 10,570 15 1.61 Marten 591 1,593 16 2.36 Mink 356 2,559 9 1.59 Muskrat 7,681 5,166 17 8.83 Otter 56 829 3 2.39 Raccoon 715 4,037 5 3.39 Red Fox 558 3,679 12 1.32 Striped skunk 522 2,007 7 3.86 Spotted skunk 8 66 8 1.52 Weasel 38 686 3 1.77 Wolf 78 4,914 15 0.10
a Reflects only animals trapped and does not include animals hunted.

Statewide Furbearer FY2017 13
Table 6. Catch-Per-Unit Effort based on trappers reporting they trapped, 2005 to present.
CPUE by species
Year Badger Beaver Bobcat Coyote Marten Mink Muskrat Otter Raccoon Red Fox
Spotted skunk
Striped skunk Weasel Wolfa
2005-2006 0.85 8.39 0.70 2.10 4.09 1.96 15.42 2.17 2.78 3.05 0.98 3.69 2.71 2006-2007 1.12 8.00 0.85 2.23 4.07 2.23 11.70 2.13 3.24 2.26 0.51 2.69 2.24 2007-2008 1.10 7.04 0.58 1.19 2.87 1.25 10.92 1.71 2.66 2.05 0 1.90 1.04 2008-2009 1.30 6.32 0.42 2.18 2.74 1.62 13.11 1.71 2.35 1.93 0.93 2.75 0.78 2009-2010 0.83 5.28 0.47 1.76 3.04 1.30 11.97 0.60 1.78 1.87 0.36 1.89 1.55 2010-2011 1.01 6.72 0.70 1.71 2.88 1.94 12.48 3.37 2.90 1.65 0.69 1.85 1.52 2011-2012 1.13 5.15 0.46 1.74 2.47 1.54 12.27 2.84 2.72 1.91 0.78 3.28 1.31 0.14 2012-2013 1.75 5.26 0.42 1.37 2.51 1.43 10.56 2.63 2.82 1.64 0.82 2.44 1.90 0.08 2013-2014 0.87 5.59 0.42 1.40 2.17 1.38 9.68 1.23 2.74 1.20 0.55 2.14 1.56 0.08 2014-2015 1.34 4.93 0.40 1.51 2.43 1.42 9.94 1.58 2.36 1.42 0.83 2.49 1.57 0.10 2015-2016 1.12 5.77 0.62 1.90 2.02 1.50 9.11 2.47 2.28 1.34 3.02 0.62 1.46 0.14 2016-2017 2.00 5.97 0.88 1.61 2.36 1.59 8.83 2.39 3.39 1.32 3.86 1.52 1.77 0.10
a Wolf trapping seasons began in 2011-2012

Statewide Furbearer FY2017 14
Table 7. Bobcat pelts tagged with USFWS CITES export tags by IDFG, 2006 to present. Year Bobcata
2006-2007 2,404 2007-2008 1,452 2008-2009 1,013 2009-2010 971 2010-2011 1,430 2011-2012 1676 2012-2013 1,563 2013-2014 1,421 2014-2015 865 2015-2016 907 2016-2017 921
a Pelts confiscated by IDFG are included in the bobcat totals for 2004-2005 (2), 2005-2006 (1), 2007-2008 (2), and 2008-2009 (9).
Table 8. Bobcat harvest (CITES tagged) by method of take reported by Region, 2016-2017.
Method of Takea
Region Total
harvest % Trapping % Calling % With
hounds % Incidental hunting %
Panhandle 310 34 151 30 7 19 132 50 13 15 Clearwater 182 20 77 15 4 11 80 30 14 17 Southwest 160 17 80 16 15 41 23 9 38 45 Magic Valley 124 13 114 22 2 5 4 2 2 2 Southeast 49 5 22 4 3 8 14 5 10 12 Upper Snake 38 4 29 6 3 8 0 0 2 2 Salmon 58 6 36 7 3 8 13 5 5 6 Total 921 100 509 100 37 100 266 100 84 100
a Percentages rounded to the nearest whole number. Table 9. Otter pelts (CITES tagged) by Region during 2016-2017 season.
River otter quota, sex, and harvest by region Region Harvest
quota Date quota
reached Male Female Unk Totala b
Harvested Panhandle 40 20 7 27 Clearwater 20 7 1 1 9 Southwest 20 10 5 15 Magic Valley 30 7 9 1 17 Southeast 15 3 5 8 Upper Snake 15 8 6 2 16 Salmon 15 3 3 6 Total 155 58 36 4 98 a Total harvest may exceed harvest quota. The otter trapping season closes in each region 72 hours after the
harvest quota for that region is met. Trappers are allowed to keep otters within this 72-hour period provided their personal quota of 2 has not been reached.
b Total includes non-target, road kill, illegal, and unknown mortality otters

Statewide Furbearer FY2017 15
Table 10. Otters caught by trappers and turned in for a rewarda, 2006 to present.
Species Regionb where otters were trappedc Season 1 2 3 4 5 6 7 Unk. Total 2006-2007 1 0 6 1 0 3 5 0 16 2007-2008 0 4 3 6 1 1 0 0 15 2008-2009 2 2 1 3 1 1 1 1 12 2009-2010 1 3 0 4 1 0 0 0 9 2010-2011 4 4 1 4 0 0 2 0 15 2011-2012 6 7 1 0 0 2 0 0 16 2012-2013 6 3 3 5 1 0 2 0 20 2013-2014 1 1 11 2 2 4 3 0 24 2014-2015 6 2 2 0 2 1 0 1 14 2015-2016 5 3 5 1 0 0 1 0 15 2016-2017 0 2 5 0 0 2 1 0 10 Total 32 31 38 26 8 14 15 2 166
a Rewards are offered ($10) for non-target or accidentally captured otters. b Regional numbers correlate from 1 to 7 for Panhandle, Clearwater, Southwest, Magic Valley,
Southeast, Upper Snake, and Salmon Regions respectively. b Figures do not include road-kills and other unknown mortalities. Figures only include
non-targets that were surrendered to the Department. Table 11. Non-target fisher reported caught by trappers turned in for a reward, 2006 to present.
aRegion where fisher were trappedb Season 1 2 3 4 5 6 7 Total 2006-2007 0 5 0 0 0 0 0 5 2007-2008 0 5 0 0 0 0 0 5 2008-2009 1 0 0 0 0 0 0 1 2009-2010 1 5 1 0 0 0 0 7 2010-2011 0 5 0 0 0 0 0 5 2011-2012 2 4 0 0 0 0 0 6 2012-2013 2 5 0 0 0 0 0 7 2013-2014 6 13 1 0 0 0 0 20 2014-2015 1 1 0 0 0 0 0 2 2015-2016 2 2 0 0 0 0 0 4 2016-2017 0 4 0 0 0 0 0 4 Total 15 45 2 0 0 0 0 66
a Regional numbers correlate from 1 to 7 for Panhandle, Clearwater, Southwest, Magic Valley, Southeast, Upper Snake, and Salmon Regions respectively.
b Figures do not include road-kills and other unknown mortalities. Figures only include non-targets that were surrendered to the Department.

Statewide Furbearer FY2017 16
6BAPPENDIX A
IDAHO
2016-2017 SEASON
TRAPPING RULES

Statewide Furbearer 2016 17

Statewide Furbearer 2016 18

Statewide Furbearer 2016 19

Statewide Furbearer 2016 20

Statewide Furbearer 2016 21

Statewide Furbearer 2016 22

Statewide Furbearer 2016 23

Statewide Furbearer 2016 24

Statewide Furbearer 2016 25

Statewide Furbearer 2016 26

Statewide Furbearer 2016 27

Statewide Furbearer 2016
Submitted by: DDDavid Smith Grants/Contracts Specialist Approved by: IDAHO DEPARTMENT OF FISH AND GAME Toby Boudreau Assistant Chief, Bureau of Wildlife Federal Aid Coordinator Scott Reinecker, Chief Bureau of Wildlife

IDAHO
GAME MANAGEMENT UNITS

FEDERAL AID IN WILDLIFE RESTORATION
The Federal Aid in Wildlife Restoration Program consists of funds from a
10% to 11% manufacturer’s excise tax collected from the sale of
handguns, sporting rifles, shotguns, ammunition, and archery equipment.
The Federal Aid program then allots the funds back to states through a
formula based on each state’s
geographic area and the number of
paid hunting license holders in the
state. The Idaho Department of
Fish and Game uses the funds to
help restore, conserve, manage,
and enhance wild birds and
mammals for the public benefit.
These funds are also used to
educate hunters to develop the skills, knowledge, and attitudes necessary
to be responsible, ethical hunters. Seventy-five percent of the funds for
this project are from Federal Aid. The other 25% comes from license-
generated funds.