
Idaho Basin Outlook Report January 2013
27
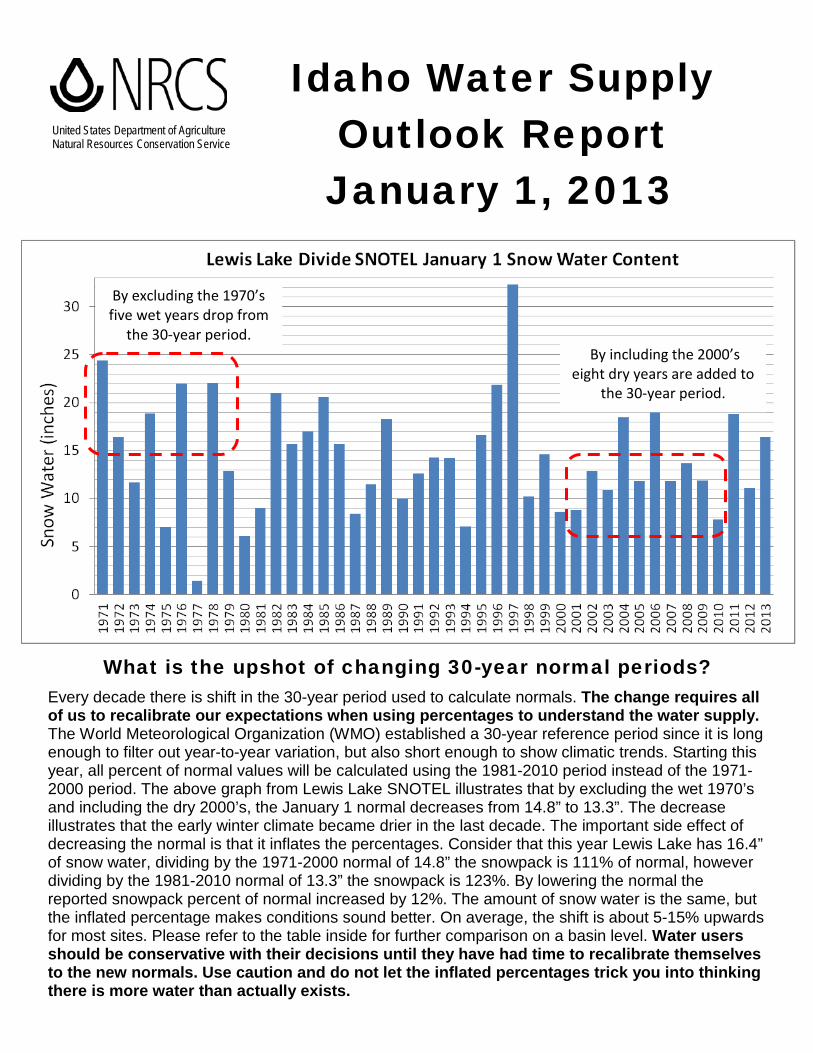
Idaho Water Supply Outlook Report January 1, 2013 What is the upshot of changing 30-year normal periods? Every decade there is shift in the 30-year period used to calculate normals. The change requires all of us to recalibrate our expectations when using percentages to understand the water supply. The World Meteorological Organization (WMO) established a 30-year reference period since it is long enough to filter out year-to-year variation, but also short enough to show climatic trends. Starting this year, all percent of normal values will be calculated using the 1981-2010 period instead of the 1971- 2000 period. The above graph from Lewis Lake SNOTEL illustrates that by excluding the wet 1970’s and including the dry 2000’s, the January 1 normal decreases from 14.8” to 13.3”. The decrease illustrates that the early winter climate became drier in the last decade. The important side effect of decreasing the normal is that it inflates the percentages. Consider that this year Lewis Lake has 16.4” of snow water, dividing by the 1971-2000 normal of 14.8” the snowpack is 111% of normal, however dividing by the 1981-2010 normal of 13.3” the snowpack is 123%. By lowering the normal the reported snowpack percent of normal increased by 12%. The amount of snow water is the same, but the inflated percentage makes conditions sound better. On average, the shift is about 5-15% upwards for most sites. Please refer to the table inside for further comparison on a basin level. Water users should be conservative with their decisions until they have had time to recalibrate themselves to the new normals. Use caution and do not let the inflated percentages trick you into thinking there is more water than actually exists. United States Department of Agriculture Natural Resources Conservation Service By excluding the 1970’s five wet years drop from the 30-year period. By including the 2000’s eight dry years are added to the 30-year period.
-
Upload
john-parsons -
Category
Documents
-
view
216 -
download
1
description
Here is the January Basin Outlook Report from the US NRCS in Idaho
Transcript of Idaho Basin Outlook Report January 2013
Idaho Water Supply Outlook Report January 1, 2013
What is the upshot of changing 30-year normal periods?
Every decade there is shift in the 30-year period used to calculate normals. The change requires all of us to recalibrate our expectations when using percentages to understand the water supply. The World Meteorological Organization (WMO) established a 30-year reference period since it is long enough to filter out year-to-year variation, but also short enough to show climatic trends. Starting this year, all percent of normal values will be calculated using the 1981-2010 period instead of the 1971-2000 period. The above graph from Lewis Lake SNOTEL illustrates that by excluding the wet 1970’s and including the dry 2000’s, the January 1 normal decreases from 14.8” to 13.3”. The decrease illustrates that the early winter climate became drier in the last decade. The important side effect of decreasing the normal is that it inflates the percentages. Consider that this year Lewis Lake has 16.4” of snow water, dividing by the 1971-2000 normal of 14.8” the snowpack is 111% of normal, however dividing by the 1981-2010 normal of 13.3” the snowpack is 123%. By lowering the normal the reported snowpack percent of normal increased by 12%. The amount of snow water is the same, but the inflated percentage makes conditions sound better. On average, the shift is about 5-15% upwards for most sites. Please refer to the table inside for further comparison on a basin level. Water users should be conservative with their decisions until they have had time to recalibrate themselves to the new normals. Use caution and do not let the inflated percentages trick you into thinking there is more water than actually exists.
United States Department of Agriculture Natural Resources Conservation Service
By excluding the 1970’s five wet years drop from
the 30-year period. By including the 2000’s
eight dry years are added to the 30-year period.

For more water supply and resource management information, or to subscribe to this publication Contact - - Your local county Natural Resources Conservation Service Office
or Natural Resources Conservation Service Internet Web Address Snow Surveys http://www.id.nrcs.usda.gov/snow/ 9173 West Barnes Drive, Suite C Boise, Idaho 83709-1574 (208) 378-5740
To join a free email subscription list contact us by email at: [email protected]
Basin Outlook Reports and Federal - State - Private Cooperative Snow Surveys
How forecasts are made Most of the annual streamflow in the western United States originates as snowfall that has accumulated in the mountains during the winter and early spring. As the snowpack accumulates, hydrologists estimate the runoff that will occur when the snow melts. Measurements of snow water equivalent at selected manual snow courses and automated SNOTEL sites, along with precipitation, antecedent streamflow, and indices of the El Niño / Southern Oscillation are used in computerized statistical and simulation models to produce runoff forecasts. Unless otherwise specified, all forecasts are for flows that would occur naturally without any upstream influences. Forecasts of any kind, of course, are not perfect. Streamflow forecast uncertainty arises from three primary sources: (1) uncertain knowledge of future weather conditions, (2) uncertainty in the forecasting procedure, and (3) errors in the data. The forecast, therefore, must be interpreted not as a single value but rather as a range of values with specific probabilities of occurrence. The middle of the range is expressed by the 50% exceedance probability forecast, for which there is a 50% chance that the actual flow will be above, and a 50% chance that the actual flow will be below, this value. To describe the expected range around this 50% value, four other forecasts are provided, two smaller values (90% and 70% exceedance probability) and two larger values (30%, and 10% exceedance probability). For example, there is a 90% chance that the actual flow will be more than the 90% exceedance probability forecast. The others can be interpreted similarly. The wider the spread among these values, the more uncertainty is in the forecast. As the season progresses, forecasts become more accurate, primarily because a greater portion of the future weather conditions become known; this is reflected by a narrowing of the range around the 50% exceedance probability forecast. Users should take this uncertainty into consideration when making operational decisions by selecting forecasts corresponding to the level of risk they are willing to assume about the amount of water to be expected. If users anticipate receiving a lesser supply of water, or if they wish to increase their chances of having an adequate supply of water for their operations, they may want to base their decisions on the 90% or 70% exceedance probability forecasts, or something in between. On the other hand, if users are concerned about receiving too much water (for example, threat of flooding), they may want to base their decisions on the 30% or 10% exceedance probability forecasts, or something in between. Regardless of the forecast value users choose for operations, they should be prepared to deal with either more or less water. (Users should remember that even if the 90% exceedance probability forecast is used, there is still a 10% chance of receiving less than this amount.) By using the exceedance probability information, users can easily determine the chances of receiving more or less water.
The U.S. Department of Agriculture (USDA) prohibits discrimination against its customers. If you believe you experienced discrimination when obtaining services from USDA, participating in a USDA program, or participating in a program that receives financial assistance from USDA, you may file a complaint with USDA. Information about how to file a discrimination complaint is available from the Office of the Assistant Secretary for Civil Rights. USDA prohibits discrimination in all its programs and activities on the basis of race, color, national origin, age, disability, and where applicable, sex (including gender identity and expression), marital status, familial status, parental status, religion, sexual orientation, political beliefs, genetic information, reprisal, or because all or part of an individual’s income is derived from any public assistance program. (Not all prohibited bases apply to all programs.) To file a complaint of discrimination, complete, sign, and mail a program discrimination complaint form, available at any USDA office location or online at www.ascr.usda.gov, or write to: USDA, Office of the Assistant Secretary for Civil Rights, 1400 Independence Avenue, SW, Washington, DC 20250-9410. Or call toll free at (866) 632-9992 (voice) to obtain additional information, the appropriate office or to request documents. Individuals who are deaf, hard of hearing, or have speech disabilities may contact USDA through the Federal Relay service at (800) 877-8339 or (800) 845-6136 (in Spanish). USDA is an equal opportunity provider, employer, and lender. Persons with disabilities who require alternative means for communication of program information (e.g. Braille, large print, audiotape, etc.) should contact USDA's TARGET Center at (202) 720-2600 (voice and TDD).

IDAHO WATER SUPPLY OUTLOOK REPORT JANUARY 1, 2013
SUMMARY
The climatic variability we saw in 2012 is continuing into the 2013 water year, already resulting in a unique snowpack situation throughout the state. Here is what we know: the anticipated El Nino oceanic condition that developed in the summer changed to a neutral condition by fall’s end. This is good news, as neutral conditions tend to be associated with near normal precipitation across most of the Western United States. However, we have not seen a year with a mid-season switch in quite a while. Warm valley temperatures in November allowed mostly rain to fall up to 6,500 feet. Cold temperatures above 7,000 feet allowed this abundant moisture to fall as snow several feet thick in Idaho’s central mountains. As a result, a handful of sites above 7,000 feet in central Idaho were reporting record high snow water content levels in December while their neighboring lower elevation sites were reporting near record low levels.
In the Payette basin Squaw Flat and Brundage Reservoir SNOTEL sites received more than 25 inches total precipitation since the water year started October 1, a near record. In the Panhandle Region Hidden Lake and Bear Mountain SNOTEL sites each received over 40 inches of precipitation since October 1; not a record, but just a lot of rain and snow. This region as a whole has received nearly half of its normal annual precipitation in the first three months of the water year!
The lowest January 1 snowpacks are in Idaho’s lower elevation watersheds, the Weiser and Owyhee, with 68% and 83% of normal, respectively. The highest snowpack is 163% in the Big Lost basin, which has over two-thirds of its early April seasonal peak! The key to good snow this year is elevation. The higher your mountains, the better your snowpack. The Lost River Range and Pioneer Mountains are home to most of the tallest peaks in Idaho and host Idaho’s highest snowpack percentages.
What is certain is that there is water in the bank. Overall, most Idaho reservoirs are 80-115% of average with the exception of a few in central and southern Idaho at 30-65% of average. Soil moisture recovered from the dry summer and is in good shape from the November rain, especially in northern Idaho. Streamflow forecasts mirror the snowpack ranging from 65-75% of average in the Bear and Salmon Falls basins to 110-135% in the Wood and Lost basins. Keep in mind, last April when a large percent of snow in the mid-elevations melted, but the remaining higher elevation snow was enough to sustain good flows in the basins north of the Snake River. Will history repeat itself with a well above average snowpack at higher elevations? Stay tuned with winter just starting December 21; we are not even half way through the season. The persistent storm track from November and December has subsided and the cold, clear weather in late December and early January is now dropping snowpack percentages several points a day.
SNOWPACK
As the saying goes, if you could take Idaho and roll it flat, Idaho would be bigger than Texas. To understand your snowpack this year, you really have to understand the elevation in your basin and amount of land above certain thresholds. These elevation thresholds are playing a critical role where snow falls and accumulates this year. Air temperature decreases three to four degrees per 1000 feet elevation gain and because the storms in November and December were warmer than normal there was a distinct dividing line between rain and snow. If you tend to lump things together, basin snowpack percentages as a whole range from 130-160% of normal in Idaho’s central mountains to 68% in the Weiser basin. Elsewhere the snowpack is near normal at 80-120% of the new 1981-2010
medians. However, if you are a splitter, the snowpack in the Boise basin is only 58% of normal below 6,500 feet, and 123% of normal above this elevation; overall the Boise snowpack is 98% of normal. Also interesting is that the snow water content at Cozy Cove, Graham Guard Station and Bogus Basin SNOTEL sites, all below 6,100 feet, is near record low levels since daily records start. In the Little Wood basin, 7,000 feet is the dividing zone between a really good snowpack of 150% of normal and an above normal snowpack of 115%. In the Big Wood basin, 6,000 feet is the dividing band between below normal snow at Camas Creek and Soldier Ranger Station, and sites in the 7,400-8,800 foot elevation zone that are 150% of normal.
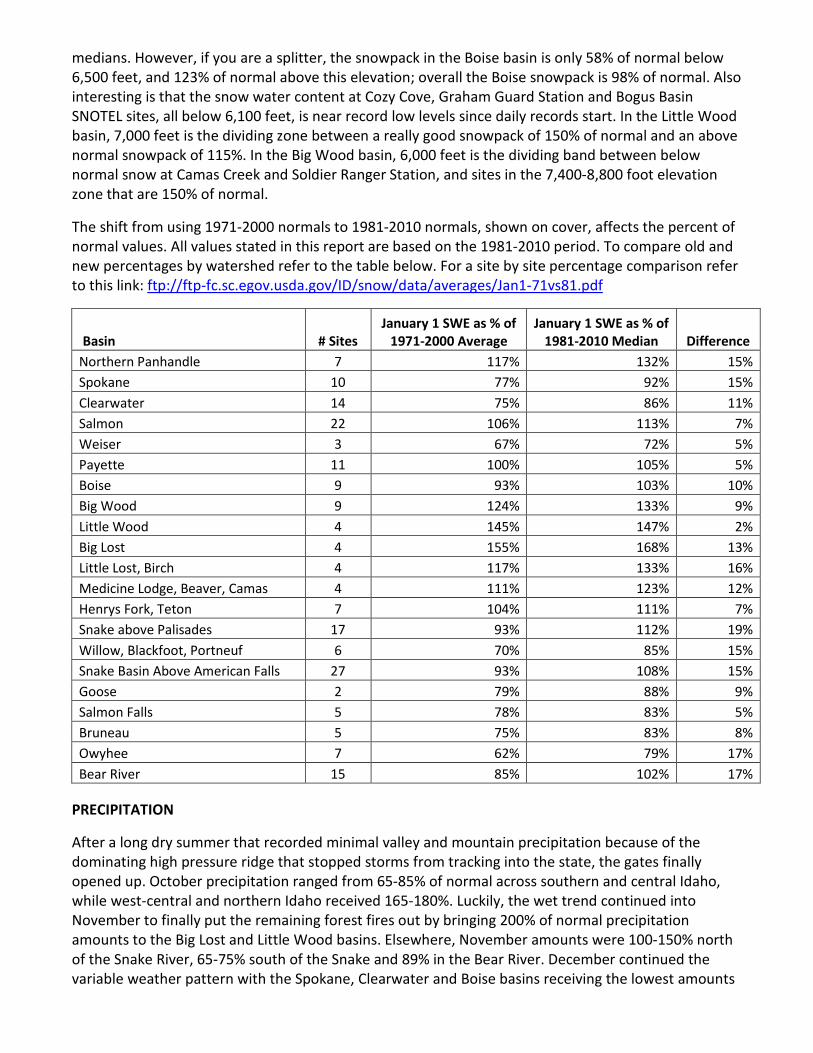
The shift from using 1971-2000 normals to 1981-2010 normals, shown on cover, affects the percent of normal values. All values stated in this report are based on the 1981-2010 period. To compare old and new percentages by watershed refer to the table below. For a site by site percentage comparison refer to this link: ftp://ftp-fc.sc.egov.usda.gov/ID/snow/data/averages/Jan1-71vs81.pdf
Basin # Sites January 1 SWE as % of
1971-2000 Average January 1 SWE as % of
1981-2010 Median Difference Northern Panhandle 7 117% 132% 15% Spokane 10 77% 92% 15% Clearwater 14 75% 86% 11% Salmon 22 106% 113% 7% Weiser 3 67% 72% 5% Payette 11 100% 105% 5% Boise 9 93% 103% 10% Big Wood 9 124% 133% 9% Little Wood 4 145% 147% 2% Big Lost 4 155% 168% 13% Little Lost, Birch 4 117% 133% 16% Medicine Lodge, Beaver, Camas 4 111% 123% 12% Henrys Fork, Teton 7 104% 111% 7% Snake above Palisades 17 93% 112% 19% Willow, Blackfoot, Portneuf 6 70% 85% 15% Snake Basin Above American Falls 27 93% 108% 15% Goose 2 79% 88% 9% Salmon Falls 5 78% 83% 5% Bruneau 5 75% 83% 8% Owyhee 7 62% 79% 17% Bear River 15 85% 102% 17%
PRECIPITATION
After a long dry summer that recorded minimal valley and mountain precipitation because of the dominating high pressure ridge that stopped storms from tracking into the state, the gates finally opened up. October precipitation ranged from 65-85% of normal across southern and central Idaho, while west-central and northern Idaho received 165-180%. Luckily, the wet trend continued into November to finally put the remaining forest fires out by bringing 200% of normal precipitation amounts to the Big Lost and Little Wood basins. Elsewhere, November amounts were 100-150% north of the Snake River, 65-75% south of the Snake and 89% in the Bear River. December continued the variable weather pattern with the Spokane, Clearwater and Boise basins receiving the lowest amounts

at 115% of normal while the Big Lost, Oakley, Bruneau, and Owyhee basins were the wettest at 150%. Precipitation since the water year started October 1 ranges from a high of 150% of normal in the Panhandle Region, Big Lost and Little Wood basins to 100-105% of normal across southern Idaho and the Upper Snake. Additional concerns this season are possible rapid melt from rain or an earlier melt because of the loss of canopy and blackened areas in the many acres that burned. A gradual spring melt with moderate spring precipitation would be ideal to re-establish vegetation in the burned areas.
RESERVOIRS
Idaho’s reservoirs are in good shape this year with some water in the account and snow in the high country waiting to melt and fill them up. From north to south: Pend Oreille and Priest lakes are above average while Coeur d’Alene is below and waiting for another low elevation runoff event. Dworshak Reservoir is 63% of average. The Payette and Boise reservoir systems are storing near average totals. Magic Reservoir is low at 23% of average, 10% of capacity, after drafting for hydropower plant work. Little Wood Reservoir is 92% of average while Mackay Reservoir received a boost from the November rain and is 119% of average. Jackson Lake is 127% of average while Palisades Reservoir is less at 48% of average. American Falls is refilling and is half full, 84% of average. Bear Lake is 96% of average, 62% full because of the 2011 runoff. Montpelier, Oakley, Salmon Falls, Wildhorse and Owyhee reservoirs are 55-70% of average.
Note: NRCS reports reservoir information in terms of usable volumes, which includes both active, inactive and in some cases, dead storage. Other operators may report reservoir contents in different terms. For additional information, see the reservoir definitions in this report.
STREAMFLOW
Antecedent streamflow this fall and early winter vary like Idaho’s climate. Northern Idaho streams were flowing above average from the October and November precipitation while southern Idaho’s streams recovered some from the extremely dry summer, but remain flowing at average or less prior to the sub-zero temperature setting-in. Soil moisture across the state also mirrors the precipitation and fall streamflow levels. Streamflow forecasts range from 65–85% in the Salmon Falls and the Bear River basin in southern Idaho, to higher than 125% in central Idaho. The NRCS publishes five probability streamflow forecast values for each point; the future storm track and temperatures in the second half of winter will help users determine which way to hedge. Will we continue the extended dry and cold weather occurring in early January or return to the wild and variable weather we have come to expect?
Following are proposed streamflow forecast changes. Please provide us with comments or concerns.
Smith Creek near Porthill – N. Idaho, discontinued due to current data not being available since 2002.
Falls River near Ashton – E. Idaho, Propose moving forecast to Falls River above Yellowstone Canal near Squirrel gage with no adjustments.
Big Wood River above Stanton – Central Idaho, propose dropping the Willow Creek adjustment and forecast the Big Wood River at Stanton Crossing near Bellevue by combining records with the long-term Big Wood River near Bellevue station that did not include minimal Willow Creek flow.
Gros Ventre River at Kelly – Upper Snake, Wyoming, streamgage and forecasts are discontinued.
Note: The volumes referenced in these narratives are the 50% Chance of Exceeding Forecast, unless otherwise noted. Users may wish to use a different forecast to reduce their risk of having too much or too little water. Forecasts published in this report are produced by the USDA NRCS.
RECREATION
The lack of snowfall below 6,500 feet in central Idaho has resulted in a recession for winter recreation. This is not a fiscal cliff type recession; instead it’s more similar to glacial recession where snow retreats up a valley. Up high snow has been available for the takers since Thanksgiving. To get it, recreationists have had to go higher than normal to find that elusive snowline, sometimes carrying their skis, board or snowshoes over bare ground or driving to a higher trailhead to access the winter wonderland. This winter has been unusual in that regard. In mid-December going from 5,400 feet to 6,900 feet meant going from near record low snow to near record high snow. Perhaps it’s a picture of climate change, where snow parks and ski resort bases are a little too low, but higher on the mountain snow storms are more intense due to a slightly warmer atmosphere that is capable of holding more moisture. Or perhaps it’s just part of nature’s regular variability, either way this recession is a good excuse to explore by going further and higher to the best snow.
IDAHO SURFACE WATER SUPPLY INDEX (SWSI) January 1, 2013
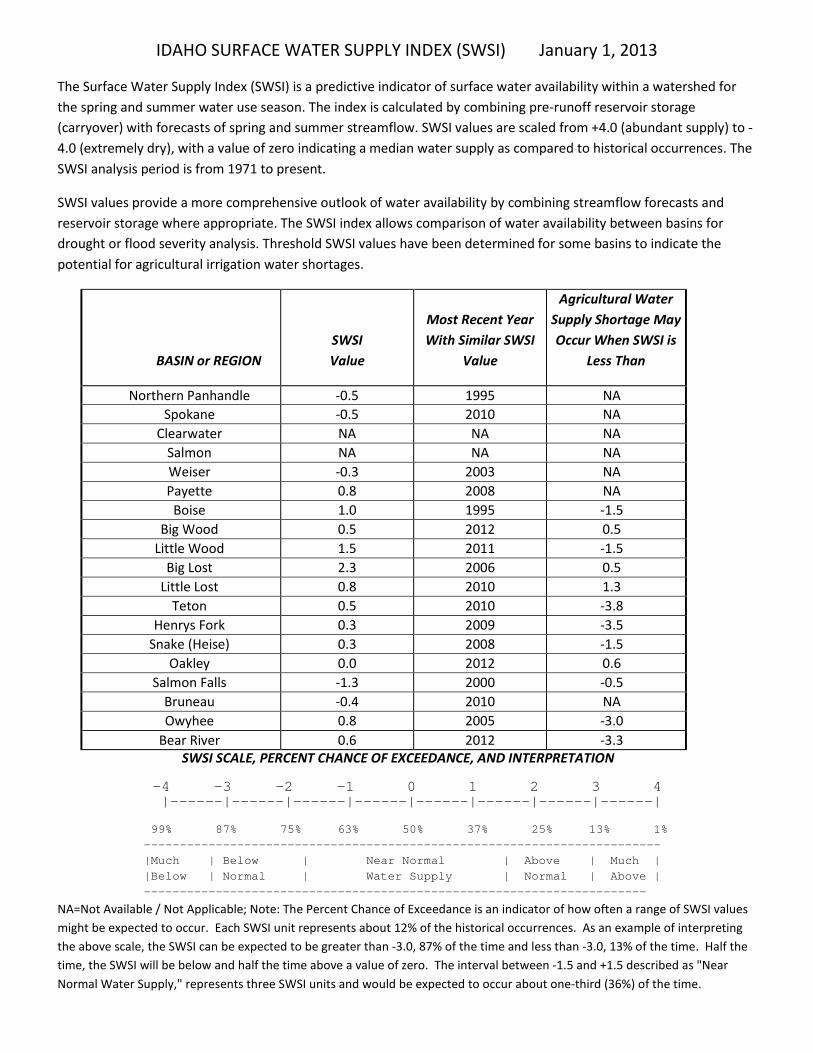
The Surface Water Supply Index (SWSI) is a predictive indicator of surface water availability within a watershed for the spring and summer water use season. The index is calculated by combining pre-runoff reservoir storage (carryover) with forecasts of spring and summer streamflow. SWSI values are scaled from +4.0 (abundant supply) to -4.0 (extremely dry), with a value of zero indicating a median water supply as compared to historical occurrences. The SWSI analysis period is from 1971 to present.
SWSI values provide a more comprehensive outlook of water availability by combining streamflow forecasts and reservoir storage where appropriate. The SWSI index allows comparison of water availability between basins for drought or flood severity analysis. Threshold SWSI values have been determined for some basins to indicate the potential for agricultural irrigation water shortages.
BASIN or REGION
SWSI Value
Most Recent Year With Similar SWSI
Value
Agricultural Water Supply Shortage May Occur When SWSI is
Less Than
Northern Panhandle -0.5 1995 NA Spokane -0.5 2010
NA Clearwater NA NA NA
Salmon NA NA NA Weiser -0.3 2003 NA Payette 0.8 2008 NA
Boise 1.0 1995 -1.5
Big Wood 0.5 2012 0.5
Little Wood 1.5 2011 -1.5 Big Lost 2.3 2006 0.5
Little Lost 0.8 2010 1.3 Teton 0.5 2010 -3.8
Henrys Fork 0.3 2009 -3.5 Snake (Heise) 0.3 2008 -1.5
Oakley 0.0 2012 0.6 Salmon Falls -1.3 2000 -0.5
Bruneau -0.4 2010 NA Owyhee 0.8 2005 -3.0
Bear River 0.6 2012 -3.3 SWSI SCALE, PERCENT CHANCE OF EXCEEDANCE, AND INTERPRETATION
-4 -3 -2 -1 0 1 2 3 4 |------|------|------|------|------|------|------|------|
99% 87% 75% 63% 50% 37% 25% 13% 1% ------------------------------------------------------------------------ |Much | Below | Near Normal | Above | Much | |Below | Normal | Water Supply | Normal | Above | ----------------------------------------------------------------------
NA=Not Available / Not Applicable; Note: The Percent Chance of Exceedance is an indicator of how often a range of SWSI values might be expected to occur. Each SWSI unit represents about 12% of the historical occurrences. As an example of interpreting the above scale, the SWSI can be expected to be greater than -3.0, 87% of the time and less than -3.0, 13% of the time. Half the time, the SWSI will be below and half the time above a value of zero. The interval between -1.5 and +1.5 described as "Near Normal Water Supply," represents three SWSI units and would be expected to occur about one-third (36%) of the time.

PANHANDLE REGION
JANUARY 1, 2013
0
10
20
30
40
50
60
Jan Feb Mar Apr May Jun
Wat
er C
onte
nt In
ches
Mountain Snowpack (inches)PANHANDLE REGION
Current Median
Maximum Minimum
0
20
40
60
80
100
120
140
160
180
200
Oct Nov Dec Jan Feb Mar Apr May
Perc
ent o
f Ave
rage
Mountain PrecipitationPANHANDLE REGION
Monthly Year-to-date
WATER SUPPLY OUTLOOK
The Panhandle Region’s water supply is off to a good start this year. The region received above normal precipitation in October, November and December bringing water year to date precipitation since October 1 to 143% of normal in the far Northern Panhandle. During the same period the Spokane basin’s precipitation totaled 121%. The snowpack in North Idaho has increased steadily since early November. The January 1 snowpack is 126% of normal in the Northern Panhandle and 91% of normal in the Spokane basin. Pend Oreille, Coeur d’Alene and Priest lakes are all storing more water than at this point last year. Streamflow forecasts range from near normal for the Spokane River and the NF Coeur d’Alene River to up to 124% of normal for the Moyie River. The above percentages are based on the new 1981-2010 normals. This month’s cover points out these normals are lower than the 1971-2000 normals. The result of lower normals is that percent of normal snow and streamflow values are higher than they would have been. Please recalibrate your expectations based on the new normals.

================================================================================================================================== PANHANDLE REGION Streamflow Forecasts - January 1, 2013 ================================================================================================================================== | <<====== Drier ====== Future Conditions ======= Wetter =====>> | | | Forecast Point Forecast | ==================== Chance Of Exceeding * ====================== | Period | 90% 70% | 50% | 30% 10% | 30-Yr Avg. | (1000AF) (1000AF) | (1000AF) (% AVG.) | (1000AF) (1000AF) | (1000AF) ====================================================================|=======================|===================================== Moyie R at Eastport APR-JUL 330 410 | 465 124 | 520 600 375 APR-SEP 345 425 | 480 125 | 535 615 385 | | Boundary Ck nr Porthill APR-JUL 100 119 | 132 113 | 145 164 117 APR-SEP 105 125 | 138 112 | 151 171 123 | | Pend Oreille Lake Inflow (2) APR-JUL 9963 11652 | 12800 109 | 13948 15637 11800 APR-SEP 11146 12905 | 14100 110 | 15295 17054 12800 | | Priest R nr Priest River (1,2) APR-JUL 710 850 | 945 121 | 1040 1180 780 APR-SEP 750 900 | 1000 121 | 1100 1250 830 | | NF Coeur d'Alene R at Enaville APR-JUL 419 595 | 715 102 | 835 1011 700 APR-SEP 455 634 | 755 102 | 876 1055 740 | | St. Joe R at Calder APR-JUL 738 942 | 1080 103 | 1218 1422 1050 APR-SEP 801 1009 | 1150 103 | 1291 1499 1120 | | Spokane R nr Post Falls (2) APR-JUL 1526 2064 | 2430 102 | 2796 3334 2390 APR-SEP 1611 2158 | 2530 102 | 2902 3449 2480 | | Spokane R at Long Lake (2) APR-JUL 1697 2306 | 2720 104 | 3134 3743 2620 APR-SEP 1893 2522 | 2950 104 | 3378 4007 2850 | | ================================================================================================================================== PANHANDLE REGION | PANHANDLE REGION Reservoir Storage (1000 AF) - End of December | Watershed Snowpack Analysis - January 1, 2013 ================================================================================================================================== Usable | *** Usable Storage *** | Number This Year as % of Reservoir Capacity| This Last 1971-00 | Watershed of ================= | Year Year Avg | Data Sites Last Yr Average ========================================================================|========================================================= HUNGRY HORSE 3451.0 3162.9 3003.0 2420.9 | Kootenai ab Bonners Ferry | FLATHEAD LAKE 1791.0 1135.7 1187.0 1192.7 | Moyie River | NOXON RAPIDS 335.0 322.7 314.2 315.8 | Priest River 1981-2010 normals not | Pend Oreille 1561.3 900.3 641.0 673.4 | Pend Oreille River available at press time | Coeur d'Alene 238.5 72.9 50.9 110.1 | Rathdrum Creek | Priest Lake 119.3 64.1 53.2 55.7 | Coeur d'Alene River | | St. Joe River | | Spokane River | | Palouse River | ================================================================================================================================== * 90%, 70%, 50%, 30%, and 10% chances of exceeding are the probabilities that the actual volume will exceed the volumes in the table. The average is computed for the 1981-2010 base period. (1) - The values listed under the 10% and 90% Chance of Exceeding are actually 5% and 95% exceedance levels. (2) - The value is natural volume - actual volume may be affected by upstream water management.
CLEARWATER RIVER BASIN
JANUARY 1, 2013
0
10
20
30
40
50
60
70
Jan Feb Mar Apr May Jun
Wat
er C
onte
nt In
ches
Mountain Snowpack (inches)CLEARWATER RIVER BASIN
Current Median
Maximum Minimum
0
20
40
60
80
100
120
140
160
180
200
Oct Nov Dec Jan Feb Mar Apr May
Perc
ent o
f Ave
rage
Mountain PrecipitationCLEARWATER RIVER BASIN
Monthly Year-to-date
WATER SUPPLY OUTLOOK
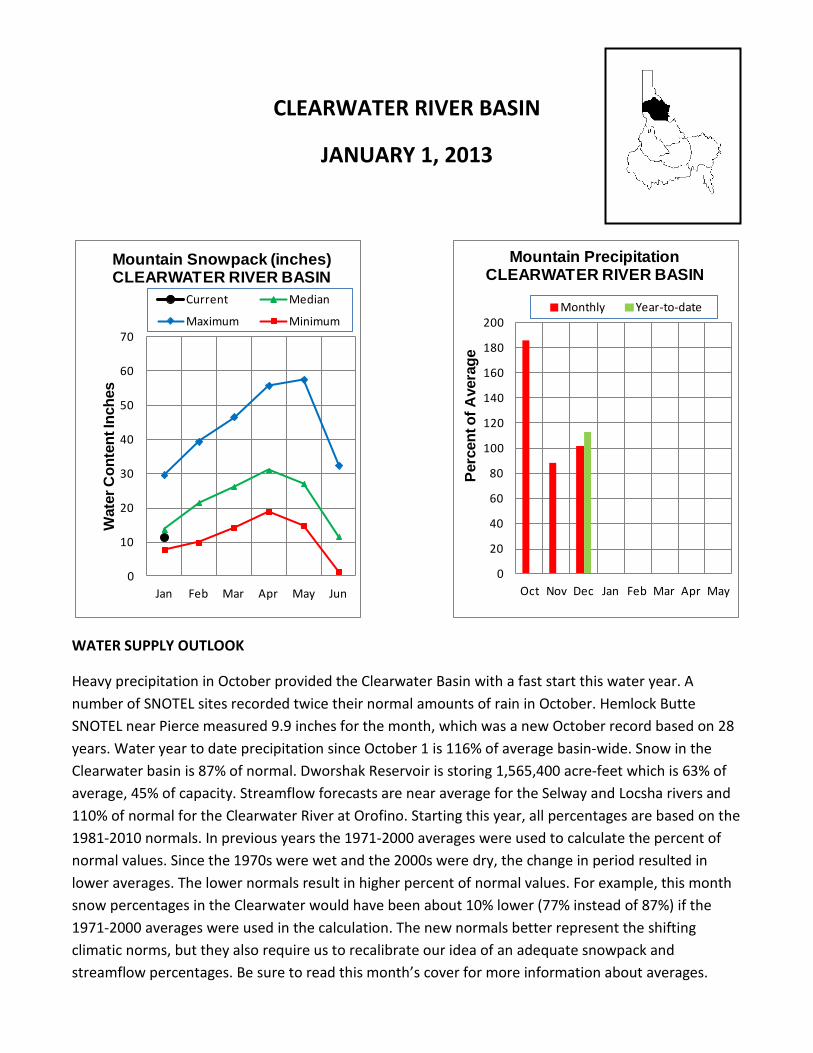
Heavy precipitation in October provided the Clearwater Basin with a fast start this water year. A number of SNOTEL sites recorded twice their normal amounts of rain in October. Hemlock Butte SNOTEL near Pierce measured 9.9 inches for the month, which was a new October record based on 28 years. Water year to date precipitation since October 1 is 116% of average basin-wide. Snow in the Clearwater basin is 87% of normal. Dworshak Reservoir is storing 1,565,400 acre-feet which is 63% of average, 45% of capacity. Streamflow forecasts are near average for the Selway and Locsha rivers and 110% of normal for the Clearwater River at Orofino. Starting this year, all percentages are based on the 1981-2010 normals. In previous years the 1971-2000 averages were used to calculate the percent of normal values. Since the 1970s were wet and the 2000s were dry, the change in period resulted in lower averages. The lower normals result in higher percent of normal values. For example, this month snow percentages in the Clearwater would have been about 10% lower (77% instead of 87%) if the 1971-2000 averages were used in the calculation. The new normals better represent the shifting climatic norms, but they also require us to recalibrate our idea of an adequate snowpack and streamflow percentages. Be sure to read this month’s cover for more information about averages.

================================================================================================================================== CLEARWATER RIVER BASIN Streamflow Forecasts - January 1, 2013 ================================================================================================================================== | <<====== Drier ====== Future Conditions ======= Wetter =====>> | | | Forecast Point Forecast | ==================== Chance Of Exceeding * ====================== | Period | 90% 70% | 50% | 30% 10% | 30-Yr Avg. | (1000AF) (1000AF) | (1000AF) (% AVG.) | (1000AF) (1000AF) | (1000AF) ====================================================================|=======================|===================================== Selway R nr Lowell APR-JUL 1390 1690 | 1900 99 | 2110 2410 1920 APR-SEP 1480 1790 | 2000 99 | 2210 2520 2020 | | Lochsa R nr Lowell APR-JUL 1040 1260 | 1420 101 | 1580 1800 1410 APR-SEP 1110 1340 | 1500 101 | 1660 1890 1480 | | Clearwater R at Orofino (1) APR-JUL 2520 4040 | 4730 110 | 5420 6940 4310 APR-SEP 2780 4300 | 4990 110 | 5680 7200 4540 | | ================================================================================================================================== CLEARWATER RIVER BASIN | CLEARWATER RIVER BASIN Reservoir Storage (1000 AF) - End of December | Watershed Snowpack Analysis - January 1, 2013 ================================================================================================================================== Usable | *** Usable Storage *** | Number This Year as % of Reservoir Capacity| This Last 1971-00 | Watershed of ================= | Year Year Avg | Data Sites Last Yr Average ========================================================================|========================================================= Dworshak 3468.0 1565.4 2256.3 2481.4 | North Fork Clearwater | | Lochsa River 1981-2010 normals not | | Selway River available at press time | | Clearwater Basin Total | ================================================================================================================================== * 90%, 70%, 50%, 30%, and 10% chances of exceeding are the probabilities that the actual volume will exceed the volumes in the table. The average is computed for the 1981-2010 base period. (1) - The values listed under the 10% and 90% Chance of Exceeding are actually 5% and 95% exceedance levels. (2) - The value is natural volume - actual volume may be affected by upstream water management
SALMON RIVER BASIN
JANUARY 1, 2013
0
5
10
15
20
25
30
35
40
Jan Feb Mar Apr May Jun
Wat
er C
onte
nt In
ches
Mountain Snowpack (inches)SALMON RIVER BASIN
Current Median
Maximum Minimum
0
20
40
60
80
100
120
140
160
Oct Nov Dec Jan Feb Mar Apr May
Perc
ent o
f Ave
rage
Mountain PrecipitationSALMON RIVER BASIN
Monthly Year-to-date
WATER SUPPLY OUTLOOK
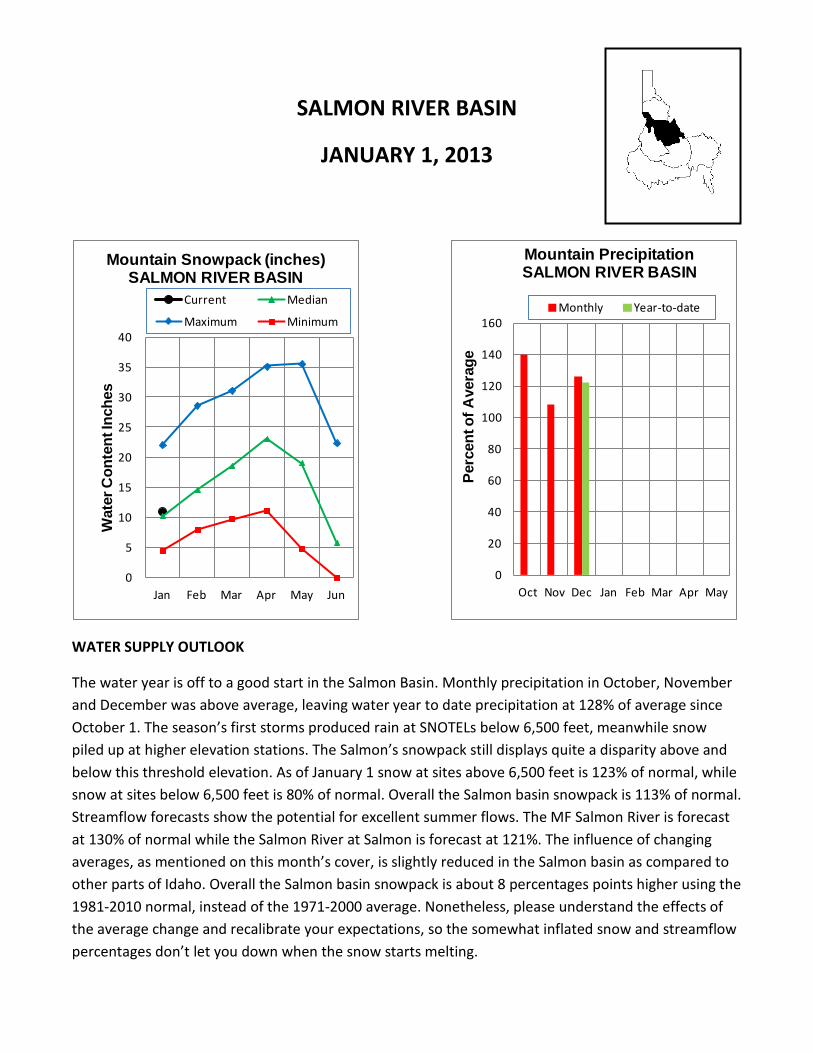
The water year is off to a good start in the Salmon Basin. Monthly precipitation in October, November and December was above average, leaving water year to date precipitation at 128% of average since October 1. The season’s first storms produced rain at SNOTELs below 6,500 feet, meanwhile snow piled up at higher elevation stations. The Salmon’s snowpack still displays quite a disparity above and below this threshold elevation. As of January 1 snow at sites above 6,500 feet is 123% of normal, while snow at sites below 6,500 feet is 80% of normal. Overall the Salmon basin snowpack is 113% of normal. Streamflow forecasts show the potential for excellent summer flows. The MF Salmon River is forecast at 130% of normal while the Salmon River at Salmon is forecast at 121%. The influence of changing averages, as mentioned on this month’s cover, is slightly reduced in the Salmon basin as compared to other parts of Idaho. Overall the Salmon basin snowpack is about 8 percentages points higher using the 1981-2010 normal, instead of the 1971-2000 average. Nonetheless, please understand the effects of the average change and recalibrate your expectations, so the somewhat inflated snow and streamflow percentages don’t let you down when the snow starts melting.

================================================================================================================================== SALMON RIVER BASIN Streamflow Forecasts - January 1, 2013 ================================================================================================================================== | <<====== Drier ====== Future Conditions ======= Wetter =====>> | | | Forecast Point Forecast | ==================== Chance Of Exceeding * ====================== | Period | 90% 70% | 50% | 30% 10% | 30-Yr Avg. | (1000AF) (1000AF) | (1000AF) (% AVG.) | (1000AF) (1000AF) | (1000AF) ====================================================================|=======================|===================================== Salmon R at Salmon (1) APR-JUL 545 815 | 935 121 | 1060 1320 775 APR-SEP 635 940 | 1080 120 | 1220 1530 900 | | Lemhi R nr Lemhi APR-JUL 39 59 | 75 101 | 93 122 74 APR-SEP 49 72 | 90 100 | 110 143 90 | | MF Salmon R at MF Lodge APR-JUL 575 770 | 905 131 | 1040 1240 690 APR-SEP 640 855 | 1000 130 | 1150 1360 770 | | SF Salmon R nr Krassel RS APR-JUL 220 275 | 315 117 | 355 410 270 APR-SEP 230 290 | 330 114 | 370 430 290 | | Johnson Ck at Yellow Pine APR-JUL 145 184 | 210 110 | 235 275 191 | | ================================================================================================================================== SALMON RIVER BASIN | SALMON RIVER BASIN Reservoir Storage (1000 AF) - End of December | Watershed Snowpack Analysis - January 1, 2013 ================================================================================================================================== Usable | *** Usable Storage *** | Number This Year as % of Reservoir Capacity| This Last | Watershed of ================= | Year Year Avg | Data Sites Last Yr Average ========================================================================|========================================================= | Salmon River ab Salmon | This table is intentionally left blank | Lemhi River 1981-2010 normals not | | Middle Fork Salmon River available at press time | | South Fork Salmon River | | Little Salmon River | | Salmon Basin Total | ================================================================================================================================== * 90%, 70%, 50%, 30%, and 10% chances of exceeding are the probabilities that the actual volume will exceed the volumes in the table. The average is computed for the 1981-2010 base period. (1) - The values listed under the 10% and 90% Chance of Exceeding are actually 5% and 95% exceedance levels. (2) - The value is natural volume - actual volume may be affected by upstream water management.
WEISER, PAYETTE, BOISE RIVER BASINS
JANUARY 1, 2013
0
5
10
15
20
25
30
35
40
45
Jan Feb Mar Apr May Jun
Wat
er C
onte
nt In
ches
Mountain Snowpack (inches)WEISER, PAYETTE, BOISE
RIVER BASINSCurrent MedianMaximum Minimum
0
20
40
60
80
100
120
140
160
Oct Nov Dec Jan Feb Mar Apr May
Perc
ent o
f Ave
rage
Mountain PrecipitationWEISER, PAYETTE, BOISE
RIVER BASINSMonthly Year-to-date
WATER SUPPLY OUTLOOK
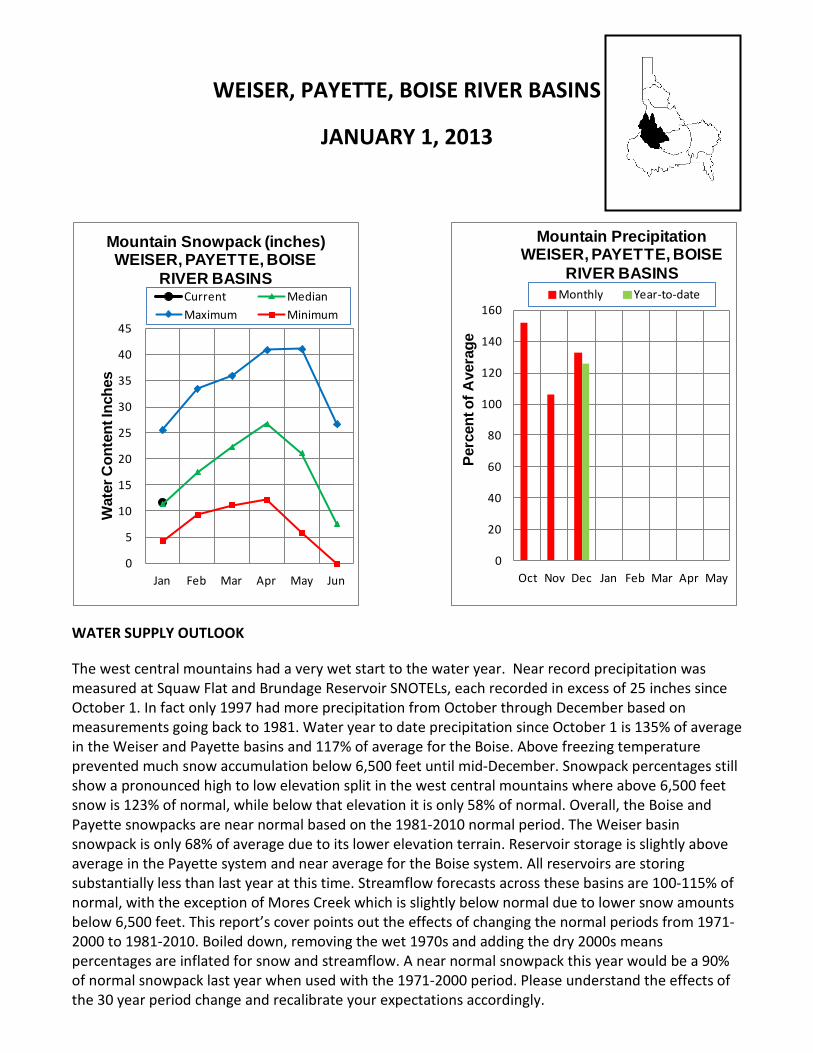
The west central mountains had a very wet start to the water year. Near record precipitation was measured at Squaw Flat and Brundage Reservoir SNOTELs, each recorded in excess of 25 inches since October 1. In fact only 1997 had more precipitation from October through December based on measurements going back to 1981. Water year to date precipitation since October 1 is 135% of average in the Weiser and Payette basins and 117% of average for the Boise. Above freezing temperature prevented much snow accumulation below 6,500 feet until mid-December. Snowpack percentages still show a pronounced high to low elevation split in the west central mountains where above 6,500 feet snow is 123% of normal, while below that elevation it is only 58% of normal. Overall, the Boise and Payette snowpacks are near normal based on the 1981-2010 normal period. The Weiser basin snowpack is only 68% of average due to its lower elevation terrain. Reservoir storage is slightly above average in the Payette system and near average for the Boise system. All reservoirs are storing substantially less than last year at this time. Streamflow forecasts across these basins are 100-115% of normal, with the exception of Mores Creek which is slightly below normal due to lower snow amounts below 6,500 feet. This report’s cover points out the effects of changing the normal periods from 1971-2000 to 1981-2010. Boiled down, removing the wet 1970s and adding the dry 2000s means percentages are inflated for snow and streamflow. A near normal snowpack this year would be a 90% of normal snowpack last year when used with the 1971-2000 period. Please understand the effects of the 30 year period change and recalibrate your expectations accordingly.

================================================================================================================================== WEISER, PAYETTE, BOISE RIVER BASINS Streamflow Forecasts - January 1, 2013 ================================================================================================================================== | <<====== Drier ====== Future Conditions ======= Wetter =====>> | | | Forecast Point Forecast | ==================== Chance Of Exceeding * ====================== | Period | 90% 70% | 50% | 30% 10% | 30-Yr Avg. | (1000AF) (1000AF) | (1000AF) (% AVG.) | (1000AF) (1000AF) | (1000AF) ====================================================================|=======================|===================================== Weiser R nr Weiser (1) FEB-JUL 205 460 | 610 99 | 780 1240 615 APR-JUL 119 275 | 365 99 | 470 745 370 APR-SEP 134 295 | 390 98 | 500 780 400 | | SF Payette R at Lowman APR-JUL 270 345 | 405 101 | 470 570 400 APR-SEP 310 395 | 460 101 | 530 640 455 | | Deadwood Resv Inflow (1,2) APR-JUL 82 122 | 141 115 | 160 200 123 APR-SEP 86 130 | 150 115 | 170 215 131 | | Lake Fork Payette R nr McCall APR-JUL 66 80 | 90 113 | 101 118 80 APR-SEP 68 82 | 93 112 | 104 122 83 | | NF Payette R at Cascade (1,2) APR-JUL 285 460 | 540 111 | 620 795 485 APR-SEP 285 470 | 555 112 | 640 825 495 | | NF Payette R nr Banks (2) APR-JUL 485 620 | 710 114 | 800 935 625 APR-SEP 480 625 | 720 113 | 815 960 640 | | Payette R nr Horseshoe Bend (1,2) APR-JUL 1000 1470 | 1680 114 | 1890 2360 1480 APR-SEP 1070 1550 | 1770 109 | 1990 2470 1630 | | Boise R nr Twin Springs (1) APR-JUL 340 535 | 625 107 | 715 910 585 APR-SEP 375 580 | 675 106 | 770 975 635 | | SF Boise R at Anderson Ranch D (1,2) APR-JUL 285 490 | 580 122 | 670 875 475 APR-SEP 305 520 | 615 121 | 710 925 510 | | Mores Ck nr Arrowrock Dam APR-JUL 48 79 | 104 90 | 133 181 115 APR-SEP 50 81 | 107 90 | 136 186 119 | | Boise R nr Boise (1,2) APR-JUN 770 1110 | 1260 111 | 1410 1750 1140 APR-JUL 817 1232 | 1420 113 | 1608 2023 1260 APR-SEP 910 1330 | 1520 112 | 1710 2130 1360 | | ================================================================================================================================== WEISER, PAYETTE, BOISE RIVER BASINS | WEISER, PAYETTE, BOISE RIVER BASINS Reservoir Storage (1000 AF) - End of December | Watershed Snowpack Analysis - January 1, 2013 ================================================================================================================================== Usable | *** Usable Storage *** | Number This Year as % of Reservoir Capacity| This Last 1971-00 | Watershed of ================= | Year Year Avg | Data Sites Last Yr Average ========================================================================|========================================================= Mann Creek 11.1 2.4 1.7 3.3 | Mann Creek | Cascade 693.2 502.2 489.7 456.4 | Weiser River 1981-2010 normals not | Deadwood 161.9 94.9 94.1 82.5 | North Fork Payette available at press time | Anderson Ranch 450.2 270.9 373.8 296.8 | South Fork Payette | Arrowrock 272.2 174.8 192.9 173.1 | Payette Basin Total | Lucky Peak 293.2 91.7 87.1 95.5 | Middle & North Fork Boise | Lake Lowell (Deer Flat) 165.2 119.5 120.3 98.4 | South Fork Boise River | | Mores Creek | | Boise Basin Total | | Canyon Creek | ================================================================================================================================== * 90%, 70%, 50%, 30%, and 10% chances of exceeding are the probabilities that the actual volume will exceed the volumes in the table. The average is computed for the 1981-2010 base period. (1) - The values listed under the 10% and 90% Chance of Exceeding are actually 5% and 95% exceedance levels. (2) - The value is natural volume - actual volume may be affected by upstream water management

WOOD and LOST RIVER BASINS
JANUARY 1, 2013
0
5
10
15
20
25
30
Jan Feb Mar Apr May Jun
Wat
er C
onte
nt In
ches
Mountain Snowpack (inches)WOOD AND LOST RIVER
BASINS Current MedianMaximum Minimum
0
20
40
60
80
100
120
140
160
Oct Nov Dec Jan Feb Mar Apr May
Perc
ent o
f Ave
rage
Mountain PrecipitationWOOD AND LOST RIVER
BASINSMonthly Year-to-date
WATER SUPPLY OUTLOOK
The Wood and Lost basins are off to a great start this water year and boast the best snowpack in Idaho. Many sites recorded twice the usual November precipitation amounts. December’s precipitation wasn’t far off that pace with monthly amounts of 150%. Water year to date precipitation since October 1 is 151% in the Little Wood, 146% of average in the Big Lost, 138% in the Big Wood and 117% Little Lost. Because of higher elevations snow accumulated earlier at SNOTEL sites in this region compared to other central Idaho basins with slightly lower elevations. In November and early December 6,500 feet was the critical rain-to-snow threshold elevation. With nearly all Wood and Lost basin SNOTEL sites above this threshold the snowpack in these basins is 133-163% of normal. The Big Lost’s January 1 snowpack is the best since 1997. The Little Lost and Little Wood basins have nearly the same amount of snow as 2011, which is an amount greater than any other year since 1997. The Big Wood’s snow is the greatest since 2006. Water storage is near average or better for Little Wood and Mackay reservoirs. Magic’s storage is low after the reservoir was drafted in order to complete maintenance; that work is completed and storage levels are now recovering. With ample precipitation and a good snowpack, summer streamflow forecasts are above average ranging from 110-140%. The lowest forecast is for Camas Creek at 104% of average. Winter is not even half over so more snow is certainly needed, but at this point the water supply outlook is promising. Take time to read this month’s cover in order to understand how the new 30 year averages drive up the percent of normal amounts.
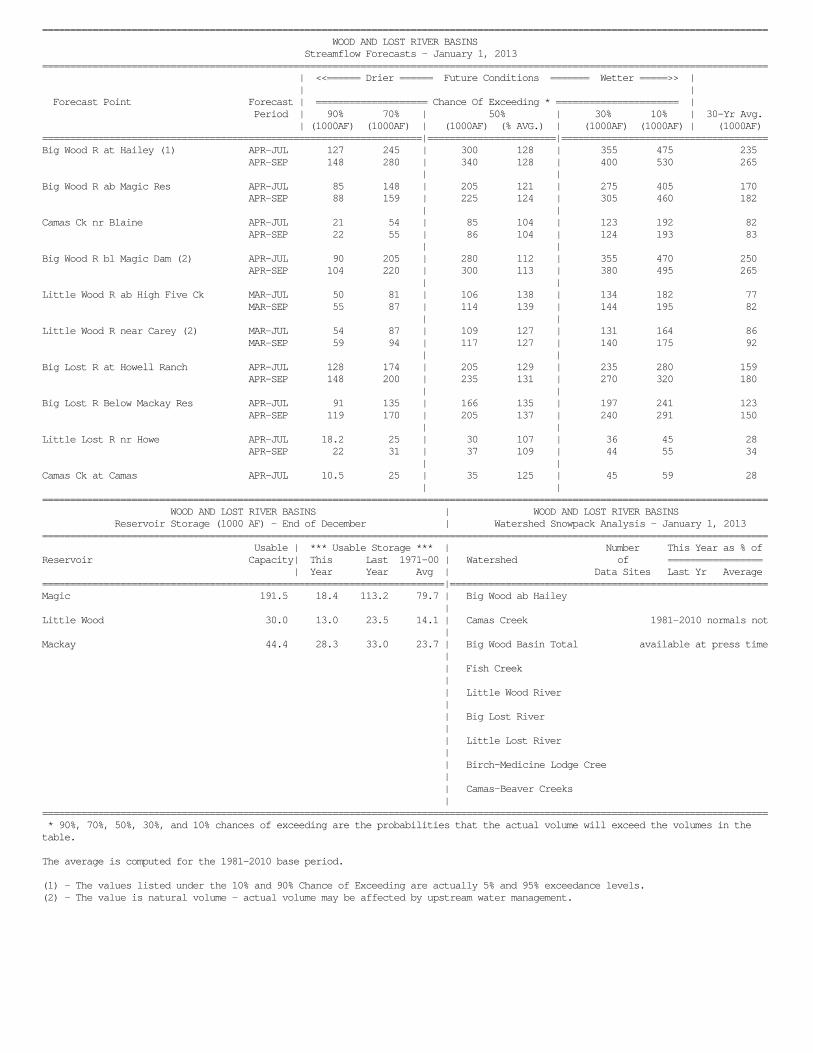
================================================================================================================================== WOOD AND LOST RIVER BASINS Streamflow Forecasts - January 1, 2013 ================================================================================================================================== | <<====== Drier ====== Future Conditions ======= Wetter =====>> | | | Forecast Point Forecast | ==================== Chance Of Exceeding * ====================== | Period | 90% 70% | 50% | 30% 10% | 30-Yr Avg. | (1000AF) (1000AF) | (1000AF) (% AVG.) | (1000AF) (1000AF) | (1000AF) ====================================================================|=======================|===================================== Big Wood R at Hailey (1) APR-JUL 127 245 | 300 128 | 355 475 235 APR-SEP 148 280 | 340 128 | 400 530 265 | | Big Wood R ab Magic Res APR-JUL 85 148 | 205 121 | 275 405 170 APR-SEP 88 159 | 225 124 | 305 460 182 | | Camas Ck nr Blaine APR-JUL 21 54 | 85 104 | 123 192 82 APR-SEP 22 55 | 86 104 | 124 193 83 | | Big Wood R bl Magic Dam (2) APR-JUL 90 205 | 280 112 | 355 470 250 APR-SEP 104 220 | 300 113 | 380 495 265 | | Little Wood R ab High Five Ck MAR-JUL 50 81 | 106 138 | 134 182 77 MAR-SEP 55 87 | 114 139 | 144 195 82 | | Little Wood R near Carey (2) MAR-JUL 54 87 | 109 127 | 131 164 86 MAR-SEP 59 94 | 117 127 | 140 175 92 | | Big Lost R at Howell Ranch APR-JUL 128 174 | 205 129 | 235 280 159 APR-SEP 148 200 | 235 131 | 270 320 180 | | Big Lost R Below Mackay Res APR-JUL 91 135 | 166 135 | 197 241 123 APR-SEP 119 170 | 205 137 | 240 291 150 | | Little Lost R nr Howe APR-JUL 18.2 25 | 30 107 | 36 45 28 APR-SEP 22 31 | 37 109 | 44 55 34 | | Camas Ck at Camas APR-JUL 10.5 25 | 35 125 | 45 59 28 | | ================================================================================================================================== WOOD AND LOST RIVER BASINS | WOOD AND LOST RIVER BASINS Reservoir Storage (1000 AF) - End of December | Watershed Snowpack Analysis - January 1, 2013 ================================================================================================================================== Usable | *** Usable Storage *** | Number This Year as % of Reservoir Capacity| This Last 1971-00 | Watershed of ================= | Year Year Avg | Data Sites Last Yr Average ========================================================================|========================================================= Magic 191.5 18.4 113.2 79.7 | Big Wood ab Hailey | Little Wood 30.0 13.0 23.5 14.1 | Camas Creek 1981-2010 normals not | Mackay 44.4 28.3 33.0 23.7 | Big Wood Basin Total available at press time | | Fish Creek | | Little Wood River | | Big Lost River | | Little Lost River | | Birch-Medicine Lodge Cree | | Camas-Beaver Creeks | ================================================================================================================================== * 90%, 70%, 50%, 30%, and 10% chances of exceeding are the probabilities that the actual volume will exceed the volumes in the table. The average is computed for the 1981-2010 base period. (1) - The values listed under the 10% and 90% Chance of Exceeding are actually 5% and 95% exceedance levels. (2) - The value is natural volume - actual volume may be affected by upstream water management.
UPPER SNAKE BASIN
JANUARY 1, 2013
0
5
10
15
20
25
30
35
Jan Feb Mar Apr May Jun
Wat
er C
onte
nt In
ches
Mountain Snowpack (inches)UPPER SNAKE RIVER
BASINCurrent Median
Maximum Minimum
0
20
40
60
80
100
120
140
Oct Nov Dec Jan Feb Mar Apr May
Perc
ent o
f Ave
rage
Mountain PrecipitationUPPER SNAKE RIVER
BASINMonthly Year-to-date
WATER SUPPLY OUTLOOK
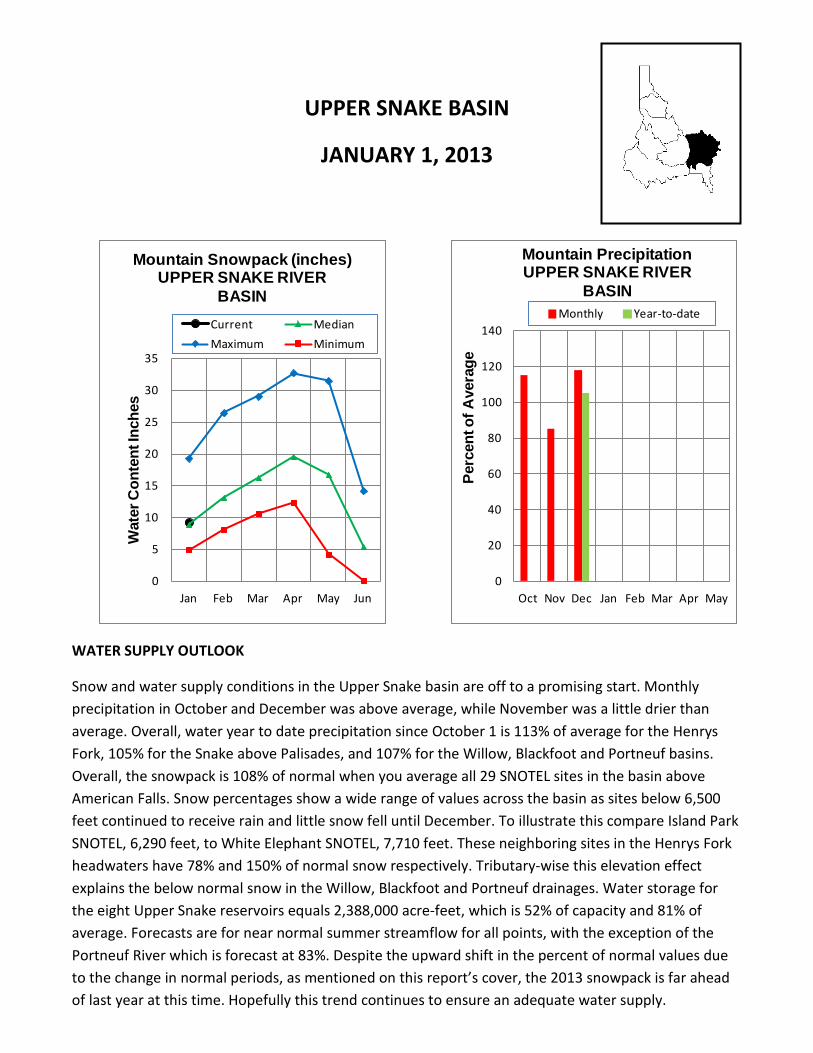
Snow and water supply conditions in the Upper Snake basin are off to a promising start. Monthly precipitation in October and December was above average, while November was a little drier than average. Overall, water year to date precipitation since October 1 is 113% of average for the Henrys Fork, 105% for the Snake above Palisades, and 107% for the Willow, Blackfoot and Portneuf basins. Overall, the snowpack is 108% of normal when you average all 29 SNOTEL sites in the basin above American Falls. Snow percentages show a wide range of values across the basin as sites below 6,500 feet continued to receive rain and little snow fell until December. To illustrate this compare Island Park SNOTEL, 6,290 feet, to White Elephant SNOTEL, 7,710 feet. These neighboring sites in the Henrys Fork headwaters have 78% and 150% of normal snow respectively. Tributary-wise this elevation effect explains the below normal snow in the Willow, Blackfoot and Portneuf drainages. Water storage for the eight Upper Snake reservoirs equals 2,388,000 acre-feet, which is 52% of capacity and 81% of average. Forecasts are for near normal summer streamflow for all points, with the exception of the Portneuf River which is forecast at 83%. Despite the upward shift in the percent of normal values due to the change in normal periods, as mentioned on this report’s cover, the 2013 snowpack is far ahead of last year at this time. Hopefully this trend continues to ensure an adequate water supply.

================================================================================================================================== UPPER SNAKE RIVER BASIN Streamflow Forecasts - January 1, 2013 ================================================================================================================================== | <<====== Drier ====== Future Conditions ======= Wetter =====>> | | | Forecast Point Forecast | ==================== Chance Of Exceeding * ====================== | Period | 90% 70% | 50% | 30% 10% | 30-Yr Avg. | (1000AF) (1000AF) | (1000AF) (% AVG.) | (1000AF) (1000AF) | (1000AF) ====================================================================|=======================|===================================== Henrys Fork nr Ashton (2) APR-JUL 380 475 | 540 102 | 610 725 530 APR-SEP 535 640 | 720 101 | 805 935 710 | | Henrys Fork nr Rexburg (2) APR-JUL 1130 1300 | 1420 101 | 1540 1710 1400 APR-SEP 1490 1680 | 1810 101 | 1940 2130 1790 | | Falls R nr Ashton (2) APR-JUL 280 330 | 365 100 | 405 465 365 APR-SEP 330 390 | 430 99 | 475 545 435 | | Teton R nr Driggs APR-JUL 89 124 | 150 97 | 179 225 154 APR-SEP 113 155 | 187 97 | 220 280 193 | | Teton R nr St. Anthony APR-JUL 220 295 | 355 97 | 420 520 365 APR-SEP 265 355 | 420 97 | 495 610 435 | | Snake R at Flagg Ranch APR-JUL 380 465 | 520 112 | 575 660 465 APR-SEP 420 510 | 570 112 | 630 720 510 | | Snake R nr Moran (1,2) APR-JUL 535 730 | 815 107 | 900 1090 765 APR-SEP 590 805 | 900 107 | 995 1210 845 | | Pacific Ck At Moran APR-JUL 127 163 | 188 115 | 215 250 164 APR-SEP 137 174 | 199 115 | 225 260 173 | | Buffalo Fork ab Lava nr Moran APR-JUL 230 275 | 305 109 | 335 380 280 APR-SEP 265 315 | 350 109 | 385 435 320 | | Snake R nr Alpine (1,2) APR-JUL 1350 1970 | 2250 104 | 2530 3150 2170 APR-SEP 1560 2260 | 2580 103 | 2900 3600 2500 | | Greys R Nr Alpine APR-JUL 196 255 | 295 97 | 335 395 305 APR-SEP 230 300 | 345 96 | 390 460 360 | | Salt R Nr Etna APR-JUL 139 230 | 290 97 | 350 440 300 APR-SEP 179 285 | 355 96 | 425 530 370 | | Snake R nr Irwin (1,2) APR-JUL 2090 2750 | 3050 101 | 3350 4010 3010 APR-SEP 2450 3190 | 3530 101 | 3870 4610 3500 | | Snake R nr Heise (2) APR-JUL 2460 2940 | 3260 101 | 3580 4060 3240 APR-SEP 2880 3420 | 3790 100 | 4160 4700 3780 | | Willow Ck nr Ririe MAR-JUL 15.3 45 | 66 99 | 87 117 67 | | Blackfoot R ab Res nr Henry APR-JUN 20 37 | 52 87 | 69 98 60 | | Portneuf R at Topaz MAR-JUL 35 51 | 64 84 | 78 102 76 MAR-SEP 43 62 | 77 83 | 94 121 93 | | ================================================================================================================================== UPPER SNAKE RIVER BASIN | UPPER SNAKE RIVER BASIN Reservoir Storage (1000 AF) - End of December | Watershed Snowpack Analysis - January 1, 2013 ================================================================================================================================== Usable | *** Usable Storage *** | Number This Year as % of Reservoir Capacity| This Last 1971-00 | Watershed of ================= | Year Year Avg | Data Sites Last Yr Average ========================================================================|========================================================= Henrys Lake 90.4 89.5 87.2 82.5 | Henrys Fork-Falls River Island Park 135.2 96.7 111.9 96.1 | Teton River 1981-2010 normals not Grassy Lake 15.2 12.5 11.8 11.6 | Henrys Fork above Rexburg available at press time Jackson Lake 847.0 611.5 631.1 481.7 | Snake above Jackson Lake Palisades 1400.0 492.5 1236.5 1036.5 | Pacific Creek Ririe 80.5 44.3 40.5 34.5 | Gros Ventre River Blackfoot 348.7 217.1 273.7 215.3 | Hoback River American Falls 1672.6 824.2 941.1 986.6 | Greys River ================================================================================================================================== * 90%, 70%, 50%, 30%, and 10% chances of exceeding are the probabilities that the actual volume will exceed the volumes in the table. The average is computed for the 1981-2010 base period. (1) - The values listed under the 10% and 90% Chance of Exceeding are actually 5% and 95% exceedance levels. (2) - The value is natural volume - actual volume may be affected by upstream water management.
SOUTHSIDE SNAKE RIVER BASINS
JANUARY 1, 2013
0
5
10
15
20
25
30
35
40
Jan Feb Mar Apr May Jun
Wat
er C
onte
nt In
ches
Mountain Snowpack (inches)SOUTHSIDE SNAKE RIVER
BASINSCurrent MedianMaximum Minimum
0
20
40
60
80
100
120
140
160
180
Oct Nov Dec Jan Feb Mar Apr May
Perc
ent o
f Ave
rage
Mountain PrecipitationSOUTHSIDE SNAKE RIVER
BASINSMonthly Year-to-date
WATER SUPPLY OUTLOOK
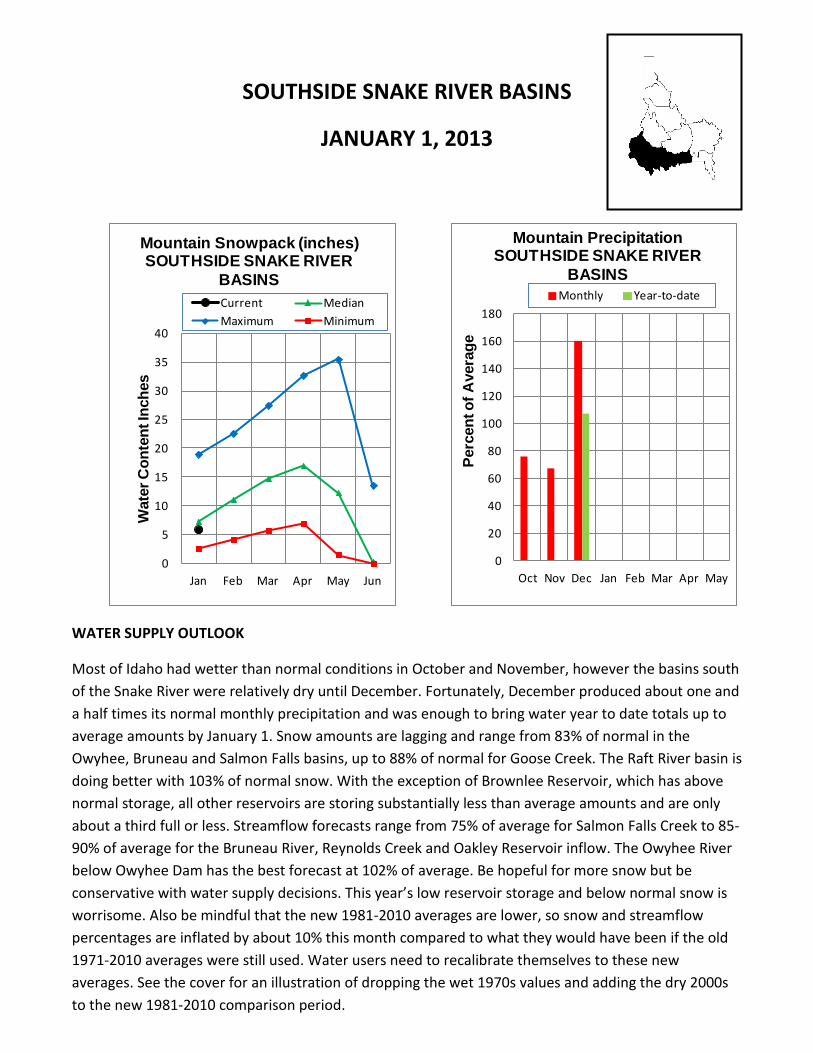
Most of Idaho had wetter than normal conditions in October and November, however the basins south of the Snake River were relatively dry until December. Fortunately, December produced about one and a half times its normal monthly precipitation and was enough to bring water year to date totals up to average amounts by January 1. Snow amounts are lagging and range from 83% of normal in the Owyhee, Bruneau and Salmon Falls basins, up to 88% of normal for Goose Creek. The Raft River basin is doing better with 103% of normal snow. With the exception of Brownlee Reservoir, which has above normal storage, all other reservoirs are storing substantially less than average amounts and are only about a third full or less. Streamflow forecasts range from 75% of average for Salmon Falls Creek to 85-90% of average for the Bruneau River, Reynolds Creek and Oakley Reservoir inflow. The Owyhee River below Owyhee Dam has the best forecast at 102% of average. Be hopeful for more snow but be conservative with water supply decisions. This year’s low reservoir storage and below normal snow is worrisome. Also be mindful that the new 1981-2010 averages are lower, so snow and streamflow percentages are inflated by about 10% this month compared to what they would have been if the old 1971-2010 averages were still used. Water users need to recalibrate themselves to these new averages. See the cover for an illustration of dropping the wet 1970s values and adding the dry 2000s to the new 1981-2010 comparison period.

================================================================================================================================== SOUTHSIDE SNAKE RIVER BASINS Streamflow Forecasts - January 1, 2013 ================================================================================================================================== | <<====== Drier ====== Future Conditions ======= Wetter =====>> | | | Forecast Point Forecast | ==================== Chance Of Exceeding * ====================== | Period | 90% 70% | 50% | 30% 10% | 30-Yr Avg. | (1000AF) (1000AF) | (1000AF) (% AVG.) | (1000AF) (1000AF) | (1000AF) ====================================================================|=======================|===================================== Goose Ck ab Trapper Ck nr Oakley MAR-JUL 5.7 13.8 | 19.3 88 | 25 33 22 MAR-SEP 6.5 15.1 | 21 88 | 27 35 24 | | Trapper Ck nr Oakley MAR-JUL 3.2 4.5 | 5.4 92 | 6.3 7.6 5.9 MAR-SEP 4.1 5.6 | 6.5 92 | 7.4 8.9 7.1 | | Oakley Res Inflow (2) MAR-JUL 9.4 18.7 | 25 89 | 31 41 28 MAR-SEP 12.3 21 | 28 90 | 36 50 31 | | Salmon Falls Ck nr San Jacinto MAR-JUN 27 45 | 59 77 | 75 103 77 MAR-JUL 28 46 | 61 75 | 78 107 81 MAR-SEP 30 49 | 65 77 | 83 113 85 | | Bruneau R nr Hot Springs MAR-JUL 84 133 | 172 84 | 215 290 205 MAR-SEP 89 139 | 180 84 | 225 305 215 | | Reynolds Ck at Tollgate MAR-JUL 2.8 5.8 | 7.8 89 | 9.8 12.8 8.8 | | Owyhee R nr Gold Ck (2) MAR-JUL 7.7 14.6 | 21 75 | 29 44 28 MAR-SEP 6.6 12.7 | 18.5 69 | 26 40 27 | | Owyhee R nr Rome FEB-JUL 215 445 | 600 103 | 755 985 580 FEB-SEP 215 450 | 610 103 | 770 1000 595 | | Owyhee R bl Owyhee Dam (2) FEB-JUL 300 490 | 650 102 | 830 1140 635 FEB-SEP 315 505 | 665 100 | 845 1150 665 APR-SEP 174 300 | 405 100 | 525 730 405 | | ================================================================================================================================== SOUTHSIDE SNAKE RIVER BASINS | SOUTHSIDE SNAKE RIVER BASINS Reservoir Storage (1000 AF) - End of December | Watershed Snowpack Analysis - January 1, 2013 ================================================================================================================================== Usable | *** Usable Storage *** | Number This Year as % of Reservoir Capacity| This Last 1971-00 | Watershed of ================= | Year Year Avg | Data Sites Last Yr Average ========================================================================|========================================================= Oakley 75.6 18.5 31.9 25.7 | Raft River | Salmon Falls 182.6 28.6 84.6 52.6 | Goose-Trapper Creeks | WILDHORSE RESERVOIR 71.5 24.8 48.2 37.8 | Salmon Falls Creek 1981-2010 normals not | OWYHEE 715.0 263.9 492.4 398.1 | Bruneau River available at press time | Brownlee 1420.0 1315.0 1339.1 1303.0 | Reynolds Creek | | Owyhee Basin Total | | Owyhee Basin SNOTEL | ================================================================================================================================== * 90%, 70%, 50%, 30%, and 10% chances of exceeding are the probabilities that the actual volume will exceed the volumes in the table. The average is computed for the 1981-2010 base period. (1) - The values listed under the 10% and 90% Chance of Exceeding are actually 5% and 95% exceedance levels. (2) - The value is natural volume - actual volume may be affected by upstream water management.

BEAR RIVER BASIN
JANUARY 1, 2013
0
5
10
15
20
25
30
Jan Feb Mar Apr May Jun
Wat
er C
onte
nt In
ches
Mountain Snowpack (inches)BEAR RIVER BASIN
Current Median
Maximum Minimum
0
20
40
60
80
100
120
Oct Nov Dec Jan Feb Mar Apr May
Perc
ent o
f Ave
rage
Mountain PrecipitationBEAR RIVER BASIN
Monthly Year-to-date
WATER SUPPLY OUTLOOK
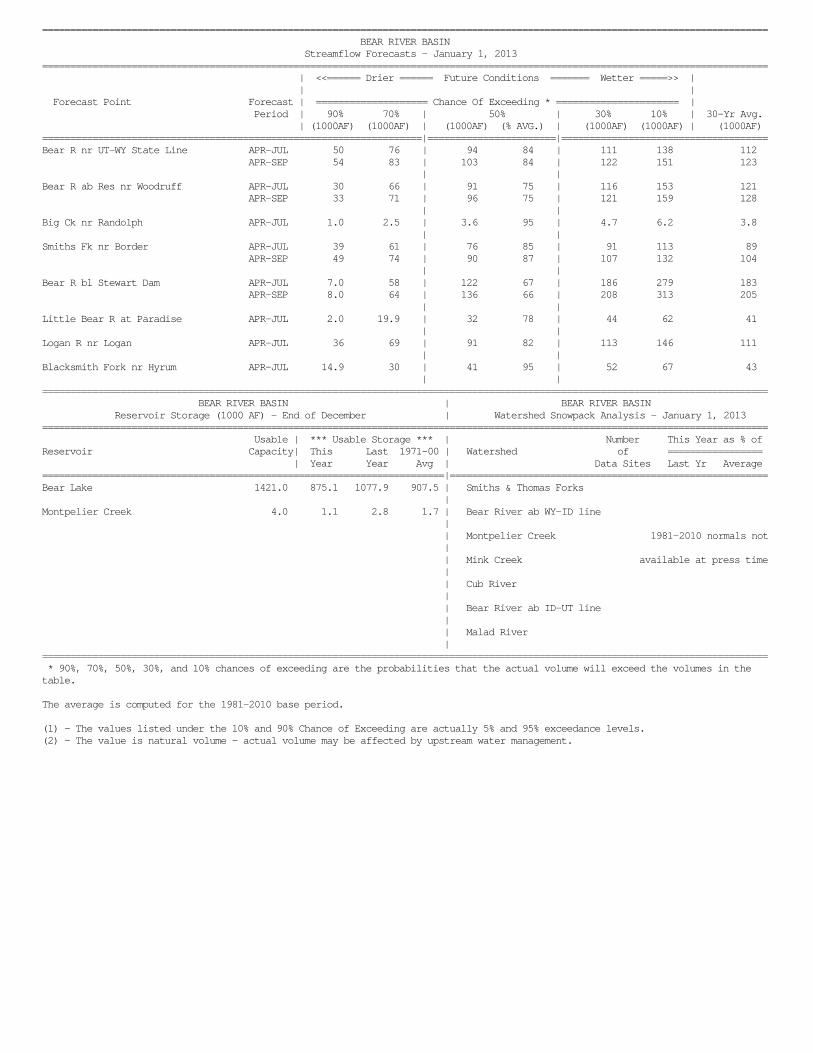
Based on the new 1981-2010 averages the Bear River is on track for a normal winter. Precipitation was better than average in October and December, making up for a drier than normal November. Water year to date precipitation since October 1 is average, as is the snowpack in the basin. The snowpack is about 125% of normal at Trial Lake and Bug Lake SNOTEL sites in Utah and decreases downstream to about 75% of normal at Emigrant Summit and Oxford Spring SNOTEL sites in Idaho. Bear Lake is storing 875,100 acre-feet, slightly less than normal. Montpelier Reservoir, with 1,100 acre-feet, is 65% of average, 28% full. The Bear River below Stewart Dam is forecast for 67% of average flow for the April-July period. Other forecasts vary from 67% of normal for the Bear River below Stewart Dam to 95% for Blacksmith Fork in Utah. Keep in mind these near normal conditions are based on the normal period from 1981-2010 instead of 1971-2000. By dropping wet years in the 1970s and adding dry ones in the 2000s the 1981-2010 normals are lower than the 1971-2000 averages. Lower snow and streamflow averages produce higher percent of normal values. Water users need to recalibrate themselves. This year’s normal snowpack would have been about 85% of normal using the 1971-2000 normals. Be conservative making water supply decisions until we all get a better feel for the effects of the new normals.
================================================================================================================================== BEAR RIVER BASIN Streamflow Forecasts - January 1, 2013 ================================================================================================================================== | <<====== Drier ====== Future Conditions ======= Wetter =====>> | | | Forecast Point Forecast | ==================== Chance Of Exceeding * ====================== | Period | 90% 70% | 50% | 30% 10% | 30-Yr Avg. | (1000AF) (1000AF) | (1000AF) (% AVG.) | (1000AF) (1000AF) | (1000AF) ====================================================================|=======================|===================================== Bear R nr UT-WY State Line APR-JUL 50 76 | 94 84 | 111 138 112 APR-SEP 54 83 | 103 84 | 122 151 123 | | Bear R ab Res nr Woodruff APR-JUL 30 66 | 91 75 | 116 153 121 APR-SEP 33 71 | 96 75 | 121 159 128 | | Big Ck nr Randolph APR-JUL 1.0 2.5 | 3.6 95 | 4.7 6.2 3.8 | | Smiths Fk nr Border APR-JUL 39 61 | 76 85 | 91 113 89 APR-SEP 49 74 | 90 87 | 107 132 104 | | Bear R bl Stewart Dam APR-JUL 7.0 58 | 122 67 | 186 279 183 APR-SEP 8.0 64 | 136 66 | 208 313 205 | | Little Bear R at Paradise APR-JUL 2.0 19.9 | 32 78 | 44 62 41 | | Logan R nr Logan APR-JUL 36 69 | 91 82 | 113 146 111 | | Blacksmith Fork nr Hyrum APR-JUL 14.9 30 | 41 95 | 52 67 43 | | ================================================================================================================================== BEAR RIVER BASIN | BEAR RIVER BASIN Reservoir Storage (1000 AF) - End of December | Watershed Snowpack Analysis - January 1, 2013 ================================================================================================================================== Usable | *** Usable Storage *** | Number This Year as % of Reservoir Capacity| This Last 1971-00 | Watershed of ================= | Year Year Avg | Data Sites Last Yr Average ========================================================================|========================================================= Bear Lake 1421.0 875.1 1077.9 907.5 | Smiths & Thomas Forks | Montpelier Creek 4.0 1.1 2.8 1.7 | Bear River ab WY-ID line | | Montpelier Creek 1981-2010 normals not | | Mink Creek available at press time | | Cub River | | Bear River ab ID-UT line | | Malad River | ================================================================================================================================== * 90%, 70%, 50%, 30%, and 10% chances of exceeding are the probabilities that the actual volume will exceed the volumes in the table. The average is computed for the 1981-2010 base period. (1) - The values listed under the 10% and 90% Chance of Exceeding are actually 5% and 95% exceedance levels. (2) - The value is natural volume - actual volume may be affected by upstream water management.

Streamflow Adjustment List for All Forecasts Published in Idaho Water Supply Outlook Report: Streamflow forecasts are projections of runoff volumes that would occur without influences from upstream reservoirs or diversions. These values are referred to as natural, unregulated or adjusted flows. To make these adjustments, changes in reservoir storage, diversions, and inter-basin transfers are added or subtracted from the observed (actual) streamflow volumes. The following list documents the adjustments made for each forecast point. (Revised Dec 2011). Panhandle River Basins Kootenai R at Leonia, MT + Lake Koocanusa storage change Moyie R at Eastport – no corrections Smith Creek nr Porthill – no corrections Boundary Ck nr Porthill – no corrections Clark Fork R at Whitehorse Rapids + Hungry Horse storage change + Flathead Lake storage change + Noxon Rapids Res storage change Pend Oreille Lake Inflow + Pend Oreille R at Newport, WA + Hungry Horse storage change + Flathead Lake storage change + Noxon Rapids storage change + Pend Oreille Lake storage change + Priest Lake storage change Priest R nr Priest R + Priest Lake storage change NF Coeur d'Alene R at Enaville - no corrections St. Joe R at Calder- no corrections Spokane R nr Post Falls + Coeur d'Alene Lake storage change Spokane R at Long Lake, WA + Coeur d'Alene Lake storage change + Long Lake, WA storage change Clearwater River Basin Selway R nr Lowell - no corrections Lochsa R nr Lowell - no corrections Dworshak Res Inflow + Clearwater R nr Peck - Clearwater R at Orofino + Dworshak Res storage change Clearwater R at Orofino - no corrections Clearwater R at Spalding + Dworshak Res storage change Salmon River Basin Salmon R at Salmon - no corrections Lemhi R nr Lemhi – no corrections MF Salmon R at MF Lodge – no corrections SF Salmon R nr Krassel Ranger Station – no corrections Johnson Creek at Yellow pine – no corrections Salmon R at White Bird - no corrections Weiser, Payette, Boise River Basins Weiser R nr Weiser - no corrections SF Payette R at Lowman - no corrections
Deadwood Res Inflow + Deadwood R bl Deadwood Res nr Lowman + Deadwood Res storage change Lake Fork Payette R nr McCall – no corrections NF Payette R at Cascade + Cascade Res storage change + Payette Lake storage change NF Payette R nr Banks + Cascade Res storage change + Payette Lake storage change Payette R nr Horseshoe Bend + Cascade Res storage change + Deadwood Res storage change + Payette Lake storage change Boise R nr Twin Springs - no corrections SF Boise R at Anderson Ranch Dam + Anderson Ranch Res storage change Mores Ck nr Arrowrock Dam – no corrections Boise R nr Boise + Anderson Ranch Res storage change + Arrowrock Res storage change + Lucky Peak Res storage change Wood and Lost River Basins Big Wood R at Hailey - no corrections Big Wood R ab Magic Res + Big Wood R at Stanton Crossing nr Bellevue + Willow Ck Camas Ck nr Blaine – no corrections Big Wood R bl Magic Dam nr Richfield + Magic Res storage change Little Wood R ab High Five Ck – no corrections Little Wood R nr Carey + Little Wood Res storage change Big Lost R at Howell Ranch - no corrections Big Lost R bl Mackay Res nr Mackay + Mackay Res storage change Little Lost R bl Wet Ck nr Howe - no corrections Upper Snake River Basin Henrys Fork nr Ashton + Henrys Lake storage change + Island Park Res storage change Falls R nr Ashton + Grassy Lake storage change + Diversions from Falls R ab nr Ashton Teton R nr Driggs - no corrections Teton R nr St. Anthony - Cross Cut Canal into Teton R + Sum of Diversions for Teton R ab St. Anthony + Teton Dam for water year 1976 only
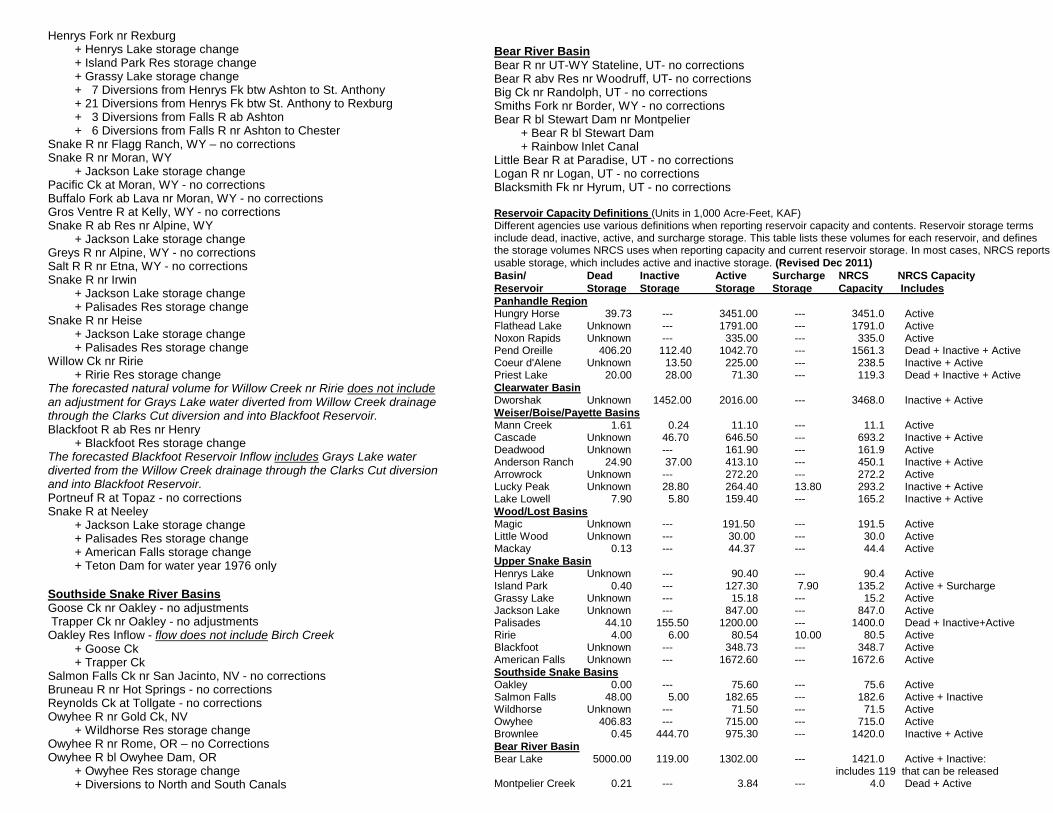
Henrys Fork nr Rexburg + Henrys Lake storage change + Island Park Res storage change + Grassy Lake storage change + 7 Diversions from Henrys Fk btw Ashton to St. Anthony + 21 Diversions from Henrys Fk btw St. Anthony to Rexburg + 3 Diversions from Falls R ab Ashton + 6 Diversions from Falls R nr Ashton to Chester Snake R nr Flagg Ranch, WY – no corrections Snake R nr Moran, WY + Jackson Lake storage change Pacific Ck at Moran, WY - no corrections Buffalo Fork ab Lava nr Moran, WY - no corrections Gros Ventre R at Kelly, WY - no corrections Snake R ab Res nr Alpine, WY + Jackson Lake storage change Greys R nr Alpine, WY - no corrections Salt R R nr Etna, WY - no corrections Snake R nr Irwin + Jackson Lake storage change + Palisades Res storage change Snake R nr Heise + Jackson Lake storage change + Palisades Res storage change Willow Ck nr Ririe + Ririe Res storage change The forecasted natural volume for Willow Creek nr Ririe does not include an adjustment for Grays Lake water diverted from Willow Creek drainage through the Clarks Cut diversion and into Blackfoot Reservoir. Blackfoot R ab Res nr Henry + Blackfoot Res storage change The forecasted Blackfoot Reservoir Inflow includes Grays Lake water diverted from the Willow Creek drainage through the Clarks Cut diversion and into Blackfoot Reservoir. Portneuf R at Topaz - no corrections Snake R at Neeley + Jackson Lake storage change + Palisades Res storage change + American Falls storage change + Teton Dam for water year 1976 only Southside Snake River Basins Goose Ck nr Oakley - no adjustments Trapper Ck nr Oakley - no adjustments Oakley Res Inflow - flow does not include Birch Creek + Goose Ck + Trapper Ck Salmon Falls Ck nr San Jacinto, NV - no corrections Bruneau R nr Hot Springs - no corrections Reynolds Ck at Tollgate - no corrections Owyhee R nr Gold Ck, NV + Wildhorse Res storage change Owyhee R nr Rome, OR – no Corrections Owyhee R bl Owyhee Dam, OR + Owyhee Res storage change + Diversions to North and South Canals
Bear River Basin Bear R nr UT-WY Stateline, UT- no corrections Bear R abv Res nr Woodruff, UT- no corrections Big Ck nr Randolph, UT - no corrections Smiths Fork nr Border, WY - no corrections Bear R bl Stewart Dam nr Montpelier + Bear R bl Stewart Dam + Rainbow Inlet Canal Little Bear R at Paradise, UT - no corrections Logan R nr Logan, UT - no corrections Blacksmith Fk nr Hyrum, UT - no corrections Reservoir Capacity Definitions (Units in 1,000 Acre-Feet, KAF) Different agencies use various definitions when reporting reservoir capacity and contents. Reservoir storage terms include dead, inactive, active, and surcharge storage. This table lists these volumes for each reservoir, and defines the storage volumes NRCS uses when reporting capacity and current reservoir storage. In most cases, NRCS reports usable storage, which includes active and inactive storage. (Revised Dec 2011) Basin/ Dead Inactive Active Surcharge NRCS NRCS Capacity Reservoir Storage Storage Storage Storage Capacity Includes Panhandle Region Hungry Horse 39.73 --- 3451.00 --- 3451.0 Active Flathead Lake Unknown --- 1791.00 --- 1791.0 Active Noxon Rapids Unknown --- 335.00 --- 335.0 Active Pend Oreille 406.20 112.40 1042.70 --- 1561.3 Dead + Inactive + Active Coeur d'Alene Unknown 13.50 225.00 --- 238.5 Inactive + Active Priest Lake 20.00 28.00 71.30 --- 119.3 Dead + Inactive + Active Clearwater Basin Dworshak Unknown 1452.00 2016.00 --- 3468.0 Inactive + Active Weiser/Boise/Payette Basins Mann Creek 1.61 0.24 11.10 --- 11.1 Active Cascade Unknown 46.70 646.50 --- 693.2 Inactive + Active Deadwood Unknown --- 161.90 --- 161.9 Active Anderson Ranch 24.90 37.00 413.10 --- 450.1 Inactive + Active Arrowrock Unknown --- 272.20 --- 272.2 Active Lucky Peak Unknown 28.80 264.40 13.80 293.2 Inactive + Active Lake Lowell 7.90 5.80 159.40 --- 165.2 Inactive + Active Wood/Lost Basins Magic Unknown --- 191.50 --- 191.5 Active Little Wood Unknown --- 30.00 --- 30.0 Active Mackay 0.13 --- 44.37 --- 44.4 Active Upper Snake Basin Henrys Lake Unknown --- 90.40 --- 90.4 Active Island Park 0.40 --- 127.30 7.90 135.2 Active + Surcharge Grassy Lake Unknown --- 15.18 --- 15.2 Active Jackson Lake Unknown --- 847.00 --- 847.0 Active Palisades 44.10 155.50 1200.00 --- 1400.0 Dead + Inactive+Active Ririe 4.00 6.00 80.54 10.00 80.5 Active Blackfoot Unknown --- 348.73 --- 348.7 Active American Falls Unknown --- 1672.60 --- 1672.6 Active Southside Snake Basins Oakley 0.00 --- 75.60 --- 75.6 Active Salmon Falls 48.00 5.00 182.65 --- 182.6 Active + Inactive Wildhorse Unknown --- 71.50 --- 71.5 Active Owyhee 406.83 --- 715.00 --- 715.0 Active Brownlee 0.45 444.70 975.30 --- 1420.0 Inactive + Active Bear River Basin Bear Lake 5000.00 119.00 1302.00 --- 1421.0 Active + Inactive:
includes 119 that can be released Montpelier Creek 0.21 --- 3.84 --- 4.0 Dead + Active

Interpreting Water Supply Forecasts
Introduction Each month, five forecasts are issued for each forecast point and each forecast period. Unless otherwise specified, all streamflow forecasts are for streamflow volumes that would occur naturally without any upstream influences. Water users need to know what the different forecasts represent if they are to use the information correctly when making operational decisions. The following is an explanation of each of the forecasts. 90 Percent Chance of Exceedance Forecast. There is a 90 percent chance that the actual streamflow volume will exceed this forecast value, and there is a 10 percent chance that the actual streamflow volume will be less than this forecast value. 70 Percent Chance of Exceedance Forecast. There is a 70 percent chance that the actual streamflow volume will exceed this forecast value, and there is a 30 percent chance that the actual streamflow volume will be less than this forecast value. 50 Percent Chance of Exceedance Forecast. There is a 50 percent chance that the actual streamflow volume will exceed this forecast value, and there is a 50 percent chance that the actual streamflow volume will be less than this forecast value. Generally, this forecast is the middle of the range of possible streamflow volumes that can be produced given current conditions. 30 Percent Chance of Exceedance Forecast. There is a 30 percent chance that the actual streamflow volume will exceed this forecast value, and there is a 70 percent chance that the actual streamflow volume will be less than this forecast value. 10 Percent Chance of Exceedance Forecast. There is a 10 percent chance that the actual streamflow volume will exceed this forecast value, and there is a 90 percent chance that the actual streamflow volume will be less than this forecast value.
*Note: There is still a 20 percent chance that actual streamflow volumes will fall either below the 90 percent exceedance forecast or above the 10 percent exceedance forecast.
These forecasts represent the uncertainty inherent in making streamflow predictions. This uncertainty may include sources such as: unknown future weather conditions, uncertainties associated with the various prediction methodologies, and the spatial coverage of the data network in a given basin. 30-Year Average. The 30-year average streamflow for each forecast period is provided for comparison. The average is based on data from 1971-2000. The % AVG. column compares the 50% chance of exceedance forecast to the 30-year average streamflow; values above 100% denote when the 50% chance of exceedance forecast would be greater than the 30-year average streamflow. AF - Acre-feet, forecasted volume of water are typically in thousands of acre-feet.
These forecasts are given to users to help make risk-based decisions. Users can select the forecast corresponding to the level of risk they are willing to accept in order to minimize the negative impacts of having more or less water than planned for. To Decrease the Chance of Having Less Water than Planned for A user might determine that making decisions based on a 50 percent chance of exceedance forecast is too much risk to take (there is still a 50% chance that the user will receive less than this amount). To reduce the risk of .having less water than planned for, users can base their operational decisions on one of the forecasts with a greater chance of being exceeded such as the 90 or 70 percent exceedance forecasts. To Decrease the Chance of Having More Water than Planned for A user might determine that making decisions based on a 50 percent chance of exceedance forecast is too much risk to take (there is still a 50% chance that the user will receive more than this amount). To reduce the risk of having more water than planned for, users can base their operational decisions on one of the forecasts with a lesser chance of being exceeded such as the 30 or 10 percent exceedance forecasts. Using the forecasts - an Example Using the 50 Percent Exceedance Forecast. Using the example forecasts shown below, there is a 50% chance that actual streamflow volume at the Boise River near Twin Springs will be less than 685 KAF between April 1 and July 31. There is also a 50% chance that actual streamflow volume will be greater than 685 KAF. Using the 90 and 70 Percent Exceedance Forecasts. If an unexpected shortage of water could cause problems (such as irrigated agriculture), users might want to plan on receiving 610 KAF (from the 70 percent exceedance forecast). There is a 30% chance of receiving less than 610 KAF. Alternatively, if users determine the risk of using the 70 percent exceedance forecast is too great, then they might plan on receiving 443 KAF (from the 90 percent exceedance forecast). There is 10% chance of receiving less than 443 KAF. Using the 30 or 10 Percent Exceedance Forecasts. If an unexpected excess of water could cause problems (such as operating a flood control reservoir), users might plan on receiving 760 KAF (from the 30 percent exceedance forecast). There is a 30% chance of receiving more than 760 KAF. Alternatively, if users determine the risk of using the 30 percent exceedance forecast is too great, then they might plan on receiving 927 KAF (from the 10 percent exceedance forecast). There is a 10% chance of receiving more than 927 KAF. Users could also choose a volume in between any of these values to reflect their desired risk level.
Weiser, Payette, Boise River Basins Streamflow Forecasts – January 2006
===================================================================================================================================== Forecast Point Forecast ============================= Chance of Exceeding * ============================== Period 90%
(1000AF) 70%
(1000AF) 50%
(1000 AF) (% AVG.) 30%
(1000AF) 10%
(1000AF) 30-Yr Avg. (1000AF)
===================================================================================================================================== SF PAYETTE RIVER at Lowman APR-JUL 329 414 471 109 528 613 432 APR-SEP 369 459 521 107 583 673 488 BOISE RIVER near Twin Springs (1) APR-JUL 443 610 685 109 760 927 631 APR-SEP 495 670 750 109 830 1005 690 =====================================================================================================================================
*90%, 70%, 30%, and 10% chances of exceeding are the probabilities that the actual flow will exceed the volumes in the table
USDA Natural Resources Conservation Service 9173 West Barnes Drive, Suite C Boise ID 83709-1574
OFFICIAL BUSINESS
Issued by Jason Weller, Acting Chief Natural Resources Conservation Service Washington, DC Released by Jeff Burwell, State Conservationist Rob Sampson, State Conservation Engineer Natural Resources Conservation Service Boise, Idaho Prepared by Idaho Snow Survey Staff Ron Abramovich, Water Supply Specialist Philip Morrisey, Data Collection Officer Jeff Anderson, Hydrologist Jeff Graham, Electronics Technician Alex Rebentisch, Electronics Technician Forecasts and Assistance provided by Rashawn Tama, Forecast Hydrologist Jolyne Lea, Forecast Hydrologist NRCS, National Water and Climate Center, Portland, Oregon Numerous other groups and agencies provide funding and/or cooperative support for the collection, operation and maintenance of the Cooperative Idaho Snow Survey Program. Their cooperation is greatly appreciated.


