Colorado Basin Outlook
22
NOAA/NWS Arizona La Nina Briefing December 6, 2013 Kevin Werner NWS Colorado Basin River Forecast Center 1 Colorado Basin Outlook
Transcript of Colorado Basin Outlook

NOAA/NWS Arizona La Nina Briefing December 6, 2013
Kevin Werner NWS Colorado Basin River Forecast Center
1
Colorado Basin Outlook

Outline
• River Forecast Center overview • Arizona’s water supply • 2013 runoff review
• Colorado River • Salt/Verde Rivers
• 2014 Look Ahead • Antecedent conditions • Climate and Weather impacts on Streamflow
2

Colorado Basin River Forecast Center
The Colorado Basin River Forecast Center (CBRFC) generates streamflow forecasts across the Colorado and Utah. The latest forecasts, data, and more are available online: – Daily streamflow forecasts – Long lead peak flow forecasts – Water supply forecasts – Webinar briefings – Email updates – And More….
www.cbrfc.noaa.gov

Arizona Water Supply
Expository TextMost of Arizona’s water supply is surface water from the Colorado River and from in-state
rivers such as the Gila, Salt and Verde. Of course, Central Arizona Project (CAP) water is
surface water too. Groundwater is an important water supply throughout the state, but through
increased CAP use the state has reduced the amount of groundwater pumped. Reclaimed
water or “effluent” is a growing water supply for irrigation and industrial users.
Central Arizona Project is designed to bring 1.5 million acre-feet of Colorado River water per
year to Pima, Pinal and Maricopa counties. CAP carries water from Lake Havasu near Parker
to the southern boundary of the Tohono O’odham Indian Reservation southwest of Tucson.
It is a 336-mile long system of aqueducts, tunnels, pumping plants and pipelines and is the
largest single resource of renewable water supplies in the state of Arizona.
Water is used for many purposes in Arizona. Most of the water is used for agriculture in
central and southwestern Arizona. Municipal uses include residential, commercial and some
industrial uses. Mining, electrical power generation, dairies and feedlots comprise most of
the industrial water demand. There are also environmental uses (e.g. wetland inhabitants) of
water that are difficult to measure. Water use by riparian vegetation can be significant in some
areas. Nonconsumptive uses of water include hydroelectric power generation and recreation
such as boating, fishing and swimming.
Water demand is expected to increase as Arizona’s population grows. Arizona is the second
fastest growing state, increasing from 3.6 million to 5.1 million inhabitants (40%) between 1990
and 2000. By July 2006, an additional 1 million people lived in Arizona. Rapid population
growth impacts water supplies and infrastructure in some areas of the state. Arizona’s
population is expected to exceed 11 million by 2050.
ObjectivesStudents will:
Interpret pie charts •
Summarize the data shown in the charts •
Identify 5 ways to conserve water at home and school•
Identify 5 ways to conserve water in agriculture•
Evaluate water supply and demand in Arizona•
Describe water-oriented careers in Arizona •
Suggested Activities:Brainstorm and discuss water supply and water use using data from the Arizona Department •
of Water Resources web site: http://www.azwater.gov/dwr/
Construct a graphic, poster, brochure, etc. designed to communicate the amount of water used •
indirectly to produce different things (see Arizona Water Web (ACW p. 190))
ARIZONA COOPERATIVE
E TENSION
Graphic 10: Water Supply & Water Demand
ARIZONA WATER MAP CURRICULUM GUIDE
November, 2009AZ1501j
Water Supply
Water Demand
Major Concepts:Groundwater and CAP water are •
extremely important to Arizona’s water
supply
Agriculture is the largest water user•
Vocabulary:reclaimed water•
aqueduct•
effluent•
nonconsumptive•
hydroelectric•
population•
Arizona Project WET Lesson Links:“Arizona Water Web”• (ACW p. 190)
Read • Home Grown Tomatoes (ACW p. 289)
& Sundance Farms (ACW p. 299) about
agricultural water conservation
Arizona Academic Standards Correlation: http://cals.arizona.edu/arizonawet/
standards/azstandardscorr.html
4
Arizona’s surface water surface water supply: • 2.8 MAF/year from Colorado R • ~0.8 MAF/year from Salt Verde • ~0.25 MAF/year from other rivers
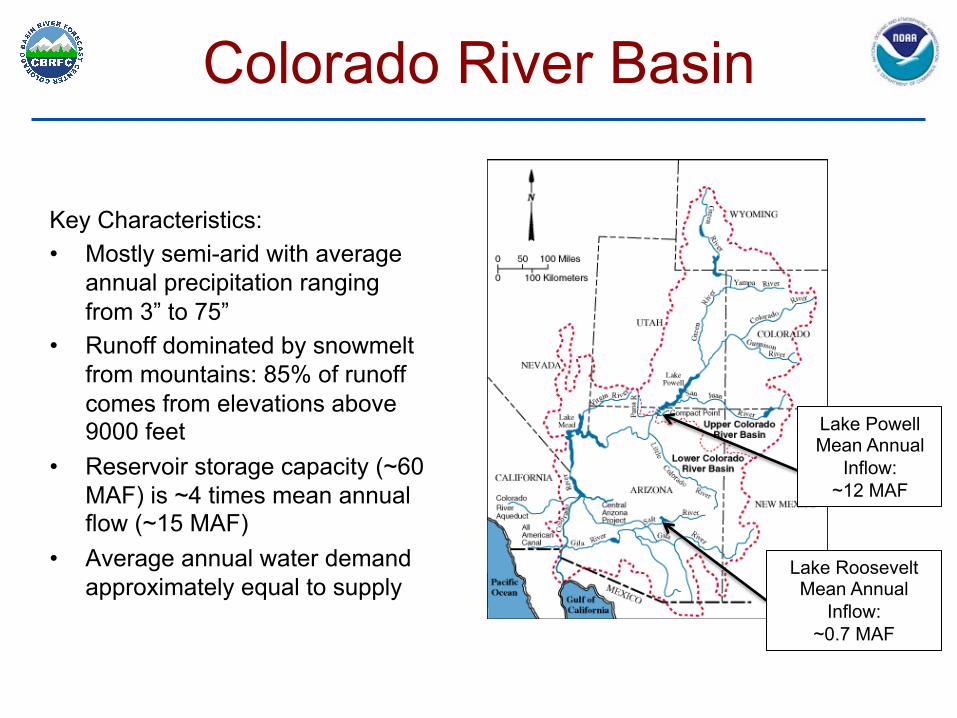
Colorado River Basin
Key Characteristics: • Mostly semi-arid with average
annual precipitation ranging from 3” to 75”
• Runoff dominated by snowmelt from mountains: 85% of runoff comes from elevations above 9000 feet
• Reservoir storage capacity (~60 MAF) is ~4 times mean annual flow (~15 MAF)
• Average annual water demand approximately equal to supply
Lake Powell Mean Annual
Inflow: ~12 MAF
Lake Roosevelt Mean Annual
Inflow: ~0.7 MAF

Recent History
6
• Upper Colorado - 2012 and 2013 were the two driest consecutive years on record and two of the four driest individual years on record for Lake Powell inflow
• Salt/Verde – Roosevelt inflow was 2011 (9th driest), 2012 (21st driest), and 2013 (34th driest) were all much below historical average and median
• Summer 2013 was very wet – providing good antecedent conditions for winter season

Lake Powell Inflow
7

La Nina and CO River Streamflow
Very low correlations in most of upper basin (right: Lake Powell)
La Nina correlated with low streamflow in lower basin at around 0.2 – 0.3
Weaker correlations for San Juan Basin with low streamflow and Upper Green with high streamflow
2014 forecast
Average = 7.9 maf
Lake Powell Inflow vs El Nino / La Nina
El N
ino
La N
ina

El Nino/La Nina and Arizona Rivers
Salt River shown Significant
correlations (0.15-0.3) for low streamflow during La Nina years
Relationship
especially strong with strong La Nina years (like 2011)
2014 forecast
Lake Roosevelt Inflow vs El Nino / La Nina
El N
ino
La N
ina

Summer/Fall Precipita0on

Water Year Departure from Normal

CBRFC Mod
el Soil M
oisture
11/1/2013

Base Flow: Salt, Verde, and Gila
13
Dry conditions throughout AZ Being so dry from last year
definitely factored into this year’s forecast
Conditions improved this summer for next year’s WS
Verde Upper Gila
Salt

Base flows: Upper Colorado
East River at Almont, CO Animas River at Durango, CO
Yampa River at Steamboat Springs, CO Green at Warren Bridge, WY

Snow so far (Dec 5)

16


Early WY14 River Outlook…
Excellent antecedent condi0ons – Aug/Sept precipita0on – Soil moisture (less so in UT) – Streamflow
Climate predic0ons – Dry for AZ, NM – No help for upper basin
Weather – Ac0ve period

Early WY14 River Outlook: Lake Powell
BoZom line: Off to a promising start but long ways to go

Early WY14 River Outlook: Lake Roosevelt
BoZom line: Off to a promising start but long ways to go

Summary
• Poor runoff last 2-3 years • Great antecedent conditions • ENSO neutral -> “anything goes” • Snow season off to a good start but still
very early and lots can happen.
21
Kevin Werner
CBRFC Service Coordina0on Hydrologist
Phone: 801.524.5130 Email: [email protected]
Feedback, Ques0ons, Concerns always welcome….