IBM WebSphere Application Server V8 - IBM - United States
13
WHAT IS A SPORTS CAR? BY JEAN-FRANCOIS INGENBLEEK Universitd Libre de Bruxelles and JEAN LEMAIRE Wharton School, University of Pennsylvania ABSTRACT Principal component analysis is employed to construct a new formula defining 'sports cars', a classification variable commonly used by Belgian insurers in motor insurance. Five hundred and eighty-one different car models were used in the design of the formula. It is based solely on the cars' technical characteristics and hence does not rely on the subjective opinion of experts; the resulting classification is independent of units of measurement employed. Thus the defi- nition is suitable for application world-wide. KEYWORDS Principal component analysis, establishment of motor insurance tariffs, sports cars. 1. INTRODUCTION The Belgian automobile market is wide open to competition. There is no 'Belgian car', and the country is small and boasts an excellent network of motorways. It is not difficult for a foreign car manufacturer to enter the Belgian market. The cost of establishing a chain of dealers and workshops is modest. Moreover, foreigners do not have to confront established domestic manufacturers as would be the case in, say, France or the US. As a result, Belgian consumers have the privilege of being able to choose among no less than 581 different models. For the insurers, there is a marked drawback in having so many different car models in such a small market, shared by over 100 companies: claim statistics for car models are unreliable. Until a few months ago, companies were not even required to provide statistics by car model to the Automobile Statistics Commission of the Professional Union of Insurance Companies. Hence such data are for the moment totally unavailable, and other variables than 'car model' need to be used for tariff purposes. In establishing their rates, Belgian insurers have always used a variable called 'vehicles of a sporting nature', i.e. sports cars. The statutory tariff for third-party ASTIN BULLETIN Vol. 18, No. 2
Transcript of IBM WebSphere Application Server V8 - IBM - United States
W H A T IS A SPORTS CAR?
BY JEAN-FRANCOIS INGENBLEEK
Universitd Libre de Bruxelles
and
JEAN LEMAIRE
Wharton School, University o f Pennsylvania
ABSTRACT
Principal component analysis is employed to construct a new formula defining 'sports cars ' , a classification variable commonly used by Belgian insurers in motor insurance. Five hundred and eighty-one different car models were used in the design of the formula. It is based solely on the cars ' technical characteristics and hence does not rely on the subjective opinion of experts; the resulting classification is independent of units of measurement employed. Thus the defi- nition is suitable for application world-wide.
KEYWORDS
Principal component analysis, establishment of motor insurance tariffs, sports cars.
1. INTRODUCTION
The Belgian automobile market is wide open to competition. There is no 'Belgian car ' , and the country is small and boasts an excellent network of motorways. It is not difficult for a foreign car manufacturer to enter the Belgian market. The cost of establishing a chain of dealers and workshops is modest. Moreover, foreigners do not have to confront established domestic manufacturers as would be the case in, say, France or the US. As a result, Belgian consumers have the privilege of being able to choose among no less than 581 different models.
For the insurers, there is a marked drawback in having so many different car models in such a small market, shared by over 100 companies: claim statistics for car models are unreliable. Until a few months ago, companies were not even required to provide statistics by car model to the Automobile Statistics Commission of the Professional Union of Insurance Companies. Hence such data are for the moment totally unavailable, and other variables than 'car model ' need to be used for tariff purposes.
In establishing their rates, Belgian insurers have always used a variable called 'vehicles of a sporting nature ' , i.e. sports cars. The statutory tariff for third-party
ASTIN BULLETIN Vol. 18, No. 2

176 INGENBLEEK AND LEMAIRE
liability penalizes sports cars brought on to the road before 1 July 1971 by a sup- plement of 40% on top of the basic premium for business use. In other lines (fire, theft, collision, etc.) there is no statutory tariff. Nevertheless, most companies treat sports cars in a special fashion. For instance, the underwriting standards for sports cars in one large company are as follows:
in collision coverage, to require the largest available deductible and apply a sur- charge of 40070, and in theft insurance, to require an electronic security system.
By definition, a vehicle is said to be of a sporting nature iff
where
17, P
W is the weight of the car, in kilograms, P is the power of the engine, in DIN horse-power, S is the number of seats, and cc is the engine cubic capacity, in litres.
This formula was devised in 1971 by a well-known Belgian Grand Prix driver (it is also used in rally and endurance racing, to subdivide the competitors into classes). Clearly, it is not exempt from criticisms:
(i) it is extremely sensitive to the number of seats, a variable which is not well defined;
(ii) it does not take into account the recent technological evolution in the con- struction of engines (introduction of turbos, improvement in diesel engines, LPG . . . . );
(iii) the use of third and fourth roots has no physical justification; (iv) as the formula classifies all vehicles into two categories only, awkward
border-line cases were bound to arise. For instance, a BMW 528I is of a sporting nature, while the more expensive and slightly heavier BMW 728I is not. Yet both cars have identical engines! This lead to bittersweet discus- sions with the importer, who claimed that his customers could avoid the surcharge by always carrying a heavy bag in their trunks!
In an article entitled 'Fraud ' , a leading specialized automobile journal presented six car models (Audi 80 GTE, VW Golf GTI two and four doors, VW Jetta GT two and four doors, VW Scirocco GTX), with the same engine, power, cubic capacity and number of seats. Due to slight weight differences, four of the models are of a sporting nature, two are not. A VW JETTA with two doors is a sports car, while the four door version is not!
It is obvious that the formula has its flaws. Moreover, the classification 'sports car ' is itself a questionable notion. After all, sports cars are not dangerous per
se; those who buy and drive them are the risks. Thus 'sports car ' is at best a proxy
WHAT IS A SPORTS CAR? 177
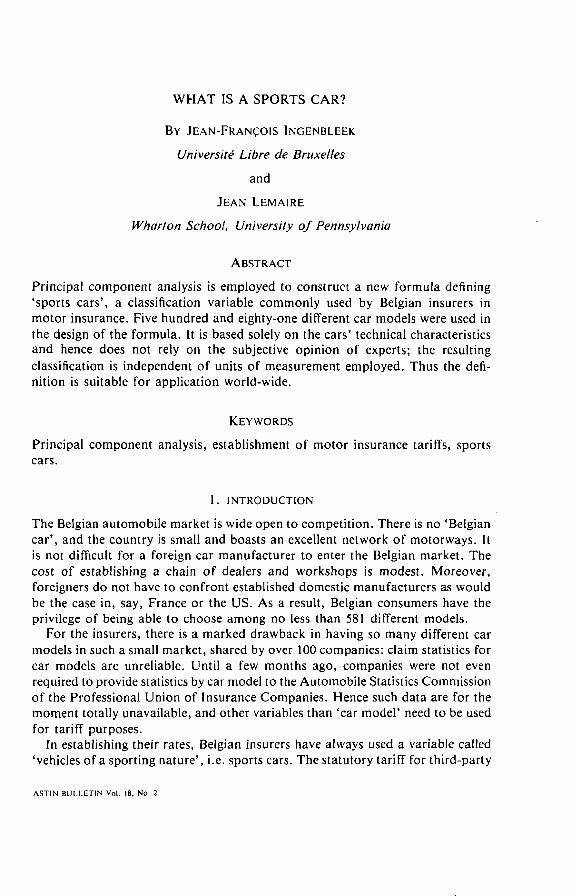
variable for 'driver who behaves aggressively'. In fact, the objective is to characterize the 'sports car driver' by the vehicle s/he is likely to buy. In spite of all of this, the claim statistics presented in Table I show that 'vehicle of a sporting nature ' remains a highly significant variable.
These statistics persuaded the Automobile Technical Commission of the Pro- fessional Union of Insurance Companies to appoint a study group, composed of actuaries, engineers and practitioners, to establish a new formula. The initial con- clusions of the study group were as follows:
1. The formula should be of the multiplicative type, for technical reasons (e.g. the engineers of the group felt that the variable 'weight/power ' makes more sense than any linear combination of 'weight ' and 'power ' ) ;
2. It should only include well-defined parameters. This requirement led to the deletion of variables like ' top speed' or 'min imum time to reach 100 km]h ' , for which there is no international standard of measure: the values provided by the manufacturers depend on weather and road con- ditions, on the type of tyres . . . . The selected parameters were
the power of the engine, in kw din; the weight of the car, in kg; the cubic capacity of the engine, in cc; the maximum torque (couple), in Nm din; the maximum engine speed, in rounds per minute.
3. The construction of the formula should if possible be 'expert-free ' ; in other words, the classification of a given vehicle should only depend on objectively measurable performance standards, and not on a necessarily subjective evaluation by an expert. One consequence is that the new
TABLE I
CLAIM STATISTICS FOR ORDINARY AND SPORTS CARS FROM A MAJOR COMPANY
Ordinary cars Sports cars
Claim Average claim Claim Average claim frequency amount (BF) Year frequency amount (BF)
0.124 42,352 1976 0.134 228,057 0.127 46,841 1977 0.157 32,252 0.121 48,328 1978 0.127 420,430 0.119 54,375 1979 0.142 280,216 0.109 63,026 1980 0.106 44,594 0.105 73,141 1981 0.141 36,094 0.098 79,299 1982 0.132 39,412 0.096 93,349 1983 0.132 1,990,334 0.098 105,280 1984 0.144 30,346 0.111 92,796 1985 0.170 230,777
0.102 88,662 Average 198111985 0.143 440,952 0.111 69,980 Average 1976/1985 0.139 312,600
178 INGENBLEEK AND LEMAIRE
definition will consider only technical characteristics of car; no attempt is made to consider manufacturers ' ' images ' on consumers ' minds.
All the models registered on 1 January 1986, 581 in total, were compiled in a data base (where several slightly differing variants of a model are marketed, only one was considered). Five models (the three Bentleys and the two Rolls Royces) had to be eliminated, since the importer did not disclose the values taken by several variables. Since there are only 96 Bentleys and 221 Rolls Royces in Belgium, these deletions are insignificant. Noteworthy is the near-absence of American models: the high US dollar, near its peak in January 1986, priced US- manufactured cars out of reach of most Belgian motorists. It should also be noted that all car models received an equal weighting in the statistical analysis: a technical formula defining sports cars should of course not depend on market shares. Analyses performed on sub-groups of cars led essentially to the same for- mula, which appears to be extremely robust as regards the models in the data base.
2. STATISTICAL RESULTS
The statistical method used was principal component analysis, performed on the logarithms of the variables so as to linearize multiplicative formulae.
Principal component analysis is a multivariate technique whose main purpose is to derive a small number of linear combinations (principal components) of a set of variables that retain as much of the information in the original variables as possible. It aims at reducing the number of variables necessary to describe the data, while losing the smallest possible amount of information: very often a small number of principal components can be used in place of the original variables. Given a data set with p numeric variables, p principal components may be com- puted; each one is a linear combination of the original variables with coefficients equal to the eigenvectors (customarily taken with unit norm) of the correlation matrix. The principal components are sorted by descending order of the eigen- values, which are equal to the variances of the components. Principal com- ponents have a variety of useful properties:
The eigenvectors are orthogonal; so the principal components represent jointly perpendicular directions through the space of the original variables. The principal component scores are jointly uncorrelated. The first principal component has the largest variance of any unit-length linear combination of the observed variables. The j th principal component has the largest variance of any unit-length linear combination orthogonal to the first j - I principal components. The last principal component has the smallest variance of any linear combination of the original variables. The first j principal components are the best linear predictors of the original variables among all possible sets of j variables.
The five following variables were used in the analysis, after standardization in order to eliminate the influence of measurement units.
W H A T IS A S P O R T S C A R ? 1 7 9
Xl = log(weight/power), x2 = log(power/cubic capacity), x3 = log(maximum torque), x4 = log(maximum engine speed), x5 = log(cubic capacity).
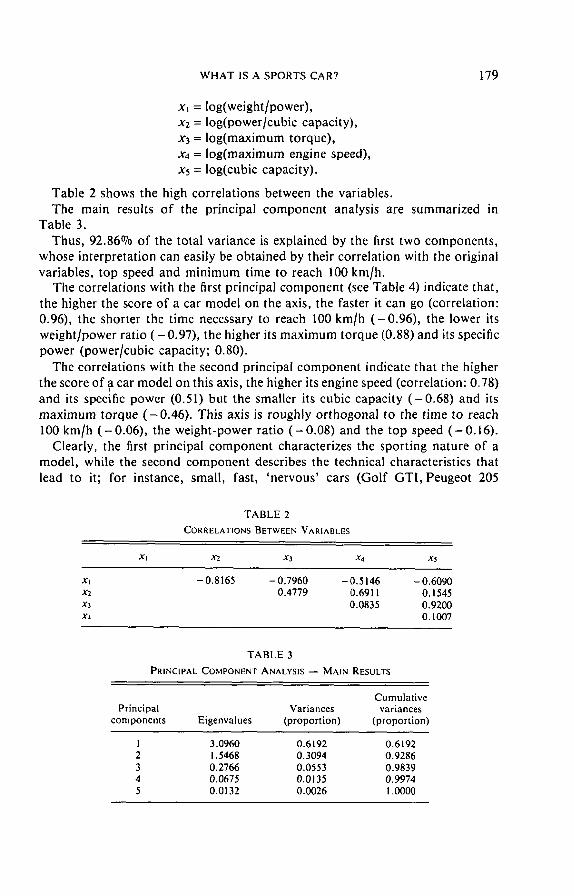
Table 2 shows the high correlations between the variables. The main results of the principal component analysis are summarized in
Table 3. Thus, 92.86°70 of the total variance is explained by the first two components,
whose interpretation can easily be obtained by their correlation with the original variables, top speed and minimum time to reach 100 km/h.
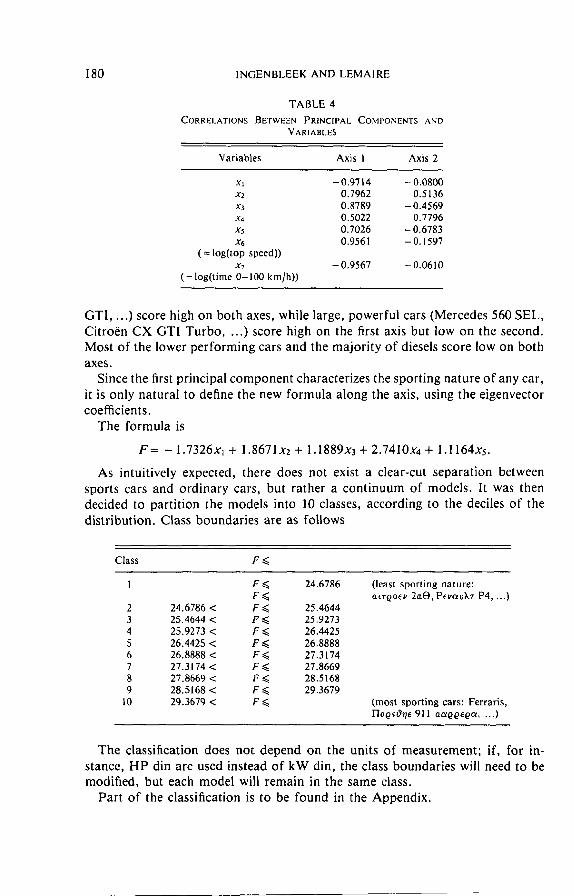
The correlations with the first principal component (see Table 4) indicate that, the higher the score of a car model on the axis, the faster it can go (correlation: 0.96), the shorter the time necessary to reach 100 km/h ( -0 .9 6 ) , the lower its weight/power ratio ( - 0.97), the higher its maximum torque (0.88) and its specific power (power/cubic capacity; 0.80).
The correlations with the second principal component indicate that the higher the score of 9 car model on this axis, the higher its engine speed (correlation: 0.78) and its specific power (0.51) but the smaller its cubic capacity ( - 0 . 6 8 ) and its maximum torque ( -0 .46 ) . This axis is roughly orthogonal to the time to reach 100 km/h ( -0 .06 ) , the weight-power ratio ( - 0 . 0 8 ) and the top speed ( -0 .16 ) .
Clearly, the first principal component characterizes the sporting nature of a model, while the second component describes the technical characteristics that lead to it; for instance, small, fast, 'nervous' cars (Golf GTI, Peugeot 205
T A B L E 2
CORRELATIONS BETWEEN VARIABLES
xt x2 x3 x4 x5
x~ - 0.8165 - 0.7960 - 0, 5146 - 0,6090 x2 0.4779 0.6911 0.1545 x~ 0.0835 0.9200 x4 0.1007
T A B L E 3
PRINCIPAL COMPONENT ANALYSIS - - MAIN RESULTS
C u m u l a t i v e Pr inc ipal Var iances var iances
componen t s Eigenvalues (p ropor t ion) (p ropor t ion)
I 3.0960 0.6192 0.6192 2 1.5468 0.3094 0.9286 3 0.2766 0.0553 0.9839 4 0.0675 0.0135 0.9974 5 0.0132 0.0026 1.0000
1 8 0 I N G E N B L E E K A N D L E M A I R E
T A B L E 4
CORRELATIONS BETWEEN PRINCIPAL COMPONENTS AND VARIABLES
Var iables Axis 1 Axis 2
xl - 0.9714 - 0.0800 x2 0.7962 0.5136 x3 0,8789 - 0.4569 x4 0.5022 0.7796 x5 0.7026 - 0.6783 x6 0.9561 - 0.1597
( = log(top speed)) x7 - 0.9567 - 0.0610
( = log( t ime 0 - 1 0 0 km/h))
GT1 .. . . ) score high on both axes, while large, powerful cars (Mercedes 560 SEL, Citroen CX GTI Turbo . . . . ) score high on the first axis but low on the second. Most of the lower performing cars and the majority of diesels score low on both axes.
Since the first principal component characterizes the sporting nature of any car, it is only natural to define the new formula along the axis, using the eigenvector coefficients.
The formula is
F = - 1.7326xt + 1.8671x2 + 1.1889x3 + 2.7410x4 + 1.1164x5.
As intuitively expected, there does not exist a clear-cut separation between sports cars and ordinary cars, but rather a continuum of models. It was then decided to partition the models into 10 classes, according to the deciles of the distribution. Class boundaries are as follows
Class F~<
I F ~< 24.6786 F~<
2 24,6786 < F ~< 25.4644 3 25.4644 < F ~ 25.9273 4 25.9273 < F ~< 26.4425 5 26.4425 < F ~< 26.8888 6 26.8888 < F ~ 27.3174 7 27.3174 < F ~< 27.8669 8 27.8669 < F ~ 28.5168 9 28.5168 < F ~< 29.3679
10 29.3679 < F ~<
(least spor t ing nature : atrOOO~V 2~O, P~vo~ukr P4, ...)
(most spor t ing cars: Ferrar is , I-lo0~0r/e 911 ac~00t00ct . . . . )
The classification does not depend on the units of measurement; if, for in- stance, HP din are used instead of kW din, the class boundaries will need to be modified, but each model will remain in the same class.
Part of the classification is to be found in the Appendix.
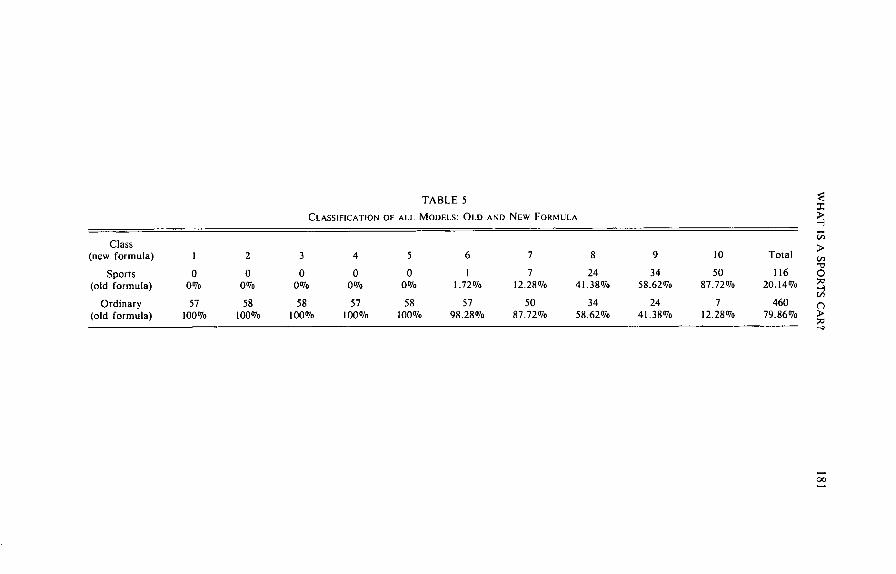
TABLE 5
CLASSIFICATION OF ALL MODELS: OLD AND NEW FORMULA
Class (new formula) I 2 3 4 5 6 7 8 9 10 Total
Sports 0 0 0 0 0 1 7 24 34 50 116 (old formula) 0~/o 0°7o 0o7o 0%0 0°7o 1.72°7o 12.28°/o 4 1 . 3 8 ° 7 o 5 8 . 6 2 o / 0 8 7 .7 2 O/o 20.14°/o
Ordinary 57 58 58 57 58 57 50 34 24 7 460 (old formula) 100O/o 100% 100%o I00o7o 100%o 98.28% 87.72% 58.62% 41.38O7o 12 .28O/o 79.86o70
> t~
O 7~
t")
182 INGENBLEEK AND LEMAIRE
3. COMPARISON WITH OLD FORMULA
Table 5 compares the results given by the old and new formulae; for instance, the first sports car (as defined by the old formula) appears in class 6 of the new definition. Seven models which were formerly not considered as sports cars are now assigned to class 10.
Figure 1 shows the position of all models along the two axes. Sports cars (according to the old formula) are indicated by a ' + ', ordinary cars are shown by a 'o ' . Thus the old formula provided some degree of consistency in that it selected the upper-right part of the figure: most of the sports cars, according to the old formula, are to be found above a diago~nal straight line. Clearly the deviser of the 1971 formula sought to combine technical characteristics with the external aspect of the car: small, 'z ippy ' cars were classified as sports cars; on the other hand large, powerful cars (with the same power but a less 'appealing look') were not.
4. SHOULD ENGINEERS BE TRUSTED?
The old formula selects as sports cars the models which fall into the upper-right part of Figure 1, above the diagonal. The new formula proceeds by horizontal lines. This difference results from the study group's decision to use only the technical characteristics of the models in the definition: this is the major assumption behind the entire analysis.
Yet the people who buy fast cars are not necessarily engineers. Are they in- fluenced purely by technical considerations in their selection process, or do they also base their decision on external aspects of the cars?
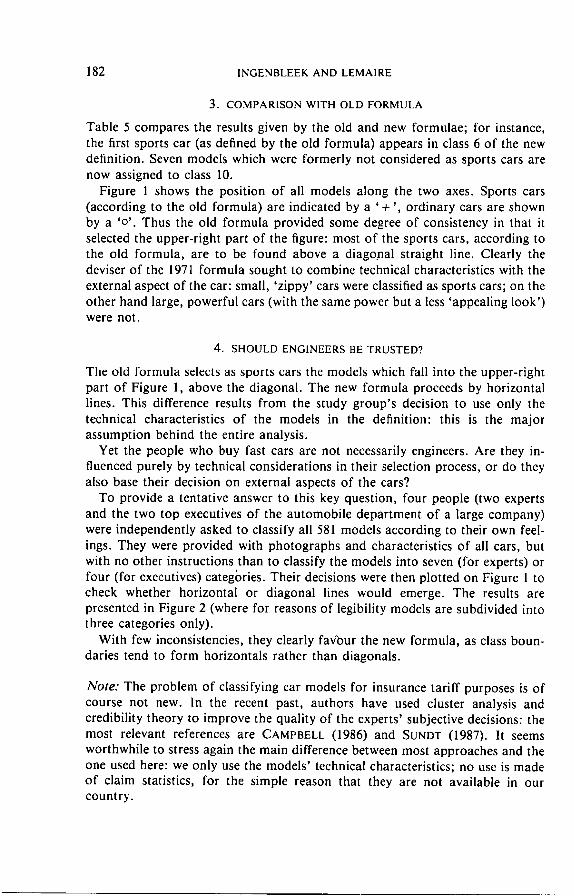
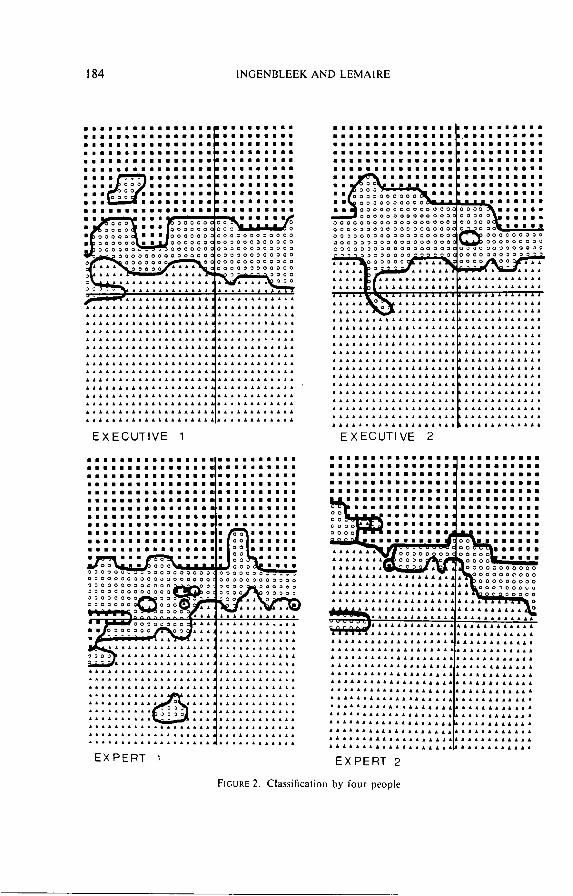
To provide a tentative answer to this key question, four people (two experts and the two top executives of the automobile department of a large company) were independently asked to classify all 581 models according to their own feel- ings. They were provided with photographs and characteristics of all cars, but with no other instructions than to classify the models into seven (for experts) or four (for executives) categories. Their decisions were then plotted on Figure 1 to check whether horizontal or diagonal lines would emerge. The results are presented in Figure 2 (where for reasons of legibility models are subdivided into three categories only).
With few inconsistencies, they clearly fa¢our the new formula, as class boun- daries tend to form horizontals rather than diagonals.
Note: The problem of classifying car models for insurance tariff purposes is of course not new. In the recent past, authors have used cluster analysis and credibility theory to improve the quality of the experts' subjective decisions: the most relevant references are CAMPBELL (1986) and SUNDT (1987). It seems worthwhile to stress again the main difference between most approaches and the one used here: we only use the models ' technical characteristics; no use is made of claim statistics, for the simple reason that they are not available in our country.

W H A T IS A SPORTS CAR? 183
24
23
+ = S PORTS I O L D
o : O R D I N A R Y
F O R M U L A
÷
4- 4-
4-
t. + % o 4-4
oo Q o ~ % o.I-
+ o o o o ~
o o c P ~ o
o ~o° ~o~
° o o % 8 ~
o ~ ~ o o ~ o o ~ o
o ° ~ o ~ o ~ o o~°
o oe~ o %
• ° °°ooo~: o ° o o ° o ~ o
o o o ~ o
~o o
o
FIRST AX IS
+
4-
4- 4-
÷ 4- +
4- 4- 4-
% 4- +
* +
;4- 4-, ~ ..~.+'~" + +
o ~ :
,~ ~ " ~ + S E C O N D
' ~ ° o°° ° ° ~ A X I S
~ o~ ~ o o
o o ~o o~o 0 0 0
o o ~OoOo~OO oOO o ~ o o o
~Oo ~ o 8
0 0 o o °°o ~o o° o ~ o o 8
o o
0 0
0
FIGURE I. Representation of all cars in main plane
! 84 INGENBLEEK AND LEMAIRE
i i iiiiiiilIiiiiiiiii o o o o o o o o o o o o o o o o o c o o o o o o o o ~ o o o o o o o o o
• ,w~ - o o o o o o o o o o o o o o ~ o o o o o o ~ o o o o o
. . . . . . . . . : : . . . . . . . . . . . . . . . . : ,
. . . . . . . . . : : , , , : : : : ' : . . . . . . . : :
i l ....... i i i i . . . . . . . . . . . .
E X E C U T I V E 1
: : : : : : : : : : : : : : : m i l l l m i i l m i l i i l
m m m m m | m m m m m l m m l
: : : : : : : : : : : : : : : : : : : : : : : : : : : : : :
: : : : : : : : : m i m m m m i m e
i m m m m m m m m
1 1 : : : : 1 : : 1 1 : 1 : 1 : : :
o o o o o o o o o o o o o o o o o o o < o o o o o o o o o o o o
o o o o o o o o = o o o o o o o o a o o o ~ o : ~ ~ oo ~ l l ~ j~ l~ oo ~ ~ oo ~ o o o o o o o o o o ooooooooooooo o~ o~oc ooooo
i C j , • . , t ~ , ,~ j ~ o o o o " '
EXPERT 1
: : : : : : : : : : : : : : : m l w i l m m m i l l i l m n m m m m m a m i m i m i i m i
o o o o o o o o o o o o o o o o o o ~ o o o o o o o o o o o o o o ~ o o o < o o o 0 o o o o o o o o o o o o o o < o o o o o ~ o o o o o o o o o o o o ~ o o o o o ~ o o o o o o o o o o o o c
: . : : : : : ; : : : : i el l i l i ID II l i IS m ID l i
ie l i el l i al l i l i m la II
: : : : : : : : : :
i! i i i! i i i!
• a ~ , ooooo¢ c
. . . . A £ £ i £ ~ ~ £ A £ 6 ~ A I A £ £ £
a a ~ , & , a a a £ a & a a & ~ ,
a a a , £ , , a & a a & A ~ & ~
E X E C U T I V E 2
iiiiiiiiiiiiliiiiiiiiii
a i J i a i a a a ~ A A a a J A a a A a A a ~ A I A a l A ~ a A a A A a
1 1 1 1 1 1 1 1 1 1 1 1 1 1 1 A l l £ 1 l l l l [ l l ~ l l [ l l
I A I I A I I I I I A A I I i i A A
• I i 1 1 1 1 1 A I l
EX PERT 2
A A A A A A A A I A A A A A A A I A A A J A A A A A A 4 A I I A i A A A J A A A A A J a A a A l a A i l l
A A : A A J A A ~ A A A A A A A I A A A A A a l a l l A i a a A
A A A a A A A I A A A I ~ a A ~ A A A A A A J J J A A A A A A A A
A A J A a a a a ~ a ~ a
FIGURE 2. Classification by four people
W H A T IS A SPORTS CAR? 185
REFERENCES
B. SUNDT (Two credibility regression approaches for the classification of passenger cars in a multiplicative tariff, A S T I N Bulletin, 1'7, 1987, 41-70).
M. CAMPBELL (An integrated system for estimating the risk premium of individual car models in motor insurance, A S T I N Bulletin, 16, 1986, 165-183).
J E A N - F R A N C O I S INGENBLEEK
Universitd Libre de Bruxelles, Boulevard du Triomphe 50, C.P. 210, B-I050 Bruxelles, Belgique.
J E A N L E M A I R E
Wharton School, University o f Pennsylvania, 3641 Locust Walk, Philadelphia, PA 19104, U.S.A.
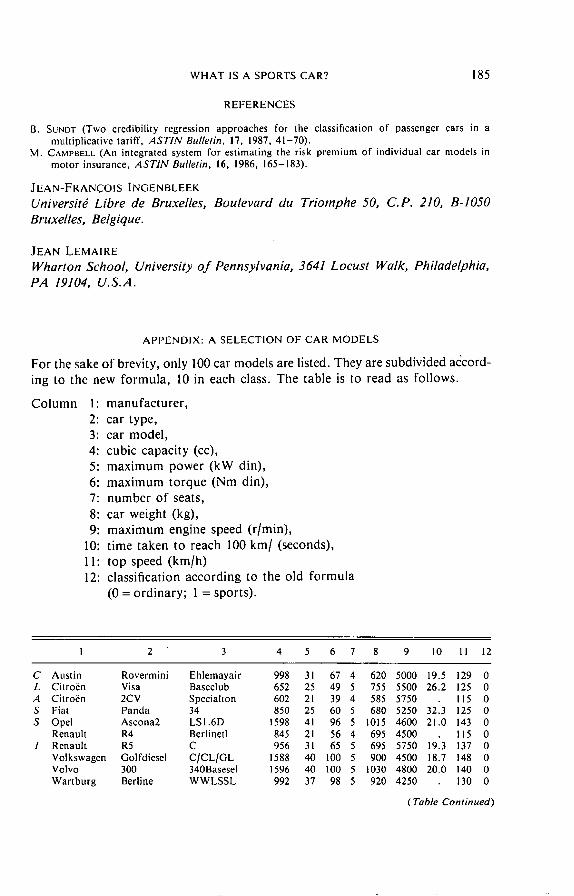
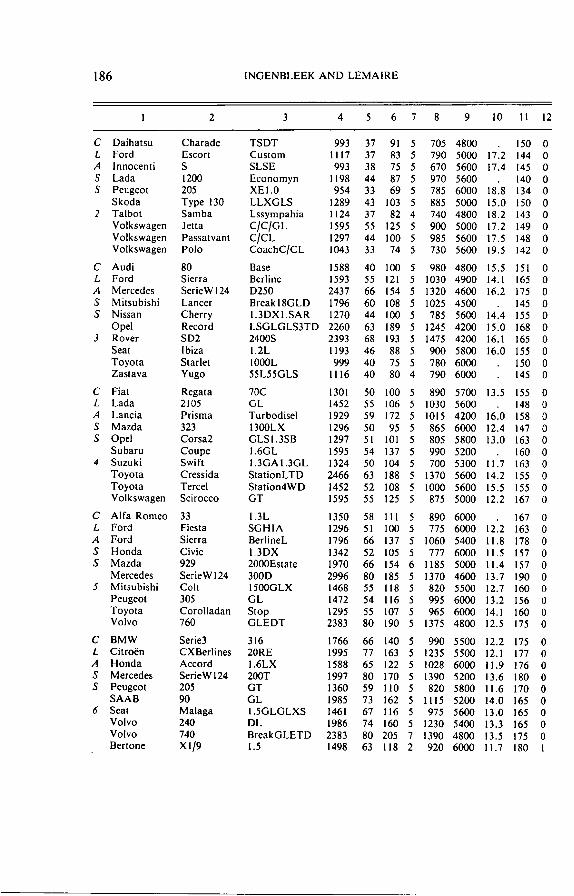
APPENDIX: A SELECTION OF CAR MODELS
For the sake of brevity, only 100 car models are listed. They are subdivided a6cord- ing to the new formula, 10 in each class. The table is to read as follows.
Column 1: manufacturer, 2: car type, 3: car model, 4: cubic capacity (cc), 5: maximum power (kW din), 6: maximum torque (Nm din), 7: number of seats, 8: car weight (kg), 9: maximum engine speed (r/min),
10: time taken to reach 100 km/ (seconds), 11: top speed (km/h) 12: classification according to the old formula
(0 = ordinary; 1 = sports).
I 2 3 4 5 6 7 8 9 10 11 12
C Austin Rovermini Ehlemayair 998 31 67 4 620 5000 19.5 129 0 L CitroEn Visa Baseclub 652 25 49 5 755 5500 26.2 125 0 A Citroen 2CV Speciahon 602 21 39 4 585 5750 115 0 S Fiat Panda 34 850 25 60 5 680 5250 3213 125 0 S Opel Ascona2 LSI.6D 1598 41 96 5 1015 4600 21.0 143 0
Renault R4 Berlinetl 845 21 56 4 695 4500 115 0 / Renault R5 C 956 31 65 5 695 5750 1913 137 0
Volkswagen Golfdiesel C /CL/GL 1588 40 100 5 900 4500 18.7 148 0 Volvo 300 340Basesel 1596 40 100 5 1030 4800 20.0 140 0 Wartburg Berline WWLSSL 992 37 98 5 920 4250 130 0
( Table Continued
186 INGENBLEEK AND LEMAIRE
I 2 3 4 5 6 7 8 9 10 II 12
C Daihatsu Charade L Ford Escort A Innocenti S S Lada 1200 S Peugeot 205
Skoda Type 130 2 Talbot Samba
Volkswagen Jetta Volkswagen Passatvant Volkswagen Polo
C Audi 80 L Ford Sierra A Mercedes SerieW124 S Mitsubishi Lancer S Nissan Cherry
Opel Record 3 Rover SD2
Seat Ibiza Toyota Starlet Zastava Yugo
C Fiat Regata L Lada 2105 A Lancia Prisma S Mazda 323 S Opel Corsa2
Subaru Coupe 4 Suzuki Swift
Toyota Cressida Toyota Tercel Volkswagen Scirocco
C Alfa Romeo 33 L Ford Fiesta ,4 Ford Sierra S Honda Civic S Mazda 929
Mercedes SerieW 124 5 Mitsubishi Colt
Peugeot 305 Toyota Corolladan Volvo 760
C BMW Serie3 L Citro6n CXBerlines A Honda Accord S Mercedes SerieW124 S Peugeot 205
SAAB 90 6 Seat Malaga
Volvo 240 Volvo 740 Bertone X 119
TSDT Custom SLSE Economyn XE1.0 LLXGLS Lssympahia C/C/GL C/CL CoachC/CL
Base Berline D250 Breakl8GLD 1.3DXI.SAR
993 37 91 5 705 4800 150 0 1117 37 83 5 790 5000 17.2 144 0 993 38 75 5 670 5600 17 .4 145 0
1198 44 87 5 970 5600 140 0 954 33 69 5 785 6000 18.8 134 0
1289 43 103 5 885 5000 15.0 150 0 1124 37 82 4 740 4800 18.2 143 0 1595 55 125 5 900 5000 17.2 149 0 1297 44 100 5 985 5600 17.5 148 0 1043 33 74 5 730 5600 19.5 142 0
1588 40 100 5 980 4800 15.5 151 0 1593 55 121 5 1030 4900 14.1 165 0 2437 66 154 5 1320 4600 16.2 175 0 1796 60 108 5 1025 4500 145 0 1270 44 100 5 785 5600 14.4 155 0
LSGLGLS3TD 2260 63 189 5 1245 4200 15.0 168 0 2400S 1.2L 1000L 55L55GLS
70C GL Turbodisel 1300LX GLS1.3SB 1.6GL 1.3GAI.3GL StationLTD Station4WD GT
1.3L SGHIA BerlineL 1.3DX 2000Estate 300D 1500GLX GL Stop GLEDT
316 20RE 1.6LX 200T GT GL 1.5GLGLXS DL BreakGLETD 1.5
2393 68 193 5 1475 4200 16.1 165 0 1193 46 88 5 900 5800 16.0 155 0 999 40 75 5 780 6000 150 0
1116 40 80 4 790 6000 145 0
1301 50 100 5 890 5700 13.5 155 0 1452 55 106 5 1030 5600 148 0 1929 59 172 5 1015 4200 16.0 158 0 1296 50 95 5 865 6000 12 .4 147 0 1297 51 101 5 805 5800 13.0 163 0 1595 54 137 5 990 5200 160 0 1324 50 104 5 700 5300 11.7 163 0 2466 63 188 5 1370 5600 14.2 155 0 1452 52 108 5 1000 5600 15.5 155 0 1595 55 125 5 875 5000 12.2 167 0
1350 58 111 5 890 6000 . 167 0 1296 51 100 5 775 6000 12.2 163 0 1796 66 137 5 1060 5400 11.8 178 0 1342 52 105 5 777 6000 11.5 157 0 1970 66 154 6 1185 5000 11.4 157 0 2996 80 185 5 1370 4600 13.7 190 0 1468 55 118 5 820 5500 12 .7 160 0 1472 54 116 5 995 6000 13.2 156 0 1295 55 107 5 965 6000 14.1 160 0 2383 80 190 5 1375 4800 12.5 175 0
1766 66 140 5 990 5500 12.2 175 0 1995 77 163 5 1235 5500 12.1 177 0 1588 65 122 5 1028 6000 i l .9 176 0 1997 80 170 5 1390 5200 13.6 180 0 1360 59 I10 5 820 5800 11.6 170 0 1985 73 162 5 1115 5200 14.0 165 0 1461 67 116 5 975 5600 13.0 165 0 1986 74 160 5 1230 5400 13 .3 165 0 2383 80 205 7 1390 4800 13.5 175 0 1498 63 118 2 920 6000 11.7 180 I

WHAT IS A SPORTS CAR? 187
I 2 3 4 5 6 7 8 9 10 II 12
C Audi 100 Base L BMW Serie5 5181 A Mercedes SerieW201 190 S Opel Manta GSI S Renault R25 GTX
Saab 900 GLI 7 Volkswagen Passatvant GT
Ford Fiesta X R2 Lancia YI0 Turbo Volkswagen Sicrocco GT-GTX
C Alfa Romeo 75 1.8 L Jaguar Serie3 XI63.4 A Mercedes SerieW124 230E S Mercedes SerieW201 190E S Peugeot 505Berlines GTI
Volvo 740 BreakGLE 8 Citro6n Visa GTI
Fiat Ritmo 105TC Fiat Uno Turbo Peugeot 205 GTi
C Bitter SC Coupe L BMW Serie7 7281 A Citroi/n CXBerlines 25GTITurbo S Volvo 760 Gleautoque S Morgan Plus8 2.0LCarbu
Porsche 924 S 9 Porsche 944 B
Renault Alpine V6 TVR 2 8 0 1 Convertible Volkswagen Golfbernes GTII6V
C Maserati Quattro Porte L BMW Serie5 5281 A De Tomaso Longchamps S Ferrari 328GTD 3186 S Jaguar Serie3 XJSVI2Cupe
Lamborghini Countachs Quattroole I0 Lotus Esprit $3
Mercedes Classe 560SEI_. Porsche 91 ICarrera Turbo Renault Alpine V6Turbo
1994 85 170 5 1250 5200 10 .7 190 0 1766 77 145 5 1140 5800 12.6 175 0 1997 77 170 5 1080 5500 12.4 185 0 1979 81 162 5 1065 5400 10.0 192 0 2165 90 181 5 1285 5250 10.3 195 0 1985 87 167 5 1140 5250 12.0 175 0 1994 85 165 5 1105 5400 10.8 182 0 1597 71 132 5 850 6000 9.9 180 I 1049 62 123 5 790 5750 9.6 180 1 1781 82 153 5 920 5200 9.1 191 I
1779 88 167 5 1060 5300 9.5 190 0 3442 129 255 5 1770 5250 9.8 188 0 2299 100 205 5 1280 5100 10.4 203 0 1997 90 178 5 II00 5100 10 .5 195 0 2165 90 189 5 1280 5750 10.0 183 0 2316 96 190 5 1360 5400 10.5 182 0 1580 76 134 5 870 6250 9.1 188 I 1585 77 133 5 905 6100 9.5 180 I 1301 77 147 5 845 5750 8.3 200 1 1580 76 132 5 855 6250 9.5 190 I
2968 132 248 4 1560 5800 9.6 215 0 2788 135 240 5 1510 5800 9.5 201 0 2500 122 290 5 1385 5000 8.0 220 0 2849 115 235 5 1305 5700 10 .5 185 0 3528 116 267 2 940 5250 200 2479 110 195 4 1190 5800 8.5 215 2479 116 205 4 1210 5800 8.4 220 2849 118 221 4 1140 5750 8.0 235 2792 110 221 2 1130 5700 7.8 214 1781 102 168 5 960 6100 8.5 208
4930 205 392 5 1940 5600 230 2788 135 240 5 1300 5800 8.4 215 5763 206 441 5 1700 5600 7.0 240 3186 199 304 2 1375 7000 260 5345 217 432 4 1755 5500 7.6 241 4754 335 500 2 1490 7000 4.8 298 2174 115 217 2 1100 6500 7.2 222 5547 220 455 5 1810 5000 7.2 245 3299 211 430 4 1335 5500 5.4 260 2458 147 285 4 1210 5750 7.0 250