``I think you should be more explicit here in step two...''
22
``I think you should be more explicit here in step two...''
-
Upload
rosamund-page -
Category
Documents
-
view
214 -
download
1
Transcript of ``I think you should be more explicit here in step two...''

``I think you should be more explicit here in step two...''

INTRODUCTION TO RESEARCH DESIGN
Stephen Gorard
http://www.tlrp.org/capacity/rcbn.html
http://trials-pp.co.uk
http://streamingportal.multistream.co.uk/ngflcymru/eng_webstream_pres02.htm

The argument for research design
A key ethical concern for those funding, conducting or using publicly-funded social science research must be the quality of the research, and the security of the conclusions drawn
This approach to research ethics calls for appropriate scepticism to be used more widely – the warranting principle
Traditional research methods training and ‘experts’ are not enhancing quality in this warranting way.
Working towards an ideal design can be an important part of any research enterprise, even where that design is not possible
It is helpful to consider the research enterprise as a cycle of complementary phases and activities, because this illustrates how all methods can have an appropriate place in the full cycle of research

Interviews involved 15 parents of primary school children (p.85).
‘a majority of the working-class parents concurred with their child… a significant deviation from this class trend was mothers of mainly black working-class boys’ (p.90).
Reay, D. and Lucey, H. (2000) Children, school choice and social differences, Educational Studies, 26, 1, 83-100
Interviews involved 15 parents of primary school children (p.85).
‘a majority of the working-class parents concurred with their child… a significant deviation from this class trend was mothers of mainly black working-class boys’ (p.90).
Class? working-class and at least one otherSex of parent? male/femaleEthnicity? black and at least one otherSex of child? male/female
If we assume equal distribution of categories….
‘majority of the working-class parents’ could be 4 cases,
‘mothers of mainly black working-class boys’ could not even be one case.
Reay, D. and Lucey, H. (2000) Children, school choice and social differences, Educational Studies, 26, 1, 83-100

‘According to the LSE, the extra places made available by the expansion of universities in the Eighties and Nineties have largely been filled by students from better-off backgrounds’ (http://www.suttontrust.com/press068.asp).
'The comprehensive system was brought in to try to improve social mobility, but the opposite has happened' Sir Peter Lampl (http://www.suttontrust.com/press068.asp).
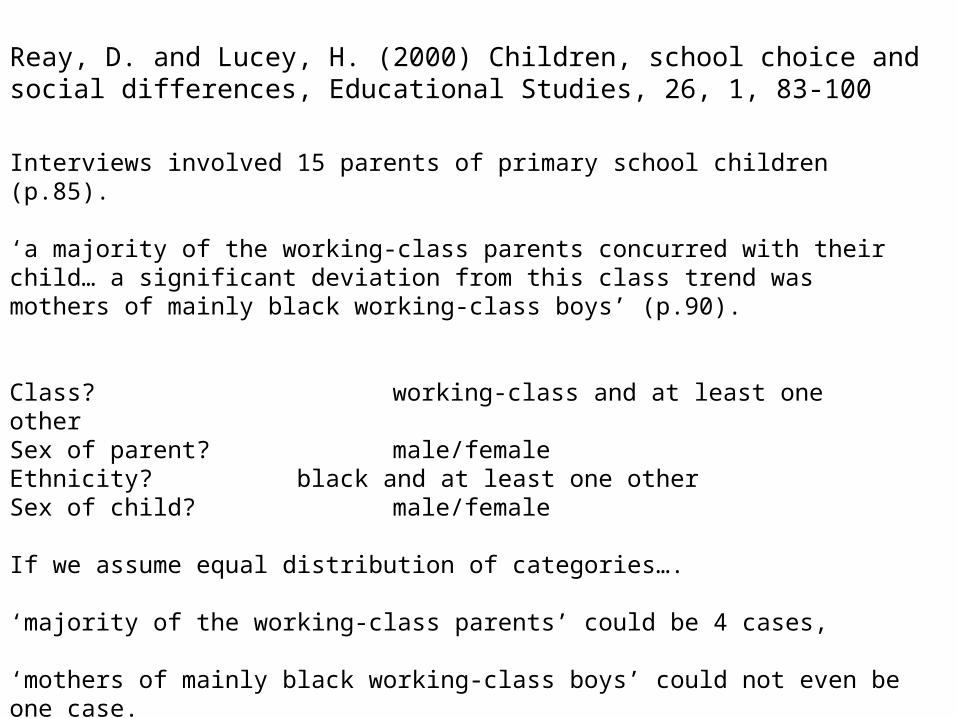
International comparisons indicate that intergenerational mobility in Britain is of the same order of magnitude as in the US, but that these countries are substantially less mobile than Canada and the Nordic countries.
Intergenerational mobility fell markedly over time in Britain, with there being less mobility for a cohort of people born in 1970 compared to a cohort born in 1958.
Source: Blanden, Machin and Gregg (2005) Intergenerational mobility in Europe and North America, London: Centre for Economic Performance, p.2
Internationally comparable estimates of intergenerational mobility
Country Sons born
Sons earning measure
Measure of parental status
Partial correlation
Britain 1970 Age 30 Average parental 1980+1986
.271
Norway 1958 Average 1992+1999
Father 1974
.139
Denmark 1958-1960 Average 1998+2000
Father 1980
.143
Sweden 1962 Average 1996+1999
Father 1975
.143
Finland 1958-1960 Average 1995+2000
Father 1975
.147
Source: Blanden, Machin and Gregg (2005) Intergenerational mobility in Europe and North America, London: Centre for Economic Performance, p.6
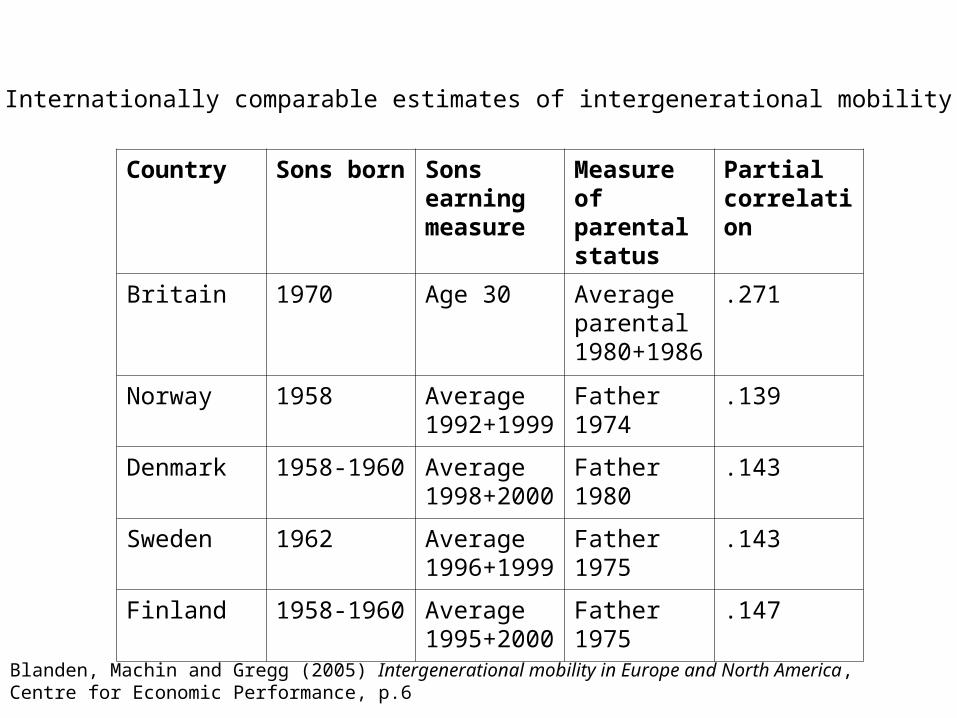
Table 3: Transition Matrix for Britain, Sons Born in 1958Sons’ earnings quartile aged 33 in 1991Bottom 2nd 3rd Top
Bottom parent quartile (when son aged 16) .31 .28 .23 .17
Source: Blanden, Machin and Gregg (2005) Intergenerational mobility in Europe and North America, London: Centre for Economic Performance, p.8
Table 4: Transition Matrix for Britain, Sons Born in 1970 Sons’ earnings quartile aged 30 in 2000Bottom 2nd 3rd Top
Bottom parent quartile (when son aged 16) .38 .25 .21 .16

The format of a warrant as a syllogism
Observation/Data: This is an A
Conclusion: Therefore, this is B

The format of a warrant as a syllogism
Explicit Warrant: All As are B
Observation/Data: This is an A
Conclusion: Therefore, this is B

An effect of education?
p.238 – ‘The data are based on the entire population of schools… Consequently, the results can be considered as representative of the whole population of pupils who take both KS3 and GCSE exams’.
Multi-level model of the effect of single-sex teaching.
p.246 – ‘The effect of school type is highly significant’
Malacova, E. (2007) Effects of single-sex education on progress in GCSE, Oxford Review of Education, 33, 2, 233-259

Contradictory trends
Between 1994 and 2004, reports of studies using a researcher manipulated intervention declined from 45% to 33% in the US.
But causal statements in non-intervention studies grew from 34% to 43%. In particular, complex statistical approaches such as HLM (MLM) and structural
equation modelling were routinely misunderstood by researchers as testing causation.
Robinson, D., Levin, J., Thomas, G., Pituch, K. and Vaughn, S. (2007) The incidence of ‘causal’ statements in teaching-and-learning research journals, American Educational Research Journal, 44, 2, 400-413
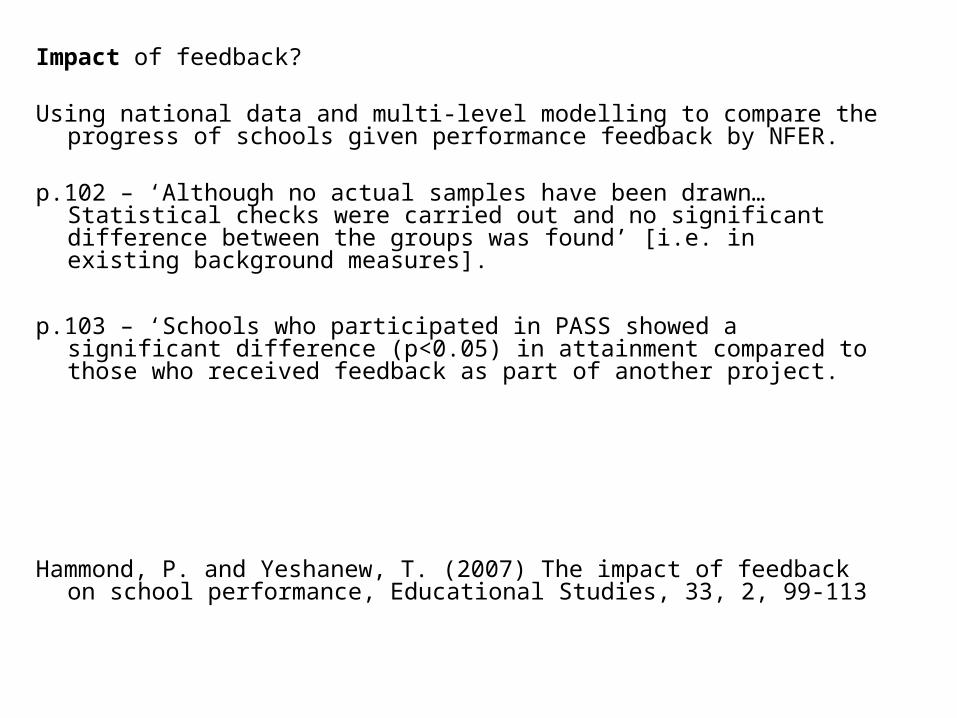
Impact of feedback?
Using national data and multi-level modelling to compare the progress of schools given performance feedback by NFER.
p.102 – ‘Although no actual samples have been drawn… Statistical checks were carried out and no significant difference between the groups was found’ [i.e. in existing background measures].
p.103 – ‘Schools who participated in PASS showed a significant difference (p<0.05) in attainment compared to those who received feedback as part of another project.
Hammond, P. and Yeshanew, T. (2007) The impact of feedback on school performance, Educational Studies, 33, 2, 99-113

A school effect?
Looks at successive years of positive value-added scores in one England district, 1993-2002.
An improving school is one where VA increases in successive years
p.271- ‘the pupil intake and time trend explanatory variables included in the fixed part of the value-added model (Model A) were statistically significant (at 0.05 level)’.
p.261 – ‘it appears that only one in 16 schools managed to improve continuously for more than four years at some point over the decade in terms of value-added’.
Thomas, S., Peng, WJ. And Gray, J. (2007) Modelling patterns of improvement over time: value-added trends in English secondary school performance across ten cohorts, Oxford Review of Education, 33, 3, 261-295

Result of academisation?
DfES - We expect that all Academies will make steady upward progress… Good teaching, excellent facilities and motivated pupils will deliver real improvements in educational standards.
BBC - The government has released GCSE figures from three of its new flagship Academies in England. All the schools, which were set up in deprived areas, showed remarkable improvements in results.
Bexley Business Academy
1997 1998 1999 2000 2001 2002 2003
Percentage eligible for FSM
53 49 52 50 49 46 42
GCSE points per candidate
- 23 20 20 22 23

Back to the Department for Children, Schools and FamiliesLA : Nottingham, City of Greenwood Dale School Sneinton Boulevard Nottingham Nottinghamshire NG2 4GL 0115 9103200 MIXED
Key Stage 2 to 4 Contextual Value Added MeasureKey Stage 2 to 4 contextual value added measure 1068.6Upper limit of CVA confidence interval 1077.2Lower limit of CVA confidence interval 1059.9Coverage indicator - % of students included in Key Stage 2 to 4 CVA 93%
Achievement and attainment tables

Sources of errors in CVA
Missing data - examplesover 15% of KS4 PLASC missing one of FSM, sex, ethnicityover 5% of KS4 NPD have no equivalent for KS2over 10% of PLASC records unmatched in NPD
Incorrect data – examplescoding (neither male nor female)entry/transcriptionstorage (dropout)storage (binary conversion)
Measurement error – examplesIDACI and the ecological fallacyValidity of assessment, marking and moderationDefinitions such as SEN, ethnicity, or first language

Propagation of errors in CVA
Imagine a pupil with a predicted KS4 of 100 and an actual score of 110
Imagine that all scores are only 90% correct – a conservative view
The predicted score really lies between 90 and 110The actual score really lies between 99 and 121
CVA calculates a residual of +10The real residual is between -11 and +31
We do not even know if the pupil has done better or worse than expected

The link between KS2 points and GCSE benchmark, secondary schools in England, 2004Correlation of +0.87
0
10
20
30
40
50
60
70
80
90
100
20 22 24 26 28 30 32 34
KS points
GC
SE
be
nc
hm
ark
Source: Gorard, S. (2006) Value-added is of little value, Journal of Educational Policy, 21, 2, 233-241
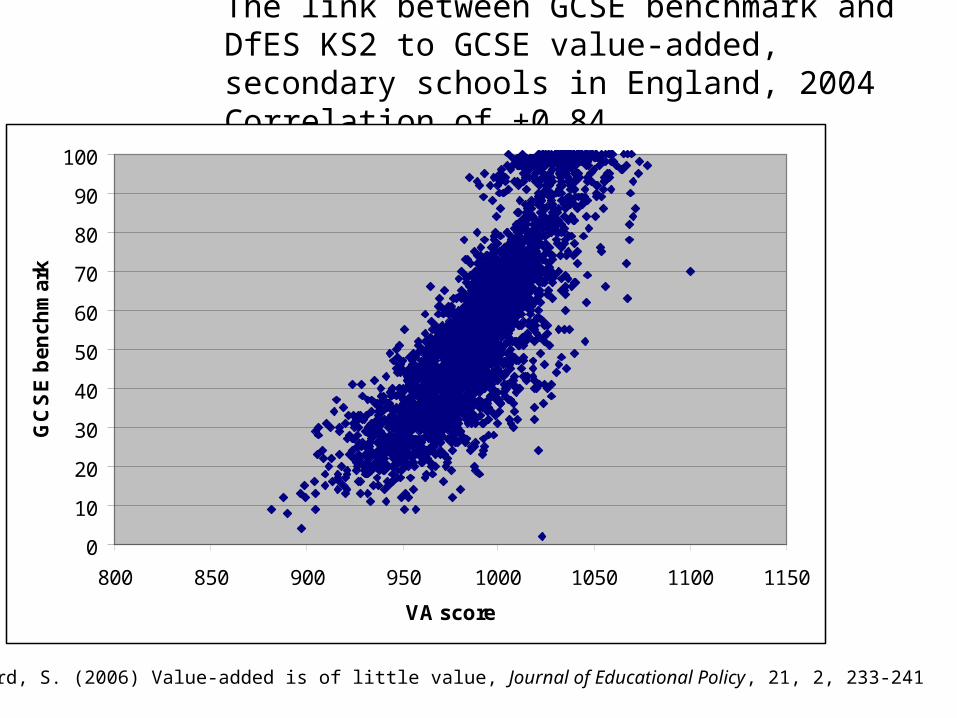
The link between GCSE benchmark and DfES KS2 to GCSE value-added, secondary schools in England, 2004Correlation of +0.84
0
10
20
30
40
50
60
70
80
90
100
800 850 900 950 1000 1050 1100 1150
VA score
GC
SE
be
nc
hm
ark
Source: Gorard, S. (2006) Value-added is of little value, Journal of Educational Policy, 21, 2, 233-241

Guess what?
Secondary data analysisFeminist theory and approachesThe role of theoryEthnogaphyWorking overseasAdult learningDiscourse analysis………….
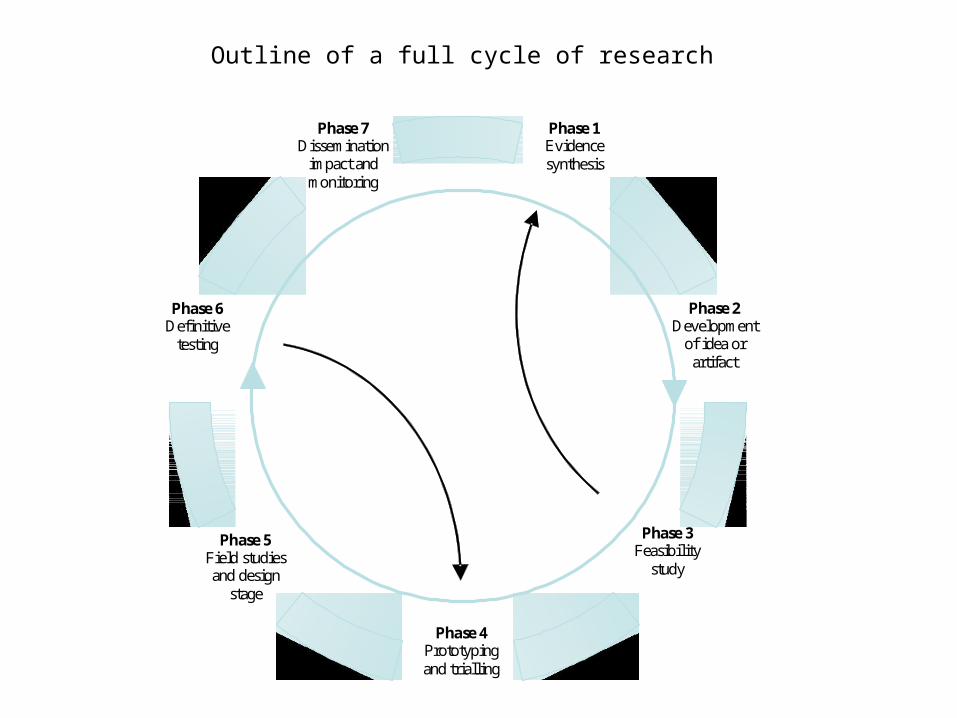
Phase 4 Prototyping and trialling
Phase 1 Evidence synthesis
Phase 6 Definitive
testing
Phase 7 Dissemination
impact and monitoring
Phase 2 Development
of idea or artifact
Phase 3 Feasibility
study
Phase 5 Field studies and design
stage
Outline of a full cycle of research