Rueckert-Hartman College for Health Professions Division ...
Upload
truongmienCategory
view
216download
0
I
. I
1 '~ I
/
N(ltional Criminal Justice Reference Service
This microfiche was produced from documents received for inclusion in the NCJRS data base, Since NCJRS cannot exercise control over the physical condition of the documents submitted, the individual frame quality will vary, The resolution chart on this frame may be used to evaluate the document quality.
1.0
11.1
:: 111112,8 111112,5
:: I~II~ I 2.2 ~ I~ w :i ~ L:. ~ I;I.lUou.
111111.25 III11 1.4 .~
"
MICROCOPY RESOLUTION TEST CHART NATIONAL BUREAU OF STANDARDS·1963·A
Microfilming procedures used to create this fiche comply with the standards set forth in 41CFR 101-11.504.
Points of view or opinions stated in this document are those of the author(s) and do not represent the official position or policies of the U. S. Department of Justice.
National Institute of Justice United States D,epartment ofJusticte Washington, D~ C. 20531
".'-1/' I,.
,i"""
"
\
'.
II,
.§,.
I'
" /~'
" .. ~.:'';' .. ;.. .
"
'.
. ~ ...• : . -- \
I
/'
I
This project wa~ sUpported by Grant Number N
_~I~70c-Ol:!f2:.29 __ awarded by the Law En~
Iorcement Assistance Adm' ~ t- . D J.n .... s ratJ.on U. S.
epartment of' Justice • d . , , . ,un e~ the Omnibus Crime C~ntro1 and
Streets Act of' 1968 ~ 'I' f. • Saf'e , ., a.S amended. Points
~', ~ of' view or opinions
"
stated in this dQ(;L:ment are those ., i'
" .' - ... _ . _ ,of the author~'.~~q., do not necessarJ.1y represent th " • ,.. .- . -.. - - .
e offJ.cJ.a1 position , or policies of' ~he U.S. Department of' Justice.
,. :~. !
,j','.'
. 'fJ
,
.... . ...
~
"
.. ,',
,/ .' ,/
. .... ....
i --
._ ...... _--- ~
.~ . .. '
",' ".
, .. -- - ,_ .. - _._.,
I
·f . . , i ,
;
l ; r
J f
j'i:
1. . , I
If you have issues viewing or accessing this file contact us at NCJRS.gov.
;'
\ I)
r I.
II ~i \
t i,
. , '
.. , .'
/
• y
" .~
."

... ;~
~------~~~~--------------------------.---
The Prevention and Control of Robbery Volume Three
THE GEOGRAPHY OF ROBBERY
By
Susan wilcox
U.S. Department of Justice National Institute of Justice
This document has been reproduced exactly as received from the person or organization originating it. Points of view or opinions stated in this document are those of the authors and do not necessarily represent the official position or policies of the National Institute of Justice.
Permission to reproduce this 4I9p1'J;iQhleQ material has been granted by
Public Domain / LEAA
to the National Criminal Justice Reference Service (NCJRS),
Further reproduction outside of the NCJRS system requires permissi!)n of the~t owner.
April 1973,
The Center on Administration of Criminal Justice
Un,iversity of California, Davis
Co-Directors
Edward L. Barrett, Jr. ueD School of Law
Lloyd D. Musolf Institute of Governmental Affai·rs
"
"
'~.
,~,
\,Ii
()
THE GEOGRAPHY OF ROBBERY
Table of Contents
Chapter
One: The Study .••••••••••••..••••••••••••••••••.•••••.•.. 5 Two: Robbery In The City ..•••••••••••••••••.••••••••••..• 10 Three: Commercial RObbery.................................. 27 Four: Individual RObbery ••.••.•••••••••••••.•••.•.••••••.•• 40 Five: A Comparison With Some Earlier Research ••• : •.••••... 72 Six: Some Problems of Spatial Analysis ••••••••••.•.••.••. 95
Footnote s •••.••••••• • •••••••••••••.••••.•.•••••••.•.• 107
The Prevention and Control of Robbery
.t Volume One: The Robbery Setting, The Actors and Some Issues
Volume Two:
Volume Three:
Volume Four:
Volume Five:
The Handling of Robbery Arrestees: of Fact and Policy
The Geography of Robbe~y
Some Issues
The Response of the Police and Other Agencies to Robbery
The History and Goncept of Robbery
This study was made possible by grants from the National Institute
of Law Enforcement and Criminal Justice (NI-70-02,9) and from the
Ford Foundation. The findings and conclusions are, however, solely
those of the authors and not necessarily those Q,f the Department of
Justice or the Foundation.
-2-
'~:,:'" ~"~--;::'-"--"~~.f'~"'''"'''''. Z"",. """"'---...-":""'"'--,--,----...,...~-----_"'_"",.,.""'_.,..,t I,. _____ ...,...,...--,~ _______ ~~_.,.........,_
/~.' '. ()
/
.' .
Study Directors:
Geography Study:
History and Co?cept Study:
Police Response Study:
Field Superv'isors:
Research Assistants:
Marie Aindrus Steve Baker Lee Bardellini Susan Bardellini Roosevelt Baines Bill Bisset Mary Boehm Larry Bolton Phil Bourdette Ann Buchbinder Elizabeth Cabrall Alan Carlson Shirley cartwright Jan Charlup
. Lynn Cooper Richard coughlin Bruce Degraaf
. Bill Dubois
Consultants:
James Cherry Michael Matchett
Support Staff:
Lainda" Boosembark Carol Crayne
, General Consultants:
Ronald Beattie
Ii . ,- "'. .. ... ' ~
"~ ..
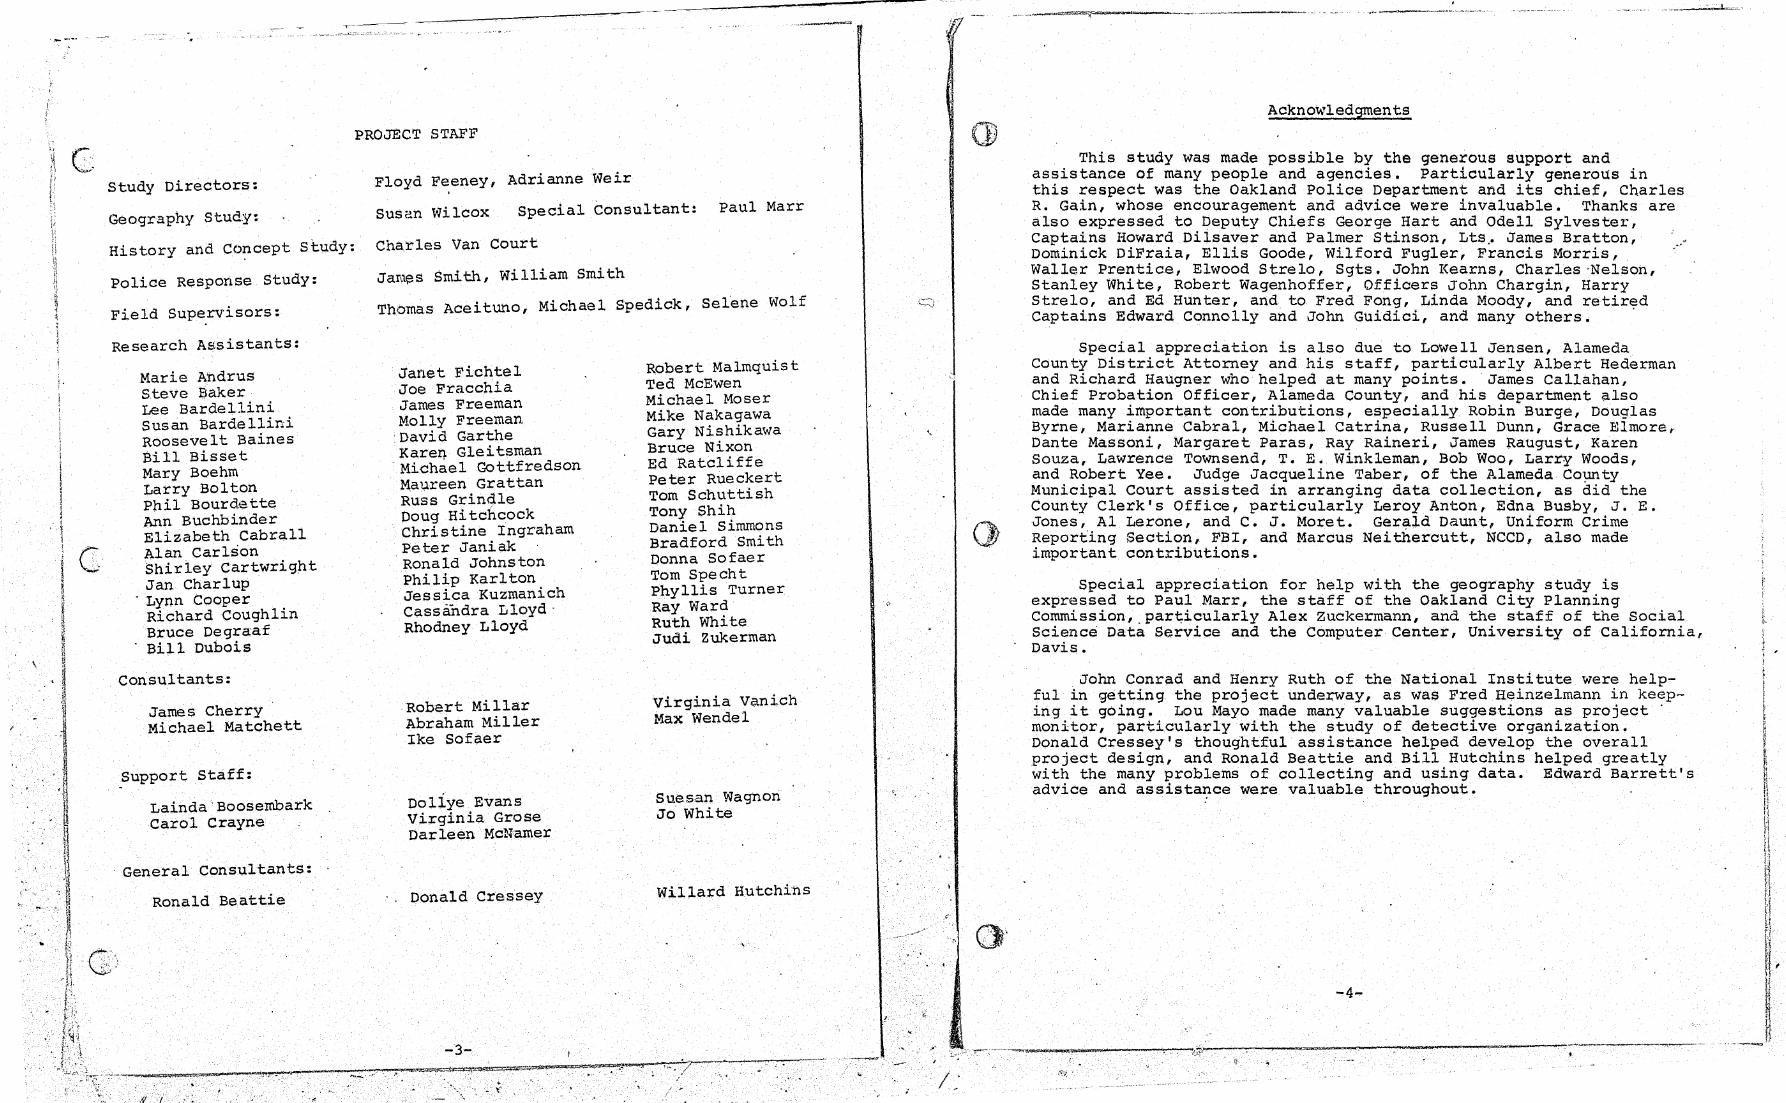
PROJECT STAFF
Floyd Feeney, Adrianne Weir
Sus,:!U Wilcox Special Consultant: Paul Marr
Charles Van Court
Jarl:1.\'3s Smith, William Smith
Thomas Acei tuno, Michael Spedick, Selene Wolf
Janet E'ichtel Joe Fracchia James Freeman Molly Freeman. David Garthe Karen Gleitsman Michael Gottfredson M,aureen Grattan Russ Grinq.le Doug Hitchcock Christine Ingraham Peter Janiak Ronald Johnston Philip Karlton Jessica Kuzmanich Cassandra Lloyd· Rhodney Lloyd
Robert Millar Abraham Miller Ike Sofaer
Dollye Evans Virginia Grose Darleen McNamer
Donald Cre.Esey
-3-
. .........
'.
Robert Malmquis t Ted McEwen Michael Moser Mike Nakagawa Gary Nishikawa Bruce Nixon Ed Ratcliffe Peter Rueckert Tom Schuttish Tony Shih Daniel simmons Bradford Smith Donna Sofaer Tom Specht Phyllis Turner Ray Ward Ruth White Judi Zukerman
Virginia Vanich Max Wendel
Suesan Wagnon Jo White
Willard HutchihS
/'
-
,',
.~ c·
Ackno\<,rledgrnen ts
, This study was made possible by the generous support and as~~stance of many people and agencies. Particularly generous in th~s respect was the Oakland Police Department and its chief Charles R. Gain, whose encouragement and advice were invaluable. Th~nks are also ~xpr:ssed tO,Deputy Chiefs George Hart and Odell Sylvester, Captal.ns doward D~lsaver and Palmer Stinson, Lts. James Bratton Dominick DiFraia, Ellis Goode, Wilford Fugler, Francis Morris ' Waller Prentic.e, Elwood S tre 10 , Sgts. John Kearns, Charles 'Nelson Stanley White, Robert Wagenhoffer, Officers John Chargin, Harry , strel~, and Ed Hunter, and to Fred Fong, Linda Moody, and retired Capta~ns Edward Connolly and John Guidici, and many others. .
Special appreciation is also due to Lowell Jensen, Alameda Count~ District Attorney and his staff, particularly Albert Hederman and R~chard Haugner who helped at many points. James Callahan Chief Prob~tion Officer, ~lam~da County, and his department al~o made many 7mportant contr7but~ons, especially Robin Burge, Douglas Byrne, Mar~anne Cabral, M~chael Catrina, Russell Dunn Grace Elmore Dante Massoni, Margaret Paras, Ray Raineri, James Rau;ust, Karen ' Souza, Lawrence Townsend, T. E. Winkleman, Bob Woo, Larry Woods, and Robert Yee. Judge Jacqueline Taber, of the Alameda County Municipal Court assisted in arranging data collection as did the County Clerk's Office, particularly Leroy Anton, Edna'Busby, J. E. Jones'.,Al Ler0t;e, and C. J. Moret. Ger~ld Daunt, Uniform Crime Report~ng Sect~on, FBI, and Marcus Neithercutt, NCCD also made importan t contributions. I
Special appreciation for help with the geography study is expr7ss~d to Pau~ Marr, the staff of the Oakland City Planning comm~ss~on,.par~~cularly Alex Zuckermann, and the staff of the Social Science Data Service and the Computer Center, University of California Davis. '
,John C~nrad and H~nry Ruth of the National Institute were help~ul 7n ge~t~ng the proJect underway, as was Fred Heinzelmann in keep~ng,~t go~ng., Lou Mayo,made many valuable suggestions as project' mon~tor, part~cularly w~th the study of detective organization. Don~ld cres~ey's thoughtful assistance helped develop the overall p:oJect des~gn, and Ronald Beattie and Bill Hutchins helped greatly w~th the many problems of collecting and using data. Edward Barrett's advice and assistance were valuable throughout.
-4-
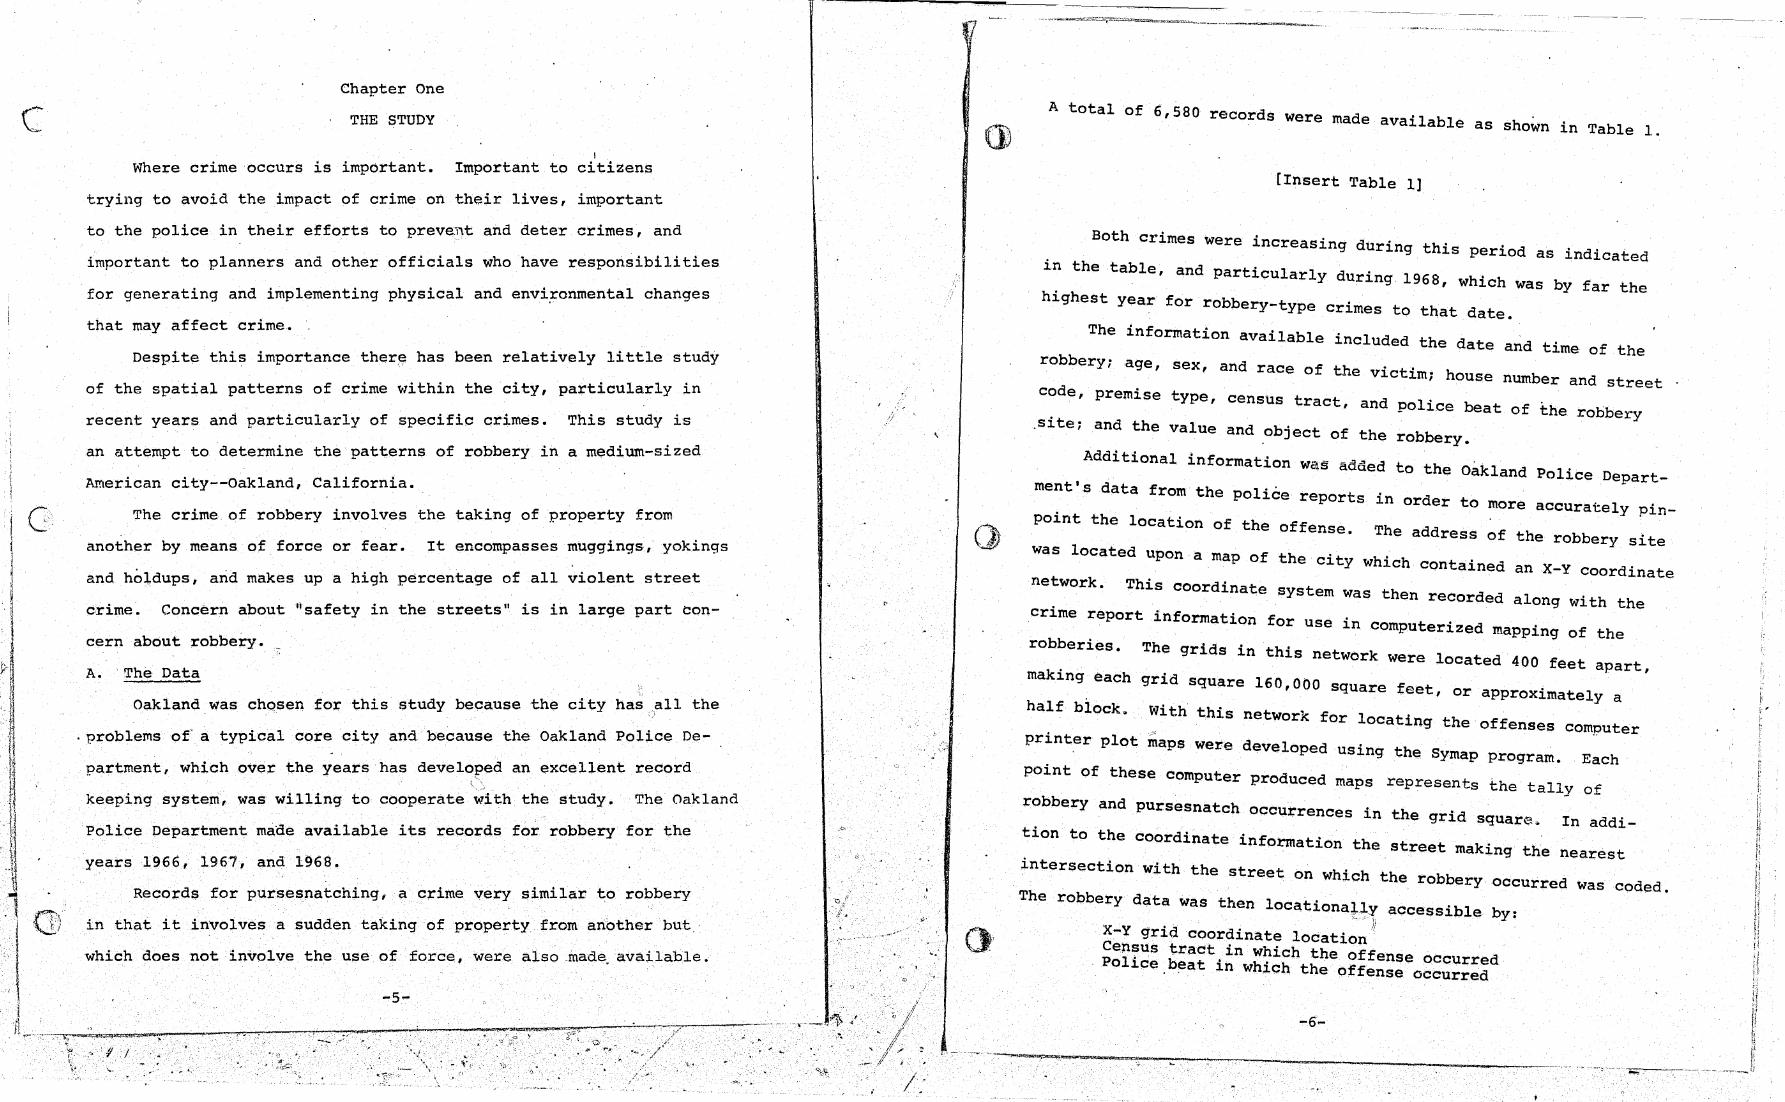
c Chapter One
THE STUDY
I
Where crime occurs is important. Important to citizens
trying to avoid the impact of crime on their lives, important
to the police in their efforts to preve~11t and deter crimes, and
important to planners and other officials who have responsibilities
for generating and implementing physical and environmental changes
that may affect crime.
Despite this importance there has been relatively little study
of the spatial patterns of crime within the city, particularly in
recent years and particularly of specific crimes. This study is
an attempt to determine the patterns of robbery in a medium-sized
An'lerican ci ty--Oakland, California.
The crime of robbery involves the taking of property from
another by means of force or fear. It encompasses mUggings, yokings
and holdups, and makes up a high percentage of all violent street
crime. Concern about Ii safety in the streets II is in large part con-
A. The Data
Oakland was chosen for this study because the city has <,all the
. problems of' a typical core city and. because the Oakland Police De-
t h ' h oV'er the years has developed an excellent record partmen I W 1C t,~<',':-
keeping system, was willing to cooperate with the study. The Oakland
Police Department made available its records for robbery for the
years 1966, 1967j and 1968.
Records for pursesnatching, a crime very similar to robbery
in that it involves a sudden taking of property from an.other but,'
which does not involve the use of force, were also ,made,available,
-5-
..
\
.' '1
/:
A total of 6,580 records were made available as shown in Table 1.
[Insert Table 1]
in Both crimes were increasing during this period as indicated
the table, and particularly during 1968, which was by far the
highest year for robbery-type crimes to that date.
The information available included the date and time of the
robbery; age, sex, and race of the vict1'm,. house number and street
code, premi se type, census tract, and po11' .ce beat of the robbery
.site; and the value and object of the robbery.
Addi tional information wc:~s added to the Oak' land Police Depart-
ment'.s data from the police reports in order to more accurately pin-
point the location of the offense. The address of the robbery site
was located upon a map of the city which conta1'ned
rletwork. an X-Y coordinate
This coordinate system was then recorded along with the crime report information for use '
1n computerized mapping of the rObberies. The g 'd ' th'
r1 s 1n 1S network were located 400 feet apart,
making each grid square 160,000 square feet, or approximately a
half bl' ock. W'th' th' 1 1S network for locating the f o fenses computer ;;
printer plot maps were developed using the Symap program. Each
point of these computer produced maps represents the tally of
robbery and pursesnatch occurrences 1'n th 'd ' e gr1 squarE~ ~ In addi-
tion to the coordinate information the street making the nearest
intersection with the street on which the robbery occurred was coded.
The robbery data was then locationaj.ly accessible by:
i'_ ; ,
X-y grid coordinate 10cation 1
Cen~us tract,in which the offense occurred Poll.ce,beat 1n which the offense occurred
-6-
.. .,... ..... ' .... ~--... --':"""'--::"":"""-:--~---------~--~-----

Robberies
1966
1967
1968
Total
...
,c---
T~b1e 1 .. ' , .
and Purse snatches - 1966-68
Robbery Pursesnatch
1052 268
1404 420
2733 703
5189 1391
(' , ,
'"'"!7-
Total
1320
1824
3436
6580
l
.'
'-:,'
.. ~ ~
.. , .. \~'""':.
"""""_-........ --.-:--.-'-r-:--~.-.-. _-.--,.",¥.-.-.----.,.......r.' " "_ ,:~ .. " . ~~.~.!it ..
. ',....,.~ .. - :\
..
..
,. ~ .
"/~
. . __ r~" __ '~'~>"_ ~,~c,,,,,,,_.·"· _____ -
Street on which the offense occurred street intersection nearest the offense
B. The City
Oakland is a city of 360,000 located on the mainland side of
the San Francisco Bay. It has all the characteri~tics of the core
of a much larger urban area. Encompassing about 54 square miles,
it is the second largest city of a metropolitan area of three million
people arid is situated in the middle part of a string of urban cities
along the eastern side of the Bay. Flanked by Berkeley on the north
and San Leandro on the south, Oakland, as shown in Map 1, is physi-
cally composed of two areas, a "flatland." area next to the Bay and
a "hill" area further inland. The waterfront is largely industrial;
further inland is a section of older houses, and beyond that there
is a rather undefined downtown, commercial core. Radiating out,
<=> from this downtown core area are a number of major arteries along
which there are long, thin commercial strips. Beyond these, the
hill area, largely residential, rises into the coast range which goes
up to nearly 2,000 feet. Oakland completely surrounds the small 1
city of Piedmont.
[Insert Map 1]
Using the point mapping method, there are approximately 9,200
grid squares o~'approximately a half block area each in the city of
Oakland. Approximately 3,000 of these areas are either water-covered
or are areas such as tide flats or high hills that are essentially
not in'the inhab.i'ted part of the city.
-8-

(/
/
, .
f 1-~. .
Map 1
San Francisco Bay Region
-9-
.-
"" ~l I.::;'
,1' ......
-----. -------------------~--.------------
,
"
0,: . ,
Chapter Irwo
ROBBERY IN THE CITY
The most significant spatial fact about robbery in Oakland
is that for most parts of the city robbery is a relatively rare event.
During the three-year study period, 1966-68, Oakland had one
of the highest robbery rates in the country and the number of rob
beries in the city had climbed to his'corical1y high levels. Despite
these high rates, however, Over 4,000 or more than two thirds, of
the approxima~ely 6,200 half block-sized areas of the city that
are neither watercovered, vacant or too hilly for occupation, had
no rObberies or purse snatches during the entire ·three-year period.
Only 2,059 of the areas had a robbery or pursesnatch during this
period, as shown in Table 2. And of this number 864 had only one
such event. Thus only 19 iC'ercent of the approximately 6,200 possible
grid squares contained more than one robbery or pursesnatch offense.
Overall more than 25 percent of the robberies and prusesnatches
occurred within less than four percent of the inhabited grid squares.
Even in these grid squares, however, robbery was not a daily or a
weekly event. Only one grid .square averaged as many as one offense
per month and few were even close.
[Insert Table 2 J
Nor were the areas which did have robberies during the study
period evenly distributed throughout the city.
--First, robbery is heavily concentrated in the flatlands,
and particularly near the Bay.
--SeCOhd,this concentration diminishes with increaSing dis-
tance from the Bay.
-10-

/
. t ,-;.
!
Table 2
Number of Grid Squares With Robberies and Pursesnatches 1966-1968
Number of Robberies and Pursesnatches Number of in Grid sguare Grid Squares
0 4141
1 864
2 427
3 234
4 135
5 91
6 66
7-8 94
9-10 50
11-20 78
21-50 19
Above 50 1 : \
Total 6200
*Less than .02 p.ercent.
Percent of All Occupied Grid Squares in the City
66.8
13.9
6.9
3.8
2.2
1.5
1.0
1.5
0.8
1.3
0.3
-*
100.0
-11-
Cumulative Percent All Grid Squares Excluding Those Wit;hout, a Robbery
13.9
20.8
'24.6
26.8
28.3
29.3
30.8
31.6
32.9
33.2
33.2
33.2
:--
"
" "
c.;
()
. ,
< ,
:lI: ),.( ....... T
--Third, even wi thin the general areas of concentrati~~rt in
the flatlands, there are large areas of little or no
robbery.
--Fourth, there is a heavy concentration along certain major
streets.
The robbery dist~ibution shown on Map 2 is the pattern for
the total sample of all robbery and pursesnatch offenses during
'the three-year period. Separate distributions for armed, and
strongarm robberies are shown on Maps 3 and 4. These distributions
are essentially the same as that for all robberies as a group: a
concentration in the flatlands with the concentration decreasing as
the distance from the Bay increases.
The distribution for pursesnatches, shown on Map 5, however,
differs from the total rQbbery distribution and differs strongly
from the armed and strongarm distributions.
[Insert Maps 2, 3, 4 & 5]
If all rObberies are broken down by sex of the victim and the
pursesnatches grouped together with the female armed and female
strongarm robberies, the reE?ulting distribution is similar to that
for the purse snatches alone and quite different from the distri
bution formed by gJ:;'ouping the male armed and male strongarm robber-
ies. The major, overriding difference between the two patterns is
the absence of female robbery victimization in two areas of high
robbery concentration in the northwestern portion of the city and
to the west of tl1e heart of 'the downtown. Both of these areas of
robber~' focus are a resul t of male victimization only. Female r'\ . .'
robberies are much 'more concentrated in the areas to the east of
-12-

"
/ , " '\
\ /'
'-
'-. , .
.'
1,
i !-
~~-~----------~--------------------------------------------
o u Map 2
Total Robbery - 1966-1968
r·;:·-.... lu ...... ::::: ....... J-. ••• _ ... _ ..... - ....................... r ........... -....... --... _.,_ ..... ,_.-.... _ ... , .......... ,_ ........ ).:::::-.... n .. _~ ............ __ ... _'._ .. _ .• ___ .....-_'_ .. _1_._'_._I·_·._··'_.·n.J __ I_~._._ ... _ .. .....- ,ro, -~-_-'-S~,....J~ I ,,::::::i ,... ..... "" .... __ .. "."" ...... " ..... -."._._"." .. " ... "." " .. "., ........ ".
I ...... Oakland Hills \ ....................... . I .... ! '~ ................. . I /(\ .. .. i '~ ..
'1' ~'<'-~A ......... , '<V~ ... :. ,.
I . .... . i /':,: ::: .': :B.rqadway I Berkeley./:: ;' .. ::' -:: .. ' . I '. ., . ".'. is'qq ). . .' " ...
~qz.: ....... : i -.; -l. ° ... ,.:....... .
I I ... .
.......................... .. . . . . . . . . . . . . . . . .. : Piedmont ....
............ ..., .•• .o.
. : .. . .. .... .
. .. .. . .. . .......
~I ' ............ " .. ~ .. ::'.:, ;:: i~\!: j~: ~~;~; ~:: : .... ",.' '1 :..... .. ".. : .. :, ~. .. ! "..:: :. ~ .. :: " .. ! ':: :: "". .: ~ ~ ~ .. ::." .. !: •• : .... Emeryville ........ ':." . .- :.,:: ,.: :::. .. '.: ::; :::.: .:. ;':'::" .. :.:. : ':;
•••• "0-.. .. .... 0"" ".. 110 ". "" ••• -10 .0_. .. •• 0 ... III
1" .. ,. .......... ::: :.:.: ::: :::~: ::: > -: ::, :: ~:: :::': ::: ,.- : ::: -.- > : ; ':.
: ••••• _ •• I •• at I -.. • - .. , ••••• _ I· ••
. ! : :.o ...... ~. :.' .'
... .: ............... . ............. ...... ................... ....
Oakland H il i;"-·_·······_" .. -."_"" ..... _",,_,,.... I
. '.
. .....
.. .... ,
I J ri :: I ,) ,.
................ I . '. ':;" :::: :" ~~-J.4 I
... , '.' . . : t.h 1
. . . " "''''''} San . -I' .' . ' .. 3"·1 Leandro
., ..... -- ......................... .
Ii ........ /., •. -1,1 ....... " .. " .. _ .. 1/ .....•........ ,,_...... . ... , ......... : ........ .
'1 / .. /: Army 'j ... :: ........... · .. · .... · .. san Francisco Bay :' :' Y:Base !
.:j I )........ i .:-.. :.-... :.~/ !
·l I : II .. ": i ..... ~ .... I : : : I
I .:... ........ ::: .... oJ re.s c .. o ..... t ... ;/ . ::=- •
7,- 9- 1 1- 2 1-
,. ~ L---... ---....· .. /Naval _.:............. r,- Scale Number of Robberie
I .. ,/ Supply _. 0"1"111"'& -~- "'''~. Grid Square . ". Cen te r -_....... . ...... , ........ _ .. _ ........ _.--..... _ . ...::::.., L .... ,_ .... _._.l~: .... _._ .. _.~r.:~:_ .. _.L._ ........... J,_ ..... ,~_._'_, ................ J., .. __ ...... _.l._._ .. _.,_~_ .. __ !_._, __ ... ~,._ ............ J ......... ~_ ..... l.. ___ ._._I_~ ___ .... ,
,~ 1 ... . l''''~-._~ __ '''''_ .... _,~ __ =-__ ......., __ ~~~~~~~~_w_~ ____ _ .: ..... ..::,. _,.f
-------"c;c' ," ,-- -;-_." . "
"~ .' "
.-
\
I, ,
,\

/
/l .,.
-".
:1 .!
f .
, .
" '
1
"
,.,.
/ t· ... -
~-- --- --- ------ ~----------
-_ .. _._-------===-¥""' _ ...... _------------------------_. o fL)' .
C( " 1 , .~
Map 3
Armed Robbery 1966-1968
I-'-~:~~;o'-.-·-~·--T::~=~~:=::;~:::.~:~~-:~,..·:~~~-·------·--~::-~~·-~ .. ~~-·· .. ---~'I I .,~ "'«"'" ..................................... ...... ................................................. I I ........... Oakland Hills 'j:. ... Oakland Hills ......................................... .\
I ............... '.' '.,.'" ..... I . ~ I ;'>"'$>",..,... . ........................ '. ",,>y»'1
I I B:~qe~ey .::::i·'· ., l:,:~:' ... :~::·~~:· .. ) ., : ~.oo~ .... ",1 ~i .zo ..... : .... : . . ." ." .:. ,. I I .. ' ... .0 . .
I, .. . . ~- . . .,
I EmerYVi;~e ""':'" " . :: . ,. ,., . '. (~ -!4tJ, I I' . . ,.
San I .,/·:.,~---1 " ............ /... . ........ -..................... ..... Lean'dro I I .... I" i I
{. ./ ,/:Army' I .. :.: .............. San Francisco Bay ..................... I
.. I" J .. ' :: l /i.Base I .' :: .......... :: j J rescott .... / 'I
.. 1avr~-~--/~ .......... / '"""", Scale Number of Robber j ....... Supply _.:::...... :li=-'~:::. o£i£i£i£i£iaiblliib~;;;;;;; S Grid Square ...... I "·\ .. cen te:..f~:~::"·" I I ~ I ! 8 I B I I I ,I ·r .......... · .. · ...... ·j ........ · .... · .... · .. "j" .... :::·.. I .
.a __ ....... _. __ -.;...::, .......... _'_'_"-"_"'_" __ I_'_I __ '-"._t---o,_~, ___ ",_,_"""_,._,,._,._._ ••••••••••••• _, •• _ ••• __ •• _ •• t._ .. _~_._·. ___ I __ ._I·_ ..... t--•• _I .. _. __ .~_._.)_.····,_ ..... _t-. ____ t--I I
'. 4' ..
/'
! I 1 . ....
I.
I
' ..
.'
\
1\
..',
'-' I
,< ,
II ,(j

"
r -,\. . i\
r
.,'
j h d Ii ·1
'·1 .,
Ij II I.' j r f I i'l 1·-·1
-~
II L;
n H \1 ~
o Map 4
Strongarm Robbery - 1966-1968
~----~'------"------~ r .. ''':''---(:::r--·-'--"-T=~~~~:::::~-·-·::::::-::~:::::=::'~::::::::::::::::----,-----------,--,---~-I "=::::::..... Oakland Hills .-...... ,.. \,.-C\._ ............ ,-. . ... r.{' ............ ~~~::~;-.~~.~ .. ~:-.. - .. -.-...... ..
I .... . ... ,.... -..... ----.. -...... I
I ~"""'.9-,,'to ... :::-' .. :: .... :.>.' .............................. i.. 'Y' -·-· .. ··1 : I' ~ • • "'y), 1 ' ! Berkeley ./ . .... ../·Pit:dmont .: ........ : - .," ~aC?~.... :': : I : .... . ;s. " '" . . I
i I ~.s c7il] .,. ) . r. .: .... : ...... : .... : .' . . .. , '. . '. ; . ) :: .... , iii c7i.b .l ... :...... . ........... :. . . .. . .,
/
" ~ I' - 0: ... ·; .. ··: .' .:.
,jl"l ,: .. · .. · .. ··· .. 0' '. . . ":'. .: :::~·i;;-14th I ~ I Emeryville .;.. . . : L/ San I
I j
i 1\. /.----1 . . ...................... /':~.. ... <.-.............. .--........... \......(~ .. :.: .. r·i Leandro I ..................... :.
I .. " .......... S an Francis co Bay 7-... 1 !-. 21- .=;t" I I u : , • 10.--- -u __ ..: =-' I
... ~ava1 ..... ..... illa.~. S~a1§ _. r of Robbe .es . "'''-'''- I .... Supply /....... f::::=:=" "O' .. I. •••• -.£%~ Grid Square ...... -_ .. _
'.\ <" Cen te"r ---:~:::::.... "=ii¥ 8 ~ I 1 I l .. ··· .. · ...... ··· .... i-······ .. _· .... ·r·- I L r·. -r ..... j I' I I I 1. . ...... -.. - .... ,-.. -.. -.. -.... -.-,.-.--.. -.-....... --~-.---~--....... -. ~--o~~---=r·, . . J I I
. _t_ ..... ,-_. __ ._I_ . ..-!t-. __ .!!..._I_ ..... __ .......... ' __ ... _lu_ •• ___ .).--.--• ..-r .......... _-.-.,-.-.-... --_.-,.-.- -0- .
r
l . ~ ~_ •• _ ... ___ ~ __ -..~ ____ ~."...._ ....... _4,'""'! .. ____ _ U'
---~~--------.-~------~--- -----~--------~--------------------~----~~------------------~-------~. .' f\=~~
.'
~-. . , /-I _"
.~ I
,
\
- .\
. , - ~;"
./::.' ;,~- ",'
-

',} 0-\ .-
'"
if'"
. "'0
-"
-----~--
~---- ----------
-- '"
q ~_~ _____________________ =__ __________ , . __ T~_~·~_. _____________ ~M_ .... _(ll~~=====-='_== .. =:::I....~""'_-_-__ "'" , o o () .
Map 5
Pursesnatches - 1966-1968
I :: ......... .l ;: ............................... : ............................................ : ...... \ .,
,. ...................... .:.......... ..... . I' ............. . ............ . • 1'. :. ........................... . ....... .... • •••.• , .•••••••••
Oakland Hills .... ... f·" Oakland Hills ............................ .
'.1 ...................... •• : ......... I'. r : ....... :........... . ....................... ..
I ...... .. .. ...1 I ~ 'j
! ~ ::.... ........................... . I ~J./. '::,' .. ' :. I
i .. , :: . 'I. 'I. I
i .,/~~ :::' .. /piedmont ........... : IV~">->'>' r j Berkel.e,.Y ......... :. .: ..... .' 0·,·. '. '. . I : ...... .··I~o .... '.' :. . . : •••• . .• ~ • : ":.'. oj i : ...... : j
I 1 S"h. ':' ". ...... ..:' :. I-' i ~ -..,;~ .......... . ............... . .... : I 0\ i r:tb .1. .... : .... :" .. . ....... i I . 0.:. . . .. ......... I i '. . ., .' . . '. . . ...... I
.~ IEmerYVi~~~······-·.: .. ) :. . :: ........ : .... : .. • .•• , .(_ie~~4th .,1
Ii l .,. .: . ; .. ;. ~ rt::;i ;;; ;:::: .:; :':': ::; :~; ::." .l .. ,.
'
Ii I :::~':': . ': ..... ,' '. . ..::: .. / San I' l . .. '. .. I I : ..... ........... ...... . Leandro I'
1
1-1 /<::.:~:J ........ __ .... _.. . ........ _ .. - \ ........ , ,:~~~: ... :, ,I
. _ I :: ,:' ':1Base! .. San Francisco Bay : ........ /
, if·': (1 I . I' I : ........... : 1 ...... .: '1 '1 t,............................... :=' I
: ,. .. 11 .. /·"Naval .... ::....... ~li~:·· =:.. rf:= .. ~·~·~·b~Ili"mm;mli;;~; Number o~ Robberi .. in .:........... I i <·i .. ~:~i~~~::~:::< .. ·; I' ' ... :-"l', I ~ I ~!. I Grl~. squa~e .... "j' ...................... j ..................... :j:::::::::... I I a..._._.!4~ ....•..•. _ ......... ln .............. _ .. , .. _ .............. _ .. , .......... , .................. _., ........... 1 .......... , ... _ .... · ... ·· .... •·· .• · ... ·•· ... ·,··.· .... ·, ....... _r .......... '.n ....... , ...•...•.• - •.. _.-•.......•.••.••.• - .•.. -.-.,.-............ ·· ... ····.····1···.'··.·1 ... ··.····,_·.····,. .. · ... · .•. _ ... -_-.-... -.-.. ,.-.-•.• - .. -.,_ ..... -.,.-... -.-.-._ •
.- 1 ~~'_~~ ______ ~ __ -. ________ , .. -.-' ___ ~~_=~_._H=-__ a~~_: __ -._~-__ ~~.~. __ --__ -_----_-._~-___ ~ ____ --__ . __ __
..... --"" .. -. --------_ .. _._-_._----------_.'"
r:
-. I .
!
l
_I
,
\
"
- 0
,- ,
-

/
- ---- - --~-~
,the high male victimization., If there is a focus at all, it is
about, a few maj,or streets of the city.
A. Robbery on Majo,r Traffic Arteries
Robbery in Oakland is heavily concentrated on a few major
streets. Thirty-six major traffic and business arteries, 25 of which
are shown in Table 3, contain about 50 percent of the robberies--even
though these streets cover a distance of only 76 ,miles, less than one-2
fifteenth of the total street distance in the city.
[Insert Table 3]
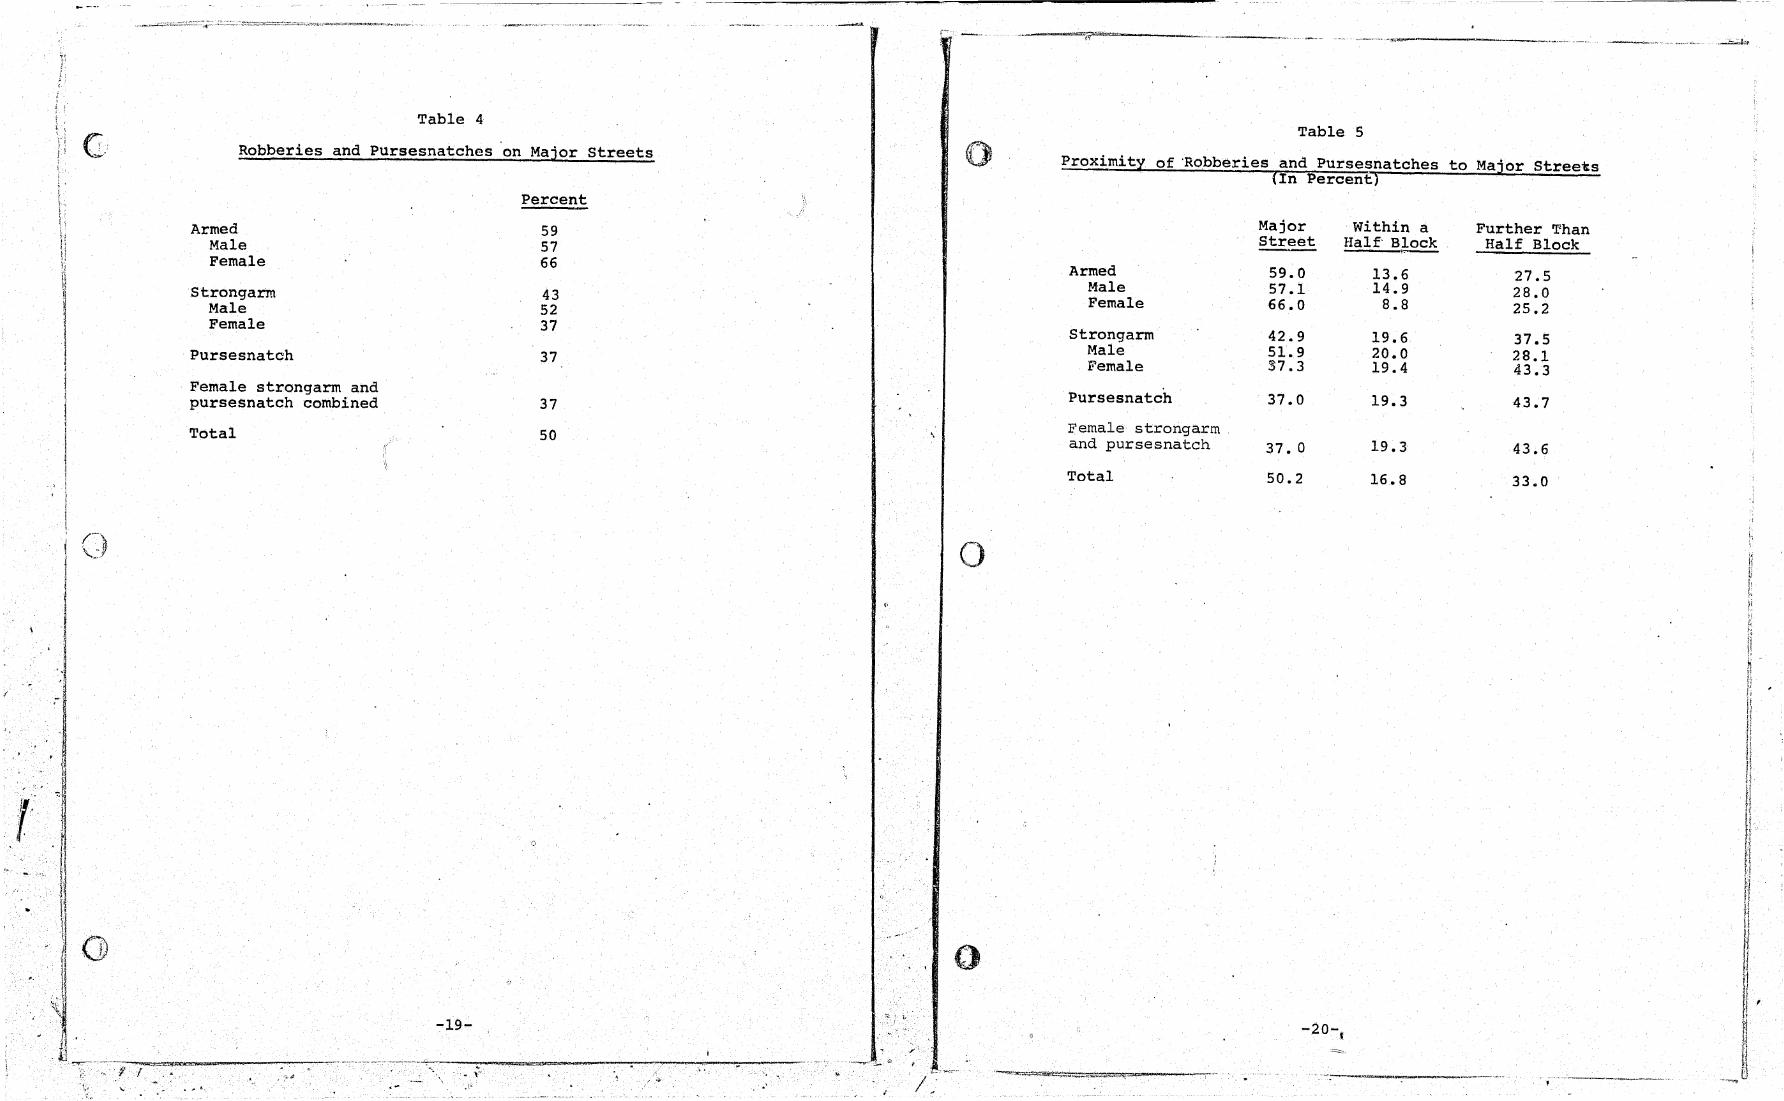
The concentration on the major streets is greater for armed
robbery (59 percent) than for strongarm (43 percent) or purse
snatch (37 percent), as shown in Table 4.
[Insert Table 4]
If the neighboring areas of these few streets are considered
and robberies within a half block on either side of these streets
included, the amount of robbery accounted for increases to 67 per-
cent of the total, as shown in Table 5.
[Insert Table 5]
The table showing tobbe~y frequencies on each of th~major
streets does not take into account the varying lengths of ,the ci ty
streets. In order to. make the street figures comparable between
-17-
, . , ,
~'
i
o
\
o
o
,-
; I:
Street
East 14th Street
MacArthur
Foothill
San Pablo
Telegraph
Broadway
Grove
7th Street
12th Street
Bancroft
Fruitvale
14th Street
East 12th Street
Market
16th Street
Jefferson
Willow
23rd Avenue
Park Avenu~
Washington
Shattuck
8th 'Street
East 18th Street
15th Street
San Leandro
Total
Table 3'
l-lajor Robbery Streets
Number Percent
508 7.7
276 4.2
257 3.9
235 3.6
235 3.6
179 2.7
139 2.1
123 1.9
98 1.5
91 1.4
85 1.3
76 1.2
65 1.0
65 1.0
64 1.0 "
58 -0.9
60 0.9
59 0.9
47 0.7
55 0.8
49 0_.7
45 0.7
46 0.7
47 0.7
47 0.7
3009 45.8
} . \ > ", Ii ,1 J, Ij
n
~ I I !
I J
Table 4
Robberies and Pursesnatches on Major streets
Percent
Armed 59 Male 57 Female 66
Strongarm 43 Male 52 Female 37
Purse snatch 37
Female strongarm and purse snatch
Total
combined 37
50
o
-19-
"",""","_ .. " -"".--~~-~---=-""'-==-----~-~--::';-""'"'::--. \"
,-
0
\
o .'
o
-----==~I~-=--------
Table 5
Proximity of 'Robberies and Pursesnatches (In Percent)
to Major Stree"ks
Major within a Further 'I'han street Half' Block Half Block
~
Armed 59.0 13.6 27.5 Male 57.1 14.9 28.0 Female 66.0 8.8 25.2
Strongarm 42.9 19.6 37.5 Male 51. 9 20.0 28.1 Female 37.3 19.4 43.3
Pursesnatch 37.0 19.3 43.7
Female strongarm and pursesnatch 37. 0 19.3 43.6
Total 50.2 16.8 33.0
, -20-,
i'""--~--~""

------.
streets of differing lengths, the number of robberies per thousand
feet of street were calculated and listed in Table 6.
[Insert Table 6]
B. Site Characteristics
Thirty-one percent of all robberies occurred in areas of the 3
ci ty classified as commercial landuse, as shown in T,able 7. other
landuse classifications including industrial, park, vacant, freeway,
and low density residential landuse are all very low in rchbery
occurrence, as may be seen by comparing Map 2 (total robbery) with
Map 6 (generalized landuse).
[Insert Table 7 & Map 6]
While commercial landuse contains the largest percentage of
each robbery subtype, the second ranking 'landuse type varies by type
of robbery. Hi~h density residential landuse is the second most
important landuse for male nonarmed robbery" low medium density
residential is second in female nonarmed, and medium'den'sity is
second for armed robbery.
While the major type of landuse in which ropberies occurred
is commercial and the majority of robberies occurred upon the major
streets, the most important kinds of premise--the specific setting
for the offense independent of the landuse--for robbery are street
and sidewalk, liquor store, small grocery store, and gas station.
The most important premise type for robbery as a whole is the street
and sidewalk. This type accounts for 71 percent of the male and 83
-21-
-~~-,......--- ~---
,
. ' _ -'-~-"""""""'-"""_:>!"--~~---. ",'-""-:-J·7-n-'~,·: '-~-".~~~ .... '">bc.*
I I .~
Table 6
Major Streets - Robberies per 1000 Feet of Length
(1\, 1'rJ Length Street in Miles
East 14th Street
Mj;lcArthur
Foothill
San Pablo
Telegraph
Broadway
Grove
7th Street
12th Street
Bancroft
Fruitvale
o 14th Street
East 12th Street
Market
16th Street
Jefferson
Willow
23rd Avenue
Washington
Park
Shattuck
8th Street
East Bth Street
15th Street
~ San Leandro
,Average
7.0
9.1
5.5
3.7
3.4
4.3
3.9
2.9
2.6
5.2
2.8
2.2
3.4
3.7
1.6
0.9
1.2
2.0
0.8
2.0
1.3
2.8
0.8
0.8
3.7
3.1
-22-
Robberies per 1000 Feet
13.8
5.8
8.9
17.3
1~.2
7.9
6.8
8.7
7.2
3.3
5.9
6.9
3.6
3.4
7.5
11.1
9.1
5.5
1.1
5.1
7.1
3.0
11. 2
10.9
2.4
7.5
" !
,

.. '
, '
:
,/,r " " .
. '
,-"
. '
.. _l I ..
..... , .... . • V
f / , .
\1 ,
, .
',/ '
, .
()
I
I
Commercial
Low medium density residential'
Medium density residential
High density residential
Industrial
Freeway
Government or institution
Low density residential
Park
Vacant
No information
Total
,~,
r
Table 7
Landuse of RObbe~ Sites (In Percent
Female Nonarmed
Male ( Including Total Armed Nonarmed Pursesnatch)
(N=65l0) (N=1758) (N=726) (N=B12 )
31. 2 32.0 36.9 26.4
l4.B 13.6 11.2 1B.6
14.6 15.2 11. 7 15.6
12.5 9.2 14.7 15.7
4.3 6.1 5.4 1.0
3.1 3.6 3.2 2.3
1.7 1.1 1.3 2.9
1.6 1.6 1.1 1.8
0.9 0.7 O.B 1.3
0.3 0.5 0.4 0.1
15.0 16.2 13.2 14.4
100.0 100.0 100.0 100.0
,
-23-

I ' . "
~ ... ,
f I
)., "
"
, '
",
, , ,"
;'
.,
' .. j..
. . ,
'~ 4'
,~ "
/
/:-~, . /////.:/ '/::/" %;~;~
~~ ~ /
Map 6
Commercial
i h-Density H g'dential Resl
di m-Density . hMe u Rig. den tial Resl "ty
d ' m-Densl Low Me ,IU ResidentIal
, I Utility, IndustrIa, t tion or Transpor a
Low-De~sity Residential
·'~-'~i·:·: nmen Institutionatla1r ~'!.~-:':-:':" Gover
t · nal Recrea 10 Park or
o Vacant
LAND USE
OAKLAND CITY PLANNING
DEPARTMENT 701 DIVISION
,
"
\
,

/
/ 'j
'.~""\ Ir",· ,
.11 , , "" ~ ....
.. ,
f·
.' . , .r
, ,
.,... ,.
".
o
()
"
. "
~-
/
percent of the female nonarmed robbery. There is however" a great
deal of difference in the premise of occurrence between armed and
nonarmed robberies. Only 24 percent of the armed robberies occurred
in the street and sidewalk premise type. Armed robbery is, however,
much higher in the business type of premise codes due to the fact
that many robberies of commercial establishments are armed. When
premise codes are tallied by their code groupings, as may be seen
in Table 8, armed robbery is higher in the business premises group
while nonarrned robbery is higher in the open space group.
[Insert Table 8]
-25-

; ..
I " \
/'
.~: '
; . "
".
f I - " • ~,I-
~i -------~~=-><--~"""""'---------------------"-'""~-.'-' .. -"."-' , A
f1 \1
1} ! j l
1
1
I IV
'" I
Group'ed Premise T~
Ope'n space
Dwellings
Finance
Public places
Business, commercial
Transpo;rtation
Schools
No information
Total
Total (N=6580)
61.0
5.2
1.6
1.8
26.3
2.8
0.6
0.8
100.0
Armed
o Ti'lhle 8
Premise Type of Robbery Sites (In Percent)
Male Female Male Armed Armed Strongarm
(N=2994) (N-234l) (N=638) (N=1348)
29.3 32.2 19.4 80.5
6.4 5.9 8.5 5.3.
3.3 2.0 8.2 0.3
1.3 1.5 1.7 -3.7
53.1 50.8 61.6 6.2
5.2 6.6 0.2 1.3
0.1 0.2 0.0 2.0
1.0 0.9 0.5 0.7
100.0 100.0 100.0 100.0
Female Strong:arrn
(N=797)
88.6
5.4
0.0
1.1
3.8
0.4
0.4
0.4
100.0
"j .' ..... ~. -.- '~,.-
'" ·" __ -..... __ ~_""'=_=""""'=""""""'"",........r....,_=~"..~'-~ --..,.......-------,-~---.--~-'" / 'ft •
, ,
,
\
Purse- ,Female Snatch Nonarrned (N=139l) (N=2l88)
94.0 92.0
,2.2 3.4
0.0 0.0
0.9 1.0
1.7 2.4
0.3 0.3
0.3 0.3
0.6 0.5
100.0 100.0
" '
. , . ,

.( 'C '';:7
'), f, \,
\}
Chapter Three
COMMERCIAL ROBBERY
Commercial robbery is even more concentrated than robbery
as a whole. All of the city's 1989 commercial robberies for the
three-year period occurred in only 12 percent of the grid squares 4
for the city.
Commercial robbery is also highly concentrated along the major
thoroughfare streets. Over 65 percent of the commercial robberies
occurred on one of the major robbery streets. An additional nine
percent of the commercial robberies occurred within a half block
of these major streets, making a total of over 75 percent occurring
on or within a half block of a major robbery street, as shown
in Table 9. (See also Map 7.)
[Insert Table 9 and Map 7]
i( \, Interestin'gly the center of the city does not appear to ac-
count for a particularly high proportion of the commercial robberies.
Most of the central business district of Oakland is contained in
census tracts 19 and 29. These census tracts together contain only
3.8 percent of the commercial robbery, as shown in Table 10, while
the two census tracts adjacent to them, census tracts 13 and 18, to-
gether contain 4.2 percent of the commercial robbery. However, the
central area averages two robberies per grid square while the adjacent
areas average only one. As may be seen in Map 7, when the central
area is compared to the area above West Grand Avenue, especiallY,be-
tween Telegraph Avenue and Market Street (census tract 13), it becomes
-27-
f I - . , " . .-
------~--~------
.,
o
" ,
'~ 0)
I:
Table 9
Proximity of Commercial Robbery to Major Streets
On major streets
Within half block
Further than half block
-28-
Percent
68.5
9.0
22.5
--
, ! ,
" r-.; " ,\

t
. " - \ "
/
l' I
," '0 . "
.... ,..,.
J i I • 1
• ,
I
---------------
-------~~~~~==~=--=~------=------------------------------------------
Commercial Robbery - J.966-1968
" ............ j .......... , ••••••••••••••••••••••••••••• , .......... _ ........ , ••••• _ ...................... 1 .......... , .................... _, ................ --.--•• _ •• _.-,.-............. -...-...... ,.. ....... _., ....... _.......-. __ ,....-. ...... _._.,_._ .. _._, __ ._ ........... ____ - ....... - • • -.~...-' I .................... '. -
I ."........................ ··1............ .... .............. ... ..... .. .o' .............. ~ •••
I ...... l . ....................... '. . .. ........... .
....... .. .... ::::........ ....... .. I ::;.... . ..... " ........ " ..... , " ........... '\." ." .................. -.................. .. i .......... Oakland ~illS \ .. " .. ! ......... :.:'.. loaklan1d Hillf ................................ !........ I 1 .... • ........ :\
\
. ~ ......... :
~ I I ~ I I ~., : ................................. i i berkeley ~ /' - , ..... , Broadway ./: .. ) .j \.11 f-' ...= Piedmon t .:::." 1- l: •• • ........ ::... j '1 ! -,. : .:' i' ! I s. :: ........... :...... ..:.: .. :" i
I 1 .P",,:~ :.:..... . ....... :..... i N'\ "<J,J./. :.:.:..... ': . .'.... I w q:.... :. :.... i I ...... .: i
j ..................... : ~' ". :' ." (.:e"'J. 4 t11 I \Eme-:~ville ~.::' : .. L .. y I I : ,<;.,.: ........... ....... rJ ~:~ndro I
:....... . ......
l
I II'" ................... :... . ... : ... . : ......... ;
\
. :,1 'i .' I .••.•
/::Army I. San Francisco Bay ...... :::::::::::;::.
II .. "··~~:/rs: ... ~ .. __ .,.. "" 11- 21- .:::.:.,.·.l·
I I I
.~ t-· .... · .... ·.:1 ., .. u .... I I : ...... Naval ./.::.... If:l!:l~' !::!!!~~~;;;;;i:;;;"""_ ............. . I '\~.~.;.~;~!:~:~~7-'" .." I 0 I .~ I ~ I .... " ......... " ....... " ......... __ .::,,". . I l __ ,_ ... _r--_ ....... _, __ ... _,_ ............... __ ... _.n ...................... , ......... , .......... , ......... , ......... , .......... , ............... 'H •• ' .••.• ···.,··.· .. ••· •. ·• •• ····,······ ••• t.·· .. ····,····.·· .... ,··-·····f····.····~····.···· .. ·· ...... to ........... • •• •• •• ,····.· .. ·I·········l····.·~··t ......... , ..... ~ ........... --.. ----.... -. 'N~
o
., .. "
' .. /
I
'! -i
1 I I
'"
\
.;
u ..
,

, : ,
"! . r ";;
c
o
,'- .~
evident that the outlying commercial and thoroughfare streets
of the city appear to attact much greater amounts of commercial
robbery than does the central business district.
[Insert Table 10]
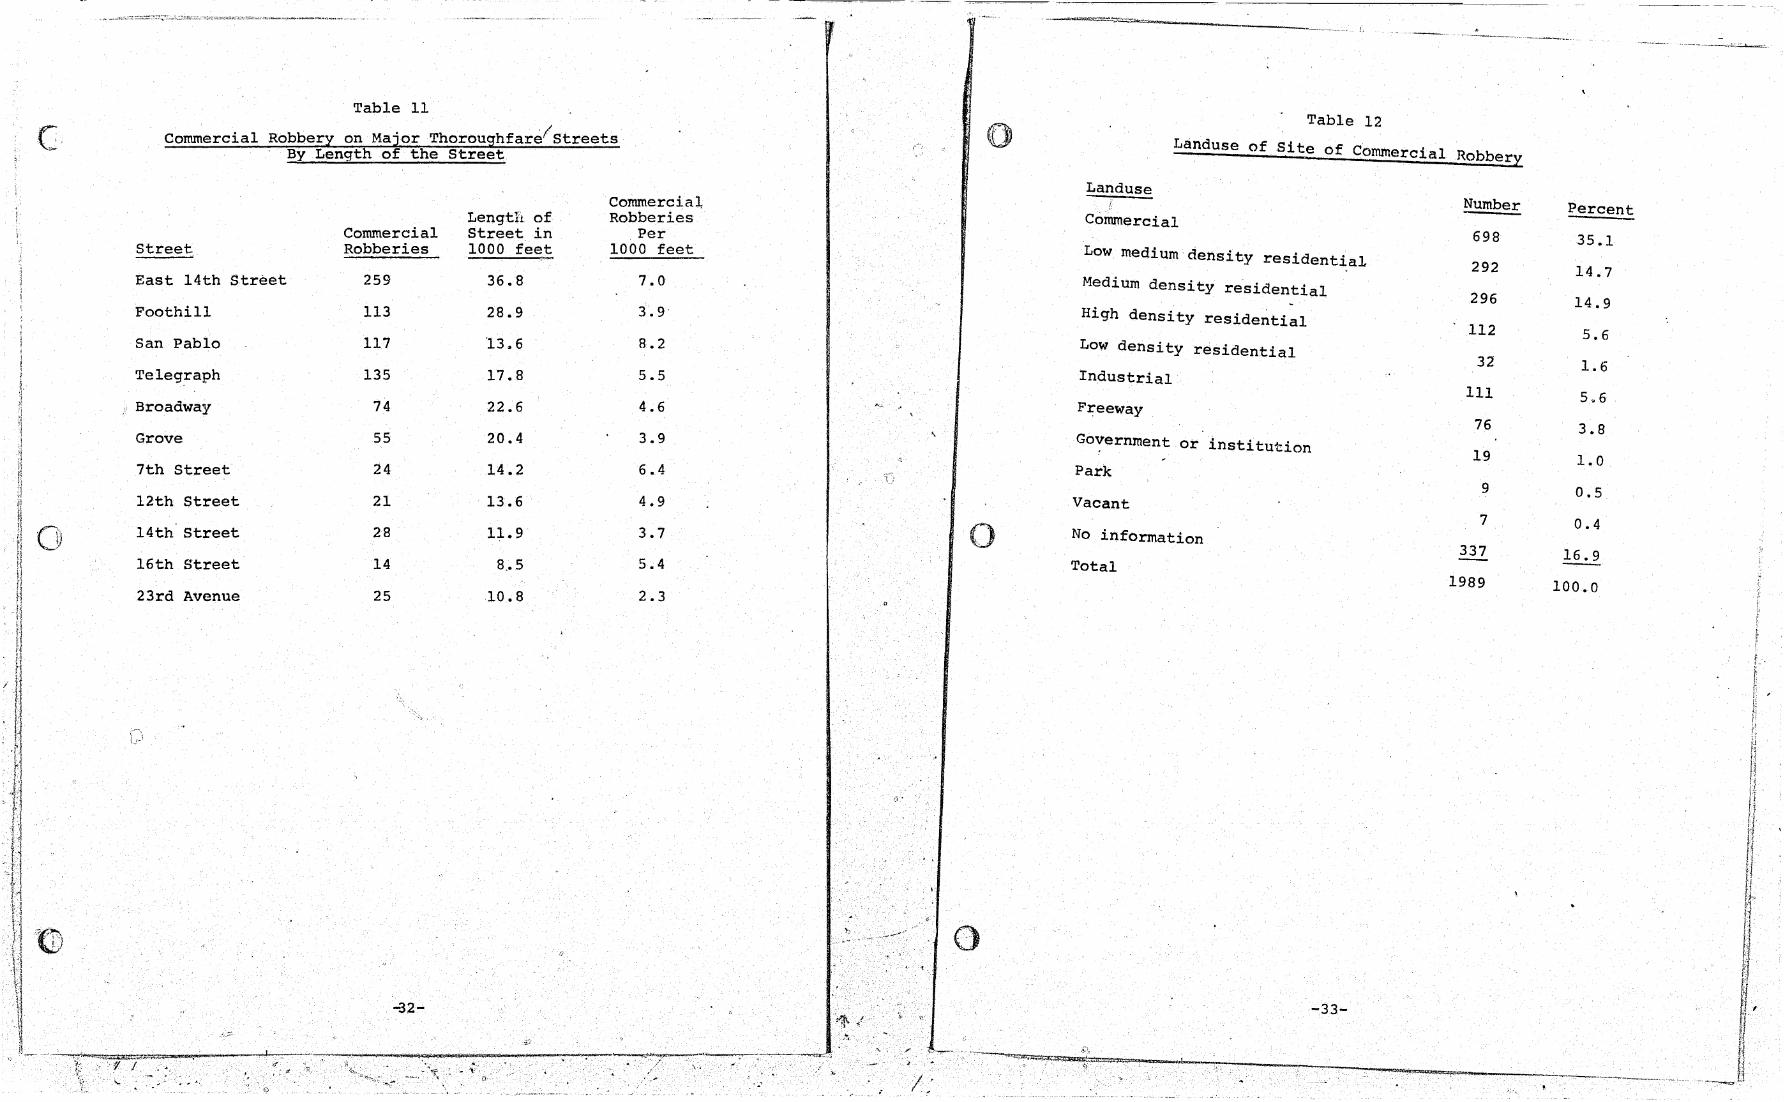
This can also be seen by comparing the downtown stre~ts (14th8
16th, Grove, and Broadway) with the major arterial streets (San
Pablo and East 14th), as shown in Table 11.
[Insert Table 11]
The robbery, of a commercial enterprise includes both the rob
bery of the inside of a store and the delivery boy on the street.
This latter group is, however, so small that only 5 percent of the
commercial robberies occurred on the' city street or sidewalk. Only
about 35 percent o~ those commercial robberie~ for which there was
information occurred within a commercial landuse area. This is far
less than the 37 percent which occurred in residential landuse
areas, as shown in Tabl(? 12.
[Insert Table 12]
. /1
This high percentage of commercial robb~ries in residential
areas may be due in part to robbery in the fringes about the com
mercial areas. It is undoubtedly primarily due, however, to vic
timization" of stand-alone establishments which are the only com
mercial establis"hment on a block or one of a sma!l 'cluster of
-30-
;5 'F--">-;'F;;}~~~~-' c'
. #
:7 \. , " '~ '" '.' ~ .. i ... .-
,',
.. ".
,.;... ~-:,-- -~.<. ,"'!, :.-./'
,0
'.
j, I~
C)
o
, --,--,~-.-.
Table 10
Commercial Robbery by Census Tract
Number of Percent of Commercial
Number of Commercial Robberies Commercial Robberies Size of Per Grid
Census Tract Robberies 2:E City Grid Squares ~uare
Central District 20 1.9 19 38 1.9
29 37 1.9 16 2.3
Adjacent Areas 28 1.4' 13 39 2.0
18 43 2.2 42 1.0 20 19 1.0 19 1.0 23 14 0.7 17 .8 28 10 0.5 41 .2 30 13 0.7 '51 .2
-31-
/
C'" , , ,
"..
Table 11
Commercial Robbery on Major Thoroughfare/Streets By Length of the Street
Street
East 14th Street
Foothill
San Pablo
Telegraph
Broadway
Grove
7th Street
12th Street
14th Street
16th Street
23rd Avenue
Commercial Robberies
259
113
117
135
74
55
24
21
28
14
25
-32-
Length of street in 1000 feet
36.8
28.9
13.6
17.8
22.6
20.4
14.2
13.6
11.9
8 .• 5
10.8
Commercial, Robberies
Per 1000 feet
7.0
3.9
8.2
5.5
4.6
3.9
6.4
4.9
3.7
5.4
2.3
.. ~'- 't;';~l:t . ....,r<\,g:~;:;.r}"'~"","'·\"_, _'''I'', -----,-,'-.......,--!.', 1/ I ;.' .\~- '" ~ '" ~, • ~<',~
--~-~-~--
\
(1 •
. .
"
~,
",., .. "
o
0'·, ,,-
Table 12
Landuse of Site of Corom, ercial
Landuse
Commercial
Low medium density residential
Medium density residential
High density residential
Low density residential
Industrial
Freeway
Government or institution
Park
Vacant
No information
Total
-33-
Robbery
~umber
698
292
296
112
32
111
76
19
9
7
337
1989
"
Percent
35.1
14.7
14.9
5.6
1.6
5.6
3.8
1.0
0.5
0.4
16.9
100.0
-• --~--.,-~---,..!:...'~
,

I'
i' \
commercial establishments. The establishments which have the highest
C, commercial robbery rates are those which tend to locate independently
of. other businesses. This is especially true for the three major
victimization premise types of gas station, liquor store, and small
grocery store. Together these three types of establishments account
for 50 percent of the commercial robberies, as shown in Table 13.
[Insert Table 13]
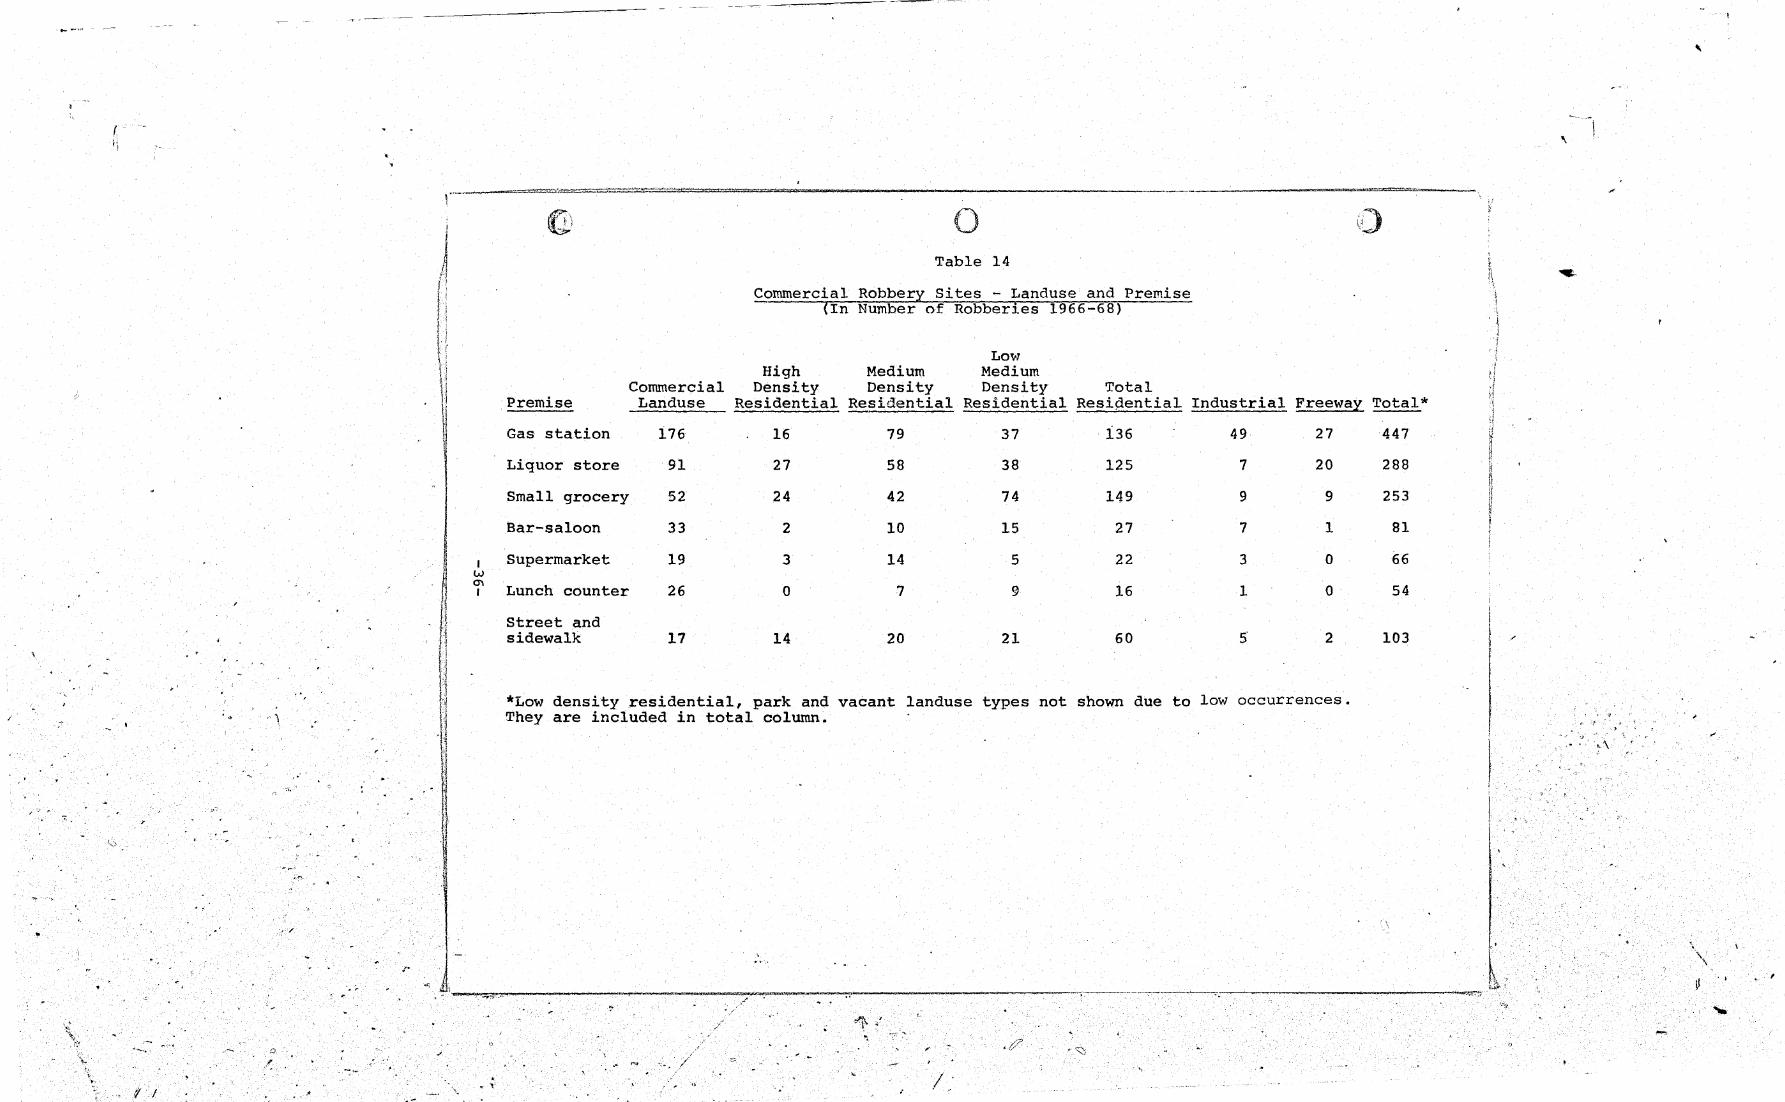
The 1anduses in which a major portion of the liquor and small
grocery store commercial robberies occur are medi.um and low-medium
density residential. However, these 1anduses do not contribute
equally to gas station robberies which tend to occur more frequently
in commercial 1anduse areas, as shown in Table 14.
[Insert Table 14]
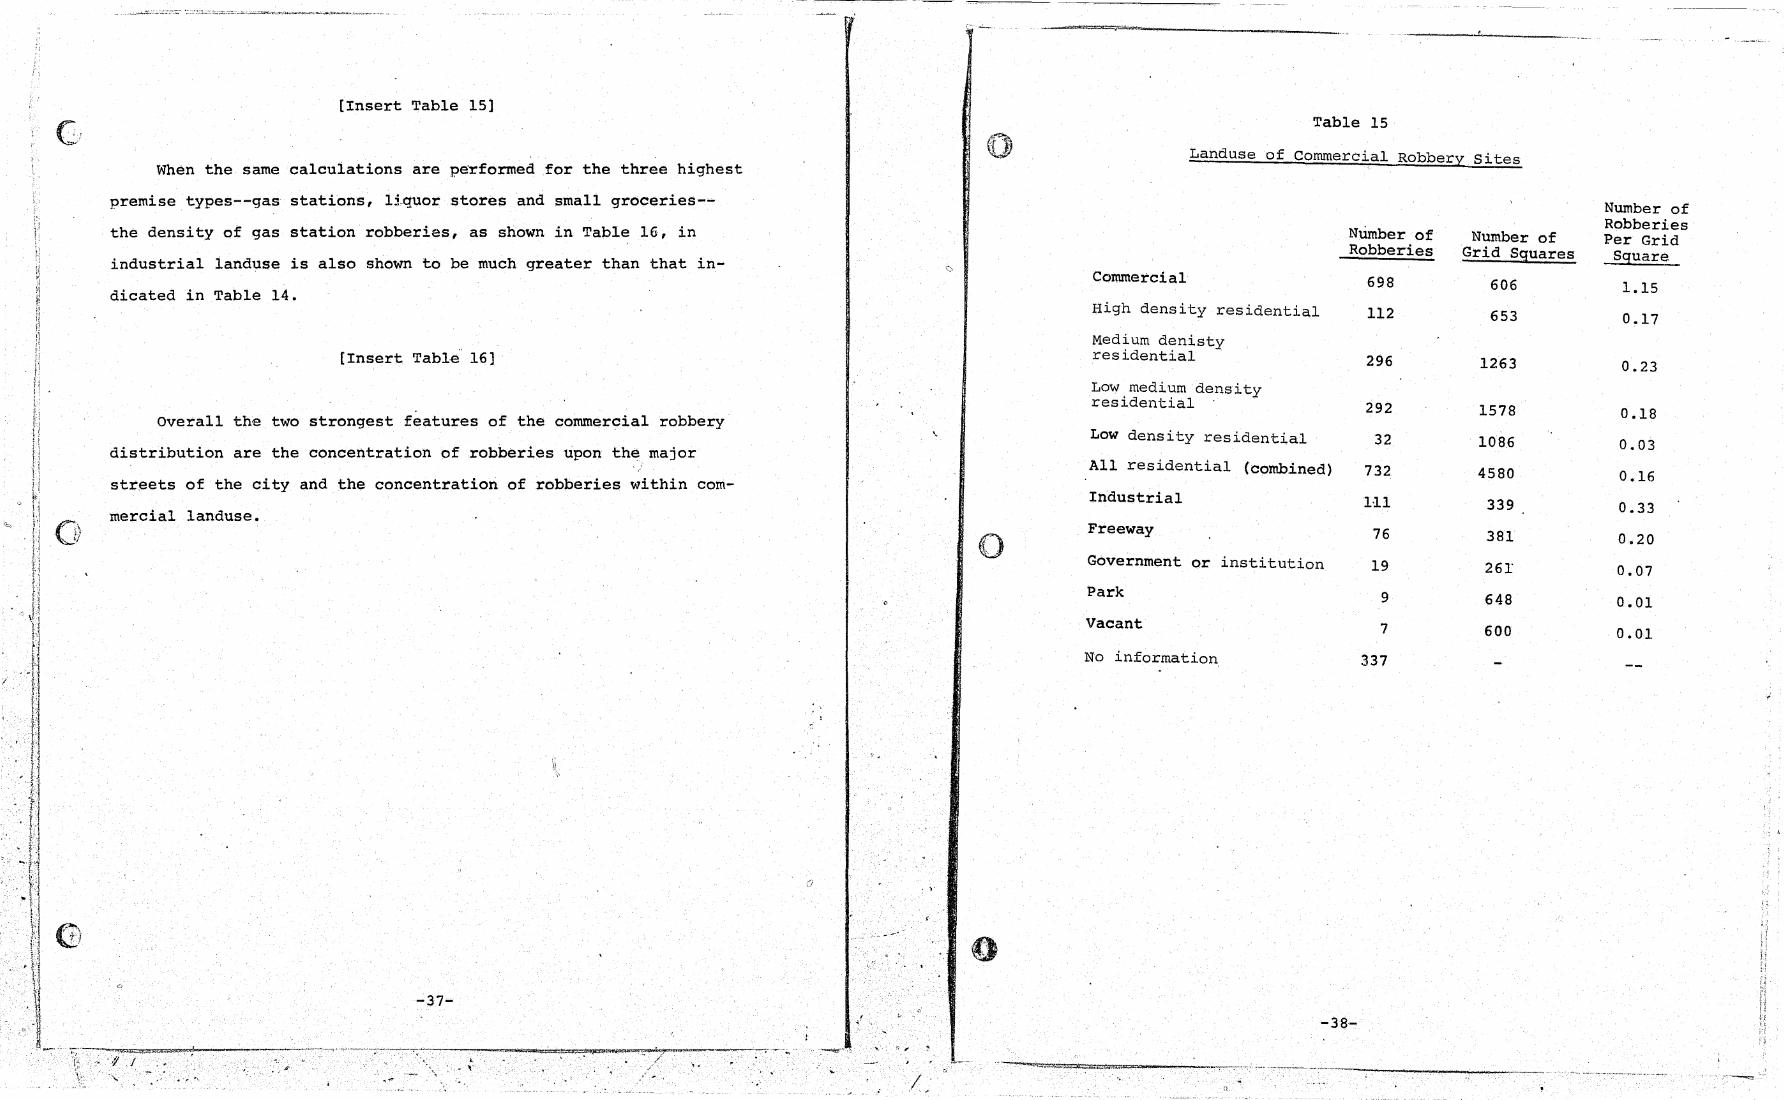
The iow percentage of commercial robberies within commercial
landuse and the correspondingly higher proportion within the resi
dential 1anduse areas is due partly to the fact that over half of
the city of Oakland is ~esidentia1 1anduse. Table 15 shows both
the number of commercia.1 robberies within each 1anduse and the num-
ber for each grid square of that kind of 1anduse.Viewed this
way, commercial robberies are nearly six times as dense in com-
mercia1 1anduse as wi thin residerltia1 1anduse,. Also of note is the
relatively high density of commercial robbery within industrial
1anduseareas. Tl)is ~s not demons.trated in the previous tables
due to the small iamount of this type of'landuse throughout the
city. -34-
r ~,_
, , 0
.,
0
Table 13
Most Frequent Premise Types of 9ommerc~al Robbery
Premise Number Percent
Gas station 447 22.5 Liquor store 288 14.5 Small grocery 253 12.7 Street and side walk 103 5.2 Bar - saloon 81 4.1 Supermarket
66 3.3 Lunch counter - cafe 112 5.6 Mot'el
57 2.9 Cleaners
57 2.9 Drug store 45 i 2.3 Bank
41 2.1
, -35-
r h ,
i
j { ! ji I; ! :
11 if \ I 1 r{ j j
I
,~ w en I
3
fl l.j
V l fl 1'4
I .. 'I, , H . "H
~' H "
' , Ii :" .' 1 .r ,I .. '-0-
tl "
(~)
;..,
..
II ,<
. ,-___ -""~.'.f='-'''''''''~...:t.~'''''''''''''''''''''''''''-=~ M-rt»t"'Z"........"7k'd::$C
(1 0 ' !) .... , .
Table 14
Commercial Robberx Sites - Landuse and Premise (In Number of Robberies 1966-68)
Low High Medium Medium
Commercial Density Density Density Total Premise Landuse Residential Residential Residential Resiqential
Gas station 176 16 79 37 i36
Liquor store 91 27 58 38 125
Small grocery 52 24 42 74 149
Bar-saloon 33 2 10 15 27
Supermarket 19 3 14 5 22
Lunch counter 26 0 7 9 16
Street and sidewalk 17 14 20 21 60
*Low density residential, park and vacant landuse types not shown due to They are included in total column.
-------"';'-~, -."'----,--
4/ ::.-;;: ....
" , .
~.......,
'[) 'j \ '
Industrial Freewal Total*
49 27 447
7 20 288
9 9 253
7 1 81
3 0 66
1 0 54
5' 2 103
low occurrences.
\
~ f\ "
/
" ,
!
1 \ \
",
,\
,
\,
\
,.,
, . . ,
:/
C;, - .
r;\ '\..,..l/
[Insert Table 15]
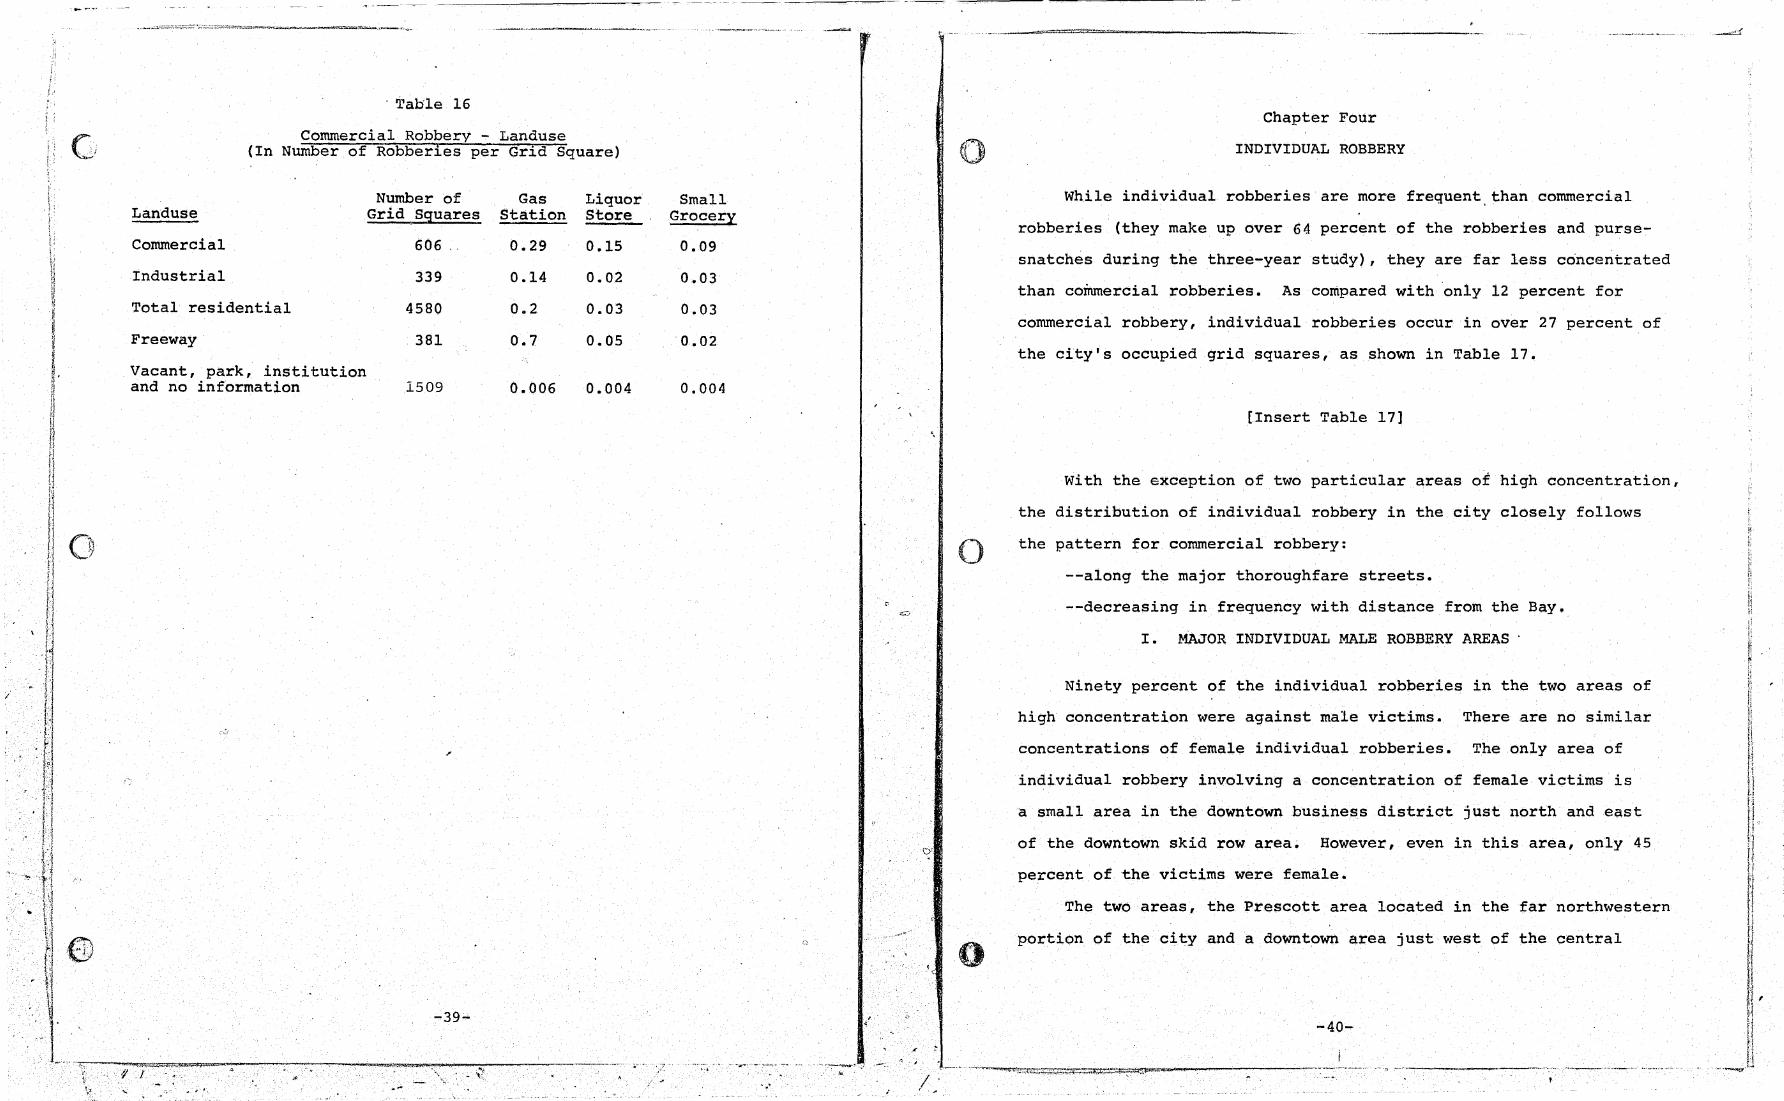
When the same ca1cuiations are pe~formed for the three highest
't stat1' ons, 1:i.quor stores and small groceries---prem1se ypes--gas
the density of gas station robberies, as shown in Table 16, in
industrial ianduse is also shown to be much greater than that in-
dicated in Table 14.
[Insert Table 16]
Overall the two strongest features of the commercial robbery
distribution are the concentration of robberies upon the major
streets of the city and the concentration of robberies within com-
mercia1 1anduse.
-37-
----", .. ,_~_--~~-}i--------.~.--:~.-:~ -'.'.-~--:--'...., • .f j ,-
.--,--..-...,.....-~)ii!"":;::;tiC ... ""'=. =~~r--~~"-----~" .• " i.. - ~ "It " .., - ,.
o
()
\
0
,.:
: )'
«)
Table 15
Landuse of Commercial Robbery Sites
Number of Robberies
NUmber of Number of Per Grid Robberies Grid Sguares Sguare
Commercial 698 606 1.15 High density residential 112 653 0.17 Medium denisty residential 296 1263 0.23 Low medium density residential 292 1578 0.18 Low density residential 32 108.6 0.03 All residential (combined) 732 4580 0.16 Industrial H.1 339 0.33 Freeway 76 381 0.20 Government or institution 19 261 0.07 Park 9 648 0.01 Vacant 7 600 0.01
No information 337
"
-38-
n.
'I "
, , '
{ \
.1 :
. Table 16
Commercial Robbery - Landuse (In Number of Robberies per Grid Square)
Number of Gas Liquor Landuse Grid Squares Station Store
Commercial 606 ., 0.29 0.15
Industrial 339 0.14 0.02
Total residential 4580 0.2 0.03
Freeway 381 0.7 0.05
Vacant, park, institution and no information 1509 0.006 0.004
-----~'--
Small Grocery
0.09
0.03
0.03
0.02
0.004
"
-",",,,,,.,
"
... . "
, -"-~"""-,,,""'j==----------
0:''','' .'
Chapter Four
INDIVIDUAL ROBBERY
While individual robberies are more frequent, than commercial
robberies (they make up over 64 percent of the robberies and purse-
snatches during the three-year study), they are far less concentrated
than commercial robberies. As compared with only 12 percent for
commercial robbery, individual robberies occur in over 27 percent of
the city's occupied grid squares, as shown in Table 17.
[Insert Table 17]
with the exception of two particular areas of high concentration,
the distribution of individual robbery in the city closely follows
<=> the pattern for commercial robbery:
--along the major thoroughfare streets.
--decreasing in frequency with distance from the Bay.
I. MAJOR INDIVIDUAL MALE ROBBERY AREAS .
Ninety percent of the individual robberies in the two areas of
high concentration were against male victims. There are no similar
concentrations of female individual robberies. The only area of
individual robbery involving a concentration of female victims is
a small area in the downtown business district just north and east
of the downtown skid row area. However, even in this area, only 45
percent of the victims were female.
The two areas, the Prescott area located in the far northwestern
o portion of the city and a downtown area just west of the central
-40-
,

I:
0
\
I
.
Table 17
Number of Grid Squares with Robberies
Number of Robberies in Grid Square Total Commercial
o 4141 5427
1 864 365
2 427 163
3 234 77
4 1.35 60
5 91 28
6 66 29
7-8 94 25
9-10 50 15
11-20 78 9
21-50 19 2
Over 50 1 0
Total 6200 6200
.-
Individual Individual Male
4508 5263
855 590
374 164
148 77
99 34'
62 22
40 15
59 15
23 4
22 9
10 7
0 0
6200 620,0
-41-
Individual Female
4962
757
253
90
65
28
19
17
4
5
0
0
6200
"
I . I Y,.:!"
o
business district, are similar in some respects. Both .contain a
number of bars and taverns, both have some skid row aspects, and
both serve as a meeting place for prostitutes and their customers.
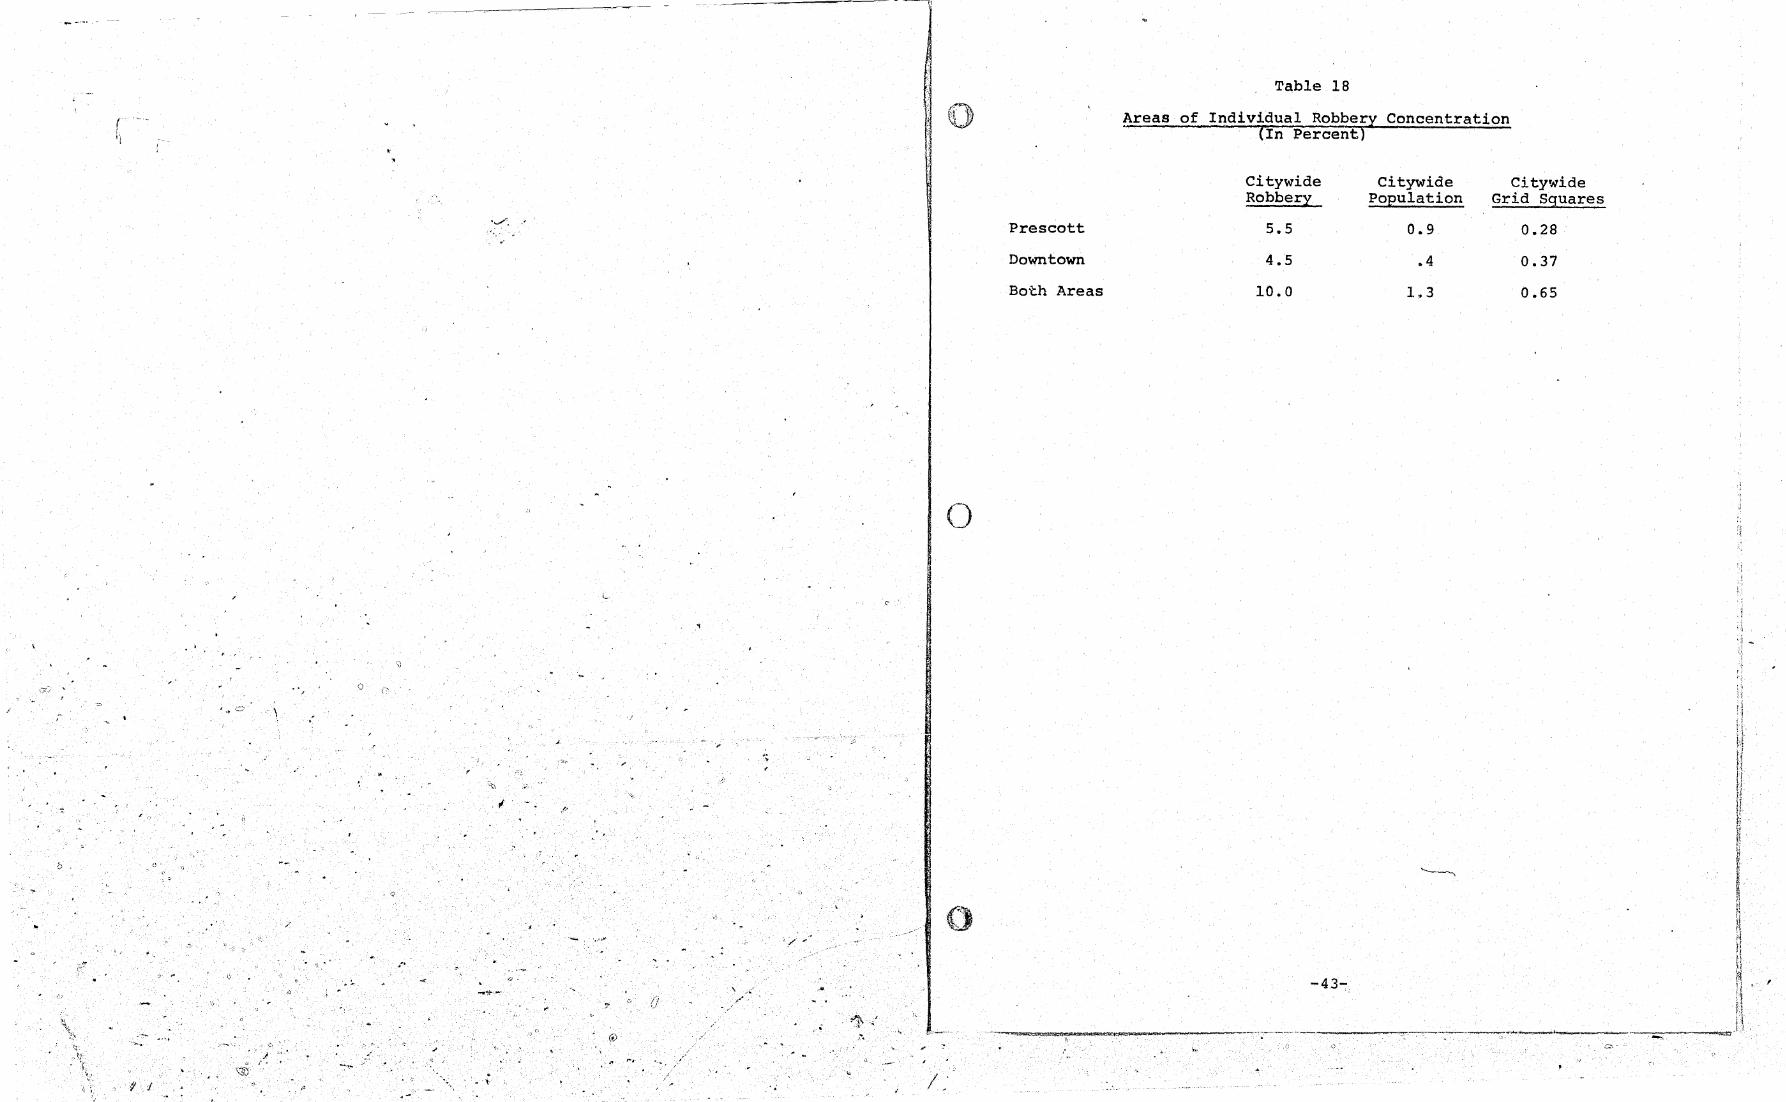
Together these two areas account for approximately te:n percent of
the total individual robberies, but only 1.3 percent of the city's
population, and less than one percent of the 6,200 inhabited grid
squares, as shown in Table 18.
[Insert Table 18]
The greatest concentration of individual male robberies is in
the Prescott area. Encompassed by census tract 15, this area
accounts for 9.8 percent of the individual male strongarms and 13.5
percent of the individual male armed robberies, for a total of 11.2
percent of all individual male robberies. Located near the Bay,
the Oakland Army Base and the u.S. Naval Supply Center, this area
is the oldest area of the city and is the heart of one of the Bay 15
Area's oldest black residence areas.
The center of the robbery concentration in this area is Seventh
and Willow Streets, the core of a neighborhood shopping area dotted
with eating establishments, and bars. There were 58 individual male
robberies about the. intersection of these two streets during the , ,
three-year period and over ten in every grid square touching on 16
Seventh Street for a four-block area. (See Map 8.) This inter-
section has the highest concentration of robbery in the entire city.
[Insert Map 8]
-42-
,', I
. ../", "
/ ; \
"
-.
".
"
':/!" " ". ,
/i ,j
-' '" o '@.
1 /. .-, ,.
Prescott
Downtown
Both Areas
o
,,, . . '
. ... I:
Table 18
Areas of Individual Robbery Concentration (In Percent)
Citywide Citywide Citywide Robbery Population Grid Squares
5.5 0.9 0.28
4.5 .4 0.37
10.0 1.3 0.65
-43- ,

' ... _''"T
f
, i
,~
t ~ II
I j I I
~ ',1
i \j
~ H
~ ~
I
I
*" *" I
, .. I
I - .~ \ , ·'1
/
/'
.~.
1j I .. - .• .. -
---.---~--
~ ________________________________________________________________________ =-J~=-'~_====_~ ______ __ =='7i'"'~_~~I""""""' __ _
o t"'t tj
Map 8 ·-i~-·'--,-·-·~--:::::::~::!~:::7-·::-'---... ··-·-· ... -··-'-... ··-'-··-.. r---.·---,--t-----.-_____ ·._ .. -.-.-_I ___ I_..---t_l __ ..--_...-__, • _r-_..-t-_I--S .... :.... . ... .. ~. ~ ..... :
: :...................... . ........ .. .:::::::::::: ............... .
Individual Male Robbery . '" ............. .
.................. .... . .. .. , .. .:. ....... '. I
" n. .. ........... I . .... ............ .'~.
................. Of ............................. .
.:.: ...... , ........... : .. ..:' Oaklapd HillIS ......... .
f .. • ....... 1 .... 1 I ... :~:;-' .. -....... -..... ,_ ........ ,;. °laklandl HillS I
I 9-,<,-
I ~ ....... : ...... . I ... :.. Broadway
I Berkeley<.:. Ib~qi;' ) r.,q,6 ......... . . , ~q ..........
: . .......... i ...... :... I ""' .. :. : ... . . .: I Emeryville ...... : ...... :: .... I .,. ........;.. .' I ...= --1
I .' .: .... /.f" II
./', .l Armyi I .. i /"j Base]
I L .... ~ .. .f I. .... ~rescott
........... . ....................... . . . . .
//~ iedmon ~ ... _ ....... ).
: ...... : ....... .:: .................. ..
. . '.. , . :..,. _-.-:----:-
0·:' ... ::.' '::. "'0:.: '. .' ' .. : ... ' .. : : :'. '.' . . .' ...... ' ... '" ...
, •• '''.. '" 0" 000· '0 o. o • '0' •• , 0
, . . .. • '0' •• , •
" " '" .. ,. . , ,
San FrancisC0
.......................... , .. \ ..... .
Bay
: l--'" ............ ':Naval .:r .... -~. Scale
. _..' -==- 0
' .. .........
.~ I I .,. i
..... .,.1 " ........ ·· ...... 1
,..L14t I .... "):1 h I
I
I I
........ S upp ly ... :::........ ni-r:", f ~ : ~ ::'" Cen ter_---::::.... ~' I I·· ............. _~.f.::...... I I IJ
LL_...-__ a----!. • '-·-.----.-I-.-I--...... -.--___ ~_--. __ ._ .. _'_~.-..-_I_._.-_..__.--.,, ____ .-.----'----1--1-.--...-.
, ,
1\
~I . ~.. ~
' ...
,-
l ~ 1\
\
\ , /
,1
I , ;] , " [1 :.! ~J 't 11
~ II U , Ii ,
I
I I r
, t"v
,
.'
,-'I
,,.
,~\: ,;1
.'
'1 " ,)
\' '\
" '\ It.
.. ,
: .... -

! i
In contrast to the more or less residential character of the
broader Prescott neighborhood, the downtown area of robbery concentra
tion is one which was once the commercial heart of the city, but
which has now become a somewhat seedy fringe of the city's economic
life. This six-block area can be divided into two sections. Farthest
from the Bay is a mixed residential and commercial area whose resi-
dents are largely elderly persons living in the many small boarding
houses. Closer to the Bay is a much more blighted section, with
large numbers of hotels and bars catering to single'men. Together
these two sections account for ten percent of the individual male
strongarm robberies, six percent of the individual male armed rob-
beries, and a total of nine percent of all individual male robberies.
Over 43 percent'of the individual male robberies in the Prescott
area were armed, in contrast to a city-wide average of 36 percent,
and only 27 percent in the downtown skid row area. The Prescott
total was the highest of any census tract in the city.
In both areas the victims are often persons other than the resi-
dents. The Prescott neighborhood has a predominantly young, black
population, as shown in Table 19, while the'victims are largely young
wh~tes ... Many o.f them a~e llI'l9..Ollptedlyservic;:emen £~om the nearby
army base seeking to take advantage of the night life in the area.
The downtown area, on the other hand, has an older white population
but a very };lalanced victim breakdown. Black victims in the downtown !
area are much younger than the white victims and correspond in age
to the citywide average for robbery victims. Victims in both areas
are in the below 50'age group more often than the average for the
[Insert Table 19]
-45-
... 'f.;
"
o
,0 , \
Prescott
Central District
Table 19
Characteristics ,of Residents
Total Population
3,293
3,947
Percent, White
3.5
85.9
Median Age , Male'
19.7
52.6
Source: U.S. Department of Commerce, Bureau of the Census, U.S. Censuses of Population ~nd Housing 1960, Final Report PHC(1)-137, Census Tract, San Franc1sco-Oakland, California, Standard Metropolitan Statistical Area, Table P-l.
-46-

(, The fact that older males do not show up as victims in the
downtown skid row area as frequently as their proportion of the
population does not mean that these me~ are not the targets of
robberies in these areas. Rather this is a reflection of the pre
ponderance of victimization of nonresidents, and possibly of some
lack of reporting of crimes by derelicts and inhabitants.
other than these two major a~eas, only a few' areas 'contain
clusters of individual male robberies. One such cluster of in-
dividual male robberies is an area of small concentration about
the intersection of San Pablo Boulevard and MacArthur Freeway.
This area may be a reflection of the individual male robbery in
the nearby city of Emeryville where the conditions are similar to
those in the Prescott area (a rundown commercial strip development
containing many bars and saloons surrounded by old, dilapidated
houses). A second area of high individual male robbery is in the
Fruitvale district about the local commercial center of the neigh-
borhood, while a third area is located about an East Oakland com-
mercial district (at Ninety-eighth Avenue and East Fourteenth Street) .
II'. INDIVIDUAL MALE ROBBERY
The great majority, almost 75 percent, of the individual male
robberies occur in the open on a city street or sidewalk, as shown
in Table 20. Less than nine percent occurred indoors.
[Insert Table 20).
This high proportion of individual male robberies occurring on
city streets and sidewalks holds for each landuse type, as shown in
~~p........,.,.., ""', -4~F"""" 7~-~,·,~.~ ...... :w:;:: .. ·m:;:::·,;;;;;;;;;::; '!;':p' ~ ; I 1' ... 4 '-"~--~.'-'--':4..:-,
.';:" ;./~,-~t '.', ~:~
., <:, ... - .'
I
"
\
0,''', "
o
o
•
Table 20
Individual Male Robbery: Premise Type - __ of the Offense Site (In Percent)
Sidewalk
Street
,Parking lot
City park
Private yard
Apartment
Hotel
Bar - saloon
Gas station
Other (premises with less than 1% of Individual Male Robbery each)
Total (N=1960)
47.0
26.9
5.0
3.2
2.2
1.6
1.2
1.2
1.0
10.7
Armed (N-7l0)
48.9
21.7
6.9
3.3
1.3
2.3
, 1.1
1.7
1.4
11.4
Strongarm (N=1250)
45.8
29.6
4.0
3.2
2.6
1.3
1.1
1.0
0.7
10.:4
Not7:. Only p,remise types which accounted Ind1v1dual Male Robbery were included. fOL one percent or more of
-48-
" ,
,

/
Table 21.
[Insert Table 21]
Over 35 percent of the individual male robberies occur in
commercial landuse areas. This is far more than that for any
other landuse type, as shown in Tables 22 and 23. Both strongarm
and armed robbery are highest in commercial landuse areas, while
both occur in moderate levels in industrial and high density
residential landuse areas.
[Insert Tables 2.2 and 23]
While there thus appears to be some correspondenc:e between
commercial areas and the incidence of individual male robberies,
this focus appears to be more dependent upon the nature of the
commercial area tlj;\n its mere existence. Fringe-type night life
and skid row type activities appear to some extent to be spread in
little pockets, with each poverty area of the city containing its
own such ~rea. The relative frequency of individual male robberies
in the commercial areas of the poverty neighborhoods suggests a
relationship between individual male robbery and such areas.
This relationship between fringe-type night life and individual
male robbery is visible to a substantial extent in the times that
individual male robberies occur. Sixty-eight percent of these
offenses occur in the evening hours between six p.m. and two a.m.,
as shown in 'Figure 1. While the peak periods for the two types of
individual male robbery differ, both increase greatly at eight
p.m. and continue to increase until one a.m., The increase in armed
.. ",
C)
"
" ' o .') , .11 ,
. Wi!: . en
I • I,
Landuse
Table 21
Individual Male Robbery: Street Premise Compared with Landuse of Occurrence
(In Percent)
All Street Premise P remise Types
Commercial
Low medium density residential
Medium density residential
High density residential
Industrial
Freeway
Government or institution
Low density residential
Park
Vacant
No information
P1
-50-
35.5
10.4
13.3
15.8
6.0
3.5
1.2
1.1
0.8
0.4
12.0
35.4
10.2
12.8
15.4
5.7
3.3
1.4
0.9
0.2
0.4
13.2 ;. ,

If )~i
;1 ~'; l~ "
iL .{
~ fl
I
r:; ,~,:.
C" , J'
Table 22
1 Robbery : Landuseof O'ccurrence ' Individual Ma' e _ (In percent)
Total Armed Strongarm (N=699) (N=1250) (N=1968)
Commercial 35.5 31.1 37.9
Low medium density residential 10.1 9.4 10.4
Medi um densi ty residential 12.7 14.9 11. 3
High density residential 15.5 18.9 15.3
Low density residential 1.0 1.0 1.0
Industrial 5.7 6~3 5.4
Freeway 3.4 3.7 . 3.2
Government or institution 1.4 1.3 1.4
Park 1.2 1.7 0.9
Vacant 0.5 0.8 0.4
No information 13.2 13.8 12.8
100.0 100.0 100.0
-51-
.j! ;. F. \. ~.... . . ,
--~--~~- ~'--"
. }
' .
"
,\,
"
/. ,I
o Table 23
Indi vidu;a'l' Male Robbery Sites
Number of Robberies per Grid Square of Landuse
Total Armed Strong arm Commercial
1.18 0.36 0.79 High density residential 0.47 0.17 0.30 Medium density 'residential
0.20 0.08 0.11 Low medium density residential 0~13 0.04 0.08 All residential (combined) 0.17 0.06 0.10 Industrial
0.34 0.13 0.20 Government or ins·titution . 0.11 0.03 0.07 Freeway
0.17 0.07 0.10 Park
0.04 0.02 0.02 () Vacant 0.02 0.01 0.01
o
-52-
--------_.- - -
. . '
'-
I. :
"
~,
"
:1
....... '
. . ",
1.1 : . . . ,
- -.-------
individual male robberies during the evening hours is much more
~ constant than that of strongarm robberies. In addition, the per
centage of strongarm robberies drops sharply at'~idnight and does
not surpass'armed robbery until two a.m •
()
o
[Insert Figure 1]
These times of peak concentration vary to some extent by season,
as shown in Figure 2. Individual male robbery is the only type of
robbery with a relatively high percent of 'robbery during the summer,
as shown in Figures 2 and 3. Commercial and indiyidual female rob
beries are high in both the fall-winter and summer periods.
[Insert Figures 2 and 31
The influence of darkness can be seen in both the summer and
the winter months, as shown in Figure 4. In August dusk comes
around nine p.m.; in December around six p.m. In both months there
is a sharp increase in robbery between the hour before sunset and
the hour of sunset. The change between AU9ust and December in the
hour in which this evening increase takes place strongly suggests
a connection between dusk and individual male robbe.ry rather than a
connection with the end of the working day.
[Insert Figure 4]
The duration of the period of high robbery, however, seems to
be connected more to an evening recreation cycle, as the period ends
-53-

,-
"
,(
"
" 0
(;
~,.
" l\ .\.\
.. :' ..
\,~ '.\;-.
;;':; '::~
~~
: .-
c
." ~
"-
;~
,j I
II 11 11 H \1 ,ij J!
I.','"
11 Ii j
I j
1 !
*\
I 1 !
~ IJ II .
," I,
I)~
p 1/
e I
r 9
__ ~l __
Armed . Robbery c - - --- Strongarm Robbery
I -8 -"- Average 01 ~
e I
n 7
t t.
l' . -. ~-.
I
o Figure 1
Individual Male Robbery By
Time of Day of Offense
.- ... - . --I
I
...1
__ .J
I
J J
I I I L __
-., I I I ,
I
L -I
1- -L
~~--<,--,a---~--__ +----4~---r--~+---~I----~----+---~----~----+----4~--~----+----4~--~----~----r----+----+-----~--~~ .s (. ! e f/ 10 /I II- 1.3 I ~ 1..5 / ~ / 7 /8 I 9 1 3 5
Time of Day
~~
~,'1- .,
t) . 'I'
" I
,
, r"
'"
I \
~\ 'I ? l , , 1
, I , ! '<I :1 'I
il ~
12- ~ i j
/I \ [\
10 !1 M
IJ , !
g
~
" 5
If \,
3 \ . "
" >, ~ .,
t
~ .'.
-,

c .... _ ....
f I' i I
I
j /1 fl I,
It i'
11 If l i P lfl ( \ ~1
\\ ),
Ii e q '/
n r 1 8 - . -
c 7
e - - - - 1 I
,....- -- -n ~ L -- --t 5
I U1 U1 Sf I
3 ,
;/ "
~ ~
~ .' ,
1 0 / ", 'I Jan. Feb. Mar.
,-
I.'.J ,
I -
:' ..
-.. -.;.,... -'
1 .1 , '.
C) Figure 2
Individual Male Robbery By
Month of Offense I
-!- - - ------ - - - - -- - ; " - r-- - . .r - - - -r
r - - - -, I
I I I
I I I I I I r- - -
~
Apr. May June July Aug. Sept.
-- ,Armed Robbery
- - - 'Strongarm Robbery
-, ,- Average
'/
/
It
r - - - - r-- - -I
II
I I 10 I
I I I
9 L- l-- - ,
~
l - - - -J 8
1-
~
" 1/
1
/.,
act. N(')v. Dec.
i ,
\ ~ 1\ il
.1 . 1 f
f.f " \/ ~
Ii jj " Ii
J ! !
i
fl Ii J j
i ,. I
! I
\
i'
"
"
\ \
--~~~~--
. ,

. 1 .
"
---------------------------~----~----------------------------------=-=~~ ~--~~--~.. r
J 0 Fi~re 3 0 ,h II I
1
1 ~ II
I I
I 111 0'\ I
p
e
r
c
e
n
t
II
10
9
e
7
b
.5
.4
\ , . \ , .
\ ... ... ' . ..... . t,6 •
Month of Robbery
Individual Male Robbery Individual Female Robbery Commercial Robbery
I
I --- .../
, I
I I
I
" , , I / . ,
/
Jan. Feb.Mar.Apr.May Jun.J'ul.Aug.Sep.Oct.Nov.Dec .
. j-"' .. -,,---,.......-----=-=.,.=.~.,------..---"T"""=-<-~ .. ---~,.=---:-----~---.-----~------:'--o' ' e'
'.. (I
, , .-
--------------------_~4~
.,
,
"
1;
Jl . J ,
'b ((

! j!
•
r ,',
"
, "
, '
/
.. '.~' .Ii
"
'" /'. -- '
, "
I 1
I
!
t1
li "
oj
p
e
r
c
e
n
t
I 11l -.J I
p
e
r
c
e
n
t
1(,
11.
10
8
,</
/1
8
"
Total Individual Male
Robbery
Dec. (224)
Aug. (201)
-~~--,-,,- -----~--- ------------~ -------------
4
Individual Male Robbery by Time of Day For August and December 1966-68
~ --I
I I
I .. --I.._!
p
e
August
Armed (82)
Strongarm (119) r l-i
I
'c I.
e
n 11. , December
-_ .. Armed (83)
Strongarm (14l) t , --, __ ..! I
!..J
r -. I
---t
:' • .!
-'I I
7 i q /(1 II IZ. l.f 1"/ IS 16 1118 1'I.tI.2I.a..v ~"f I
Time of Day 7 6 9 1(1 " ":1. IS N 1'5 I" 17 IS 19.:1.'" .c.I A[1:l.!1 Ali 1 :t.
Armed
-,
Dec.
Aug.
# 7 •
( 83)
(8~)
Time of Day
.. -• , __ 1
I • I I
L.l
rai! I.--
.. _.J
I I
'--t
p
e
r
c
-, e
n
I
,'-
/D
8
7
Time of Day
Strongarm Robbery
Dec.
Aug.
( 141)
( 119) r-i ; .
~-1 --T
• I __ oJ
• • : : . I, --.I
· • I
I I' ------of .. --4
9 9 It> /1 /.:1. " N IS /6 n 19 (9 ~ pJ -z..Z.. :z.J:z.~ /
Time of Day
:2.. 3
~q ~~. ~------------------------------~~~~.'~-------~~~----------~=-~--~------~~--~----------~--~------~~ ~::.~e.."'~~"''''''''=-'''''''''_''''''_''', "'1~"""""~~",,e'''A~+'':\~'''''- A
,.0
~ / ... ~
.<' "
'I
' ....
.- /
,
...
.. '
,

------,--------, __ ",T ~
r
/ '" .'
,r
'.
, '
'. "
\ : .0 " ,
"
/
()
o
about the same hour of the day for both months. The August high
robbery time period is thus shorter, starting at nine p.m. and
ending at two a.m., while the December period starts at six p.m.
and ends at the same time. Because the August period is shorter,
it might be supposed that this would mean fewer overall robberies.
This is not true, however. Both months are about the same. The
August evening peaks, however are higher than those for December.
In both months the early darkness periods have a much higher
rate of armed than strongarm robbery, while the period after midnight
has a higher rate for strongarm than for armed. The trend toward
armed robberies in the early evening hours is much stronger in
August than in December.
There does not appear to be very much variation in age between
armed and strongarm individual male robbery victims. Twenty-one
to 30 year olds are somewhat more frequently encountered in armed
robberies, while victims between 51 and 60 years of age make up a
higher proportion 'of strongarm robberies, as shown in Figure 5~
[Insert Figure 5]
White victims are involved in over 75 percent of the individual
male robberies, as shown in Figure 6. Over half of these white vic-
tims are over 40 years of age. For this over 40 age group the per-
cent age involved in armed and strongarm offenses is nearly equal for
each age grouping. The 11 to 20 age group (mostly late teens),
however, includes a much larger percentage of strongarm robbery
victims while the 21 to 30 age group has a much larger percentage
of armed robberies.
-58-
. ,

. __ ....
, ,
/ ;-., . \
'. .,
/.
.. " ""
"'"--....
" , . 1. f .• .-
I
, I
j
j
. ."
I U1 1.0 I
~-- .. ...-;t:'*#~
, ,.
o
p
e II f.
r Ib
c pi
e
n /()
t
8
.r
-~,-------.-
-----....:.----------------------------------.-----------=---..
Armed and Strongarm
~::.
.. . .
Age
o Figure 5
Individual Male Robbery By
Age of Victim
p ~o
e If
r ... r-1
c 1'1
e 11
n to
t
I
,
A 1/
I .~: • ~ . D
,t
Total
l I
Age
___ ~~~-__ "'7'!"-----'r~~~7'--""'"'"'=""'--~-'-'-p ... -------~----. ~.-.---'-... -~ • I, -,"'~ •
i ,
.. I ,r"
('. r\..j
_~ ___ --n
,
\ /
, I I
-

[Insert Figure 6]
The pattern for black victims is considerably different, as
shown in Figures 7 and 8. The black victims are slightly younger,
and there are differences in the percentage involved in armed and
strongarm robberies. The very young males, 11 to 20 years, and the
middle aged males, 41 to 50 years, are high in strongar~ victimiza-
tion while the 21 to 40 age groupings show a high proportion of
armed robbery victims.
[Insert 'Figures 7 and 8]
III. INDIVIDUAL FEMALE ROBBERY
While individual male robberies occur in only 15 percent of
the city grid squares, individual female robberies spread over 20
percent. The two types are nearly equal, however, in the proportion ,.
of robberies occurring in grid squares with only one offense--63
percent for individual male and 61 percent for individual female.
Roughly two percent (2.1) of the grid squares with at least one
individual male offense contain nine or more robberies. In con-
trast, only a small proportion ,(0.7 percent) of the grid squares
with individual female robberies havE:! more than nine.offenses and
none hav,e more than 20, as shown in Table 17.
Not only are' the individual male robberies clu,stered about the
major \hOroughfare streets more than are the individual female rob
beries but they are also much more heavily concentrated in the
northern" third of the city; 56 percent of the :tndividual male
-60 ...
c _. _.. ..~,-.,-~--.. -..
-_ .. _----......,.".= :,
o Q)
..jJ • .-1 ..c: :?;
,
o
0 $.l tJ'I Q) Z I'"
. ,
"
"
, . 0-. " ,
I ".,~
Q) Q) ..jJ
..jJ • .-1 • .-1 ..c: ..c: !3:
~
I"
•
I .
0 !o-I tJ'I Q) 0 Z !o-I
tJ'I Q)
Z . ,.
s:: ~ s:: cu cu
f \
u u U • .-1 !o-I .r-! !o-I • .-1 ,I:>
X Q) x' Q) x Q)..c:: Q) ..c:: Q) !o-I ~..jJ ::E: ..jJ ~ Q)
0 0 ..c:: ..jJ
n n
-61 ...
"

F p :1>1
e :lo
:c
c I"
e I~
n 8
t 1/
P ;lA
e ;to
r ,I.
c
e 12
n 8
t ~
Figure 7
Individual Male Robbery
White
'~/D I/~ ;ID
, 47-_ ,
Armed Victims Strongarm Victims
"--¥" ';/~S7J II-~ ,,-'1r,> Age
Negro
1-/0
~ I , , \ , , , , ,
I , , ,
\ '
\
., , '" ...
, r ,
\
\
\ \
- Armed Victims Strongarm Victims
Age
-62-
o
I; ._-o-_____ ~-':---~~.'<r'. -~ __ ._
'" ~~~!~';: ~' * "6 '
'. fl\)~'.'C .. _ .. C<""
GI
71+
:", :=;~': 'ft /:{.l
,+
u
.:
,.
::)
o
\
(J
/'
p
e
r
c
e
n
t
p
e
r
c
e
Figure 8
Individual Male Robbery
Armed ;/f
:II}
" I~
\ \ \
, .. -.... , \ g
-White V;i.ctims (~=57l) '\ ·if --Negro Victims (N=153) \
" /-/0 II-Ji) .t/~$O .tl· "10 J{/-;;O .n.,-" ~-70 7/T
Age
Strongarm
.1.4{
.10
If"
12.
" , , . , , , \
I , I , ~
" ,
, , \ ,
'\ , \
--Whi te Victims (N=105 3)\ --Negro Victims (N=200) '.
• I If,
//-20 21·~O JI-VO ~ • .ro oS"l-w, iJ,1-7o 7~i
Age
. !

c robberies being in this area as compared with only 41 percent of
7 the individual female robberies.
Moreover, the areas of concentration for male robberies are
all but void of female robberies. This is especially true of the
Prescott neighborhood where there are only 15 individual female
robberies in contrast to 220 individual male robberies. In the
downtown skid row area there were 28 inCli~idual female robberies
as compared with 159 individual mai~robberies.
Somewhat surprisingly the major downtown shopping districts
are also not areas of fi.·equent i.ndividual female robbery. Rates'
are quite low for the prime commercial centers of the Kaiser Center
area--Broadway to Lake Merritt, Twentieth to West Grand Avenue-
and the older shopping corridor of Broadway-":"Twelfth to Seventeenth
Streets.
On the northeast side of the core shopping strip, however,
there is something of a concentration of individual female rob,..
beries. (See Map 9.) This is an area of mixed landuse and has a
large number of commercial and service establishments, government
office buildings and some hotels and large, older homes which cater
to elderly persons. There are also a number of open parking lotis
which attract shoppers and employees of the cor7 ar~a buildings.
Census tract 19 approximatJs this area of intense indivldual female
robberies. As may be seen in Table 24, this census t~act, which
contains only 20 grid squares, accounts for 4.5 percent of the in-
dividual female offense§. '"
[Insert Table 24 and J-1ap 9]
, -64-
p;~ 1;,1r~~~: ~; ~~,~~<~~~'7l~' \! ... -, /::.' '.;,.
) ".
DO
,-,'
\' '1.
, ... '" o ..
------~?==---------------------
\ ,"
Table 24
Individual Female Robberies and Pursesnatches Percent of Offenses Per Grid Square in
High Census Tracts
-65-

, ,
I
'1',/
( \ .1
'. _D
,- . \"" ...... I"
., ,
"
/'
"
~-~- '----~--~~--~=--------------------------~-.,--~-------------~==>======'==---~ 'j
J n I' I , J I
11
1
QJ to Individual Female Robbery - 1966-1968
j ... : ...... , ................... , ........ :::::::.::::::::::::: ...... :: .. , ............................. , ......... , ......... , ........ , ......... , ......... , ................... , ................... , ............................. , ......... , .................... ' ............................. , ............... - ........... ,-.. ~---,--,-,;--r--l
I .. ::~r····-······· ···1.- ... _ ........... _........ . ....... _ ............. _.................... /1
I ..... ...: ............................... .. . , ................ Oakland H;lls ... .................. .. ........ ''''j'
.... ~~kland Hills ............................. .. I ! ........ . =: ..... .1 ........... :- I I I ,I · .. ·· .. · .............. 1 I I ........ , .... 1
I ~ '.. ....... . .. /. ,., ...... . I ~ I ;p.,,~ ,... .. ..... __ ... _ ... _ , , i Q ... /·.:;·.B =-= \. ~'y",,>-"">- .•. " I. .'.: 0'0(;. I Berkeley:::: .... : :.:::.,/ Pi .. e .... d ... m ... ~~.~ .......... ·•. . .1~: I ~cY'" .•. l .' . . ......... "', . ~ 'l~ :'" •• '.: ." • .. ........ II jCi.6.<o : ................... : ":.:, ............. . . '. :. '.. . . . . "II
Q) '. .' '.. ..
'I' ,., .......... ,.::> \ . ...... . . . .. '~4t1J I 'Em:.ry ville ...... /' ,
, .,;.. ,
, ::.::>--11 .. :.: .............................. _._ ......... ,/ ... _. . .... -.. , ........ -................. - \.. I I .' .... 1. 1 ./ ... :.~~.::.Leandro I I . . San Francisco ~a.y ............ .. ......... : I' ). .l/1 Army , . " : .. ' :Base I ........ :.;r " :: ........... : : j
I l /. i I i L r·l· .. ·· .. ··· .. · .... · .. ··· ....... :, ~.:: ,. I :.L~ava .......... . . ·· .. ··S·UPPly .. ' ...... ii-:ilfJll:.. ~l~...................... .:: ... . I '.' .. ' '::-":=::. .. ..................... _"'_........... ..... I
/! j .•. cen~~:"~~~~:·"·I~· 0 ~ ~ ...... --.. --.. _ .... __ ....... __ ._ ..... ~.. I,' I
..........................
L ... _, ......................................................................................... , ......... , ......... , .................. , ........................................................................ : ..................................... , ......... , ......... , .............................................. _ .................... , ......... , ..... _.-._.1 ......• ) ~JJ -=-""""' ___ "" ...... =-_''''''~~ ... , """""""'"'!" ___ ... .., _____ .... _. ___ ...... __ • _______________ ~_---.,-_-_."., ," ,"""""",. '-~",'- " / • .~:. ' .""-""!' ~ijW , '0 (]
~ • /' u-
" 11 ,~
• • y
" .,
\
"
, .
,
,) ..
, ,
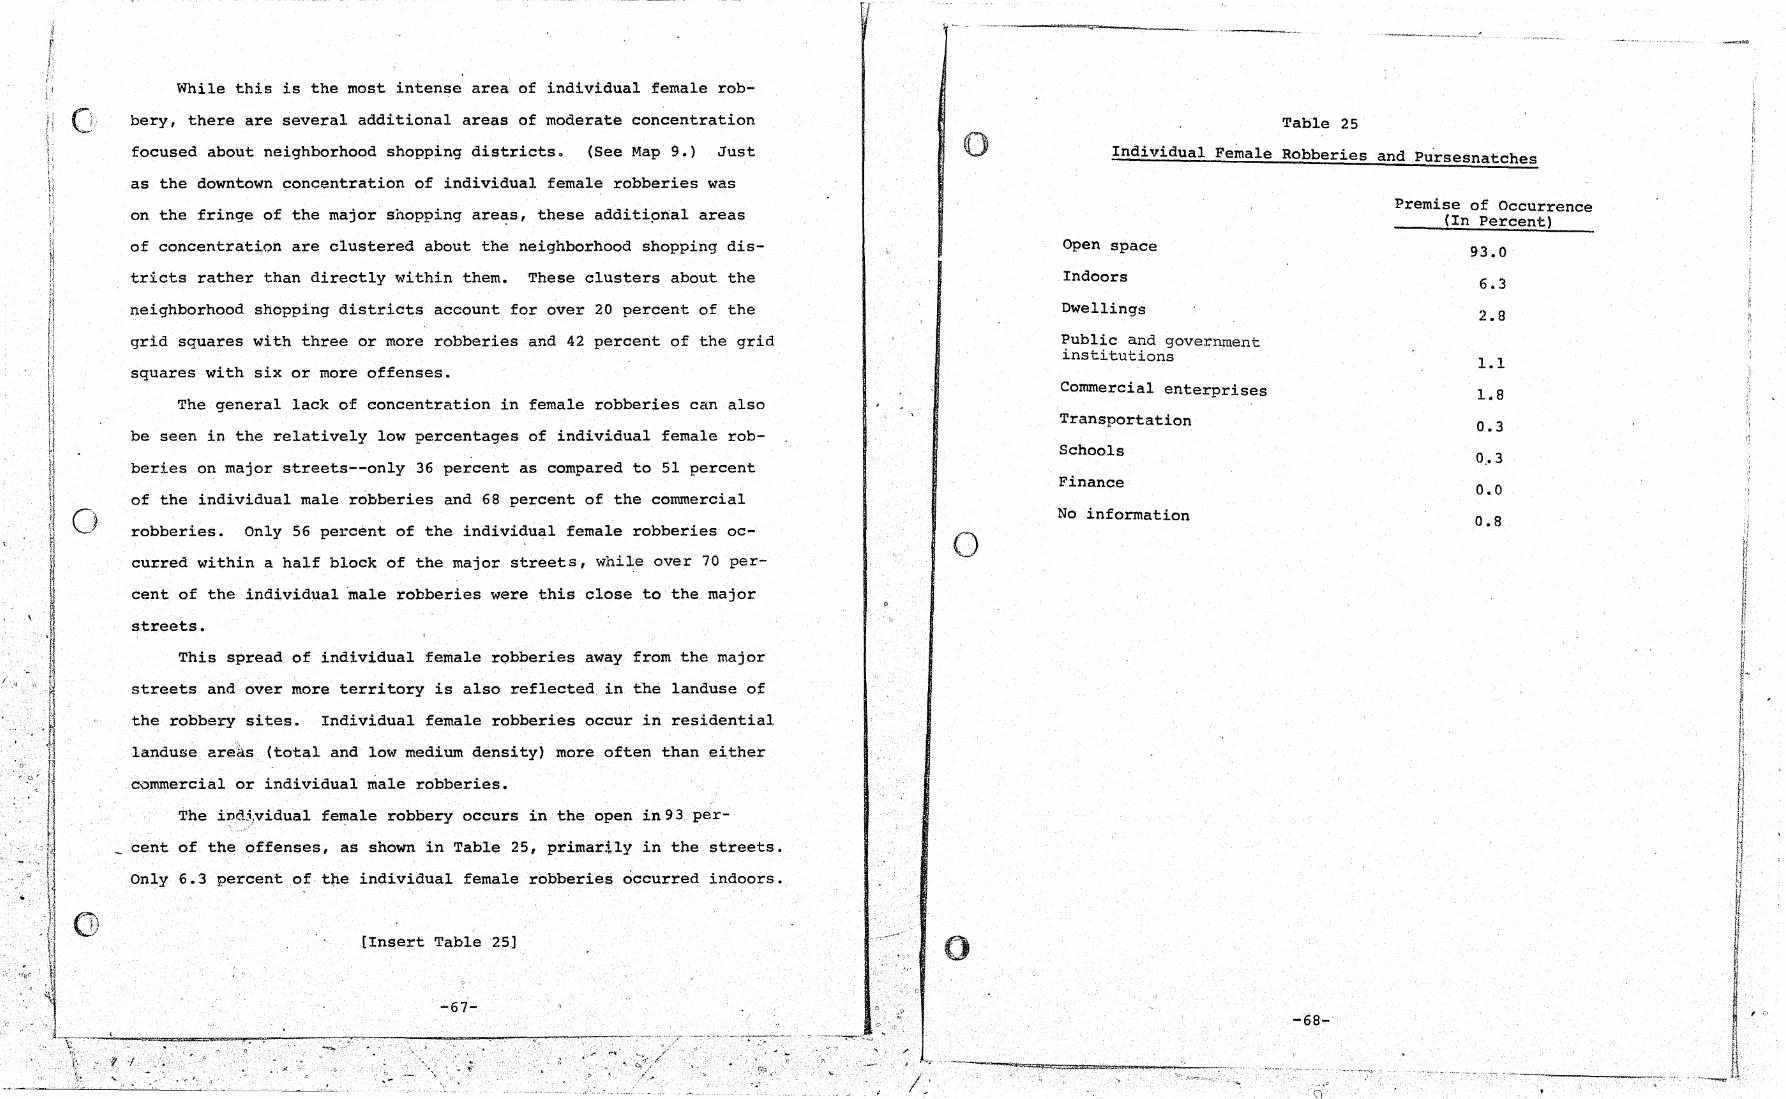
While this is the most intense area of individual female rob-
r C' , "'! bery, there are several additional areas of moderate concentration
focused about neighborhood shopping districtsQ (See Map 9.) Just
as the downtown concentration of individual female robberies was
on the fringe of the major shopping areas, these additional areas , .
of concentration are clustered about the neighborhood shopping dis-
tricts rather than directly within them. These clusters about the
neighborhood shopping districts account for over 20 percent of the
grid squares with three or more robberies and 42 percent of the grid
squares with six or more offenses.
The general lack of concentration in female robberies can also
be seen in the relatively low percentages of individual female rob-
beries on major streets--on1y 36 percent as compared to 51 percent
of the individual male robberies and 68 percent of the commercial
robberies. Only 56 percent of the individual female robberies oc-,. curred within a half block of the major streets, while over 70 per-
cent of the individual 'male robberies were this close to the major
streets.
This spread of individual female rc;>bberies away from the major
streets and over more territory is also reflected in the 1anduse of
the robbery sites. Individual female robberies occur in residential "' II
landuse areas (total and low medium density) more often than either
commercial or individual male robberies.
The i~djlvidua1 fe Il1a1e robbery occurs in the open in 93. per-"
cent of the offenses, as shown in Table 25, primarily in the streets.
Only 6.3 percent of, the individual female robberies occurred indoors.
[In~ert Table 25]
-67-
- ____ '_-;:;I:'=~. . . ~ _~""""'''''? .. :-''!'~-' -----;::-ro, ;;"'_'~" -,-.---_._. ____ ,.-.~..,.., Z'"."..,:-.....,..,~ ... ";'lof,".... . J,
.' .", .
[,1
o
o
o
/~'
Table 25
Individual Female Robberies and Pursesnatches
Open space
Indoors
Dwellings
Public and government institutions
Commercial enterprises
Transportation
Schools
Finance
No information
-68-
Premise of Occurrence (In Percent)
93.0
6.3
2.8
1.1
1.8
0.3
0,.3
0.0
0.8
.' .. '
i..
• "I
/ . ,
. . . /
'.
/ o
, .,~~; ':,
, .
o !)'
. . . . ":" . .-
- . I :; ....
".
i' ;1
The most vulnerable hpurs for individual female victims are
o from one p.m. to ten p.m., as shown in Figure 9. This includes
the prime shopping hours for both the daytime and the evening.
C)
o
[Insert Figure 9]
These offenses' are concentrated in the winter and fall months,
as shown in Figure 3 above. The decrease in robberies during the
summer and spring may be due in part to increased daylight but is
probably related to the decline in shopping activity aft.er the
Christmas season as well.
The concentration of individual female robberies about the
shopping distripts along with the occurrence ot individual female
robberies during the shopping hours and in the open, on the street
suggests a strong connection be~ween journey from wor~ or shop
ping in core areas to parking on or exiting from the fringes of
these areas as a situation of vulnerability. The increased number
of individual female robberies during the months of November and
December may well result from the combination of the increase in
evening shopping due to the Christmas season and the cover of
darkness for the robbery offender due to the early nightfall
during ,this period. Elderly white women appear to be particularly
vulnerable to this kind of victimization .
Of special note is a small concentration of individual female
robberies in an area of low density in the Elmhurst section along
East Fourteenth street in the southern portion of the city. The
robberies in this area cluster in two distinct groups, one centering
upon the location'of several public housing projects and the other
-69-

.;;:.::
,
,;.
"
..
. Q
Q
I " I
Y: ,fl o
J ij II '~
] i i
'/ , :j
\ 11 fl Ii
Ii
"q.
,0
.~
IZ,
p 10
e 8
r ..
c
'i e
n ~
t 5
I -..J 0 I
11 p
e 10
r 8
C ~
e J/
n ~
t
f,\
o o Figure 9
Individual Female Robbery
Total
,r-J
I , 7 q '" II 12. 13 ,.,
Strongarm
tf la /I lot I~ If IS" I" 11 IP Itt :<0 ~I ~1. .u :Z:,/ I
Time of Day
.@ ,
, . .~
I
IS
By Time of Day
I
I J
I I
l I" 17 18 Ilf
Time of Day
p f~ Purse snatch
e
r
c
t
I' "
10
8
" 1/
I I I I I I I I I I I I , I
g 'f 10 (I I;L 15' N IS- I~ 17 /..P I? ::l.O ;2/ .u. ~~ 2'1
Time of Day
\
" ii
'"
I \ t
"1& 'I
" \
J i
H
II ~ 1\ ;/
~
"
I lTd C'
j \)
l
~ '~, \ \"
~l " ,
. , , ....,

.'
\ :
..
, ' . .. ..., .,,~
(\
'0 ~-c
'" td "
~ a
.' .,0
o
8 .. ',.,;\
" IJ n' Q
1/
/
a minor commercial area serving the surrounding neighborhood. Rob
beries from these two areas spread into the residential neighbor
hoods toward the Bay but not into the neighborhoods going away
from the Bay. The area going toward the Bay combines a high con~
centration of young black families and a much lower concentration
of older whites, and is the only area of high individual female 8·
robbery and high black residential population in the city. other
areas of the city with high black populations have only a moderate
amount of individual female robbery. In addition, nowhere else in
the city is .. there .any sizeable number of individual. female robberies
in an area of low density residential landuse.
-71-
___ .....-.-_. it" ~->-;-·-'1t .. -0 -, ......;......-'~~-:.~'""'~,,-. --::it:--~:----""' .. ,-, ,-.-,:,-, .. ~:,,~. .., " /~ ,.. ":'"
)./.'"
"
f)
"
• 1
~I '
/ ' I, ,
o
--------~ - -- --~-
-------.~---- -----
Chapter Five
A CQMPARISON WITH SOME EARLIER RESEARCH
A. The Ring Theory
Perhaps the most important single work in the field of crime
area studies is that of Clifford R. Shaw and. Henry D. McKay on 9
Chicago in the 1920's and 30's. The general purpose of their
work was to describe the ecological relationships between the re
sidence of an offender and the physical form of the urban area. In
their very ambitious Chicago study, Shaw and McKay collected data
on eight groups of individuals including 51,859 male school truants,
43,298 juvenile del:inquents, and 7,541 adult offenders and studied
their activities dUl':ing the period from 1900 to 1927. For each
individual offender the home address, offense, age, sex, and other
<=) items were collected. Each offender's residence was plotted on a
map. Then ratios of offenders to total population of similar age
and sex were calculated and mapped for specific areas of the city,
census tracts, and Dquare mile areas. The distributions were fit
to E.W. Burgess' theory of radial expansion, which suggests that a
city expands radially from its center, forming a series of concen
tric zones. This theory was based upon studies of urban growth in
the Chicago area and describes five basic zones for this city. They
are in order from the center outwards:
"ea) an inner central business district; (b) a trans-i tion zone surrounding t:he central business district: with residential areas being 'invaded' by business and industry from the inner core; (c) a working-class residential di$tricti (d) a zone of better residences with single-family dwellings; and ee) an outer zone of commuting with ,suburban areas and satellite'cities. n 10
o This theory as applied to delinquency was accepted as being .. in the
-72~
'.' "I.I

· -~- -~ ---~----~--- --- --~~
main correct as far as the city of Chicago is concei'ned." The
data was analyzed by square .mile areas, concentric zones, and radial
lines of gradient, all centering on the Chicago' Loop. Map lO.is an
example of the type of maps used in their analysis.
[Insert Map 10]
The Shaw and McKay study concluded that:
1. "There are marked variations in the rate of school truants, juvenile delinquents, and adult criminals between different areas in Chicago."
2. IIRates of truancy, delinquency, and adult crime tend to vary inversely in proportion to the distance from the center of the city."
3. There is a "marked similarity in the distribution of truants, juvenile delinquents, and adult criminals in the city."
4. "The difference in rates of truancy, delinquency, and crime reflect differences in qommunity backgrounds."
5. ' "The main high rate areas of the city ••• have been characterized by high rates over a long period."
CI
6. "The rate of recidivism varies directly with the rate of .. indi vidual delinquents atld inversely with the distance from the center of the city.n ll
These' conclusions were interpreted into gene:r:al theories. Shaw
and McKay theorized that dl3linquency was related to the si tuati'ons
resulting from city growth, since (a) the highest rat~s of delinquency iJ;~~...:
-"
were found in areas adjacent to the central business district and
large industrial-centers; (b) these areas were found to be in a pro
cess of transi tionfrom residential areas to ,areas of business and
industry; and (c) -these areas were characterized by physical deterio
ration, decreasing population, and disintegration of conventional ,~'
culture. They also~'theorized that with the disinte9ration of the
-73-
o
\ w
()
IJ
.'
1-
Source:
o
-------------,----
Map 10
Ring Pattern of Delinquency Rates
Zone Map III
MAP OF CHICAGO
- - -...:;::;::,,~ .. ,. C.R. Shaw and H 7D. I:'1cKa:(, Delinquency Areas: A Study of th7 Geogr~ph~c D~str~bution of School Truants Juv7n~1e De1u:quen~s ,,~nd Adu1 t Offenders in Chi~a 0
~~h~cago: Un~ve:r;:s~ty of Chicago Press', 1929). 9
-74-
E
D
"

C~j '-
/
~--------.-.-,....,...,..----~----------------------------.~--
community as a unit of social control in such areas, the resistance
to delinquent and criminal patterns continually weakens until the , 12
attitudes and behavior of delinquency become accepted.
The studies of Shaw and McKay did not distinguiSh crime patterns
by type of crime. Their analysis of patterns ","as based upon the resi-
dences of all juveniles and adults coming before the courts i,n the
study period. The analysis consequently says little about either
the distribution of special kinds of offenses or offenders such as
truants, felons, pickpockets or burglars. The specific distribution
of robbery was not discussed.
A more recent study by Calvin Schmid of seattle dealt with both 13
the location of offenses and the residence of the offender. The
distance from the center of the city for many of the individual
crime types were calculated, as shown in Figure, 10. While Schmid's
classifications of robbery are somewhat different from,those used in
the pres,ent study, there are many sirnilari ties between his results
and'the general pattern of robbery in ?akland.
[Insert Figure 10]
The city of Oakland has, like the' cities studied by Shaw and
l-1cKay and Schmid, had a growth pattern that has generally moved out-
ward in a series of expanding circles--starting with the Bay but with , .
a severe distortion due to the older, denser, more urban city ,in the
northern area in contrast to the lower density, suburban nature of
the southern area.
-75-: c/'
" ... ------.-'~-ii'..,..---c........,.----, ......... -.... ~..".-,--""',.'--,..--
\' ... :,~ //, II.
\
'.
[, I,
o
o
Source:
Figure 10
ir=~~~=~~~=====:!'·!!!1C~'!i?S_-~·~"~·=!!"!i::!'!~!!:'~~.!!1!-~,~~_~. __ ~ __ ~_~
CRIME GR'ADIE'NTS~ OFFENSES'· SEATTLE: 1949 -1951
z 0
~ oJ
~ (J Q,
0 0 0 ci 2 u: ... .. '" ~ '"
z a
OJ
.~ 1,0.0.0.0.
5 .. a .. o
" o ci 2
~ w
~
e-",,-:--r:.=.r~-r-....-,= 1,0.00.0
\{T~V
\:"1-]~1 z a S oJ
~ a Q,
a o o <S 2
IS ... ~ 0..1 E=--r--+--+-f-li-
· . .t,~~~ '... '\
I , R~SIt>s:NCt
10.0,0 I II 1lI & ll: Jl:t ZONE
1.:00;;======.=_-;.-..-=--;_.... . ~_ ... .;.;;.-
1.0. I n
0.1 I It
Calvin Schmid, Urban Crime Areas, Part II, American Sociological Review, XXV, 10 (1960), p. 664.
)
-76-
;.l /
""~~-="'~""-;"."'" .-~-----, ~,~. ' .. ~~(

I
. "
If allowance is made for this distortion, however, the re-
suIting gradients for robbery for Oakland are very similar to Schmid's
for Seattle--with commercial and male individual robbery decreasing
sharply from the commercial heart of the city to the suburban fringe,
while individual female robbery occurs in both the commercial center
of the city and the midland area of the city with very lit,tle oc
curring in the low density residential areas.
B. Central District
The Schmid study of Seattle also included a more detailed
analysis of crime in the core area of the city. This area was found
to contain 15.5 percent of the population, 47 percent of the offenses
known to the police, and 60 percent of the arrestees for the study 14
periods of 1949-l9~1 for the offenses and 1950-1951 for arrestees.
The proportion of robbery in this area, however, was only 16 per
cent for highway robbery, 8 percent for nonresidential robbery, 20
percent for residential and 26 percent for other kinds.
The percentage .of the city IS total robbery .offenses was almost
the same in the skid row area as in the central business district, as
shown in Table 26. The skid row area, however, had only two-thirds
of the population of the central business district and only one
third of the area. Pursesnatch was the only robbery-type crime. ;that
was markedly less in the skid row area.
[Insert Table 26]
While the skid row-area contained fewer total offenses than the
central. business district, it accounted for the highest number of
-77-
o . " .... , ..
..
o
o , ,
/-I"."",
------==-~~-----------. -· _____ ~_·_~~w~ ___ ......... _w, ______ ... ~
Table 26
Offenses for the Central Business District and Skid Row Areas Seattle, 1949-~gl
(In Percent of Citywide Offenses for Each Crime)
Population
Area, square miles
Assault
Felonious homicide
Miscellaneous larceny
Shctplifting
Theft from persch
Check fraud
False impersonation
Bunco
Other fraud
Embezzlement
Burglar,t
Robbery, highway
Robbery, nonresidential
Pursesnatching
Robbery, residential
Other forms of robbery
Central Business District
5,189
.3
11
22
16
55
31
31
19
20
27
21
7
16
8
13
20
26
Skid Row
3,551
.1
15
15
5
3
20
3
18
8
25
2
5
16
5
5
19
22
Source: Calvin Schmid, Urban crime Areas, Part II, American Sociological Review, XXV, No·. 10 (1960), p. 658.
-78-

...
arrestees per 100,000 population for 24 of the 33 crime categories
'I) studied. In contrast with the pattern for offenses, however, rob\.~
o
bery was not one of the 24 categories for whioh arrests were con
centrated in the skid row area. Surprisingly, the arrest rate for
robbery in the central business district was more than twice that
of the skid row area, as shown in Table 27.
[Insert Table 27]
Distributional data for arrests is not included in this study.
The pattern of robbery offenses in the central district of Oakland
is, how~ver, similar to that found by Schmid. Because of the high
number of robberies in the Prescott area,' the density of robbery in
the central district is not the highest in the city. The dispersion
,pattern in the central district, however, is similar. Thus, the
grid squares of the central district with ten or more robberies
during thesttldy period are all considerably distant from the major
shopping areas, with the highest concentrations occurring in the
-,7 downtown skid row area, and in an area north of San Pablo Avenue and
east of Fourteenth Street.
The central business district-of Oakland is longitudinal in
shape, with a length of about 15 blocks. Havin,C') migrated from the
waterfront, its prosperity and condition var:y do great deal, partly
by age. Like the areas of concentration in seattle the areas of
concentration in Oakland are on the fringes., There is virtually no
robbery about the high class shopping and office area of the Kaiser
Center,. and .very little in the area south I.)f Broadway. Overall th~
robbery concentrations in the Oakland cenf.:.ral district, as may be .
JI ,\ i\ \\ -79-
".-~... . ~ t·.,. • ~ ..... ' ~.".
.. -.,' :::':~:( -
. '-
" Q
.- ;. +~ ••
.' .~
, I:
Or' :1 l
Table 27
Arrests for the Cent . Skid Row Areasr~!a~~~~ness District and
(In Percent of City Wid A e, 1950-1951 e rrests for Each Crime)
Assaul.t
Central Business District Skid Row
()
Felonious homicide
Petty larceny
. Automobile theft
Shoplifting
Ot~er forms of larceny
Bunco, confidence, swindling
Other forms of fraud
Burglary
Prostitution
Robbery
Sou~ce: C~lvin Schmid
8
10
11
4
9
13
7
19
4
14
16
16
16
18
1
20
29
31
4
7
9
7
SOc~ological R' I Urban Crime Areas Part II ev~ew, XXV, No. 10 (1960), p. 659. ' American
.... ao-
.'-. ...J.--:-_~~_"""""'_~_~~_. \":1' ~ ,. :q -~-':""""----.-- --'-
(1 .
,.

Map 11
Total Robbery - Downtown Oakland
o seen in Map 11, are very low when the three-year span of the data
is considert::d.
[Insert Map 11]
Nhen the distribution of the subtypes of robbery is considered,
there is a considexoable difference between the commercial and in-
dividual robbery patterns. The commercial robbery pattern, which is
sparser than the individual robbery pattern, concentrates in the
area between the "downtown" shopping districts, an and
area of many small shops and a lOWE~r level of activity than the , \
major downtown areas, as shown in Map 12. The shops in this area
appe.ar to be more vulnerable than those in the denSer shopping dis-
tricts. Individual robberies in this however, are quite low area,
as compared with other areas of the central district. The denser
areas comm~rcial activity, with large department stores and finer
shops, have a much lower commercial robbery rate.
[Insert Map 121
Individual robbery in the central business district parallels
the distribution of total robbery. Individual female robberies are
highest, however, in the more blighted areas below Thirteenth street
and in the commercial and office areas away from both the busy shop-
ping areas, shown in Map 13. Individual male robbery is highest as
in areas that have been left behind by progress, such as those with
old hotels, apartments and rooming houses, shg\m in Map 14. as
,
. I
o
o ·f····.····I~.-.• ~.&.2.' ••• + ••• -3.~ •• + ••• w4 •••. + •••• ~ •••• ~ •••• 6 •••• +. , . . .. ····.····H·~··.····9·····-···1··-··-·-·1···· I ~ . I i ~ · I, ••••• ' , t •• t,., • f , , • I ••••• t"., "" :::: I .......... .... :::: ! ~ I ! L """ mGIWTT" I l~ • 1 ."Xi I ! 1 ! "" .. t ••••••• ooooo I L "" ••• , •••••• 00000 I "" ......... "oooou L + • • ,. 00000 f •• i • II
I ' · ,. 00000 , , • , , 6 •••• OOUOU ,', ••
1 .... _____ ."n.+++. I 41 •••• ___ ._"','t'{>++++ t
•••••• -._""'+.+++ I •• I' _.-_., ""+++++ 4 I ::.:no XXXX !lHllH!lOUUUO~!!el1l! I
+1 c=:: x~XX !lHHII~OUUUOB6~" I ==== xxxx 5!1N~NnUUUO
I ..... ~ .. -.. ::&:rz ~~~~ !~!!!ou .••. , ~~~v ! I ••••• ---... • ••• I ..... ___ •• -. - ......... , .... I :; ...... R __ - _:::::::::::::: .... I I ..... NIIII"~ IINIU .. " .... I I ..... lll!~!ol8 "H~N 00000---·- ..... "., .... ..... :;
I ••••• tUHHH~ ~~»II uouuo ...... •• ••••• ,'.' ,',' •• ,. "',. t II uouou-···· •••••
+1 e~"t-Je .. -· .. • •••• ••••• I 8 e-----IIHIIN¥
I .~~~!I:3::::: O~fH'e·-···!UUUUt ••• ••••••• •••• ••••• •
J I,Jr.lDU ~e~ee·-·-·s"~».ti···'···" 0 ••• , ••••• t . . . . . .. . . . . . ...
6
• , • • • I
I
HMH~Ii"!lIIJjIlIlIlHHII '" ••• , '" 1 NNNM6NN~.IINII"5" i.'.' .. ",····· I
I IUlflt~IIIINIIIIIIIU!lIl" It." ..... ··· 411 .. , . , ~HH8HHNN!HXXXXX I
+ 1I~~~UHI,"MIIXXXXX"'" I II!HH!RHH~HXXXXX •••••
J
nHUHHHHHXXXXX 1"1 aaaa OOuU X~XXX •••• +UUOUU a==. OQUO .XXXx ••••• UUUUU •••• •••• oeLlU XXXXX+++++UOQUIJ ••• o. ••.. J
I aaa" ooUU XXXXX++ •• ·!JIJIlUU ........ .
f ", f xxxx>.+++++.+ .. ++ it ••••••• ,
! ".,. xxxxJC+++........... .,... t " , t x~·xx)..++++ • ., •••
xxxxx++ .+... " t It 1 ....... , nnr 1
I "". • l ::::: I 1 -1 tl51 •••.•• I •• I .......... 'd
1 t •••••••••• • •••••• ~. el" -. I ••••• ~.... • ••• , •••• ••• 1 t ••••• •••• .t*. I . . . . .. .... . " ... I ::::: ••••• ........ I 1 • • I ". •••••
1 <~: ••• - **.. I 9 ~,..... • • " ** ••• , : .. :: ..... I
...... ~ 9 •• I • , • I ..... .. I .. . .. , , .
t •••• , • I •• * • f .. I I .. * ! 1 ••• -••••• I-.-•• --.-z.~~- ••• -.l •• - •• -.-- _. ___ :*. . t " •• ·5· ... -~ •. o ___ ··6·· ..... + ... ···,····~··- .. Hc·· .. + .. ···9··· ... ·
••••••• a •• a •• ~ca ••••••••• & ••••• D.a=.aaa ••• ~ •• x.: •• =a. ···l··a·~·~··l···· ., •• ' •••••• ttl"'" _o_. __ .~~ •• _a ••••• +++ ••• +~+ .•• a •• ~ •• a.=aa# ••• =a.a=~vv.aas •••••• a22:.=c~a ••• a •••• 1 •••••• t.,."., •••• ___ c_ 3=~ •••• a= •••••• +.> ~~~~~XXXXX UOOOUUUUU ee8ee~e~e WMMNWMNNM ••• ' •• 1.1 •••••••• ' ""2"" ..... J ...... , •••• 4 •••••• ++5++++ X XX UOOOUUOUU oe~d~~~~e ~~~MNW~M. a •• II.lal f •••••••• """." ._. ___ ._l1li _:.aa:aa-::u •• +++++++++ ~~~X6XXXX UOQ07UUIJU ..,etHftft!t!etj IrUUU,-YY»IU' 11111*1811 ••••••••• ",." •• , a •• __ • ___ ' •• aa •• ~a ••••••• +. XXX~~XXXX~ unoOUUOUU eeBeeee"~ MMWMMNM.M all.,Ua •• ... a ... ~.~ .•... ~ .... ~ ......••..••. :1' •••••••••• x........ X X~ UOOOUOU~U e~~~e~eeb ~V~MMM.MW ••••••••• 1 . i 3 . . •• z •••••• ~= •• K ••• & •• az.aa.a •••••••••• az •• K.a •••
.. . A.. ~ . ·6 .7-8 9-10 1.1-20 21-5'0
[Insert ?~aps 13 & 14] NUmber of ~obberies in Grid Square
-82J..
-81-.' .. ~-'~--"r, --, .. , ... ,-------.-, .. ",.,----
"/(' I
r.

t.
, I,
r,j ~~I
iYiap
Commercial Robbery Downtown
II • ••••• r)n···.·-··l··~·.·wM·l_·_. _ .•.. G·~····.····6····+····,····.···· • •. • , ··········1·········2····.····3········· .. . t I I I • I 1 • I
} \ I I I t I
I I I • I I
• I I ... , I
I ::::, ~ ~ "'" f I .......... I I .......... I I .......... • I .......... I
+ I II • '" J .•• , •••• ! I .,tt, 1
3 : : : : : I
i .....! ! ::::: f II , ••• • f I ""...... :::: 4 I ::::::::::.... 1 ~I ."....... "" .... II I :::: .... +
! ".. t I I I ..... ~ 1 ""'" .. , 1 I , ...... ," 1 !o .......... , .. , I I ::::: : : :: ...... ,," ! ! ..... " I
6I1 ..... ...H..... ::::: ~ 4f~ I,
:::::::::: .,.,' ~. I I I ... +. ~o 1 !!!! I • •••• II II •••• ::::: , ..... I :::: I ( . I I
! I I .... 'I •••• 8 A.... . : : ::: .... ... of I ,.... .,.~.. I
!"~! ........ . 1 ".0. j •1 •••• 1
•••• I I ...•• I ," • t ,
911
::::: " ...... "'" f I,' •• I I
I i i •.. I
·1 .•• I 1 ... 'd S f Number of ~er:i.es l.n. Grl. 0 qu, are ...... o •••••••••
Y •••••••••••••••••••
1 •••• 1 '. -~3.-•••• -.4~ •••••••• ~ •••••••• ~6 ••••••••• _... '. *···-.····1-·-w+~··-2··-·+ . + , •• c~ ••••••••• a ••••• &s ••••
_.... - .::I.a.a.:sa:l •• sIl1l::I •• aJl., •••••• 1I~1I •• ~s=.aa. c.; ill »M ... uuhl •••••••• 1 ......... -i .. ·i"~~~:~::::·::=::!==:,.:::::.u'" .++1'HH. ~~xx~~~~~~ "Mgg888Htl~ gg~~gggg: 1I:~IUIt"1f .. ::~:::. ......... . ,.,"'" .......... c....... ......... U0007UUUU ~e~d~eeee ~.~W~IW~~ I. .1 ......... ~·'·2···' ... ·J •••• 2 ••• q •• "'. ·.+·5·.+· xal~~=~=~ ~ooouuouu ee~doeHe~ N.~HM~N»1f .1::::: ••
•••• 1 ••••. i.,t.t ••• ;, - ••• ".~ ••• ~.=¥G=.~ ~~+.+.+~. ~X.XXXXXX uooouuuuu ~e~ee~ee8 .W~M»W~~~ II ••••••• ••••••••• ,., •• tt.' ••• ~-••••••• ::laa=2 •• ++t++++ X ~ •••••• a •••••••• s ••••• ~.a.2.a.a~ •• If •••• ' ••• ' .•..••••••••••••••••••• :II •••••••••••••••••••• ::-J ••••• -'7· 8 9 10 '11 ~o 21 50 :a.: •••• :.=-••• 11 - .. 5 6' _ _, _I/&. _
1 02 3 ~. " -83-
:Y'I ",
.'
o
\
()
o
,.' ,-/ . I,
Hap 13
Individual Female Robbery Downtown
·····.·~··I····.· .. ·2····.····l····.·.··4··~·.···~5 •.. ·.····6····.····r··.·.···.II .•••••.•. 9 •••.• ~ ... I ...••.... 1 .... I ~ 1 I ! ~ ~ ! } ~p :f.,. 1
I I 1 I f xtXXl: .......... . I f
XXX xx 1 • XX)(Xl •
'I"""t , , , , • t , , , I )CltXXXI I
I .... ,"'" I 2 .......... 2 } +...... } '+++.+ M
I ..... E:RRtTT I 1 ++++. I • + I I I 1
1 p::5' -9 "!./ • .. .. .. • .. ....... I I Jj1, .................. " I I ~<.... .. ............. c .. ". 1 I <J I 1 •••• XXXXX I • ",. XXX;:X • I "" XXXXX 1 I "" XXXX)( I I •••• •••••• I 1 .......... 1 4 _ ••• ~..... •••• •••••• •
f -.......... ..... ..... III :::::::::: :::: :::: :::::~~~~~::.z.
I '''''..... ·····xxx _...... ."". I i '''''::::: l1lil1li OOUU ••••• XX .... u ... n i I ..... 11111111 OOUU 1 I ..... BHIIN OOUO 1 I ........ 11 IJOUU ............... I 5 .. t. ~ I .. ".... OOUU .. .. .. ... .. .. I I &::. •• UOUO "~"~ '" •••• f ... c. OOUU t •• , : • ,. : ••••
! • I 'v.··· ..... 1
'II •• ;:"" ..... G'T 11 ==~:c""t..... "f"
6 .~ ••• :"=="'" ••••• ..", b l •••••• = •• "''' ••• a. "'''I I i ..... ::::: . ..... "", . I ..... "". I 1 c •• ,,"..... I J ••••• :z:a S :U1 ..... , I •••• ..==:11.,... f 1{ ..... ·····II:n... "1" :)~.:: ::::. "," ... J .. .. .... I I ... ......... I • \ .... ..... ..... i I ,.... ,.,,' i.·.·. I I 'II ".,' •••••
I ___ _ __ ._0 .!!'! ~. • 1
6 "" •••• ~ I "" ••• I I ,." •••• I I •... f •••• i ••••••• t I •••• I 1 ••••• I •• *** ... 9 ••• " ~ I ••••• I
f "'" • J -::::: ." 1 . . ... , . . I ..... I l • I ,ro
o • 0 f 1····.····,·.-•••.•• 2--· •••• _.3 •••• + •••• q ••• w ••• !.~ ••• ·+····6 ••••• a_._' ••••• ~ ••• M ••••••••• 9._ ••••••• 1 ••••••••• 1 ••••
,Number of Robberies ip. Grid Square • ••••••• " ................. & •••• " •• "'''=::: ... " ...................... \;: ...... "'" .. " ..................... " ............. . •••••••••••••• , •••••••••••••••••••••••••••••• XXXXxx~)Cx u~oouuooo eD8~abebe UH~N.N •• Y .111.1.11 • •••••••••• ,""" ................... + •• + ••••• xxxxxxxxx uooouuuuu ~~~~ebeb~ ~ •• N.iMI~ •• 11 •• ," • ••• 1 •••• ""2"" •••• J •••• • .. ··4& ...... +.5 •••• XXXX6XXXX U0007UU~U ~e~ed~bbe ~~~NY~WM~ dl ••••••• ::::::::: i::: :,:::: :::::::::::::::::: !::!!!!!! ~~~gg~~ HgggSSfl~H ~g:gggg~g =:::===~= :::::::U ·························~······.· •••••• g ••••••• a •••••••••••••••••••• v ....... ".c •••••••••••••••••••••• 1 2 3
o
4 5 6 -84-
7-8 9-10 11-20 21-50
_.'"ri._ ........ __ ~ _.---..<_ .. 0'
, ,
I -
L t
'.

/
(.':' , ~f
--------------------------~----~------------------~ ------------------------------
Map 14
Individual Male Robbery Downtown
b··l·········t···· •••• ~.e •••• ···~······ S .A._o.+ .... 5 ....•. ··o6····.····t···~. 1 -3········ • 1 +···_l·_··~··-·~-H-..... . • -... ~ > ..
\ I ! \' II :::: . \
e.&:I» 1 •• "a 1 I + \ I I I i 2
I \ 1 l-fti<.e- (l'\~~1I. IlT I 2 ••••• e'... • 1 ••••••• • • • 1 I ., •••• ,t., 1 I •••••••••• ,.,.. 1 . "'" ::::: ~ I ... It I 1 t.,,· .... I 1 .-_.- • , . • I 1 fl., .,.,. .. I ::::: ••••• I I :.: : : .. . . . . . . . . I • ...• ..--•.•... '!~~~ 4
\
..... "~ • ,I • , • • • , , , I . __ .1 ....... '"., 1 1 ..... :-.,~ •• '.-.. 1 Q .,t' •• aa:, •••• • •• I •••••• ,;.::1& ::!: aa::: 0""" .- ·l 1 •.•••••. ::.:. ..,t :: ••• :": .• -." ••.. t' •• ,0 ••••• II ........... :. •• • • • 1 + ••• -.~~~~~ ",. ::::: :::: ::::: 1 I ••••• ".,' •••• ••••• .;II I ••••• ,', •• :::: ••••• f'" I
...... ,.,' .... , l ••••• •••• xxxxx ••••• !::: .... , 1 5 ••••• ~";HH~ :::: - •• - ~~~~~ :;: :: ,... ••• •• + I •••• f~K;t;P;N ••••• I
i"."",,;.,\ :::::~~~:~ :::::::::~ :::: ::::: 1 .. ""._._._ •••••••••• 1 t ,.", •••• - ••••• ~
.1 +++++OOOOOXXXXl\. ••••• 1 1 +++++OOOUOXXXXX..... 1 t· +++++OOOOOXXXXX 1 .~ + I ++++ OUooU~RRg"··~·· I
UUUOUHIIMNII.· .. ·" .,- l ++++ OUUOOlllllliill"·"'''· I ++++ UUUougHIIN~.···· + +.++ _.a.' ,t t' ,t J:2=.'~XXXX~ 7
I .... :::: ~~!!~:::::~~~~~ ""', :::: I
I .... ::,:::!::.~~~~~~~ ::::: II 7 ,tl" •••• ·'·"· ••••• I ,.,., ••••.• ,. • •• ,... I ",.,... ,t" ••••• I I .,' :,:::: 1 ! ":":"::~: .....-1 1 • • • •• , , , If , •••• ~" 1 ••• •• • •• o. .... ••. . ...
1 /' \ ::~: :::: ••• :". \ 1 . ...... : .. * ••••• '''1' •••• it I .,,~. • •••• i ..... · '" I - :~::: "; :~~..... I i '-:-;::::::::-.:>-, • " .'. ~ •••• ' •• '" I 9 "....' -I ... i 1 .:* \ I :: , I .••
\ . ., ',' .' .. .a •••• + .... urbi:;··,..·;.··~··l··"····.!J·l·.::~O··2 r.:so···'·
. ._ •••• -•••• +., ••• Q-_.!"' ••••• 5···S .. ••• 6.6 . I':::.~ ~ ~,~ '~A=:;:a.;. •• :as ... a:i;:a==a:aa.a.
1 ....... •••• J'--..... -~,_·,2-· i l. 3 4 ••••• c"D.a=s.;a •• = •• aa1l ... ·:a:· ... ···=~······:;~:t:I~H., 1I1Iu.wan"t,IUI, " ••• ·_·::1 , lU ........ ~ •• ~·~~~~~.·:::::::::·:::::: .... +++!::::: gg~~~~r Hgggt.HSHB get!l!~gggg :::~e::~: :~:~~: .. .
:::: i:::: :::: ~::: ::::::;:::: ::::::::: tH!~!::! g~~~~x~~x~ ~gn~~8tl~ nUggg~g' =:::!;;;;';;;;;;i!!. •••••• I~ "t,,~t·t' .~-•• --•.. ~_ =.~ •. ++~.++.++ xxxxx ~ ~ ' .. = •• =a •••• = •• ~a ••••• • I ••••• •• " t. t ,',', , ........... :.;: ••••••• :l.: ... :.:Ia .•• a, .• .1I ••••••• a;)1 "
•••• ',1 I.' ~ ••• s.tJ •• e •••.• :lc ••••• ~.- - .·..;n r<rl.'.:1- Square ......... " NIimber of Robberl.es... Ul l.4. "0
\ '0
"
"
"
'& .
The only port.ion of the central business district in which
both individual male and female robberies are high is an area of
mixed office and re~idential buildings east of Fourteenth Street
and north of Broadway • The major daytime employment sites in this
area are a group of government and private office buildings.
The individual female robbery concentration decreases slowly
on the north and east while the male robbery pattern remains rela-
tively uniform over the area north of San Pablo Avenue. While there
are few individual female offenses west of Fourteenth Street, the
individual male robbery occurrence becomes denser toward the skid
row area. This area contains the major portion of the individual
male robberies concentrated in the central area.
c. A Theory of Intensity
A recent study of crime distribution, and the only such study
focusing wholly on the crime of robbery, was a study by Schlomo Angel.
Beginning with t'he assumption that crimes ·on the street are influenced
both by the presence of witnesses, which deter crimes, and the pre-
sence of victims which make them possible, this study postulated
that different types of landuse would affect lithe probability that a
witness would show up in effective range during the time it takes to 15
perpetrate the offense." This theory is illustrated in Figure 11
which maps the levei of Ii robbery as the intensity of landuse and street
use increase. If the. intensity of landuse is very low, this theory
su~gests that the level of crime will be low. The scarcity of po-
tential vi'ctims reduces the availability of opportunity. This is
Zone 1 in Figure 11.
[Insert Figure 11]
-86-
. '

(. fl /"J , , .
~
'"
1 "i
~.------ --~~~~----------~----
Figure 11
~n Relat~on to the Intensity of Use Robbery Occurrence • •
Number of
Crimes
Source:
Z Z Z
n n ,e e
Intensity of Use
schlomo Angel, Discouragi~g Crime Through city Planning, working paper NQ. 75 (Berkeley:. center for :Planning and Development Research, Un~v. o.f california), February 1968, p. 16.
(I
~,
-87-
-,'of<
, . 0 ... ·
o
-i',
o
As the intensity' of use increases, the, number of potential vic
tims ~vailable increases sufficiently to. attract the attention of
potential offenders, but people are not sufficiently numerous to
provide witnesses. This situation is called the "critical intensity
zone", Zone 2, and is the situation in which most street crimes are
theorized to take place. When the intensity of use is very high,
Zone 3, the level of activity is high enough to create a number of 16
witnesses adequate to deter the potential offender.
Using data from Oakland this study found most robberies to
occur within a block of a commercial artery. (See Map 15.) Very few
robberies were found to occur in low density, middle income resi-
dentialareas or the higher priced shopping and restaurant areas.
The lack of available victims in the middle and upper income resi-
dential areas and the presence of good witnesses, and "conscious"
ci tizens of the higher income levels were held accoul'ltablc for the
lack of robbery in these areas. The occurrence of robbery wi thin a.
block of the commercial arteries was considered to be generated by
the movement of persons f~om reasonably crowded commercial areas
into less populous side streets on their way to cars or nearby resi-17
dences. These [findings were considered to be supportive of the
idea that street crimes are highest in a zone o~ critical intensity.
Using this as a basis, ~gel developed several theoretical models
for street and commercial area design which he felt might help in :;';'
;'reducing the nuntl]er of critical intensity zones and ultimately the \\
number of street 6rimes.
[Insert Map 15]
-88-
I ' ; ,
1

/
~"".
,:.,,~- ~ ~"'"
"? '"
)'~'-"''''''''
. "
I,: .
~!,';:. '.' -.'~ ....
\:,.0" ~. '.,
.. :;... ... :~.: ', ..
l , .'
" :'O ... e4tIM .... ".1MI1 ~ C.IIC""". I
. ' ,-
~/ I.\~II/ JJ::lf.lJm
Ii./I'
E ... CH SYMIOL IlEPRESENTS ONE OFFENSE:
• UMED ROIIERY
,.STRONG .... M
COMMERCI ... L ZONES
", -.., '
Map 15
SPATIAL DISTRIBUTION
OF ROBBERIES IN
OAKLAND, CALIFORN IA
November 8, 1966 -December 20, 1966
." .... 1'10· .. . • "~ ... 1' ... .
0.1
\ •
.,. .. II
l'
'10
a.,
Source: ~chlomo Angel, Discouraging crime Through city Plann~ng, Work~ngPaper No. 75 (Berkeley: center for Planning and Development Research, Univ. of California) , February 1968, p. 15. t.
-89-
.-~.',
o
0-
.,
~ C)
i\
o
o I j..
,. /;
~-- -- -~---
The Angel theory of critical intensity seems clearer in the
case of the individual female robbery pattern than in the male.
In the central district the level of individual female robbery was
greatest for the fringe areas away from ~he very active shopping
districts. Here large numbers of the shoppers are drawn for park
ing. Similarly in the major neighborhood shopping districts indi
vidual female robbery is higher in the area around the shopping
centers than in the centers themselves. The majority of the major
shopping districts are surrounded by high dens~ty. and medium high
density residential landuse. However, these higher density areas
do not appear to provide a, sufficient level of activity to perform
the surveillance that is said to be necessary to prevent criminal
activity. The individual male pattern, while concentrated to a
SUbstantial extent on the streets, is less clearly influe~ced by
the level of street activity as opposed to such other factors as
certain neighborhoods.
Angel also suggested that on the major streets themselves there
existed levels of traffic congestion--very low and high congestion--
which provided optimum cover for the offender to conunit his offense.
(See Figure 11.) He reasoned that at a high level of congestion
the necessity for automobile drivers to keep watch on the traffic
prevents them from observing crime on 'the sidewalks or in ~tores
while at a low level of congestion there is so little street traffic
that the motorist ·goes faster and thus there is a lower probability
of a passing motorist seeing an offense or getaway taking place. At " an intermediate level drivers were seen as providing some protection
to the streets and stores nearby.
-90-
... 1

. , ,;
.
r-·· .. !i
11
'/
. ' .
, '
I ~
" .
.' " -,'
. ../.
. .. Ii ,)
, r
l'
,-
, , 6.,," •
o , 1"' ... 'I .'
~.
r o
()
o
---------
=,;
If true, this theo,ry sho\lld have a particular effect on commer-
cial robbery which is heavily concentrated on the stre,ets. A street
'by street comparison was therefore made of the number of robberies
relative to the' amount of traffic. This ratio (called the congestion
'ratio) was then compared in Figure 12 with the number of robberies
per 1,000 feet of street. The results of this comparison indicate
two clusters of streets, each representing a distinct area of the
ci~y. Thus the streets of the downtown area are grouped as low in
both number of robberies per 1,000 feet of street and in robberies
per traffic volume., The southern streets, on the other hand, have
higher levels of commercial robbery both per traffic volume and per
1,000 feet of length, spreading in a horizontal band about the mid
.30's level of congestion-robbery ratios. Of ~ote is the clustering
of the two major northern area streets. of San Pablo and Telegraph
which carry much of the traffic between central Oakland and the cities
north. Broadway, a street which carries a great deal of commuter
traffic has the lowest rate of commerical robbery per street traffic
of any street in the city with a ratio of only .10 •
{Insert Figure 12]
It is not clear what levels of street traffic would be high, low
and intermediate in terms of the Angel suggestions concerning the im-
pact of traffic upon robbery. The fact that relationship between
commercial robbery and both street traffic and length of street is
similar for the streets which are similar in location and function
s:uggests, however, that at least at their level of street traffic,
the differences in traffic volume make no substantial difference in
the number of robberies. 19
-91-
--------_._ .............. ,
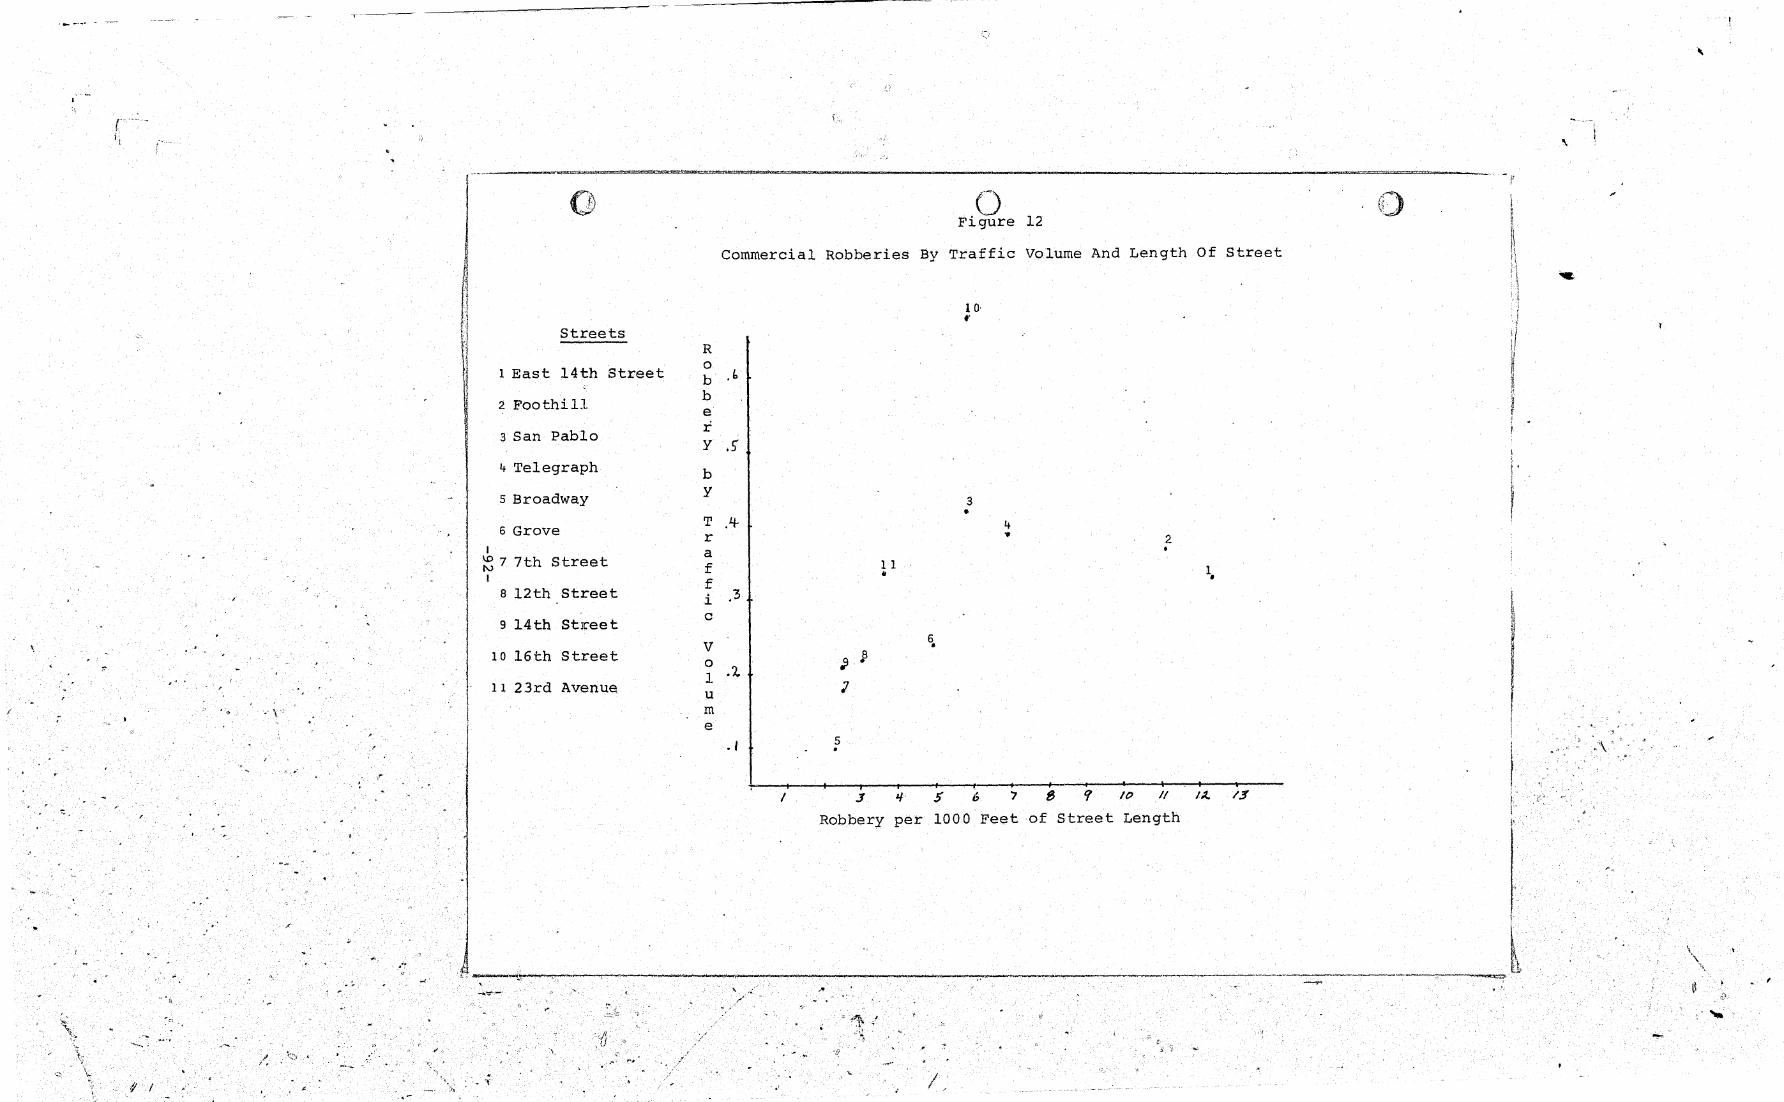
" ,
/ ,-
"-\i
# I ....
- \
'" , .
," "
..
,J.
-------
__ "'~M ____ ="' __ """"'==-==""'-="'''''''"-"-_' ='''''","",,,,,~,,,, _____________________________________ .............. -======"""""""L<,a:; ___ _
o
Streets
1 East 14th Street
2 Foothill
3 San Pablo
4 Telegraph
5 Broadway
6 Grove I ~ 77th Street I
8 12th Street
9 14th Street
10 16th Street
11 23rd Avenue
(J , ..
o Figure 12
Commercial Robberies By Traffic Volume And Length Of Street
R o b .j,
b e r y .S'
b y
T r a f f i c
,4-
,3
v o 1 .1. u m e
./
/
1 1 ..
5
5
10· f'
3 •
6
4 .. 2 •
/0 1/
Robbery per 1000 Feet of Street Length
j' -:;
/
1 •
, I~ /5
i, i , j
I
,
,
"'.
. ,
: .....

In another recent study of crime patterns and urban design,
the' landuse of major urban arterial streets was said to influence
the ~xtent to which the criminal activity penetrated into the
residential areas·through which the streets pa$sed. Specifically,
the lack of sufficient on-site parking for commercial and entertain
ment areas was found to be a factor in bringing victims into the
poorly lit residential sectors in search of parking. The attraction
for offenders was. such that high mugging and theft from automobile
rates resulted in the side street areas. A second finding of this
study of the City of Detroit by Gerald Leudtke was a relationship
between the frequency of pedestrian traffic in commercial areas and
the commercia-l robberies. In general, as Table 28 demonstrates, the
heavier the pedestrian 'traffic the less the likelihood that stores in 20
the area would be robbed.
[Insert Table 28]
The studies of Leudtke and Angel suggest that tp~ nature of the I
robbery site rather than its location within the city' is more im
portant to understanding its occurrence.
-93-
.~-~-.
"),'"
" \ .
j
o
"
(~)
. --
/.
." - ' .•. -------------.~
Amount of
erc1a Robbery Sltes (In Per?ent of Sites)
Detro1t 1969-70
Very busy, Da~
crowding 0.0
Busy, no crOWding 6.4
Moderate pedestrian traffic 25.4
Light pedestrian traffic 30.9
Sporadic pedestrian traffic 36.4
No pedestrian traffic 0.9
Area of '
Night
0.0
0.0
1.8
2.7
77.3
18.2
Source: G. Luedtke D and the PhYSical Ci' .' Ly~tad, J. Kozlowsky and ' .Reduction, A Pilot ~r'd Ne1ghborhood Design Techn?· Hamer1nk, Crime Enforcement and C' ,u y Prep~red for the Natio ~ques ~or Crime and Associates nr~m1)na1 JUst1ce (Detroit Mich~a Inst1tute of Law
, '" p. 27A. ' gan: Gerald Luedtke
-94-

c>
I
~"'.. ", .. : ,..;" .;:~:,;'. "
Chapter Six
SOME PROBLEMS OF SPATIAL A~ALYSIS
Any analysis of the spatial characteristics of a phenomenon
such as crime will inevitably encounter problems of scale and of
I 't Is the .subJ'ect the forest or the trees? If the particu arJ. y.
area to be discussed i.s to be broken up into parts for tpe purpose
h t h ld be the size of the various of comparison and analysis, was ou
parts? Does their shape matter or is it irrelevant? Should the
data be standardized in some way--in terms of area, population
or some other cha.racteristic especially related to the phenomenon?
By far the largest amount of crime area analysis that takes
place is that performed by police departments. At one level this
may be through the use of pinmaps which record each indi "ddual
crime, usually for a short period of time, and for the purpose
h t term problems or trends that should be o~ picking up any s or
dealt with more or less immediately. At anoth$r level this will
, f statistics for an area such be through the regular maJ.ntenance 0
as a beat or a census trac • " t These m.ay be used to some extent for
, b t are also lJ.'kely to be used over longer short term analysJ.s u
a month Or year for general comparative purposes and periods such as
for such things as manpower allocation.
A. Analysis In Terms of Standard Areas
The use of standard areas such as be~t o;r census tracts in
, 't' h the'r data that is this kind of way facilitates comparJ.son w~ 0
also maintained with reference to the samf~ kind of area unit,
, cr'J.'mes, population data, socia'l and economic data, including other .
and a myriad of other possible things ranging from firealarms to
-95-
- .. ,,-----":""'"---..,--.-,:::;-:;:>-1 ,I ~
o " __ ."'.::'"_'_."._ ...... --:--" .. __ ---'~+.~~-N
- " -......
, ----O.7-........... _ ...... ~ ........ ,'_" __ "" __ ~7'~_' .. ,~._.-.,._.r-.. ~ _ ..
peanut consumption. Census tracts in particular are useful in
<:) this kind of way.
o
o
The extent to which area units of this type only approximate
the equality necessary for meaningful comparisons is often over
looked, however. If beat 19 is the largest in the city in terms of
area and at the'same time has the greatest number of robberies in
the city, it is not at all unusual to hear that beat 19 is "high in
robbery", even if it has a relatively low density of robbery per
unit of area. For some purposes, of course, the density may be
irrelevant. But the distinction may be missed, even when it is
the central issue.
This problem can be illustrated in terms of the'Oakland data.
The city, which covers about 54 square miles, has 29 police beats
and 72 census tracts. The police beats average over 1.8 square
miles each. The census tracts average three fourths of a square
mile in area, but range in size from census tract 72 with over 619
grid squares to tract 23, with only 17 grid squares.
The census tract which contains the highest number of robber-
~es, census tract 15, has a very low number of robberies per grid
s~~are area, 1.5, while another cen(&us tract which has fewer rob
beries, census tract 19, has over 16 robberies per grid square. The
rank:lngs of the high census tracts by number of robberies per,
grid square and number per unit of population are shown in Table 29.
The variation is enormous.
[Insert Table 29J
This same change of the rank of the highest robbery area occurs
-96-

/
' ... -"' ....
Census Tract Number
15
18
19
68
20
70
53
69
52
63
57
33
'~, 26
2.7
29
23
Numbe'r of Robberies
283
23.7
237
224
217
211
197
191
184
158
145
14'5
138
132.
92
85
., .. -~~-.... ---.. ,.-
Table 29
Robbery b1 Census Tr~cts 966-68
Size in Grid Squares
183
42
20
160
19
101
50
88
\ .
54
83
48.
50
34
25
16
17
population (1960)
7261
6775
2359.
7831
1588
5213
5419
7591
5547
4105
5575
6340
5408
3840
1128
1292
-97-
Rank by Number of Robberies
1
2
3
4
5
6
.7
8
9
11
12
13
14
15
16
Rank by Number of RobberiE?s
. G'V' ,,~~lt'r'~' ~ Per )h:t:,·,:-
Squa:J;:~~ __
15
4
1
6
2
13
8
12
9
~4
10
11
7
5
3
6
,Rank by Number
Per Person
.5
9
2
12
1
6
8
15
11
7
13
16
14
10
3
4
....:....,.-..,...-....:.......,.....--:\""'1iIl;::.··;'.......,.-~-=«>::tQ4;~--·_Jl ... -·~·~""-.-. .....-:-:/'. -'--~'-~-~"':" '<
o
\
o
o
wi th bea't: areas. Oakland police beat 17, for example, contains
·the highest number of robberies while the density of robbery
in this beat is one eighth that of the density of police beat
five and equal to the density in a beat with almost half the num
ber of robberies, beat 22.
Standardization of the data into numbers per square mile or
per 100,000 persons is often made to eliminate these differences
between areas. Display of the data in map form can alsO be helpful
in making the reader aware of the variations.
A second problem with. respect to the use of standard areas
relates to the homogeneity of the phenomenon within th.e area. The .~
recording of the data by beat or census tract implie~1 to some ex-
tent that the crime occurs uniformly over the area. This assump
tion of homogeneous distribution within a census tract or police
beat can be very misleading for robbery.
An analysis of the robbery distribution in the area of census
tract 15 illustrates this problem. Census tract 15 is the highest
robbery census tract in the city. However, there is an intense
concentration of robbery in this census tract upon the street
which makes
FigUre
is the most
up the boundary;with census tract 21, as shown in
The robbery concentration in this four block section
intense in the entire city. However, when this robbery
concentration is di,splayed by census tract it is spread out over
the,. entire area of census tracts 15 and 21. When this same area
is considered by the police beat area, the area of concentration
is within one beat area. However, this area also includes large
areas with no robbery at all, as may be seen by comparing the dis-
tributions in Figure 13.
-98-

"
, "
,."
,",
" ,
Yo I , . 4" "
"
t',
. . ,
. "
. .../. ,"
.'
'. I'
..
-"--- - --- --~---------------------------------~
,. " , .'
r
, ,
\ "'
• '"1.
.[ I .
I
0,'," '{
()
o
'7
[Insert Figure 13]
This problem of homogeneity within the area o'f analysis is
multiplied many times over when the distribution of the phenomenon
has linear tendencies, and is made even worse if the line of the
linear pattern also happens to be the boundary of the various areas.
Both these problems occur with respect to robbery in Oakland.
The pattern of robbery when plotted by the" actual location
of the offense is linear with concentrations focused upon the
major streets of the city. This pattern of concentration is
not evident when viewing the maps of robbery plotted by census
tract and police beat areas. The major street in Figure 14,
East 14th Street, is also a boundary for several of the census
tracts. (See Figure 14.) In each of the census tracts that use
this thoroughfare as a boundary there is very little robbery
away from this street. The census tract map of the area, ,however,
necessarily generalizes the occurrence of robbery over the entire
area of the census tracts involved. Thus, a census tract map,
such as Figure 14, shows large areas bounded by t?e major streets
as having a relatively high robbery frequency, when over 70 per-
cent of each tract shown has relatively little robbery.
The same problem exists when robbery is; plotted by police
bea'~ areas. Police beat areas are larger in size than census
tracts~ When police beats are used for mapping, the robberies
which occur about the major streets are even further generalized
into larger areas, as shown in Figure 14.
[Insert Figure 14]
-99-

/ .'
..
r
I
I 1
I I-' o o I
o () Figure 13
Robbery in the Prescott Neighborhood - 1966-1968
Census Tract
15
.. -./ \.
.' \
\ .. " Census Trac t '.
21 \. /
! I
. Beat 1 /
I , / .....
_ .. - ., _ .. -'. Beat Boundary ...... .' ... Census Tract Boundary .' ....
I
'\
, .. ..,.
. , ,

. __ ...
/
-,
j J "
-----------------------------------------~------------------------------------------------------------------------------~~--==~~~~"~~----~ '- r.
o (~)
j
I
J ,.... a I-' I
Io
.~j-
, . I
.... : ,:-" -.. -l, .~, ~ •• .
•
.' . . ~.. .. .. , .
"0 ,~ ~ -'0 f
... t •
Each dot equals one robbery.
P~lice Be~t Areas
\.
"
" 4
• .
. ' " .I' .0:
. '. " ..
•
--I "
•
~ .. . .' , ..
Robbe.ry
Legend:
/
Census Trac-t Areas
Fi,;,ure 14
on East 14th Street and Adjoining Areas
Darker areas indicate a greater number of robberies
!
I I I ,
,
/'
,I
, ,
,
.,

and police beats distort the actual Clearly census tracts
pattern of robbery so that' some nonrobbery areas are shown to
have high'robbery rates. There are no existing standard units
however, which do not ·cor .. ·.:ain the for describing urban areas, /
same kind Qf limitations.
To deal with this problem the St. Louis Police Department
called "Pauly" blocks. has developed a system of small areas
Each of these is between our f and six city blocks in size, and
for St. Louis there are about 400, or about three and a half times
more than the number of census trac s. t Even the pauly blocks,
however, generalize highly clustere even s s d t uch as robbery into
possible nonevent areas. The size of the Pauly block area is
t hat a reasonably accurate city-wide sufficiently small, however,
. d 21 pattern may be determ1ne •
. department, in order to obtain More recently the St. LOU1S
. dIed a .method of mapping even more precise information, has eve op
the site of traffic calls and criminal activity which uses the
22 Maps. are produced for each of actual location of the offense.
the nine districts • of the C;ty by a computer pen plotting system
using actual addre~ses. When there are more than ~ive events
. radius a circle is drawn upon the within a quarter of a mile ~n
Areas of dense occurrence are cbaracterized map in that area •.
by the numbers of circles.
B. Analysis By Actual Location
of the Present study, a unit of analysis For the purpose
-102-
,. .i -,. •• _ 4
.J..~.
---~------
I.
;
was sought that would minimize any invalid generalization of the
~ robbery pattern, be independent of the street pattern of the city,
but which would nevertheless allow some generalizations' to be made.
The use of a grid system of fine gradation was ultimately decided
upon. A coordinate system capable of displaying a linear distri
bution and large enough to be practical fo~ coding was then sought.
Little guidance was found, however, for development of an optimal
size of stUdy unit.
o
What general gui.delines there are seem accurate enough, but
not very helpful in concrete cases. Thus, the level of detail
of the data on a map is said to depend upon a combination of the
scale of the available base map and the requirements of the map
ping sYmbolism.23
Since a map is an abstraction of reality in
which the symbol represents the occurrence of a real phenomenon,24
both the size and character of the symbol and the adoption of an
appropriate scale to display the symbol are important.
While a square grid coordinate system is independent of the
street pattern, its utiiity varies with the size of the grid unit.
The larger the area of each grid unit, the less clear the clllste,r-
ing of robbery about the streets. As the size approaches a cen
sus tract in area, the robbery distribution obviously becomes sim
ilar to the distribution of the census tract map and the focus upon
the major streets is lost. As the size of the grid unit decreases
the street focus pecomes clearer, as shown in Figure'lS. (The
subfigures show ·the results of a decreasing grid size~,)' Since the
street focus of robbery tends to cluster within a half city block of
o the major streets, a grid area which approximates this size was
chosen (Figure 15.D).
-103-
. -.... ~.----.,..~"''''-.. -"",,,,._" '-. -.....,..---

( \
»
I
o
[Insert Figure 15]
The visibility using this method 'of analysis of robbery
patterns is considerably better with the large, 39" x 26" maps
originally produced than ~wi th the 8 1/2" x II" reproductions neces
sarily used in this report. It is difficult in the smaller version
either to show the basic events or to add additional information
such as street patterns that would aid in the analysis.
This method of analysis and those now being used by the St.
Louis department are still in their infancy. Their cost and their
ultimate potential on any basis of wide-scale use either for short
range tactical problems or for longer range. analysis and planning
has not yet been determined. They seem to offer, however, a great
deal of promise and to warrant further experimentation and
development.
-104-
.-~.,...----,;:~-_, ...... "'l!P:tI="""")a:4""' ____ ' ___ --7-;.---~ ~:--'",: ... --'.-"'-''''" ~-""~..,~.< _ '\
"
\
c
.. /~'
---------==~-"--------
C)
.--~~ <-........ __ • . .-~. . __ . .,.-----Figure 15
Robbery Di~tribution in Central Oakland - 1966-1968 W~th Varying Size of Mapping Unit
(Robbery Increases With Intensity of Shade)
A
C
M e r r
e i t t
D
-105-
E
Size of Mapping Unit

i·.
('
'.
FOOTNOTES
1. Oakland City Planning Department, Options for Oakland: a
Summary Report on the Oakland 701 Project (Oakland, California:
Oakland City Planning Department), December 1969, pp. 77-79.
2. Letter from Alex Zuckermann, Lirarian, oakland City Planning
Department, August 4, 1971.
3. The landuse data was taken from a survey conducted in 1965 by
4.
I
the Oakland Planning Commission IS 701 Study staff. This land-\
use system is very generalized and; stresses thelanduse of the I
block rather than the individual parcel. with such a system
the landuse is a reflection of the neighborhood rather than the
site's individual functio·n. The neighborhood grocery and even
the supermarket, if located apart from other commercial establish
ments, would be considered wi thin a noncommercial landuse area.
Thus while commercial robbery may not occur without the involve-
ment of a business of some sort it quite often does occur in
a noncommercial landuse area. The geperalization of this land-
use system resulted in a large number of grid areas, 15 percent,
with no landuse information. While this is unfortunate, the
use of such a generalized .landuse base shows the basic function
of the area of the site of the robbery rather-than the site's . uniqueness within an area.
Commercial robberies are those offenses whose victims were in
commercial enterprises. They' consist of only' 30 percent of
"i ·the robberies during the three year period, 1966-1968. These
j ' .. :;t4r-'. " ' . '.
-106-
-~-'-""-"---'-"""""--""""""--'''-: ',"" ;;! .-
) . Cl
\
. \
/I ,
o
o
o
robberies, as well ~\s robbery of indi viduals--64. 5 percent of
the robberies--will be discussed in greater depth. The re
maining 5.5 percent of the robberies were either residential
robberies or transportation robberies •. Because of the small
number of these two robbery types ,. they will not be dis cussed
separately.
5. In 1960 there were 3,293 persons living in this census tract
of which 94.5 percent were black; the mean average income for
this area was only $3,153 as compared with $6,303 for the city.
The Prescott area is surrounded on two sides by a large and
shabby industrial port area and on the other sides by the
6.
Nimi tz Freeway. The area may easily be classified as a ghetto
with near complete isolation ifrom the rest of the city. The
majority of the housing consists of old, dilapidated Victorian
style multifamily wood frame houses of which over 80 percent
were built before 1909. There is also a large federal housing
project covering two city blocks that is only one block from
the Seventh Street commercial strip, the focus of the indivi.dual
male robbery concentration.
The entire length of Seventh Street contains 88 robberies with
an additional 92 robberies within a half block of Seventh. As
may be seen on Map 13, all but approximately 25 of the r.obberies
on Seventh Street were in the Prescott area. The second major
street of this area, Willow Street, contains 50 individual
male robberies with an additional 34 robberies within a half
block of Willow.
-107-
-," -,~··-:--,~~",---o~-----· -------:-'--~.------~~ -~., C

7. :i (,
8.
9.
10.
12.
13.
14.
---~---~ .. - .~. -
The City of Oakland may be divided into northern and southern
sections by dividing the city with a line connecting the Bay,
Lake Merritt and the southern boundary of the City of Piedmont.
There is a definite difference between the density of residential
areas as well as type of commercial activity between the two
areas.
Dtlring the period of 1960 to 1966 the nonwhite po],ulation of
the area increased from 17,076 to 28,820 a 69 percent increase
while the white population decreased from 16,149 to 9,170,
a 58 percent decrease. Of note is the decrease in the median
age of the nonwhite population due to the increase in younger
families: from 18.8 to 14.9 years of age for males and from
20.0 to 17.2 for females. At the satt.e time the median age of
the white population remained virtually unchanged, going from
27.9 to 26.7 years for males and 29.8 to 29.7 years for females.
(Oakland City Planning Department, East Oakland: a 701 Subarea
Report, Oakland, California: Oakland City Planning Department),
1969, p. 9.
Clifford Shaw and Henry D. McKay, JuvenLle Deliquency and
Urban Areas, (Chi.cago: University of Chicago Press) , 1947.
Peter Haggett, Location Analysis in Human Geography, (New York:
St. Martin.ls Press), 1966, p. 177.
Shaw and McKay, supra, note 9, pp. 204-206. , ILcz1
Id., pp. 202-203. -
Calvin F. Schmid, "Urban Crime Areas, Part II.," American
Sociological Review, XXV , No. 10, (1960), pp. 664 .. 665.
ld., pp ... b55-678.
..
-.~
o
,
o
o . \
I· (/ I~
15. Sc;;hlomo Angel, Discouraging Crime Through City Planning,
Working Paper No. 75 (Berkeley .. Center for Planning and
Development Research, Univ. of calif.), February 1968, pp. 16-18.
16. Ibid.
l~. Id., pp. 12-15.
18.
19.
20.
21.
22.
23.
24.
The congestion-robbery ratio is the ratio of the nUmber of
robberies per 1000 vehicles per day per length of street.
All of the streets discussed'have a " / s~m~lar speed limit (25
m.p.h.). Thus, the speed of the traffic has little influence
upon the differences between the robbery concentrations.
Gerald Luedtke, Donald Lystad, James Kozlowsky and Stephen
Hamerink, Crime and the Physical City .. Neighborhood Design
Techniques for Crime Reduction, a pilot study prepared for the
National Institute of Law Enforcement d . an Cr~rninal Justice (Detroit: Gerald Luedtke and Associates), n.d., pp. 5-6.
Interview with Dr. Ne.lsol'l B. Heller, Metropolit.cm Police De
partment of St. Louis, March 3, 1973.
Ibid.
Benjamin J. Garnier, Practical Work ;n ... Geography (New York:
St. Martin Pres~, Inc.), '1963, p. 73.
John P. Cole and Cuchlaine A. M. King, Quantitative Geography;
Techniques and Theories in Geography (New York:
and Sons, Ltd.), 1969, pp. 468-469.
-109-
John Wiley
':"'"'~- ~'.-----

/
/
/'
/,;
f'
" - IJ
" .. \"~"' .. "','.'," "':~ ':.,', ',.' . ' ~ " ,'>
-"(.\.~:'."'.'." ' . . "'", . , ' .. , -:,., ···t~ .'
/
/,
". "
,.
"'.' p-
f ,I cl :_,,~
,; /'