HYPERSPECTRAL SENSING OF SOIL - Cornell University
263
HYPERSPECTRAL SENSING OF SOIL PEDONS FOR SOIL CLASSIFICATION AND SURVEY A Thesis Presented to the Faculty of the Graduate School of Cornell University in Partial Fulfillment of the Requirements for the Degree of Master of Science by Ernest James Neafsey May 2008
Transcript of HYPERSPECTRAL SENSING OF SOIL - Cornell University

HYPERSPECTRAL SENSING OF SOIL PEDONS FOR
SOIL CLASSIFICATION AND SURVEY
A Thesis
Presented to the Faculty of the Graduate School
of Cornell University
in Partial Fulfillment of the Requirements for the Degree of
Master of Science
by
Ernest James Neafsey
May 2008

© 2008 Ernest James Neafsey
ABSTRACT
Proximal sensing using visible-near infrared (VNIR) diffuse reflectance
spectroscopy (DRS) has demonstrated substantial potential for rapid, accurate
estimation of key soil properties. Many of these soil properties are diagnostic for the
purpose of soil classification and survey. As many of the soil surveys in the United
States approach 40-50 y in age, there is need to enhance and supplement the current
methodologies employed in the soil survey update process.
This study was guided by the following objectives: (1) characterize the
hyperspectral response of selected soil chemical and physical properties that are
important to soil survey, (2) assess the quality and usefulness of hyperspectral data
collected using laboratory- and field-based methods for soil classification, (3) develop
an accurate method for estimating the spatial distribution of selected soil chemical and
physical properties within a pedon sample, and (4) conduct a comparative assessment
of soil characterization data from National Soil Survey Center (NSSC) and Cornell
Nutrient Analysis Laboratory (CNAL) for paired analyses of selected soil chemical
and physical properties.
The hyperspectral responses of selected soil samples from pedons in Allegany
and Ontario Counties in western New York were correlated with CNAL and NSSC
soil property values using Partial Least Squares 1 (PLS1) regression. In addition, the
degree of spectral discrimination among soil samples from known horizons was
examined using principal components analysis (PCA). Also, an unaligned sampling
grid (1.2 m × 0.2 m) with a sampling interval of 0.05 m (n = 125 sample points) was
used to assess the feasibility of predicting the spatial distribution of selected soil
properties throughout the profile of one pedon in Allegany County.
Conventional laboratory-based methods employed in this study yielded results
consistent with previous studies, with most R2 values in excess of 0.85. Field-based
methods implemented in situ yielded results which performed similarly to laboratory-
based methods. Where model performance measures were less than expected, likely
sources of error included small sample sizes and variable soil moisture in the field
setting, which has been shown to influence soil spectral response. An efficient data
processing flow was also developed for accurately estimating the spatial distribution
of selected soil physical and chemical properties using PLS1 regression and ordinary
kriging. While model predictions were generally within acceptable error tolerances, a
larger sample size and a more robust prediction model would reduce error rates.
Finally, a comparative assessment of soil characterization data produced by CNAL
and NSSC demonstrated substantial agreement between the two laboratories. The
results can help local practitioners obtain data more rapidly through local university-
based laboratories, while still allowing comparison and statistical analyses with data
provided by the national soil survey laboratory.
This study clearly demonstrated the potential of proximal sensing using VNIR
DRS for estimating selected soil physical and chemical properties of importance to
soil survey. The results of this study suggest that advanced proximal sensing
techniques, both laboratory-based and in situ, are worthy of additional study to assess
the full potential of this technology for soil survey. For VNIR DRS to be deployed as
a complement to field-based soil survey operations, potential users must have relevant
information in terms ofsystem capabilities and limitations and an appropriate level of
training for them to use this technology in an efficient and effective manner.
iii
BIOGRAPHICAL SKETCH
Born in Manchester, CT on 20 June 1984, E. J. Neafsey was raised in Stafford
Springs, CT and graduated from East Catholic High School in 2001. At Cornell
University, he was a Cornell Presidential Research Scholar and conducted research on
geostatistical accuracy assessment of digital terrain models (DTMs) created from
imagery acquired by the Advanced Spaceborne Thermal Emission and Reflection
Radiometer (ASTER). He received his B.S. in January 2005. In addition, he worked
for the Connecticut Department of Environmental Protection in Hartford, CT during
the summers of 2004 and 2005 in hazard mitigation and permit enforcement. He is
currently an M.S./Ph.D student in the Graduate Field of Soil and Crop Sciences at
Cornell University.
iv
ACKNOWLEDGMENTS
This study was supported by USDA-CSREES Federal Formula Funds (HATCH NYC-
125401, 125406); USDA-NRCS Soil Survey Staff-Belmont, NY and Tolland, CT;
National Soil Survey Center, NRCS-USDA, Lincoln, NB; Alfred State College,
Alfred, NY; the Computational Agriculture Initiative, a joint venture of the Cornell
Theory Center and College of Agriculture and Life Sciences and sponsored by USDA-
CSREES, Washington, DC; the Cornell Nutrient Analysis Laboratory (CNAL); and
the Department of Crop and Soil Sciences, Cornell University, Ithaca, NY.
v
TABLE OF CONTENTS
BIOGRAPHICAL SKETCH.........................................................................................iii
ACKNOWLEDGMENTS............................................................................................. iv
TABLE OF CONTENTS ...............................................................................................v
LIST OF FIGURES.....................................................................................................viii
LIST OF TABLES ......................................................................................................xiii
LIST OF ABBREVIATIONS .....................................................................................xiv
Chapter 1: Introduction and Background .......................................................................1
Literature Review .......................................................................................................1
Soil classification and survey .................................................................................1
Remote and Proximal Sensing................................................................................3
Hyperspectral Remote and Proximal Sensing ........................................................5
Remote sensing and soil survey ...........................................................................13
Literature Review Summary.................................................................................14
Study Objectives.......................................................................................................15
REFERENCES.........................................................................................................16
Chapter 2: Assessing Hyperspectral Sensing for Soil Survey......................................20
Abstract.....................................................................................................................20
Introduction ..............................................................................................................21
Hyperspectral Remote and Proximal Sensing ......................................................21
Remote sensing and soil survey ...........................................................................24
Objectives .............................................................................................................25
Materials and Methods .............................................................................................26
Study Sites Description ........................................................................................26
vi
Laboratory analyses..............................................................................................26
Hyperspectral measurements: Field .....................................................................27
Hyperspectral measurements: Lab .......................................................................30
Field sampling ......................................................................................................32
Data analysis.........................................................................................................32
Modeling...............................................................................................................33
Results ......................................................................................................................34
Prediction Plots.....................................................................................................37
PCA ......................................................................................................................54
Discussion.................................................................................................................55
Summary...................................................................................................................57
REFERENCES.........................................................................................................58
Chapter 3: Mapping Soil Profile Properties Using Proximal Diffuse Reflectance
Spectroscopy.................................................................................................................61
Abstract.....................................................................................................................61
Introduction ..............................................................................................................62
Material and Methods...............................................................................................63
Study site description ...........................................................................................63
Laboratory analyses..............................................................................................63
Hyperspectral measurements: Field .....................................................................64
Data analysis.........................................................................................................66
Spatial Modeling ..................................................................................................67
Results and Discussion .............................................................................................69
REFERENCES.........................................................................................................84
Chapter 4: Comparing Physical and Chemical Soil Properties Measurement: CNAL
vs. NSSC.......................................................................................................................85
vii
Abstract.....................................................................................................................85
Introduction ..............................................................................................................85
Methods and Materials .............................................................................................87
Results and Discussion .............................................................................................88
Chapter 5: Research Findings and Recommendations for Future Research ................97
Research Findings ....................................................................................................97
Recommendations for Future Research....................................................................98
APPENDIX 1 .............................................................................................................100
APPENDIX 2 .............................................................................................................105
CNAL .....................................................................................................................108
NSSC ......................................................................................................................115
APPENDIX 3 .............................................................................................................120
APPENDIX 4 .............................................................................................................123
PLS1 R2 Values ......................................................................................................123
Prediction Plots.......................................................................................................131
PCA ........................................................................................................................237
REFERENCES...........................................................................................................242
viii
LIST OF FIGURES
Figure 1.1 – Effect of kaolinite concentrations on soil spectral features (Ben-Dor,
2002).....................................................................................................................10
Figure 1.2 – Reflectance spectra of montmorillonite with 50% (A) and 90% (B) water
mixed in the sample (by weight) at room temperature (Ben-Dor, 2002). ............11
Figure 2.1 – Field Instrument Setup – Side View. ......................................................29
Figure 2.2 – Field Instrument Setup – Rear View. ......................................................29
Figure 2.3 – Laboratory Instrument Setup – Overview...............................................31
Figure 2.4 – Laboratory Instrument Setup – Probe. ....................................................31
Figure 2.5a – Prediction Plot – Allegany County 2005 (Field, Raw, NSSC) – % N
(Calibration). ........................................................................................................37
Figure 2.5b – Prediction Plot – Allegany County 2005 (Field, Raw, NSSC) – % N
(Validation)...........................................................................................................38
Figure 2.5c – Prediction Plot – Allegany County 2005 (Field, Raw, NSSC) – % C
(Calibration). ........................................................................................................38
Figure 2.5d – Prediction Plot – Allegany County 2005 (Field, Raw, NSSC) – % C
(Validation)...........................................................................................................39
Figure 2.5e – Prediction Plot – Allegany County 2005 (Field, Raw, NSSC) – pH
(Calibration). ........................................................................................................39
Figure 2.5f – Prediction Plot – Allegany County 2005 (Field, Raw, NSSC) – pH
(Validation)...........................................................................................................40
Figure 2.5g – Prediction Plot – Allegany County 2005 (Field, Raw, NSSC) – % Clay
(Calibration). ........................................................................................................40
ix
Figure 2.5h – Prediction Plot – Allegany County 2005 (Field, Raw, NSSC) – % Clay
(Validation)...........................................................................................................41
Figure 2.6a – Prediction Plot – Allegany County 2005 (Field, First Derivative, NSSC)
– % N (Calibration). .............................................................................................41
Figure 2.6b – Prediction Plot – Allegany County 2005 (Field, First Derivative, NSSC)
– % N (Validation). ..............................................................................................42
Figure 2.6c – Prediction Plot – Allegany County 2005 (Field, First Derivative, NSSC)
– % C (Calibration). .............................................................................................42
Figure 2.6d – Prediction Plot – Allegany County 2005 (Field, First Derivative, NSSC)
– % C (Validation)................................................................................................43
Figure 2.6e – Prediction Plot – Allegany County 2005 (Field, First Derivative, NSSC)
– pH (Calibration).................................................................................................43
Figure 2.6f – Prediction Plot – Allegany County 2005 (Field, First Derivative, NSSC)
– pH (Validation)..................................................................................................44
Figure 2.6g – Prediction Plot – Allegany County 2005 (Field, First Derivative, NSSC)
– % Clay (Calibration)..........................................................................................44
Figure 2.6h – Prediction Plot – Allegany County 2005 (Field, First Derivative, NSSC)
– % Clay (Validation)...........................................................................................45
Figure 2.7a – Prediction Plot – Allegany County 2005 (Lab, Raw, NSSC) – % N
(Calibration). ........................................................................................................45
Figure 2.7b – Prediction Plot – Allegany County 2005 (Lab, Raw, NSSC) – % N
(Validation)...........................................................................................................46
Figure 2.7c – Prediction Plot – Allegany County 2005 (Lab, Raw, NSSC) – % C
(Calibration). ........................................................................................................46
Figure 2.7d – Prediction Plot – Allegany County 2005 (Lab, Raw, NSSC) – % C
(Validation)...........................................................................................................47
x
Figure 2.7e – Prediction Plot – Allegany County 2005 (Lab, Raw, NSSC) – pH
(Calibration). ........................................................................................................47
Figure 2.7f – Prediction Plot – Allegany County 2005 (Lab, Raw, NSSC) – pH
(Validation)...........................................................................................................48
Figure 2.7g – Prediction Plot – Allegany County 2005 (Lab, Raw, NSSC) – % Clay
(Calibration). ........................................................................................................48
Figure 2.7h – Prediction Plot – Allegany County 2005 (Lab, Raw, NSSC) – % Clay
(Validation)...........................................................................................................49
Figure 2.8a – Prediction Plot – Allegany County 2005 (Lab, First Derivative, NSSC)
– % N (Calibration). .............................................................................................49
Figure 2.8b – Prediction Plot – Allegany County 2005 (Lab, First Derivative, NSSC)
– % N (Validation). ..............................................................................................50
Figure 2.8c – Prediction Plot – Allegany County 2005 (Lab, First Derivative, NSSC)
– % C (Calibration). .............................................................................................50
Figure 2.8d – Prediction Plot – Allegany County 2005 (Lab, First Derivative, NSSC)
– % C (Validation)................................................................................................51
Figure 2.8e – Prediction Plot – Allegany County 2005 (Lab, First Derivative, NSSC)
– pH (Calibration).................................................................................................51
Figure 2.8f – Prediction Plot – Allegany County 2005 (Lab, First Derivative, NSSC) –
pH (Validation).....................................................................................................52
Figure 2.8g – Prediction Plot – Allegany County 2005 (Lab, First Derivative, NSSC)
– % Clay (Calibration)..........................................................................................52
Figure 2.8h – Prediction Plot – Allegany County 2005 (Lab, First Derivative, NSSC)
– % Clay (Validation)...........................................................................................53
Figure 2.9 – PCA – Allegany County (Field)..............................................................54
Figure 2.10 – PCA – Allegany County (Lab)..............................................................54
xi
Figure 3.1 – Field acquisition of soil reflectance data in soil pit prepared for pedon
characterization by soil survey staff. ....................................................................65
Figure 3.2 – Field acquisition of soil reflectance data with contact probe in soil pit
prepared for pedon characterization by soil survey staff......................................65
Figure 3.3 – Spatial Modeling Flow Diagram. ............................................................68
Figure 3.4 – Predictions and deviations for % Carbon by sample. .............................69
Figure 3.5 – Predictions and deviations for % Organic Matter by sample..................70
Figure 3.6 – Predictions and deviations for % Clay by sample...................................70
Figure 3.7 – Predictions and deviations for % Nitrogen by sample. ...........................71
Figure 3.8 – Interpolated soil profile map of % Carbon..............................................72
Figure 3.9 – Interpolated soil profile map of % Organic Matter .................................73
Figure 3.10 – Interpolated soil profile map of % Clay. ...............................................74
Figure 3.11 – Interpolated soil profile map of % Nitrogen. ........................................75
Figure 3.12 – Laboratory v. predicted values of % Carbon using ordinary kriging,
blocked by horizon. ..............................................................................................76
Figure 3.13 – Laboratory v. predicted values of % Organic Matter using ordinary
kriging, blocked by horizon..................................................................................77
Figure 3.14 – Laboratory v. predicted values of % Clay using ordinary kriging,
blocked by horizon. ..............................................................................................78
Figure 3.15 – Laboratory v. predicted values of % Nitrogen using ordinary kriging,
blocked by horizon. ..............................................................................................79
Figure 4.1 – Regression results – % N. .......................................................................90
Figure 4.2 – Regression results – % C.........................................................................91
Figure 4.3 – Regression results – pH...........................................................................92
Figure 4.4 – Regression results – % sand. ...................................................................93
Figure 4.5 – Regression results – % silt. .....................................................................94

xii
Figure 4.6 – Regression results – % clay.....................................................................95
xiii
LIST OF TABLES
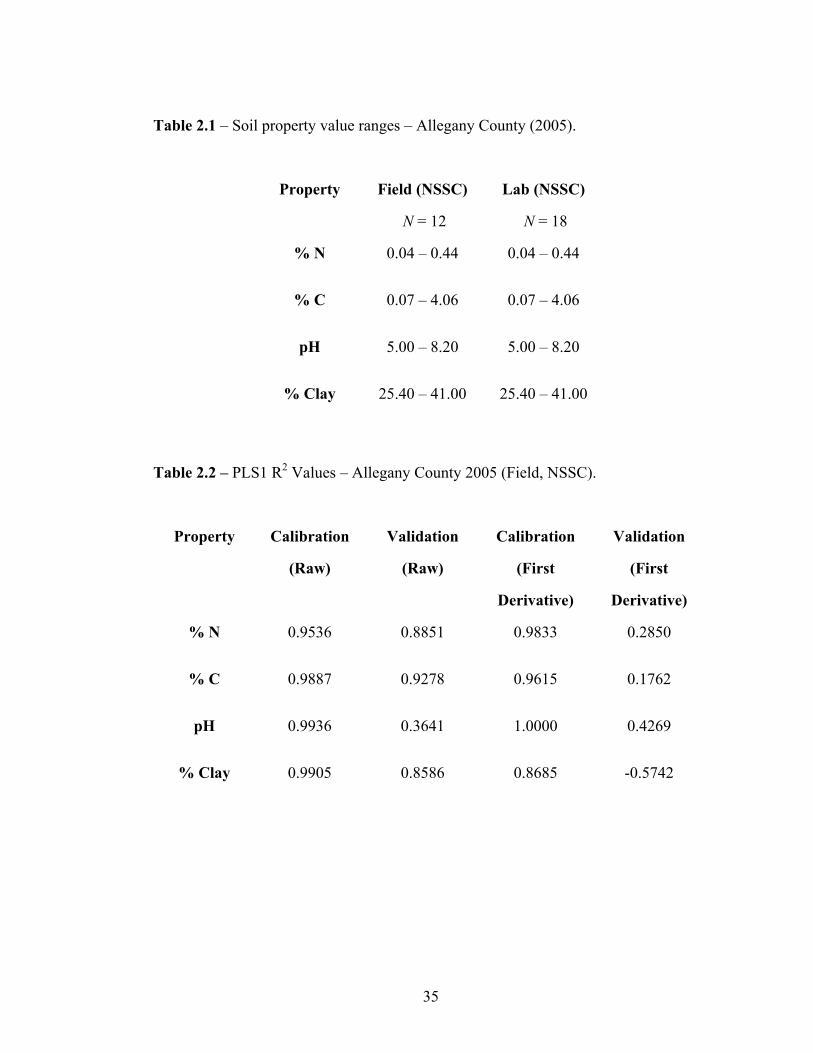
Table 2.1 – Soil property value ranges – Allegany County (2005). ............................35
Table 2.2 – PLS1 R2 Values – Allegany County 2005 (Field, NSSC). .......................35
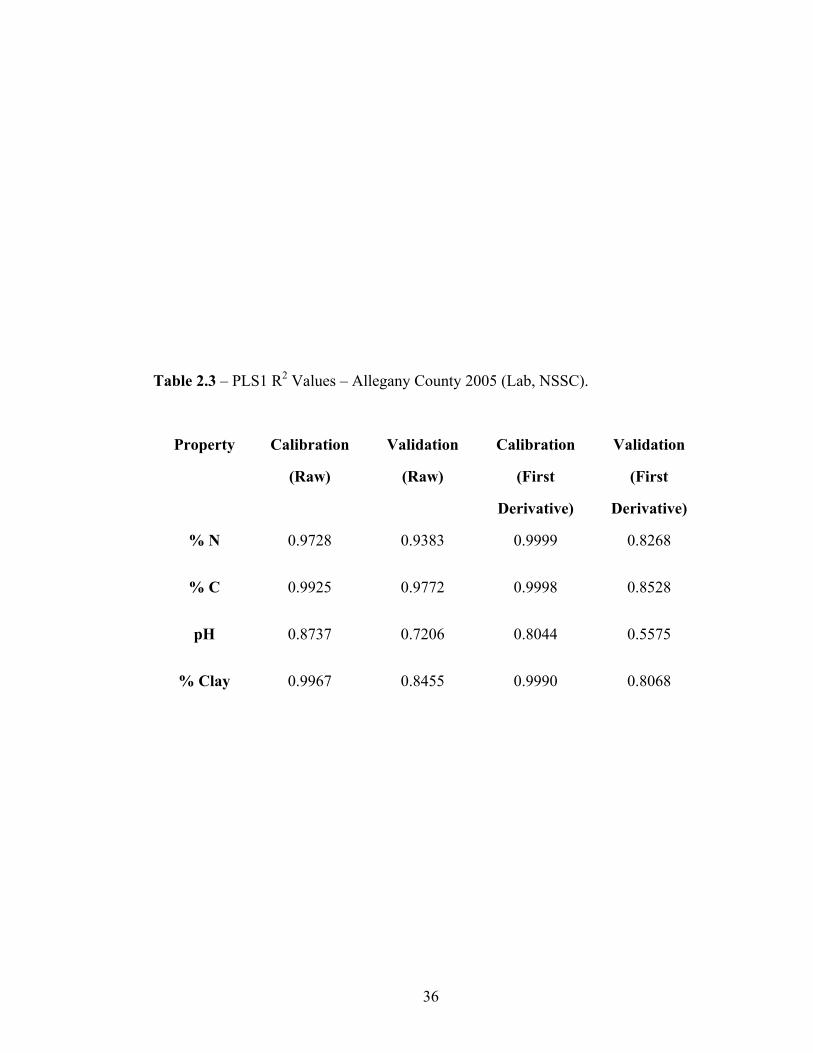
Table 2.3 – PLS1 R2 Values – Allegany County 2005 (Lab, NSSC). .........................36
Table 3.1 – Correlation Matrix – S05NY003-016 (CNAL). .......................................80
Table 4.1 – Regression Results – Selected Properties (NSSC vs. CNAL)..................89
xiv
LIST OF ABBREVIATIONS
CEC: Cation Exchange Capacity
CNAL: Cornell Nutrient Analysis Laboratory
DRS: Diffuse Reflectance Spectroscopy
FSR: Full Spectral Resolution
NRCS: Natural Resources Conservation Service
NSSC: National Soil Survey Center
NSSL (or SSL): National Soil Survey Laboratory
OM LOI: Organic Matter Loss on Ignition
PCA: Principal Components Analysis
PLS1: Partial Least-Squares 1
SOC: Soil Organic Carbon
SOM: Soil Organic Matter
VNIR: Visible Near-Infrared
1
Chapter 1: Introduction and Background
Literature Review
Soil classification and survey
Successful civilizations throughout history have prioritized some sort of soil
classification and survey. In The Georgics, Roman author Virgil writes,
Not that all soils can all things bear alike.
Willows by water-courses have their birth,
Alders in miry fens; on rocky heights
The barren mountain-ashes; on the shore
Myrtles throng gayest; Bacchus, lastly, loves
The bare hillside, and yews the north wind's chill.
Mark too the earth by outland tillers tamed…
The fundamental relationship between soil properties, their forming factors and
their corresponding sustainable use is well understood in this passage. While the
physical and chemical theoretical underpinnings of this relationship would not be
developed for many centuries, the relationship demonstrates that people have had a
sustained interest in making inferences about important soil properties to support their
land management decisions.
Modern soil classification and survey are performed in a much more
systematic and quantitative manner. In the United States, the Natural Resources
Conservation Service (NRCS) develops and maintains standards for soil classification
2
and survey. In addition, the NRCS conducts field operations to update soil surveys, as
well as create them in more remote sections of the country. Internationally, the Food
and Agriculture Organization (FAO) of the United Nations guides international soil
classification and survey operations.
Modern soil classification was pioneered by Vasily Dokuchaev, founder of
Russian soil science, in 1870 (Glinka, 1927). His research group theorized that soil
was an independent entity, a product of several soil forming factors such as parent
material, climate, topography and time. These ideas were eventually adopted in the
United States and gave rise to the systematic methodologies currently employed in the
field and laboratory. Major references include the National Soil Survey Handbook
(USDA-NRCS, 2005), the Soil Survey Manual (Soil Survey Division Staff, 1993) and
Soil Taxonomy (Soil Survey Division Staff, 1999). When the three books are used
together, soil surveyors can produce accurate maps with associated taxonomic
classification of map units by examining both the spatial distribution of soil pedons (or
unit of soil which contains all of the horizons of a given soil series) distributed
throughout the landscape and the genetic horizons contained within them.
Internationally, the World Reference Base (WRB) for Soil Resources provides a
similar framework for assigning classifications and ensures interoperability for
regional and global survey initiatives (Food and Agricultural Organization 1998).
3
Remote and Proximal Sensing
Remote sensing is commonly defined as obtaining information about an object
without being in physical contact with it. While in common parlance the term typically
refers to sensor systems positioned on satellites or aircraft, biological systems have
acquired remote sensing capabilities through the evolutionary process. Bacteria are
able to navigate to their objectives using chemical gradients. The human eye is also a
specialized stereoscopic imaging system, sensing reflectance in the spectral range of
400 – 700 nm.
Remote sensing which takes place over short distances between sensor and
object is termed “proximal sensing.” The distinction between remote and proximal
sensing is necessarily arbitrary, but proximal sensing typically is conducted less than
10 m from the study object. Traditional applications of proximal sensing include
ground-based assessments of plant health and analyses of laboratory spectra collected
for mineralogical investigations.
There are several advantages and limitations for proximal sensing. The short
transmission distances involved greatly reduce, and in many cases practically
eliminate, the need for atmospheric correction of acquired data. Deployment costs are
also reduced as the sensor can be transported by conventional vehicles or by hand. The
user also has greater control over the geometric relationship between the sensor and
features of interest and has improved knowledge of the conditions under which the
data were collected.
However, proximal sensors are rarely imaging, which makes understanding the
spatial context of each data point more difficult. This can usually be mitigated by
adapting photogrammetric procedures and using appropriate spatial interpolation
techniques to obtain sufficient information to simulate an image. In addition, many
4
proximal sensors are developed for specific applications, which can limit
interoperability data applications. Within similar systems, data are collected by users
with collection, processing and archival standards, which means there are limited
central repositories for data exchange. Work is currently underway at national
agencies and universities to develop spectral libraries to support research in related
fields of study.
Fundamentally, remote sensing data products are a representation of the
functional response of objects to energy sources. These are typically spectra, which
are acquired as a discrete series of reflectance measurements taken at different
wavelength intervals, or bands. With reference to the human eye, many remote sensors
acquire this information over a broad, yet defined range of wavelengths, known as a
spectral band. Electro-optical sensors on Earth-orbiting satellite platforms, such as
Landsat and ASTER, collect spectra for multiple spectral bands, each selected to
maximize their utility for multiple applications. Just as each rod and cone in the eye
collects individual reflectance measurements, these sensors acquire reflectance
measurements on a pixel-by-pixel basis. Several classification methods have been
developed to assess the spatial distribution of areas with similar spectral responses.
This can give insights in terms of the structural relationships between objects in a
given study area. A more thorough treatment of remote sensing may be found in
Lillesand, et al. (2004).
5
Hyperspectral Remote and Proximal Sensing
Soil Moisture
Soil moisture is a critical soil property which has broad impacts on land
management. The transition of visible-near infrared (VNIR) hyperspectral sensing of
soil properties from proximal lab and field instruments to remote sensors on aerospace
platforms may allow soil moisture to be detected over larger areas and provide many
benefits to land managers. Farmers could use hyperspectral imagery to determine
appropriate levels of irrigation. Developers could also use this information to establish
which parcels are most suitable for construction based on local wetlands regulations.
In any case, the efficacy of the method must be established before these potential
applications of VNIR spectroscopy can be used.
From a general assessment of the literature, soil moisture content can be
detected by VNIR sensing. Many published spectra of soil samples have shown that
there are distinct water absorption features at 1 400, 1 900 and 2 200 nm, the depth of
the absorption features being proportional to the water content. In addition, soil
reflectance tends to increase when water is removed from the soil (Whiting et al.,
2004). This has implications for field sensing, as the moisture content of these soils
tends to be higher, which may lead to a reduction in the discrimination of key soil
features.
Excellent correlations of VNIR-derived estimates of soil moisture with
measured values have been achieved by other investigators (Dalal, 1986). Lobell and
Asner (2002) report that “the observed changes in soil reflectance revealed a nonlinear
dependence on moisture that was well described by an exponential model, and was
similar for different soil types when moisture was expressed as degree of saturation.”
6
However, this relationship has its limits, as demonstrated by Weidong (2002). “For all
the wavelengths and all the soils, results show that for low soil moisture levels, the
reflectance decreased when the moisture increased. Conversely, after a critical point,
soil reflectance increased with soil moisture. For some soils, the reflectance of the
wettest conditions can overpass that of the driest conditions. The position of the
critical point was related to soil hydrodynamic properties” (Weidong, 2002).
A number of studies cited by Malley et al. (2004) had fair to excellent
prediction values for air-dried soils. These soils were sampled from a variety of
conditions, including 448 sites from throughout the United States, Hungary and Korea.
“Field-moist” samples from central and western North America showed slightly
poorer results. According to Malley, et al. (2004), “using remote sensing as a means to
determine soil field moisture is challenging since most of the spectral information
available for soil water partially overlaps the water vapor absorption spectral region
(Ben-Dor 2002).”
Barnes et al. (2003) noted that remote sensing of soil moisture is only possible
when vegetation is minimal and the values obtained typically only apply to the top ~5
cm to 20 cm of the soil. They also cited a study by Milfred and Kiefer (1976) who
reported that soil moisture is best correlated with remotely-sensed VNIR data a few
days after rainfall. This has implications for scheduling acquisition dates for
hyperspectral imagery or spectra, as it may be very difficult to schedule overpasses or
field sampling during these times due to practical constraints.
Texture
Texture is a fundamental soil property that has a broad impact on the
classification and management of soils. Traditionally, soil texture has been assessed in
7
the field using the ribbon method where a moist soil sample is manipulated by hand to
estimate the proportion of sand, silt, and clay particles in the sample. The length and
consistency of the ribbon informs the soil surveyor’s determination of texture (particle
size distribution). In the lab, a number of techniques have been developed to make
quantitative assessments as to the fractions of sand, silt and clay in a given soil
sample. An area of current VNIR spectroscopy research is to determine the correlation
between important spectral features of soil properties with corresponding laboratory-
derived values. Texture is a physical soil property which can have a substantial impact
on soil structure. Soil structure can affect reflectance and light scattering, which
contributes to the shape and amplitude of soil spectra.
Favorable results in this area would enable the rapid quantitative assessment of
texture in the field, which would complement (but certainly not replace) traditional
field surveying methods. It would also provide a first step in the process of calibrating
high spatial resolution hyperspectral remote sensors to detect soil texture from
kilometers, rather than millimeters away. This could allow for relatively efficient soil
mapping and classification for areas where topsoil is highly visible. This has the
potential to give land managers a more accurate assessment of the textural properties
of their soil over a large area.
Since nutrient absorption and retention are related to soil colloid chemistry, an
evaluation of the textural components would provide better assessments of fertilizer
and other soil amendment needs. Since texture also impacts water flow, more detailed
soil texture maps could assist efforts to protect aquifers from contamination through
leaching and sediment runoff (Lee et al., 2003).
Barnes et al. (2003) note several challenges to remote sensing as a means of
determining soil texture. To obtain the best estimates, tillage practices must be
uniform across the mapping area. This would require image analysts to create a mask

8
for each tillage practice area and conduct textural analyses for them separately. As in
moisture, the textural estimates only apply to the surface of the soil (Barnes and
Baker, 2000). In addition, thermal infrared data can be used with VNIR data to
improve prediction accuracies (Salisbury and D’Aria, 1992). In addition, there are
relatively few studies which include sand, silt and clay fractions as a major parameter
of interest, although Malley et al. (2004) cites several in his treatment of soil texture.
Sand
Current literature suggests that sand content can be well-predicted using VNIR
spectroscopy. Shepherd and Walsh (2002) obtained good results for sand content
prediction, although RMSE values were greater at the upper end of the prediction
range. Islam et al. (2003) obtained fair prediction values for sand. Although Cozzolino
and Morón’s (2003) samples did not contain a substantial amount of sand, good
prediction values were reported.
Silt
According to current literature, silt content can be well-predicted using VNIR
spectroscopy. Zhang et al. (2005) used wavelets with hidden Markov models (HMM)
and maximum likelihood (ML) procedures to estimate silt endmembers with excellent
accuracies. Cozzolino and Morón (2003) reported good estimation values for
Uruguayan soils where silt was, on average, the dominant textural component on a
percentage basis.
9
Clay
The current literature presents a favorable assessment of the feasibility of
predicting clay content using VNIR spectroscopy. Shepherd and Walsh (2002)
obtained good results for clay content prediction, which they noted could be related to
cation exchange capacity (CEC). This is a logical interpretation as the surface area of
clay minerals is positively correlated with CEC. Similar results were found by Islam
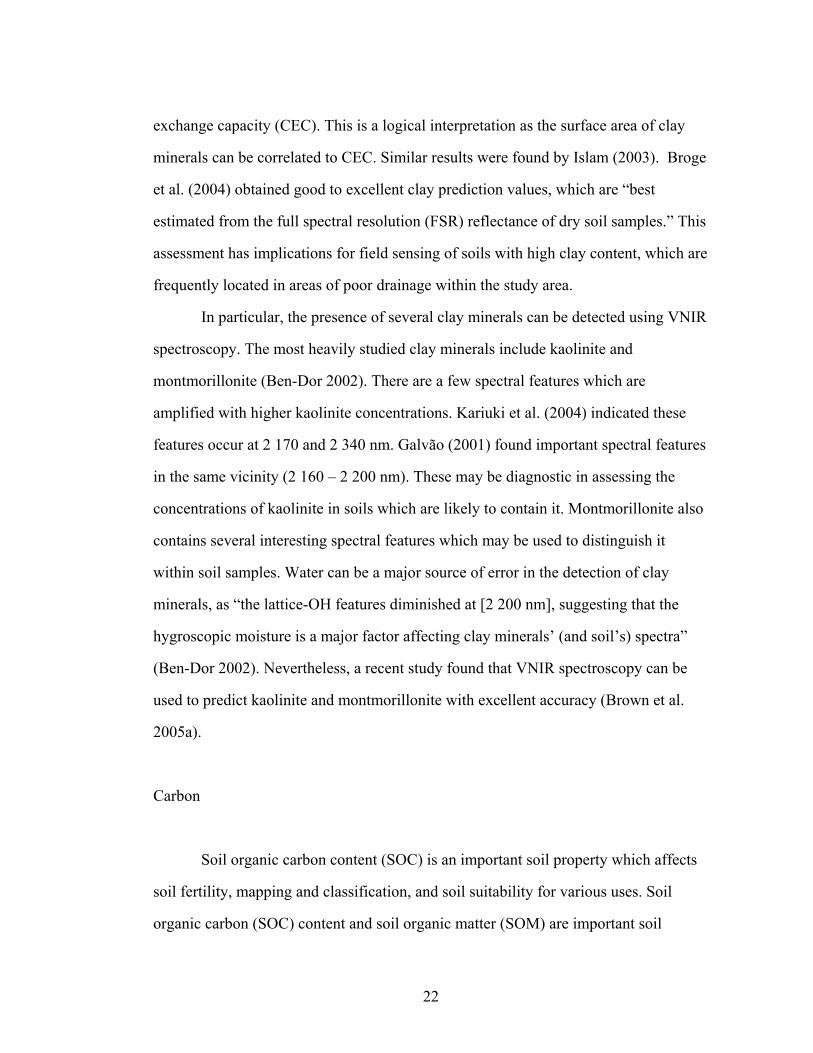
(2003). Broge et al. (2004) obtained good to excellent clay prediction values, which
are “best estimated from the full spectral resolution (FSR) reflectance of dry soil
samples.” This assessment has implications for field sensing of soils with high clay
content, which are frequently located in areas of poor drainage within the study area.
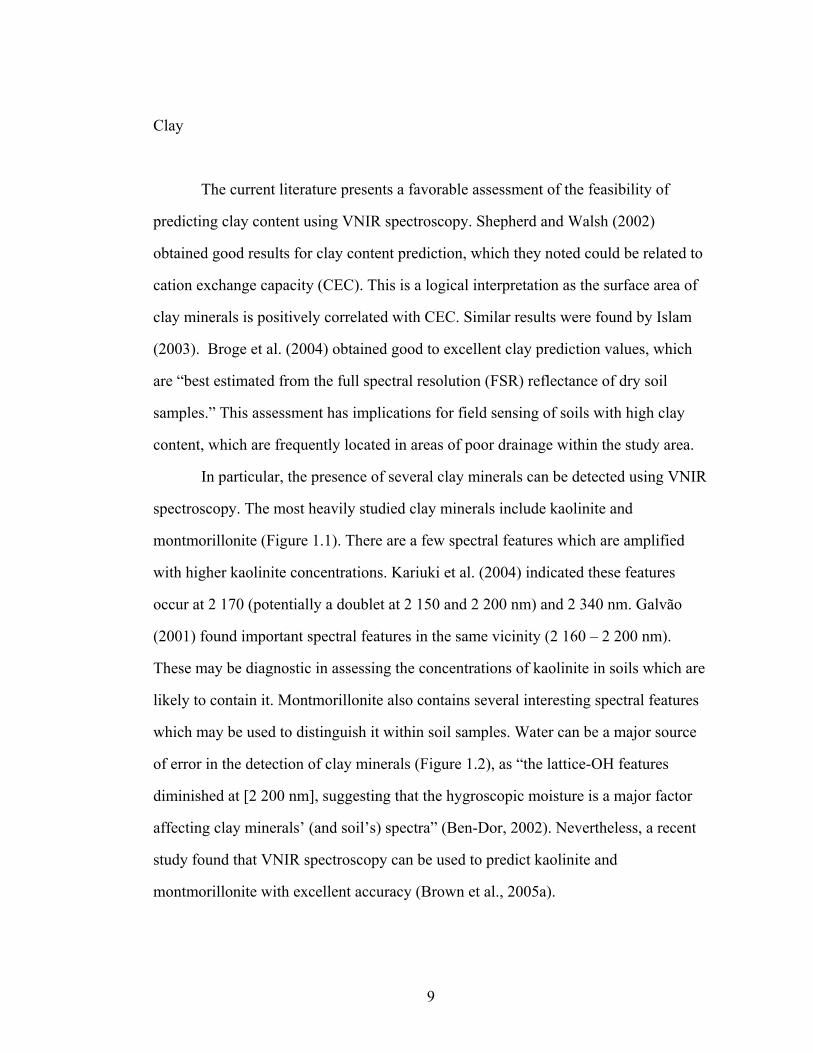
In particular, the presence of several clay minerals can be detected using VNIR
spectroscopy. The most heavily studied clay minerals include kaolinite and
montmorillonite (Figure 1.1). There are a few spectral features which are amplified
with higher kaolinite concentrations. Kariuki et al. (2004) indicated these features
occur at 2 170 (potentially a doublet at 2 150 and 2 200 nm) and 2 340 nm. Galvão
(2001) found important spectral features in the same vicinity (2 160 – 2 200 nm).
These may be diagnostic in assessing the concentrations of kaolinite in soils which are
likely to contain it. Montmorillonite also contains several interesting spectral features
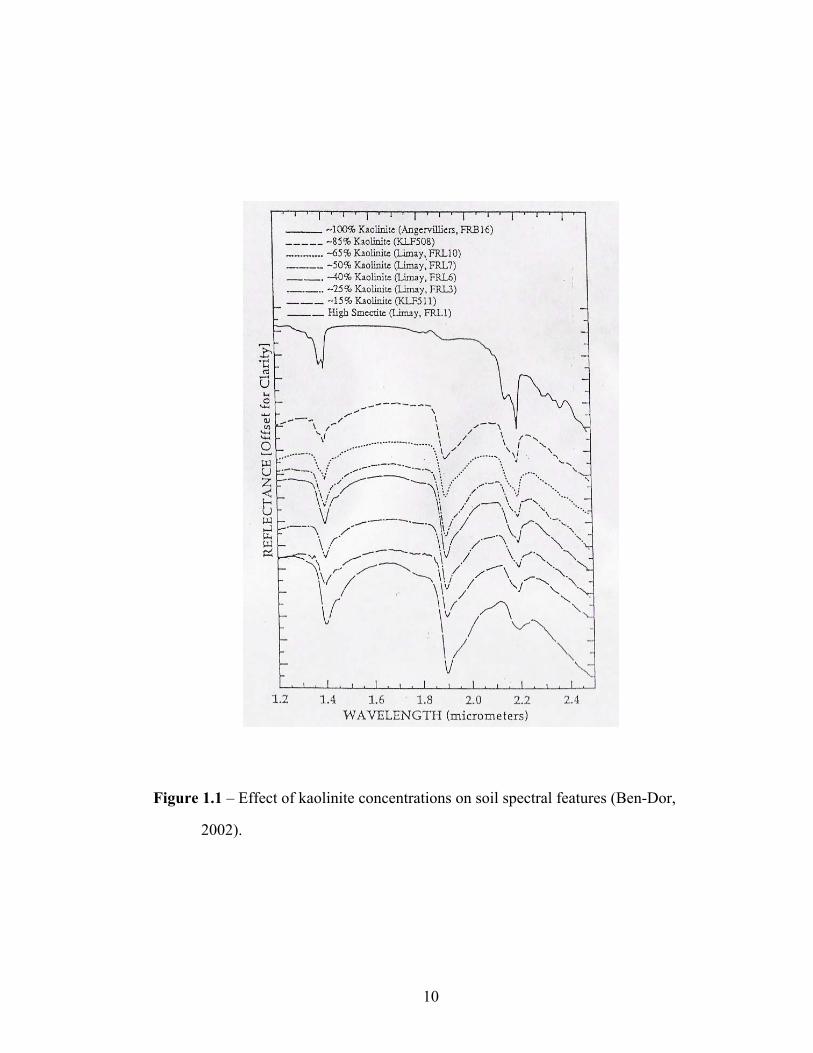
which may be used to distinguish it within soil samples. Water can be a major source
of error in the detection of clay minerals (Figure 1.2), as “the lattice-OH features
diminished at [2 200 nm], suggesting that the hygroscopic moisture is a major factor
affecting clay minerals’ (and soil’s) spectra” (Ben-Dor, 2002). Nevertheless, a recent
study found that VNIR spectroscopy can be used to predict kaolinite and
montmorillonite with excellent accuracy (Brown et al., 2005a).
10
Figure 1.1 – Effect of kaolinite concentrations on soil spectral features (Ben-Dor,
2002).
11
Figure 1.2 – Reflectance spectra of montmorillonite with 50% (A) and 90% (B) water
mixed in the sample (by weight) at room temperature (Ben-Dor, 2002).
Carbon
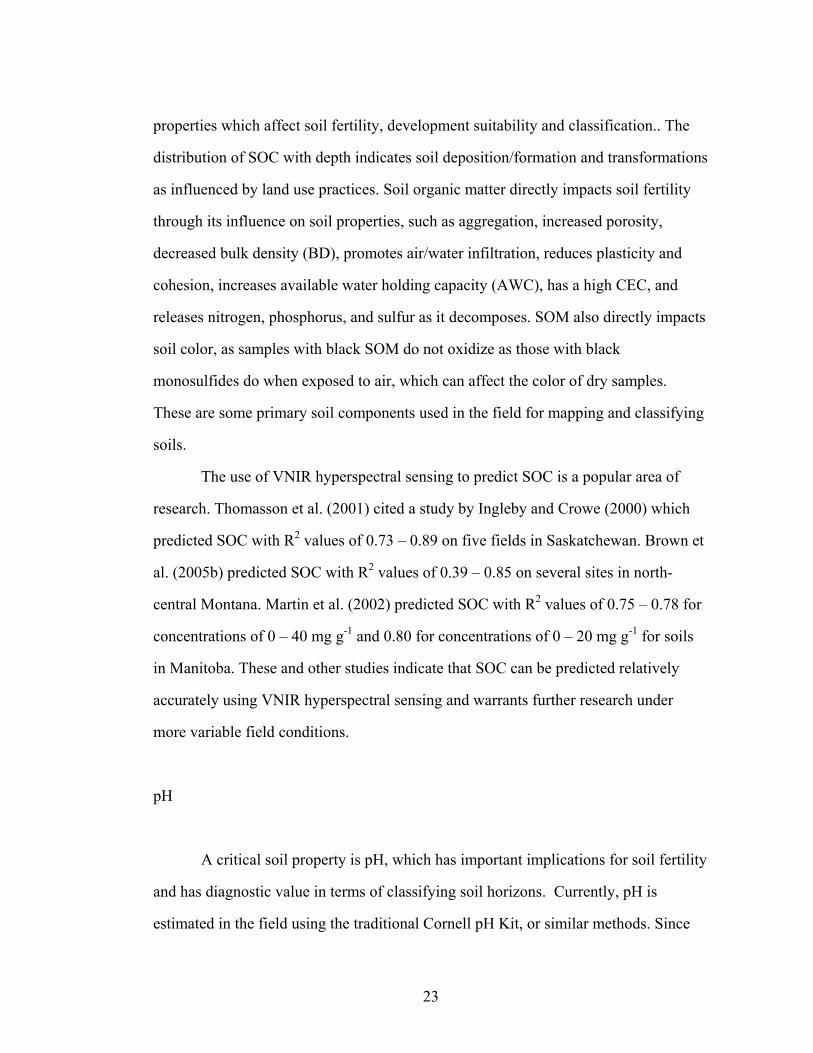
Soil organic carbon content (SOC) is an important soil property which affects
soil fertility, mapping and classification, and soil suitability for various uses. The use
of VNIR hyperspectral sensing to predict SOC is a popular area of research.
Thomasson et al. (2001) cited a study by Ingleby and Crowe (2000) which predicted
SOC with R2 values of 0.73 – 0.89 on five fields in Saskatchewan. Brown et al.
(2005b) predicted SOC with R2 values of 0.39 – 0.85 on several sites in north-central
12
Montana. Martin et al. (2002) predicted SOC with R2 values of 0.75 – 0.78 for
concentrations of 0 – 40 mg g-1 and 0.80 for concentrations of 0 – 20 mg g-1 for soils
in Manitoba. These and other studies indicate that SOC can be predicted relatively
accurately using VNIR hyperspectral sensing and warrants further research under
more variable field conditions.
pH
A critical soil property is pH, which has important implications for soil fertility
and has diagnostic value in terms of classifying soil horizons. Currently, pH is
estimated in the field using the traditional Cornell pH Kit, or similar methods. Since
this method is highly visual and is subject to interpretation, there is an interest in
establishing more consistent measures of pH under field conditions using diffuse
reflectance spectroscopy. Diffuse reflectance spectroscopy is highly sensitive to
carbon, with which pH is highly correlated. Several studies have used hyperspectral
sensing to estimate pH. Dunn et al. (2002) predicted pH with an R2 value of 0.80 using
417 samples from southeastern Australia having a pH range of 5.30-8.80. In Uruguay,
Morón and Cozzolino (2002) estimated pH with an R2 value of 0.93 using 332
samples with a pH range of 5.1-7.9. Analysis of soil samples from Maryland (n=179)
resulted in an R2 value of 0.73 for a pH range of 4.40 – 7.30 (Reeves et al., 1999).
Among other factors, the limited range of possible values for pH can degrade
prediction performance, but this can be overcome by increasing sample size.
13
Organic Matter
Soil organic matter directly impacts soil fertility, as well as soil color, which is
a primary component in field classification of soils. Malley et al. (2004) cites
numerous results from studies measuring soil organic matter (SOM). Ben-Dor and
Banin (1995) calculated an R2 value of 0.55 for a range of 0-140 g kg-1 for 91 samples
from Israel. Several other studies have resulted in favorable R2 values. However, many
of these employed the Walkley-Black method for determining SOM, so direct
comparisons cannot necessarily be made. Key limitations of the Walkley-Black
method include “incomplete oxidation of organic C and…particularly poor [digestion
of elemental C forms]” (USEPA 2002) and the mean recovery rate of organic C is
76% (Walkley and Black, 1934), necessitating a correction factor of 1.33.
Nevertheless, the results indicate that maintaining sufficient sample size and
measurement range appears to enhance prediction.
Remote sensing and soil survey
Remote sensing and soil survey have served complementary roles throughout
the 20th Century. As the demand for high-quality soil information increased, soil
survey teams required more efficient methods of resource inventory and analysis. The
emerging field of photogrammetry was quickly applied to soil survey, enabling the
systematic acquisition of data for the area of field operations.
Aerial photography offers several clear advantages for the soil surveyor. The
practice of using photo forward lap and side lap into flight plans allows for
stereoscopic coverage throughout the study area. This allows the soil surveyor to
14
examine the topography of their survey area in more detail before they go out in the
field. In addition, infrared photography can provide valuable information to soil
surveyors. In areas where vegetation and management are relatively uniform,
variations in tone can correspond with variation in soil fertility, soil moisture or other
key diagnostic soil properties. While soil fertility is typically not a consideration in
soil taxonomy, it can be correlated with contributing soil properties which are part of
the soil classification system.
A major limitation of conventional satellite remote sensing is that it is typically
only capable of collecting information relevant to the soil surface. While this can
provide useful support for agricultural operations, soil surveyors require information
about the upper 2 m of soil. Nevertheless, several studies have used remote sensing to
extract soil information. Barnes et al. (2003) employed several platforms, including
SPOT-HRV, NIR DRS, conductance meters and ground penetrating radar, to assess
multiple soil properties. Shih and Jordan (1992) used Landsat SWIR (TM band 7) to
determine surface soil moisture in Lee County in Florida. Nanni and Demattê (2006)
examined the utility of Landsat TM bands 3 and 4 to predict surface soil properties,
with acceptable R2 values for sand (0.52), clay (0.67), OM (0.51), the silt/clay ratio
(0.56), SC (0.49), CEC (0.55) and silica (0.59).
Literature Review Summary
As understanding matures of soil formation and dynamics of relevant soil
properties, the use of multiple sources of environmental information is rapidly
becoming the standard for the soil survey enterprise. While conventional means will
likely remain a critical part of the process, additional remote and proximal sensing
15
systems will give practitioners additional tools to inform their decision-making
process. Given the promise of diffuse reflectance spectroscopy for predicting critical
soil properties, this technology may play a significant role as it becomes more fully
developed and proven. Therefore, the goal of this study is to assess the parameters for
advancing the role of diffuse reflectance spectroscopy in field-based soil survey
operations.
Study Objectives
This study is guided by the following objectives:
1. Characterize the hyperspectral response of selected soil chemical and
physical properties that are important to soil survey;
2. Assess the quality of hyperspectral data collected in situ as an aid to field-
based soil survey operations and compare the quality and usefulness of
hyperspectral data collected using laboratory- and field-based methods for
soil classification and survey;
3. Develop an accurate method for estimating the spatial distribution of
selected soil chemical and physical properties within a pedon ;
4. Conduct a comparative assessment of soil characterization data from
National Soil Survey (NSSC) and Cornell Nutrient Analysis Laboratory
(CNAL) for paired analyses of selected soil chemical and physical
properties.
16
REFERENCES
Barnes E. M., K. A. Sudduth, J. W. Hummel, S. M. Lesch, D. L. Corwin, C. Yang, C.
S. T. Daughtry, and W. C. Bausch. 2003. Remote- and ground-based sensor
techniques to map soil properties. Photogramm. Eng. Remote Sens. 69:619-
630.
Barnes, E. M., and M. G. Baker. 2000. Multispectral data for mapping soil texture:
possibilities and limitations. Applied Engineering in Agriculture 16:731-741.
Ben-Dor, E. 2002. Quantitative remote sensing of soil properties. Adv. Agron. 75:173-
251.
Ben-Dor, E., and A. Banin. 1995. Near-infrared analysis as a rapid method to
simultaneously evaluate several soil properties. Soil Sci. Soc. Am. J. 59:364-
372.
Broge, N. H., A. G. Thomsen, and M. H. Greve. 2004. Prediction of topsoil organic
matter and clay content from measurements of spectral reflectance and
electrical conductivity. Acta Agric. Scand., Sect. B, Soil and Plant Sci. 54:232-
240.
Brown, D. J., K. D. Shepherd, M. G. Walsh, M. D. Mays, and T. G. Reinsch. 2005a.
Global soil characterization with VNIR diffuse reflectance spectroscopy.
Geoderma 132:273-290.
Brown, D. J., R. S. Bricklemyer, and P. R. Miller, 2005b. Validation requirements for
diffuse reflectance soil characterization models with a case study of VNIR soil
C prediction in Montana. Geoderma 129:251-267.
17
Cozzolino, D., and A. Morón. 2003. The potential of near-infrared reflectance
spectroscopy to analyse soil chemical and physical characteristics. J. Agric.
Sci. (Cambridge) 140:65-71.
Dalal, R. C., and R. J. Henry. 1986. Simultaneous determination moisture, organic
carbon and total nitrogen by near infrared spectroscopy. Soil Sci. Soc. Am. J.
50:120-123.
Dunn, B. W., H. G. Beecher, G. D. Batten, and S. Ciavarella. 2002. The potential of
near-infrared spectroscopy for soil analysis – a case study from the Riverine
Plain of south-eastern Australia. Australian Journal of Experimental
Agriculture 42:607-614.
Food and Agricultural Organization. 1998. World Reference Base for Soil Resources.
FAO, Rome.
Galvão, L. S., M. A. Pizzaro, and J. C. N. Epiphanio. 2001. Variations in reflectance
of tropical soils: spectral-chemical composition relationships from AVIRIS
data. Remote Sens. Environ. 75:245-255.
Glinka, K.D. 1927. Dokuchaiev’s Ideas in the Development of Pedology and Cognate
Sciences. 32 p. In Russian Pedology. Invest. I. Acad. Sci. USSR, Leningrad.
Ingleby, H. R. and T. G. Crowe. 2000. Reflectance models for predicting organic
carbon in Saskatchewan soils. Can. Agri. Eng. (42)2:57-63.
Islam, K., B. Singh, and A. McBratney, 2003. Simultaneous estimation of several soil
properties by ultra-violet, visible, and near-infrared reflectance spectroscopy.
Aust. J. Soil Res. 41:1101-1114.
Kariuki, P. C., T. Woldai and F. Van Der Meer. 2004. Effectiveness of spectroscopy
in identification of swelling indicator clay minerals. Int. J. Remote Sensing
25:455-469.
18
Lee, W. S., J. F. Sanchez, R. S. Mylavarapu, and J. S. Choe. 2003. Estimating
chemical properties of Florida soils using spectral reflectance. Trans. ASAE
46(5):1443–1453.
Lillesand, T. M., R. W. Kiefer, and J. W. Chipman. 2004. Remote sensing and image
interpretation. John Wiley & Sons, Ltd., New York.
Lobell, D. B., and G. P. Asner, 2002. Moisture effects on soil reflectance. Soil Sci.
Soc. Am. J. 66:722-727.
Malley, D. F., P. D. Martin, and E. Ben-Dor. 2004. Application in analysis of soils.
Near Infrared Spectroscopy in Agriculture. 44:729-784.
Martin, P. D., D. F. Malley, G. Manning, and L. Fuller. 2002. Determination of soil
organic carbon and nitrogen at the field level using near-infrared spectroscopy.
Can. J. Soil Sci. 82:413-422.
Milfred, C. J., and R. W. Kiefer, 1976. Analysis of soil variability with repetitive
aerial photography. Soil Sci. Soc. Am. J. 40:553-557.
Morón, A. and D. Cozzolino. 2002. Application of near infrared reflectance
spectroscopy for the analysis of organic C, total N and pH in soils of Uruguay.
J. Near Infrared Spectroscopy 10:215-221.
Nanni, M. R. and J. A. M. Demattê. 2006. Spectral Reflectance Methodology in
Comparison to Traditional Soil Analysis. Soil Sci. Soc. Am. J. 70:393-407.
Reeves, J. B. III, G. W. McCarty, and J. J. Meisinger. 1999. Near infrared reflectance
spectroscopy for the analysis of agricultural soils. J. Near Infrared Spectrosc.
7:179-193.
Salisbury, J. W., and D. M. D’Aria. 1992. Infrared (8-14 µm) remote sensing of soil
particle size. Remote Sens. Env. 42(2):157-165.
Shepherd, K. D. and M. G. Walsh, 2002. Development of reflectance spectral libraries
for characterization of soil properties. Soil Sci. Soc. Am. J. 66:988-998.
19
Shih, S. F., and J. D. Jordan. 1992. Landsat Mid-Infrared Data and GIS in Regional
Surface Soil-Moisture Assessment. Water Resour. Bull. 25(4):713-719.
Soil Survey Division Staff. 1993. Soil Survey Manual. Soil Conservation Service.
USDA-NRCS Agrc. Handb. 18. U. S. Gov. Print. Office, Washington, DC.
Soil Survey Division Staff. 1999. Soil Taxonomy: A basic system of soil classification
for making and interpreting soil surveys. USDA-NRCS Agric. Handb. 436. U.
S. Gov. Print. Office, Washington, DC.
Thomasson, J. A., R. Sui, M. S. Cox, and A. Al-Rajehy, 2001. Soil reflectance sensing
for determining soil properties in precision agriculture. Trans. ASAE
44(6):1445-1453.
USDA-NRCS. 2005. National Soil Survey Handbook, Title 430-VI. [Online].
Available at http://soils.usda.gov/technical/handbook (accessed 30 January
2007; verified 30 January 2007) USDA-NRCS-NSSC, Lincoln, NE.
USEPA. 2002. Methods for the Determination of Total Organic Carbon (TOC) in
Soils and Sediments. USEPA Rep. NCEA-C- 1282, EMASC-001. U. S. Gov.
Print. Office, Washington, DC.
Walkley, A. and I. A. Black, 1934. An examination of the Degtjareff method for
determining organic carbon in soils: Effect of variations in digestion conditions
and of inorganic soil constituents. Soil Sc. Soc. Am. J. 63:251-263.
Weidong, L., F. Baret, G. Xingfa, T. Qingxi, Z. Lanfen, and Z. Bing, 2002. Relating
soil surface moisture to reflectance. Remote Sens. Environ. 81:238-246.
Whiting, M. L., L. Li, and S. L. Ustin. 2004. Predicting water content using Gaussian
model on soil spectra. Remote Sens. Environ. 89:535-552.
Zhang, X., N. H. Younan, and C. G. O’Hara. 2005. Wavelet domain statistical
hyperspectral soil texture classification. IEEE Trans. Geosci. Remote Sens.
(43)3:615-618.
20
Chapter 2: Assessing Hyperspectral Sensing for Soil Survey
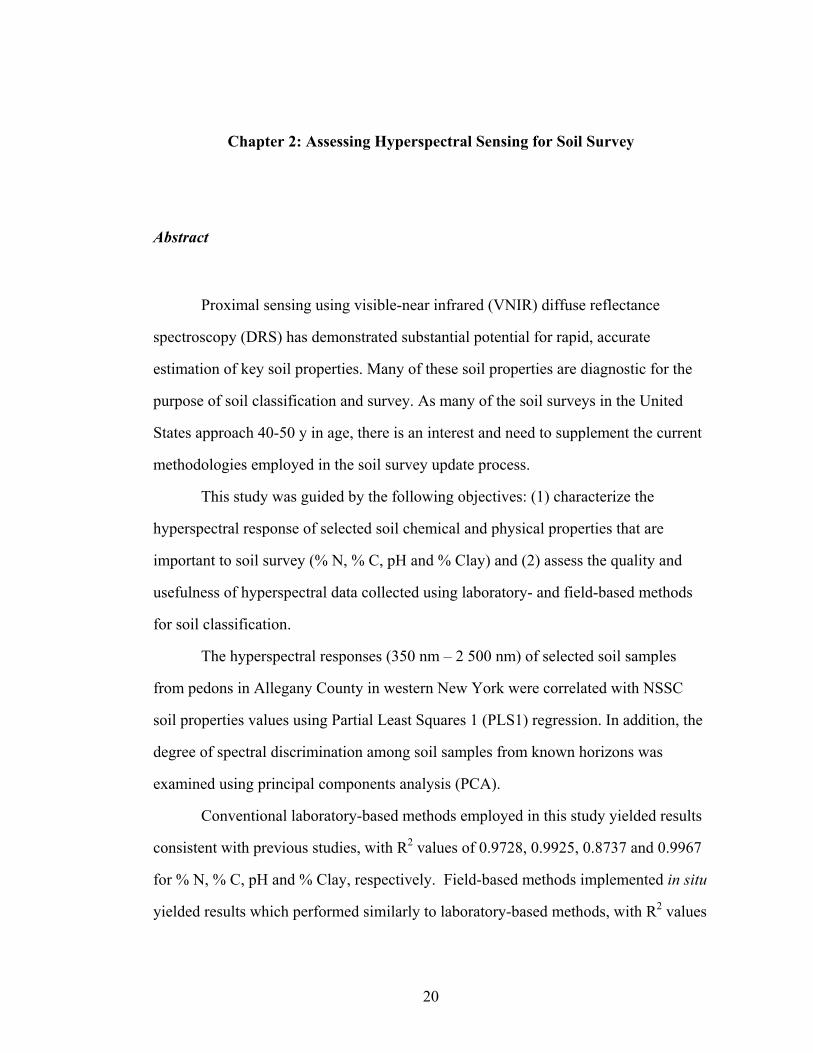
Abstract
Proximal sensing using visible-near infrared (VNIR) diffuse reflectance
spectroscopy (DRS) has demonstrated substantial potential for rapid, accurate
estimation of key soil properties. Many of these soil properties are diagnostic for the
purpose of soil classification and survey. As many of the soil surveys in the United
States approach 40-50 y in age, there is an interest and need to supplement the current
methodologies employed in the soil survey update process.
This study was guided by the following objectives: (1) characterize the
hyperspectral response of selected soil chemical and physical properties that are
important to soil survey (% N, % C, pH and % Clay) and (2) assess the quality and
usefulness of hyperspectral data collected using laboratory- and field-based methods
for soil classification.
The hyperspectral responses (350 nm – 2 500 nm) of selected soil samples
from pedons in Allegany County in western New York were correlated with NSSC
soil properties values using Partial Least Squares 1 (PLS1) regression. In addition, the
degree of spectral discrimination among soil samples from known horizons was
examined using principal components analysis (PCA).
Conventional laboratory-based methods employed in this study yielded results
consistent with previous studies, with R2 values of 0.9728, 0.9925, 0.8737 and 0.9967
for % N, % C, pH and % Clay, respectively. Field-based methods implemented in situ
yielded results which performed similarly to laboratory-based methods, with R2 values

21
of 0.9536, 0.9887, 0.9936 and 0.9905 for % N, % C, pH and % Clay, respectively.
Where model performance measures were less than expected, likely sources of error
included small sample sizes and variable soil moisture in the field setting, which has
been shown to influence soil spectral response.
In conclusion, the results of this study suggest that advanced proximal sensing
techniques, both laboratory-based and in situ, are worthy of additional study to assess
the full potential of this technology for soil survey. For VNIR DRS to be deployed for
field-based soil survey operations, potential users must have relevant information and
an appropriate level of training for them to use this technology in an efficient and
effective manner.
Introduction
This study was designed to characterize the hyperspectral response of selected
soil chemical and physical properties that are important to soil survey (% N, % C, pH
and % Clay) and assess the quality and usefulness of hyperspectral data collected
using laboratory- and field-based methods for soil classification.
Hyperspectral Remote and Proximal Sensing
Clay
The current literature presents a favorable assessment of the feasibility of
predicting clay content using VNIR spectroscopy. Shepherd and Walsh (2002)
obtained good results for clay prediction, which they noted could be related to cation
22
exchange capacity (CEC). This is a logical interpretation as the surface area of clay
minerals can be correlated to CEC. Similar results were found by Islam (2003). Broge
et al. (2004) obtained good to excellent clay prediction values, which are “best
estimated from the full spectral resolution (FSR) reflectance of dry soil samples.” This
assessment has implications for field sensing of soils with high clay content, which are
frequently located in areas of poor drainage within the study area.
In particular, the presence of several clay minerals can be detected using VNIR
spectroscopy. The most heavily studied clay minerals include kaolinite and
montmorillonite (Ben-Dor 2002). There are a few spectral features which are
amplified with higher kaolinite concentrations. Kariuki et al. (2004) indicated these
features occur at 2 170 and 2 340 nm. Galvão (2001) found important spectral features
in the same vicinity (2 160 – 2 200 nm). These may be diagnostic in assessing the
concentrations of kaolinite in soils which are likely to contain it. Montmorillonite also
contains several interesting spectral features which may be used to distinguish it
within soil samples. Water can be a major source of error in the detection of clay
minerals, as “the lattice-OH features diminished at [2 200 nm], suggesting that the
hygroscopic moisture is a major factor affecting clay minerals’ (and soil’s) spectra”
(Ben-Dor 2002). Nevertheless, a recent study found that VNIR spectroscopy can be
used to predict kaolinite and montmorillonite with excellent accuracy (Brown et al.
2005a).
Carbon
Soil organic carbon content (SOC) is an important soil property which affects
soil fertility, mapping and classification, and soil suitability for various uses. Soil
organic carbon (SOC) content and soil organic matter (SOM) are important soil
23
properties which affect soil fertility, development suitability and classification.. The
distribution of SOC with depth indicates soil deposition/formation and transformations
as influenced by land use practices. Soil organic matter directly impacts soil fertility
through its influence on soil properties, such as aggregation, increased porosity,
decreased bulk density (BD), promotes air/water infiltration, reduces plasticity and
cohesion, increases available water holding capacity (AWC), has a high CEC, and
releases nitrogen, phosphorus, and sulfur as it decomposes. SOM also directly impacts
soil color, as samples with black SOM do not oxidize as those with black
monosulfides do when exposed to air, which can affect the color of dry samples.
These are some primary soil components used in the field for mapping and classifying
soils.
The use of VNIR hyperspectral sensing to predict SOC is a popular area of
research. Thomasson et al. (2001) cited a study by Ingleby and Crowe (2000) which
predicted SOC with R2 values of 0.73 – 0.89 on five fields in Saskatchewan. Brown et
al. (2005b) predicted SOC with R2 values of 0.39 – 0.85 on several sites in north-
central Montana. Martin et al. (2002) predicted SOC with R2 values of 0.75 – 0.78 for
concentrations of 0 – 40 mg g-1 and 0.80 for concentrations of 0 – 20 mg g-1 for soils
in Manitoba. These and other studies indicate that SOC can be predicted relatively
accurately using VNIR hyperspectral sensing and warrants further research under
more variable field conditions.
pH
A critical soil property is pH, which has important implications for soil fertility
and has diagnostic value in terms of classifying soil horizons. Currently, pH is
estimated in the field using the traditional Cornell pH Kit, or similar methods. Since
24
this method is highly visual and is subject to interpretation, there is an interest in
establishing more consistent measures of pH under field conditions using diffuse
reflectance spectroscopy. Diffuse reflectance spectroscopy is highly sensitive to
carbon, with which pH is highly correlated. Several studies have used hyperspectral
sensing to estimate pH. Dunn et al. (2002) predicted pH with an R2 value of 0.80 using
417 samples from southeastern Australia with a pH range of 5.30-8.80. In Uruguay,
Morón and Cozzolino (2002) estimated pH with an R2 value of 0.93 using 332
samples with a pH range of 5.1-7.9. Analysis of soil samples from Maryland (n=179)
resulted in an R2 value of 0.73 for a Ph range of 4.40 – 7.30 (Reeves et al., 1999).
Among other factors, the limited range of possible values for pH can degrade
prediction ability, but this can clearly be overcome using a sufficient sample size.
Remote sensing and soil survey
Remote sensing and soil survey have served complementary roles throughout
the 20th Century. As the demand for high-quality soil information increased, soil
survey teams required more efficient methods of resource inventory and analysis. The
emerging field of photogrammetry was quickly applied to soil survey, enabling the
systematic acquisition of data for the area of field operations.
Aerial photography offers several clear advantages for the soil surveyor. The
practice using photo forward lap and side lap into flight plans allows for stereoscopic
coverage throughout the study area. This allows the soil surveyor to examine the
topography of their survey area in more detail before they go out in the field. In
addition, infrared photography can provide valuable information to soil surveyors. In
areas where vegetation and management are relatively uniform, variations in tone can
25
correspond with variation in soil fertility or other key diagnostic soil properties. While
soil fertility is typically not a consideration in soil taxonomy, it can be correlated with
contributing soil properties which are part of the soil classification system.
A major limitation of conventional satellite remote sensing is that it is typically
only capable of collecting information relevant to the soil surface. While this can
provide useful support for agricultural operations, soil surveyors require information
about the upper 2 m of soil. Nevertheless, several studies have used remote sensing to
extract soils information. Barnes et al. (2003) employed several platforms, including
SPOT-HRV, NIR DRS, conductance meters and ground penetrating radar, to assess
multiple soil properties. Shih and Jordan (1992) used Landsat SWIR (TM band 7) to
determine surface soil moisture in Lee County in Florida. Nanni and Demattê (2006)
examined the utility of Landsat TM bands 3 and 4 to predict surface soil properties,
with acceptable R2 performance for sand (0.52), clay (0.67), OM (0.51), the silt/clay
ratio (0.56), SC (0.49), CEC (0.55) and silica (0.59).
Objectives
This study is guided by the following objectives: (1) characterize the
hyperspectral response of selected soil chemical and physical properties that are
important to soil survey, and (2) assess the quality and usefulness of hyperspectral
data collected using laboratory- and field-based methods for soil classification.
26
Materials and Methods
Study Sites Description
Soil pedons were selected by the USDA-NRCS soil survey team based in
Belmont, NY as a part of their efforts to update the soil survey for counties in western
New York. The pedons are located in Allegany County at the SUNY-Alfred research
farm. The elevation range for the sites where pedons were sampled is 424 – 691 m.
Laboratory analyses
CNAL
All soil samples were analyzed by the Cornell Nutrient Analysis Laboratory
(CNAL) in Ithaca, NY to determine their physical and chemical properties. Percent
Nitrogen (N) was determined using a dry oxidation (combustion) method after Pella
(1990). Percent C was determined using a dry combustion method after Nelson and
Sommers (1996) and Pella (1990). Percent organic matter was assessed by calculating
the loss on ignition. Soil pH was measured in water using a method developed by
Eckert and Sims (1995). Particle size was determined using the pipette method as
described by Gee and Or (2002).
27
NSSC
All soil samples were also analyzed by the National Soil Survey Laboratory at
the National Soil Survey Center (NSSC) in Lincoln, Nebraska, to determine their
physical and chemical properties. Percent N was determined using a dry oxidation
(combustion) method after Bremner (1996). Percent C was determined using a dry
combustion method after Nelson and Sommers (1996). Soil pH was measured in water
using a method developed by Foth and Ellis (1988). Particle size (% sand, silt, clay)
was determined using the pipette method refined by Gee and Or (2002) and published
in the Soil Survey Laboratory Methods Manual.
Hyperspectral measurements: Field
Soil pits were excavated to provide access for soil profile description and
sampling. While the soil pits varied slightly, typical dimensions were 2.5 m (length)
by 0.5 m (width) by 1.75 m (depth). These dimensions are larger than most soil pits
and were designed to accommodate the ASD FieldSpec Pro FR spectrometer
(Analytical Spectral Devices, Inc., Boulder, CO; www.asdi.com) and two or three
people needed for soil spectra collection. The pedon face was then cleaned to reduce
any soil mixing effects caused by the excavation equipment. While the soil profile was
being prepared for description and sampling, the spectrometer was prepared to acquire
spectral data. A dark current was measured for calibration purposes. The instrument
was also calibrated to a white reference before each soil profile was scanned.
Soil surveyors typically analyze soil pedons by horizon, so most spectral data
were collected by horizon as well. To accomplish this, NRCS soil surveyors
28
physically marked each soil horizon boundaries. To mitigate any periodicity in the soil
profile, a random starting point between 0 – 5 cm from the left side of the excavated
and prepared pedon was chosen near the middle of each horizon in the vertical
dimension. Three sets of spectra were collected for each horizon, with the random
starting point and the second and third points located 10 cm and 20 cm away from the
first point, respectively.
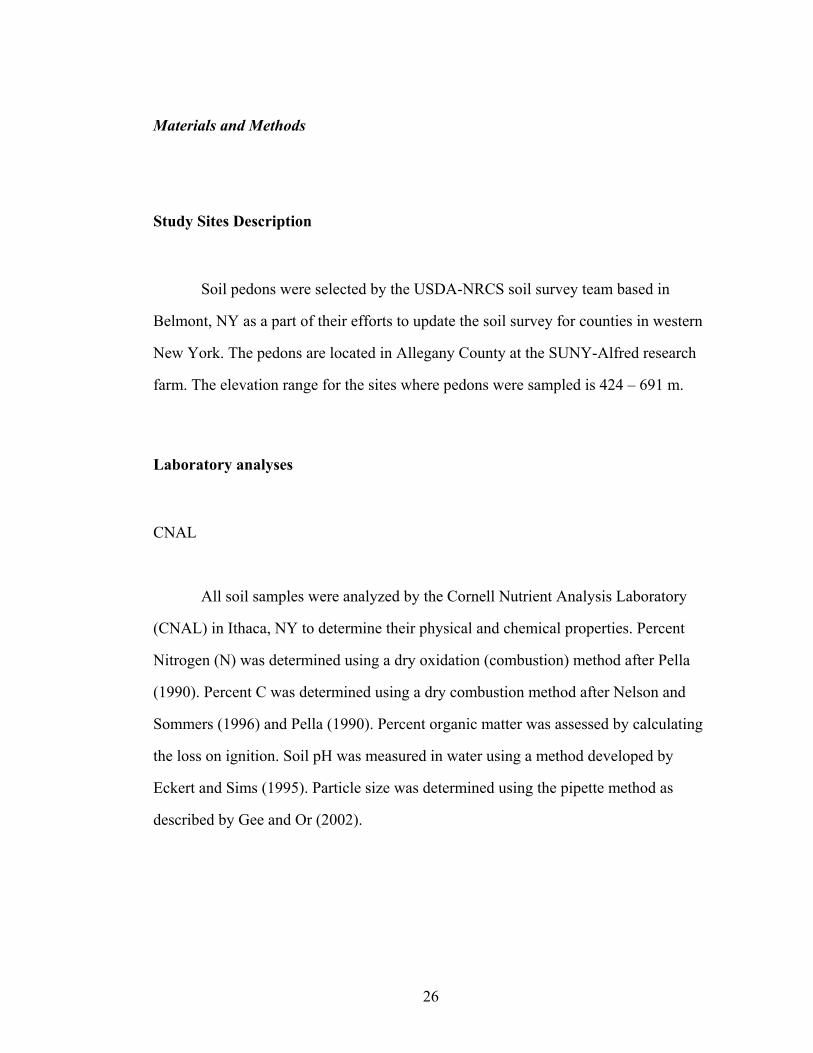
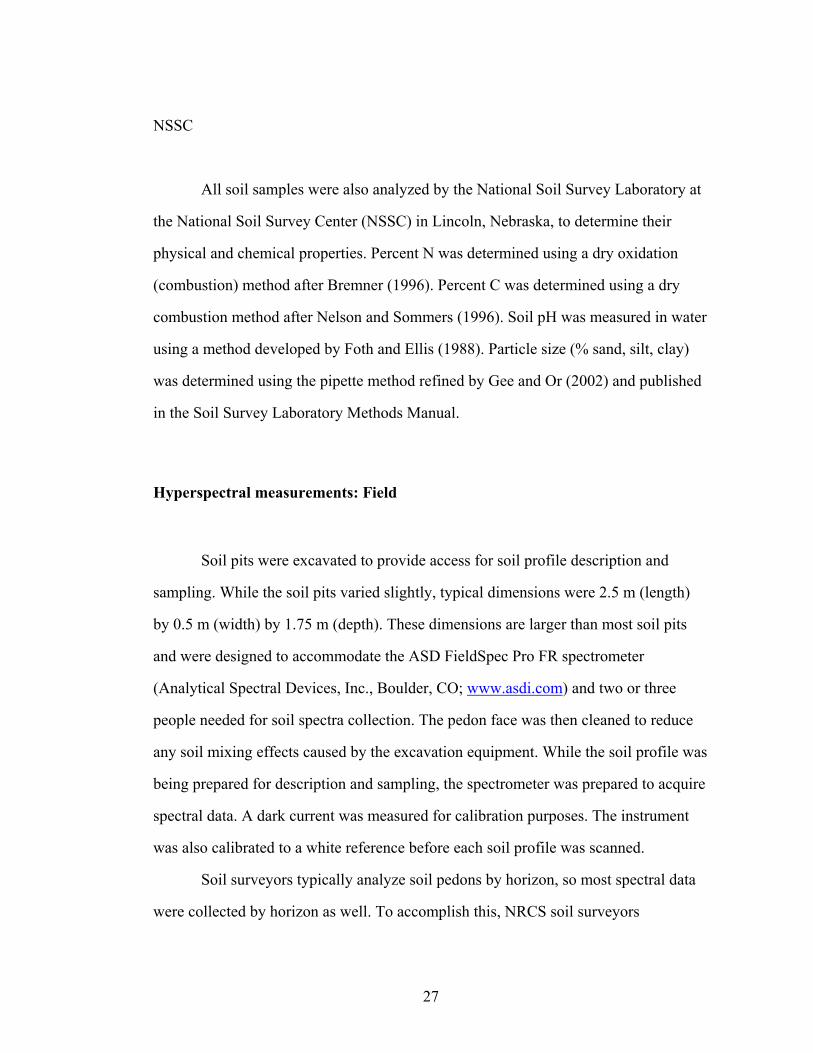
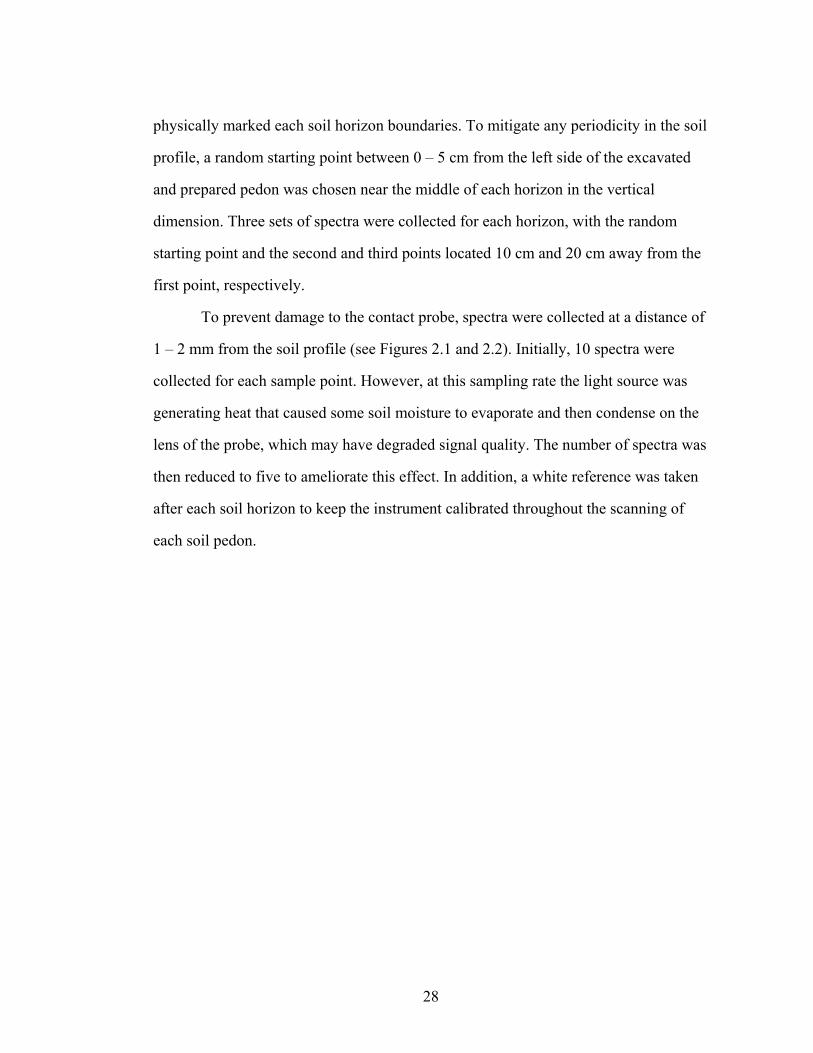
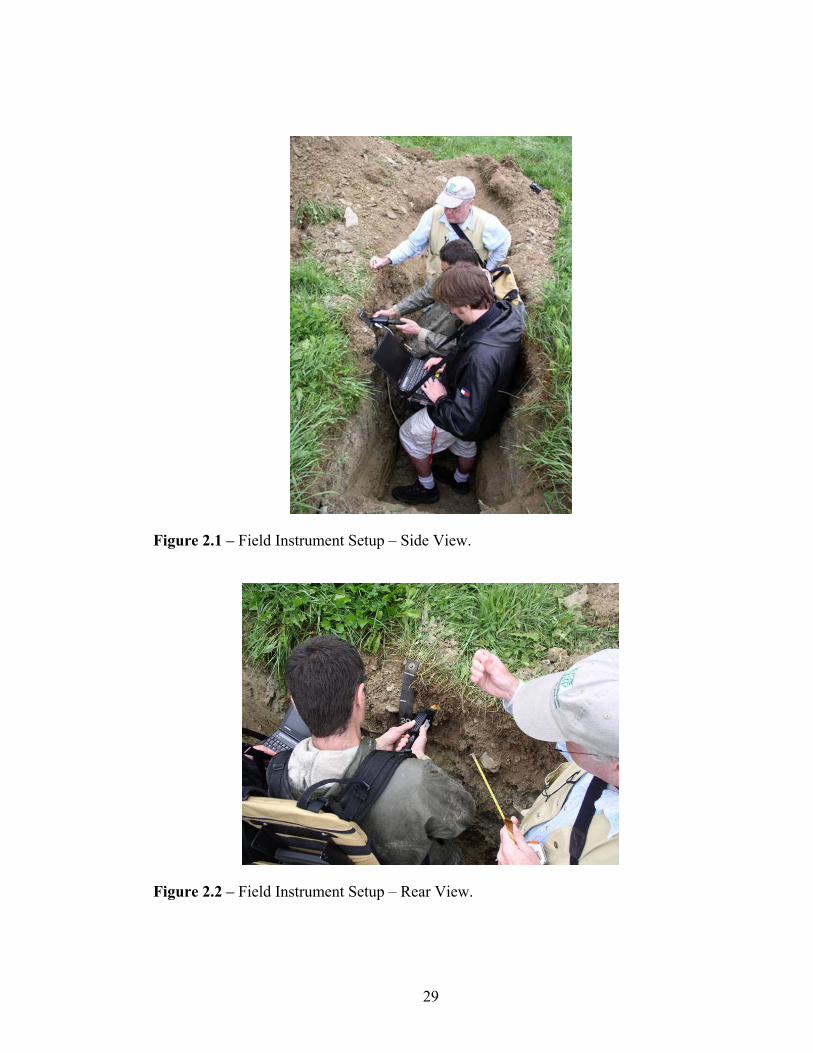
To prevent damage to the contact probe, spectra were collected at a distance of
1 – 2 mm from the soil profile (see Figures 2.1 and 2.2). Initially, 10 spectra were
collected for each sample point. However, at this sampling rate the light source was
generating heat that caused some soil moisture to evaporate and then condense on the
lens of the probe, which may have degraded signal quality. The number of spectra was
then reduced to five to ameliorate this effect. In addition, a white reference was taken
after each soil horizon to keep the instrument calibrated throughout the scanning of
each soil pedon.
29
Figure 2.1 – Field Instrument Setup – Side View.
Figure 2.2 – Field Instrument Setup – Rear View.
30
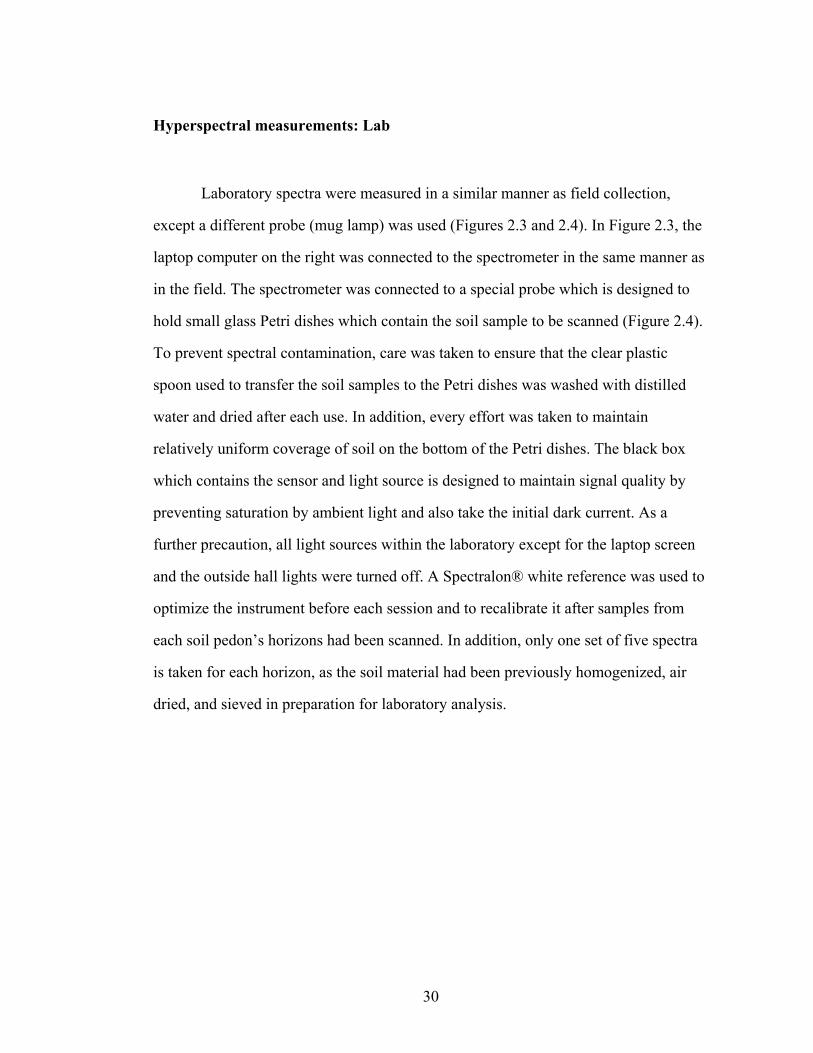
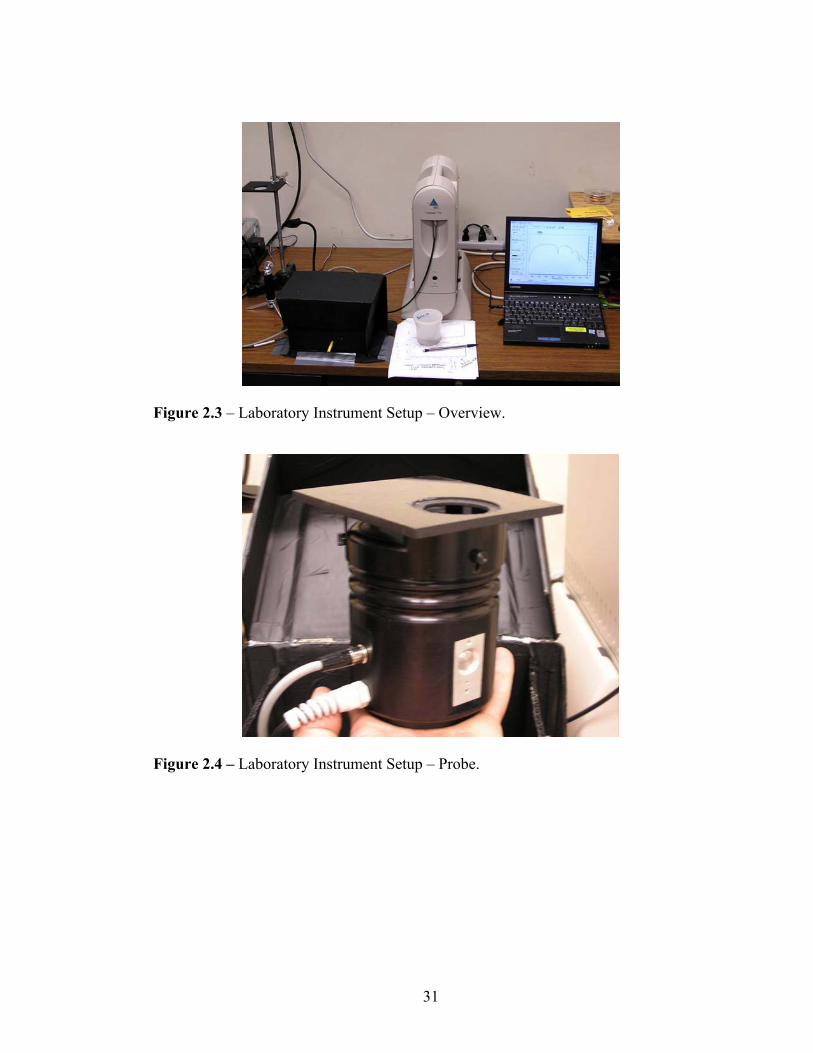
Hyperspectral measurements: Lab
Laboratory spectra were measured in a similar manner as field collection,
except a different probe (mug lamp) was used (Figures 2.3 and 2.4). In Figure 2.3, the
laptop computer on the right was connected to the spectrometer in the same manner as
in the field. The spectrometer was connected to a special probe which is designed to
hold small glass Petri dishes which contain the soil sample to be scanned (Figure 2.4).
To prevent spectral contamination, care was taken to ensure that the clear plastic
spoon used to transfer the soil samples to the Petri dishes was washed with distilled
water and dried after each use. In addition, every effort was taken to maintain
relatively uniform coverage of soil on the bottom of the Petri dishes. The black box
which contains the sensor and light source is designed to maintain signal quality by
preventing saturation by ambient light and also take the initial dark current. As a
further precaution, all light sources within the laboratory except for the laptop screen
and the outside hall lights were turned off. A Spectralon® white reference was used to
optimize the instrument before each session and to recalibrate it after samples from
each soil pedon’s horizons had been scanned. In addition, only one set of five spectra
is taken for each horizon, as the soil material had been previously homogenized, air
dried, and sieved in preparation for laboratory analysis.
31
Figure 2.3 – Laboratory Instrument Setup – Overview.
Figure 2.4 – Laboratory Instrument Setup – Probe.
32
Field sampling
After the soil pit was excavated and pedon face prepared, each horizon was
scanned using ASD Field Spectroradiometer. The NRCS soil survey team then
described each horizon and collected soil samples for submission to the National Soil
Survey Center (NSSC) in Lincoln, NE. Subsamples from each horizon were collected
in resealable bags for submission to the Cornell Nutrient Analysis Laboratory (CNAL)
for physical and chemical analysis and scanning of air-dried samples. To prevent
moisture loss, duct tape was used to seal each sample bag. Each bag was labeled with
the NRCS soil survey pedon number, the date collected and the depth of each horizon
in cm were recorded on each sample bag. Where a horizon was scanned in the field, its
corresponding sample was weighed in the lab before it was submitted to CNAL. After
each sample had been oven-dried at 50 ºC for 15 h, the samples were weighed again
and the bags tared to calculate the gravimetric soil moisture content. The samples were
then sieved and ground to produce two soil products; one with a maximum particle
size of 2 mm and one with a minimum particle size of greater than 2 mm. These sizes
were selected to evaluate the potential effect(s) of particle size on spectra collected in
the laboratory. The soil samples were then submitted to CNAL for analysis.
Data analysis
To facilitate data analysis, the native files were imported into the Unscrambler
(CAMO PROCESS AS, Oslo, Norway) applications program. The Unscrambler is a
multivariate data analysis tool which can aid in the investigation of potential
relationships between spectral reflectance and lab-acquired data. The resulting file was
33
averaged by a factor of 15 (representing the 15 spectra acquired per horizon), yielding
one spectrum for each horizon.
Modeling
Partial Least Squares Regression (PLSR)
Partial least-squares regression (PLSR) is used to evaluate the statistical
contributions of many X-variables (predictors) to one (PLS1) or more (PLS2) Y-
variables (responses) (Geladi and Kowalski, 1986; Wold et al., 2001). In this study,
the reflectance values for all 2 151 spectral wavelengths comprise the set of X-
variables. Selected physical and chemical soils properties are the Y-variables. This
study is interested in predicting individual soil properties, and as a result uses PLS1
regression. In addition, PLS1 regression provides a means to evaluate the importance
of each spectral wavelength in determining individual soils properties. While not
examined in this study, it may be potentially useful in future investigations. PLS1
regression is also used extensively in related literature, so comparisons can be made
between results in this and other studies.
Validation is achieved using the full cross validation method, “where some
samples are kept out of the calibration and used for prediction. This is repeated until
all samples have been kept out once. Validation residual variance can then be
computed from the prediction residuals…In full cross-validation, only one sample at a
time is kept out of the calibration” (Esbensen 2002). Please see the Appendix for
additional information on model development.
34
Principal Components Analysis (PCA)
Principal components analysis (PCA) is an effective method of estimating the
degree of similarity between spectral samples. PCA scores, at̂ , from two selected
principal components are commonly displayed visually on a plot. Clustering of scores
indicates similarity in the variance structure, while scores which are more evenly
distributed indicate dissimilarity. While PCA is a part of PLS1 regression, it is used
here to simply compare the variance structure of spectral samples to assess similarity
among horizon types and differences between horizon types.
Results
The following tables and plots present statistical analyses conducted for
selected soil physical and chemical properties. Soil property values for samples
scanned in the field (in situ) and in the laboratory are shown in Table 2.1. PLS1
regression R2 values are presented by year of spectral acquisition (2005), study area
(Allegany County), acquisition environment (field or lab) and spectral pre-treatment
(raw or first derivative) (Tables 2.2 – 2.3).. In addition, plots showing the measured
versus the predicted soil properties values (as well as other statistical measures) are
included (Figures 2.5 – 2.8). PCA results illustrate the spectral discrimination between
and among spectral samples collected by horizon in situ (Figure 2.9 and in the
laboratory (Figure 2.10).
35
Table 2.1 – Soil property value ranges – Allegany County (2005).
Property Field (NSSC)
N = 12
Lab (NSSC)
N = 18
% N 0.04 – 0.44 0.04 – 0.44
% C 0.07 – 4.06 0.07 – 4.06
pH 5.00 – 8.20 5.00 – 8.20
% Clay 25.40 – 41.00 25.40 – 41.00
Table 2.2 – PLS1 R2 Values – Allegany County 2005 (Field, NSSC).
Property Calibration
(Raw)
Validation
(Raw)
Calibration
(First
Derivative)
Validation
(First
Derivative)
% N 0.9536 0.8851 0.9833 0.2850
% C 0.9887 0.9278 0.9615 0.1762
pH 0.9936 0.3641 1.0000 0.4269
% Clay 0.9905 0.8586 0.8685 -0.5742
36
Table 2.3 – PLS1 R2 Values – Allegany County 2005 (Lab, NSSC).
Property Calibration
(Raw)
Validation
(Raw)
Calibration
(First
Derivative)
Validation
(First
Derivative)
% N 0.9728 0.9383 0.9999 0.8268
% C 0.9925 0.9772 0.9998 0.8528
pH 0.8737 0.7206 0.8044 0.5575
% Clay 0.9967 0.8455 0.9990 0.8068
37
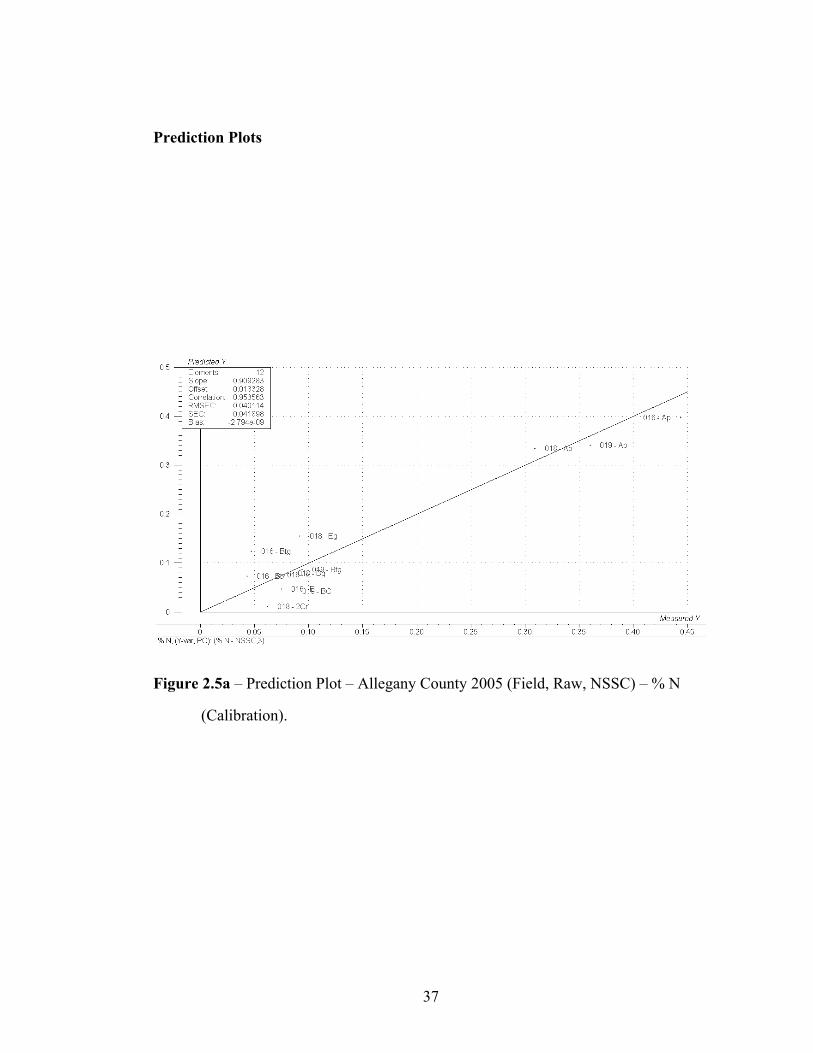
Prediction Plots
Figure 2.5a – Prediction Plot – Allegany County 2005 (Field, Raw, NSSC) – % N
(Calibration).
38
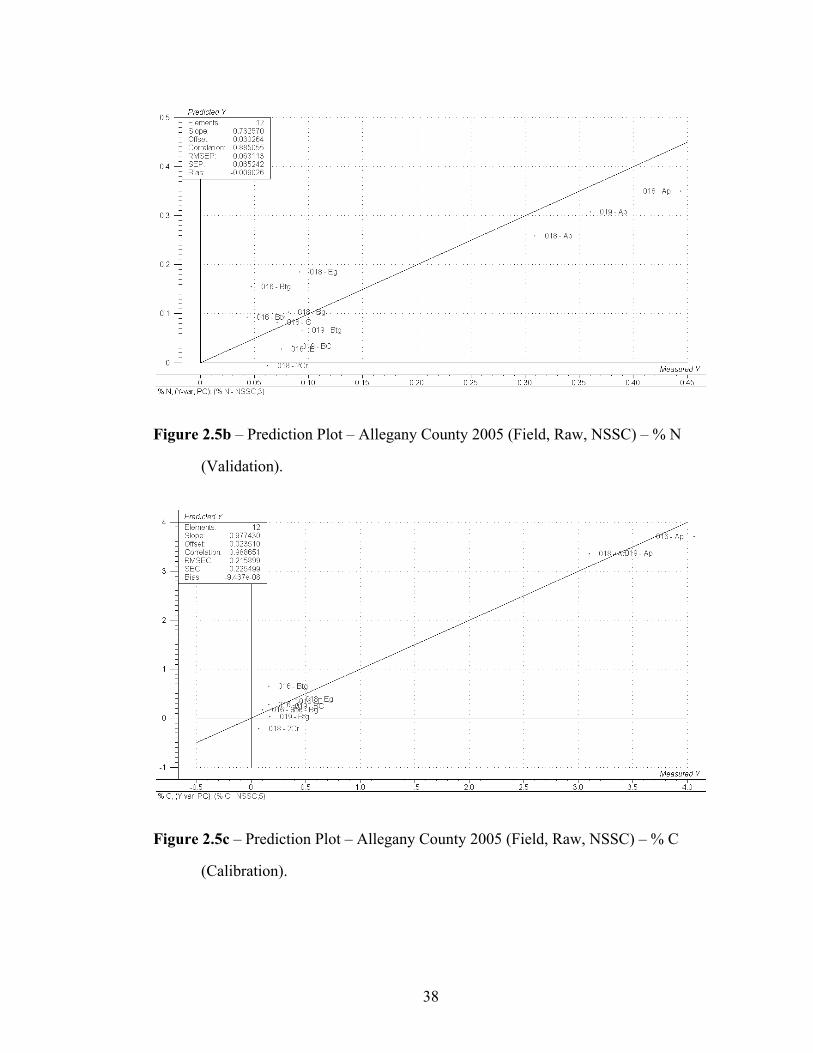
Figure 2.5b – Prediction Plot – Allegany County 2005 (Field, Raw, NSSC) – % N
(Validation).
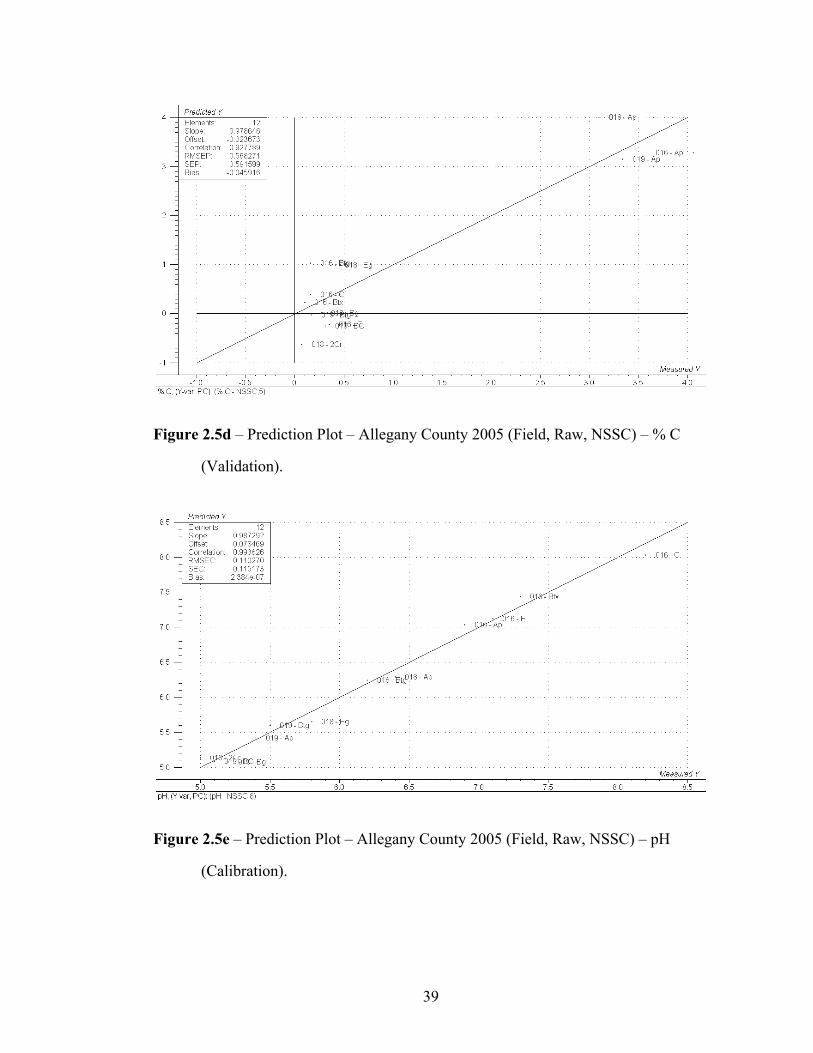
Figure 2.5c – Prediction Plot – Allegany County 2005 (Field, Raw, NSSC) – % C
(Calibration).
39
Figure 2.5d – Prediction Plot – Allegany County 2005 (Field, Raw, NSSC) – % C
(Validation).
Figure 2.5e – Prediction Plot – Allegany County 2005 (Field, Raw, NSSC) – pH
(Calibration).
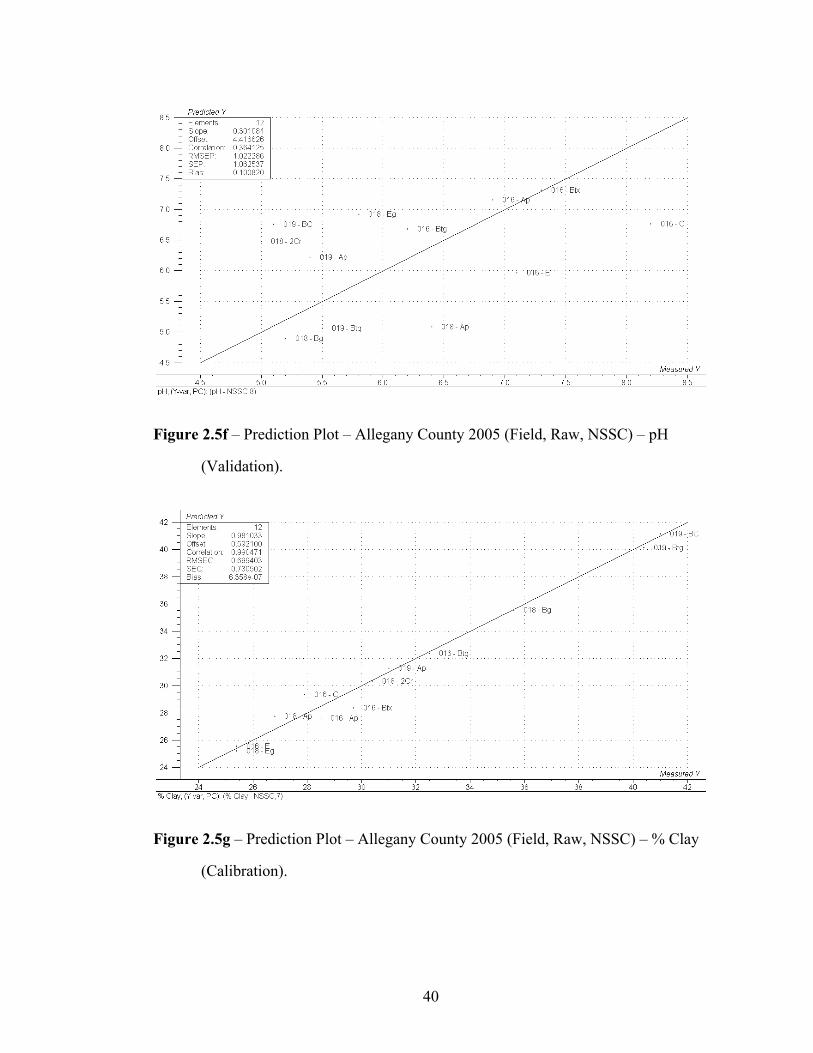
40
Figure 2.5f – Prediction Plot – Allegany County 2005 (Field, Raw, NSSC) – pH
(Validation).
Figure 2.5g – Prediction Plot – Allegany County 2005 (Field, Raw, NSSC) – % Clay
(Calibration).
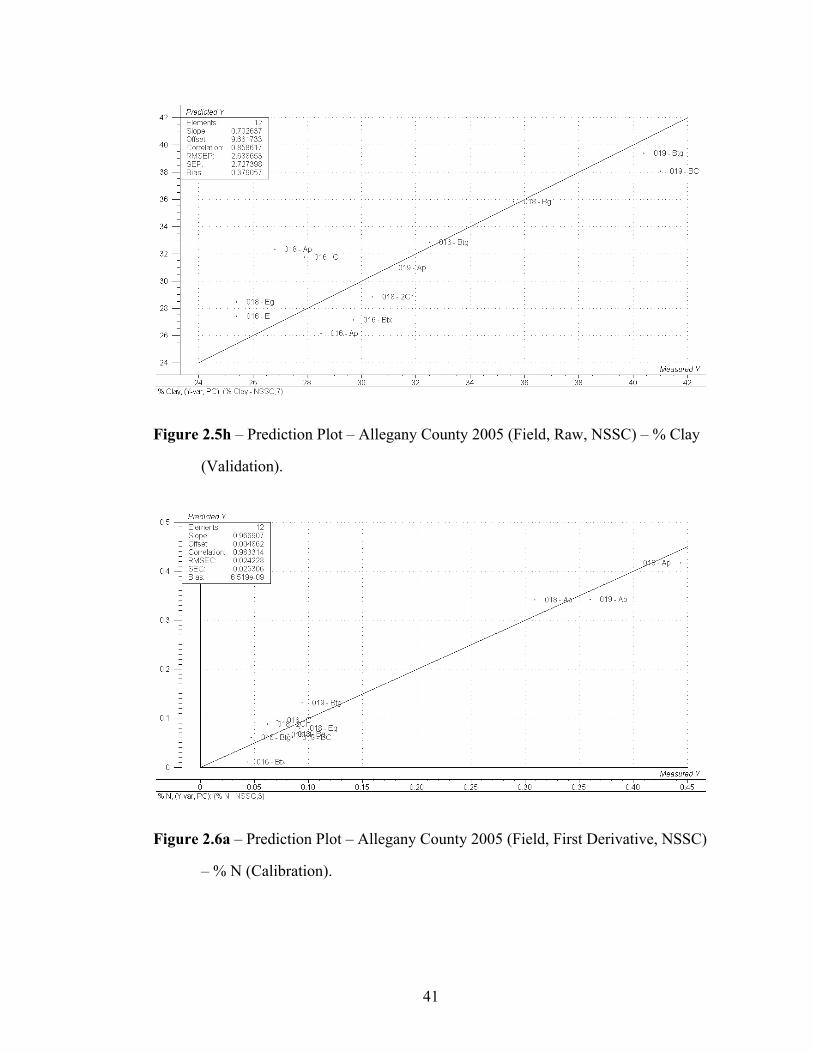
41
Figure 2.5h – Prediction Plot – Allegany County 2005 (Field, Raw, NSSC) – % Clay
(Validation).
Figure 2.6a – Prediction Plot – Allegany County 2005 (Field, First Derivative, NSSC)
– % N (Calibration).
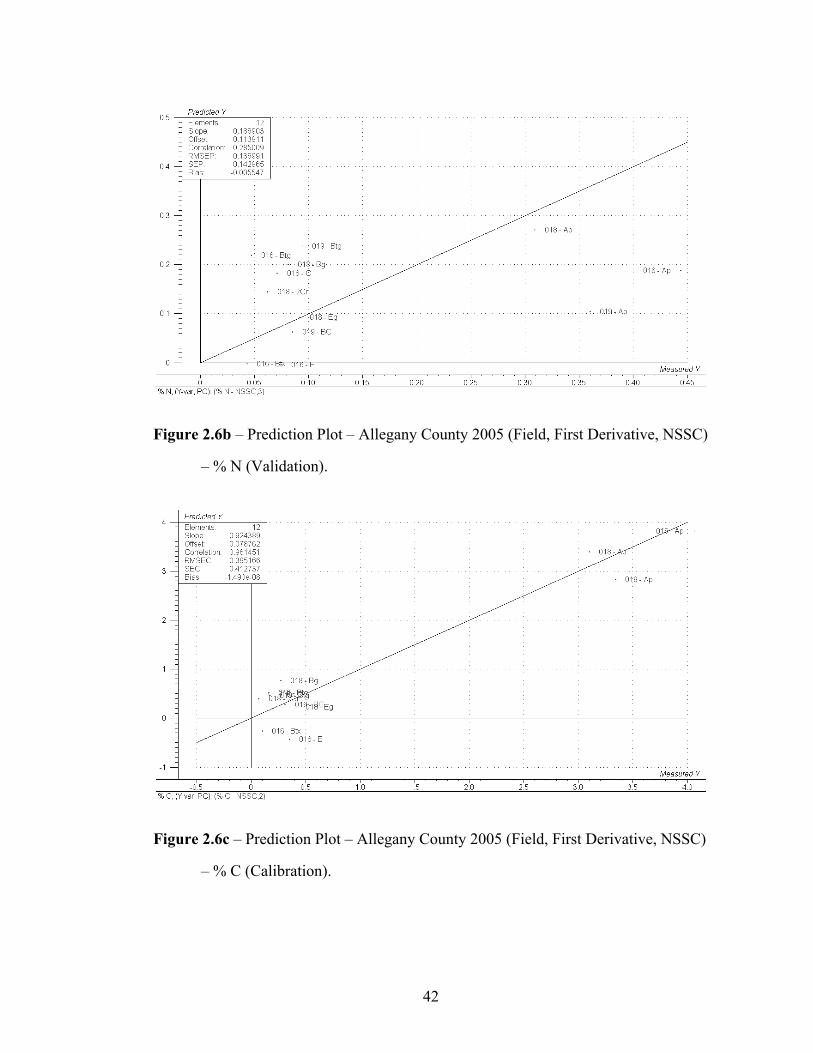
42
Figure 2.6b – Prediction Plot – Allegany County 2005 (Field, First Derivative, NSSC)
– % N (Validation).
Figure 2.6c – Prediction Plot – Allegany County 2005 (Field, First Derivative, NSSC)
– % C (Calibration).
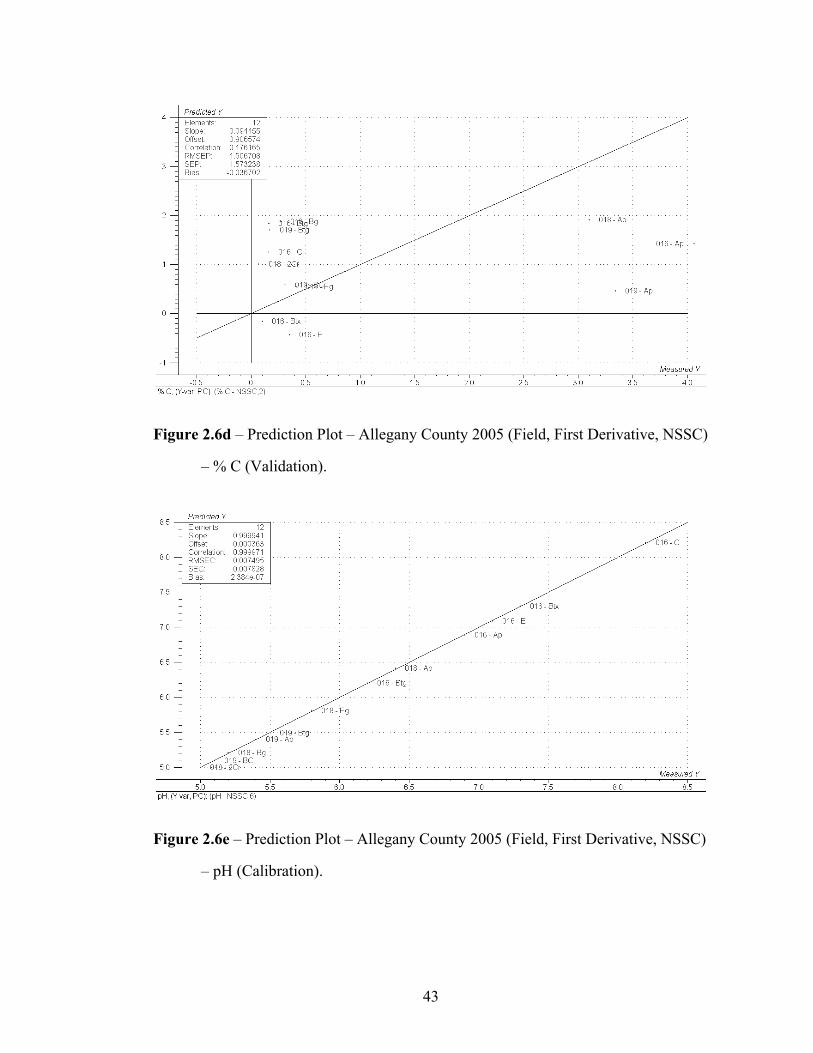
43
Figure 2.6d – Prediction Plot – Allegany County 2005 (Field, First Derivative, NSSC)
– % C (Validation).
Figure 2.6e – Prediction Plot – Allegany County 2005 (Field, First Derivative, NSSC)
– pH (Calibration).
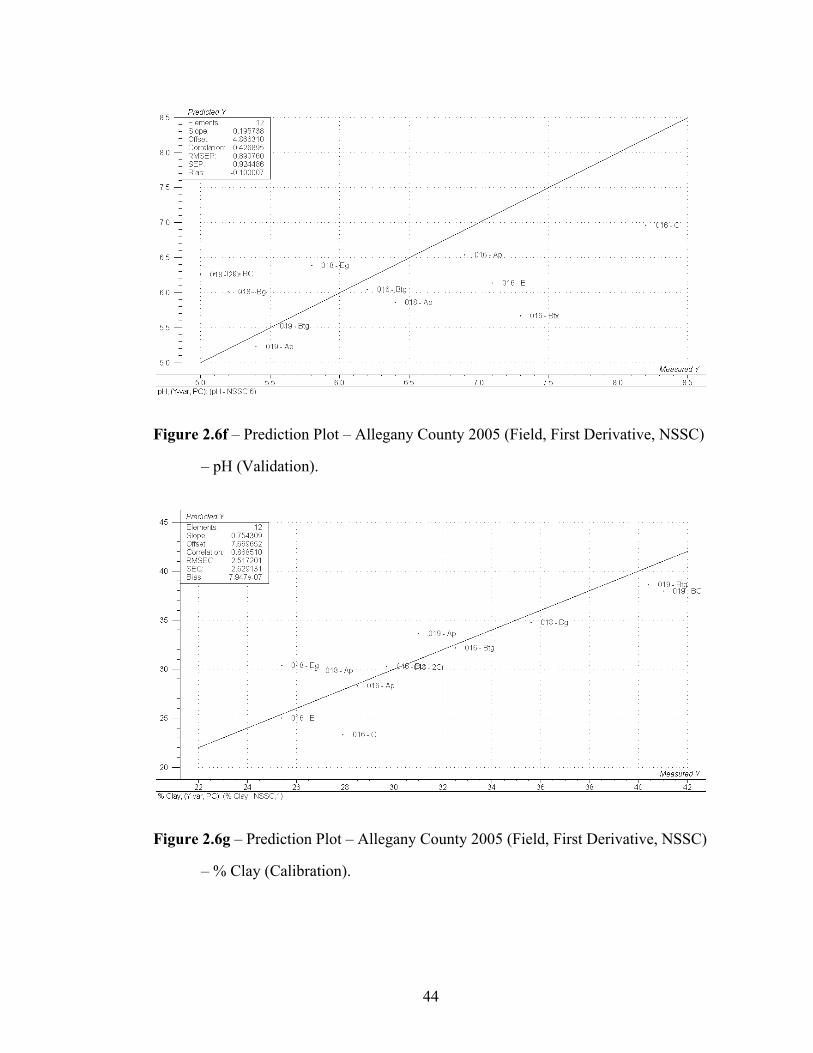
44
Figure 2.6f – Prediction Plot – Allegany County 2005 (Field, First Derivative, NSSC)
– pH (Validation).
Figure 2.6g – Prediction Plot – Allegany County 2005 (Field, First Derivative, NSSC)
– % Clay (Calibration).
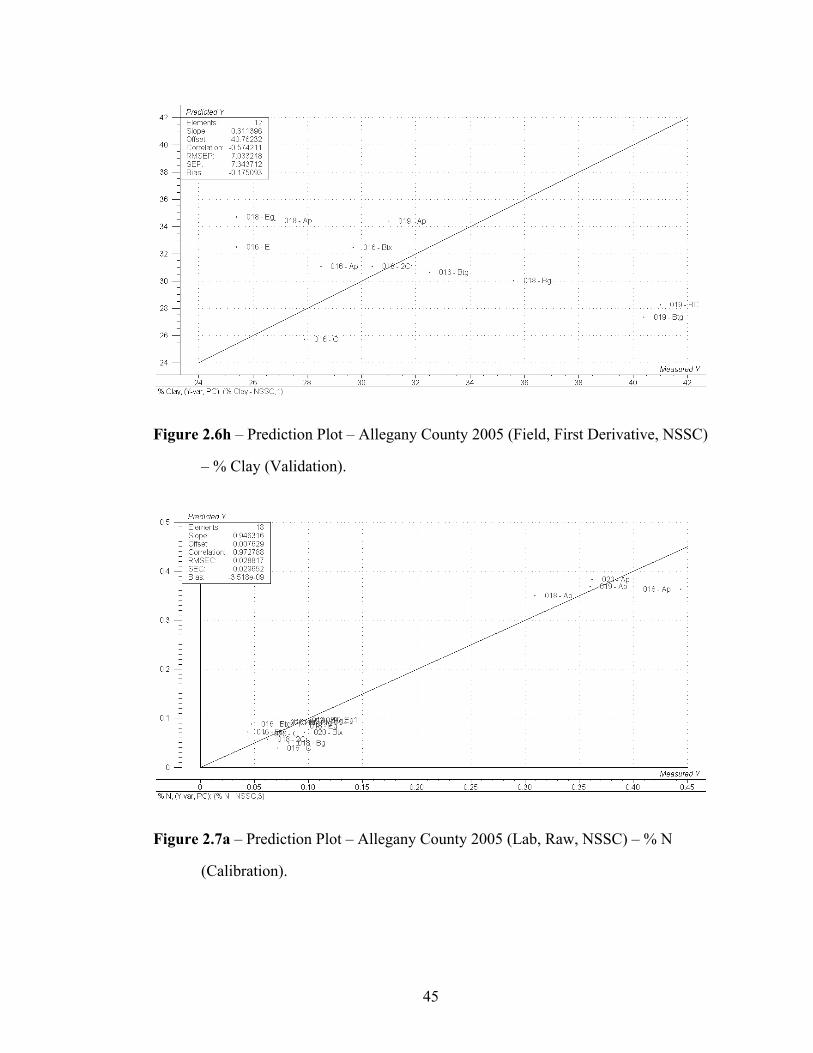
45
Figure 2.6h – Prediction Plot – Allegany County 2005 (Field, First Derivative, NSSC)
– % Clay (Validation).
Figure 2.7a – Prediction Plot – Allegany County 2005 (Lab, Raw, NSSC) – % N
(Calibration).
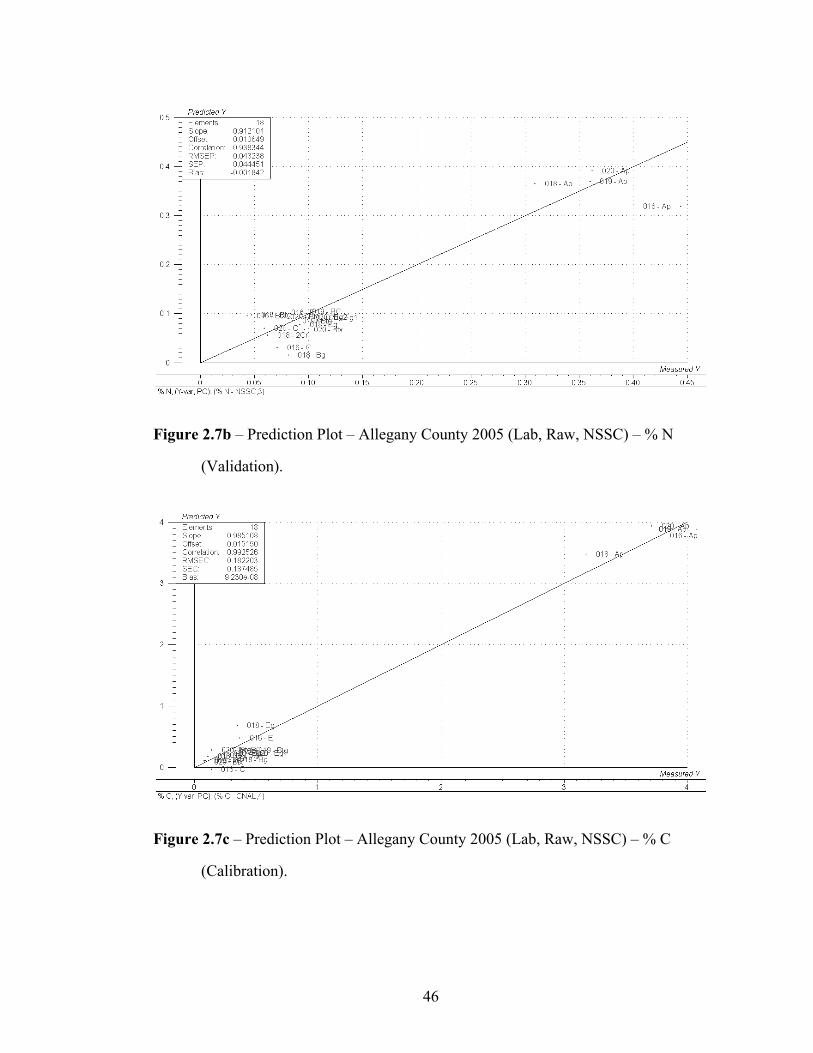
46
Figure 2.7b – Prediction Plot – Allegany County 2005 (Lab, Raw, NSSC) – % N
(Validation).
Figure 2.7c – Prediction Plot – Allegany County 2005 (Lab, Raw, NSSC) – % C
(Calibration).
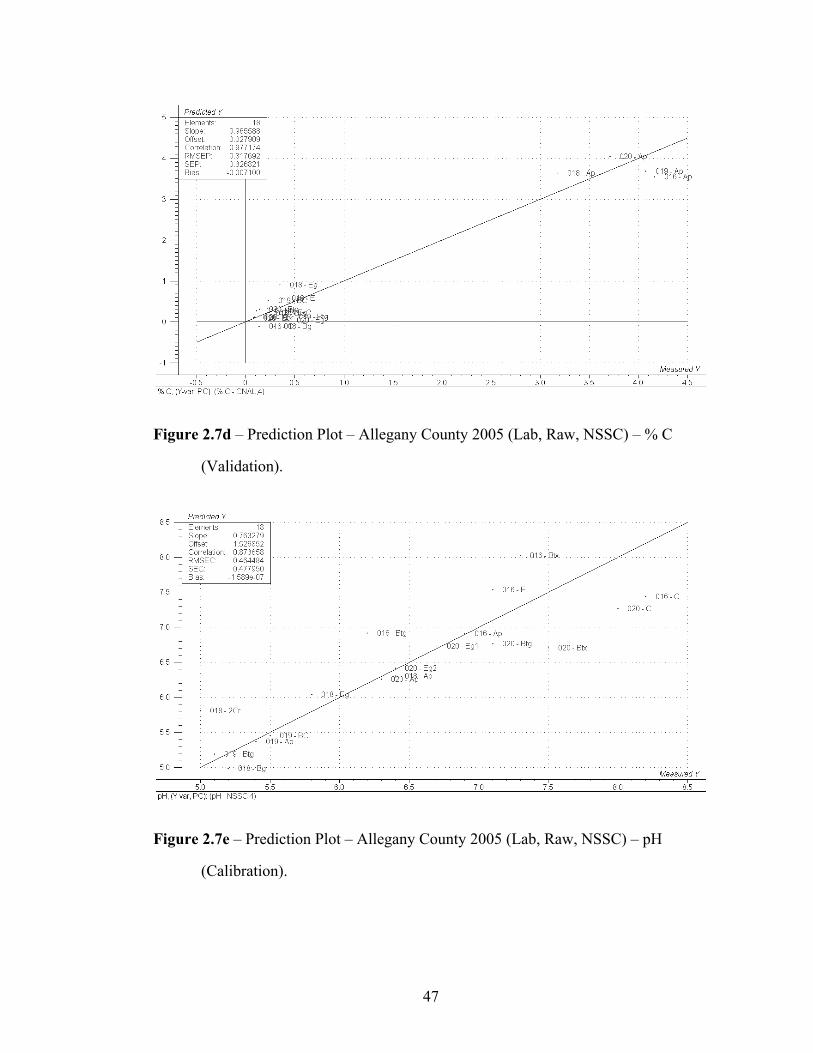
47
Figure 2.7d – Prediction Plot – Allegany County 2005 (Lab, Raw, NSSC) – % C
(Validation).
Figure 2.7e – Prediction Plot – Allegany County 2005 (Lab, Raw, NSSC) – pH
(Calibration).
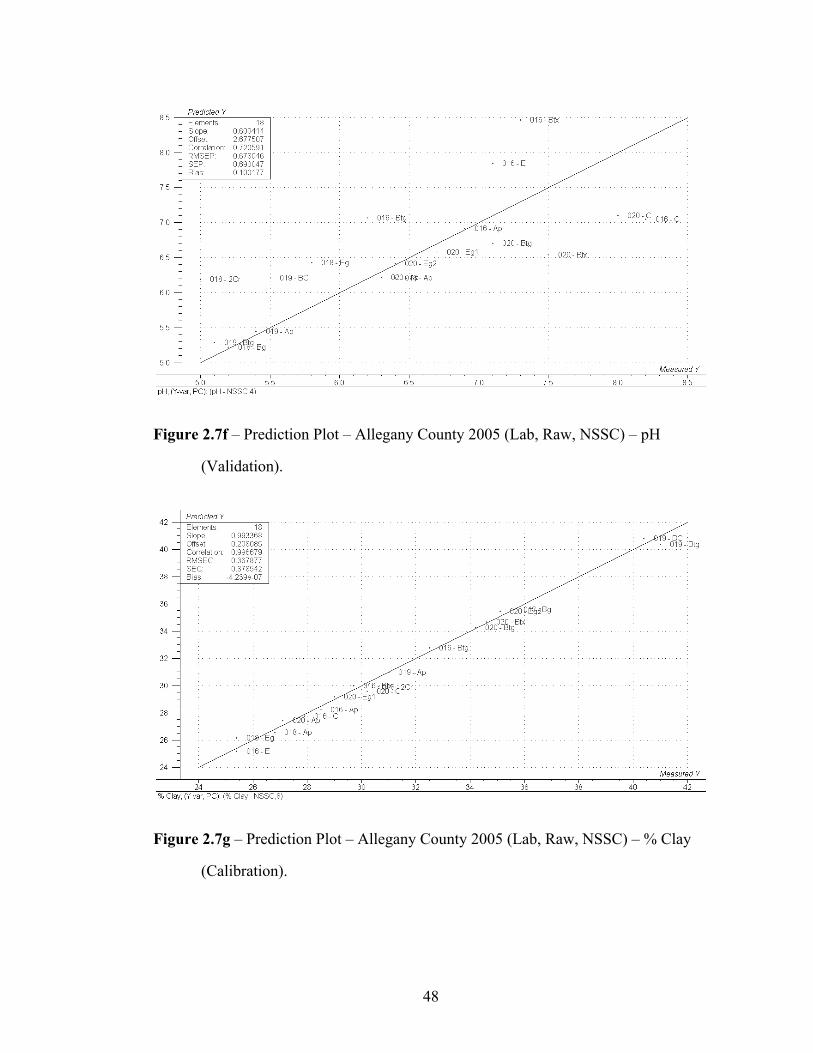
48
Figure 2.7f – Prediction Plot – Allegany County 2005 (Lab, Raw, NSSC) – pH
(Validation).
Figure 2.7g – Prediction Plot – Allegany County 2005 (Lab, Raw, NSSC) – % Clay
(Calibration).
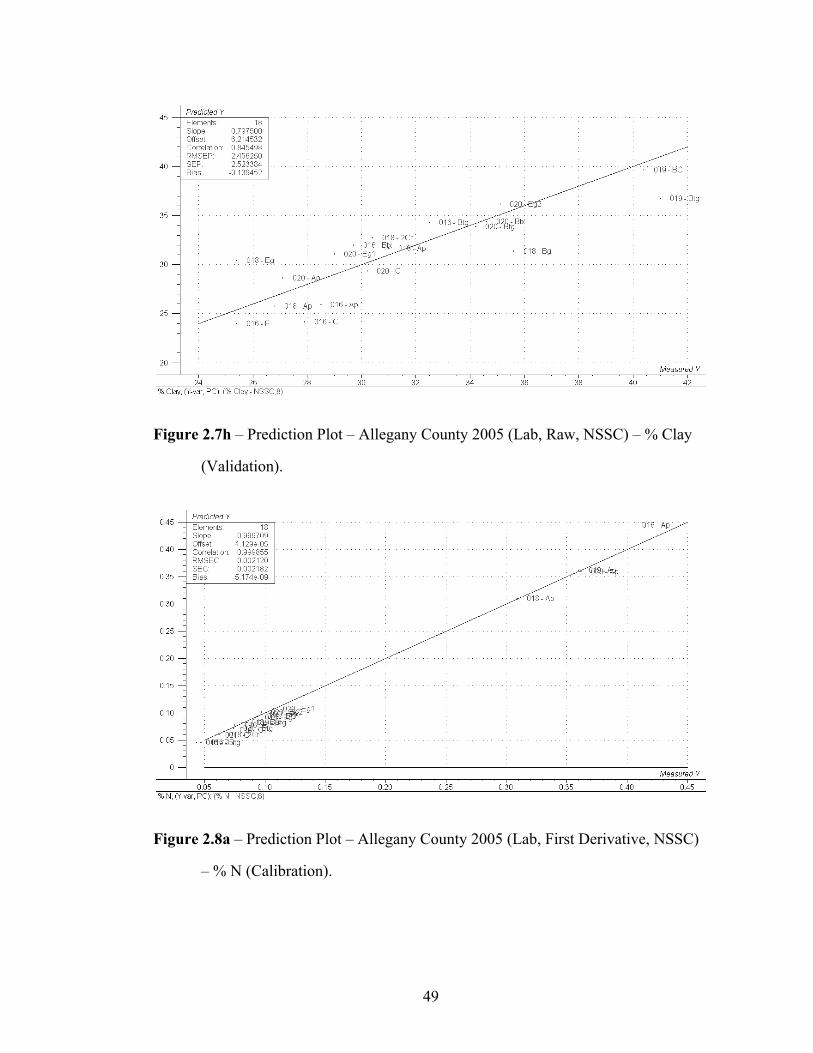
49
Figure 2.7h – Prediction Plot – Allegany County 2005 (Lab, Raw, NSSC) – % Clay
(Validation).
Figure 2.8a – Prediction Plot – Allegany County 2005 (Lab, First Derivative, NSSC)
– % N (Calibration).
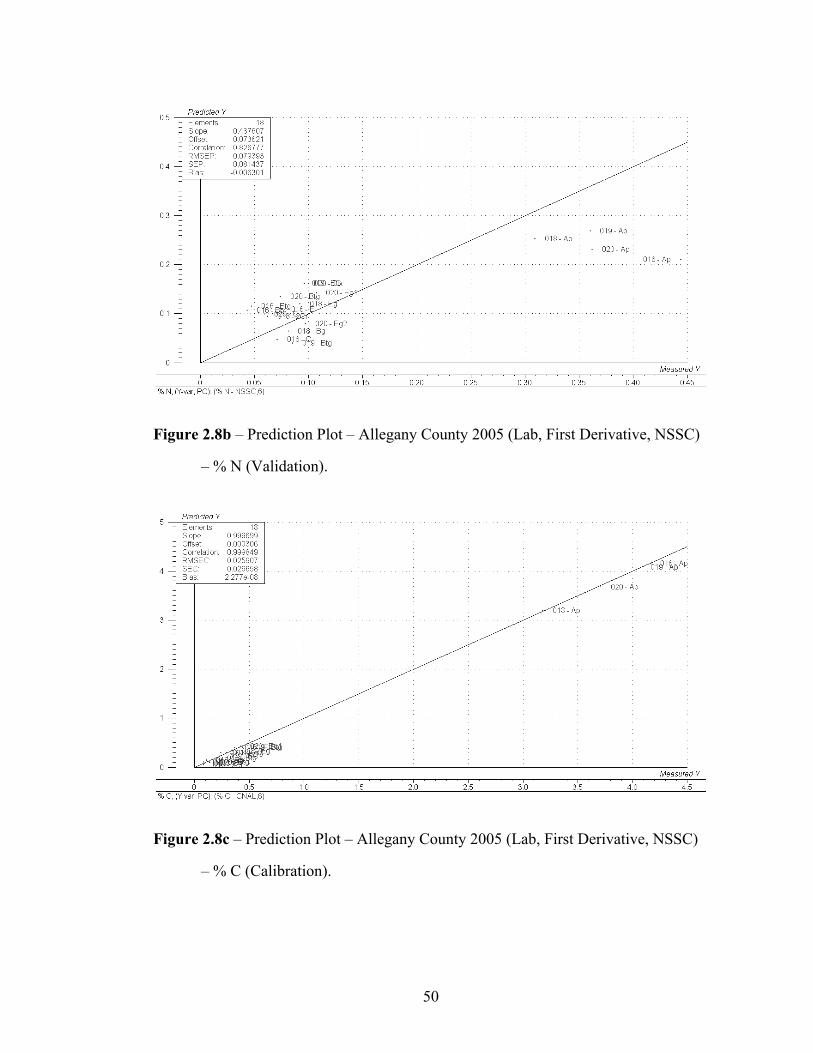
50
Figure 2.8b – Prediction Plot – Allegany County 2005 (Lab, First Derivative, NSSC)
– % N (Validation).
Figure 2.8c – Prediction Plot – Allegany County 2005 (Lab, First Derivative, NSSC)
– % C (Calibration).
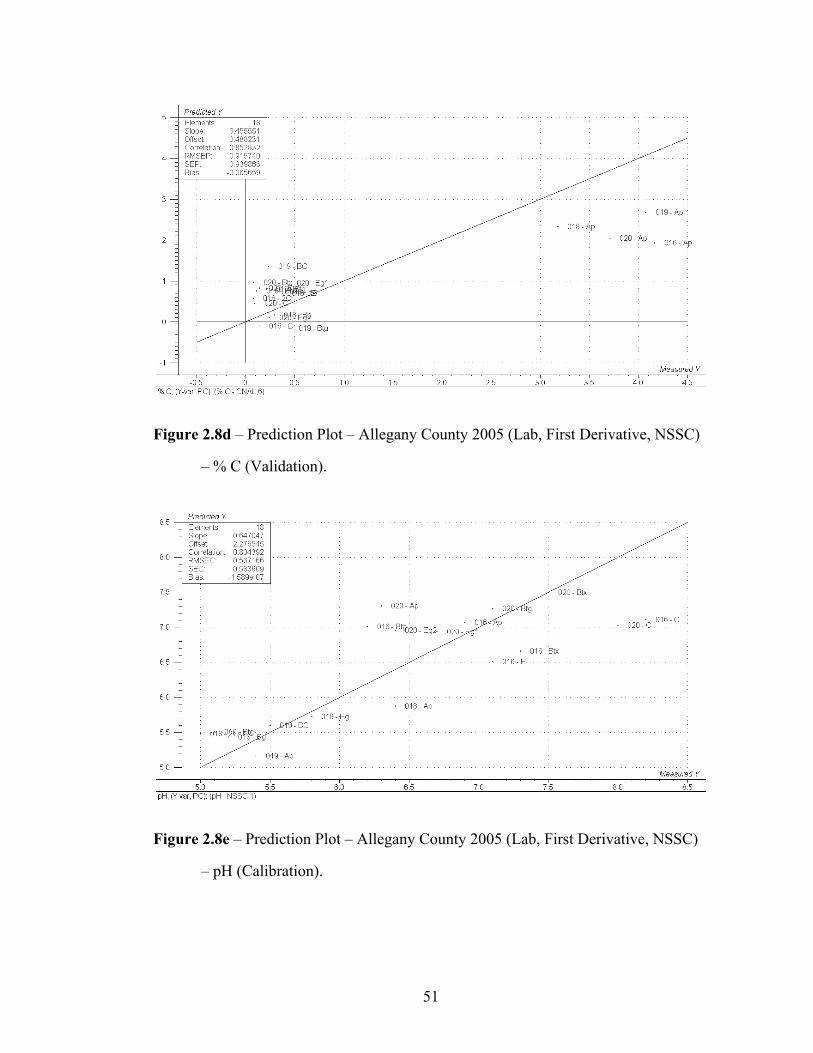
51
Figure 2.8d – Prediction Plot – Allegany County 2005 (Lab, First Derivative, NSSC)
– % C (Validation).
Figure 2.8e – Prediction Plot – Allegany County 2005 (Lab, First Derivative, NSSC)
– pH (Calibration).
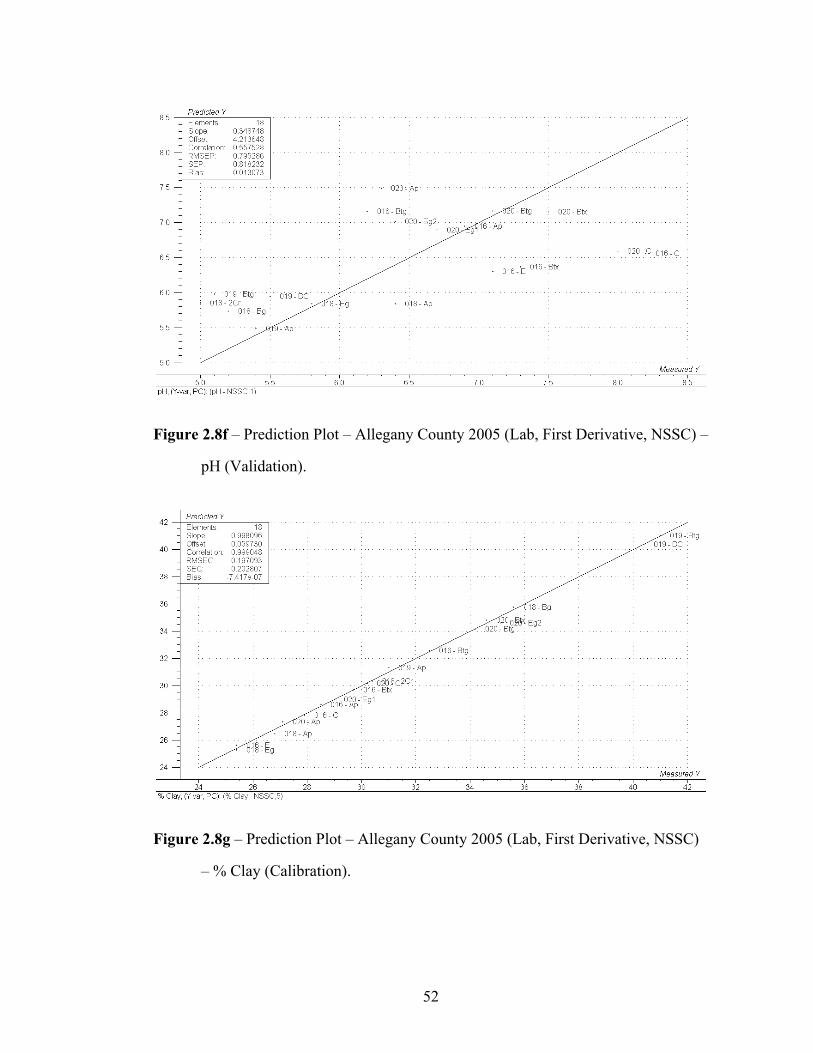
52
Figure 2.8f – Prediction Plot – Allegany County 2005 (Lab, First Derivative, NSSC) –
pH (Validation).
Figure 2.8g – Prediction Plot – Allegany County 2005 (Lab, First Derivative, NSSC)
– % Clay (Calibration).
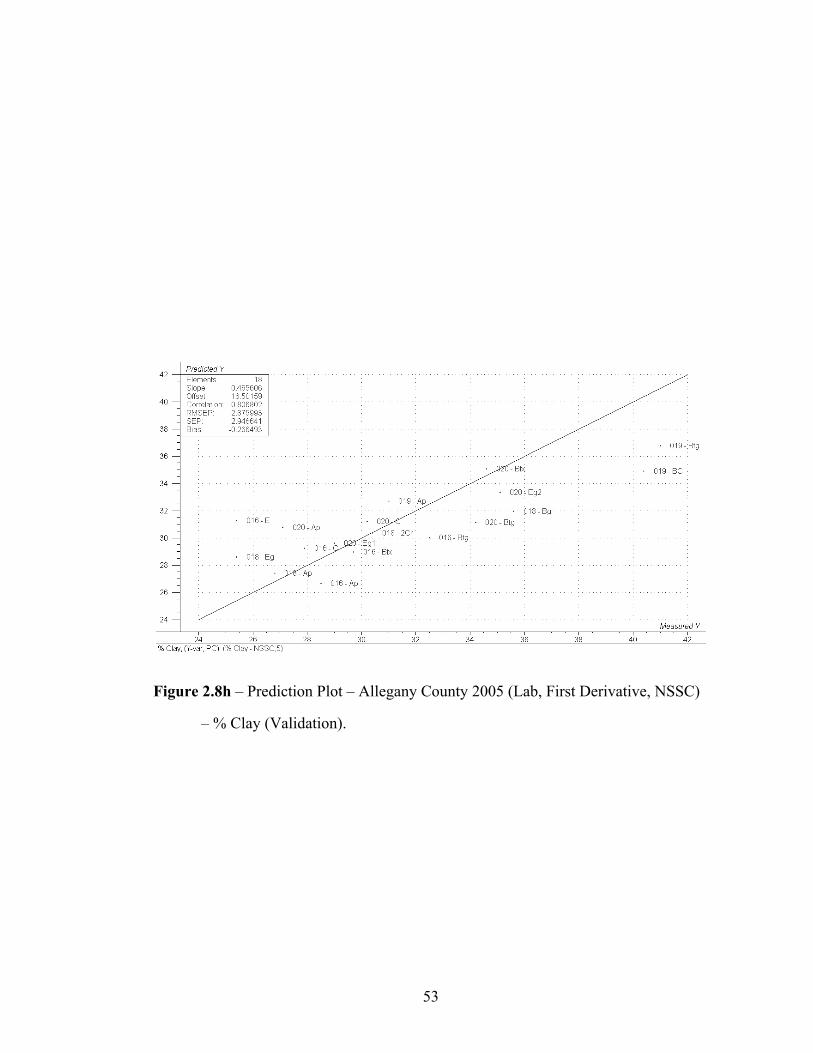
53
Figure 2.8h – Prediction Plot – Allegany County 2005 (Lab, First Derivative, NSSC)
– % Clay (Validation).
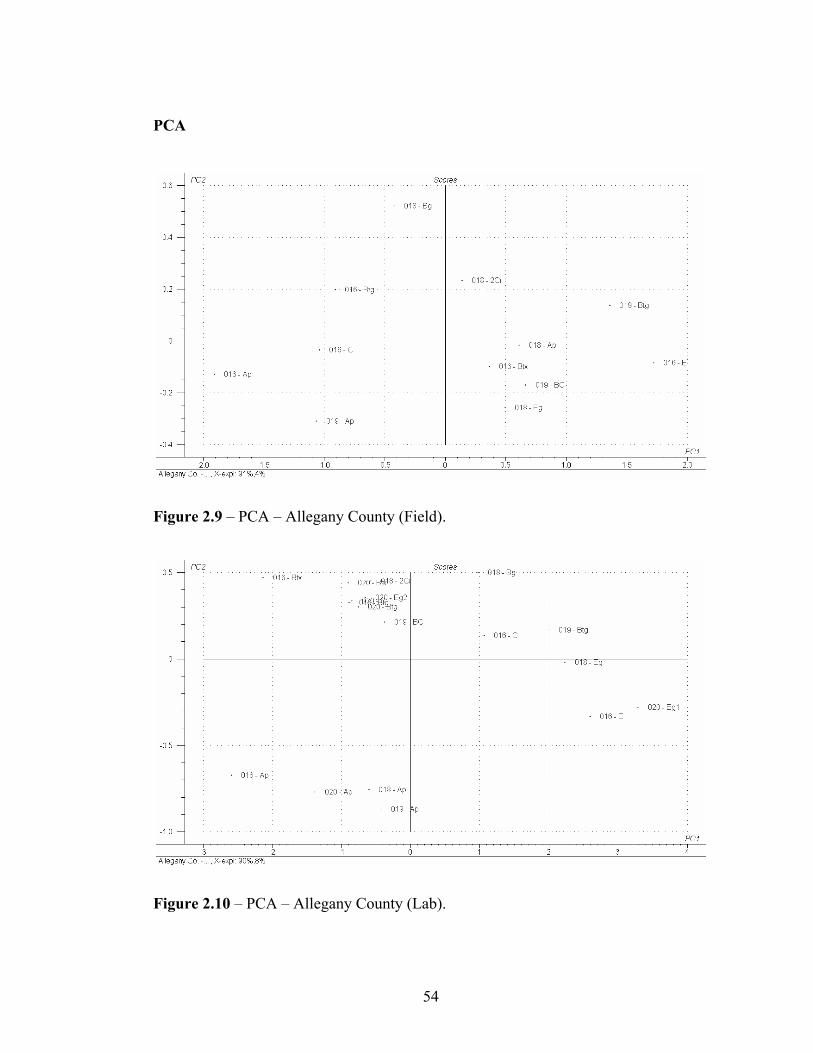
54
PCA
Figure 2.9 – PCA – Allegany County (Field).
Figure 2.10 – PCA – Allegany County (Lab).
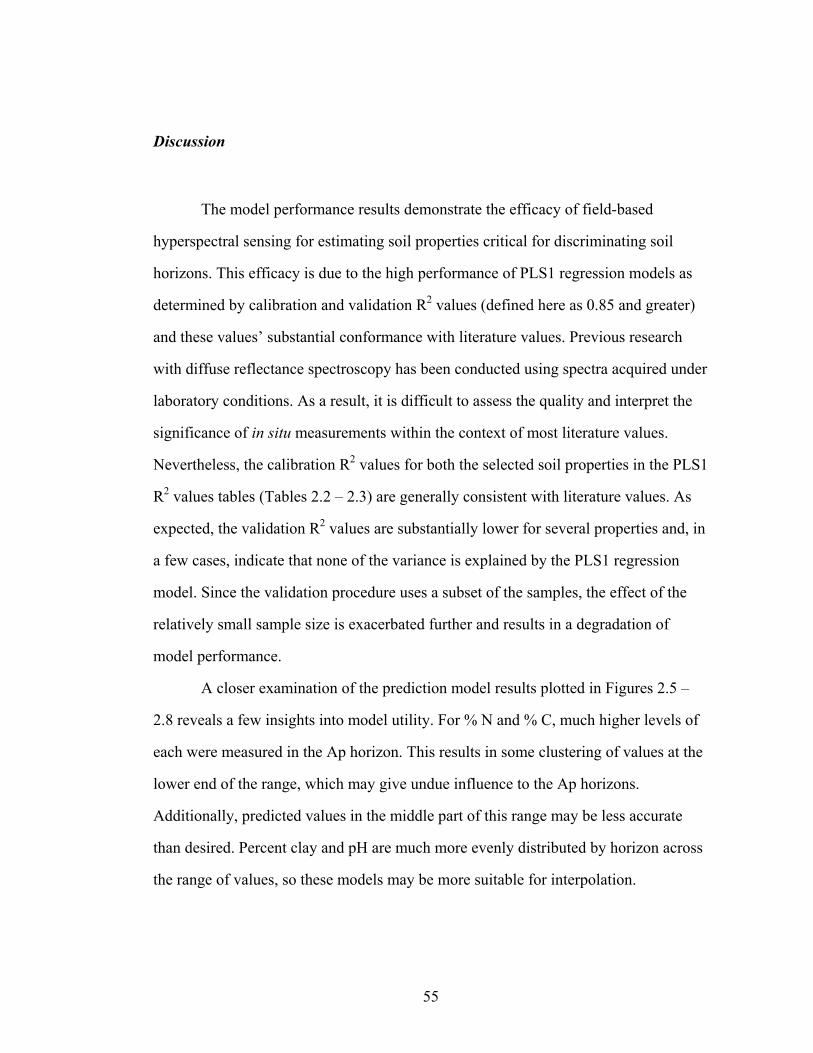
55
Discussion
The model performance results demonstrate the efficacy of field-based
hyperspectral sensing for estimating soil properties critical for discriminating soil
horizons. This efficacy is due to the high performance of PLS1 regression models as
determined by calibration and validation R2 values (defined here as 0.85 and greater)
and these values’ substantial conformance with literature values. Previous research
with diffuse reflectance spectroscopy has been conducted using spectra acquired under
laboratory conditions. As a result, it is difficult to assess the quality and interpret the
significance of in situ measurements within the context of most literature values.
Nevertheless, the calibration R2 values for both the selected soil properties in the PLS1
R2 values tables (Tables 2.2 – 2.3) are generally consistent with literature values. As
expected, the validation R2 values are substantially lower for several properties and, in
a few cases, indicate that none of the variance is explained by the PLS1 regression
model. Since the validation procedure uses a subset of the samples, the effect of the
relatively small sample size is exacerbated further and results in a degradation of
model performance.
A closer examination of the prediction model results plotted in Figures 2.5 –
2.8 reveals a few insights into model utility. For % N and % C, much higher levels of
each were measured in the Ap horizon. This results in some clustering of values at the
lower end of the range, which may give undue influence to the Ap horizons.
Additionally, predicted values in the middle part of this range may be less accurate
than desired. Percent clay and pH are much more evenly distributed by horizon across
the range of values, so these models may be more suitable for interpolation.
56
There are several potential sources of error which limit the utility of this
method in the accurate prediction of soil properties. A major factor remains soil
moisture. It has been shown that the presence of water can degrade the signal quality
recorded at the sensor. First, water reduces the amplitude of spectral features in a
nonlinear fashion (Whiting et al., 2004), many of which are diagnostic in terms of
critical soils properties. The use of derivatives can help mitigate this effect, so that lab
and field based measurements can be accurately compared (Tsai and Philpot, 1998).
Derivatives emphasize spectral features rather than amplitudes, so that chemical and
physical differences in lab and field samples can be identified. Second, water can have
a smoothing effect on the signal. This may be the more challenging adversity to
overcome in terms of spectral processing. Where water reduces the amplitude of
spectral features, the general shapes of spectral features are preserved, whereas when
water has a smoothing effect on the signal they are often modified beyond usefulness.
This smoothing effect is most readily apparent when soil is saturated, so the spectra
will exhibit features characteristic of water. Moisture effects are best addressed by
scheduling spectral acquisition soon after soil pit excavation. When this is not
possible, limiting rainwater entry can be achieved by covering the pit.
Another major potential source of error is sensor placement with respect to the
soil profile. As noted earlier, the contact probe was kept 1 – 2 mm away from the soil
profile during sampling to protect the lens and minimize the transfer of soil moisture
to the lens. While this practice may not substantially impact the relative quality of
samples, it could have an impact on general signal quality. ASDI recommends placing
the contact probe directly against the soil surface during sampling, with the option of
using a clear plastic bag for protection. This may indicate that the sensor is optimized
for this configuration, departures from which may result in a loss of signal quality.
The illumination source is most uniform at extremely close distances to the target. At
57
approximately 1 cm away from the target, the illumination provided becomes
noticeably variable within the field of view. Due to the limited sensitivity of the
human visual system with respect to radiance, this variation may be substantial enough
at closer distances to be a concern. In addition, this may allow excess ambient light to
illuminate the target, potentially degrading signal quality.
Figures 2.9 – 2.10 indicate similar variance structures among similar horizons
and different variance structures between different horizons. In particular, the Ap
horizons sampled in the laboratory and, to a lesser extent, the field demonstrate a high
degree of similarity. Higher levels of organic matter and moisture, which can
substantially reduce spectral reflectance, may be partially responsible for this
distinction.
Summary
Field-based hyperspectral sensing has the potential for the rapid,
nondestructive and accurate determination of important soil properties. Future
research will need to quantify better the effect of soil moisture on field-acquired
spectra so the technology can be deployed in humid environments such as farm fields
and forest areas. In addition, a more comprehensive spectral library will allow for the
development of more robust prediction models which can be used by practitioners
who wish to incorporate diffuse reflectance spectroscopy in their decision-making
process.
58
REFERENCES
Barnes E. M., K. A. Sudduth, J. W. Hummel, S. M. Lesch, D. L. Corwin, C. Yang, C.
S. T. Daughtry, and W. C. Bausch. 2003. Remote- and ground-based sensor
techniques to map soil properties. Photogramm. Eng. Remote Sens. 69:619-
630.
Ben-Dor, E. 2002. Quantitative remote sensing of soil properties. Adv. Agron. 75:173-
251.
Broge, N. H., A. G. Thomsen, and M. H. Greve. 2004. Prediction of topsoil organic
matter and clay content from measurements of spectral reflectance and
electrical conductivity. Acta Agric. Scand., Sect. B, Soil and Plant Sci. 54:232-
240.
Brown, D. J., K. D. Shepherd, M. G. Walsh, M. D. Mays, and T. G. Reinsch. 2005a.
Global soil characterization with VNIR diffuse reflectance spectroscopy.
Geoderma 132:273-290.
Brown, D. J., R. S. Bricklemyer, and P. R. Miller, 2005b. Validation requirements for
diffuse reflectance soil characterization models with a case study of VNIR soil
C prediction in Montana. Geoderma 129:251-267.
Dunn, B. W., H. G. Beecher, G. D. Batten, and S. Ciavarella. 2002. The potential of
near-infrared spectroscopy for soil analysis – a case study from the Riverine
Plain of south-eastern Australia. Australian Journal of Experimental
Agriculture 42:607-614.
Eckert, D. and J. T. Sims. 1995. Recommended Soil pH and Lime Requirement Tests.
p. 11-16. In J.Thomas Sims and A. Wolf (eds.) Recommended Soil Testing
Procedures for the Northeastern United States. Northeast Regional Bulletin
#493. Agricultural Experiment Station, University of Delaware, Newark, DE.
59
Esbensen, K. H. 2004. Multivariate Data Analysis in practice. CAMO Process AS.
Oslo, Norway.
Foth, H. D., and B. G. Ellis, 1988. Soil fertility. Wiley, New York.
Galvão, L. S., M. A. Pizzaro, and J. C. N. Epiphanio. 2001. Variations in reflectance
of tropical soils: spectral-chemical composition relationships from AVIRIS
data. Remote Sens. Environ. 75:245-255.
Gee, G.W. and D. Or. 2002. Particle size analysis. p. 255-293-411. In J. H. Dane and
G. C. Topp (ed.) Methods of Soil Analysis. Part 4. Physical and Mineralogical
Methods. Soil Science Society of America Book Series Number 5. American
Society of Agronomy, Madison, WI.
Geladi, P., Kowalski, B.R., 1986. Partial Least-squares regression: a tutorial. Anal.
Chim. Acta 185, 1 –17.
Ingleby, H. R. and T. G. Crowe. 2000. Reflectance models for predicting organic
carbon in Saskatchewan soils. Can. Agri. Eng. (42)2:57-63.
Islam, K., B. Singh, and A. McBratney. 2003. Simultaneous estimation of several soil
properties by ultra-violet, visible, and near-infrared reflectance spectroscopy.
Aust. J. Soil Res. 41:1101-1114.
Kariuki, P. C., T. Woldai and F. Van Der Meer. 2004. Effectiveness of spectroscopy
in identification of swelling indicator clay minerals. Int. J. Remote Sensing
25:455-469.
Martin, P. D., D. F. Malley, G. Manning, and L. Fuller. 2002. Determination of soil
organic carbon and nitrogen at the field level using near-infrared spectroscopy.
Can. J. Soil Sci. 82:413-422.
Morón, A. and D. Cozzolino. 2002. Application of near infrared reflectance
spectroscopy for the analysis of organic C, total N and pH in soils of Uruguay.
J. Near Infrared Spectroscopy 10:215-221.
60
Nanni, M. R. and J. A. M. Demattê. 2006. Spectral Reflectance Methodology in
Comparison to Traditional Soil Analysis. Soil Sci. Soc. Am. J. 70:393-407.
Nelson, D.W. and L.E. Sommers. 1996. Total Carbon, Organic Carbon, and Organic
Matter. p 961-1010. In D.L. Sparks (ed). Methods of Soil Analysis, Part 3.
Chemical Methods. Soil Science Society of America Book Series Number 5.
American Society of Agronomy, Madison, WI.
Pella, E. 1990. Elemental organic analysis. Part 1. Am. Lab 22: 116-125.
Reeves, J. B. III, G. W. McCarty, and J. J. Meisinger. 1999. Near infrared reflectance
spectroscopy for the analysis of agricultural soils. J. Near Infrared Spectrosc.
7:179-193.
Shepherd, K. D. and M. G. Walsh, 2002. Development of reflectance spectral libraries
for characterization of soil properties. Soil Sci. Soc. Am. J. 66:988-998.
Shih, S. F., and J. D. Jordan. 1992. Landsat Mid-Infrared Data and GIS in Regional
Surface Soil-Moisture Assessment. Water Resour. Bull. 25(4):713-719.
Thomasson, J. A., R. Sui, M. S. Cox, and A. Al-Rajehy, 2001. Soil reflectance sensing
for determining soil properties in precision agriculture. Trans. ASAE
44(6):1445-1453.
Tsai, F. and W. Philpot, 1998. Derivative analysis of hyperspectral data. Remote Sens.
Environ. 66:41-51.
USEPA. 2002. Methods for the Determination of Total Organic Carbon (TOC) in
Soils and Sediments. USEPA Rep. NCEA-C- 1282, EMASC-001. U. S. Gov.
Print. Office, Washington, DC.
Whiting, M. L., L. Li, and S. L. Ustin. 2004. Predicting water content using Gaussian
model on soil spectra. Remote Sens. Environ. 89:535-552.
Wold, S., Sjostrom, M., Eriksson, L., 2001. PLS-regression: a basic tool of
chemometrics. Chemom. Intell. Lab. Syst. 58, 109– 130.
61
Chapter 3: Mapping Soil Profile Properties Using Proximal Diffuse Reflectance
Spectroscopy
Abstract
Proximal sensing using visible-near infrared (VNIR) diffuse reflectance
spectroscopy (DRS) has demonstrated substantial potential for rapid, accurate
estimation of key soil properties. Many of these soil properties are diagnostic for the
purpose of soil classification and survey. As many of the soil surveys in the United
States approach 40-50 y in age, there is an interest and need to supplement the current
methodologies employed in the soil survey update process. This study was guided by
the objective of developing an accurate method for estimating the spatial distribution
of selected soil chemical and physical properties within a pedon sample. An unaligned
sampling grid (1.2 m × 0.2 m) grid with a sampling interval of 0.05 m (n = 125 sample
points) was used to assess the feasibility of predicting the spatial distribution of
selected soil properties throughout the profile of one pedon in Allegany County. An
efficient data processing flow was also developed for accurately estimating the spatial
distribution of selected soils physical and chemical soil properties using PLS1
regression and ordinary kriging. While the soil property estimates were generally
within acceptable error tolerances, a larger sample size and a more robust prediction
model would reduce these deficiencies.
In conclusion, the results of this study suggest that advanced proximal sensing
techniques, both laboratory-based and in situ, are worthy of additional study to assess
the full potential of this technology for soil survey. For VNIR DRS to be deployed for
field-based soil survey operations, potential users must have a working knowledge of
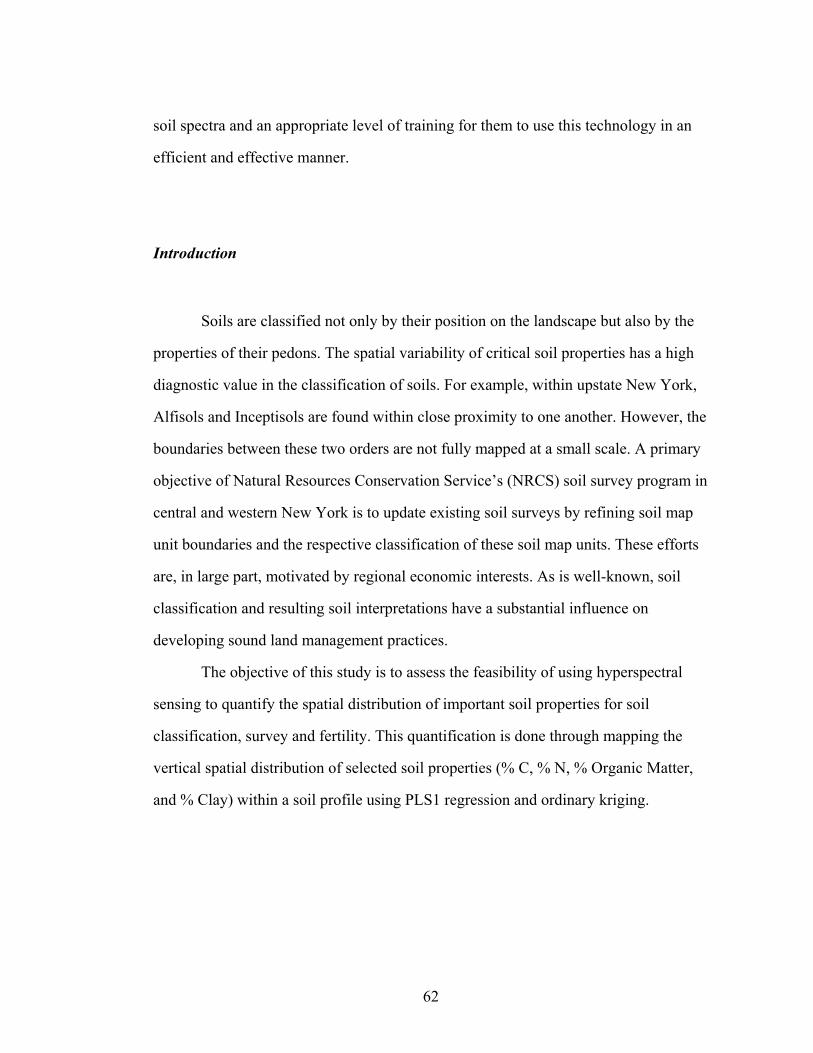
62
soil spectra and an appropriate level of training for them to use this technology in an
efficient and effective manner.
Introduction
Soils are classified not only by their position on the landscape but also by the
properties of their pedons. The spatial variability of critical soil properties has a high
diagnostic value in the classification of soils. For example, within upstate New York,
Alfisols and Inceptisols are found within close proximity to one another. However, the
boundaries between these two orders are not fully mapped at a small scale. A primary
objective of Natural Resources Conservation Service’s (NRCS) soil survey program in
central and western New York is to update existing soil surveys by refining soil map
unit boundaries and the respective classification of these soil map units. These efforts
are, in large part, motivated by regional economic interests. As is well-known, soil
classification and resulting soil interpretations have a substantial influence on
developing sound land management practices.
The objective of this study is to assess the feasibility of using hyperspectral
sensing to quantify the spatial distribution of important soil properties for soil
classification, survey and fertility. This quantification is done through mapping the
vertical spatial distribution of selected soil properties (% C, % N, % Organic Matter,
and % Clay) within a soil profile using PLS1 regression and ordinary kriging.

63
Material and Methods
Study site description
The study pedon lies along a catena selected by the NRCS soil survey team
based in Belmont, NY as a part of their efforts to update the soil survey for western
New York. The pedon is located in Allegany County at the SUNY-Alfred research
farm. The elevation at the site is approximately 550 m above mean sea level.
Laboratory analyses
All soil samples were analyzed by the Cornell Nutrient Analysis Laboratory (CNAL)
in Ithaca, NY to determine their physical and chemical properties. Percent N was
determined using a dry oxidation (combustion) method after Pella (1990). Percent C
was determined using a dry combustion method after Nelson and Sommers (1996) and
Pella (1990). Percent organic matter was assessed by calculating the loss on ignition
(Blume et al., 1990; Nelson and Sommers, 1996; ASTM, 2000; USEPA, 2002). Soil
pH was measured in water using a method developed by Eckert and Sims (1995).
Particle size (including % clay) was determined using the pipette method refined by
Gee and Or (2002) and published in the Soil Survey Laboratory Methods Manual.
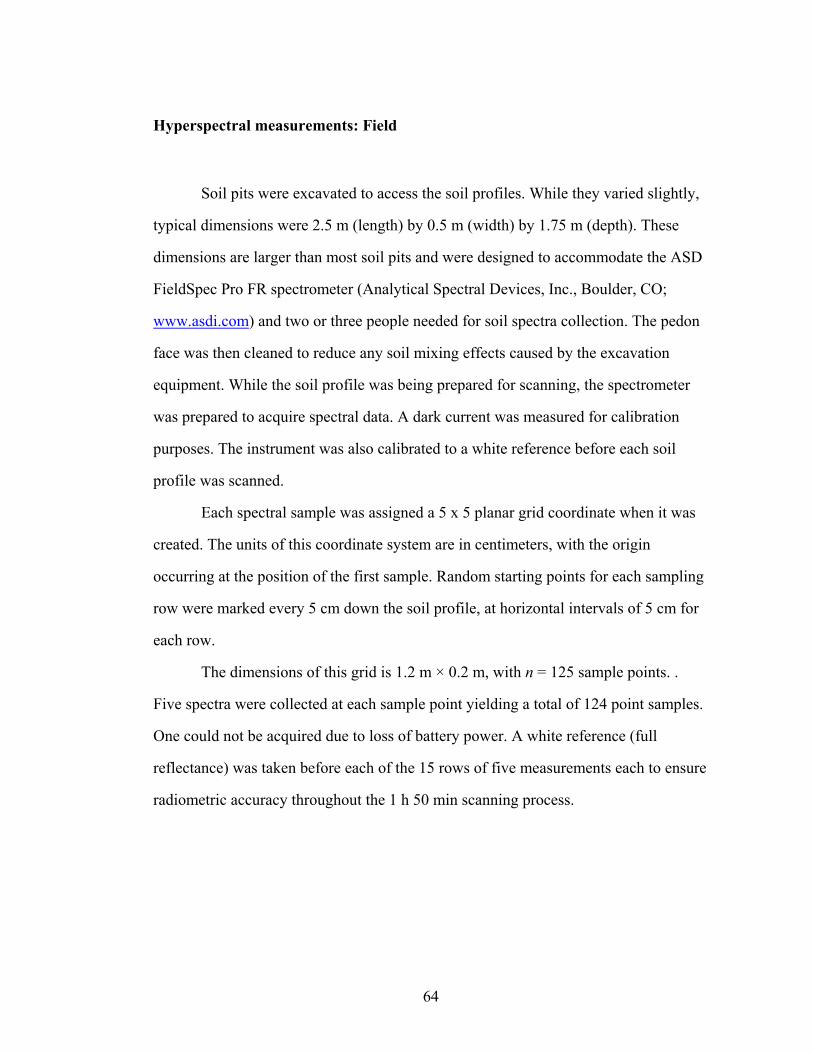
64
Hyperspectral measurements: Field
Soil pits were excavated to access the soil profiles. While they varied slightly,
typical dimensions were 2.5 m (length) by 0.5 m (width) by 1.75 m (depth). These
dimensions are larger than most soil pits and were designed to accommodate the ASD
FieldSpec Pro FR spectrometer (Analytical Spectral Devices, Inc., Boulder, CO;
www.asdi.com) and two or three people needed for soil spectra collection. The pedon
face was then cleaned to reduce any soil mixing effects caused by the excavation
equipment. While the soil profile was being prepared for scanning, the spectrometer
was prepared to acquire spectral data. A dark current was measured for calibration
purposes. The instrument was also calibrated to a white reference before each soil
profile was scanned.
Each spectral sample was assigned a 5 x 5 planar grid coordinate when it was
created. The units of this coordinate system are in centimeters, with the origin
occurring at the position of the first sample. Random starting points for each sampling
row were marked every 5 cm down the soil profile, at horizontal intervals of 5 cm for
each row.
The dimensions of this grid is 1.2 m × 0.2 m, with n = 125 sample points. .
Five spectra were collected at each sample point yielding a total of 124 point samples.
One could not be acquired due to loss of battery power. A white reference (full
reflectance) was taken before each of the 15 rows of five measurements each to ensure
radiometric accuracy throughout the 1 h 50 min scanning process.
65
Figure 3.1 – Field acquisition of soil reflectance data in soil pit prepared for pedon
characterization by soil survey staff.
Figure 3.2 – Field acquisition of soil reflectance data with contact probe in soil pit
prepared for pedon characterization by soil survey staff.
66
Data analysis
To facilitate data analysis, the raw spectral data were imported into The
Unscrambler application software program (CAMO PROCESS AS, Oslo, Norway).
Observations were divided into units of five observations each and an average over the
five observations was taken on each unit to determine the values used for inference.
Partial Least Squares 1 (PLS1)-based regression prediction (Geladi and Kowalski,
1986; Wold et al., 2001) equations were developed for % C, % N, % organic matter
(loss on ignition) and % clay using field-acquired (previously by horizon) spectral and
Cornell Nutrient Analysis Laboratory (CNAL) soil characterization data for the study
pedon.
Partial least-squares regression (PLSR) is used to evaluate the statistical
contributions of many X-variables (predictors) to one (PLS1) or more (PLS2) Y-
variables (responses) (Geladi and Kowalski, 1986; Wold et al., 2001). In this study,
the reflectance values for all 2 151 spectral wavelengths comprise the set of X-
variables. Selected physical and chemical soils properties are the Y-variables. This
study is interested in predicting individual soils properties, and as a result uses PLS1
regression. In addition, PLS1 regression provides a means to evaluate the importance
of each spectral wavelength in determining individual soils properties. While not
examined in this study, it may be potentially useful in future investigations. PLS1
regression is also used extensively in related literature, so comparisons can be made
between results in this and other studies.
Validation is achieved using the full cross validation method, “where some
samples are kept out of the calibration and used for prediction. This is repeated until
all samples have been kept out once. Validation residual variance can then be
computed from the prediction residuals…In full cross-validation, only one sample at a
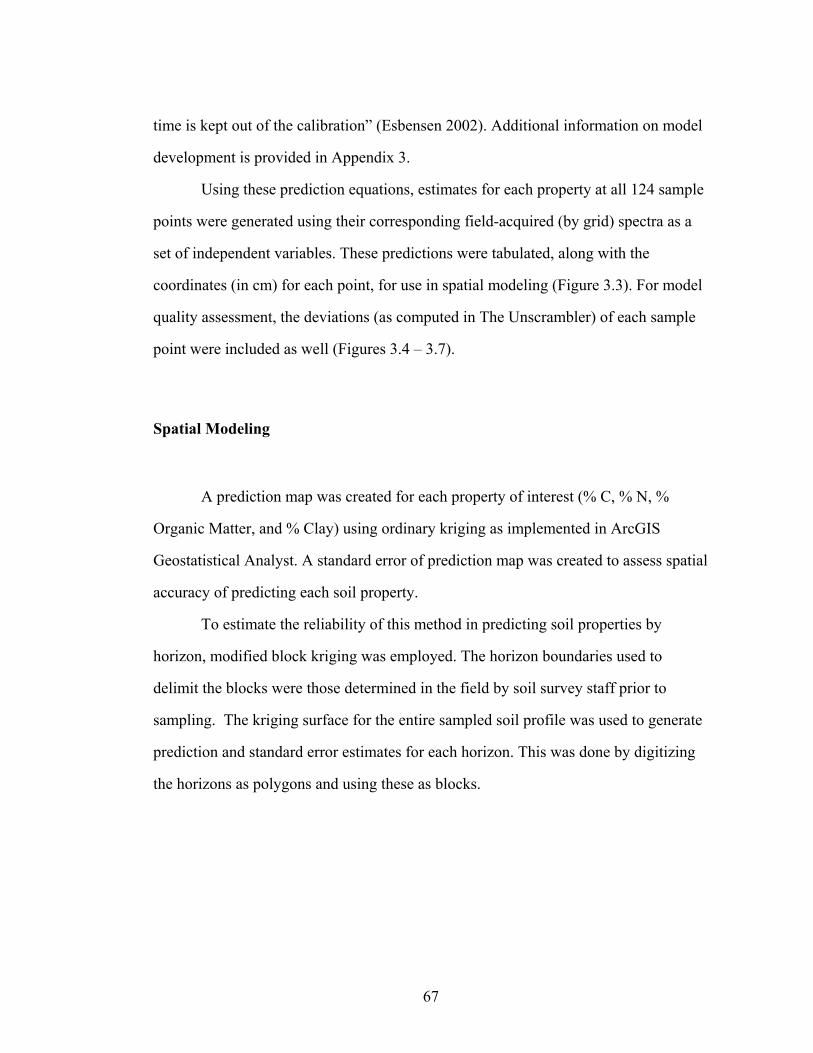
67
time is kept out of the calibration” (Esbensen 2002). Additional information on model
development is provided in Appendix 3.
Using these prediction equations, estimates for each property at all 124 sample
points were generated using their corresponding field-acquired (by grid) spectra as a
set of independent variables. These predictions were tabulated, along with the
coordinates (in cm) for each point, for use in spatial modeling (Figure 3.3). For model
quality assessment, the deviations (as computed in The Unscrambler) of each sample
point were included as well (Figures 3.4 – 3.7).
Spatial Modeling
A prediction map was created for each property of interest (% C, % N, %
Organic Matter, and % Clay) using ordinary kriging as implemented in ArcGIS
Geostatistical Analyst. A standard error of prediction map was created to assess spatial
accuracy of predicting each soil property.
To estimate the reliability of this method in predicting soil properties by
horizon, modified block kriging was employed. The horizon boundaries used to
delimit the blocks were those determined in the field by soil survey staff prior to
sampling. The kriging surface for the entire sampled soil profile was used to generate
prediction and standard error estimates for each horizon. This was done by digitizing
the horizons as polygons and using these as blocks.
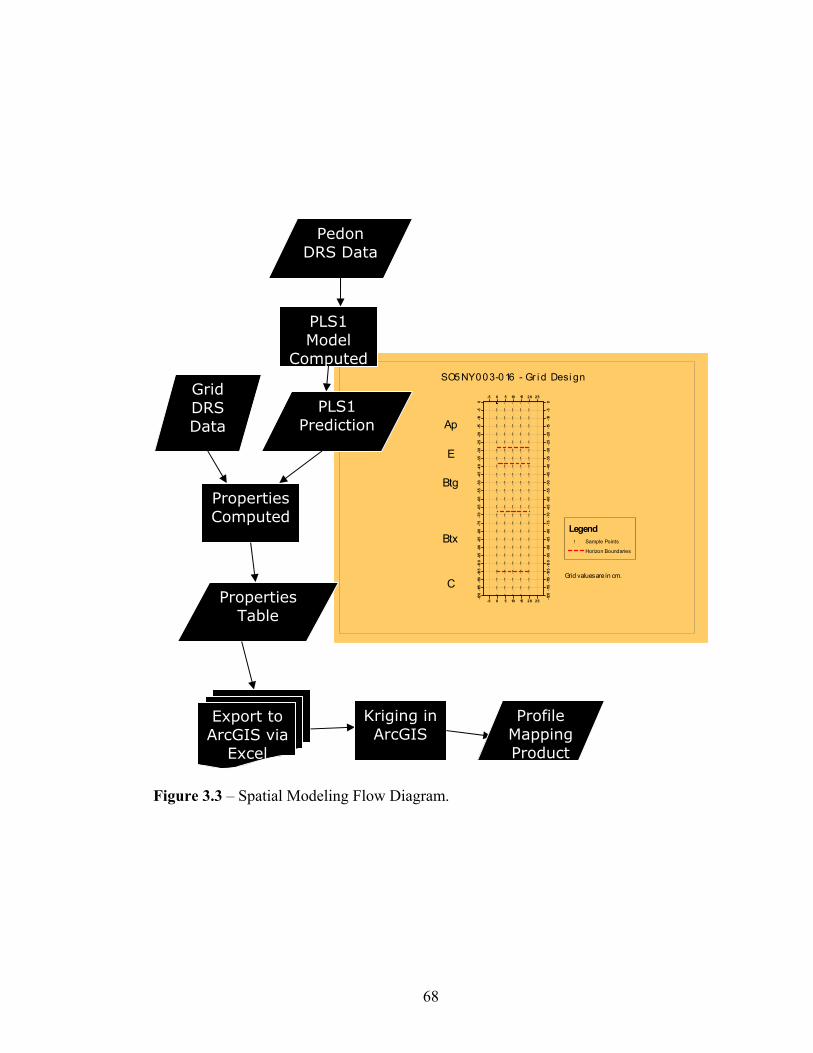
68
Figure 3.3 – Spatial Modeling Flow Diagram.
! ! ! ! !
! ! ! ! !! ! ! ! !! ! ! ! !
! ! ! ! !! ! ! ! !
! ! ! ! !! ! ! ! !! ! ! ! !
! ! ! ! !! ! ! ! !! ! ! ! !
! ! ! ! !! ! ! ! !
! ! ! ! !! ! ! ! !! ! ! ! !
! ! ! ! !! ! ! ! !! ! ! ! !! ! ! ! !
! ! ! ! !! ! ! ! !
! ! ! ! !! ! ! !
!!!!!!!!!!!!!!!!!!!!!!!!!!!!!!!!!!!!!!!!!!!!!!!!!!!!!!!!!!!!!!!!!!!!!!!!!!!!!!!!!!!!!!!!!!!!!!!!!!!!!!!!!!!!!!!!!!!!!!!!!!!!!!!!!!!!!!!!!!!!!!!!!!!!!!!!!!!!!!!!!!!!!!!!!!!!!!!!!!!!!!!!!!!!!!!!!!!!!!!!!!!!!!!!!!!!!!!!!!!!!!!!!!!!!!!!!!!!!!!!!!!!!!!!!!!!!!!!!!!!!!!!!!!!!!!!!!!!!!!!!!!!!!!!!!!!!!!!!!!!!!!!!!!!!!!!!!!!!!!!!!!!!!!!!!!!!!!!!!!!!!!!!!!!!!!!!!!!!!!!!!!!!!!!!!!!!!!!!!!!!!!!!!!!!!!!!!!!!!!!!!!!!!!!!!!!!!!!!!!!!!!!!!!!!!!!!!!!!!!!!!!!!!!!!!!!!!!!!!!!!!!!!!!!!!!!!!!!!!!!!!!!!!!!!!!!!!!!!!!!!!!!!!!!!!!!!!!!!!!!!!!!!!!!!!!!!!!!!!!!!!!!!!!!!!!!!!!!!!!!!!!!!!!!!!!!!!!!!!!!!!!!!!!!!!!!!!!!!!!!!!!!!!!!!!!!!!!!!!!!!!!!!!!!!!!!!!!!!!!!!!!!!!!!!!!!!!!!!!!!!!!!!!!!!!!!!!!!!!!!!!!!!!!!!!!!!!!!!!!!!!!!!!!!!!!!!!!!!!!!!!!!!!!!!!!!!!!!!!!!!!!!!!!!!!!!!!!!!!!!!!!!!!!!!!!!!!!!!!!!!!!!!!!!!!!!!!!!!!!!!!!!!!!!!!!!!!!!!!!!!!!!!!!!!!!!!!!!!!!!!!!!!!!!!!!!!!!!!!!!!!!!!!!!!!!!!!!!!!!!!!!!!!!!!!!!!!!!!!!!!!!!!!!!!!!!!!!!!!!!!!!!!!!!!!!!!!!!!!!!!!!!!!!!!!!!!!!!!!!!!!!!!!!!!!!!!!!!!!!!!!!!!!!!!!!!!!!!!!!!!!!!!!!!!!!!!!!!!!!!!!!!!!!!!!!!!!!!!!!!!!!!!!!!!!!!!!!!!!!!!!!!!!!!!!!!!!!!!!!!!!!!!!!!!!!!!!!!!!!!!!!!!!!!!!!!!!!!!!!!!!!!!!!!!!!!!!!!!!!!!!!!!!!!!!!!!!!!!!!!!!!!!!!!!!!!!!!!!!!!!!!!!!!!!!!!!!!!!!!!!!!!!!!!!!!!!!!!!!!!!!!!!!!!!!!!!!!!!!!!!!!!!!!!!!!!!!!!!!!!!!!!!!!!!!!!!!!!!!!!!!!!!!!!!!!!!!!!!!!!!!!!!!!!!!!!!!!!!!!!!!!!!!!!!!!!!!!!!!!!!!!!!!!!!!!!!!!!!!!!!!!!!!!!!!!!!!!!!!!!!!!!!!!!!!!!!!!!!!!!!!!!!!!!!!!!!!!!!!!!!!!!!!!!!!!!!!!!!!!!!!!!!!!!!!!!!!!!!!!!!!!!!!!!!!!!!!!!!!!!!!!!!!!!!!!!!!!!!!!!!!!!!!!!!!!!!!!!!!!!!!!!!!!!!!!!!!!!!!!!!!!!!!!!!!!!!!!!!!!!!!!!!!!!!!!!!!!!!!!!!!!!!!!!!!!!!!!!!!!!!!!!!!!!!!!!!!!!!!!!!!!!!!!!!!!!!!!!!!!!!!!!!!!!!!!!!!!!!!!!!!!!!!!!!!!!!!!!!!!!!!!!!!!!!!!!!!!!!!!!!!!!!!!!!!!!!!!!!!!!!!!!!!!!!!!!!!!!!!!!!!!!!!!!!!!!!!!!!!!!!!!!!!!!!!!!!!!!!!!!!!!!!!!!!!!!!!!!!!!!!!!!!!!!!!!!!!!!!!!!!!!!!!!!!!!!!!!!!!!!!!!!!!!!!!!!!!!!!!!!!!!!!!!!!!!!!!!!!!!!!!!!!!!!!!!!!!!!!!!!!!!!!!!!!!!!!!!!!!!!!!!!!!!!!!!!!!!!!!!!!!!!!!!!!!!!!!!!!!!!!!!!!!!!!!!!!!!!!!!!!!!!!!!!!!!!!!!!!!!!!!!!!!!!!!!!!!!!!!!!!!!!!!!!!!!!!!!!!!!!!!!!!!!!!!!!!!!!!!!!!!!!!!!!!!!!!!!!!!!!!!!!!!!!!!!!!!!!!!!!!!!!!!!!!!!!!!!!!!!!!!!!!!!!!!!!!!!!!!!!!!!!!!!!!!!!!!!!!!!!!!!!!!!!!!!!!!!!!!!!!!!!!!!!!!!!!!!!!!!!!!!!!!!!!!!!!!!!!!!!!!!!!!!!!!!!!!!!!!!!!!!!!!!!!!!!!!!!!!!!!!!!!!!!!!!!!!!!!!!!!!!!!!!!!!!!!!!!!!!!!!!!!!!!!!!!!!!!!!!!!!!!!!!!!!!!!!!!!!!!!!!!!!!!!!!!!!!!!!!!!!!!!!!!!!!!!!!!!!!!!!!!!!!!!!!!!!!!!!!!!!!!!!!!!!!!!!!!!!!!!!!!!!!!!!!!!!!!!!!!!!!!!!!!!!!!!!!!!!!!!!!!!!!!!!!!!!!!!!!!!!!!!!!!!!!!!!!!!!!!!!!!!!!!!!!!!!!!!!!!!!!!!!!!!!!!!!!!!!!!!!!!!!!!!!!!!!!!!!!!!!!!!!!!!!!!!!!!!!!!!!!!!!!!!!!!!!!!!!!!!!!!!!!!!!!!!!!!!!!!!!!!!!!!!!!!!!!!!!!!!!!!!!!!!!!!!!!!!!!!!!!!!!!!!!!!!!!!!!!!!!!!!!!!!!!!!!!!!!!!!!!!!!!!!!!!!!!!!!!!!!!!!!!!!!!!!!!!!!!!!!!!!!!!!!!!!!!!!!!!!!!!!!!!!!!!!!!!!!!!!!!!!!!!!!!!!!!!!!!!!!!!!!!!!!!!!!!!!!!!!!!!!!!!!!!!!!!!!!!!!!!!!!!!!!!!!!!!!!!!!!!!!!!!!!!!!!!!!!!!!!!!!!!!!!!!!!!!!!!!!!!!!!!!!!!!!!!!!!!!!!!!!!!!!!!!!!!!!!!!!!!!!!!!!!!!!!!!!!!!!!!!!!!!!!!!!!!!!!!!!!!!!!!!!!!!!!!!!!!!!!!!!!!!!!!!!!!!!!!!!!!!!!!!!!!!!!!!!!!!!!!!!!!!!!!!!!!!!!!!!!!!!!!!!!!!!!!!!!!!!!!!!!!!!!!!!!!!!!!!!!!!!!!!!!!!!!!!!!!!!!!!!!!!!!!!!!!!!!!!!!!!!!!!!!!!!!!!!!!!!!!!!!!!!!!!!!!!!!!!!!!!!!!!!!!!!!!!!!!!!!!!!!!!!!!!!!!!!!!!!!!!!!!!!!!!!!!!!!!!!!!!!!!!!!!!!!!!!!!!!!!!!!!!!!!!!!!!!!!!!!!!!!!!!!!!!!!!!!!!!!!!!!!!!!!!!!!!!!!!!!!!!!!!!!!!!!!!!!!!!!!!!!!!!!!!!!!!!!!!!!!!!!!!!!!!!!!!!!!!!!!!!!!!!!!!!!!!!!!!!!!!!!!!!!!!!!!!!!!!!!!!!!!!!!!!!!!!!!!!!!!!!!!!!!!!!!!!!!!!!!!!!!!!!!!!!!!!!!!!!!!!!!!!!!!!!!!!!!!!!!!!!!!!!!!!!!!!!!!!!!!!!!!!!!!!!!!!!!!!!!!!!!!!!!!!!!!!!!!!!!!!!!!!!!!!!!!!!!!!!!!!!!!!!!!!!!!!!!!!!!!!!!!!!!!!!!!!!!!!!!!!!!!!!!!!!!!!!!!!!!!!!!!!!!!!!!!!!!!!!!!!!!!!!!!!!!!!!!!!!!!!!!!!!!!!!!!!!!!!!!!!!!!!!!!!!!!!!!!!!!!!!!!!!!!!!!!!!!!!!!!!!!!!!!!!!!!!!!!!!!!!!!!!!!!!!!!!!!!!!!!!!!!!!!!!!!!!!!!!!!!!!!!!!!!!!!!!!!!!!!!!!!!!!!!!!!!!!!!!!!!!!!!!!!!!!!!!!!!!!!!!!!!!!!!!!!!!!!!!!!!!!!!!!!!!!!!!!!!!!!!!!!!!!!!!!!!!!!!!!!!!!!!!!!!!!!!!!!!!!!!!!!!!!!!!!!!!!!!!!!!!!!!!!!!!!!!!!!!!!!!!!!!!!!!!!!!!!!!!!!!!!!!!!!!!!!!!!!!!!!!!!!!!!!!!!!!!!!!!!!!!!!!!!!!!!!!!!!!!!!!!!!!!!!!!!!!!!!!!!!!!!!!!!!!!!!!!!!!!!!!!!!!!!!!!!!!!!!!!!!!!!!!!!!!!!!!!!!!!!!!!!!!!!!!!!!!!!!!!!!!!!!!!!!!!!!!!!!!!!!!!!!!!!!!!!!!!!!!!!!!!!!!!!!!!!!!!!!!!!!!!!!!!!!!!!!!!!!!!!!!!!!!!!!!!!!!!!!!!!!!!!!!!!!!!!!!!!!!!!!!!!!!!!!!!!!!!!!!!!!!!!!!!!!!!!!!!!!!!!!!!!!!!!!!!!!!!!!!!!!!!!!!!!!!!!!!!!!!!!!!!!!!!!!!!!!!!!!!!!!!!!!!!!!!!!!!!!!!!!!!!!!!!!!!!!!!!!!!!!!!!!!!!!!!!!!!!!!!!!!!!!!!!!!!!!!!!!!!!!!!!!!!!!!!!!!!!!!!!!!!!!!!!!!!!!!!!!!!!!!!!!!!!!!!!!!!!!!!!!!!!!!!!!!!!!!!!!!!!!!!!!!!!!!!!!!!!!!!!!!!!!!!!!!!!!!!!!!!!!!!!!!!!!!!!!!!!!!!!!!!!!!!!!!!!!!!!!!!!!!!!!!!!!!!!!!!!!!!!!!!!!!!!!!!!!!!!!!!!!!!!!!!!!!!!!!!!!!!!!!!!!!!!!!!!!!!!!!!!!!!!!!!!!!!!!!!!!!!!!!!!!!!!!!!!!!!!!!!!!!!!!!!!!!!!!!!!!!!!!!!!!!!!!!!!!!!!!!!!!!!!!!!!!!!!!!!!!!!!!!!!!!!!!!!!!!!!!!!!!!!!!!!!!!!!!!!!!!!!!!!!!!!!!!!!!!!!!!!!!!!!!!!!!!!!!!!!!!!!!!!!!!!!!!!!!!!!!!!!!!!!!!!!!!!!!!!!!!!!!!!!!!!!!!!!!!!!!!!!!!!!!!!!!!!!!!!!!!!!!!!!!!!!!!!!!!!!!!!!!!!!!!!!!!!!!!!!!!!!!!!!!!!!!!!!!!!!!!!!!!!!!!!!!!!!!!!!!!!!!!!!!!!!!!!!!!!!!!!!!!!!!!!!!!!!!!!!!!!!!!!!!!!!!!!!!!!!!!!!!!!!!!!!!!!!!!!!!!!!!!!!!!!!!!!!!!!!!!!!!!!!!!!!!!!!!!!!!!!!!!!!!!!!!!!!!!!!!!!!!!!!!!!!!!!!!!!!!!!!!!!!!!!!!!!!!!!!!!!!!!!!!!!!!!!!!!!!!!!!!!!!!!!!!!!!!!!!!!!!!!!!!!!!!!!!!!!!!!!!!!!!!!!!!!!!!!!!!!!!!!!!!!!!!!!!!!!!!!!!!!!!!!!!!!!!!!!!!!!!!!!!!!!!!!!!!!!!!!!!!!!!!!!!!!!!!!!!!!!!!!!!!!!!!!!!!!!!!!!!!!!!!!!!!!!!!!!!!!!!!!!!!!!!!!!!!!!!!!!!!!!!!!!!!!!!!!!!!!!!!!!!!!!!!!!!!!!!!!!!!!!!!!!!!!!!!!!!!!!!!!!!!!!!!!!!!!!!!!!!!!!!!!!!!!!!!!!!!!!!!!!!!!!!!!!!!!!!!!!!!!!!!!!!!!!!!!!!!!!!!!!!!!!!!!!!!!!!!!!!!!!!!!!!!!!!!!!!!!!!!!!!!!!!!!!!!!!!!!!!!!!!!!!!!!!!!!!!!!!!!!!!!!!!!!!!!!!!!!!!!!!!!!!!!!!!!!!!!!!!!!!!!!!!!!!!!!!!!!!!!!!!!!!!!!!!!!!!!!!!!!!!!!!!!!!!!!!!!!!!!!!!!!!!!!!!!!!!!!!!!!!!!!!!!!!!!!!!!!!!!!!!!!!!!!!!!!!!!!!!!!!!!!!!!!!!!!!!!!!!!!!!!!!!!!!!!!!!!!!!!!!!!!!!!!!!!!!!!!!!!!!!!!!!!!!!!!!!!!!!!!!!!!!!!!!!!!!!!!!!!!!!!!!!!!!!!!!!!!!!!!!!!!!!!!!!!!!!!!!!!!!!!!!!!!!!!!!!!!!!!!!!!!!!!!!!!!!!!!!!!!!!!!!!!!!!!!!!!!!!!!!!!!!!!!!!!!!!!!!!!!!!!!!!!!!!!!!!!!!!!!!!!!!!!!!!!!!!!!!!!!!!!!!!!!!!!!!!!!!!!!!!!!!!!!!!!!!!!!!!!!!!!!!!!!!!!!!!!!!!!!!!!!!!!!!!!!!!!!!!!!!!!!!!!!!!!!!!!!!!!!!!!!!!!!!!!!!!!!!!!!!!!!!!!!!!!!!!!!!!!!!!!!!!!!!!!!!!!!!!!!!!!!!!!!!!!!!!!!!!!!!!!!!!!!!!!!!!!!!!!!!!!!!!!!!!!!!!!!!!!!!!!!!!!!!!!!!!!!!!!!!!!!!!!!!!!!!!!!!!!!!!!!!!!!!!!!!!!!!!!!!!!!!!!!!!!!!!!!!!!!!!!!!!!!!!!!!!!!!!!!!!!!!!!!!!!!!!!!!!!!!!!!!!!!!!!!!!!!!!!!!!!!!!!!!!!!!!!!!!!!!!!!!!!!!!!!!!!!!!!!!!!!!!!!!!!!!!!!!!!!!!!!!!!!!!!!!!!!!!!!!!!!!!!!!!!!!!!!!!!!!!!!!!!!!!!!!!!!!!!!!!!!!!!!!!!!!!!!!!!!!!!!!!!!!!!!!!!!!!!!!!!!!!!!!!!!!!!!!!!!!!!!!!!!!!!!!!!!!!!!!!!!!!!!!!!!!!!!!!!!!!!!!!!!!!!!!!!!!!!!!!!!!!!!!!!!!!!!!!!!!!!!!!!!!!!!!!!!!!!!!!!!!!!!!!!!!!!!!!!!!!!!!!!!!!!!!!!!!!!!!!!!!!!!!!!!!!!!!!!!!!!!!!!!!!!!!!!!!!!!!!!!!!!!!!!!!!!!!!!!!!!!!!!!!!!!!!!!!!!!!!!!!!!!!!!!!!!!!!!!!!!!!!!!!!!!!!!!!!!!!!!!!!!!!!!!!!!!!!!!!!!!!!!!!!!!!!!!!!!!!!!!!!!!!!!!!!!!!!!!!!!!!!!!!!!!!!!!!!!!!!!!!!!!!!!!!!!!!!!!!!!!!!!!!!!!!!!!!!!!!!!!!!!!!!!!!!!!!!!!!!!!!!!!!!!!!!!!!!!!!!!!!!!!!!!!!!!!!!!!!!!!!!!!!!!!!!!!!!!!!!!!!!!!!!!!!!!!!!!!!!!!!!!!!!!!!!!!!!!!!!!!!!!!!!!!!!!!!!!!!!!!!!!!!!!!!!!!!!!!!!!!!!!!!!!!!!!!!!!!!!!!!!!!!!!!!!!!!!!!!!!!!!!!!!!!!!!!!!!!!!!!!!!!!!!!!!!!!!!!!!!!!!!!!!!!!!!!!!!!!!!!!!!!!!!!!!!!!!!!!!!!!!!!!!!!!!!!!!!!!!!!!!!!!!!!!!!!!!!!!!!!!!!!!!!!!!!!!!!!!!!!!!!!!!!!!!!!!!!!!!!!!!!!!!!!!!!!!!!!!!!!!!!!!!!!!!!!!!!!!!!!!!!!!!!!!!!!!!!!!!!!!!!!!!!!!!!!!!!!!!!!!!!!!!!!!!!!!!!!!!!!!!!!!!!!!!!!!!!!!!!!!!!!!!!!!!!!!!!!!!!!!!!!!!!!!!!!!!!!!!!!!!!!!!!!!!!!!!!!!!!!!!!!!!!!!!!!!!!!!!!!!!!!!!!!!!!!!!!!!!!!!!!!!!!!!!!!!!!!!!!!!!!!!!!!!!!!!!!!!!!!!!!!!!!!!!!!!!!!!!!!!!!!!!!!!!!!!!!!!!!!!!!!!!!!!!!!!!!!!!!!!!!!!!!!!!!!!!!!!!!!!!!!!!!!!!!!!!!!!!!!!!!!!!!!!!!!!!!!!!!!!!!!!!!!!!!!!!!!!!!!!!!!!!!!!!!!!!!!!!!!!!!!!!!!!!!!!!!!!!!!!!!!!!!!!!!!!!!!!!!!!!!!!!!!!!!!!!!!!!!!!!!!!!!!!!!!!!!!!!!!!!!!!!!!!!!!!!!!!!!!!!!!!!!!!!!!!!!!!!!!!!!!!!!!!!!!!!!!!!!!!!!!!!!!!!!!!!!!!!!!!!!!!!!!!!!!!!!!!!!!!!!!!!!!!!!!!!!!!!!!!!!!!!!!!!!!!!!!!!!!!!!!!!!!!!!!!!!!!!!!!!!!!!!!!!!!!!!!!!!!!!!!!!!!!!!!!!!!!!!!!!!!!!!!!!!!!!!!!!!!!!!!!!!!!!!!!!!!!!!!!!!!!!!!!!!!!!!!!!!!!!!!!!!!!!!!!!!!!!!!!!!!!!!!!!!!!!!!!!!!!!!!!!!!!!!!!!!!!!!!!!!!!!!!!!!!!!!!!!!!!!!!!!!!!!!!!!!!!!!!!!!!!!!!!!!!!!!!!!!!!!!!!!!!!!!!!!!!!!!!!!!!!!!!!!!!!!!!!!!!!!!!!!!!!!!!!!!!!!!!!!!!!!!!!!!!!!!!!!!!!!!!!!!!!!!!!!!!!!!!!!!!!!!!!!!!!!!!!!!!!!!!!!!!!!!!!!!!!!!!!!!!!!!!!!!!!!!!!!!!!!!!!!!!!!!!!!!!!!!!!!!!!!!!!!!!!!!!!!!!!!!!!!!!!!!!!!!!!!!!!!!!!!!!!!!!!!!!!!!!!!!!!!!!!!!!!!!!!!!!!!!!!!!!!!!!!!!!!!!!!!!!!!!!!!!!!!!!!!!!!!!!!!!!!!!!!!!!!!!!!!!!!!!!!!!!!!!!!!!!!!!!!!!!!!!!!!!!!!!!!!!!!!!!!!!!!!!!!!!!!!!!!!!!!!!!!!!!!!!!!!!!!!!!!!!!!!!!!!!!!!!!!!!!!!!!!!!!!!!!!!!!!!!!!!!!!!!!!!!!!!!!!!!!!!!!!!!!!!!!!!!!!!!!!!!!!!!!!!!!!!!!!!!!!!!!!!!!!!!!!!!!!!!!!!!!!!!!!!!!!!!!!!!!!!!!!!!!!!!!!!!!!!!!!!!!!!!!!!!!!!!!!!!!!!!!!!!!!!!!!!!!!!!!!!!!!!!!!!!!!!!!!!!!!!!!!!!!!!!!!!!!!!!!!!!!!!!!!!!!!!!!!!!!!!!!!!!!!!!!!!!!!!!!!!!!!!!!!!!!!!!!!!!!!!!!!!!!!!!!!!!!!!!!!!!!!!!!!!!!!!!!!!!!!!!!!!!!!!!!!!!!!!!!!!!!!!!!!!!!!!!!!!!!!!!!!!!!!!!!!!!!!!!!!!!!!!!!!!!!!!!!!!!!!!!!!!!!!!!!!!!!!!!!!!!!!!!!!!!!!!!!!!!!!!!!!!!!!!!!!!!!!!!!!!!!!!!!!!!!!!!!!!!!!!!!!!!!!!!!!!!!!!!!!!!!!!!!!!!!!!!!!!!!!!!!!!!!!!!!!!!!!!!!!!!!!!!!!!!!!!!!!!!!!!!!!!!!!!!!!!!!!!!!!!!!!!!!!!!!!!!!!!!!!!!!!!!!!!!!!!!!!!!!!!!!!!!!!!!!!!!!!!!!!!!!!!!!!!!!!!!!!!!!!!!!!!!!!!!!!!!!!!!!!!!!!!!!!!!!!!!!!!!!!!!!!!!!!!!!!!!!!!!!!!!!!!!!!!!!!!!!!!!!!!!!!!!!!!!!!!!!!!!!!!!!!!!!!!!!!!!!!!!!!!!!!!!!!!!!!!!!!!!!!!!!!!!!!!!!!!!!!!!!!!!!!!!!!!!!!!!!!!!!!!!!!!!!!!!!!!!!!!!!!!!!!!!!!!!!!!!!!!!!!!!!!!!!!!!!!!!!!!!!!!!!!!!!!!!!!!!!!!!!!!!!!!!!!!!!!!!!!!!!!!!!!!!!!!!!!!!!!!!!!!!!!!!!!!!!!!!!!!!!!!!!!!!!!!!!!!!!!!!!!!!!!!!!!!!!!!!!!!!!!!!!!!!!!!!!!!!!!!!!!!!!!!!!!!!!!!!!!!!!!!!!!!!!!!!!!!!!!!!!!!!!!!!!!!!!!!!!!!!!!!!!!!!!!!!!!!!!!!!!!!!!!!!!!!!!!!!!!!!!!!!!!!!!!!!!!!!!!!!!!!!!!!!!!!!!!!!!!!!!!!!!!!!!!!!!!!!!!!!!!!!!!!!!!!!!!!!!!!!!!!!!!!!!!!!!!!!!!!!!!!!!!!!!!!!!!!!!!!!!!!!!!!!!!!!!!!!!!!!!!!!!!!!!!!!!!!!!!!!!!!!!!!!!!!!!!!!!!!!!!!!!!!!!!!!!!!!!!!!!!!!!!!!!!!!!!!!!!!!!!!!!!!!!!!!!!!!!!!!!!!!!!!!!!!!!!!!!!!!!!!!!!!!!!!!!!!!!!!!!!!!!!!!!!!!!!!!!!!!!!!!!!!!!!!!!!!!!!!!!!!!!!!!!!!!!!!!!!!!!!!!!!!!!!!!!!!!!!!!!!!!!!!!!!!!!!!!!!!!!!!!!!!!!!!!!!!!!!!!!!!!!!!!!!!!!!!!!!!!!!!!!!!!!!!!!!!!!!!!!!!!!!!!!!!!!!!!!!!!!!!!!!!!!!!!!!!!!!!!!!!!!!!!!!!!!!!!!!!!!!!!!!!!!!!!!!!!!!!!!!!!!!!!!!!!!!!!!!!!!!!!!!!!!!!!!!!!!!!!!!!!!!!!!!!!!!!!!!!!!!!!!!!!!!!!!!!!!!!!!!!!!!!!!!!!!!!!!!!!!!!!!!!!!!!!!!!!!!!!!!!!!!!!!!!!!!!!!!!!!!!!!!!!!!!!!!!!!!!!!!!!!!!!!!!!!!!!!!!!!!!!!!!!!!!!!!!!!!!!!!!!!!!!!!!!!!!!!!!!!!!!!!!!!!!!!!!!!!!!!!!!!!!!!!!!!!!!!!!!!!!!!!!!!!!!!!!!!!!!!!!!!!!!!!!!!!!!!!!!!!!!!!!!!!!!!!!!!!!!!!!!!!!!!!!!!!!!!!!!!!!!!!!!!!!!!!!!!!!!!!!!!!!!!!!!!!!!!!!!!!!!!!!!!!!!!!!!!!!!!!!!!!!!!!!!!!!!!!!!!!!!!!!!!!!!!!!!!!!!!!!!!!!!!!!!!!!!!!!!!!!!!!!!!!!!!!!!!!!!!!!!!!!!!!!!!!!!!!!!!!!!!!!!!!!!!!!!!!!!!!!!!!!!!!!!!!!!!!!!!!!!!!!!!!!!!!!!!!!!!!!!!!!!!!!!!!!!!!!!!!!!!!!!!!!!!!!!!!!!!!!!!!!!!!!!!!!!!!!!!!!!!!!!!!!!!!!!!!!!!!!!!!!!!!!!!!!!!!!!!!!!!!!!!!!!!!!!!!!!!!!!!!!!!!!!!!!!!!!!!!!!!!!!!!!!!!!!!!!!!!!!!!!!!!!!!!!!!!!!!!!!!!!!!!!!!!!!!!!!!!!!!!!!!!!!!!!!!!!!!!!!!!!!!!!!!!!!!!!!!!!!!!!!!!!!!!!!!!!!!!!!!!!!!!!!!!!!!!!!!!!!!!!!!!!!!!!!!!!!!!!!!!!!!!!!!!!!!!!!!!!!!!!!!!!!!!!!!!!!!!!!!!!!!!!!!!!!!!!!!!!!!!!!!!!!!!!!!!!!!!!!!!!!!!!!!!!!!!!!!!!!!!!!!!!!!!!!!!!!!!!!!!!!!!!!!!!!!!!!!!!!!!!!!!!!!!!!!!!!!!!!!!!!!!!!!!!!!!!!!!!!!!!!!!!!!!!!!!!!!!!!!!!!!!!!!!!!!!!!!!!!!!!!!!!!!!!!!!!!!!!!!!!!!!!!!!!!!!!!!!!!!!!!!!!!!!!!!!!!!!!!!!!!!!!!!!!!!!!!!!!!!!!!!!!!!!!!!!!!!!!!!!!!!!!!!!!!!!!!!!!!!!!!!!!!!!!!!!!!!!!!!!!!!!!!!!!!!!!!!!!!!!!!!!!!!!!!!!!!!!!!!!!!!!!!!!!!!!!!!!!!!!!!!!!!!!!!!!!!!!!!!!!!!!!!!!!!!!!!!!!!!!!!!!!!!!!!!!!!!!!!!!!!!!!!!!!!!!!!!!!!!!!!!!!!!!!!!!!!!!!!!!!!!!!!!!!!!!!!!!!!!!!!!!!!!!!!!!!!!!!!!!!!!!!!!!!!!!!!!!!!!!!!!!!!!!!!!!!!!!!!!!!!!!!!!!!!!!!!!!!!!!!!!!!!!!!!!!!!!!!!!!!!!!!!!!!!!!!!!!!!!!!!!!!!!!!!!!!!!!!!!!!!!!!!!!!!!!!!!!!!!!!!!!!!!!!!!!!!!!!!!!!!!!!!!!!!!!!!!!!!!!!!!!!!!!!!!!!!!!!!!!!!!!!!!!!!!!!!!!!!!!!!!!!!!!!!!!!!!!!!!!!!!!!!!!!!!!!!!!!!!!!!!!!!!!!!!!!!!!!!!!!!!!!!!!!!!!!!!!!!!!!!!!!!!!!!!!!!!!!!!!!!!!!!!!!!!!!!!!!!!!!!!!!!!!!!!!!!!!!!!!!!!!!!!!!!!!!!!!!!!!!!!!!!!!!!!!!!!!!!!!!!!!!!!!!!!!!!!!!!!!!!!!!!!!!!!!!!!!!!!!!!!!!!!!!!!!!!!!!!!!!!!!!!!!!!!!!!!!!!!!!!!!!!!!!!!!!!!!!!!!!!!!!!!!!!!!!!!!!!!!!!!!!!!!!!!!!!!!!!!!!!!!!!!!!!!!!!!!!!!!!!!!!!!!!!!!!!!!!!!!!!!!!!!!!!!!!!!!!!!!!!!!!!!!!!!!!!!!!!!!!!!!!!!!!!!!!!!!!!!!!!!!!!!!!!!!!!!!!!!!!!!!!!!!!!!!!!!!!!!!!!!!!!!!!!!!!!!!!!!!!!!!!!!!!!!!!!!!!!!!!!!!!!!!!!!!!!!!!!!!!!!!!!!!!!!!!!!!!!!!!!!!!!!!!!!!!!!!!!!!!!!!!!!!!!!!!!!!!!!!!!!!!!!!!!!!!!!!!!!!!!!!!!!!!!!!!!!!!!!!!!!!!!!!!!!!!!!!!!!!!!!!!!!!!!!!!!!!!!!!!!!!!!!!!!!!!!!!!!!!!!!!!!!!!!!!!!!!!!!!!!!!!!!!!!!!!!!!!!!!!!!!!!!!!!!!!!!!!!!!!!!!!!!!!!!!!!!!!!!!!!!!!!!!!!!!!!!!!!!!!!!!!!!!!!!!!!!!!!!!!!!!!!!!!!!!!!!!!!!!!!!!!!!!!!!!!!!!!!!!!!!!!!!!!!!!!!!!!!!!!!!!!!!!!!!!!!!!!!!!!!!!!!!!!!!!!!!!!!!!!!!!!!!!!!!!!!!!!!!!!!!!!!!!!!!!!!!!!!!!!!!!!!!!!!!!!!!!!!!!!!!!!!!!!!!!!!!!!!!!!!!!!!!!!!!!!!!!!!!!!!!!!!!!!!!!!!!!!!!!!!!!!!!!!!!!!!!!!!!!!!!!!!!!!!!!!!!!!!!!!!!!!!!!!!!!!!!!!!!!!!!!!!!!!!!!!!!!!!!!!!!!!!!!!!!!!!!!!!!!!!!!!!!!!!!!!!!!!!!!!!!!!!!!!!!!!!!!!!!!!!!!!!!!!!!!!!!!!!!!!!!!!!!!!!!!!!!!!!!!!!!!!!!!!!!!!!!!!!!!!!!!!!!!!!!!!!!!!!!!!!!!!!!!!!!!!!!!!!!!!!!!!!!!!!!!!!!!!!!!!!!!!!!!!!!!!!!!!!!!!!!!!!!!!!!!!!!!!!!!!!!!!!!!!!!!!!!!!!!!!!!!!!!!!!!!!!!!!!!!!!!!!!!!!!!!!!!!!!!!!!!!!!!!!!!!!!!!!!!!!!!!!!!!!!!!!!!!!!!!!!!!!!!!!!!!!!!!!!!!!!!!!!!!!!!!!!!!!!!!!!!!!!!!!!!!!!!!!!!!!!!!!!!!!!!!!!!!!!!!!!!!!!!!!!!!!!!!!!!!!!!!!!!!!!!!!!!!!!!!!!!!!!!!!!!!!!!!!!!!!!!!!!!!!!!!!!!!!!!!!!!!!!!!!!!!!!!!!!!!!!!!!!!!!!!!!!!!!!!!!!!!!!!!!!!!!!!!!!!!!!!!!!!!!!!!!!!!!!!!!!!!!!!!!!!!!!!!!!!!!!!!!!!!!!!!!!!!!!!!!!!!!!!!!!!!!!!!!!!!!!!!!!!!!!!!!!!!!!!!!!!!!!!!!!!!!!!!!!!!!!!!!!!!!!!!!!!!!!!!!!!!!!!!!!!!!!!!!!!!!!!!!!!!!!!!!!!!!!!!!!!!!!!!!!!!!!!!!!!!!!!!!!!!!!!!!!!!!!!!!!!!!!!!!!!!!!!!!!!!!!!!!!!!!!!!!!!!!!!!!!!!!!!!!!!!!!!!!!!!!!!!!!!!!!!!!!!!!!!!!!!!!!!!!!!!!!!!!!!!!!!!!!!!!!!!!!!!!!!!!!!!!!!!!!!!!!!!!!!!!!!!!!!!!!!!!!!!!!!!!!!!!!!!!!!!!!!!!!!!!!!!!!!!!!!!!!!!!!!!!!!!!!!!!!!!!!!!!!!!!!!!!!!!!!!!!!!!!!!!!!!!!!!!!!!!!!!!!!!!!!!!!!!!!!!!!!!!!!!!!!!!!!!!!!!!!!!!!!!!!!!!!!!!!!!!!!!!!!!!!!!!!!!!!!!!!!!!!!!!!!!!!!!!!!!!!!!!!!!!!!!!!!!!!!!!!!!!!!!!!!!!!!!!!!!!!!!!!!!!!!!!!!!!!!!!!!!!!!!!!!!!!!!!!!!!!!!!!!!!!!!!!!!!!!!!!!!!!!!!!!!!!!!!!!!!!!!!!!!!!!!!!!!!!!!!!!!!!!!!!!!!!!!!!!!!!!!!!!!!!!!!!!!!!!!!!!!!!!!!!!!!!!!!!!!!!!!!!!!!!!!!!!!!!!!!!!!!!!!!!!!!!!!!!!!!!!!!!!!!!!!!!!!!!!!!!!!!!!!!!!!!!!!!!!!!!!!!!!!!!!!!!!!!!!!!!!!!!!!!!!!!!!!!!!!!!!!!!!!!!!!!!!!!!!!!!!!!!!!!!!!!!!!!!!!!!!!!!!!!!!!!!!!!!!!!!!!!!!!!!!!!!!!!!!!!!!!!!!!!!!!!!!!!!!!!!!!!!!!!!!!!!!!!!!!!!!!!!!!!!!!!!!!!!!!!!!!!!!!!!!!!!!!!!!!!!!!!!!!!!!!!!!!!!!!!!!!!!!!!!!!!!!!!!!!!!!!!!!!!!!!!!!!!!!!!!!!!!!!!!!!!!!!!!!!!!!!!!!!!!!!!!!!!!!!!!!!!!!!!!!!!!!!!!!!!!!!!!!!!!!!!!!!!!!!!!!!!!!!!!!!!!!!!!!!!!!!!!!!!!!!!!!!!!!!!!!!!!!!!!!!!!!!!!!!!!!!!!!!!!!!!!!!!!!!!!!!!!!!!!!!!!!!!!!!!!!!!!!!!!!!!!!!!!!!!!!!!!!!!!!!!!!!!!!!!!!!!!!!!!!!!!!!!!!!!!!!!!!!!!!!!!!!!!!!!!!!!!!!!!!!!!!!!!!!!!!!!!!!!!!!!!!!!!!!!!!!!!!!!!!!!!!!!!!!!!!!!!!!!!!!!!!!!!!!!!!!!!!!!!!!!!!!!!!!!!!!!!!!!!!!!!!!!!!!!!!!!!!!!!!!!!!!!!!!!!!!!!!!!!!!!!!!!!!!!!!!!!!!!!!!!!!!!!!!!!!!!!!!!!!!!!!!!!!!!!!!!!!!!!!!!!!!!!!!!!!!!!!!!!!!!!!!!!!!!!!!!!!!!!!!!!!!!!!!!!!!!!!!!!!!!!!!!!!!!!!!!!!!!!!!!!!!!!!!!!!!!!!!!!!!!!!!!!!!!!!!!!!!!!!!!!!!!!!!!!!!!!!!!!!!!!!!!!!!!!!!!!!!!!!!!!!!!!!!!!!!!!!!!!!!!!!!!!!!!!!!!!!!!!!!!!!!!!!!!!!!!!!!!!!!!!!!!!!!!!!!!!!!!!!!!!!!!!!!!!!!!!!!!!!!!!!!!!!!!!!!!!!!!!!!!!!!!!!!!!!!!!!!!!!!!!!!!!!!!!!!!!!!!!!!!!!!!!!!!!!!!!!!!!!!!!!!!!!!!!!!!!!!!!!!!!!!!!!!!!!!!!!!!!!!!!!!!!!!!!!!!!!!!!!!!!!!!!!!!!!!!!!!!!!!!!!!!!!!!!!!!!!!!!!!!!!!!!!!!!!!!!!!!!!!!!!!!!!!!!!!!!!!!!!!!!!!!!!!!!!!!!!!!!!!!!!!!!!!!!!!!!!!!!!!!!!!!!!!!!!!!!!!!!!!!!!!!!!!!!!!!!!!!!!!!!!!!!!!!!!!!!!!!!!!!!!!!!!!!!!!!!!!!!!!!!!!!!!!!!!!!!!!!!!!!!!!!!!!!!!!!!!!!!!!!!!!!!!!!!!!!!!!!!!!!!!!!!!!!!!!!!!!!!!!!!!!!!!!!!!!!!!!!!!!!!!!!!!!!!!!!!!!!!!!!!!!!!!!!!!!!!!!!!!!!!!!!!!!!!!!!!!!!!!!!!!!!!!!!!!!!!!!!!!!!!!!!!!!!!!!!!!!!!!!!!!!!!!!!!!!!!!!!!!!!!!!!!!!!!!!!!!!!!!!!!!!!!!!!!!!!!!!!!!!!!!!!!!!!!!!!!!!!!!!!!!!!!!!!!!!!!!!!!!!!!!!!!!!!!!!!!!!!!!!!!!!!!!!!!!!!!!!!!!!!!!!!!!!!!!!!!!!!!!!!!!!!!!!!!!!!!!!!!!!!!!!!!!!!!!!!!!!!!!!!!!!!!!!!!!!!!!!!!!!!!!!!!!!!!!!!!!!!!!!!!!!!!!!!!!!!!!!!!!!!!!!!!!!!!!!!!!!!!!!!!!!!!!!!!!!!!!!!!!!!!!!!!!!!!!!!!!!!!!!!!!!!!!!!!!!!!!!!!!!!!!!!!!!!!!!!!!!!!!!!!!!!!!!!!!!!!!!!!!!!!!!!!!!!!!!!!!!!!!!!!!!!!!!!!!!!!!!!!!!!!!!!!!!!!!!!!!!!!!!!!!!!!!!!!!!!!!!!!!!!!!!!!!!!!!!!!!!!!!!!!!!!!!!!!!!!!!!!!!!!!!!!!!!!!!!!!!!!!!!!!!!!!!!!!!!!!!!!!!!!!!!!!!!!!!!!!!!!!!!!!!!!!!!!!!!!!!!!!!!!!!!!!!!!!!!!!!!!!!!!!!!!!!!!!!!!!!!!!!!!!!!!!!!!!!!!!!!!!!!!!!!!!!!!!!!!!!!!!!!!!!!!!!!!!!!!!!!!!!!!!!!!!!!!!!!!!!!!!!!!!!!!!!!!!!!!!!!!!!!!!!!!!!!!!!!!!!!!!!!!!!!!!!!!!!!!!!!!!!!!!!!!!!!!!!!!!!!!!!!!!!!!!!!!!!!!!!!!!!!!!!!!!!!!!!!!!!!!!!!!!!!!!!!!!!!!!!!!!!!!!!!!!!!!!!!!!!!!!!!!!!!!!!!!!!!!!!!!!!!!!!!!!!!!!!!!!!!!!!!!!!!!!!!!!!!!!!!!!!!!!!!!!!!!!!!!!!!!!!!!!!!!!!!!!!!!!!!!!!!!!!!!!!!!!!!!!!!!!!!!!!!!!!!!!!!!!!!!!!!!!!!!!!!!!!!!!!!!!!!!!!!!!!!!!!!!!!!!!!!!!!!!!!!!!!!!!!!!!!!!!!!!!!!!!!!!!!!!!!!!!!!!!!!!!!!!!!!!!!!!!!!!!!!!!!!!!!!!!!!!!!!!!!!!!!!!!!!!!!!!!!!!!!!!!!!!!!!!!!!!!!!!!!!!!!!!!!!!!!!!!!!!!!!!!!!!!!!!!!!!!!!!!!!!!!!!!!!!!!!!!!!!!!!!!!!!!!!!!!!!!!!!!!!!!!!!!!!!!!!!!!!!!!!!!!!!!!!!!!!!!!!!!!!!!!!!!!!!!!!!!!!!!!!!!!!!!!!!!!!!!!!!!!!!!!!!!!!!!!!!!!!!!!!!!!!!!!!!!!!!!!!!!!!!!!!!!!!!!!!!!!!!!!!!!!!!!!!!!!!!!!!!!!!!!!!!!!!!!!!!!!!!!!!!!!!!!!!!!!!!!!!!!!!!!!!!!!!!!!!!!!!!!!!!!!!!!!!!!!!!!!!!!!!!!!!!!!!!!!!!!!!!!!!!!!!!!!!!!!!!!!!!!!!!!!!!!!!!!!!!!!!!!!!!!!!!!!!!!!!!!!!!!!!!!!!!!!!!!!!!!!!!!!!!!!!!!!!!!!!!!!!!!!!!!!!!!!!!!!!!!!!!!!!!!!!!!!!!!!!!!!!!!!!!!!!!!!!!!!!!!!!!!!!!!!!!!!!!!!!!!!!!!!!!!!!!!!!!!!!!!!!!!!!!!!!!!!!!!!!!!!!!!!!!!!!!!!!!!!!!!!!!!!!!!!!!!!!!!!!!!!!!!!!!!!!!!!!!!!!!!!!!!!!!!!!!!!!!!!!!!!!!!!!!!!!!!!!!!!!!!!!!!!!!!!!!!!!!!!!!!!!!!!!!!!!!!!!!!!!!!!!!!!!!!!!!!!!!!!!!!!!!!!!!!!!!!!!!!!!!!!!!!!!!!!!!!!!!!!!!!!!!!!!!!!!!!!!!!!!!!!!!!!!!!!!!!!!!!!!!!!!!!!!!!!!!!!!!!!!!!!!!!!!!!!!!!!!!!!!!!!!!!!!!!!!!!!!!!!!!!!!!!!!!!!!!!!!!!!!!!!!!!!!!!!!!!!!!!!!!!!!!!!!!!!!!!!!!!!!!!!!!!!!!!!!!!!!!!!!!!!!!!!!!!!!!!!!!!!!!!!!!!!!!!!!!!!!!!!!!!!!!!!!!!!!!!!!!!!!!!!!!!!!!!!!!!!!!!!!!!!!!!!!!!!!!!!!!!!!!!!!!!!!!!!!!!!!!!!!!!!!!!!!!!!!!!!!!!!!!!!!!!!!!!!!!!!!!!!!!!!!!!!!!!!!!!!!!!!!!!!!!!!!!!!!!!!!!!!!!!!!!!!!!!!!!!!!!!!!!!!!!!!!!!!!!!!!!!!!!!!!!!!!!!!!!!!!!!!!!!!!!!!!!!!!!!!!!!!!!!!!!!!!!!!!!!!!!!!!!!!!!!!!!!!!!!!!!!!!!!!!!!!!!!!!!!!!!!!!!!!!!!!!!!!!!!!!!!!!!!!!!!!!!!!!!!!!!!!!!!!!!!!!!!!!!!!!!!!!!!!!!!!!!!!!!!!!!!!!!!!!!!!!!!!!!!!!!!!!!!!!!!!!!!!!!!!!!!!!!!!!!!!!!!!!!!!!!!!!!!!!!!!!!!!!!!!!!!!!!!!!!!!!!!!!!!!!!!!!!!!!!!!!!!!!!!!!!!!!!!!!!!!!!!!!!!!!!!!!!!!!!!!!!!!!!!!!!!!!!!!!!!!!!!!!!!!!!!!!!!!!!!!!!!!!!!!!!!!!!!!!!!!!!!!!!!!!!!!!!!!!!!!!!!!!!!!!!!!!!!!!!!!!!!!!!!!!!!!!!!!!!!!!!!!!!!!!!!!!!!!!!!!!!!!!!!!!!!!!!!!!!!!!!!!!!!!!!!!!!!!!!!!!!!!!!!!!!!!!!!!!!!!!!!!!!!!!!!!!!!!!!!!!!!!!!!!!!!!!!!!!!!!!!!!!!!!!!!!!!!!!!!!!!!!!!!!!!!!!!!!!!!!!!!!!!!!!!!!!!!!!!!!!!!!!!!!!!!!!!!!!!!!!!!!!!!!!!!!!!!!!!!!!!!!!!!!!!!!!!!!!!!!!!!!!!!!!!!!!!!!!!!!!!!!!!!!!!!!!!!!!!!!!!!!!!!!!!!!!!!!!!!!!!!!!!!!!!!!!!!!!!!!!!!!!!!!!!!!!!!!!!!!!!!!!!!!!!!!!!!!!!!!!!!!!!!!!!!!!!!!!!!!!!!!!!!!!!!!!!!!!!!!!!!!!!!!!!!!!!!!!!!!!!!!!!!!!!!!!!!!!!!!!!!!!!!!!!!!!!!!!!!!!!!!!!!!!!!!!!!!!!!!!!!!!!!!!!!!!!!!!!!!!!!!!!!!!!!!!!!!!!!!!!!!!!!!!!!!!!!!!!!!!!!!!!!!!!!!!!!!!!!!!!!!!!!!!!!!!!!!!!!!!!!!!!!!!!!!!!!!!!!!!!!!!!!!!!!!!!!!!!!!!!!!!!!!!!!!!!!!!!!!!!!!!!!!!!!!!!!!!!!!!!!!!!!!!!!!!!!!!!!!!!!!!!!!!!!!!!!!!!!!!!!!!!!!!!!!!!!!!!!!!!!!!!!!!!!!!!!!!!!!!!!!!!!!!!!!!!!!!!!!!!!!!!!!!!!!!!!!!!!!!!!!!!!!!!!!!!!!!!!!!!!!!!!!!!!!!!!!!!!!!!!!!!!!!!!!!!!!!!!!!!!!!!!!!!!!!!!!!!!!!!!!!!!!!!!!!!!!!!!!!!!!!!!!!!!!!!!!!!!!!!!!!!!!!!!!!!!!!!!!!!!!!!!!!!!!!!!!!!!!!!!!!!!!!!!!!!!!!!!!!!!!!!!!!!!!!!!!!!!!!!!!!!!!!!!!!!!!!!!!!!!!!!!!!!!!!!!!!!!!!!!!!!!!!!!!!!!!!!!!!!!!!!!!!!!!!!!!!!!!!!!!!!!!!!!!!!!!!!!!!!!!!!!!!!!!!!!!!!!!!!!!!!!!!!!!!!!!!!!!!!!!!!!!!!!!!!!!!!!!!!!!!!!!!!!!!!!!!!!!!!!!!!!!!!!!!!!!!!!!!!!!!!!!!!!!!!!!!!!!!!!!!!!!!!!!!!!!!!!!!!!!!!!!!!!!!!!!!!!!!!!!!!!!!!!!!!!!!!!!!!!!!!!!!!!!!!!!!!!!!!!!!!!!!!!!!!!!!!!!!!!!!!!!!!!!!!!!!!!!!!!!!!!!!!!!!!!!!!!!!!!!!!!!!!!!!!!!!!!!!!!!!!!!!!!!!!!!!!!!!!!!!!!!!!!!!!!!!!!!!!!!!!!!!!!!!!!!!!!!!!!!!!!!!!!!!!!!!!!!!!!!!!!!!!!!!!!!!!!!!!!!!!!!!!!!!!!!!!!!!!!!!!!!!!!!!!!!!!!!!!!!!!!!!!!!!!!!!!!!!!!!!!!!!!!!!!!!!!!!!!!!!!!!!!!!!!!!!!!!!!!!!!!!!!!!!!!!!!!!!!!!!!!!!!!!!!!!!!!!!!!!!!!!!!!!!!!!!!!!!!!!!!!!!!!!!!!!!!!!!!!!!!!!!!!!!!!!!!!!!!!!!!!!!!!!!!!!!!!!!!!!!!!!!!!!!!!!!!!!!!!!!!!!!!!!!!!!!!!!!!!!!!!!!!!!!!!!!!!!!!!!!!!!!!!!!!!!!!!!!!!!!!!!!!!!!!!!!!!!!!!!!!!!!!!!!!!!!!!!!!!!!!!!!!!!!!!!!!!!!!!!!!!!!!!!!!!!!!!!!!!!!!!!!!!!!!!!!!!!!!!!!!!!!!!!!!!!!!!!!!!!!!!!!!!!!!!!!!!!!!!!!!!!!!!!!!!!!!!!!!!!!!!!!!!!!!!!!!!!!!!!!!!!!!!!!!!!!!!!!!!!!!!!!!!!!!!!!!!!!!!!!!!!!!!!!!!!!!!!!!!!!!!!!!!!!!!!!!!!!!!!!!!!!!!!!!!!!!!!!!!!!!!!!!!!!!!!!!!!!!!!!!!!!!!!!!!!!!!!!!!!!!!!!!!!!!!!!!!!!!!!!!!!!!!!!!!!!!!!!!!!!!!!!!!!!!!!!!!!!!!!!!!!!!!!!!!!!!!!!!!!!!!!!!!!!!!!!!!!!!!!!!!!!!!!!!!!!!!!!!!!!!!!!!!!!!!!!!!!!!!!!!!!!!!!!!!!!!!!!!!!!!!!!!!!!!!!!!!!!!!!!!!!!!!!!!!!!!!!!!!!!!!!!!!!!!!!!!!!!!!!!!!!!!!!!!!!!!!!!!!!!!!!!!!!!!!!!!!!!!!!!!!!!!!!!!!!!!!!!!!!!!!!!!!!!!!!!!!!!!!!!!!!!!!!!!!!!!!!!!!!!!!!!!!!!!!!!!!!!!!!!!!!!!!!!!!!!!!!!!!!!!!!!!!!!!!!!!!!!!!!!!!!!!!!!!!!!!!!!!!!!!!!!!!!!!!!!!!!!!!!!!!!!!!!!!!!!!!!!!!!!!!!!!!!!!!!!!!!!!!!!!!!!!!!!!!!!!!!!!!!!!!!!!!!!!!!!!!!!!!!!!!!!!!!!!!!!!!!!!!!!!!!!!!!!!!!!!!!!!!!!!!!!!!!!!!!!!!!!!!!!!!!!!!!!!!!!!!!!!!!!!!!!!!!!!!!!!!!!!!!!!!!!!!!!!!!!!!!!!!!!!!!!!!!!!!!!!!!!!!!!!!!!!!!!!!!!!!!!!!!!!!!!!!!!!!!!!!!!!!!!!!!!!!!!!!!!!!!!!!!!!!!!!!!!!!!!!!!!!!!!!!!!!!!!!!!!!!!!!!!!!!!!!!!!!!!!!!!!!!!!!!!!!!!!!!!!!!!!!!!!!!!!!!!!!!!!!!!!!!!!!!!!!!!!!!!!!!!!!!!!!!!!!!!!!!!!!!!!!!!!!!!!!!!!!!!!!!!!!!!!!!!!!!!!!!!!!!!!!!!!!!!!!!!!!!!!!!!!!!!!!!!!!!!!!!!!!!!!!!!!!!!!!!!!!!!!!!!!!!!!!!!!!!!!!!!!!!!!!!!!!!!!!!!!!!!!!!!!!!!!!!!!!!!!!!!!!!!!!!!!!!!!!!!!!!!!!!!!!!!!!!!!!!!!!!!!!!!!!!!!!!!!!!!!!!!!!!!!!!!!!!!!!!!!!!!!!!!!!!!!!!!!!!!!!!!!!!!!!!!!!!!!!!!!!!!!!!!!!!!!!!!!!!!!!!!!!!!!!!!!!!!!!!!!!!!!!!!!!!!!!!!!!!!!!!!!!!!!!!!!!!!!!!!!!!!!!!!!!!!!!!!!!!!!!!!!!!!!!!!!!!!!!!!!!!!!!!!!!!!!!!!!!!!!!!!!!!!!!!!!!!!!!!!!!!!!!!!!!!!!!!!!!!!!!!!!!!!!!!!!!!!!!!!!!!!!!!!!!!!!!!!!!!!!!!!!!!!!!!!!!!!!!!!!!!!!!!!!!!!!!!!!!!!!!!!!!!!!!!!!!!!!!!!!!!!!!!!!!!!!!!!!!!!!!!!!!!!!!!!!!!!!!!!!!!!!!!!!!!!!!!!!!!!!!!!!!!!!!!!!!!!!!!!!!!!!!!!!!!!!!!!!!!!!!!!!!!!!!!!!!!!!!!!!!!!!!!!!!!!!!!!!!!!!!!!!!!!!!!!!!!!!!!!!!!!!!!!!!!!!!!!!!!!!!!!!!!!!!!!!!!!!!!!!!!!!!!!!!!!!!!!!!!!!!!!!!!!!!!!!!!!!!!!!!!!!!!!!!!!!!!!!!!!!!!!!!!!!!!!!!!!!!!!!!!!!!!!!!!!!!!!!!!!!!!!!!!!!!!!!!!!!!!!!!!!!!!!!!!!!!!!!!!!!!!!!!!!!!!!!!!!!!!!!!!!!!!!!!!!!!!!!!!!!!!!!!!!!!!!!!!!!!!!!!!!!!!!!!!!!!!!!!!!!!!!!!!!!!!!!!!!!!!!!!!!!!!!!!!!!!!!!!!!!!!!!!!!!!!!!!!!!!!!!!!!!!!!!!!!!!!!!!!!!!!!!!!!!!!!!!!!!!!!!!!!!!!!!!!!!!!!!!!!!!!!!!!!!!!!!!!!!!!!!!!!!!!!!!!!!!!!!!!!!!!!!!!!!!!!!!!!!!!!!!!!!!!!!!!!!!!!!!!!!!!!!!!!!!!!!!!!!!!!!!!!!!!!!!!!!!!!!!!!!!!!!!!!!!!!!!!!!!!!!!!!!!!!!!!!!!!!!!!!!!!!!!!!!!!!!!!!!!!!!!!!!!!!!!!!!!!!!!!!!!!!!!!!!!!!!!!!!!!!!!!!!!!!!!!!!!!!!!!!!!!!!!!!!!!!!!!!!!!!!!!!!!!!!!!!!!!!!!!!!!!!!!!!!!!!!!!!!!!!!!!!!!!!!!!!!!!!!!!!!!!!!!!!!!!!!!!!!!!!!!!!!!!!!!!!!!!!!!!!!!!!!!!!!!!!!!!!!!!!!!!!!!!!!!!!!!!!!!!!!!!!!!!!!!!!!!!!!!!!!!!!!!!!!!!!!!!!!!!!!!!!!!!!!!!!!!!!!!!!!!!!!!!!!!!!!!!!!!!!!!!!!!!!!!!!!!!!!!!!!!!!!!!!!!!!!!!!!!!!!!!!!!!!!!!!!!!!!!!!!!!!!!!!!!!!!!!!!!!!!!!!!!!!!!!!!!!!!!!!!!!!!!!!!!!!!!!!!!!!!!!!!!!!!!!!!!!!!!!!!!!!!!!!!!!!!!!!!!!!!!!!!!!!!!!!!!!!!!!!!!!!!!!!!!!!!!!!!!!!!!!!!!!!!!!!!!!!!!!!!!!!!!!!!!!!!!!!!!!!!!!!!!!!!!!!!!!!!!!!!!!!!!!!!!!!!!!!!!!!!!!!!!!!!!!!!!!!!!!!!!!!!!!!!!!!!!!!!!!!!!!!!!!!!!!!!!!!!!!!!!!!!!!!!!!!!!!!!!!!!!!!!!!!!!!!!!!!!!!!!!!!!!!!!!!!!!!!!!!!!!!!!!!!!!!!!!!!!!!!!!!!!!!!!!!!!!!!!!!!!!!!!!!!!!!!!!!!!!!!!!!!!!!!!!!!!!!!!!!!!!!!!!!!!!!!!!!!!!!!!!!!!!!!!!!!!!!!!!!!!!!!!!!!!!!!!!!!!!!!!!!!!!!!!!!!!!!!!!!!!!!!!!!!!!!!!!!!!!!!!!!!!!!!!!!!!!!!!!!!!!!!!!!!!!!!!!!!!!!!!!!!!!!!!!!!!!!!!!!!!!!!!!!!!!!!!!!!!!!!!!!!!!!!!!!!!!!!!!!!!!!!!!!!!!!!!!!!!!!!!!!!!!!!!!!!!!!!!!!!!!!!!!!!!!!!!!!!!!!!!!!!!!!!!!!!!!!!!!!!!!!!!!!!!!!!!!!!!!!!!!!!!!!!!!!!!!!!!!!!!!!!!!!!!!!!!!!!!!!!!!!!!!!!!!!!!!!!!!!!!!!!!!!!!!!!!!!!!!!!!!!!!!!!!!!!!!!!!!!!!!!!!!!!!!!!!!!!!!!!!!!!!!!!!!!!!!!!!!!!!!!!!!!!!!!!!!!!!!!!!!!!!!!!!!!!!!!!!!!!!!!!!!!!!!!!!!!!!!!!!!!!!!!!!!!!!!!!!!!!!!!!!!!!!!!!!!!!!!!!!!!!!!!!!!!!!!!!!!!!!!!!!!!!!!!!!!!!!!!!!!!!!!!!!!!!!!!!!!!!!!!!!!!!!!!!!!!!!!!!!!!!!!!!!!!!!!!!!!!!!!!!!!!!!!!!!!!!!!!!!!!!!!!!!!!!!!!!!!!!!!!!!!!!!!!!!!!!!!!!!!!!!!!!!!!!!!!!!!!!!!!!!!!!!!!!!!!!!!!!!!!!!!!!!!!!!!!!!!!!!!!!!!!!!!!!!!!!!!!!!!!!!!!!!!!!!!!!!!!!!!!!!!!!!!!!!!!!!!!!!!!!!!!!!!!!!!!!!!!!!!!!!!!!!!!!!!!!!!!!!!!!!!!!!!!!!!!!!!!!!!!!!!!!!!!!!!!!!!!!!!!!!!!!!!!!!!!!!!!!!!!!!!!!!!!!!!!!!!!!!!!!!!!!!!!!!!!!!!!!!!!!!!!!!!!!!!!!!!!!!!!!!!!!!!!!!!!!!!!!!!!!!!!!!!!!!!!!!!!!!!!!!!!!!!!!!!!!!!!!!!!!!!!!!!!!!!!!!!!!!!!!!!!!!!!!!!!!!!!!!!!!!!!!!!!!!!!!!!!!!!!!!!!!!!!!!!!!!!!!!!!!!!!!!!!!!!!!!!!!!!!!!!!!!!!!!!!!!!!!!!!!!!!!!!!!!!!!!!!!!!!!!!!!!!!!!!!!!!!!!!!!!!!!!!!!!!!!!!!!!!!!!!!!!!!!!!!!!!!!!!!!!!!!!!!!!!!!!!!!!!!!!!!!!!!!!!!!!!!!!!!!!!!!!!!!!!!!!!!!!!!!!!!!!!!!!!!!!!!!!!!!!!!!!!!!!!!!!!!!!!!!!!!!!!!!!!!!!!!!!!!!!!!!!!!!!!!!!!!!!!!!!!!!!!!!!!!!!!!!!!!!!!!!!!!!!!!!!!!!!!!!!!!!!!!!!!!!!!!!!!!!!!!!!!!!!!!!!!!!!!!!!!!!!!!!!!!!!!!!!!!!!!!!!!!!!!!!!!!!!!!!!!!!!!!!!!!!!!!!!!!!!!!!!!!!!!!!!!!!!!!!!!!!!!!!!!!!!!!!!!!!!!!!!!!!!!!!!!!!!!!!!!!!!!!!!!!!!!!!!!!!!!!!!!!!!!!!!!!!!!!!!!!!!!!!!!!!!!!!!!!!!!!!!!!!!!!!!!!!!!!!!!!!!!!!!!!!!!!!!!!!!!!!!!!!!!!!!!!!!!!!!!!!!!!!!!!!!!!!!!!!!!!!!!!!!!!!!!!!!!!!!!!!!!!!!!!!!!!!!!!!!!!!!!!!!!!!!!!!!!!!!!!!!!!!!!!!!!!!!!!!!!!!!!!!!!!!!!!!!!!!!!!!!!!!!!!!!!!!!!!!!!!!!!!!!!!!!!!!!!!!!!!!!!!!!!!!!!!!!!!!!!!!!!!!!!!!!!!!!!!!!!!!!!!!!!!!!!!!!!!!!!!!!!!!!!!!!!!!!!!!!!!!!!!!!!!!!!!!!!!!!!!!!!!!!!!!!!!!!!!!!!!!!!!!!!!!!!!!!!!!!!!!!!!!!!!!!!!!!!!!!!!!!!!!!!!!!!!!!!!!!!!!!!!!!!!!!!!!!!!!!!!!!!!!!!!!!!!!!!!!!!!!!!!!!!!!!!!!!!!!!!!!!!!!!!!!!!!!!!!!!!!!!!!!!!!!!!!!!!!!!!!!!!!!!!!!!!!!!!!!!!!!!!!!!!!!!!!!!!!!!!!!!!!!!!!!!!!!!!!!!!!!!!!!!!!!!!!!!!!!!!!!!!!!!!!!!!!!!!!!!!!!!!!!!!!!!!!!!!!!!!!!!!!!!!!!!!!!!!!!!!!!!!!!!!!!!!!!!!!!!!!!!!!!!!!!!!!!!!!!!!!!!!!!!!!!!!!!!!!!!!!!!!!!!!!!!!!!!!!!!!!!!!!!!!!!!!!!!!!!!!!!!!!!!!!!!!!!!!!!!!!!!!!!!!!!!!!!!!!!!!!!!!!!!!!!!!!!!!!!!!!!!!!!!!!!!!!!!!!!!!!!!!!!!!!!!!!!!!!!!!!!!!!!!!!!!!!!!!!!!!!!!!!!!!!!!!!!!!!!!!!!!!!!!!!!!!!!!!!!!!!!!!!!!!!!!!!!!!!!!!!!!!!!!!!!!!!!!!!!!!!!!!!!!!!!!!!!!!!!!!!!!!!!!!!!!!!!!!!!!!!!!!!!!!!!!!!!!!!!!!!!!!!!!!!!!!!!!!!!!!!!!!!!!!!!!!!!!!!!!!!!!!!!!!!!!!!!!!!!!!!!!!!!!!!!!!!!!!!!!!!!!!!!!!!!!!!!!!!!!!!!!!!!!!!!!!!!!!!!!!!!!!!!!!!!!!!!!!!!!!!!!!!!!!!!!!!!!!!!!!!!!!!!!!!!!!!!!!!!!!!!!!!!!!!!!!!!!!!!!!!!!!!!!!!!!!!!!!!!!!!!!!!!!!!!!!!!!!!!!!!!!!!!!!!!!!!!!!!!!!!!!!!!!!!!!!!!!!!!!!!!!!!!!!!!!!!!!!!!!!!!!!!!!!!!!!!!!!!!!!!!!!!!!!!!!!!!!!!!!!!!!!!!!!!!!!!!!!!!!!!!!!!!!!!!!!!!!!!!!!!!!!!!!!!!!!!!!!!!!!!!!!!!!!!!!!!!!!!!!!!!!!!!!!!!!!!!!!!!!!!!!!!!!!!!!!!!!!!!!!!!!!!!!!!!!!!!!!!!!!!!!!!!!!!!!!!!!!!!!!!!!!!!!!!!!!!!!!!!!!!!!!!!!!!!!!!!!!!!!!!!!!!!!!!!!!!!!!!!!!!!!!!!!!!!!!!!!!!!!!!!!!!!!!!!!!!!!!!!!!!!!!!!!!!!!!!!!!!!!!!!!!!!!!!!!!!!!!!!!!!!!!!!!!!!!!!!!!!!!!!!!!!!!!!!!!!!!!!!!!!!!!!!!!!!!!!!!!!!!!!!!!!!!!!!!!!!!!!!!!!!!!!!!!!!!!!!!!!!!!!!!!!!!!!!!!!!!!!!!!!!!!!!!!!!!!!!!!!!!!!!!!!!!!!!!!!!!!!!!!!!!!!!!!!!!!!!!!!!!!!!!!!!!!!!!!!!!!!!!!!!!!!!!!!!!!!!!!!!!!!!!!!!!!!!!!!!!!!!!!!!!!!!!!!!!!!!!!!!!!!!!!!!!!!!!!!!!!!!!!!!!!!!!!!!!!!!!!!!!!!!!!!!!!!!!!!!!!!!!!!!!!!!!!!!!!!!!!!!!!!!!!!!!!!!!!!!!!!!!!!!!!!!!!!!!!!!!!!!!!!!!!!!!!!!!!!!!!!!!!!!!!!!!!!!!!!!!!!!!!!!!!!!!!!!!!!!!!!!!!!!!!!!!!!!!!!!!!!!!!!!!!!!!!!!!!!!!!!!!!!!!!!!!!!!!!!!!!!!!!!!!!!!!!!!!!!!!!!!!!!!!!!!!!!!!!!!!!!!!!!!!!!!!!!!!!!!!!!!!!!!!!!!!!!!!!!!!!!!!!!!!!!!!!!!!!!!!!!!!!!!!!!!!!!!!!!!!!!!!!!!!!!!!!!!!!!!!!!!!!!!!!!!!!!!!!!!!!!!!!!!!!!!!!!!!!!!!!!!!!!!!!!!!!!!!!!!!!!!!!!!!!!!!!!!!!!!!!!!!!!!!!!!!!!!!!!!!!!!!!!!!!!!!!!!!!!!!!!!!!!!!!!!!!!!!!!!!!!!!!!!!!!!!!!!!!!!!!!!!!!!!!!!!!!!!!!!!!!!!!!!!!!!!!!!!!!!!!!!!!!!!!!!!!!!!!!!!!!!!!!!!!!!!!!!!!!!!!!!!!!!!!!!!!!!!!!!!!!!!!!!!!!!!!!!!!!!!!!!!!!!!!!!!!!!!!!!!!!!!!!!!!!!!!!!!!!!!!!!!!!!!!!!!!!!!!!!!!!!!!!!!!!!!!!!!!!!!!!!!!!!!!!!!!!!!!!!!!!!!!!!!!!!!!!!!!!!!!!!!!!!!!!!!!!!!!!!!!!!!!!!!!!!!!!!!!!!!!!!!!!!!!!!!!!!!!!!!!!!!!!!!!!!!!!!!!!!!!!!!!!!!!!!!!!!!!!!!!!!!!!!!!!!!!!!!!!!!!!!!!!!!!!!!!!!!!!!!!!!!!!!!!!!!!!!!!!!!!!!!!!!!!!!!!!!!!!!!!!!!!!!!!!!!!!!!!!!!!!!!!!!!!!!!!!!!!!!!!!!!!!!!!!!!!!!!!!!!!!!!!!!!!!!!!!!!!!!!!!!!!!!!!!!!!!!!!!!!!!!!!!!!!!!!!!!!!!!!!!!!!!!!!!!!!!!!!!!!!!!!!!!!!!!!!!!!!!!!!!!!!!!!!!!!!!!!!!!!!!!!!!!!!!!!!!!!!!!!!!!!!!!!!!!!!!!!!!!!!!!!!!!!!!!!!!!!!!!!!!!!!!!!!!!!!!!!!!!!!!!!!!!!!!!!!!!!!!!!!!!!!!!!!!!!!!!!!!!!!!!!!!!!!!!!!!!!!!!!!!!!!!!!!!!!!!!!!!!!!!!!!!!!!!!!!!!!!!!!!!!!!!!!!!!!!!!!!!!!!!!!!!!!!!!!!!!!!!!!!!!!!!!!!!!!!!!!!!!!!!!!!!!!!!!!!!!!!!!!!!!!!!!!!!!!!!!!!!!!!!!!!!!!!!!!!!!!!!!!!!!!!!!!!!!!!!!!!!!!!!!!!!!!!!!!!!!!!!!!!!!!!!!!!!!!!!!!!!!!!!!!!!!!!!!!!!!!!!!!!!!!!!!!!!!!!!!!!!!!!!!!!!!!!!!!!!!!!!!!!!!!!!!!!!!!!!!!!!!!!!!!!!!!!!!!!!!!!!!!!!!!!!!!!!!!!!!!!!!!!!!!!!!!!!!!!!!!!!!!!!!!!!!!!!!!!!!!!!!!!!!!!!!!!!!!!!!!!!!!!!!!!!!!!!!!!!!!!!!!!!!!!!!!!!!!!!!!!!!!!!!!!!!!!!!!!!!!!!!!!!!!!!!!!!!!!!!!!!!!!!!!!!!!!!!!!!!!!!!!!!!!!!!!!!!!!!!!!!!!!!!!!!!!!!!!!!!!!!!!!!!!!!!!!!!!!!!!!!!!!!!!!!!!!!!!!!!!!!!!!!!!!!!!!!!!!!!!!!!!!!!!!!!!!!!!!!!!!!!!!!!!!!!!!!!!!!!!!!!!!!!!!!!!!!!!!!!!!!!!!!!!!!!!!!!!!!!!!!!!!!!!!!!!!!!!!!!!!!!!!!!!!!!!!!!!!!!!!!!!!!!!!!!!!!!!!!!!!!!!!!!!!!!!!!!!!!!!!!!!!!!!!!!!!!!!!!!!!!!!!!!!!!!!!!!!!!!!!!!!!!!!!!!!!!!!!!!!!!!!!!!!!!!!!!!!!!!!!!!!!!!!!!!!!!!!!!!!!!!!!!!!!!!!!!!!!!!!!!!!!!!!!!!!!!!!!!!!!!!!!!!!!!!!!!!!!!!!!!!!!!!!!!!!!!!!!!!!!!!!!!!!!!!!!!!!!!!!!!!!!!!!!!!!!!!!!!!!!!!!!!!!!!!!!!!!!!!!!!!!!!!!!!!!!!!!!!!!!!!!!!!!!!!!!!!!!!!!!!!!!!!!!!!!!!!!!!!!!!!!!!!!!!!!!!!!!!!!!!!!!!!!!!!!!!!!!!!!!!!!!!!!!!!!!!!!!!!!!!!!!!!!!!!!!!!!!!!!!!!!!!!!!!!!!!!!!!!!!!!!!!!!!!!!!!!!!!!!!!!!!!!!!!!!!!!!!!!!!!!!!!!!!!!!!!!!!!!!!!!!!!!!!!!!!!!!!!!!!!!!!!!!!!!!!!!!!!!!!!!!!!!!!!!!!!!!!!!!!!!!!!!!!!!!!!!!!!!!!!!!!!!!!!!!!!!!!!!!!!!!!!!!!!!!!!!!!!!!!!!!!!!!!!!!!!!!!!!!!!!!!!!!!!!!!!!!!!!!!!!!!!!!!!!!!!!!!!!!!!!!!!!!!!!!!!!!!!!!!!!!!!!!!!!!!!!!!!!!!!!!!!!!!!!!!!!!!!!!!!!!!!!!!!!!!!!!!!!!!!!!!!!!!!!!!!!!!!!!!!!!!!!!!!!!!!!!!!!!!!!!!!!!!!!!!!!!!!!!!!!!!!!!!!!!!!!!!!!!!!!!!!!!!!!!!!!!!!!!!!!!!!!!!!!!!!!!!!!!!!!!!!!!!!!!!!!!!!!!!!!!!!!!!!!!!!!!!!!!!!!!!!!!!!!!!!!!!!!!!!!!!!!!!!!!!!!!!!!!!!!!!!!!!!!!!!!!!!!!!!!!!!!!!!!!!!!!!!!!!!!!!!!!!!!!!!!!!!!!!!!!!!!!!!!!!!!!!!!!!!!!!!!!!!!!!!!!!!!!!!!!!!!!!!!!!!!!!!!!!!!!!!!!!!!!!!!!!!!!!!!!!!!!!!!!!!!!!!!!!!!!!!!!!!!!!!!!!!!!!!!!!!!!!!!!!!!!!!!!!!!!!!!!!!!!!!!!!!!!!!!!!!!!!!!!!!!!!!!!!!!!!!!!!!!!!!!!!!!!!!!!!!!!!!!!!!!!!!!!!!!!!!!!!!!!!!!!!!!!!!!!!!!!!!!!!!!!!!!!!!!!!!!!!!!!!!!!!!!!!!!!!!!!!!!!!!!!!!!!!!!!!!!!!!!!!!!!!!!!!!!!!!!!!!!!!!!!!!!!!!!!!!!!!!!!!!!!!!!!!!!!!!!!!!!!!!!!!!!!!!!!!!!!!!!!!!!!!!!!!!!!!!!!!!!!!!!!!!!!!!!!!!!!!!!!!!!!!!!!!!!!!!!!!!!!!!!!!!!!!!!!!!!!!!!!!!!!!!!!!!!!!!!!!!!!!!!!!!!!!!!!!!!!!!!!!!!!!!!!!!!!!!!!!!!!!!!!!!!!!!!!!!!!!!!!!!!!!!!!!!!!!!!!!!!!!!!!!!!!!!!!!!!!!!!!!!!!!!!!!!!!!!!!!!!!!!!!!!!!!!!!!!!!!!!!!!!!!!!!!!!!!!!!!!!!!!!!!!!!!!!!!!!!!!!!!!!!!!!!!!!!!!!!!!!!!!!!!!!!!!!!!!!!!!!!!!!!!!!!!!!!!!!!!!!!!!!!!!!!!!!!!!!!!!!!!!!!!!!!!!!!!!!!!!!!!!!!!!!!!!!!!!!!!!!!!!!!!!!!!!!!!!!!!!!!!!!!!!!!!!!!!!!!!!!!!!!!!!!!!!!!!!!!!!!!!!!!!!!!!!!!!!!!!!!!!!!!!!!!!!!!!!!!!!!!!!!!!!!!!!!!!!!!!!!!!!!!!!!!!!!!!!!!!!!!!!!!!!!!!!!!!!!!!!!!!!!!!!!!!!!!!!!!!!!!!!!!!!!!!!!!!!!!!!!!!!!!!!!!!!!!!!!!!!!!!!!!!!!!!!!!!!!!!!!!!!!!!!!!!!!!!!!!!!!!!!!!!!!!!!!!!!!!!!!!!!!!!!!!!!!!!!!!!!!!!!!!!!!!!!!!!!!!!!!!!!!!!!!!!!!!!!!!!!!!!!!!!!!!!!!!!!!!!!!!!!!!!!!!!!!!!!!!!!!!!!!!!!!!!!!!!!!!!!!!!!!!!!!!!!!!!!!!!!!!!!!!!!!!!!!!!!!!!!!!!!!!!!!!!!!!!!!!!!!!!!!!!!!!!!!!!!!!!!!!!!!!!!!!!!!!!!!!!!!!!!!!!!!!!!!!!!!!!!!!!!!!!!!!!!!!!!!!!!!!!!!!!!!!!!!!!!!!!!!!!!!!!!!!!!!!!!!!!!!!!!!!!!!!!!!!!!!!!!!!!!!!!!!!!!!!!!!!!!!!!!!!!!!!!!!!!!!!!!!!!!!!!!!!!!!!!!!!!!!!!!!!!!!!!!!!!!!!!!!!!!!!!!!!!!!!!!!!!!!!!!!!!!!!!!!!!!!!!!!!!!!!!!!!!!!!!!!!!!!!!!!!!!!!!!!!!!!!!!!!!!!!!!!!!!!!!!!!!!!!!!!!!!!!!!!!!!!!!!!!!!!!!!!!!!!!!!!!!!!!!!!!!!!!!!!!!!!!!!!!!!!!!!!!!!!!!!!!!!!!!!!!!!!!!!!!!!!!!!!!!!!!!!!!!!!!!!!!!!!!!!!!!!!!!!!!!!!!!!!!!!!!!!!!!!!!!!!!!!!!!!!!!!!!!!!!!!!!!!!!!!!!!!!!!!!!!!!!!!!!!!!!!!!!!!!!!!!!!!!!!!!!!!!!!!!!!!!!!!!!!!!!!!!!!!!!!!!!!!!!!!!!!!!!!!!!!!!!!!!!!!!!!!!!!!!!!!!!!!!!!!!!!!!!!!!!!!!!!!!!!!!!!!!!!!!!!!!!!!!!!!!!!!!!!!!!!!!!!!!!!!!!!!!!!!!!!!!!!!!!!!!!!!!!!!!!!!!!!!!!!!!!!!!!!!!!!!!!!!!!!!!!!!!!!!!!!!!!!!!!!!!!!!!!!!!!!!!!!!!!!!!!!!!!!!!!!!!!!!!!!!!!!!!!!!!!!!!!!!!!!!!!!!!!!!!!!!!!!!!!!!!!!!!!!!!!!!!!!!!!!!!!!!!!!!!!!!!!!!!!!!!!!!!!!!!!!!!!!!!!!!!!!!!!!!!!!!!!!!!!!!!!!!!!!!!!!!!!!!!!!!!!!!!!!!!!!!!!!!!!!!!!!!!!!!!!!!!!!!!!!!!!!!!!!!!!!!!!!!!!!!!!!!!!!!!!!!!!!!!!!!!!!!!!!!!!!!!!!!!!!!!!!!!!!!!!!!!!!!!!!!!!!!!!!!!!!!!!!!!!!!!!!!!!!!!!!!!!!!!!!!!!!!!!!!!!!!!!!!!!!!!!!!!!!!!!!!!!!!!!!!!!!!!!!!!!!!!!!!!!!!!!!!!!!!!!!!!!!!!!!!!!!!!!!!!!!!!!!!!!!!!!!!!!!!!!!!!!!!!!!!!!!!!!!!!!!!!!!!!!!!!!!!!!!!!!!!!!!!!!!!!!!!!!!!!!!!!!!!!!!!!!!!!!!!!!!!!!!!!!!!!!!!!!!!!!!!!!!!!!!!!!!!!!!!!!!!!!!!!!!!!!!!!!!!!!!!!!!!!!!!!!!!!!!!!!!!!!!!!!!!!!!!!!!!!!!!!!!!!!!!!!!!!!!!!!!!!!!!!!!!!!!!!!!!!!!!!!!!!!!!!!!!!!!!!!!!!!!!!!!!!!!!!!!!!!!!!!!!!!!!!!!!!!!!!!!!!!!!!!!!!!!!!!!!!!!!!!!!!!!!!!!!!!!!!!!!!!!!!!!!!!!!!!!!!!!!!!!!!!!!!!!!!!!!!!!!!!!!!!!!!!!!!!!!!!!!!!!!!!!!!!!!!!!!!!!!!!!!!!!!!!!!!!!!!!!!!!!!!!!!!!!!!!!!!!!!!!!!!!!!!!!!!!!!!!!!!!!!!!!!!!!!!!!!!!!!!!!!!!!!!!!!!!!!!!!!!!!!!!!!!!!!!!!!!!!!!!!!!!!!!!!!!!!!!!!!!!!!!!!!!!!!!!!!!!!!!!!!!!!!!!!!!!!!!!!!!!!!!!!!!!!!!!!!!!!!!!!!!!!!!!!!!!!!!!!!!!!!!!!!!!!!!!!!!!!!!!!!!!!!!!!!!!!!!!!!!!!!!!!!!!!!!!!!!!!!!!!!!!!!!!!!!!!!!!!!!!!!!!!!!!!!!!!!!!!!!!!!!!!!!!!!!!!!!!!!!!!!!!!!!!!!!!!!!!!!!!!!!!!!!!!!!!!!!!!!!!!!!!!!!!!!!!!!!!!!!!!!!!!!!!!!!!!!!!!!!!!!!!!!!!!!!!!!!!!!!!!!!!!!!!!!!!!!!!!!!!!!!!!!!!!!!!!!!!!!!!!!!!!!!!!!!!!!!!!!!!!!!!!!!!!!!!!!!!!!!!!!!!!!!!!!!!!!!!!!!!!!!!!!!!!!!!!!!!!!!!!!!!!!!!!!!!!!!!!!!!!!!!!!!!!!!!!!!!!!!!!!!!!!!!!!!!!!!!!!!!!!!!!!!!!!!!!!!!!!!!!!!!!!!!!!!!!!!!!!!!!!!!!!!!!!!!!!!!!!!!!!!!!!!!!!!!!!!!!!!!!!!!!!!!!!!!!!!!!!!!!!!!!!!!!!!!!!!!!!!!!!!!!!!!!!!!!!!!!!!!!!!!!!!!!!!!!!!!!!!!!!!!!!!!!!!!!!!!!!!!!!!!!!!!!!!!!!!!!!!!!!!!!!!!!!!!!!!!!!!!!!!!!!!!!!!!!!!!!!!!!!!!!!!!!!!!!!!!!!!!!!!!!!!!!!!!!!!!!!!!!!!!!!!!!!!!!!!!!!!!!!!!!!!!!!!!!!!!!!!!!!!!!!!!!!!!!!!!!!!!!!!!!!!!!!!!!!!!!!!!!!!!!!!!!!!!!!!!!!!!!!!!!!!!!!!!!!!!!!!!!!!!!!!!!!!!!!!!!!!!!!!!!!!!!!!!!!!!!!!!!!!!!!!!!!!!!!!!!!!!!!!!!!!!!!!!!!!!!!!!!!!!!!!!!!!!!!!!!!!!!!!!!!!!!!!!!!!!!!!!!!!!!!!!!!!!!!!!!!!!!!!!!!!!!!!!!!!!!!!!!!!!!!!!!!!!!!!!!!!!!!!!!!!!!!!!!!!!!!!!!!!!!!!!!!!!!!!!!!!!!!!!!!!!!!!!!!!!!!!!!!!!!!!!!!!!!!!!!!!!!!!!!!!!!!!!!!!!!!!!!!!!!!!!!!!!!!!!!!!!!!!!!!!!!!!!!!!!!!!!!!!!!!!!!!!!!!!!!!!!!!!!!!!!!!!!!!!!!!!!!!!!!!!!!!!!!!!!!!!!!!!!!!!!!!!!!!!!!!!!!!!!!!!!!!!!!!!!!!!!!!!!!!!!!!!!!!!!!!!!!!!!!!!!!!!!!!!!!!!!!!!!!!!!!!!!!!!!!!!!!!!!!!!!!!!!!!!!!!!!!!!!!!!!!!!!!!!!!!!!!!!!!!!!!!!!!!!!!!!!!!!!!!!!!!!!!!!!!!!!!!!!!!!!!!!!!!!!!!!!!!!!!!!!!!!!!!!!!!!!!!!!!!!!!!!!!!!!!!!!!!!!!!!!!!!!!!!!!!!!!!!!!!!!!!!!!!!!!!!!!!!!!!!!!!!!!!!!!!!!!!!!!!!!!!!!!!!!!!!!!!!!!!!!!!!!!!!!!!!!!!!!!!!!!!!!!!!!!!!!!!!!!!!!!!!!!!!!!!!!!!!!!!!!!!!!!!!!!!!!!!!!!!!!!!!!!!!!!!!!!!!!!!!!!!!!!!!!!!!!!!!!!!!!!!!!!!!!!!!!!!!!!!!!!!!!!!!!!!!!!!!!!!!!!!!!!!!!!!!!!!!!!!!!!!!!!!!!!!!!!!!!!!!!!!!!!!!!!!!!!!!!!!!!!!!!!!!!!!!!!!!!!!!!!!!!!!!!!!!!!!!!!!!!!!!!!!!!!!!!!!!!!!!!!!!!!!!!!!!!!!!!!!!!!!!!!!!!!!!!!!!!!!!!!!!!!!!!!!!!!!!!!!!!!!!!!!!!!!!!!!!!!!!!!!!!!!!!!!!!!!!!!!!!!!!!!!!!!!!!!!!!!!!!!!!!!!!!!!!!!!!!!!!!!!!!!!!!!!!!!!!!!!!!!!!!!!!!!!!!!!!!!!!!!!!!!!!!!!!!!!!!!!!!!!!!!!!!!!!!!!!!!!!!!!!!!!!!!!!!!!!!!!!!!!!!!!!!!!!!!!!!!!!!!!!!!!!!!!!!!!!!!!!!!!!!!!!!!!!!!!!!!!!!!!!!!!!!!!!!!!!!!!!!!!!!!!!!!!!!!!!!!!!!!!!!!!!!!!!!!!!!!!!!!!!!!!!!!!!!!!!!!!!!!!!!!!!!!!!!!!!!!!!!!!!!!!!!!!!!!!!!!!!!!!!!!!!!!!!!!!!!!!!!!!!!!!!!!!!!!!!!!!!!!!!!!!!!!!!!!!!!!!!!!!!!!!!!!!!!!!!!!!!!!!!!!!!!!!!!!!!!!!!!!!!!!!!!!!!!!!!!!!!!!!!!!!!!!!!!!!!!!!!!!!!!!!!!!!!!!!!!!!!!!!!!!!!!!!!!!!!!!!!!!!!!!!!!!!!!!!!!!!!!!!!!!!!!!!!!!!!!!!!!!!!!!!!!!!!!!!!!!!!!!!!!!!!!!!!!!!!!!!!!!!!!!!!!!!!!!!!!!!!!!!!!!!!!!!!!!!!!!!!!!!!!!!!!!!!!!!!!!!!!!!!!!!!!!!!!!!!!!!!!!!!!!!!!!!!!!!!!!!!!!!!!!!!!!!!!!!!!!!!!!!!!!!!!!!!!!!!!!!!!!!!!!!!!!!!!!!!!!!!!!!!!!!!!!!!!!!!!!!!!!!!!!!!!!!!!!!!!!!!!!!!!!!!!!!!!!!!!!!!!!!!!!!!!!!!!!!!!!!!!!!!!!!!!!!!!!!!!!!!!!!!!!!!!!!!!!!!!!!!!!!!!!!!!!!!!!!!!!!!!!!!!!!!!!!!!!!!!!!!!!!!!!!!!!!!!!!!!!!!!!!!!!!!!!!!!!!!!!!!!!!!!!!!!!!!!!!!!!!!!!!!!!!!!!!!!!!!!!!!!!!!!!!!!!!!!!!!!!!!!!!!!!!!!!!!!!!!!!!!!!!!!!!!!!!!!!!!!!!!!!!!!!!!!!!!!!!!!!!!!!!!!!!!!!!!!!!!!!!!!!!!!!!!!!!!!!!!!!!!!!!!!!!!!!!!!!!!!!!!!!!!!!!!!!!!!!!!!!!!!!!!!!!!!!!!!!!!!!!!!!!!!!!!!!!!!!!!!!!!!!!!!!!!!!!!!!!!!!!!!!!!!!!!!!!!!!!!!!!!!!!!!!!!!!!!!!!!!!!!!!!!!!!!!!!!!!!!!!!!!!!!!!!!!!!!!!!!!!!!!!!!!!!!!!!!!!!!!!!!!!!!!!!!!!!!!!!!!!!!!!!!!!!!!!!!!!!!!!!!!!!!!!!!!!!!!!!!!!!!!!!!!!!!!!!!!!!!!!!!!!!!!!!!!!!!!!!!!!!!!!!!!!!!!!!!!!!!!!!!!!!!!!!!!!!!!!!!!!!!!!!!!!!!!!!!!!!!!!!!!!!!!!!!!!!!!!!!!!!!!!!!!!!!!!!!!!!!!!!!!!!!!!!!!!!!!!!!!!!!!!!!!!!!!!!!!!!!!!!!!!!!!!!!!!!!!!!!!!!!!!!!!!!!!!!!!!!!!!!!!!!!!!!!!!!!!!!!!!!!!!!!!!!!!!!!!!!!!!!!!!!!!!!!!!!!!!!!!!!!!!!!!!!!!!!!!!!!!!!!!!!!!!!!!!!!!!!!!!!!!!!!!!!!!!!!!!!!!!!!!!!!!!!!!!!!!!!!!!!!!!!!!!!!!!!!!!!!!!!!!!!!!!!!!!!!!!!!!!!!!!!!!!!!!!!!!!!!!!!!!!!!!!!!!!!!!!!!!!!!!!!!!!!!!!!!!!!!!!!!!!!!!!!!!!!!!!!!!!!!!!!!!!!!!!!!!!!!!!!!!!!!!!!!!!!!!!!!!!!!!!!!!!!!!!!!!!!!!!!!!!!!!!!!!!!!!!!!!!!!!!!!!!!!!!!!!!!!!!!!!!!!!!!!!!!!!!!!!!!!!!!!!!!!!!!!!!!!!!!!!!!!!!!!!!!!!!!!!!!!!!!!!!!!!!!!!!!!!!!!!!!!!!!!!!!!!!!!!!!!!!!!!!!!!!!!!!!!!!!!!!!!!!!!!!!!!!!!!!!!!!!!!!!!!!!!!!!!!!!!!!!!!!!!!!!!!!!!!!!!!!!!!!!!!!!!!!!!!!!!!!!!!!!!!!!!!!!!!!!!!!!!!!!!!!!!!!!!!!!!!!!!!!!!!!!!!!!!!!!!!!!!!!!!!!!!!!!!!!!!!!!!!!!!!!!!!!!!!!!!!!!!!!!!!!!!!!!!!!!!!!!!!!!!!!!!!!!!!!!!!!!!!!!!!!!!!!!!!!!!!!!!!!!!!!!!!!!!!!!!!!!!!!!!!!!!!!!!!!!!!!!!!!!!!!!!!!!!!!!!!!!!!!!!!!!!!!!!!!!!!!!!!!!!!!!!!!!!!!!!!!!!!!!!!!!!!!!!!!!!!!!!!!!!!!!!!!!!!!!!!!!!!!!!!!!!!!!!!!!!!!!!!!!!!!!!!!!!!!!!!!!!!!!!!!!!!!!!!!!!!!!!!!!!!!!!!!!!!!!!!!!!!!!!!!!!!!!!!!!!!!!!!!!!!!!!!!!!!!!!!!!!!!!!!!!!!!!!!!!!!!!!!!!!!!!!!!!!!!!!!!!!!!!!!!!!!!!!!!!!!!!!!!!!!!!!!!!!!!!!!!!!!!!!!!!!!!!!!!!!!!!!!!!!!!!!!!!!!!!!!!!!!!!!!!!!!!!!!!!!!!!!!!!!!!!!!!!!!!!!!!!!!!!!!!!!!!!!!!!!!!!!!!!!!!!!!!!!!!!!!!!!!!!!!!!!!!!!!!!!!!!!!!!!!!!!!!!!!!!!!!!!!!!!!!!!!!!!!!!!!!!!!!!!!!!!!!!!!!!!!!!!!!!!!!!!!!!!!!!!!!!!!!!!!!!!!!!!!!!!!!!!!!!!!!!!!!!!!!!!!!!!!!!!!!!!!!!!!!!!!!!!!!!!!!!!!!!!!!!!!!!!!!!!!!!!!!!!!!!!!!!!!!!!!!!!!!!!!!!!!!!!!!!!!!!!!!!!!!!!!!!!!!!!!!!!!!!!!!!!!!!!!!!!!!!!!!!!!!!!!!!!!!!!!!!!!!!!!!!!!!!!!!!!!!!!!!!!!!!!!!!!!!!!!!!!!!!!!!!!!!!!!!!!!!!!!!!!!!!!!!!!!!!!!!!!!!!!!!!!!!!!!!!!!!!!!!!!!!!!!!!!!!!!!!!!!!!!!!!!!!!!!!!!!!!!!!!!!!!!!!!!!!!!!!!!!!!!!!!!!!!!!!!!!!!!!!!!!!!!!!!!!!!!!!!!!!!!!!!!!!!!!!!!!!!!!!!!!!!!!!!!!!!!!!!!!!!!!!!!!!!!!!!!!!!!!!!!!!!!!!!!!!!!!!!!!!!!!!!!!!!!!!!!!!!!!!!!!!!!!!!!!!!!!!!!!!!!!!!!!!!!!!!!!!!!!!!!!!!!!!!!!!!!!!!!!!!!!!!!!!!!!!!!!!!!!!!!!!!!!!!!!!!!!!!!!!!!!!!!!!!!!!!!!!!!!!!!!!!!!!!!!!!!!!!!!!!!!!!!!!!!!!!!!!!!!!!!!!!!!!!!!!!!!!!!!!!!!!!!!!!!!!!!!!!!!!!!!!!!!!!!!!!!!!!!!!!!!!!!!!!!!!!!!!!!!!!!!!!!!!!!!!!!!!!!!!!!!!!!!!!!!!!!!!!!!!!!!!!!!!!!!!!!!!!!!!!!!!!!!!!!!!!!!!!!!!!!!!!!!!!!!!!!!!!!!!!!!!!!!!!!!!!!!!!!!!!!!!!!!!!!!!!!!!!!!!!!!!!!!!!!!!!!!!!!!!!!!!!!!!!!!!!!!!!!!!!!!!!!!!!!!!!!!!!!!!!!!!!!!!!!!!!!!!!!!!!!!!!!!!!!!!!!!!!!!!!!!!!!!!!!!!!!!!!!!!!!!!!!!!!!!!!!!!!!!!!!!!!!!!!!!!!!!!!!!!!!!!!!!!!!!!!!!!!!!!!!!!!!!!!!!!!!!!!!!!!!!!!!!!!!!!!!!!!!!!!!!!!!!!!!!!!!!!!!!!!!!!!!!!!!!!!!!!!!!!!!!!!!!!!!!!!!!!!!!!!!!!!!!!!!!!!!!!!!!!!!!!!!!!!!!!!!!!!!!!!!!!!!!!!!!!!!!!!!!!!!!!!!!!!!!!!!!!!!!!!!!!!!!!!!!!!!!!!!!!!!!!!!!!!!!!!!!!!!!!!!!!!!!!!!!!!!!!!!!!!!!!!!!!!!!!!!!!!!!!!!!!!!!!!!!!!!!!!!!!!!!!!!!!!!!!!!!!!!!!!!!!!!!!!!!!!!!!!!!!!!!!!!!!!!!!!!!!!!!!!!!!!!!!!!!!!!!!!!!!!!!!!!!!!!!!!!!!!!!!!!!!!!!!!!!!!!!!!!!!!!!!!!!!!!!!!!!!!!!!!!!!!!!!!!!!!!!!!!!!!!!!!!!!!!!!!!!!!!!!!!!!!!!!!!!!!!!!!!!!!!!!!!!!!!!!!!!!!!!!!!!!!!!!!!!!!!!!!!!!!!!!!!!!!!!!!!!!!!!!!!!!!!!!!!!!!!!!!!!!!!!!!!!!!!!!!!!!!!!!!!!!!!!!!!!!!!!!!!!!!!!!!!!!!!!!!!!!!!!!!!!!!!!!!!!!!!!!!!!!!!!!!!!!!!!!!!!!!!!!!!!!!!!!!!!!!!!!!!!!!!!!!!!!!!!!!!!!!!!!!!!!!!!!!!!!!!!!!!!!!!!!!!!!!!!!!!!!!!!!!!!!!!!!!!!!!!!!!!!!!!!!!!!!!!!!!!!!!!!!!!!!!!!!!!!!!!!!!!!!!!!!!!!!!!!!!!!!!!!!!!!!!!!!!!!!!!!!!!!!!!!!!!!!!!!!!!!!!!!!!!!!!!!!!!!!!!!!!!!!!!!!!!!!!!!!!!!!!!!!!!!!!!!!!!!!!!!!!!!!!!!!!!!!!!!!!!!!!!!!!!!!!!!!!!!!!!!!!!!!!!!!!!!!!!!!!!!!!!!!!!!!!!!!!!!!!!!!!!!!!!!!!!!!!!!!!!!!!!!!!!!!!!!!!!!!!!!!!!!!!!!!!!!!!!!!!!!!!!!!!!!!!!!!!!!!!!!!!!!!!!!!!!!!!!!!!!!!!!!!!!!!!!!!!!!!!!!!!!!!!!!!!!!!!!!!!!!!!!!!!!!!!!!!!!!!!!!!!!!!!!!!!!!!!!!!!!!!!!!!!!!!!!!!!!!!!!!!!!!!!!!!!!!!!!!!!!!!!!!!!!!!!!!!!!!!!!!!!!!!!!!!!!!!!!!!!!!!!!!!!!!!!!!!!!!!!!!!!!!!!!!!!!!!!!!!!!!!!!!!!!!!!!!!!!!!!!!!!!!!!!!!!!!!!!!!!!!!!!!!!!!!!!!!!!!!!!!!!!!!!!!!!!!!!!!!!!!!!!!!!!!!!!!!!!!!!!!!!!!!!!!!!!!!!!!!!!!!!!!!!!!!!!!!!!!!!!!!!!!!!!!!!!!!!!!!!!!!!!!!!!!!!!!!!!!!!!!!!!!!!!!!!!!!!!!!!!!!!!!!!!!!!!!!!!!!!!!!!!!!!!!!!!!!!!!!!!!!!!!!!!!!!!!!!!!!!!!!!!!!!!!!!!!!!!!!!!!!!!!!!!!!!!!!!!!!!!!!!!!!!!!!!!!!!!!!!!!!!!!!!!!!!!!!!!!!!!!!!!!!!!!!!!!!!!!!!!!!!!!!!!!!!!!!!!!!!!!!!!!!!!!!!!!!!!!!!!!!!!!!!!!!!!!!!!!!!!!!!!!!!!!!!!!!!!!!!!!!!!!!!!!!!!!!!!!!!!!!!!!!!!!!!!!!!!!!!!!!!!!!!!!!!!!!!!!!!!!!!!!!!!!!!!!!!!!!!!!!!!!!!!!!!!!!!!!!!!!!!!!!!!!!!!!!!!!!!!!!!!!!!!!!!!!!!!!!!!!!!!!!!!!!!!!!!!!!!!!!!!!!!!!!!!!!!!!!!!!!!!!!!!!!!!!!!!!!!!!!!!!!!!!!!!!!!!!!!!!!!!!!!!!!!!!!!!!!!!!!!!!!!!!!!!!!!!!!!!!!!!!!!!!!!!!!!!!!!!!!!!!!!!!!!!!!!!!!!!!!!!!!!!!!!!!!!!!!!!!!!!!!!!!!!!!!!!!!!!!!!!!!!!!!!!!!!!!!!!!!!!!!!!!!!!!!!!!!!!!!!!!!!!!!!!!!!!!!!!!!!!!!!!!!!!!!!!!!!!!!!!!!!!!!!!!!!!!!!!!!!!!!!!!!!!!!!!!!!!!!!!!!!!!!!!!!!!!!!!!!!!!!!!!!!!!!!!!!!!!!!!!!!!!!!!!!!!!!!!!!!!!!!!!!!!!!!!!!!!!!!!!!!!!!!!!!!!!!!!!!!!!!!!!!!!!!!!!!!!!!!!!!!!!!!!!!!!!!!!!!!!!!!!!!!!!!!!!!!!!!!!!!!!!!!!!!!!!!!!!!!!!!!!!!!!!!!!!!!!!!!!!!!!!!!!!!!!!!!!!!!!!!!!!!!!!!!!!!!!!!!!!!!!!!!!!!!!!!!!!!!!!!!!!!!!!!!!!!!!!!!!!!!!!!!!!!!!!!!!!!!!!!!!!!!!!!!!!!!!!!!!!!!!!!!!!!!!!!!!!!!!!!!!!!!!!!!!!!!!!!!!!!!!!!!!!!!!!!!!!!!!!!!!!!!!!!!!!!!!!!!!!!!!!!!!!!!!!!!!!!!!!!!!!!!!!!!!!!!!!!!!!!!!!!!!!!!!!!!!!!!!!!!!!!!!!!!!!!!!!!!!!!!!!!!!!!!!!!!!!!!!!!!!!!!!!!!!!!!!!!!!!!!!!!!!!!!!!!!!!!!!!!!!!!!!!!!!!!!!!!!!!!!!!!!!!!!!!!!!!!!!!!!!!!!!!!!!!!!!!!!!!!!!!!!!!!!!!!!!!!!!!!!!!!!!!!!!!!!!!!!!!!!!!!!!!!!!!!!!!!!!!!!!!!!!!!!!!!!!!!!!!!!!!!!!!!!!!!!!!!!!!!!!!!!!!!!!!!!!!!!!!!!!!!!!!!!!!!!!!!!!!!!!!!!!!!!!!!!!!!!!!!!!!!!!!!!!!!!!!!!!!!!!!!!!!!!!!!!!!!!!!!!!!!!!!!!!!!!!!!!!!!!!!!!!!!!!!!!!!!!!!!!!!!!!!!!!!!!!!!!!!!!!!!!!!!!!!!!!!!!!!!!!!!!!!!!!!!!!!!!!!!!!!!!!!!!!!!!!!!!!!!!!!!!!!!!!!!!!!!!!!!!!!!!!!!!!!!!!!!!!!!!!!!!!!!!!!!!!!!!!!!!!!!!!!!!!!!!!!!!!!!!!!!!!!!!!!!!!!!!!!!!!!!!!!!!!!!!!!!!!!!!!!!!!!!!!!!!!!!!!!!!!!!!!!!!!!!!!!!!!!!!!!!!!!!!!!!!!!!!!!!!!!!!!!!!!!!!!!!!!!!!!!!!!!!!!!!!!!!!!!!!!!!!!!!!!!!!!!!!!!!!!!!!!!!!!!!!!!!!!!!!!!!!!!!!!!!!!!!!!!!!!!!!!!!!!!!!!!!!!!!!!!!!!!!!!!!!!!!!!!!!!!!!!!!!!!!!!!!!!!!!!!!!!!!!!!!!!!!!!!!!!!!!!!!!!!!!!!!!!!!!!!!!!!!!!!!!!!!!!!!!!!!!!!!!!!!!!!!!!!!!!!!!!!!!!!!!!!!!!!!!!!!!!!!!!!!!!!!!!!!!!!!!!!!!!!!!!!!!!!!!!!!!!!!!!!!!!!!!!!!!!!!!!!!!!!!!!!!!!!!!!!!!!!!!!!!!!!!!!!!!!!!!!!!!!!!!!!!!!!!!!!!!!!!!!!!!!!!!!!!!!!!!!!!!!!!!!!!!!!!!!!!!!!!!!!!!!!!!!!!!!!!!!!!!!!!!!!!!!!!!!!!!!!!!!!!!!!!!!!!!!!!!!!!!!!!!!!!!!!!!!!!!!!!!!!!!!!!!!!!!!!!!!!!!!!!!!!!!!!!!!!!!!!!!!!!!!!!!!!!!!!!!!!!!!!!!!!!!!!!!!!!!!!!!!!!!!!!!!!!!!!!!!!!!!!!!!!!!!!!!!!!!!!!!!!!!!!!!!!!!!!!!!!!!!!!!!!!!!!!!!!!!!!!!!!!!!!!!!!!!!!!!!!!!!!!!!!!!!!!!!!!!!!!!!!!!!!!!!!!!!!!!!!!!!!!!!!!!!!!!!!!!!!!!!!!!!!!!!!!!!!!!!!!!!!!!!!!!!!!!!!!!!!!!!!!!!!!!!!!!!!!!!!!!!!!!!!!!!!!!!!!!!!!!!!!!!!!!!!!!!!!!!!!!!!!!!!!!!!!!!!!!!!!!!!!!!!!!!!!!!!!!!!!!!!!!!!!!!!!!!!!!!!!!!!!!!!!!!!!!!!!!!!!!!!!!!!!!!!!!!!!!!!!!!!!!!!!!!!!!!!!!!!!!!!!!!!!!!!!!!!!!!!!!!!!!!!!!!!!!!!!!!!!!!!!!!!!!!!!!!!!!!!!!!!!!!!!!!!!!!!!!!!!!!!!!!!!!!!!!!!!!!!!!!!!!!!!!!!!!!!!!!!!!!!!!!!!!!!!!!!!!!!!!!!!!!!!!!!!!!!!!!!!!!!!!!!!!!!!!!!!!!!!!!!!!!!!!!!!!!!!!!!!!!!!!!!!!!!!!!!!!!!!!!!!!!!!!!!!!!!!!!!!!!!!!!!!!!!!!!!!!!!!!!!!!!!!!!!!!!!!!!!!!!!!!!!!!!!!!!!!!!!!!!!!!!!!!!!!!!!!!!!!!!!!!!!!!!!!!!!!!!!!!!!!!!!!!!!!!!!!!!!!!!!!!!!!!!!!!!!!!!!!!!!!!!!!!!!!!!!!!!!!!!!!!!!!!!!!!!!!!!!!!!!!!!!!!!!!!!!!!!!!!!!!!!!!!!!!!!!!!!!!!!!!!!!!!!!!!!!!!!!!!!!!!!!!!!!!!!!!!!!!!!!!!!!!!!!!!!!!!!!!!!!!!!!!!!!!!!!!!!!!!!!!!!!!!!!!!!!!!!!!!!!!!!!!!!!!!!!!!!!!!!!!!!!!!!!!!!!!!!!!!!!!!!!!!!!!!!!!!!!!!!!!!!!!!!!!!!!!!!!!!!!!!!!!!!!!!!!!!!!!!!!!!!!!!!!!!!!!!!!!!!!!!!!!!!!!!!!!!!!!!!!!!!!!!!!!!!!!!!!!!!!!!!!!!!!!!!!!!!!!!!!!!!!!!!!!!!!!!!!!!!!!!!!!!!!!!!!!!!!!!!!!!!!!!!!!!!!!!!!!!!!!!!!!!!!!!!!!!!!!!!!!!!!!!!!!!!!!!!!!!!!!!!!!!!!!!!!!!!!!!!!!!!!!!!!!!!!!!!!!!!!!!!!!!!!!!!!!!!!!!!!!!!!!!!!!!!!!!!!!!!!!!!!!!!!!!!!!!!!!!!!!!!!!!!!!!!!!!!!!!!!!!!!!!!!!!!!!!!!!!!!!!!!!!!!!!!!!!!!!!!!!!!!!!!!!!!!!!!!!!!!!!!!!!!!!!!!!!!!!!!!!!!!!!!!!!!!!!!!!!!!!!!!!!!!!!!!!!!!!!!!!!!!!!!!!!!!!!!!!!!!!!!!!!!!!!!!!!!!!!!!!!!!!!!!!!!!!!!!!!!!!!!!!!!!!!!!!!!!!!!!!!!!!!!!!!!!!!!!!!!!!!!!!!!!!!!!!!!!!!!!!!!!!!!!!!!!!!!!!!!!!!!!!!!!!!!!!!!!!!!!!!!!!!!!!!!!!!!!!!!!!!!!!!!!!!!!!!!!!!!!!!!!!!!!!!!!!!!!!!!!!!!!!!!!!!!!!!!!!!!!!!!!!!!!!!!!!!!!!!!!!!!!!!!!!!!!!!!!!!!!!!!!!!!!!!!!!!!!!!!!!!!!!!!!!!!!!!!!!!!!!!!!!!!!!!!!!!!!!!!!!!!!!!!!!!!!!!!!!!!!!!!!!!!!!!!!!!!!!!!!!!!!!!!!!!!!!!!!!!!!!!!!!!!!!!!!!!!!!!!!!!!!!!!!!!!!!!!!!!!!!!!!!!!!!!!!!!!!!!!!!!!!!!!!!!!!!!!!!!!!!!!!!!!!!!!!!!!!!!!!!!!!!!!!!!!!!!!!!!!!!!!!!!!!!!!!!!!!!!!!!!!!!!!!!!!!!!!!!!!!!!!!!!!!!!!!!!!!!!!!!!!!!!!!!!!!!!!!!!!!!!!!!!!!!!!!!!!!!!!!!!!!!!!!!!!!!!!!!!!!!!!!!!!!!!!!!!!!!!!!!!!!!!!!!!!!!!!!!!!!!!!!!!!!!!!!!!!!!!!!!!!!!!!!!!!!!!!!!!!!!!!!!!!!!!!!!!!!!!!!!!!!!!!!!!!!!!!!!!!!!!!!!!!!!!!!!!!!!!!!!!!!!!!!!!!!!!!!!!!!!!!!!!!!!!!!!!!!!!!!!!!!!!!!!!!!!!!!!!!!!!!!!!!!!!!!!!!!!!!!!!!!!!!!!!!!!!!!!!!!!!!!!!!!!!!!!!!!!!!!!!!!!!!!!!!!!!!!!!!!!!!!!!!!!!!!!!!!!!!!!!!!!!!!!!!!!!!!!!!!!!!!!!!!!!!!!!!!!!!!!!!!!!!!!!!!!!!!!!!!!!!!!!!!!!!!!!!!!!!!!!!!!!!!!!!!!!!!!!!!!!!!!!!!!!!!!!!!!!!!!!!!!!!!!!!!!!!!!!!!!!!!!!!!!!!!!!!!!!!!!!!!!!!!!!!!!!!!!!!!!!!!!!!!!!!!!!!!!!!!!!!!!!!!!!!!!!!!!!!!!!!!!!!!!!!!!!!!!!!!!!!!!!!!!!!!!!!!!!!!!!!!!!!!!!!!!!!!!!!!!!!!!!!!!!!!!!!!!!!!!!!!!!!!!!!!!!!!!!!!!!!!!!!!!!!!!!!!!!!!!!!!!!!!!!!!!!!!!!!!!!!!!!!!!!!!!!!!!!!!!!!!!!!!!!!!!!!!!!!!!!!!!!!!!!!!!!!!!!!!!!!!!!!!!!!!!!!!!!!!!!!!!!!!!!!!!!!!!!!!!!!!!!!!!!!!!!!!!!!!!!!!!!!!!!!!!!!!!!!!!!!!!!!!!!!!!!!!!!!!!!!!!!!!!!!!!!!!!!!!!!!!!!!!!!!!!!!!!!!!!!!!!!!!!!!!!!!!!!!!!!!!!!!!!!!!!!!!!!!!!!!!!!!!!!!!!!!!!!!!!!!!!!!!!!!!!!!!!!!!!!!!!!!!!!!!!!!!!!!!!!!!!!!!!!!!!!!!!!!!!!!!!!!!!!!!!!!!!!!!!!!!!!!!!!!!!!!!!!!!!!!!!!!!!!!!!!!!!!!!!!!!!!!!!!!!!!!!!!!!!!!!!!!!!!!!!!!!!!!!!!!!!!!!!!!!!!!!!!!!!!!!!!!!!!!!!!!!!!!!!!!!!!!!!!!!!!!!!!!!!!!!!!!!!!!!!!!!!!!!!!!!!!!!!!!!!!!!!!!!!!!!!!!!!!!!!!!!!!!!!!!!!!!!!!!!!!!!!!!!!!!!!!!!!!!!!!!!!!!!!!!!!!!!!!!!!!!!!!!!!!!!!!!!!!!!!!!!!!!!!!!!!!!!!!!!!!!!!!!!!!!!!!!!!!!!!!!!!!!!!!!!!!!!!!!!!!!!!!!!!!!!!!!!!!!!!!!!!!!!!!!!!!!!!!!!!!!!!!!!!!!!!!!!!!!!!!!!!!!!!!!!!!!!!!!!!!!!!!!!!!!!!!!!!!!!!!!!!!!!!!!!!!!!!!!!!!!!!!!!!!!!!!!!!!!!!!!!!!!!!!!!!!!!!!!!!!!!!!!!!!!!!!!!!!!!!!!!!!!!!!!!!!!!!!!!!!!!!!!!!!!!!!!!!!!!!!!!!!!!!!!!!!!!!!!!!!!!!!!!!!!!!!!!!!!!!!!!!!!!!!!!!!!!!!!!!!!!!!!!!!!!!!!!!!!!!!!!!!!!!!!!!!!!!!!!!!!!!!!!!!!!!!!!!!!!!!!!!!!!!!!!!!!!!!!!!!!!!!!!!!!!!!!!!!!!!!!!!!!!!!!!!!!!!!!!!!!!!!!!!!!!!!!!!!!!!!!!!!!!!!!!!!!!!!!!!!!!!!!!!!!!!!!!!!!!!!!!!!!!!!!!!!!!!!!!!!!!!!!!!!!!!!!!!!!!!!!!!!!!!!!!!!!!!!!!!!!!!!!!!!!!!!!!!!!!!!!!!!!!!!!!!!!!!!!!!!!!!!!!!!!!!!!!!!!!!!!!!!!!!!!!!!!!!!!!!!!!!!!!!!!!!!!!!!!!!!!!!!!!!!!!!!!!!!!!!!!!!!!!!!!!!!!!!!!!!!!!!!!!!!!!!!!!!!!!!!!!!!!!!!!!!!!!!!!!!!!!!!!!!!!!!!!!!!!!!!!!!!!!!!!!!!!!!!!!!!!!!!!!!!!!!!!!!!!!!!!!!!!!!!!!!!!!!!!!!!!!!!!!!!!!!!!!!!!!!!!!!!!!!!!!!!!!!!!!!!!!!!!!!!!!!!!!!!!!!!!!!!!!!!!!!!!!!!!!!!!!!!!!!!!!!!!!!!!!!!!!!!!!!!!!!!!!!!!!!!!!!!!!!!!!!!!!!!!!!!!!!!!!!!!!!!!!!!!!!!!!!!!!!!!!!!!!!!!!!!!!!!!!!!!!!!!!!!!!!!!!!!!!!!!!!!!!!!!!!!!!!!!!!!!!!!!!!!!!!!!!!!!!!!!!!!!!!!!!!!!!!!!!!!!!!!!!!!!!!!!!!!!!!!!!!!!!!!!!!!!!!!!!!!!!!!!!!!!!!!!!!!!!!!!!!!!!!!!!!!!!!!!!!!!!!!!!!!!!!!!!!!!!!!!!!!!!!!!!!!!!!!!!!!!!!!!!!!!!!!!!!!!!!!!!!!!!!!!!!!!!!!!!!!!!!!!!!!!!!!!!!!!!!!!!!!!!!!!!!!!!!!!!!!!!!!!!!!!!!!!!!!!!!!!!!!!!!!!!!!!!!!!!!!!!!!!!!!!!!!!!!!!!!!!!!!!!!!!!!!!!!!!!!!!!!!!!!!!!!!!!!!!!!!!!!!!!!!!!!!!!!!!!!!!!!!!!!!!!!!!!!!!!!!!!!!!!!!!!!!!!!!!!!!!!!!!!!!!!!!!!!!!!!!!!!!!!!!!!!!!!!!!!!!!!!!!!!!!!!!!!!!!!!!!!!!!!!!!!!!!!!!!!!!!!!!!!!!!!!!!!!!!!!!!!!!!!!!!!!!!!!!!!!!!!!!!!!!!!!!!!!!!!!!!!!!!!!!!!!!!!!!!!!!!!!!!!!!!!!!!!!!!!!!!!!!!!!!!!!!!!!!!!!!!!!!!!!!!!!!!!!!!!!!!!!!!!!!!!!!!!!!!!!!!!!!!!!!!!!!!!!!!!!!!!!!!!!!!!!!!!!!!!!!!!!!!!!!!!!!!!!!!!!!!!!!!!!!!!!!!!!!!!!!!!!!!!!!!!!!!!!!!!!!!!!!!!!!!!!!!!!!!!!!!!!!!!!!!!!!!!!!!!!!!!!!!!!!!!!!!!!!!!!!!!!!!!!!!!!!!!!!!!!!!!!!!!!!!!!!!!!!!!!!!!!!!!!!!!!!!!!!!!!!!!!!!!!!!!!!!!!!!!!!!!!!!!!!!!!!!!!!!!!!!!!!!!!!!!!!!!!!!!!!!!!!!!!!!!!!!!!!!!!!!!!!!!!!!!!!!!!!!!!!!!!!!!!!!!!!!!!!!!!!!!!!!!!!!!!!!!!!!!!!!!!!!!!!!!!!!!!!!!!!!!!!!!!!!!!!!!!!!!!!!!!!!!!!!!!!!!!!!!!!!!!!!!!!!!!!!!!!!!!!!!!!!!!!!!!!!!!!!!!!!!!!!!!!!!!!!!!!!!!!!!!!!!!!!!!!!!!!!!!!!!!!!!!!!!!!!!!!!!!!!!!!!!!!!!!!!!!!!!!!!!!!!!!!!!!!!!!!!!!!!!!!!!!!!!!!!!!!!!!!!!!!!!!!!!!!!!!!!!!!!!!!!!!!!!!!!!!!!!!!!!!!!!!!!!!!!!!!!!!!!!!!!!!!!!!!!!!!!!!!!!!!!!!!!!!!!!!!!!!!!!!!!!!!!!!!!!!!!!!!!!!!!!!!!!!!!!!!!!!!!!!!!!!!!!!!!!!!!!!!!!!!!!!!!!!!!!!!!!!!!!!!!!!!!!!!!!!!!!!!!!!!!!!!!!!!!!!!!!!!!!!!!!!!!!!!!!!!!!!!!!!!!!!!!!!!!!!!!!!!!!!!!!!!!!!!!!!!!!!!!!!!!!!!!!!!!!!!!!!!!!!!!!!!!!!!!!!!!!!!!!!!!!!!!!!!!!!!!!!!!!!!!!!!!!!!!!!!!!!!!!!!!!!!!!!!!!!!!!!!!!!!!!!!!!!!!!!!!!!!!!!!!!!!!!!!!!!!!!!!!!!!!!!!!!!!!!!!!!!!!!!!!!!!!!!!!!!!!!!!!!!!!!!!!!!!!!!!!!!!!!!!!!!!!!!!!!!!!!!!!!!!!!!!!!!!!!!!!!!!!!!!!!!!!!!!!!!!!!!!!!!!!!!!!!!!!!!!!!!!!!!!!!!!!!!!!!!!!!!!!!!!!!!!!!!!!!!!!!!!!!!!!!!!!!!!!!!!!!!!!!!!!!!!!!!!!!!!!!!!!!!!!!!!!!!!!!!!!!!!!!!!!!!!!!!!!!!!!!!!!!!!!!!!!!!!!!!!!!!!!!!!!!!!!!!!!!!!!!!!!!!!!!!!!!!!!!!!!!!!!!!!!!!!!!!!!!!!!!!!!!!!!!!!!!!!!!!!!!!!!!!!!!!!!!!!!!!!!!!!!!!!!!!!!!!!!!!!!!!!!!!!!!!!!!!!!!!!!!!!!!!!!!!!!!!!!!!!!!!!!!!!!!!!!!!!!!!!!!!!!!!!!!!!!!!!!!!!!!!!!!!!!!!!!!!!!!!!!!!!!!!!!!!!!!!!!!!!!!!!!!!!!!!!!!!!!!!!!!!!!!!!!!!!!!!!!!!!!!!!!!!!!!!!!!!!!!!!!!!!!!!!!!!!!!!!!!!!!!!!!!!!!!!!!!!!!!!!!!!!!!!!!!!!!!!!!!!!!!!!!!!!!!!!!!!!!!!!!!!!!!!!!!!!!!!!!!!!!!!!!!!!!!!!!!!!!!!!!!!!!!!!!!!!!!!!!!!!!!!!!!!!!!!!!!!!!!!!!!!!!!!!!!!!!!!!!!!!!!!!!!!!!!!!!!!!!!!!!!!!!!!!!!!!!!!!!!!!!!!!!!!!!!!!!!!!!!!!!!!!!!!!!!!!!!!!!!!!!!!!!!!!!!!!!!!!!!!!!!!!!!!!!!!!!!!!!!!!!!!!!!!!!!!!!!!!!!!!!!!!!!!!!!!!!!!!!!!!!!!!!!!!!!!!!!!!!!!!!!!!!!!!!!!!!!!!!!!!!!!!!!!!!!!!!!!!!!!!!!!!!!!!!!!!!!!!!!!!!!!!!!!!!!!!!!!!!!!!!!!!!!!!!!!!!!!!!!!!!!!!!!!!!!!!!!!!!!!!!!!!!!!!!!!!!!!!!!!!!!!!!!!!!!!!!!!!!!!!!!!!!!!!!!!!!!!!!!!!!!!!!!!!!!!!!!!!!!!!!!!!!!!!!!!!!!!!!!!!!!!!!!!!!!!!!!!!!!!!!!!!!!!!!!!!!!!!!!!!!!!!!!!!!!!!!!!!!!!!!!!!!!!!!!!!!!!!!!!!!!!!!!!!!!!!!!!!!!!!!!!!!!!!!!!!!!!!!!!!!!!!!!!!!!!!!!!!!!!!!!!!!!!!!!!!!!!!!!!!!!!!!!!!!!!!!!!!!!!!!!!!!!!!!!!!!!!!!!!!!!!!!!!!!!!!!!!!!!!!!!!!!!!!!!!!!!!!!!!!!!!!!!!!!!!!!!!!!!!!!!!!!!!!!!!!!!!!!!!!!!!!!!!!!!!!!!!!!!!!!!!!!!!!!!!!!!!!!!!!!!!!!!!!!!!!!!!!!!!!!!!!!!!!!!!!!!!!!!!!!!!!!!!!!!!!!!!!!!!!!!!!!!!!!!!!!!!!!!!!!!!!!!!!!!!!!!!!!!!!!!!!!!!!!!!!!!!!!!!!!!!!!!!!!!!!!!!!!!!!!!!!!!!!!!!!!!!!!!!!!!!!!!!!!!!!!!!!!!!!!!!!!!!!!!!!!!!!!!!!!!!!!!!!!!!!!!!!!!!!!!!!!!!!!!!!!!!!!!!!!!!!!!!!!!!!!!!!!!!!!!!!!!!!!!!!!!!!!!!!!!!!!!!!!!!!!!!!!!!!!!!!!!!!!!!!!!!!!!!!!!!!!!!!!!!!!!!!!!!!!!!!!!!!!!!!!!!!!!!!!!!!!!!!!!!!!!!!!!!!!!!!!!!!!!!!!!!!!!!!!!!!!!!!!!!!!!!!!!!!!!!!!!!!!!!!!!!!!!!!!!!!!!!!!!!!!!!!!!!!!!!!!!!!!!!!!!!!!!!!!!!!!!!!!!!!!!!!!!!!!!!!!!!!!!!!!!!!!!!!!!!!!!!!!!!!!!!!!!!!!!!!!!!!!!!!!!!!!!!!!!!!!!!!!!!!!!!!!!!!!!!!!!!!!!!!!!!!!!!!!!!!!!!!!!!!!!!!!!!!!!!!!!!!!!!!!!!!!!!!!!!!!!!!!!!!!!!!!!!!!!!!!!!!!!!!!!!!!!!!!!!!!!!!!!!!!!!!!!!!!!!!!!!!!!!!!!!!!!!!!!!!!!!!!!!!!!!!!!!!!!!!!!!!!!!!!!!!!!!!!!!!!!!!!!!!!!!!!!!!!!!!!!!!!!!!!!!!!!!!!!!!!!!!!!!!!!!!!!!!!!!!!!!!!!!!!!!!!!!!!!!!!!!!!!!!!!!!!!!!!!!!!!!!!!!!!!!!!!!!!!!!!!!!!!!!!!!!!!!!!!!!!!!!!!!!!!!!!!!!!!!!!!!!!!!!!!!!!!!!!!!!!!!!!!!!!!!!!!!!!!!!!!!!!!!!!!!!!!!!!!!!!!!!!!!!!!!!!!!!!!!!!!!!!!!!!!!!!!!!!!!!!!!!!!!!!!!!!!!!!!!!!!!!!!!!!!!!!!!!!!!!!!!!!!!!!!!!!!!!!!!!!!!!!!!!!!!!!!!!!!!!!!!!!!!!!!!!!!!!!!!!!!!!!!!!!!!!!!!!!!!!!!!!!!!!!!!!!!!!!!!!!!!!!!!!!!!!!!!!!!!!!!!!!!!!!!!!!!!!!!!!!!!!!!!!!!!!!!!!!!!!!!!!!!!!!!!!!!!!!!!!!!!!!!!!!!!!!!!!!!!!!!!!!!!!!!!!!!!!!!!!!!!!!!!!!!!!!!!!!!!!!!!!!!!!!!!!!!!!!!!!!!!!!!!!!!!!!!!!!!!!!!!!!!!!!!!!!!!!!!!!!!!!!!!!!!!!!!!!!!!!!!!!!!!!!!!!!!!!!!!!!!!!!!!!!!!!!!!!!!!!!!!!!!!!!!!!!!!!!!!!!!!!!!!!!!!!!!!!!!!!!!!!!!!!!!!!!!!!!!!!!!!!!!!!!!!!!!!!!!!!!!!!!!!!!!!!!!!!!!!!!!!!!!!!!!!!!!!!!!!!!!!!!!!!!!!!!!!!!!!!!!!!!!!!!!!!!!!!!!!!!!!!!!!!!!!!!!!!!!!!!!!!!!!!!!!!!!!!!!!!!!!!!!!!!!!!!!!!!!!!!!!!!!!!!!!!!!!!!!!!!!!!!!!!!!!!!!!!!!!!!!!!!!!!!!!!!!!!!!!!!!!!!!!!!!!!!!!!!!!!!!!!!!!!!!!!!!!!!!!!!!!!!!!!!!!!!!!!!!!!!!!!!!!!!!!!!!!!!!!!!!!!!!!!!!!!!!!!!!!!!!!!!!!!!!!!!!!!!!!!!!!!!!!!!!!!!!!!!!!!!!!!!!!!!!!!!!!!!!!!!!!!!!!!!!!!!!!!!!!!!!!!!!!!!!!!!!!!!!!!!!!!!!!!!!!!!!!!!!!!!!!!!!!!!!!!!!!!!!!!!!!!!!!!!!!!!!!!!!!!!!!!!!!!!!!!!!!!!!!!!!!!!!!!!!!!!!!!!!!!!!!!!!!!!!!!!!!!!!!!!!!!!!!!!!!!!!!!!!!!!!!!!!!!!!!!!!!!!!!!!!!!!!!!!!!!!!!!!!!!!!!!!!!!!!!!!!!!!!!!!!!!!!!!!!!!!!!!!!!!!!!!!!!!!!!!!!!!!!!!!!!!!!!!!!!!!!!!!!!!!!!!!!!!!!!!!!!!!!!!!!!!!!!!!!!!!!!!!!!!!!!!!!!!!!!!!!!!!!!!!!!!!!!!!!!!!!!!!!!!!!!!!!!!!!!!!!!!!!!!!!!!!!!!!!!!!!!!!!!!!!!!!!!!!!!!!!!!!!!!!!!!!!!!!!!!!!!!!!!!!!!!!!!!!!!!!!!!!!!!!!!!!!!!!!!!!!!!!!!!!!!!!!!!!!!!!!!!!!!!!!!!!!!!!!!!!!!!!!!!!!!!!!!!!!!!!!!!!!!!!!!!!!!!!!!!!!!!!!!!!!!!!!!!!!!!!!!!!!!!!!!!!!!!!!!!!!!!!!!!!!!!!!!!!!!!!!!!!!!!!!!!!!!!!!!!!!!!!!!!!!!!!!!!!!!!!!!!!!!!!!!!!!!!!!!!!!!!!!!!!!!!!!!!!!!!!!!!!!!!!!!!!!!!!!!!!!!!!!!!!!!!!!!!!!!!!!!!!!!!!!!!!!!!!!!!!!!!!!!!!!!!!!!!!!!!!!!!!!!!!!!!!!!!!!!!!!!!!!!!!!!!!!!!!!!!!!!!!!!!!!!!!!!!!!!!!!!!!!!!!!!!!!!!!!!!!!!!!!!!!!!!!!!!!!!!!!!!!!!!!!!!!!!!!!!!!!!!!!!!!!!!!!!!!!!!!!!!!!!!!!!!!!!!!!!!!!!!!!!!!!!!!!!!!!!!!!!!!!!!!!!!!!!!!!!!!!!!!!!!!!!!!!!!!!!!!!!!!!!!!!!!!!!!!!!!!!!!!!!!!!!!!!!!!!!!!!!!!!!!!!!!!!!!!!!!!!!!!!!!!!!!!!!!!!!!!!!!!!!!!!!!!!!!!!!!!!!!!!!!!!!!!!!!!!!!!!!!!!!!!!!!!!!!!!!!!!!!!!!!!!!!!!!!!!!!!!!!!!!!!!!!!!!!!!!!!!!!!!!!!!!!!!!!!!!!!!!!!!!!!!!!!!!!!!!!!!!!!!!!!!!!!!!!!!!!!!!!!!!!!!!!!!!!!!!!!!!!!!!!!!!!!!!!!!!!!!!!!!!!!!!!!!!!!!!!!!!!!!!!!!!!!!!!!!!!!!!!!!!!!!!!!!!!!!!!!!!!!!!!!!!!!!!!!!!!!!!!!!!!!!!!!!!!!!!!!!!!!!!!!!!!!!!!!!!!!!!!!!!!!!!!!!!!!!!!!!!!!!!!!!!!!!!!!!!!!!!!!!!!!!!!!!!!!!!!!!!!!!!!!!!!!!!!!!!!!!!!!!!!!!!!!!!!!!!!!!!!!!!!!!!!!!!!!!!!!!!!!!!!!!!!!!!!!!!!!!!!!!!!!!!!!!!!!!!!!!!!!!!!!!!!!!!!!!!!!!!!!!!!!!!!!!!!!!!!!!!!!!!!!!!!!!!!!!!!!!!!!!!!!!!!!!!!!!!!!!!!!!!!!!!!!!!!!!!!!!!!!!!!!!!!!!!!!!!!!!!!!!!!!!!!!!!!!!!!!!!!!!!!!!!!!!!!!!!!!!!!!!!!!!!!!!!!!!!!!!!!!!!!!!!!!!!!!!!!!!!!!!!!!!!!!!!!!!!!!!!!!!!!!!!!!!!!!!!!!!!!!!!!!!!!!!!!!!!!!!!!!!!!!!!!!!!!!!!!!!!!!!!!!!!!!!!!!!!!!!!!!!!!!!!!!!!!!!!!!!!!!!!!!!!!!!!!!!!!!!!!!!!!!!!!!!!!!!!!!!!!!!!!!!!!!!!!!!!!!!!!!!!!!!!!!!!!!!!!!!!!!!!!!!!!!!!!!!!!!!!!!!!!!!!!!!!!!!!!!!!!!!!!!!!!!!!!!!!!!!!!!!!!!!!!!!!!!!!!!!!!!!!!!!!!!!!!!!!!!!!!!!!!!!!!!!!!!!!!!!!!!!!!!!!!!!!!!!!!!!!!!!!!!!!!!!!!!!!!!!!!!!!!!!!!!!!!!!!!!!!!!!!!!!!!!!!!!!!!!!!!!!!!!!!!!!!!!!!!!!!!!!!!!!!!!!!!!!!!!!!!!!!!!!!!!!!!!!!!!!!!!!!!!!!!!!!!!!!!!!!!!!!!!!!!!!!!!!!!!!!!!!!!!!!!!!!!!!!!!!!!!!!!!!!!!!!!!!!!!!!!!!!!!!!!!!!!!!!!!!!!!!!!!!!!!!!!!!!!!!!!!!!!!!!!!!!!!!!!!!!!!!!!!!!!!!!!!!!!!!!!!!!!!!!!!!!!!!!!!!!!!!!!!!!!!!!!!!!!!!!!!!!!!!!!!!!!!!!!!!!!!!!!!!!!!!!!!!!!!!!!!!!!!!!!!!!!!!!!!!!!!!!!!!!!!!!!!!!!!!!!!!!!!!!!!!!!!!!!!!!!!!!!!!!!!!!!!!!!!!!!!!!!!!!!!!!!!!!!!!!!!!!!!!!!!!!!!!!!!!!!!!!!!!!!!!!!!!!!!!!!!!!!!!!!!!!!!!!!!!!!!!!!!!!!!!!!!!!!!!!!!!!!!!!!!!!!!!!!!!!!!!!!!!!!!!!!!!!!!!!!!!!!!!!!!!!!!!!!!!!!!!!!!!!!!!!!!!!!!!!!!!!!!!!!!!!!!!!!!!!!!!!!!!!!!!!!!!!!!!!!!!!!!!!!!!!!!!!!!!!!!!!!!!!!!!!!!!!!!!!!!!!!!!!!!!!!!!!!!!!!!!!!!!!!!!!!!!!!!!!!!!!!!!!!!!!!!!!!!!!!!!!!!!!!!!!!!!!!!!!!!!!!!!!!!!!!!!!!!!!!!!!!!!!!!!!!!!!!!!!!!!!!!!!!!!!!!!!!!!!!!!!!!!!!!!!!!!!!!!!!!!!!!!!!!!!!!!!!!!!!!!!!!!!!!!!!!!!!!!!!!!!!!!!!!!!!!!!!!!!!!!!!!!!!!!!!!!!!!!!!!!!!!!!!!!!!!!!!!!!!!!!!!!!!!!!!!!!!!!!!!!!!!!!!!!!!!!!!!!!!!!!!!!!!!!!!!!!!!!!!!!!!!!!!!!!!!!!!!!!!!!!!!!!!!!!!!!!!!!!!!!!!!!!!!!!!!!!!!!!!!!!!!!!!!!!!!!!!!!!!!!!!!!!!!!!!!!!!!!!!!!!!!!!!!!!!!!!!!!!!!!!!!!!!!!!!!!!!!!!!!!!!!!!!!!!!!!!!!!!!!!!!!!!!!!!!!!!!!!!!!!!!!!!!!!!!!!!!!!!!!!!!!!!!!!!!!!!!!!!!!!!!!!!!!!!!!!!!!!!!!!!!!!!!!!!!!!!!!!!!!!!!!!!!!!!!!!!!!!!!!!!!!!!!!!!!!!!!!!!!!!!!!!!!!!!!!!!!!!!!!!!!!!!!!!!!!!!!!!!!!!!!!!!!!!!!!!!!!!!!!!!!!!!!!!!!!!!!!!!!!!!!!!!!!!!!!!!!!!!!!!!!!!!!!!!!!!!!!!!!!!!!!!!!!!!!!!!!!!!!!!!!!!!!!!!!!!!!!!!!!!!!!!!!!!!!!!!!!!!!!!!!!!!!!!!!!!!!!!!!!!!!!!!!!!!!!!!!!!!!!!!!!!!!!!!!!!!!!!!!!!!!!!!!!!!!!!!!!!!!!!!!!!!!!!!!!!!!!!!!!!!!!!!!!!!!!!!!!!!!!!!!!!!!!!!!!!!!!!!!!!!!!!!!!!!!!!!!!!!!!!!!!!!!!!!!!!!!!!!!!!!!!!!!!!!!!!!!!!!!!!!!!!!!!!!!!!!!!!!!!!!!!!!!!!!!!!!!!!!!!!!!!!!!!!!!!!!!!!!!!!!!!!!!!!!!!!!!!!!!!!!!!!!!!!!!!!!!!!!!!!!!!!!!!!!!!!!!!!!!!!!!!!!!!!!!!!!!!!!!!!!!!!!!!!!!!!!!!!!!!!!!!!!!!!!!!!!!!!!!!!!!!!!!!!!!!!!!!!!!!!!!!!!!!!!!!!!!!!!!!!!!!!!!!!!!!!!!!!!!!!!!!!!!!!!!!!!!!!!!!!!!!!!!!!!!!!!!!!!!!!!!!!!!!!!!!!!!!!!!!!!!!!!!!!!!!!!!!!!!!!!!!!!!!!!!!!!!!!!!!!!!!!!!!!!!!!!!!!!!!!!!!!!!!!!!!!!!!!!!!!!!!!!!!!!!!!!!!!!!!!!!!!!!!!!!!!!!!!!!!!!!!!!!!!!!!!!!!!!!!!!!!!!!!!!!!!!!!!!!!!!!!!!!!!!!!!!!!!!!!!!!!!!!!!!!!!!!!!!!!!!!!!!!!!!!!!!!!!!!!!!!!!!!!!!!!!!!!!!!!!!!!!!!!!!!!!!!!!!!!!!!!!!!!!!!!!!!!!!!!!!!!!!!!!!!!!!!!!!!!!!!!!!!!!!!!!!!!!!!!!!!!!!!!!!!!!!!!!!!!!!!!!!!!!!!!!!!!!!!!!!!!!!!!!!!!!!!!!!!!!!!!!!!!!!!!!!!!!!!!!!!!!!!!!!!!!!!!!!!!!!!!!!!!!!!!!!!!!!!!!!!!!!!!!!!!!!!!!!!!!!!!!!!!!!!!!!!!!!!!!!!!!!!!!!!!!!!!!!!!!!!!!!!!!!!!!!!!!!!!!!!!!!!!!!!!!!!!!!!!!!!!!!!!!!!!!!!!!!!!!!!!!!!!!!!!!!!!!!!!!!!!!!!!!!!!!!!!!!!!!!!!!!!!!!!!!!!!!!!!!!!!!!!!!!!!!!!!!!!!!!!!!!!!!!!!!!!!!!!!!!!!!!!!!!!!!!!!!!!!!!!!!!!!!!!!!!!!!!!!!!!!!!!!!!!!!!!!!!!!!!!!!!!!!!!!!!!!!!!!!!!!!!!!!!!!!!!!!!!!!!!!!!!!!!!!!!!!!!!!!!!!!!!!!!!!!!!!!!!!!!!!!!!!!!!!!!!!!!!!!!!!!!!!!!!!!!!!!!!!!!!!!!!!!!!!!!!!!!!!!!!!!!!!!!!!!!!!!!!!!!!!!!!!!!!!!!!!!!!!!!!!!!!!!!!!!!!!!!!!!!!!!!!!!!!!!!!!!!!!!!!!!!!!!!!!!!!!!!!!!!!!!!!!!!!!!!!!!!!!!!!!!!!!!!!!!!!!!!!!!!!!!!!!!!!!!!!!!!!!!!!!!!!!!!!!!!!!!!!!!!!!!!!!!!!!!!!!!!!!!!!!!!!!!!!!!!!!!!!!!!!!!!!!!!!!!!!!!!!!!!!!!!!!!!!!!!!!!!!!!!!!!!!!!!!!!!!!!!!!!!!!!!!!!!!!!!!!!!!!!!!!!!!!!!!!!!!!!!!!!!!!!!!!!!!!!!!!!!!!!!!!!!!!!!!!!!!!!!!!!!!!!!!!!!!!!!!!!!!!!!!!!!!!!!!!!!!!!!!!!!!!!!!!!!!!!!!!!!!!!!!!!!!!!!!!!!!!!!!!!!!!!!!!!!!!!!!!!!!!!!!!!!!!!!!!!!!!!!!!!!!!!!!!!!!!!!!!!!!!!!!!!!!!!!!!!!!!!!!!!!!!!!!!!!!!!!!!!!!!!!!!!!!!!!!!!!!!!!!!!!!!!!!!!!!!!!!!!!!!!!!!!!!!!!!!!!!!!!!!!!!!!!!!!!!!!!!!!!!!!!!!!!!!!!!!!!!!!!!!!!!!!!!!!!!!!!!!!!!!!!!!!!!!!!!!!!!!!!!!!!!!!!!!!!!!!!!!!!!!!!!!!!!!!!!!!!!!!!!!!!!!!!!!!!!!!!!!!!!!!!!!!!!!!!!!!!!!!!!!!!!!!!!!!!!!!!!!!!!!!!!!!!!!!!!!!!!!!!!!!!!!!!!!!!!!!!!!!!!!!!!!!!!!!!!!!!!!!!!!!!!!!!!!!!!!!!!!!!!!!!!!!!!!!!!!!!!!!!!!!!!!!!!!!!!!!!!!!!!!!!!!!!!!!!!!!!!!!!!!!!!!!!!!!!!!!!!!!!!!!!!!!!!!!!!!!!!!!!!!!!!!!!!!!!!!!!!!!!!!!!!!!!!!!!!!!!!!!!!!!!!!!!!!!!!!!!!!!!!!!!!!!!!!!!!!!!!!!!!!!!!!!!!!!!!!!!!!!!!!!!!!!!!!!!!!!!!!!!!!!!!!!!!!!!!!!!!!!!!!!!!!!!!!!!!!!!!!!!!!!!!!!!!!!!!!!!!!!!!!!!!!!!!!!!!!!!!!!!!!!!!!!!!!!!!!!!!!!!!!!!!!!!!!!!!!!!!!!!!!!!!!!!!!!!!!!!!!!!!!!!!!!!!!!!!!!!!!!!!!!!!!!!!!!!!!!!!!!!!!!!!!!!!!!!!!!!!!!!!!!!!!!!!!!!!!!!!!!!!!!!!!!!!!!!!!!!!!!!!!!!!!!!!!!!!!!!!!!!!!!!!!!!!!!!!!!!!!!!!!!!!!!!!!!!!!!!!!!!!!!!!!!!!!!!!!!!!!!!!!!!!!!!!!!!!!!!!!!!!!!!!!!!!!!!!!!!!!!!!!!!!!!!!!!!!!!!!!!!!!!!!!!!!!!!!!!!!!!!!!!!!!!!!!!!!!!!!!!!!!!!!!!!!!!!!!!!!!!!!!!!!!!!!!!!!!!!!!!!!!!!!!!!!!!!!!!!!!!!!!!!!!!!!!!!!!!!!!!!!!!!!!!!!!!!!!!!!!!!!!!!!!!!!!!!!!!!!!!!!!!!!!!!!!!!!!!!!!!!!!!!!!!!!!!!!!!!!!!!!!!!!!!!!!!!!!!!!!!!!!!!!!!!!!!!!!!!!!!!!!!!!!!!!!!!!!!!!!!!!!!!!!!!!!!!!!!!!!!!!!!!!!!!!!!!!!!!!!!!!!!!!!!!!!!!!!!!!!!!!!!!!!!!!!!!!!!!!!!!!!!!!!!!!!!!!!!!!!!!!!!!!!!!!!!!!!!!!!!!!!!!!!!!!!!!!!!!!!!!!!!!!!!!!!!!!!!!!!!!!!!!!!!!!!!!!!!!!!!!!!!!!!!!!!!!!!!!!!!!!!!!!!!!!!!!!!!!!!!!!!!!!!!!!!!!!!!!!!!!!!!!!!!!!!!!!!!!!!!!!!!!!!!!!!!!!!!!!!!!!!!!!!!!!!!!!!!!!!!!!!!!!!!!!!!!!!!!!!!!!!!!!!!!!!!!!!!!!!!!!!!!!!!!!!!!!!!!!!!!!!!!!!!!!!!!!!!!!!!!!!!!!!!!!!!!!!!!!!!!!!!!!!!!!!!!!!!!!!!!!!!!!!!!!!!!!!!!!!!!!!!!!!!!!!!!!!!!!!!!!!!!!!!!!!!!!!!!!!!!!!!!!!!!!!!!!!!!!!!!!!!!!!!!!!!!!!!!!!!!!!!!!!!!!!!!!!!!!!!!!!!!!!!!!!!!!!!!!!!!!!!!!!!!!!!!!!!!!!!!!!!!!!!!!!!!!!!!!!!!!!!!!!!!!!!!!!!!!!!!!!!!!!!!!!!!!!!!!!!!!!!!!!!!!!!!!!!!!!!!!!!!!!!!!!!!!!!!!!!!!!!!!!!!!!!!!!!!!!!!!!!!!!!!!!!!!!!!!!!!!!!!!!!!!!!!!!!!!!!!!!!!!!!!!!!!!!!!!!!!!!!!!!!!!!!!!!!!!!!!!!!!!!!!!!!!!!!!!!!!!!!!!!!!!!!!!!!!!!!!!!!!!!!!!!!!!!!!!!!!!!!!!!!!!!!!!!!!!!!!!!!!!!!!!!!!!!!!!!!!!!!!!!!!!!!!!!!!!!!!!!!!!!!!!!!!!!!!!!!!!!!!!!!!!!!!!!!!!!!!!!!!!!!!!!!!!!!!!!!!!!!!!!!!!!!!!!!!!!!!!!!!!!!!!!!!!!!!!!!!!!!!!!!!!!!!!!!!!!!!!!!!!!!!!!!!!!!!!!!!!!!!!!!!!!!!!!!!!!!!!!!!!!!!!!!!!!!!!!!!!!!!!!!!!!!!!!!!!!!!!!!!!!!!!!!!!!!!!!!!!!!!!!!!!!!!!!!!!!!!!!!!!!!!!!!!!!!!!!!!!!!!!!!!!!!!!!!!!!!!!!!!!!!!!!!!!!!!!!!!!!!!!!!!!!!!!!!!!!!!!!!!!!!!!!!!!!!!!!!!!!!!!!!!!!!!!!!!!!!!!!!!!!!!!!!!!!!!!!!!!!!!!!!!!!!!!!!!!!!!!!!!!!!!!!!!!!!!!!!!!!!!!!!!!!!!!!!!!!!!!!!!!!!!!!!!!!!!!!!!!!!!!!!!!!!!!!!!!!!!!!!!!!!!!!!!!!!!!!!!!!!!!!!!!!!!!!!!!!!!!!!!!!!!!!!!!!!!!!!!!!!!!!!!!!!!!!!!!!!!!!!!!!!!!!!!!!!!!!!!!!!!!!!!!!!!!!!!!!!!!!!!!!!!!!!!!!!!!!!!!!!!!!!!!!!!!!!!!!!!!!!!!!!!!!!!!!!!!!!!!!!!!!!!!!!!!!!!!!!!!!!!!!!!!!!!!!!!!!!!!!!!!!!!!!!!!!!!!!!!!!!!!!!!!!!!!!!!!!!!!!!!!!!!!!!!!!!!!!!!!!!!!!!!!!!!!!!!!!!!!!!!!!!!!!!!!!!!!!!!!!!!!!!!!!!!!!!!!!!!!!!!!!!!!!!!!!!!!!!!!!!!!!!!!!!!!!!!!!!!!!!!!!!!!!!!!!!!!!!!!!!!!!!!!!!!!!!!!!!!!!!!!!!!!!!!!!!!!!!!!!!!!!!!!!!!!!!!!!!!!!!!!!!!!!!!!!!!!!!!!!!!!!!!!!!!!!!!!!!!!!!!!!!!!!!!!!!!!!!!!!!!!!!!!!!!!!!!!!!!!!!!!!!!!!!!!!!!!!!!!!!!!!!!!!!!!!!!!!!!!!!!!!!!!!!!!!!!!!!!!!!!!!!!!!!!!!!!!!!!!!!!!!!!!!!!!!!!!!!!!!!!!!!!!!!!!!!!!!!!!!!!!!!!!!!!!!!!!!!!!!!!!!!!!!!!!!!!!!!!!!!!!!!!!!!!!!!!!!!!!!!!!!!!!!!!!!!!!!!!!!!!!!!!!!!!!!!!!!!!!!!!!!!!!!!!!!!!!!!!!!!!!!!!!!!!!!!!!!!!!!!!!!!!!!!!!!!!!!!!!!!!!!!!!!!!!!!!!!!!!!!!!!!!!!!!!!!!!!!!!!!!!!!!!!!!!!!!!!!!!!!!!!!!!!!!!!!!!!!!!!!!!!!!!!!!!!!!!!!!!!!!!!!!!!!!!!!!!!!!!!!!!!!!!!!!!!!!!!!!!!!!!!!!!!!!!!!!!!!!!!!!!!!!!!!!!!!!!!!!!!!!!!!!!!!!!!!!!!!!!!!!!!!!!!!!!!!!!!!!!!!!!!!!!!!!!!!!!!!!!!!!!!!!!!!!!!!!!!!!!!!!!!!!!!!!!!!!!!!!!!!!!!!!!!!!!!!!!!!!!!!!!!!!!!!!!!!!!!!!!!!!!!!!!!!!!!!!!!!!!!!!!!!!!!!!!!!!!!!!!!!!!!!!!!!!!!!!!!!!!!!!!!!!!!!!!!!!!!!!!!!!!!!!!!!!!!!!!!!!!!!!!!!!!!!!!!!!!!!!!!!!!!!!!!!!!!!!!!!!!!!!!!!!!!!!!!!!!!!!!!!!!!!!!!!!!!!!!!!!!!!!!!!!!!!!!!!!!!!!!!!!!!!!!!!!!!!!!!!!!!!!!!!!!!!!!!!!!!!!!!!!!!!!!!!!!!!!!!!!!!!!!!!!!!!!!!!!!!!!!!!!!!!!!!!!!!!!!!!!!!!!!!!!!!!!!!!!!!!!!!!!!!!!!!!!!!!!!!!!!!!!!!!!!!!!!!!!!!!!!!!!!!!!!!!!!!!!!!!!!!!!!!!!!!!!!!!!!!!!!!!!!!!!!!!!!!!!!!!!!!!!!!!!!!!!!!!!!!!!!!!!!!!!!!!!!!!!!!!!!!!!!!!!!!!!!!!!!!!!!!!!!!!!!!!!!!!!!!!!!!!!!!!!!!!!!!!!!!!!!!!!!!!!!!!!!!!!!!!!!!!!!!!!!!!!!!!!!!!!!!!!!!!!!!!!!!!!!!!!!!!!!!!!!!!!!!!!!!!!!!!!!!!!!!!!!!!!!!!!!!!!!!!!!!!!!!!!!!!!!!!!!!!!!!!!!!!!!!!!!!!!!!!!!!!!!!!!!!!!!!!!!!!!!!!!!!!!!!!!!!!!!!!!!!!!!!!!!!!!!!!!!!!!!!!!!!!!!!!!!!!!!!!!!!!!!!!!!!!!!!!!!!!!!!!!!!!!!!!!!!!!!!!!!!!!!!!!!!!!!!!!!!!!!!!!!!!!!!!!!!!!!!!!!!!!!!!!!!!!!!!!!!!!!!!!!!!!!!!!!!!!!!!!!!!!!!!!!!!!!!!!!!!!!!!!!!!!!!!!!!!!!!!!!!!!!!!!!!!!!!!!!!!!!!!!!!!!!!!!!!!!!!!!!!!!!!!!!!!!!!!!!!!!!!!!!!!!!!!!!!!!!!!!!!!!!!!!!!!!!!!!!!!!!!!!!!!!!!!!!!!!!!!!!!!!!!!!!!!!!!!!!!!!!!!!!!!!!!!!!!!!!!!!!!!!!!!!!!!!!!!!!!!!!!!!!!!!!!!!!!!!!!!!!!!!!!!!!!!!!!!!!!!!!!!!!!!!!!!!!!!!!!!!!!!!!!!!!!!!!!!!!!!!!!!!!!!!!!!!!!!!!!!!!!!!!!!!!!!!!!!!!!!!!!!!!!!!!!!!!!!!!!!!!!!!!!!!!!!!!!!!!!!!!!!!!!!!!!!!!!!!!!!!!!!!!!!!!!!!!!!!!!!!!!!!!!!!!!!!!!!!!!!!!!!!!!!!!!!!!!!!!!!!!!!!!!!!!!!!!!!!!!!!!!!!!!!!!!!!!!!!!!!!!!!!!!!!!!!!!!!!!!!!!!!!!!!!!!!!!!!!!!!!!!!!!!!!!!!!!!!!!!!!!!!!!!!!!!!!!!!!!!!!!!!!!!!!!!!!!!!!!!!!!!!!!!!!!!!!!!!!!!!!!!!!!!!!!!!!!!!!!!!!!!!!!!!!!!!!!!!!!!!!!!!!!!!!!!!!!!!!!!!!!!!!!!!!!!!!!!!!!!!!!!!!!!!!!!!!!!!!!!!!!!!!!!!!!!!!!!!!!!!!!!!!!!!!!!!!!!!!!!!!!!!!!!!!!!!!!!!!!!!!!!!!!!!!!!!!!!!!!!!!!!!!!!!!!!!!!!!!!!!!!!!!!!!!!!!!!!!!!!!!!!!!!!!!!!!!!!!!!!!!!!!!!!!!!!!!!!!!!!!!!!!!!!!!!!!!!!!!!!!!!!!!!!!!!!!!!!!!!!!!!!!!!!!!!!!!!!!!!!!!!!!!!!!!!!!!!!!!!!!!!!!!!!!!!!!!!!!!!!!!!!!!!!!!!!!!!!!!!!!!!!!!!!!!!!!!!!!!!!!!!!!!!!!!!!!!!!!!!!!!!!!!!!!!!!!!!!!!!!!!!!!!!!!!!!!!!!!!!!!!!!!!!!!!!!!!!!!!!!!!!!!!!!!!!!!!!!!!!!!!!!!!!!!!!!!!!!!!!!!!!!!!!!!!!!!!!!!!!!!!!!!!!!!!!!!!!!!!!!!!!!!!!!!!!!!!!!!!!!!!!!!!!!!!!!!!!!!!!!!!!!!!!!!!!!!!!!!!!!!!!!!!!!!!!!!!!!!!!!!!!!!!!!!!!!!!!!!!!!!!!!!!!!!!!!!!!!!!!!!!!!!!!!!!!!!!!!!!!!!!!!!!!!!!!!!!!!!!!!!!!!!!!!!!!!!!!!!!!!!!!!!!!!!!!!!!!!!!!!!!!!!!!!!!!!!!!!!!!!!!!!!!!!!!!!!!!!!!!!!!!!!!!!!!!!!!!!!!!!!!!!!!!!!!!!!!!!!!!!!!!!!!!!!!!!!!!!!!!!!!!!!!!!!!!!!!!!!!!!!!!!!!!!!!!!!!!!!!!!!!!!!!!!!!!!!!!!!!!!!!!!!!!!!!!!!!!!!!!!!!!!!!!!!!!!!!!!!!!!!!!!!!!!!!!!!!!!!!!!!!!!!!!!!!!!!!!!!!!!!!!!!!!!!!!!!!!!!!!!!!!!!!!!!!!!!!!!!!!!!!!!!!!!!!!!!!!!!!!!!!!!!!!!!!!!!!!!!!!!!!!!!!!!!!!!!!!!!!!!!!!!!!!!!!!!!!!!!!!!!!!!!!!!!!!!!!!!!!!!!!!!!!!!!!!!!!!!!!!!!!!!!!!!!!!!!!!!!!!!!!!!!!!!!!!!!!!!!!!!!!!!!!!!!!!!!!!!!!!!!!!!!!!!!!!!!!!!!!!!!!!!!!!!!!!!!!!!!!!!!!!!!!!!!!!!!!!!!!!!!!!!!!!!!!!!!!!!!!!!!!!!!!!!!!!!!!!!!!!!!!!!!!!!!!!!!!!!!!!!!!!!!!!!!!!!!!!!!!!!!!!!!!!!!!!!!!!!!!!!!!!!!!!!!!!!!!!!!!!!!!!!!!!!!!!!!!!!!!!!!!!!!!!!!!!!!!!!!!!!!!!!!!!!!!!!!!!!!!!!!!!!!!!!!!!!!!!!!!!!!!!!!!!!!!!!!!!!!!!!!!!!!!!!!!!!!!!!!!!!!!!!!!!!!!!!!!!!!!!!!!!!!!!!!!!!!!!!!!!!!!!!!!!!!!!!!!!!!!!!!!!!!!!!!!!!!!!!!!!!!!!!!!!!!!!!!!!!!!!!!!!!!!!!!!!!!!!!!!!!!!!!!!!!!!!!!!!!!!!!!!!!!!!!!!!!!!!!!!!!!!!!!!!!!!!!!!!!!!!!!!!!!!!!!!!!!!!!!!!!!!!!!!!!!!!!!!!!!!!!!!!!!!!!!!!!!!!!!!!!!!!!!!!!!!!!!!!!!!!!!!!!!!!!!!!!!!!!!!!!!!!!!!!!!!!!!!!!!!!!!!!!!!!!!!!!!!!!!!!!!!!!!!!!!!!!!!!!!!!!!!!!!!!!!!!!!!!!!!!!!!!!!!!!!!!!!!!!!!!!!!!!!!!!!!!!!!!!!!!!!!!!!!!!!!!!!!!!!!!!!!!!!!!!!!!!!!!!!!!!!!!!!!!!!!!!!!!!!!!!!!!!!!!!!!!!!!!!!!!!!!!!!!!!!!!!!!!!!!!!!!!!!!!!!!!!!!!!!!!!!!!!!!!!!!!!!!!!!!!!!!!!!!!!!!!!!!!!!!!!!!!!!!!!!!!!!!!!!!!!!!!!!!!!!!!!!!!!!!!!!!!!!!!!!!!!!!!!!!!!!!!!!!!!!!!!!!!!!!!!!!!!!!!!!!!!!!!!!!!!!!!!!!!!!!-5
-5
0
0
5
5
10
10
15
15
20
20
25
25
-120
-120
-115
-115
-110
-110
-105
-105
-100
-100
-95
-95
-90
-90
-85
-85
-80
-80
-75
-75
-70
-70
-65
-65
-60
-60
-55
-55
-50
-50
-45
-45
-40
-40
-35
-35
-30
-30
-25
-25
-20
-20
-15 -15
-10 -10
-5 -5
0 0
SO5NY003-016 - Gr i d Desi gn
Legend! Sample Points
Horizon Boundaries
Grid values are in cm.
Ap
E
Btg
Btx
C
Pedon DRS Data
PLS1 Model
Computed
PLS1 Prediction
Grid DRS Data
Properties Computed
Properties Table
Export to ArcGIS via
Excel
Kriging in ArcGIS
Profile Mapping Product
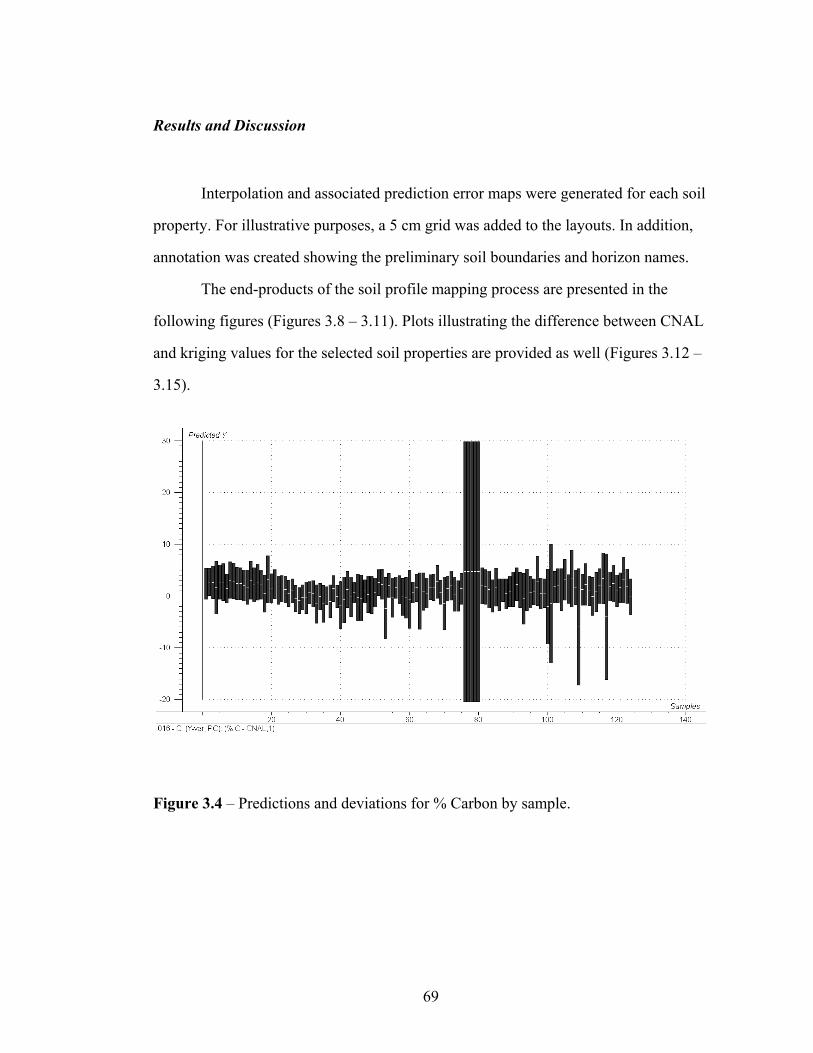
69
Results and Discussion
Interpolation and associated prediction error maps were generated for each soil
property. For illustrative purposes, a 5 cm grid was added to the layouts. In addition,
annotation was created showing the preliminary soil boundaries and horizon names.
The end-products of the soil profile mapping process are presented in the
following figures (Figures 3.8 – 3.11). Plots illustrating the difference between CNAL
and kriging values for the selected soil properties are provided as well (Figures 3.12 –
3.15).
Figure 3.4 – Predictions and deviations for % Carbon by sample.
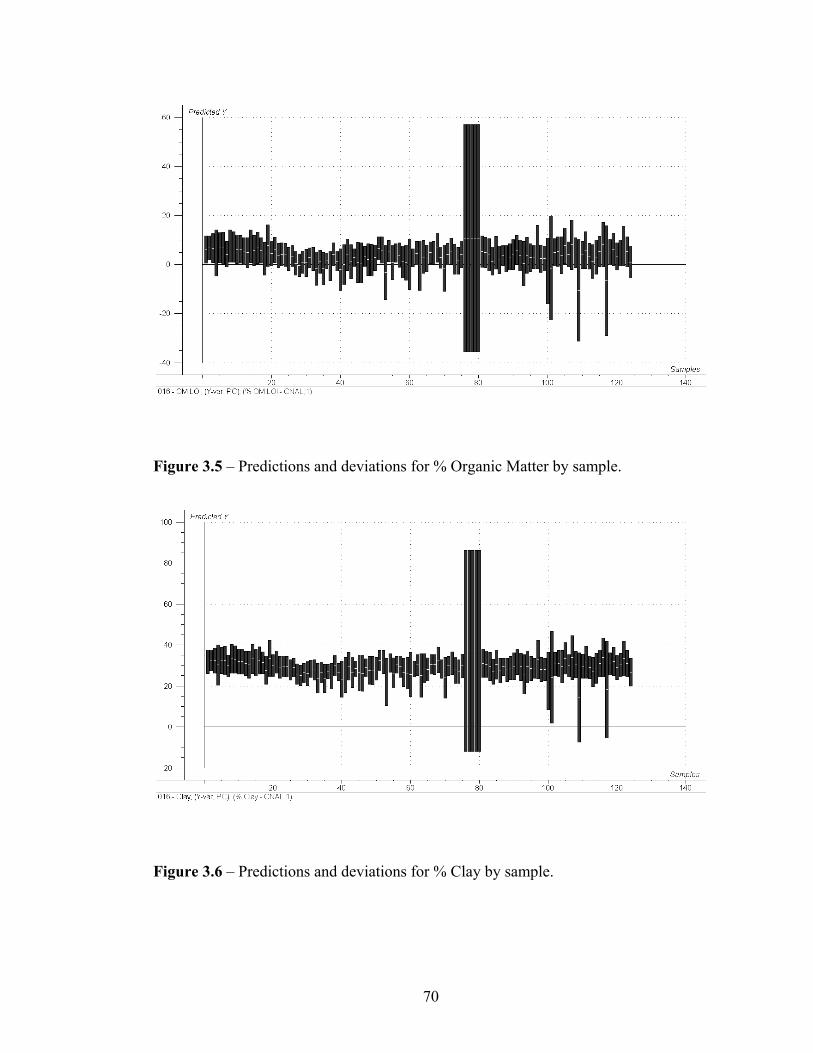
70
Figure 3.5 – Predictions and deviations for % Organic Matter by sample.
Figure 3.6 – Predictions and deviations for % Clay by sample.
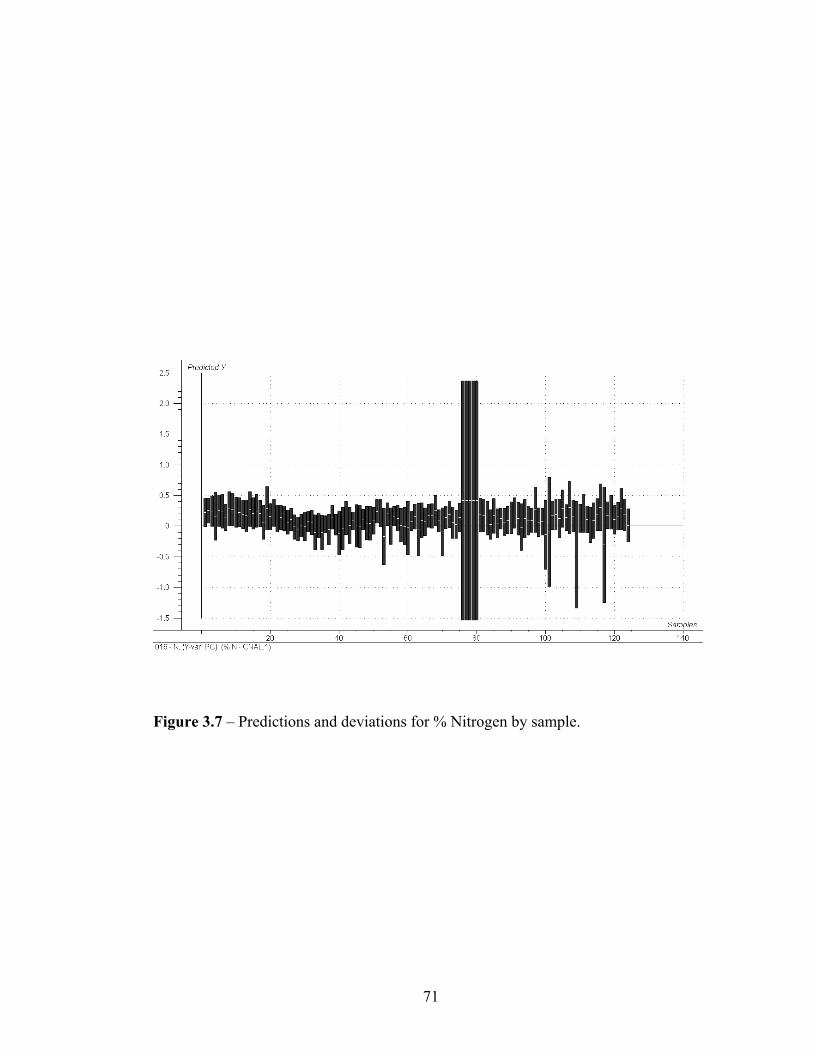
71
Figure 3.7 – Predictions and deviations for % Nitrogen by sample.

72
Figure 3.8 – Interpolated soil profile map of % Carbon.
-5
-5
0
0
5
5
10
10
15
15
20
20
25
25-120
-120
-115
-115
-110
-110
-105
-105
-100
-100
-95
-95
-90
-90
-85
-85
-80
-80
-75
-75
-70
-70
-65
-65
-60
-60
-55
-55
-50
-50
-45
-45
-40
-40
-35
-35
-30
-30
-25
-25
-20
-20
-15 -15
-10 -10
-5 -5
0 0
SO5 NY0 0 3-0 16 - % C
LegendOrdinary Kriging - % C
-5.96 - -2.46
-2.46 - -0.63
-0.63 - 0.31
0.31 - 0.81
0.81 - 1.06
1.06 - 1.20
1.20 - 1.45
1.45 - 1.95
1.95 - 2.89
2.89 - 4.72
Horizon Boundaries
Grid values are in cm.
Ap
E
Btg
Btx
C
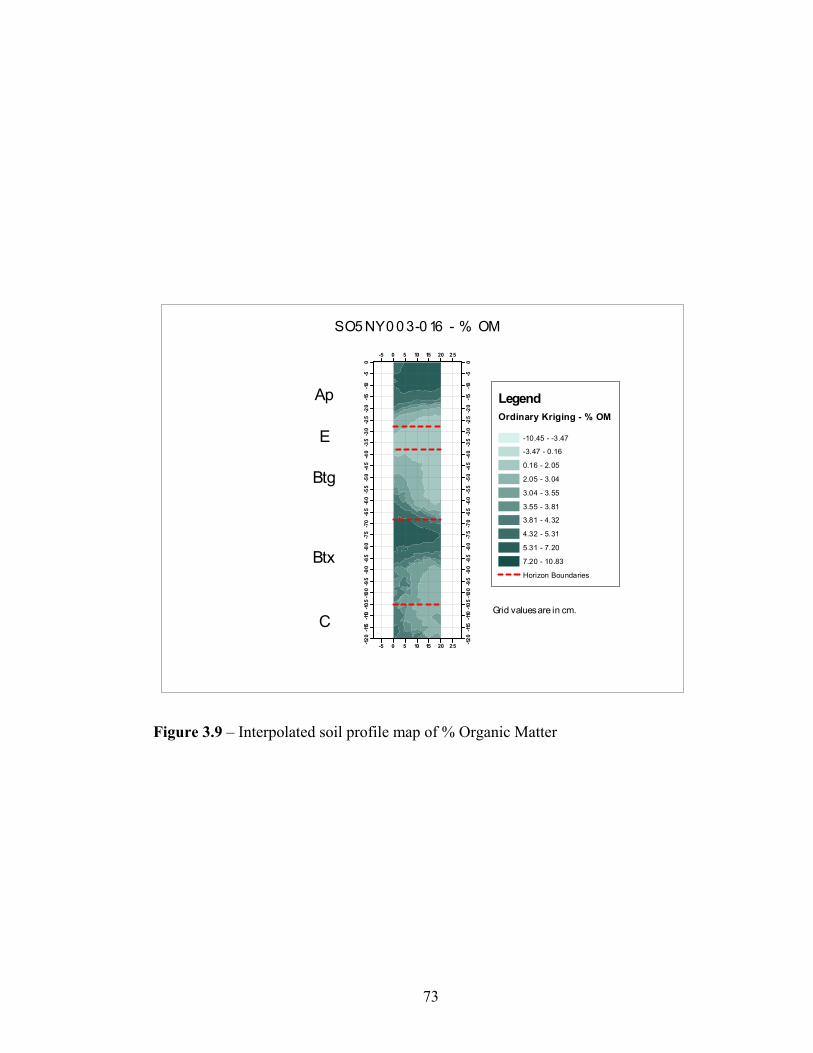
73
Figure 3.9 – Interpolated soil profile map of % Organic Matter
-5
-5
0
0
5
5
10
10
15
15
20
20
25
25-120
-120
-115
-115
-110
-110
-105
-105
-100
-100
-95
-95
-90
-90
-85
-85
-80
-80
-75
-75
-70
-70
-65
-65
-60
-60
-55
-55
-50
-50
-45
-45
-40
-40
-35
-35
-30
-30
-25
-25
-20
-20
-15 -15
-10 -10
-5 -5
0 0
SO5 NY0 0 3-0 16 - % OM
LegendOrdinary Kriging - % OM
-10.45 - -3.47
-3.47 - 0.16
0.16 - 2.05
2.05 - 3.04
3.04 - 3.55
3.55 - 3.81
3.81 - 4.32
4.32 - 5.31
5.31 - 7.20
7.20 - 10.83
Horizon Boundaries
Grid values are in cm.
Ap
E
Btg
Btx
C
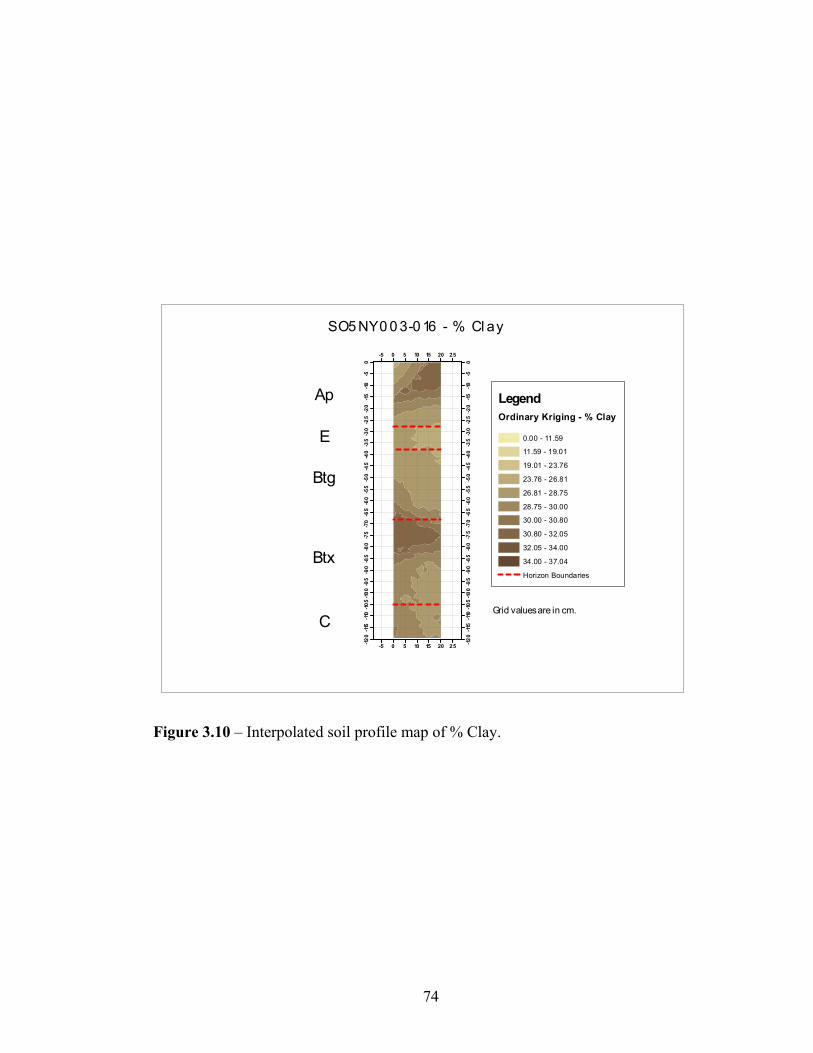
74
Figure 3.10 – Interpolated soil profile map of % Clay.
-5
-5
0
0
5
5
10
10
15
15
20
20
25
25-120
-120
-115
-115
-110
-110
-105
-105
-100
-100
-95
-95
-90
-90
-85
-85
-80
-80
-75
-75
-70
-70
-65
-65
-60
-60
-55
-55
-50
-50
-45
-45
-40
-40
-35
-35
-30
-30
-25
-25
-20
-20
-15 -15
-10 -10
-5 -5
0 0
SO5 NY0 0 3-0 16 - % Cl ay
LegendOrdinary Kriging - % Clay
0.00 - 11.59
11.59 - 19.01
19.01 - 23.76
23.76 - 26.81
26.81 - 28.75
28.75 - 30.00
30.00 - 30.80
30.80 - 32.05
32.05 - 34.00
34.00 - 37.04
Horizon Boundaries
Grid values are in cm.
Ap
E
Btg
Btx
C
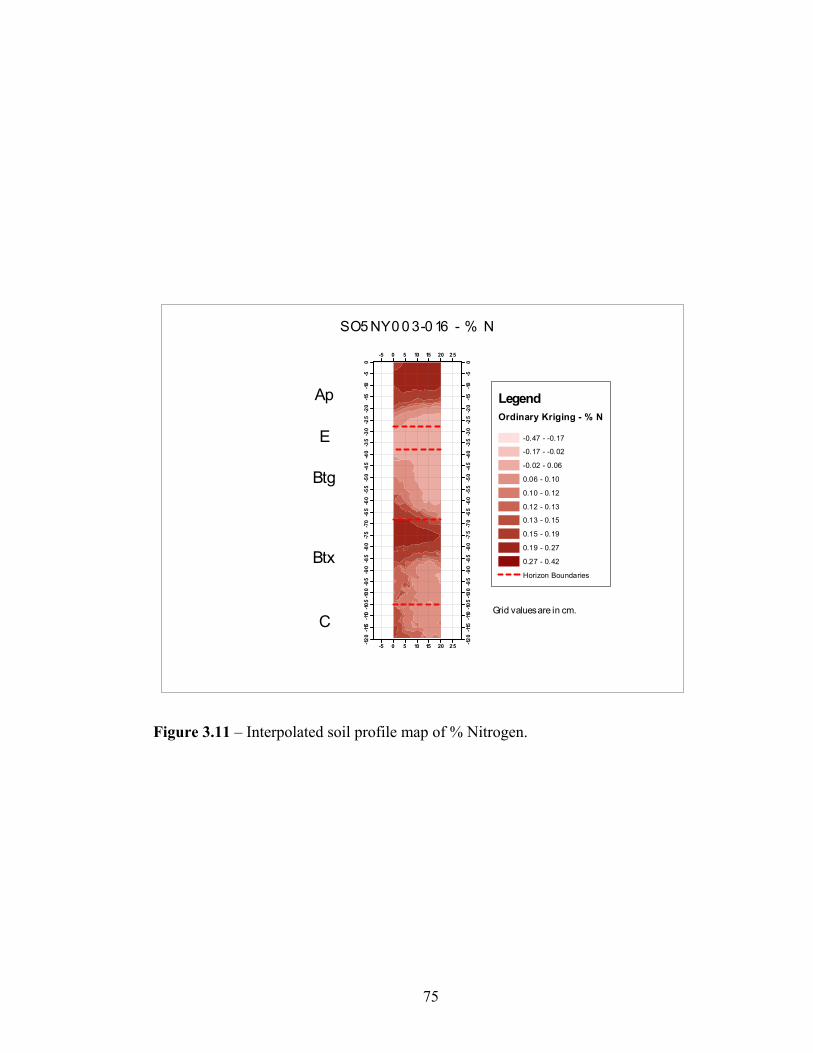
75
Figure 3.11 – Interpolated soil profile map of % Nitrogen.
-5
-5
0
0
5
5
10
10
15
15
20
20
25
25-120
-120
-115
-115
-110
-110
-105
-105
-100
-100
-95
-95
-90
-90
-85
-85
-80
-80
-75
-75
-70
-70
-65
-65
-60
-60
-55
-55
-50
-50
-45
-45
-40
-40
-35
-35
-30
-30
-25
-25
-20
-20
-15 -15
-10 -10
-5 -5
0 0
SO5 NY0 0 3-0 16 - % N
LegendOrdinary Kriging - % N
-0.47 - -0.17
-0.17 - -0.02
-0.02 - 0.06
0.06 - 0.10
0.10 - 0.12
0.12 - 0.13
0.13 - 0.15
0.15 - 0.19
0.19 - 0.27
0.27 - 0.42
Horizon Boundaries
Grid values are in cm.
Ap
E
Btg
Btx
C
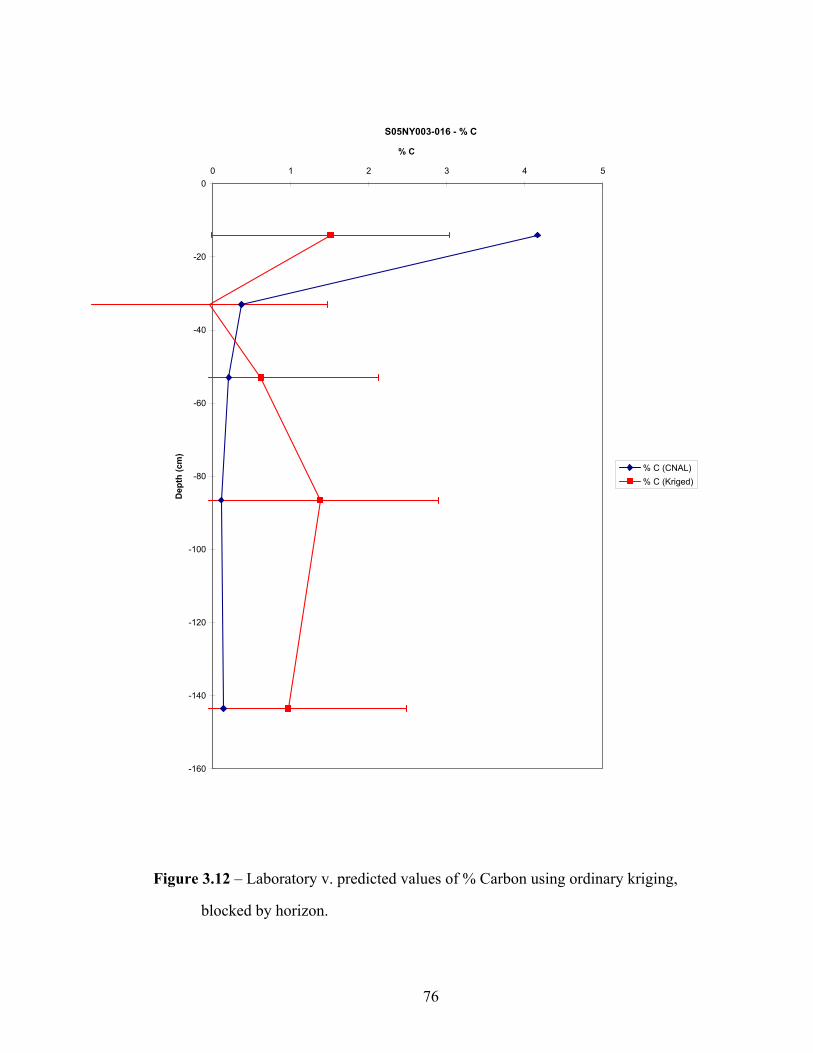
76
S05NY003-016 - % C
-160
-140
-120
-100
-80
-60
-40
-20
00 1 2 3 4 5
% C
Dep
th (c
m)
% C (CNAL)% C (Kriged)
Figure 3.12 – Laboratory v. predicted values of % Carbon using ordinary kriging,
blocked by horizon.
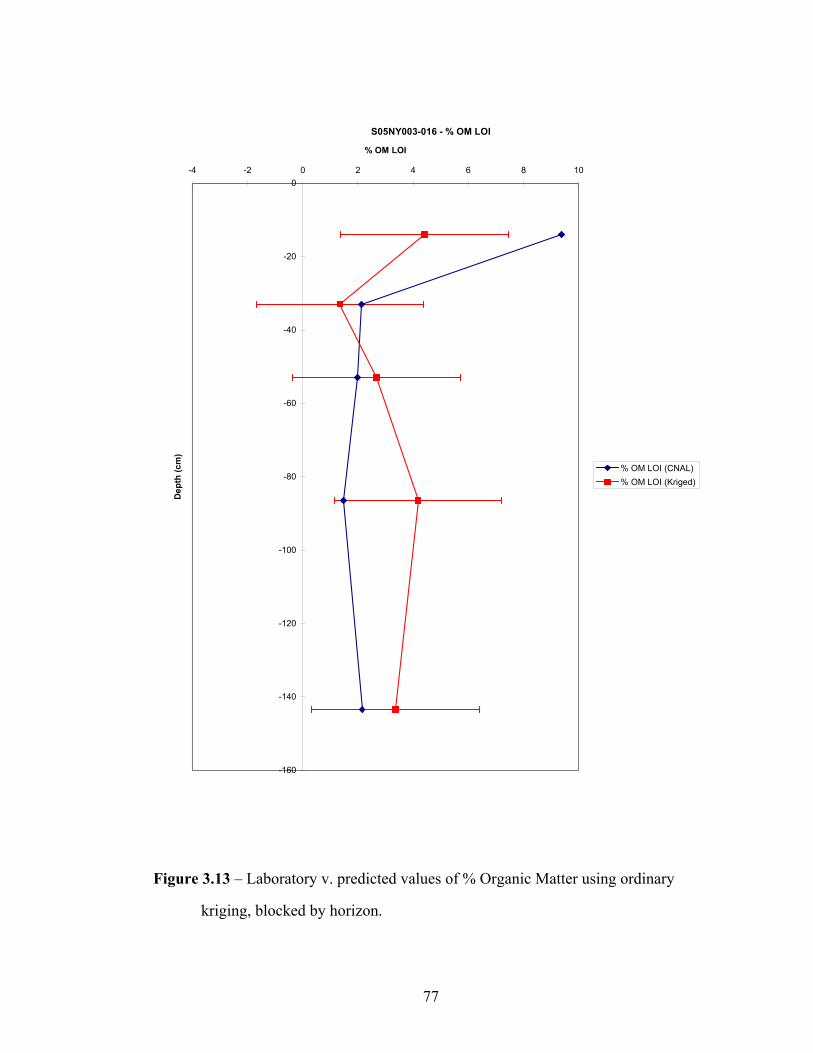
77
S05NY003-016 - % OM LOI
-160
-140
-120
-100
-80
-60
-40
-20
0-4 -2 0 2 4 6 8 10
% OM LOI
Dep
th (c
m)
% OM LOI (CNAL)% OM LOI (Kriged)
Figure 3.13 – Laboratory v. predicted values of % Organic Matter using ordinary
kriging, blocked by horizon.
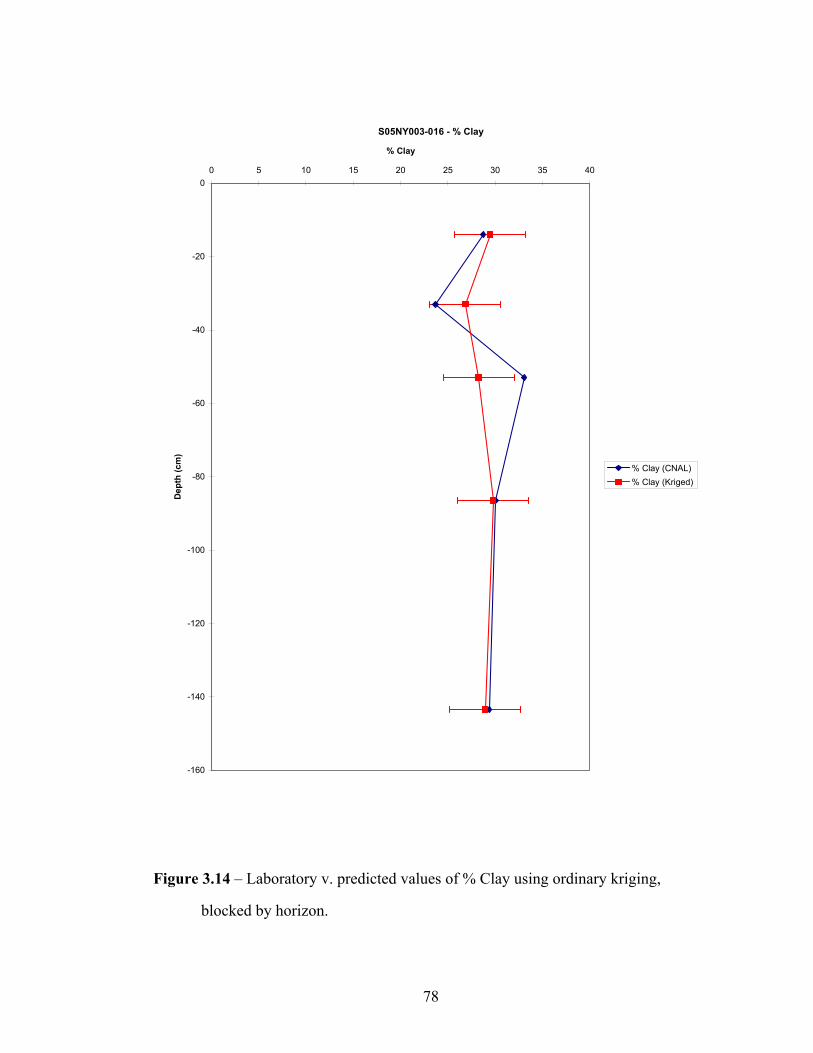
78
S05NY003-016 - % Clay
-160
-140
-120
-100
-80
-60
-40
-20
00 5 10 15 20 25 30 35 40
% Clay
Dep
th (c
m)
% Clay (CNAL)% Clay (Kriged)
Figure 3.14 – Laboratory v. predicted values of % Clay using ordinary kriging,
blocked by horizon.
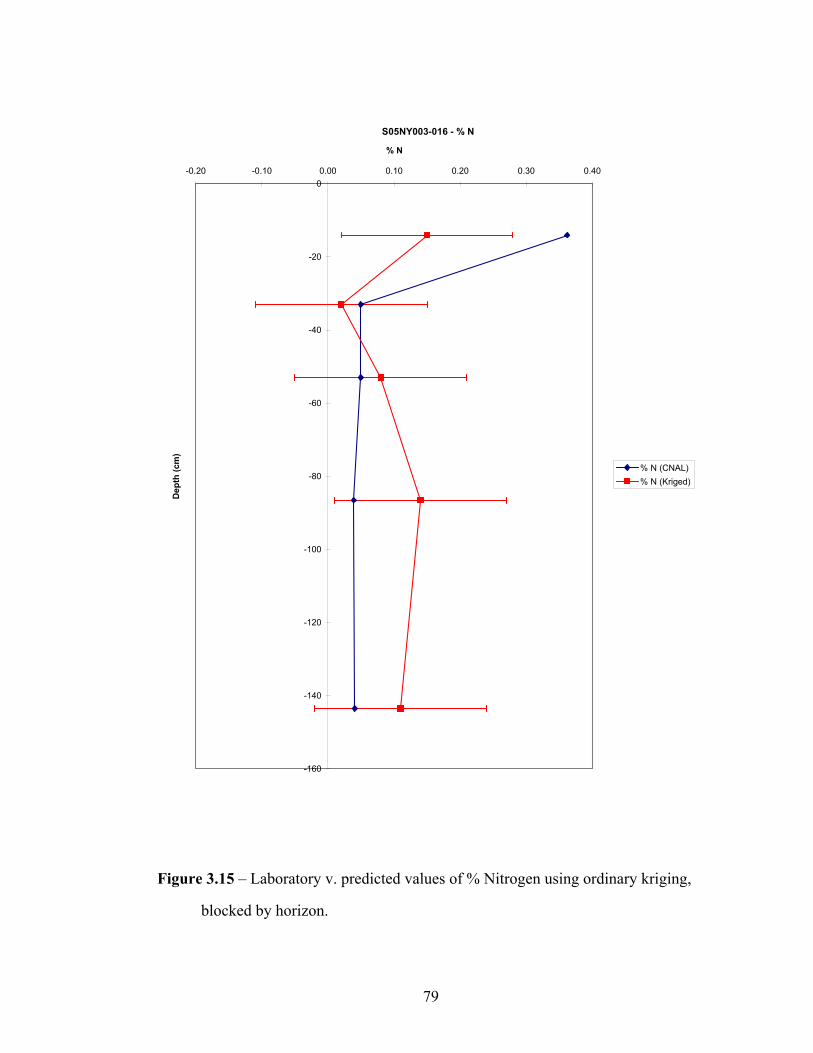
79
S05NY003-016 - % N
-160
-140
-120
-100
-80
-60
-40
-20
0-0.20 -0.10 0.00 0.10 0.20 0.30 0.40
% N
Dep
th (c
m)
% N (CNAL)% N (Kriged)
Figure 3.15 – Laboratory v. predicted values of % Nitrogen using ordinary kriging,
blocked by horizon.
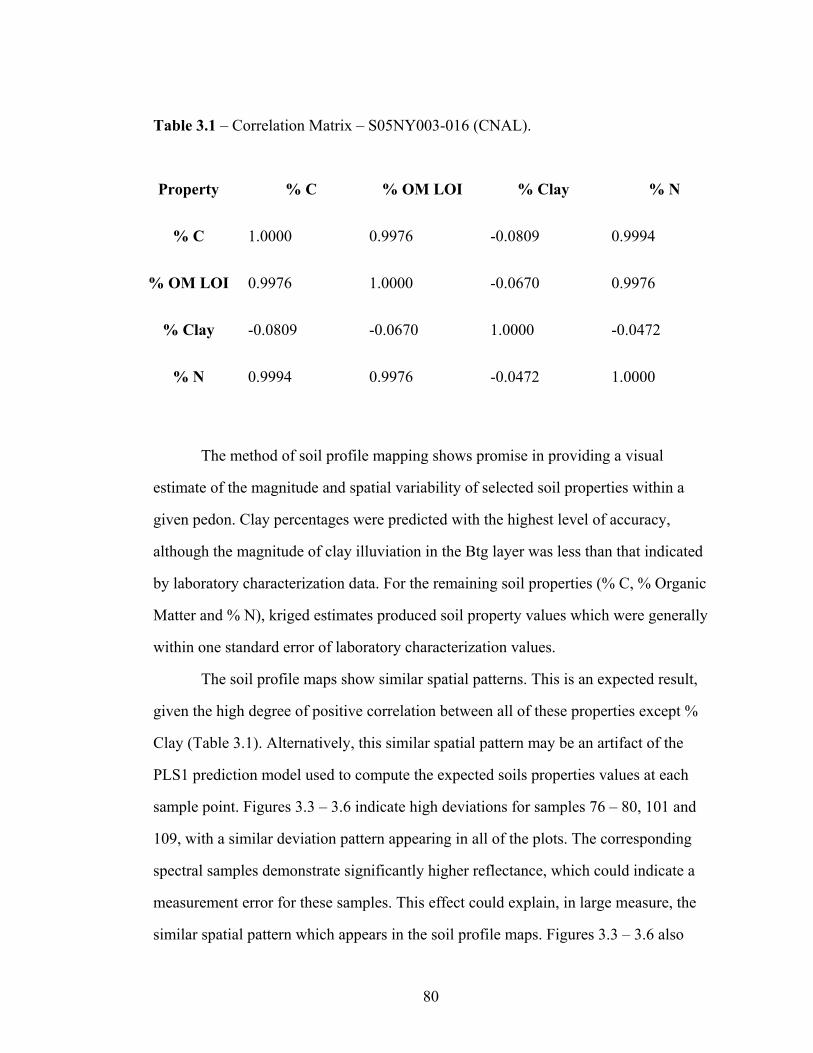
80
Table 3.1 – Correlation Matrix – S05NY003-016 (CNAL).
Property % C % OM LOI % Clay % N
% C 1.0000 0.9976 -0.0809 0.9994
% OM LOI 0.9976 1.0000 -0.0670 0.9976
% Clay -0.0809 -0.0670 1.0000 -0.0472
% N 0.9994 0.9976 -0.0472 1.0000
The method of soil profile mapping shows promise in providing a visual
estimate of the magnitude and spatial variability of selected soil properties within a
given pedon. Clay percentages were predicted with the highest level of accuracy,
although the magnitude of clay illuviation in the Btg layer was less than that indicated
by laboratory characterization data. For the remaining soil properties (% C, % Organic
Matter and % N), kriged estimates produced soil property values which were generally
within one standard error of laboratory characterization values.
The soil profile maps show similar spatial patterns. This is an expected result,
given the high degree of positive correlation between all of these properties except %
Clay (Table 3.1). Alternatively, this similar spatial pattern may be an artifact of the
PLS1 prediction model used to compute the expected soils properties values at each
sample point. Figures 3.3 – 3.6 indicate high deviations for samples 76 – 80, 101 and
109, with a similar deviation pattern appearing in all of the plots. The corresponding
spectral samples demonstrate significantly higher reflectance, which could indicate a
measurement error for these samples. This effect could explain, in large measure, the
similar spatial pattern which appears in the soil profile maps. Figures 3.3 – 3.6 also
81
indicate that the PLS1 regression model used returned negative values for % C, %
Organic Matter and % N, a problematic result which is reflected in the soil profile
maps in Figures 3.8 – 3.11. Logarithmic transformation was attempted to eliminate
these negative values, but the resulting values were well outside acceptable limits as
suggested by laboratory values. Again, the potentially erroneous spectra could be
responsible for this effect. A more robust prediction model would likely reduce the
probability of similar artifacts, including the similar soil property prediction patterns,
in the future versions of these products.
Figure 3.12 indicates that Kriging performed within one standard error for % C
with the exception of the Ap horizon. Figure 3.13 indicates that Kriging performed
within one standard error for % Organic Matter with the exception of the Ap horizon.
Percent Clay was best predicted with Kriging, with the exception of the Btg horizon
(Figure 3.14), where the values do not reflect the higher percentages of clay there.
Figure 3.15 indicates that Kriging performed within one standard error for % N with
the exception of the Ap horizon.
At present, several issues limit the immediate application of this method in the
field. Sample size is a major limitation, as the soil property data for only one soil
profile were used to create the PLS1 prediction model. Although there were other
pedons in the Allegany County study area with the same preliminary soil series
designation, each had a different topographic position on the landscape and were
under different land management regimes. Therefore, it was inappropriate to include
these samples for the purpose of prediction. This issue can be resolved by increasing
sample size by collecting replicate samples within the profile to be scanned or
increasing the number of soil profiles to be sampled. Given common equipment and
time constraints, the former option may be the most feasible. While unlikely to have
management implications, maintaining representative geographic location of the
82
samples is important for adequately representing the spatial distribution of soil
properties of interest.
This study used an unaligned systematic grid. In other words, all successive
samples were aligned on the y-axis, but varied in alignment by up to 2.5 cm on the x-
axis. Since this variation could not be accurately quantified using available field
equipment, the sample points were projected on the uniform grid described above.
Maintaining the positional accuracy in both x- and y-axes would have been difficult
with out a template or frame to physically represent sample location on the profile
face.
Although not directly related to data quality, the physical implementation of
the spectral acquisition process provides several challenges. The sensor unit weighs
approximately 7.2 kg and is worn in a backpack while the user is collecting spectral
samples in the soil pit. The controller PC is worn in a pack on the front of the user
while the same user, or co-worker, is manipulating the contact probe sensor. While
satisfactory for the 20 min required for collecting spectra by horizon, it produces
significant strain when worn during the 1 h 50 min scanning process. Combined with
the short battery life of the controller PC, a maximum of two to three soil profiles can
be scanned during any given day. Possible solutions include carrying spare PC battery
packs or recharging them using an automobile during a pause in operations.
Nevertheless, this study has demonstrated the feasibility of using hyperspectral
sensing to quantify the spatial distribution of important soil properties for soil
classification, survey and fertility. While the major issues of sample size and PLS1
regression model quality need to be addressed through further study, the method used
has the potential to rapidly generate soil property visualization products. At
practitioners’ discretion, these products can be used to complement their extensive

83
tacit knowledge infrastructure and provide estimates in un-surveyed areas where such
knowledge is still developing.
84
REFERENCES
ASTM. 2000. Standard test methods for moisture, ash, and organic matter of peat and
other organic soils. Method D 2974-00. American Society for Testing and
Materials. West Conshohocken, PA.
Blume, L.J., B.A. Schumacher, P.W. Shaffer et al. 1990. Handbook of Methods for
Acid Deposition Studies Laboratory Analyses for Soil Chemistry. EPA/600/4-
90/023. U.S. Environmental Protection Agency, Las Vegas, NV.
Cressie, N. A. C., 1993. Statistics for Spatial Data, Rev. ed. Wiley. New York.
Geladi, P., Kowalski, B.R., 1986. Partial Least-squares regression: a tutorial. Anal.
Chim. Acta 185, 1 –17.
Nelson, D.W. and L.E. Sommers. 1996. Total carbon, organic carbon, and organic
matter. In: Methods of Soil Analysis, Part 2, 2nd
ed., A.L. Page et al., Ed.
Agronomy. 9:961-1010. Am. Soc. of Agron., Inc. Madison, WI.
Pella, E. 1990. Elemental organic analysis. Part 1. Am. Lab 22: 116-125.
USEPA. 2002. Methods for the Determination of Total Organic Carbon (TOC) in
Soils and Sediments. USEPA Rep. NCEA-C- 1282, EMASC-001. U. S. Gov.
Print. Office, Washington, DC.
Wold, S., Sjostrom, M., Eriksson, L., 2001. PLS-regression: a basic tool of
chemometrics. Chemom. Intell. Lab. Syst. 58, 109– 130.
85
Chapter 4: Comparing Physical and Chemical Soil Properties Measurement:
CNAL vs. NSSC
Abstract
This study compared soil characterization data from National Soil Survey
(NSSC) and Cornell Nutrient Analysis Laboratory (CNAL) for paired analyses of
selected soil chemical and physical properties. This assessment of soil characterization
data generated by CNAL and NSSC, as determined using simple linear regression,
demonstrated substantial agreement between the two laboratories. The results can
help local practitioners obtain data more rapidly through local university-based
laboratories, while still allowing comparison and statistical analyses with data
provided by the national soil survey laboratory.
Introduction
Soil information is widely used and is an integral component in many land
management decision-making processes. It is well established that the distribution of
soils on the landscape is a product of their soil forming factors, properties and
processes. the genesis and morphology of which can have a significant impact on how
land can be used in a sustainable manner. The spatial distribution of these soil
properties and processes can help land managers ensure lands are used responsibly
while avoiding adverse environmental impacts. In addition, those involved in intensive
86
land use practices must take many soil properties and associated agricultural,
engineering and other interpretations into account when implementing those practices.
As precision agriculture becomes a more widespread practice, farming
interests have a desire for more detailed and timely soil information for their property.
Also, there is a growing desire to remediate many hectares of brownfields in our urban
areas. Most of these areas were industrial zones with the legacy of these activities
contained within the soil. Remediation and redevelopment require substantial
investments to provide a healthy land surface for multiple uses. Since many of these
opportunities are time-sensitive, it is critical that stakeholders have all the information
they need in an accurate and reasonable time-frame so they can plan effectively
alternative land use scenarios.
Historically, detailed soil property analyses have been conducted at only a few
laboratories across the United States. While these laboratories strive to do their best
given the available resources, this has resulted in a significant processing backlog.
Some NRCS field offices have expressed interest in using local land-grant university
soil testing laboratories to expedite and supplement their soil survey update operations
by performing the more routine analyses that overload the national laboratories that
focus on more complex and time-consuming soil characterization procedures.
Movement towards a more distributed model of soil information collection and
soil characterization offer several significant advantages. First, local soil testing
laboratories have an extensive knowledge base about the soils within their service
area. They are then in a position to design their analysis procedures to account for
special conditions, such as elevated carbonates in certain areas. Second, these
analytical laboratories typically have a smaller number of customers than larger
national laboratories. This offers the customer a higher level of service, as individual
concerns can be more easily addressed. Third, local facilities typically offer shorter
87
response times for selected analytical tests. While NRCS field offices will continue to
submit samples to the NSSC for analyses and to contribute and maintain national soil
survey databases, they will be able to refine their soil survey products earlier and more
rapidly disseminate soil information to their stakeholders. These customers can then
modify their land use practices more quickly, reducing potentially deleterious effects
on the environment.
Soil property values produced by local soil analytical laboratories must be as
accurate and timely to have any value at complementing national laboratories. The
objective of this study was to assess the accuracy and precision of soil characterization
data derived from both the NSSC Soil Survey Laboratory, currently considered the
standard for NRCS soil survey operations, and the Cornell Nutrient Analysis
Laboratory (CNAL) at Cornell University.
Methods and Materials
Paired samples of soils collected as part of ongoing soil survey programs in
Allegany and Ontario Counties in New York were submitted to both the NSSC and
CNAL. As these laboratories have different conventions for presenting results, soil
characterization data were compiled into one master dataset. To ensure that
appropriate comparisons are made, the analytical methods of each laboratory were
reviewed. Generally, the soil properties of interest were measured using equivalent
procedures, so adjustments or omissions of selected analytical tests were unnecessary.
Simple linear regression techniques and paired t-tests were used to assess the
relationship of soil characterization data derived by NSSC and CNAL for duplicate
88
samples. Specifically, the calculated regression coefficients and correlation are used to
quantify this relationship.
Results and Discussion
In general, the comparison of NSSC and CNAL laboratory values indicates
that there is substantial consistency of measure between the two laboratories. While
the correlation (see Table 4.1 and Figures 4.1 – 4.6) was highest for the textural
components % sand, % silt and % clay, the most consistent results (as determined by
the computed slope) were obtained for pH and % Clay. Each had intercepts near zero
as well, which indicates similarity between data generated by these two analytical
laboratories. While % N had the lowest intercept, the regression slope is relatively low
(further from 1.0 than the other soil properties), as is the correlation coefficient. A
relatively high slope and a low intercept for the regression model for % Silt also
indicates an over-prediction by CNAL in comparison to NSSC. Paired t-test results
indicate high similarity for % N, % sand and % silt at the 0.05 significance level.
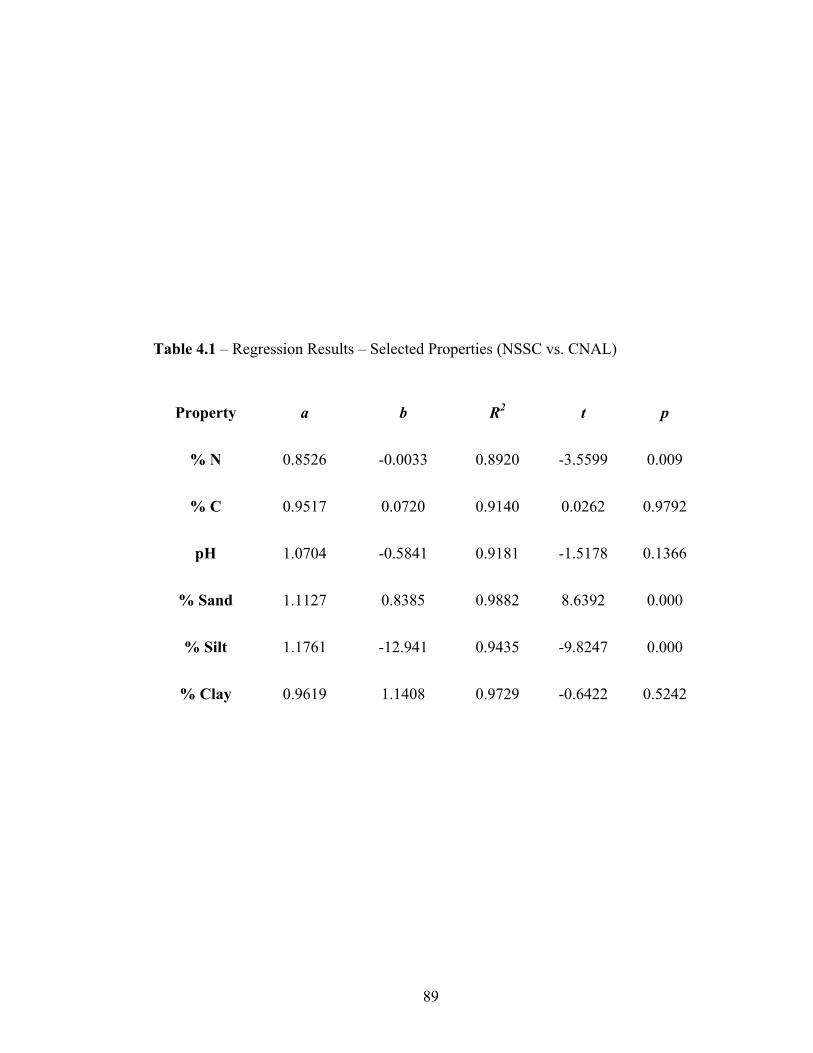
89
Table 4.1 – Regression Results – Selected Properties (NSSC vs. CNAL)
Property a b R2 t p
% N 0.8526 -0.0033 0.8920 -3.5599 0.009
% C 0.9517 0.0720 0.9140 0.0262 0.9792
pH 1.0704 -0.5841 0.9181 -1.5178 0.1366
% Sand 1.1127 0.8385 0.9882 8.6392 0.000
% Silt 1.1761 -12.941 0.9435 -9.8247 0.000
% Clay 0.9619 1.1408 0.9729 -0.6422 0.5242
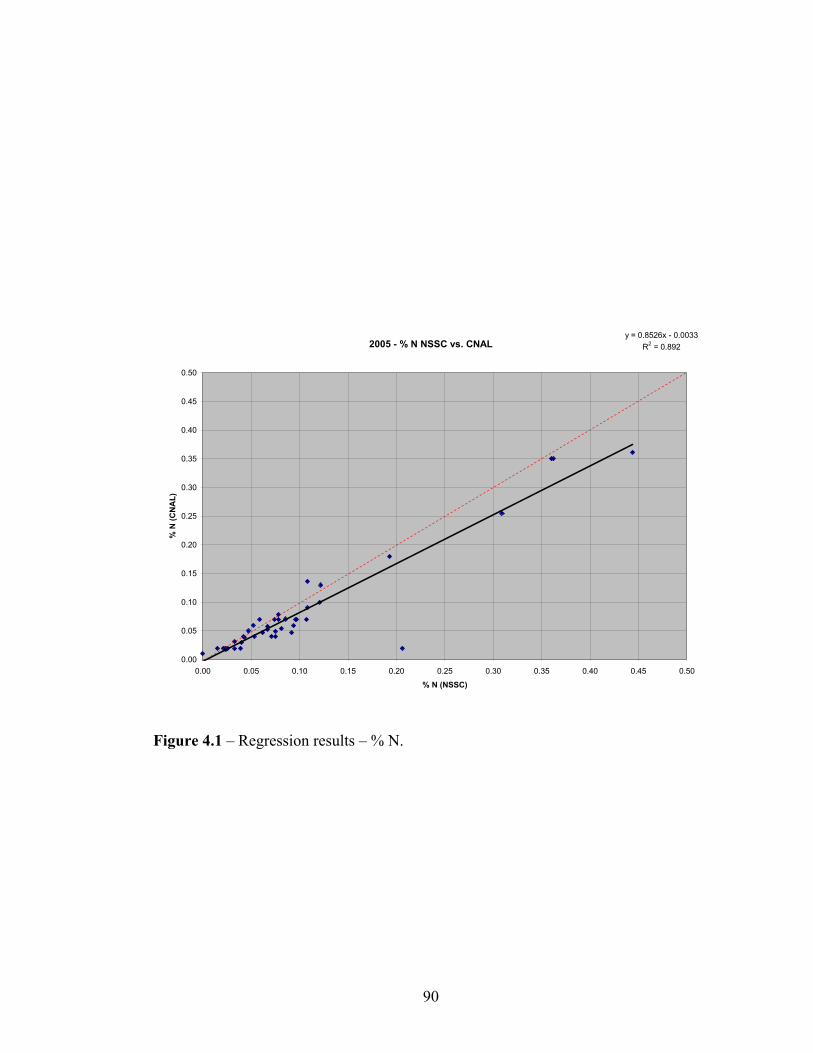
90
2005 - % N NSSC vs. CNALy = 0.8526x - 0.0033
R2 = 0.892
0.00
0.05
0.10
0.15
0.20
0.25
0.30
0.35
0.40
0.45
0.50
0.00 0.05 0.10 0.15 0.20 0.25 0.30 0.35 0.40 0.45 0.50
% N (NSSC)
% N
(CN
AL)
Figure 4.1 – Regression results – % N.
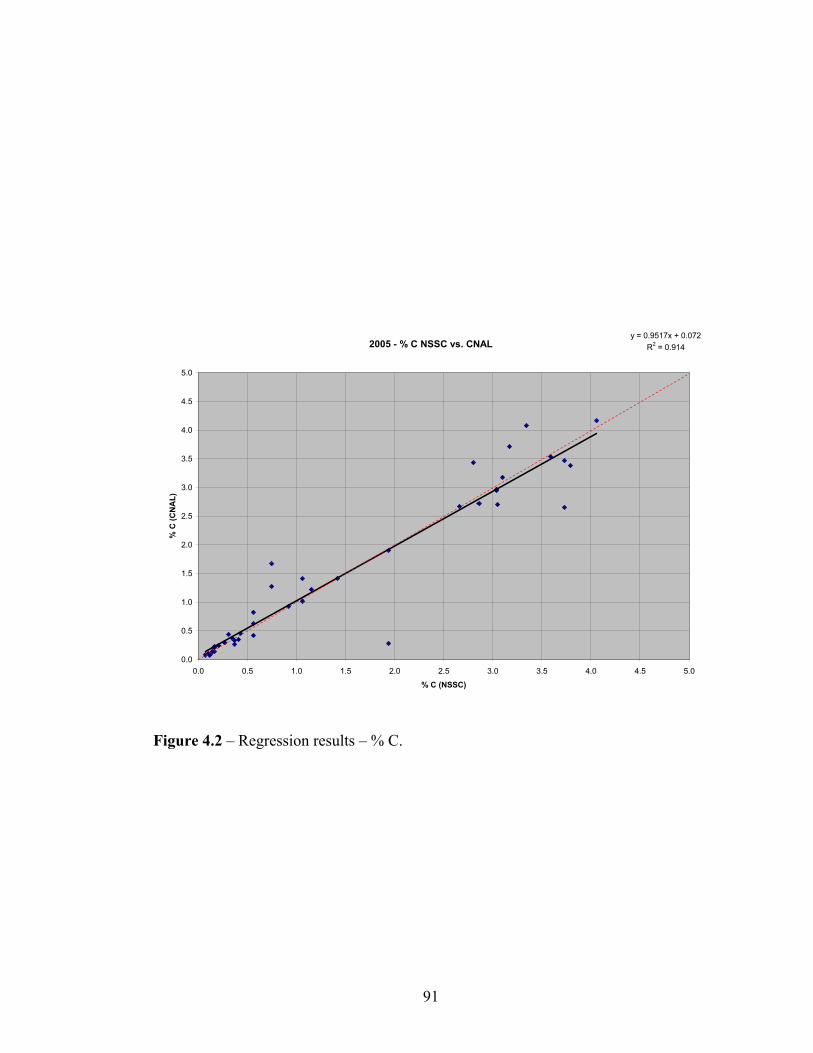
91
2005 - % C NSSC vs. CNALy = 0.9517x + 0.072
R2 = 0.914
0.0
0.5
1.0
1.5
2.0
2.5
3.0
3.5
4.0
4.5
5.0
0.0 0.5 1.0 1.5 2.0 2.5 3.0 3.5 4.0 4.5 5.0
% C (NSSC)
% C
(CN
AL)
Figure 4.2 – Regression results – % C.
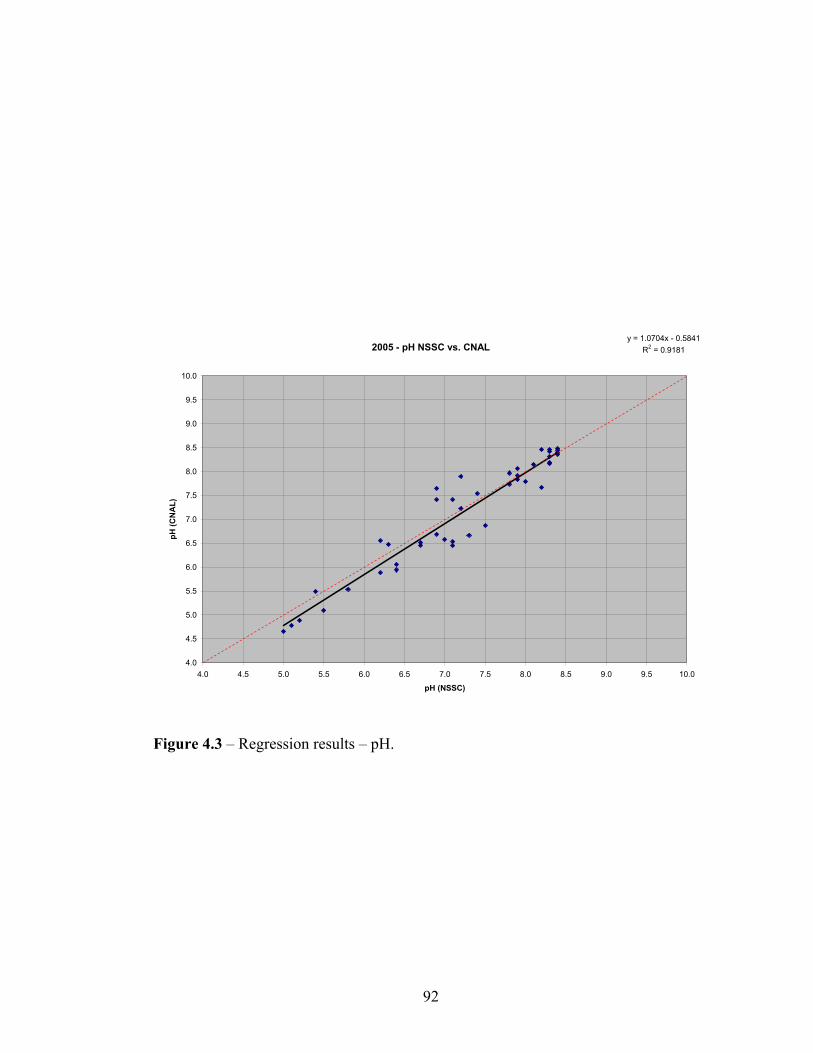
92
2005 - pH NSSC vs. CNALy = 1.0704x - 0.5841
R2 = 0.9181
4.0
4.5
5.0
5.5
6.0
6.5
7.0
7.5
8.0
8.5
9.0
9.5
10.0
4.0 4.5 5.0 5.5 6.0 6.5 7.0 7.5 8.0 8.5 9.0 9.5 10.0
pH (NSSC)
pH (C
NA
L)
Figure 4.3 – Regression results – pH.
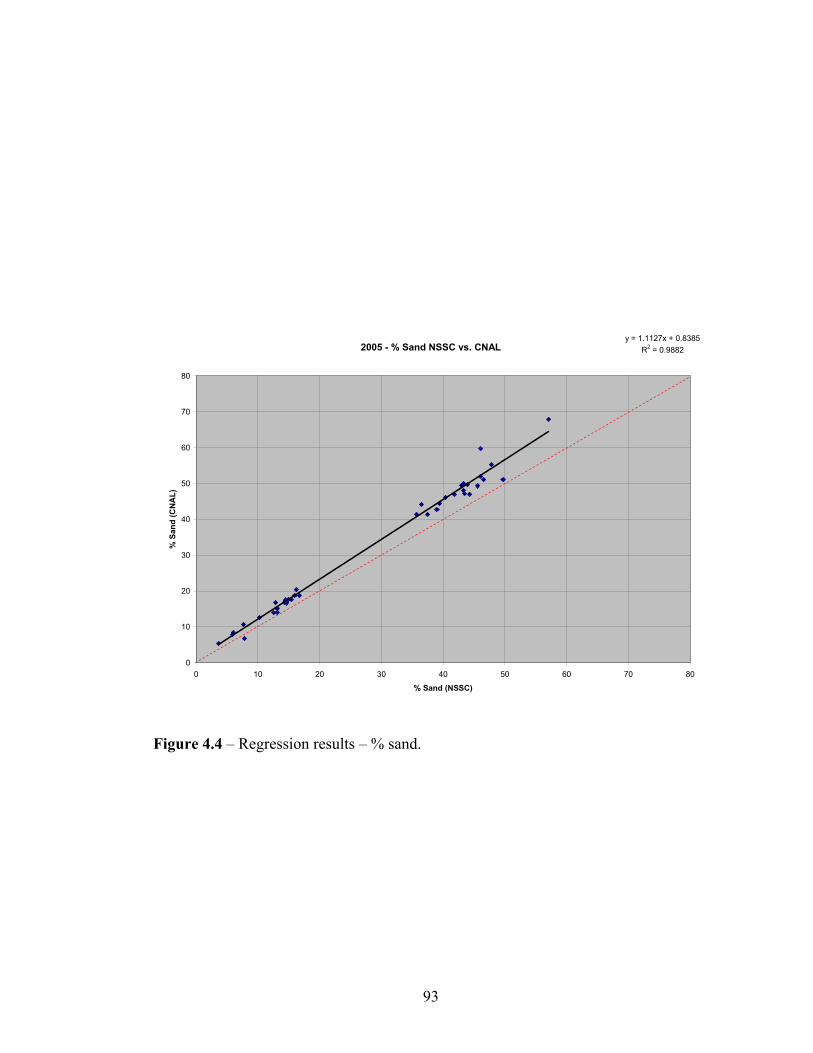
93
2005 - % Sand NSSC vs. CNALy = 1.1127x + 0.8385
R2 = 0.9882
0
10
20
30
40
50
60
70
80
0 10 20 30 40 50 60 70 80
% Sand (NSSC)
% S
and
(CN
AL)
Figure 4.4 – Regression results – % sand.
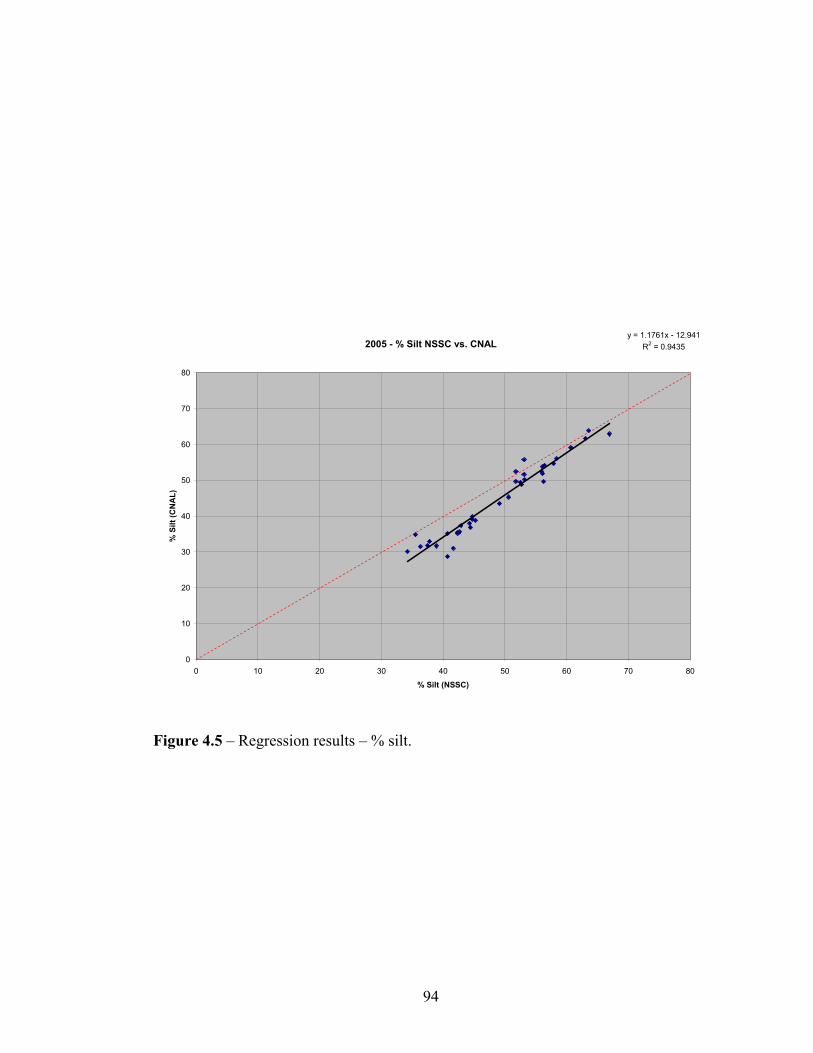
94
2005 - % Silt NSSC vs. CNALy = 1.1761x - 12.941
R2 = 0.9435
0
10
20
30
40
50
60
70
80
0 10 20 30 40 50 60 70 80
% Silt (NSSC)
% S
ilt (C
NA
L)
Figure 4.5 – Regression results – % silt.
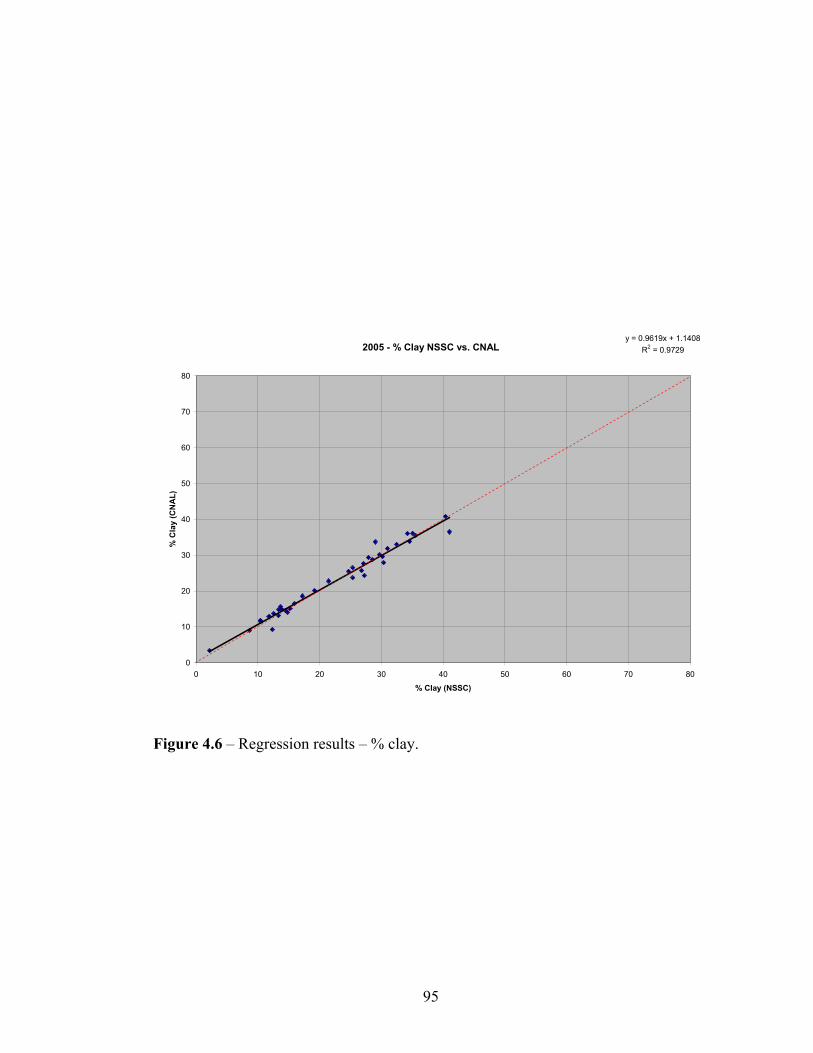
95
2005 - % Clay NSSC vs. CNALy = 0.9619x + 1.1408
R2 = 0.9729
0
10
20
30
40
50
60
70
80
0 10 20 30 40 50 60 70 80
% Clay (NSSC)
% C
lay
(CN
AL)
Figure 4.6 – Regression results – % clay.
96
Although this study has a relatively low sample size (N = 31), sources of error
should be minimal as both laboratories employ industry-standard methods for
measuring soil properties. However, systematic error created through lab operators’
individual standards could be responsible for some of the variance between the NSSC
and CNAL lab results. A possible means to account for this would be to include
samples from a broader time period, which would then be processed by multiple
technicians, and broader range of soil property values.
Nevertheless, regression models such as those developed for this study can
help local practitioners standardize results from regional laboratories with those
produced at the national level. If regional laboratories become the primary lab analysis
center for NRCS soil scientists and other interests in their service area, these results
will aid in providing an acceptable level of consistency between recently acquired data
and historical data produced at national laboratories. This will allow them to take
advantage of rapid data return without sacrificing the context which these older
records afford.
97
Chapter 5: Research Findings and Recommendations for Future Research
Research Findings
This study clearly demonstrated the potential of proximal sensing using
visible-near infrared diffuse reflectance spectroscopy (VNIR DRS) in the estimation
of selected soil physical and chemical properties. Conventional laboratory-based
methods employed in this study yielded results consistent with previous studies, with
most R2 values in excess of 0.85. Field-based methods implemented in situ yielded
results which performed similarly to laboratory-based methods. Where model-
performance measures were undesirable, likely sources of error include small sample
sizes and excess moisture in the field, which has been shown to degrade signal
performance.
An efficient workflow was also developed for computing an accurate
estimation of the spatial distribution of selected soil physical and chemical properties
using PLS1 regression and ordinary kriging. While the products created were
generally within acceptable error tolerances, a larger sample size and a more robust
prediction model would reduce these estimation errors. Finally, a comparative
assessment of soil characterization data collected by CNAL and NSSC demonstrated
substantial agreement between the two laboratories. The results can help local
practitioners obtain data more rapidly through local laboratories, while still allowing
them to compare them with data received through national laboratories.
In conclusion, the results of this work suggest that advanced proximal sensing
techniques are worthy of additional study to assess the full potential of this
technology. Before this VNIR DRS is deployed for field operations, it is critical that
98
potential users have the information they need to use it intelligently, if at all.
Hopefully, this study represents the start of efforts to enhance our understanding of
which field conditions are conducive to the effective use of this proximal sensing
technology.
Recommendations for Future Research
Future research will focus on integrating proximal VNIR diffuse reflectance
spectroscopy with remotely-sensed and digitally mapped environmental information
for predictive landscape-scale analyses of soil properties. Current efforts in soil-
landscape interaction modeling (e.g., SoLIM) are an attempt to characterize and refine
the relationship between soil morphology and landscape-specific soil forming factors.
As DRS has the potential to accurately predict key soil properties, data collected using
this method could improve model performance and predictive soil mapping (PSM) in
general.
Areas of fruitful research will be in the integration of predictive soil mapping
and diffuse reflectance spectroscopy (DRS). Study areas are best where SSURGO soil
geographic data have been compiled, validated and digitized for the entire study area
and detailed landscape information is also widely available. Field work may include
developing a spectral library for archived soil samples, collecting spectral samples for
benchmark soils in the study area, inventorying cultural assets in the soil profile and
exploring use of DRS for sub-aqueous soil sampling and mapping.
These data will be used to determine the relationship between key landscape
factors using PLS1 regression prediction and the following environmental covariates,
to name a few:
99
• Surficial geology
• Drainage
• Land-use / land-cover
• Climate
• Terrain
Expected outcomes for such studies include a comprehensive spectral library, a
DRS suitability map, and a set of robust PLS1 regression prediction models for
selected key soil properties. This information will help NRCS soil survey staff make
informed decisions regarding the deployment of this technology in the future and help
them develop a soil properties prediction system which they deem most useful in
supporting field operations.
Continuing efforts will be an extension of research reported in this thesis.
Spectral library and prediction model development will continue in parallel with soil
survey update operations in selected locations. Accommodations for larger sample
sizes and a greater variety of soil types will likely help improve model performance
and widen applicability to other parts of the country.
Eventually DRS, as a stand alone technology or in concert with modern soil
survey and PSM, will be used to rapidly generate comprehensive and accurate soil
characterization reports for a variety of users. Applications could include an
automated soil classification program which could be used to complement
conventional methods and resolve ambiguous cases. In addition, agricultural interests
could use the technology to modify fertilizer application rates, provide potential cost-
savings to land use operations, and enhance land stewardship through reduction of
land use practices that may be degrading the environment. In any case, sound
information will be needed in order for DRS technology to be utilized to its full and
appropriate potential, which requires continued investments in future research.
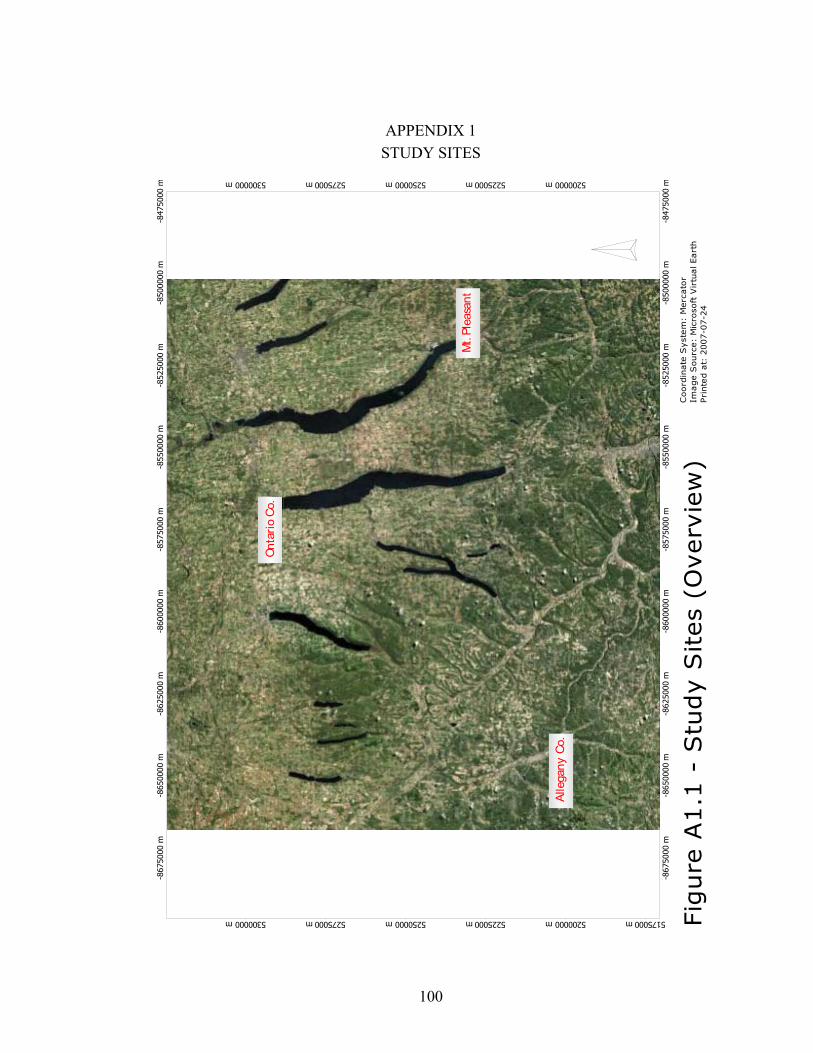
100
APPENDIX 1 STUDY SITES
Alle
gany
Co.
Mt.
Plea
sant
Onta
rio C
o.
-847
5000
m-8
5000
00 m
-852
5000
m-8
5500
00 m
-857
5000
m-8
6000
00 m
-862
5000
m-8
6500
00 m
-867
5000
m
-847
5000
m-8
5000
00 m
-852
5000
m-8
5500
00 m
-857
5000
m-8
6000
00 m
-862
5000
m-8
6500
00 m
-867
5000
m
5300000 m 5275000 m 5250000 m 5225000 m 5200000 m
5300000 m 5275000 m 5250000 m 5225000 m 5200000 m 5175000 m Fig
ure
A1.1
- S
tudy S
ites
(Overv
iew
)C
oord
inate
Syst
em
: M
erc
ato
rIm
age S
ourc
e:
Mic
roso
ft V
irtu
al Eart
hPri
nte
d a
t: 2
007-0
7-2
4
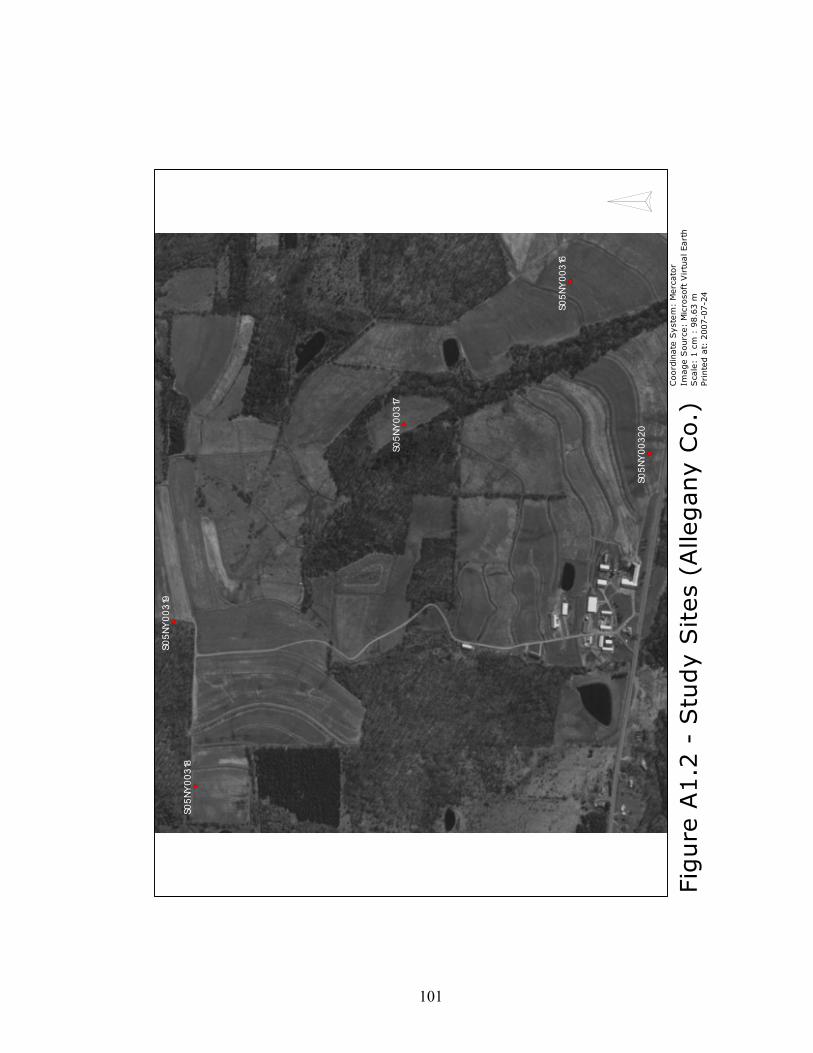
101
S05N
Y00
316
S05N
Y00
317
S05N
Y00
318
S05N
Y00
319
S05N
Y00
320
Figure
A1.2
- S
tudy S
ites
(Alle
gany C
o.)
Coord
inate
Syst
em
: M
erc
ato
rIm
age S
ourc
e:
Mic
roso
ft V
irtu
al Eart
hS
cale
: 1 c
m :
98.6
3 m
Pri
nte
d a
t: 2
007-0
7-2
4
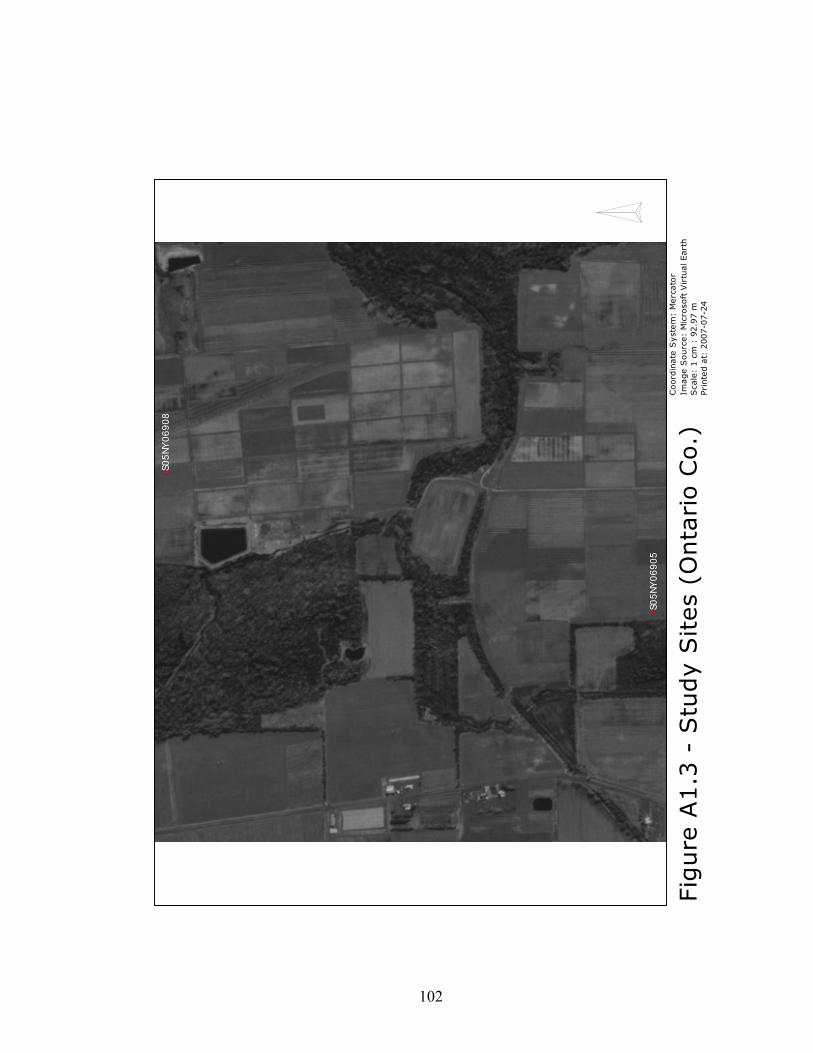
102
S05N
Y06
905
S05N
Y06
908
Figure
A1.3
- S
tudy S
ites
(Onta
rio C
o.)
Coord
inate
Syst
em
: M
erc
ato
rIm
age S
ourc
e:
Mic
roso
ft V
irtu
al Eart
hS
cale
: 1 c
m :
92.9
7 m
Pri
nte
d a
t: 2
007-0
7-2
4
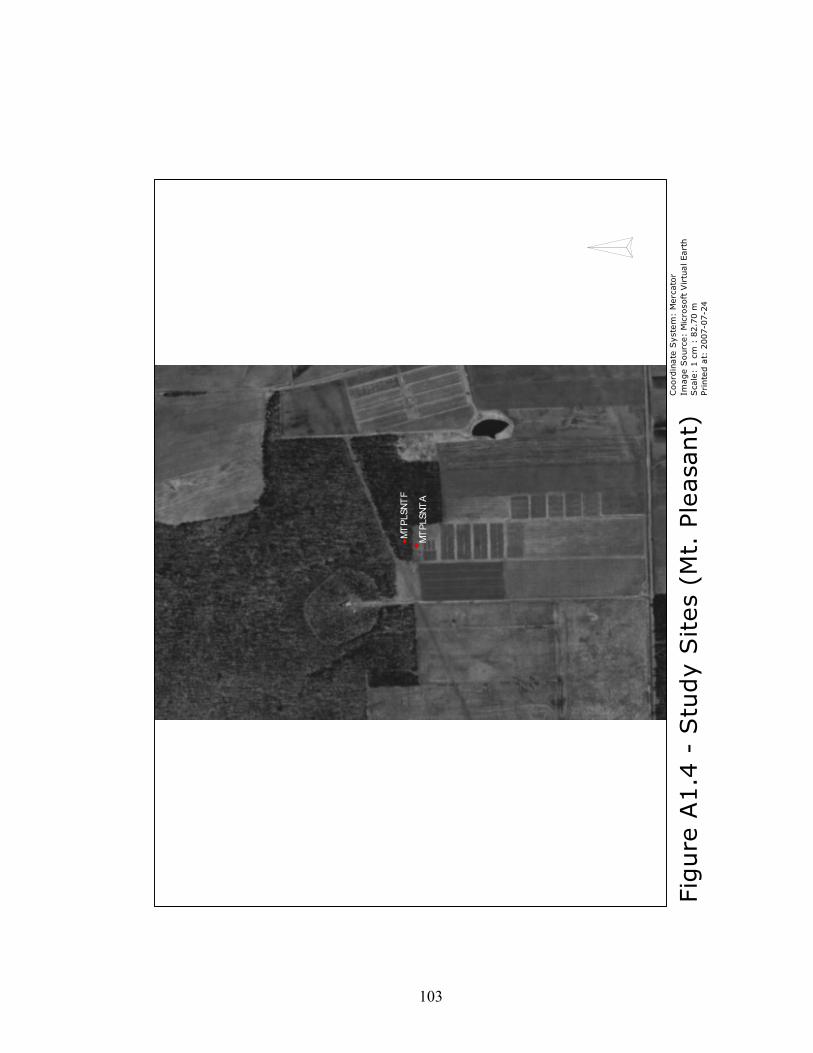
103
MT
PLSN
T A
MT
PLSN
T F
Figure
A1.4
- S
tudy S
ites
(Mt.
Ple
asa
nt)
Coord
inate
Syst
em
: M
erc
ato
rIm
age S
ourc
e:
Mic
roso
ft V
irtu
al Eart
hS
cale
: 1 c
m :
82.7
0 m
Pri
nte
d a
t: 2
007-0
7-2
4
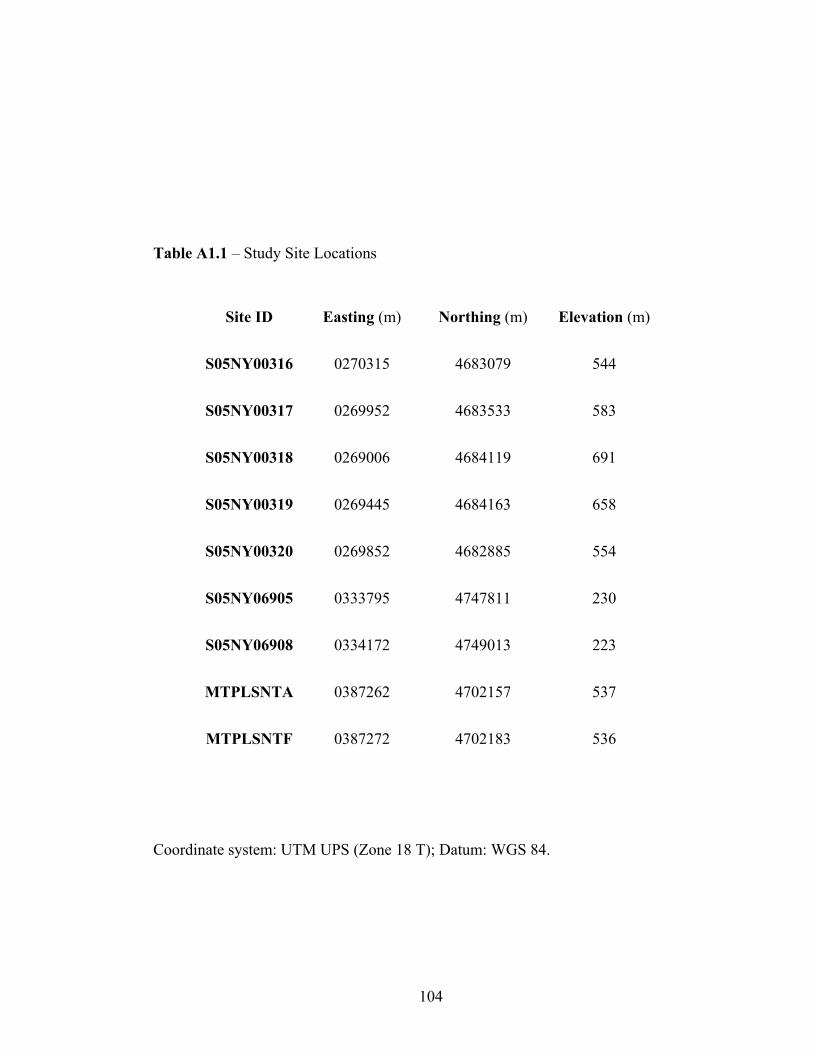
104
Table A1.1 – Study Site Locations
Site ID Easting (m) Northing (m) Elevation (m)
S05NY00316 0270315 4683079 544
S05NY00317 0269952 4683533 583
S05NY00318 0269006 4684119 691
S05NY00319 0269445 4684163 658
S05NY00320 0269852 4682885 554
S05NY06905 0333795 4747811 230
S05NY06908 0334172 4749013 223
MTPLSNTA 0387262 4702157 537
MTPLSNTF 0387272 4702183 536
Coordinate system: UTM UPS (Zone 18 T); Datum: WGS 84.

105
APPENDIX 2 LABORATORY RESULTS
Table A2.1 – Property value ranges – Allegany County (2004).
Property Lab (CNAL)
N = 27
Lab (NSSC)
N = 27
% N 0.03 – 0.25 0.03 – 1.18
% C 0.12 – 2.76 0.13 – 2.93
% OM LOI 1.11 – 6.94 N/A
pH 5.05 – 7.53 5.30 – 7.80
% Clay 8.74 – 26.74 9.30 – 26.70
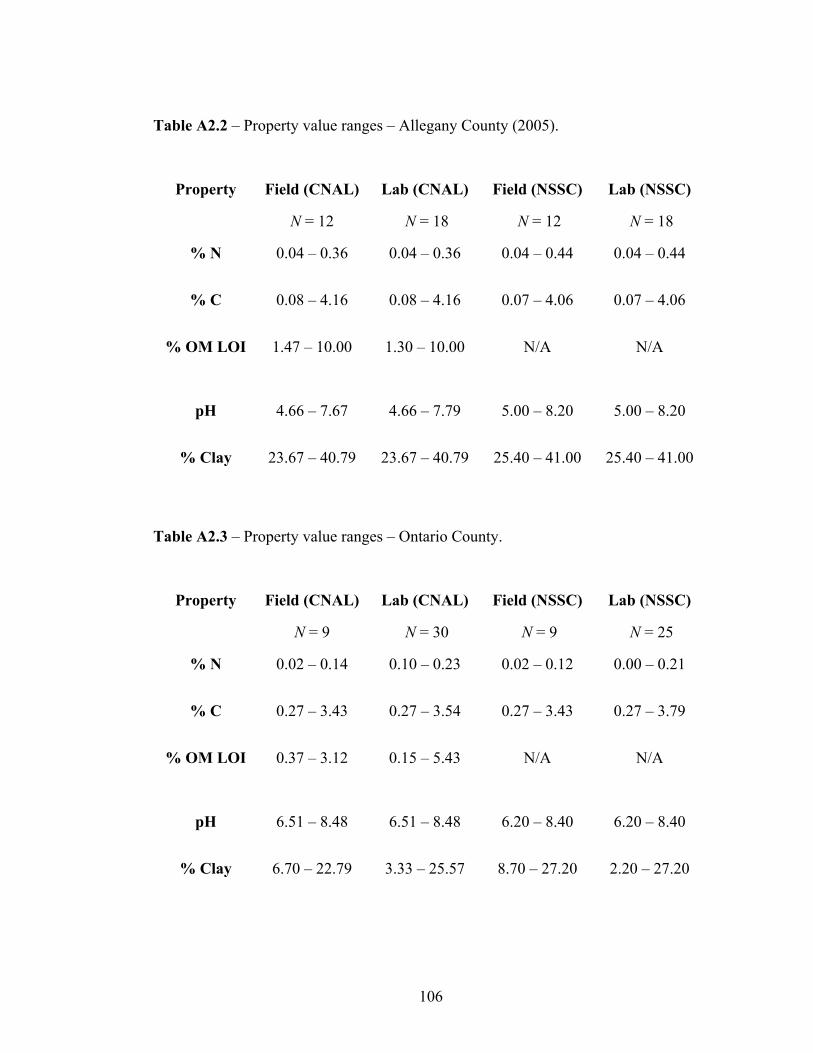
106
Table A2.2 – Property value ranges – Allegany County (2005).
Property Field (CNAL)
N = 12
Lab (CNAL)
N = 18
Field (NSSC)
N = 12
Lab (NSSC)
N = 18
% N 0.04 – 0.36 0.04 – 0.36 0.04 – 0.44 0.04 – 0.44
% C 0.08 – 4.16 0.08 – 4.16 0.07 – 4.06 0.07 – 4.06
% OM LOI 1.47 – 10.00 1.30 – 10.00 N/A
N/A
pH 4.66 – 7.67 4.66 – 7.79 5.00 – 8.20 5.00 – 8.20
% Clay 23.67 – 40.79 23.67 – 40.79 25.40 – 41.00 25.40 – 41.00
Table A2.3 – Property value ranges – Ontario County.
Property Field (CNAL)
N = 9
Lab (CNAL)
N = 30
Field (NSSC)
N = 9
Lab (NSSC)
N = 25
% N 0.02 – 0.14 0.10 – 0.23 0.02 – 0.12 0.00 – 0.21
% C 0.27 – 3.43 0.27 – 3.54 0.27 – 3.43 0.27 – 3.79
% OM LOI 0.37 – 3.12 0.15 – 5.43 N/A
N/A
pH 6.51 – 8.48 6.51 – 8.48 6.20 – 8.40 6.20 – 8.40
% Clay 6.70 – 22.79 3.33 – 25.57 8.70 – 27.20 2.20 – 27.20
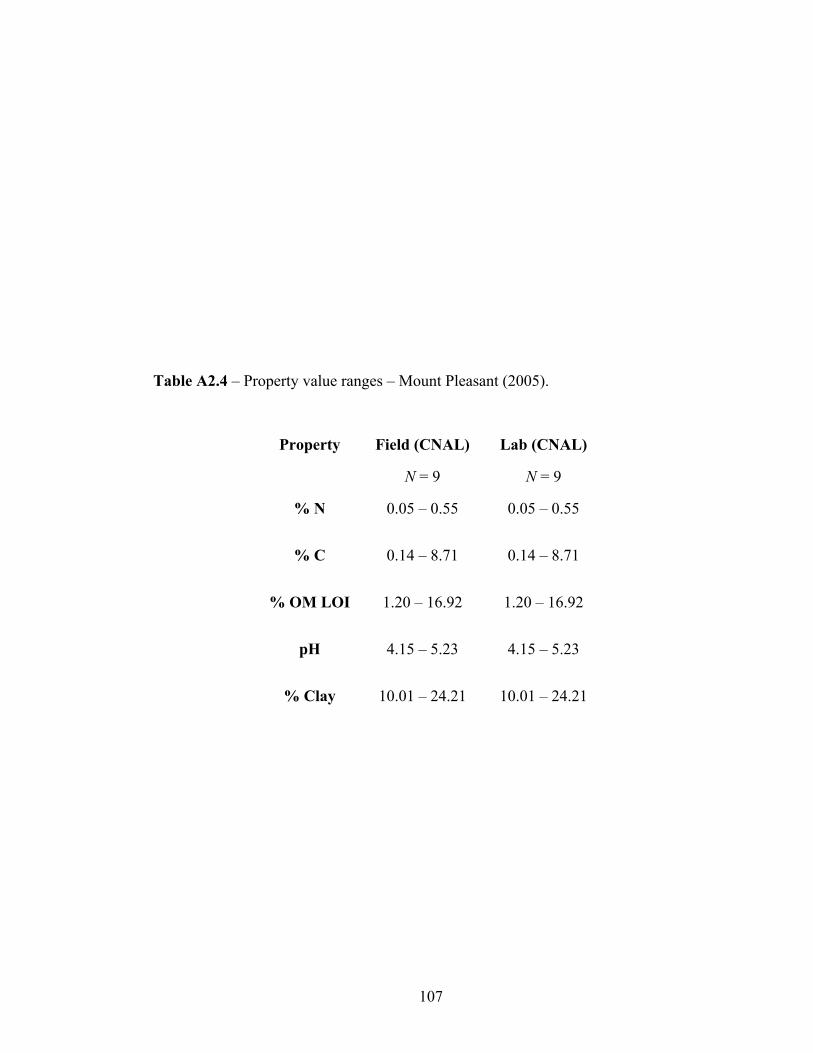
107
Table A2.4 – Property value ranges – Mount Pleasant (2005).
Property Field (CNAL)
N = 9
Lab (CNAL)
N = 9
% N 0.05 – 0.55 0.05 – 0.55
% C 0.14 – 8.71 0.14 – 8.71
% OM LOI 1.20 – 16.92 1.20 – 16.92
pH 4.15 – 5.23 4.15 – 5.23
% Clay 10.01 – 24.21 10.01 – 24.21
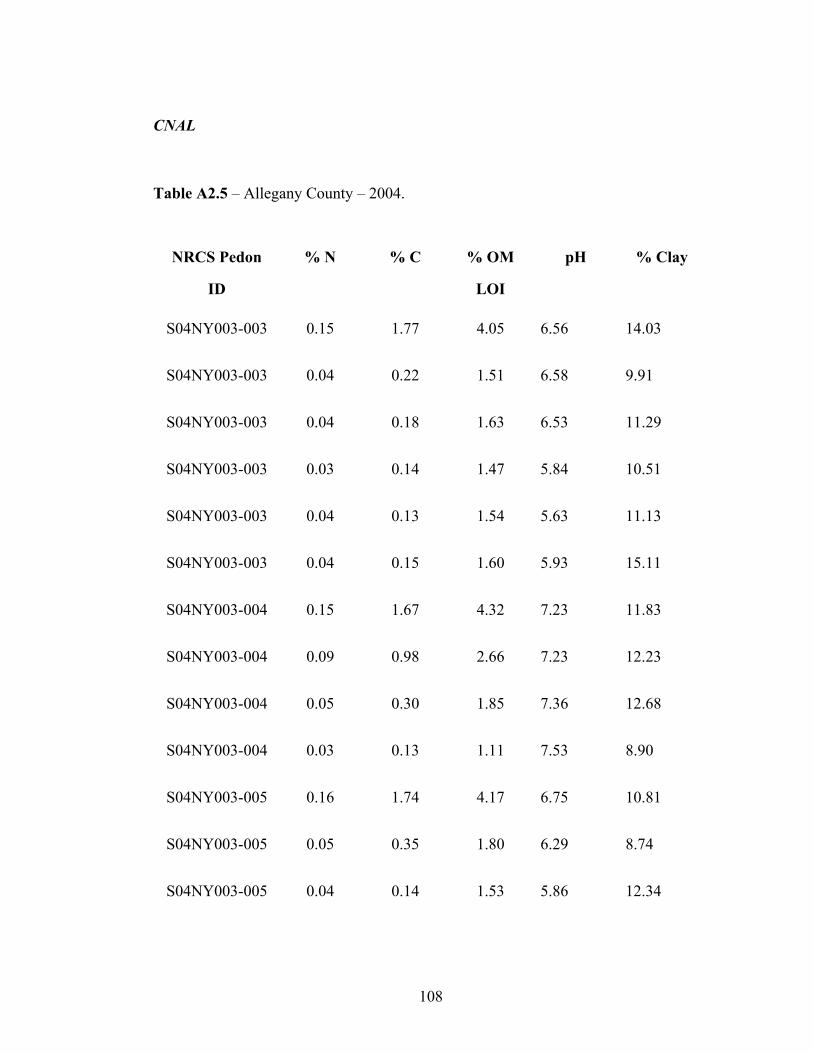
108
CNAL
Table A2.5 – Allegany County – 2004.
NRCS Pedon
ID
% N % C % OM
LOI
pH % Clay
S04NY003-003 0.15 1.77 4.05 6.56 14.03
S04NY003-003 0.04 0.22 1.51 6.58 9.91
S04NY003-003 0.04 0.18 1.63 6.53 11.29
S04NY003-003 0.03 0.14 1.47 5.84 10.51
S04NY003-003 0.04 0.13 1.54 5.63 11.13
S04NY003-003 0.04 0.15 1.60 5.93 15.11
S04NY003-004 0.15 1.67 4.32 7.23 11.83
S04NY003-004 0.09 0.98 2.66 7.23 12.23
S04NY003-004 0.05 0.30 1.85 7.36 12.68
S04NY003-004 0.03 0.13 1.11 7.53 8.90
S04NY003-005 0.16 1.74 4.17 6.75 10.81
S04NY003-005 0.05 0.35 1.80 6.29 8.74
S04NY003-005 0.04 0.14 1.53 5.86 12.34
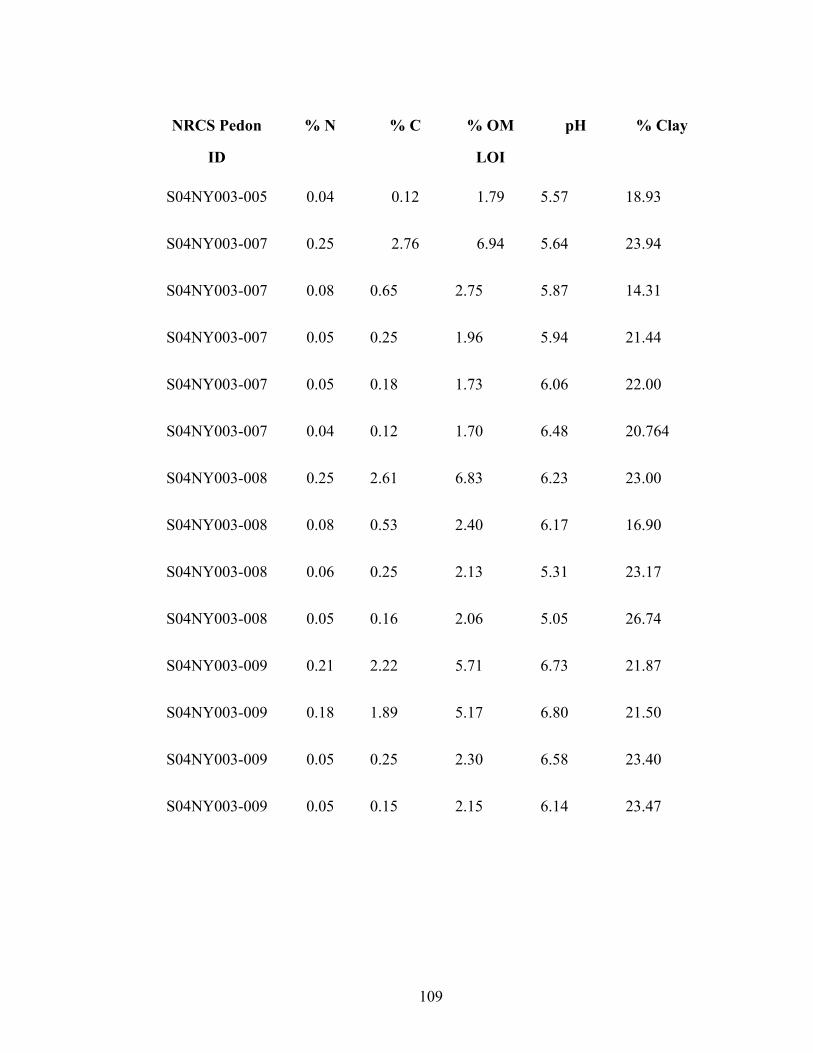
109
NRCS Pedon
ID
% N % C % OM
LOI
pH % Clay
S04NY003-005 0.04 0.12 1.79 5.57 18.93
S04NY003-007 0.25 2.76 6.94 5.64 23.94
S04NY003-007 0.08 0.65 2.75 5.87 14.31
S04NY003-007 0.05 0.25 1.96 5.94 21.44
S04NY003-007 0.05 0.18 1.73 6.06 22.00
S04NY003-007 0.04 0.12 1.70 6.48 20.764
S04NY003-008 0.25 2.61 6.83 6.23 23.00
S04NY003-008 0.08 0.53 2.40 6.17 16.90
S04NY003-008 0.06 0.25 2.13 5.31 23.17
S04NY003-008 0.05 0.16 2.06 5.05 26.74
S04NY003-009 0.21 2.22 5.71 6.73 21.87
S04NY003-009 0.18 1.89 5.17 6.80 21.50
S04NY003-009 0.05 0.25 2.30 6.58 23.40
S04NY003-009 0.05 0.15 2.15 6.14 23.47
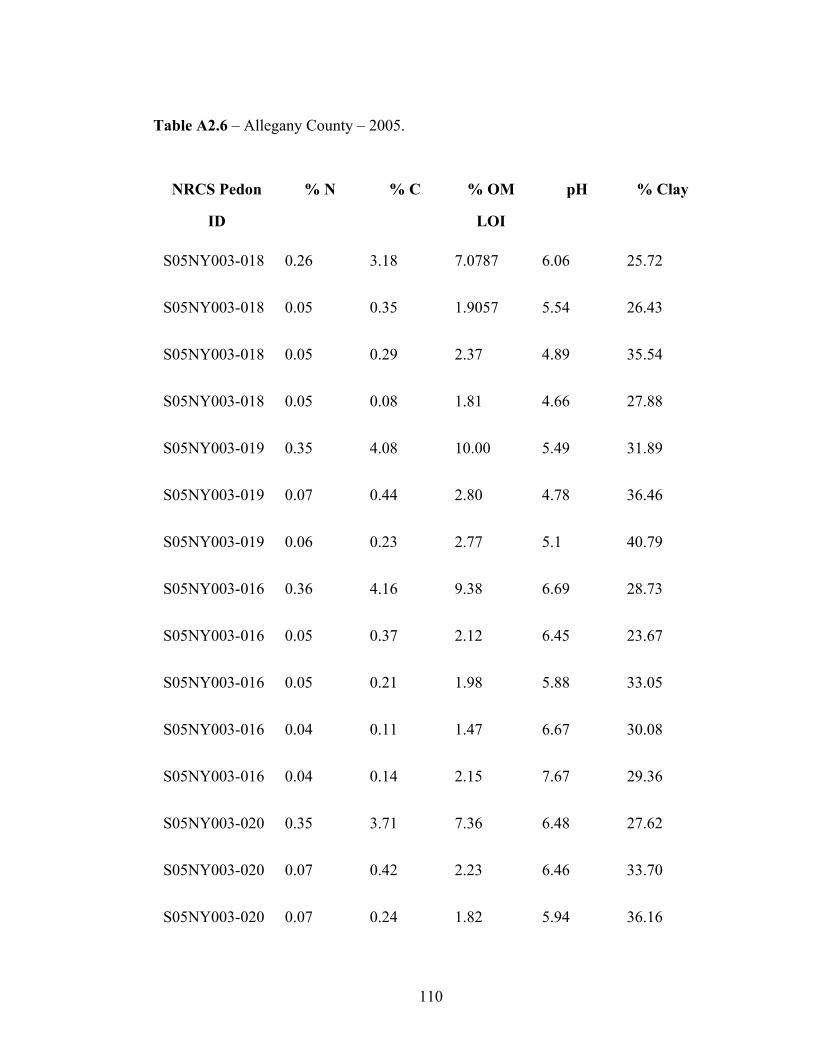
110
Table A2.6 – Allegany County – 2005.
NRCS Pedon
ID
% N % C % OM
LOI
pH % Clay
S05NY003-018 0.26 3.18 7.0787 6.06 25.72
S05NY003-018 0.05 0.35 1.9057 5.54 26.43
S05NY003-018 0.05 0.29 2.37 4.89 35.54
S05NY003-018 0.05 0.08 1.81 4.66 27.88
S05NY003-019 0.35 4.08 10.00 5.49 31.89
S05NY003-019 0.07 0.44 2.80 4.78 36.46
S05NY003-019 0.06 0.23 2.77 5.1 40.79
S05NY003-016 0.36 4.16 9.38 6.69 28.73
S05NY003-016 0.05 0.37 2.12 6.45 23.67
S05NY003-016 0.05 0.21 1.98 5.88 33.05
S05NY003-016 0.04 0.11 1.47 6.67 30.08
S05NY003-016 0.04 0.14 2.15 7.67 29.36
S05NY003-020 0.35 3.71 7.36 6.48 27.62
S05NY003-020 0.07 0.42 2.23 6.46 33.70
S05NY003-020 0.07 0.24 1.82 5.94 36.16
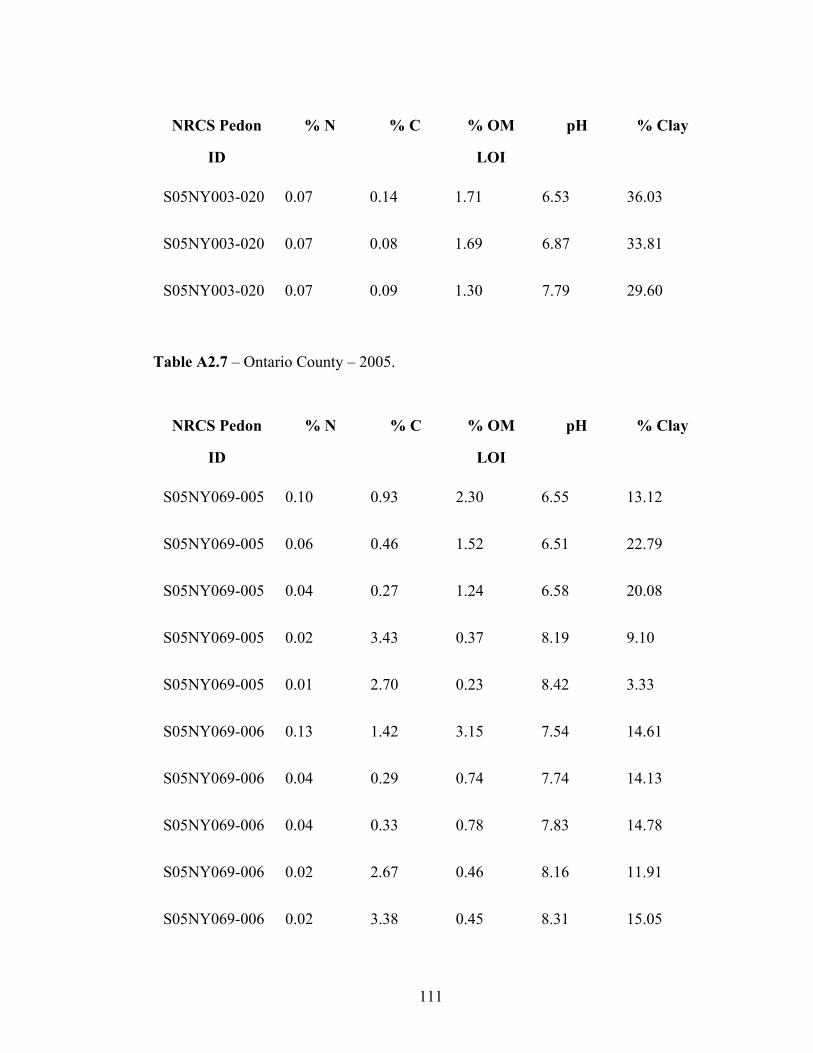
111
NRCS Pedon
ID
% N % C % OM
LOI
pH % Clay
S05NY003-020 0.07 0.14 1.71 6.53 36.03
S05NY003-020 0.07 0.08 1.69 6.87 33.81
S05NY003-020 0.07 0.09 1.30 7.79 29.60
Table A2.7 – Ontario County – 2005.
NRCS Pedon
ID
% N % C % OM
LOI
pH % Clay
S05NY069-005 0.10 0.93 2.30 6.55 13.12
S05NY069-005 0.06 0.46 1.52 6.51 22.79
S05NY069-005 0.04 0.27 1.24 6.58 20.08
S05NY069-005 0.02 3.43 0.37 8.19 9.10
S05NY069-005 0.01 2.70 0.23 8.42 3.33
S05NY069-006 0.13 1.42 3.15 7.54 14.61
S05NY069-006 0.04 0.29 0.74 7.74 14.13
S05NY069-006 0.04 0.33 0.78 7.83 14.78
S05NY069-006 0.02 2.67 0.46 8.16 11.91
S05NY069-006 0.02 3.38 0.45 8.31 15.05
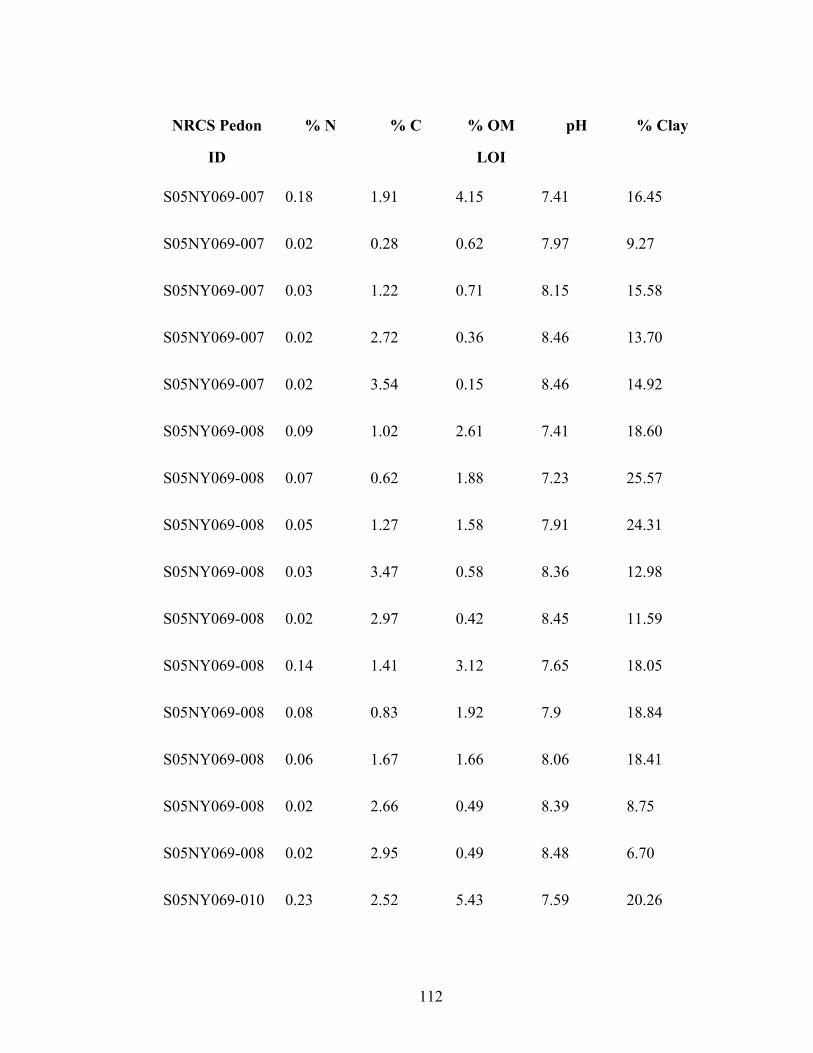
112
NRCS Pedon
ID
% N % C % OM
LOI
pH % Clay
S05NY069-007 0.18 1.91 4.15 7.41 16.45
S05NY069-007 0.02 0.28 0.62 7.97 9.27
S05NY069-007 0.03 1.22 0.71 8.15 15.58
S05NY069-007 0.02 2.72 0.36 8.46 13.70
S05NY069-007 0.02 3.54 0.15 8.46 14.92
S05NY069-008 0.09 1.02 2.61 7.41 18.60
S05NY069-008 0.07 0.62 1.88 7.23 25.57
S05NY069-008 0.05 1.27 1.58 7.91 24.31
S05NY069-008 0.03 3.47 0.58 8.36 12.98
S05NY069-008 0.02 2.97 0.42 8.45 11.59
S05NY069-008 0.14 1.41 3.12 7.65 18.05
S05NY069-008 0.08 0.83 1.92 7.9 18.84
S05NY069-008 0.06 1.67 1.66 8.06 18.41
S05NY069-008 0.02 2.66 0.49 8.39 8.75
S05NY069-008 0.02 2.95 0.49 8.48 6.70
S05NY069-010 0.23 2.52 5.43 7.59 20.26
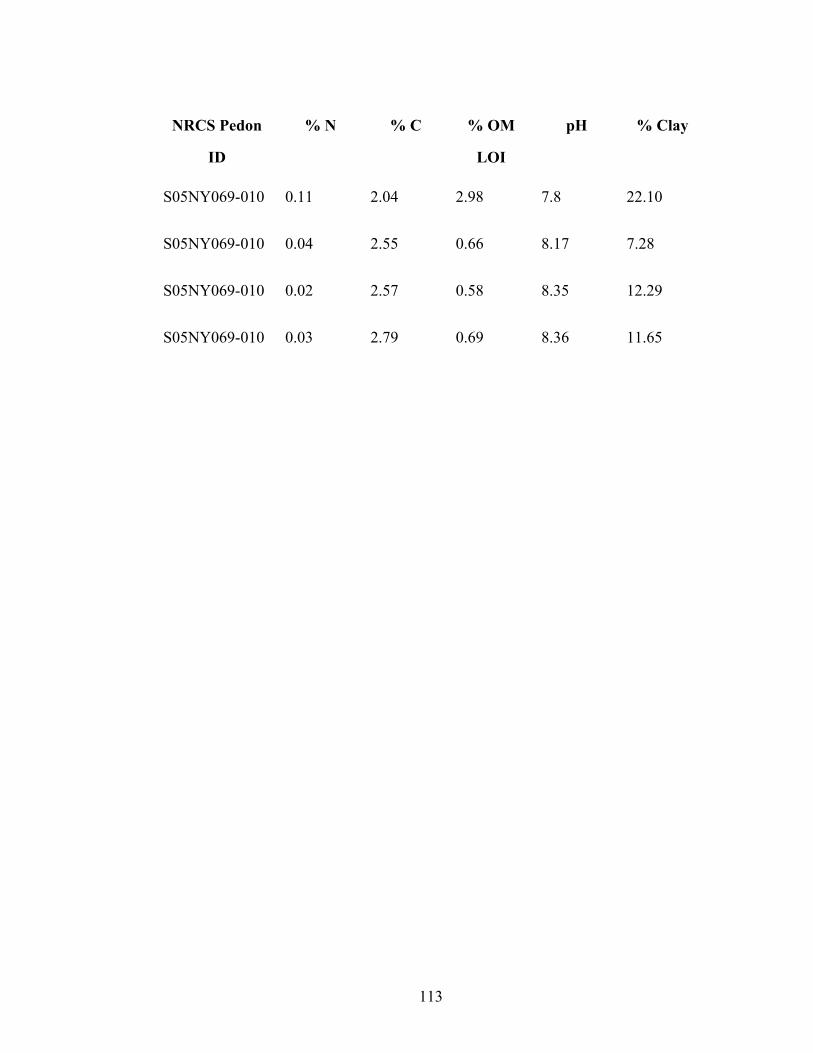
113
NRCS Pedon
ID
% N % C % OM
LOI
pH % Clay
S05NY069-010 0.11 2.04 2.98 7.8 22.10
S05NY069-010 0.04 2.55 0.66 8.17 7.28
S05NY069-010 0.02 2.57 0.58 8.35 12.29
S05NY069-010 0.03 2.79 0.69 8.36 11.65
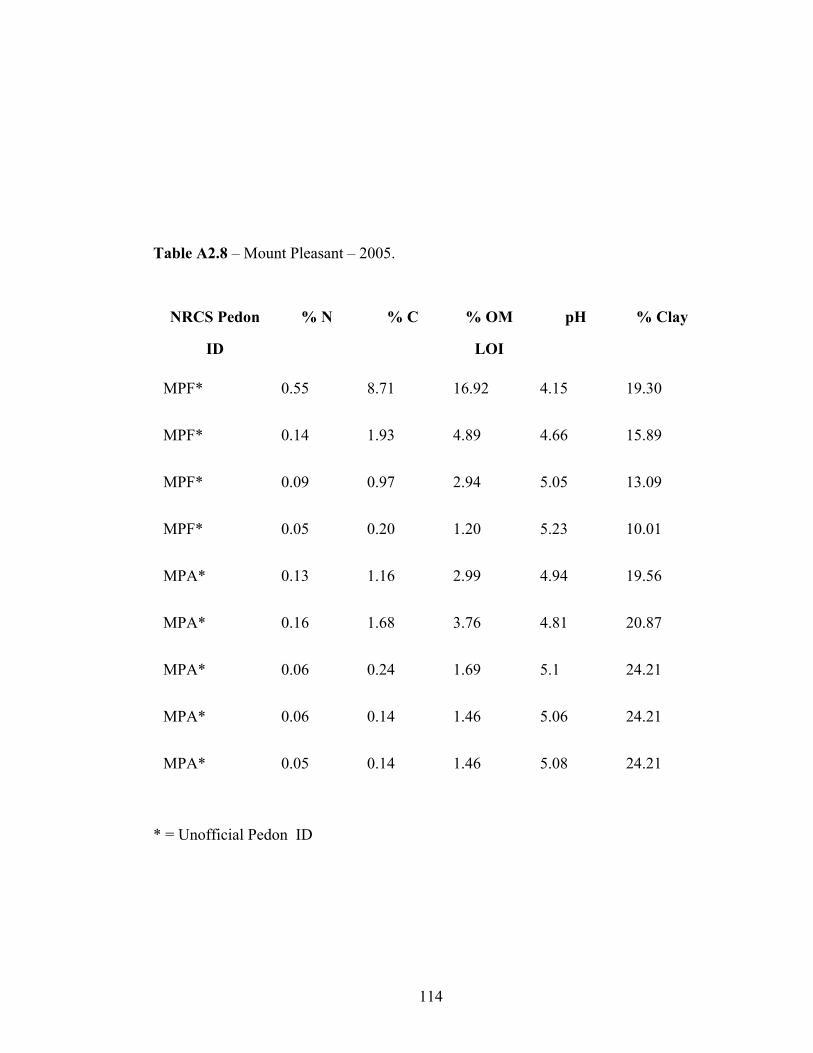
114
Table A2.8 – Mount Pleasant – 2005.
NRCS Pedon
ID
% N % C % OM
LOI
pH % Clay
MPF* 0.55 8.71 16.92 4.15 19.30
MPF* 0.14 1.93 4.89 4.66 15.89
MPF* 0.09 0.97 2.94 5.05 13.09
MPF* 0.05 0.20 1.20 5.23 10.01
MPA* 0.13 1.16 2.99 4.94 19.56
MPA* 0.16 1.68 3.76 4.81 20.87
MPA* 0.06 0.24 1.69 5.1 24.21
MPA* 0.06 0.14 1.46 5.06 24.21
MPA* 0.05 0.14 1.46 5.08 24.21
* = Unofficial Pedon ID
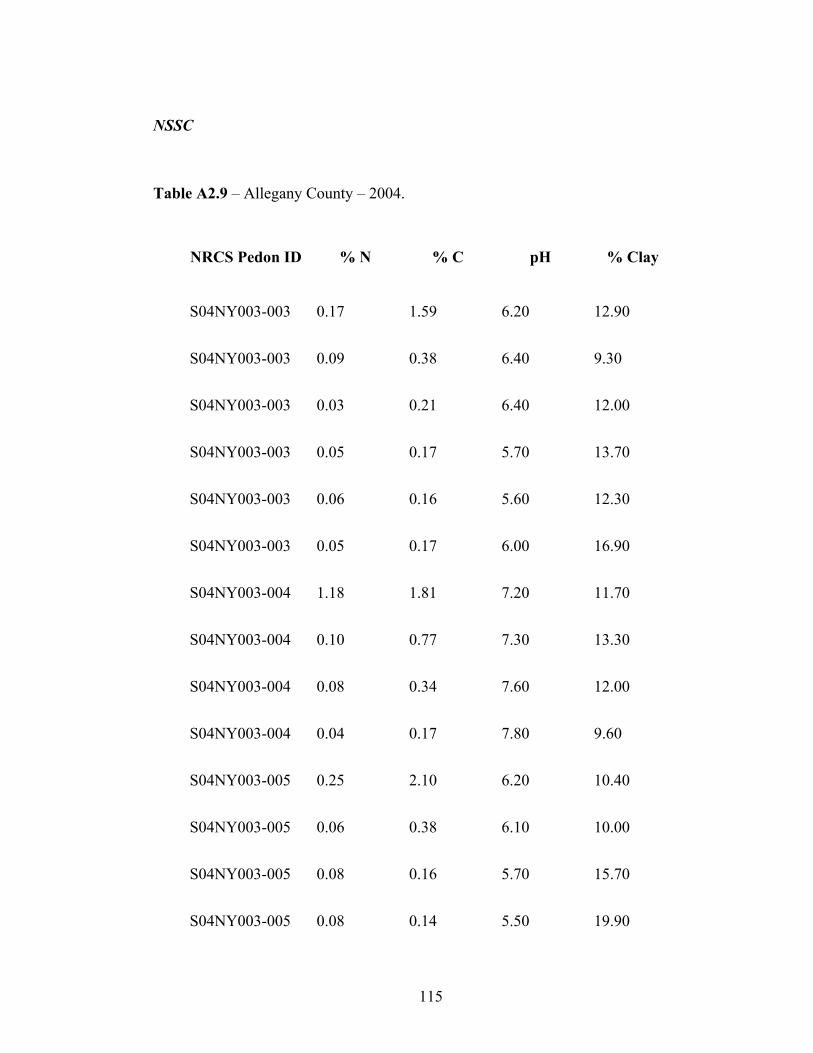
115
NSSC
Table A2.9 – Allegany County – 2004.
NRCS Pedon ID % N % C pH % Clay
S04NY003-003 0.17 1.59 6.20 12.90
S04NY003-003 0.09 0.38 6.40 9.30
S04NY003-003 0.03 0.21 6.40 12.00
S04NY003-003 0.05 0.17 5.70 13.70
S04NY003-003 0.06 0.16 5.60 12.30
S04NY003-003 0.05 0.17 6.00 16.90
S04NY003-004 1.18 1.81 7.20 11.70
S04NY003-004 0.10 0.77 7.30 13.30
S04NY003-004 0.08 0.34 7.60 12.00
S04NY003-004 0.04 0.17 7.80 9.60
S04NY003-005 0.25 2.10 6.20 10.40
S04NY003-005 0.06 0.38 6.10 10.00
S04NY003-005 0.08 0.16 5.70 15.70
S04NY003-005 0.08 0.14 5.50 19.90
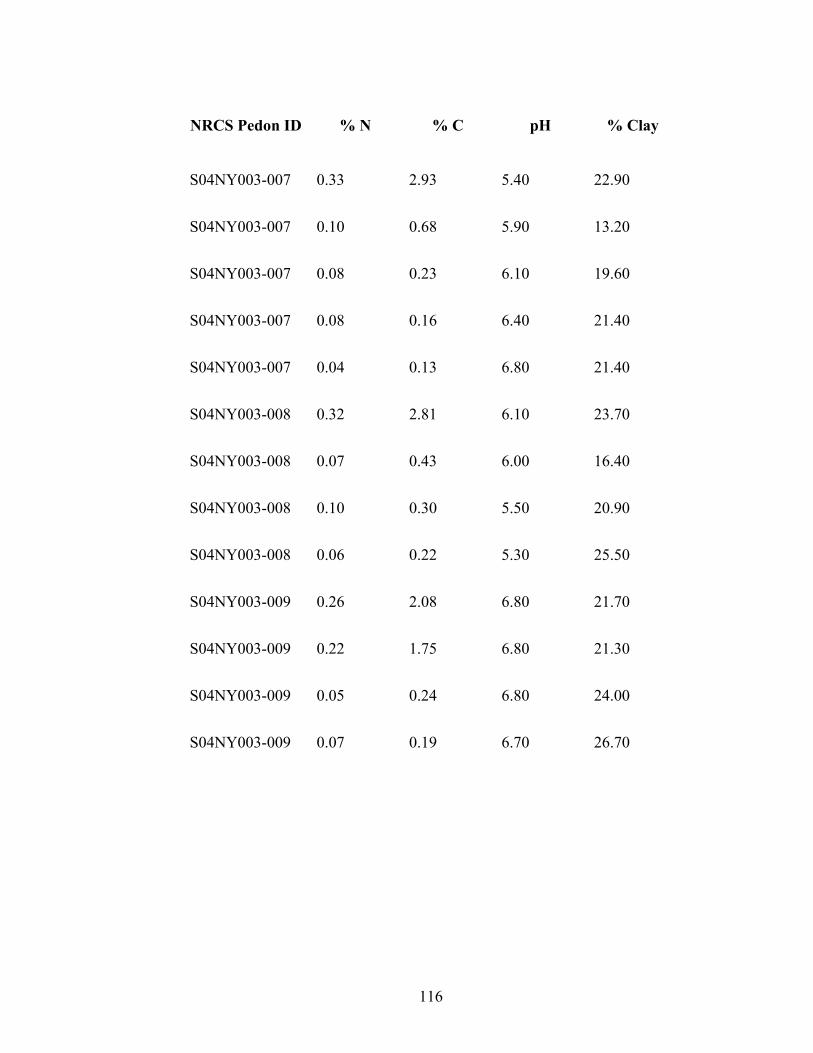
116
NRCS Pedon ID % N % C pH % Clay
S04NY003-007 0.33 2.93 5.40 22.90
S04NY003-007 0.10 0.68 5.90 13.20
S04NY003-007 0.08 0.23 6.10 19.60
S04NY003-007 0.08 0.16 6.40 21.40
S04NY003-007 0.04 0.13 6.80 21.40
S04NY003-008 0.32 2.81 6.10 23.70
S04NY003-008 0.07 0.43 6.00 16.40
S04NY003-008 0.10 0.30 5.50 20.90
S04NY003-008 0.06 0.22 5.30 25.50
S04NY003-009 0.26 2.08 6.80 21.70
S04NY003-009 0.22 1.75 6.80 21.30
S04NY003-009 0.05 0.24 6.80 24.00
S04NY003-009 0.07 0.19 6.70 26.70
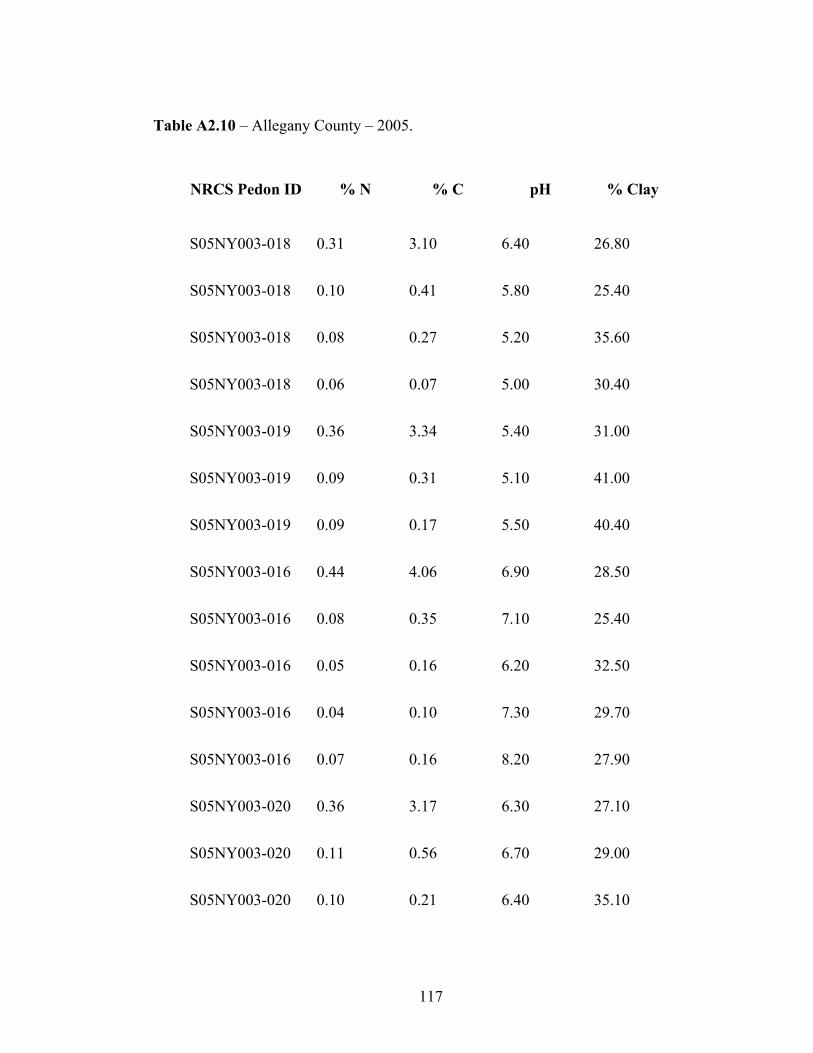
117
Table A2.10 – Allegany County – 2005.
NRCS Pedon ID % N % C pH % Clay
S05NY003-018 0.31 3.10 6.40 26.80
S05NY003-018 0.10 0.41 5.80 25.40
S05NY003-018 0.08 0.27 5.20 35.60
S05NY003-018 0.06 0.07 5.00 30.40
S05NY003-019 0.36 3.34 5.40 31.00
S05NY003-019 0.09 0.31 5.10 41.00
S05NY003-019 0.09 0.17 5.50 40.40
S05NY003-016 0.44 4.06 6.90 28.50
S05NY003-016 0.08 0.35 7.10 25.40
S05NY003-016 0.05 0.16 6.20 32.50
S05NY003-016 0.04 0.10 7.30 29.70
S05NY003-016 0.07 0.16 8.20 27.90
S05NY003-020 0.36 3.17 6.30 27.10
S05NY003-020 0.11 0.56 6.70 29.00
S05NY003-020 0.10 0.21 6.40 35.10
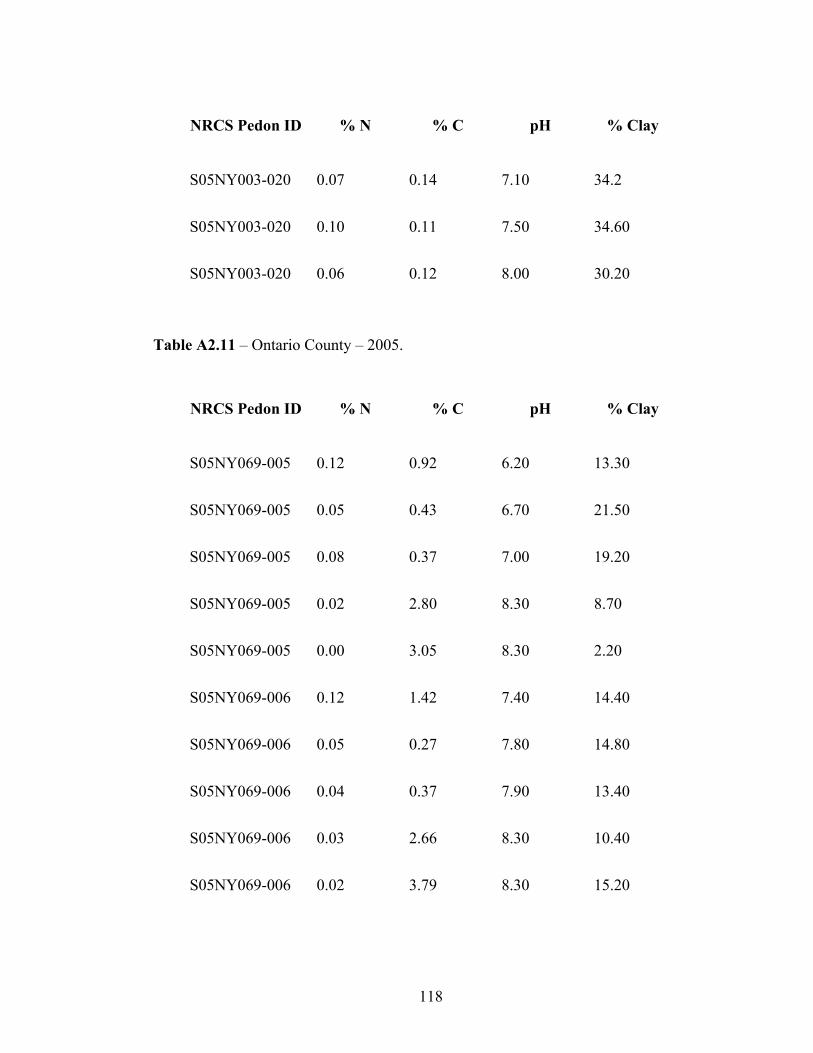
118
NRCS Pedon ID % N % C pH % Clay
S05NY003-020 0.07 0.14 7.10 34.2
S05NY003-020 0.10 0.11 7.50 34.60
S05NY003-020 0.06 0.12 8.00 30.20
Table A2.11 – Ontario County – 2005.
NRCS Pedon ID % N % C pH % Clay
S05NY069-005 0.12 0.92 6.20 13.30
S05NY069-005 0.05 0.43 6.70 21.50
S05NY069-005 0.08 0.37 7.00 19.20
S05NY069-005 0.02 2.80 8.30 8.70
S05NY069-005 0.00 3.05 8.30 2.20
S05NY069-006 0.12 1.42 7.40 14.40
S05NY069-006 0.05 0.27 7.80 14.80
S05NY069-006 0.04 0.37 7.90 13.40
S05NY069-006 0.03 2.66 8.30 10.40
S05NY069-006 0.02 3.79 8.30 15.20
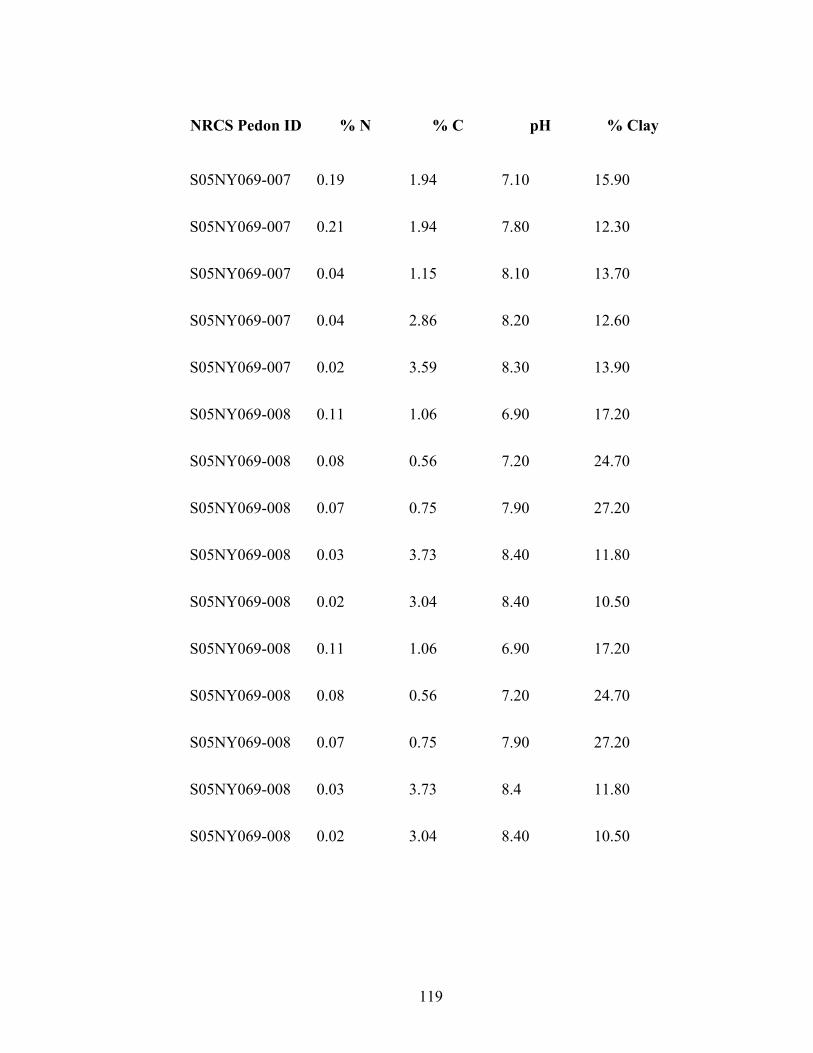
119
NRCS Pedon ID % N % C pH % Clay
S05NY069-007 0.19 1.94 7.10 15.90
S05NY069-007 0.21 1.94 7.80 12.30
S05NY069-007 0.04 1.15 8.10 13.70
S05NY069-007 0.04 2.86 8.20 12.60
S05NY069-007 0.02 3.59 8.30 13.90
S05NY069-008 0.11 1.06 6.90 17.20
S05NY069-008 0.08 0.56 7.20 24.70
S05NY069-008 0.07 0.75 7.90 27.20
S05NY069-008 0.03 3.73 8.40 11.80
S05NY069-008 0.02 3.04 8.40 10.50
S05NY069-008 0.11 1.06 6.90 17.20
S05NY069-008 0.08 0.56 7.20 24.70
S05NY069-008 0.07 0.75 7.90 27.20
S05NY069-008 0.03 3.73 8.4 11.80
S05NY069-008 0.02 3.04 8.40 10.50
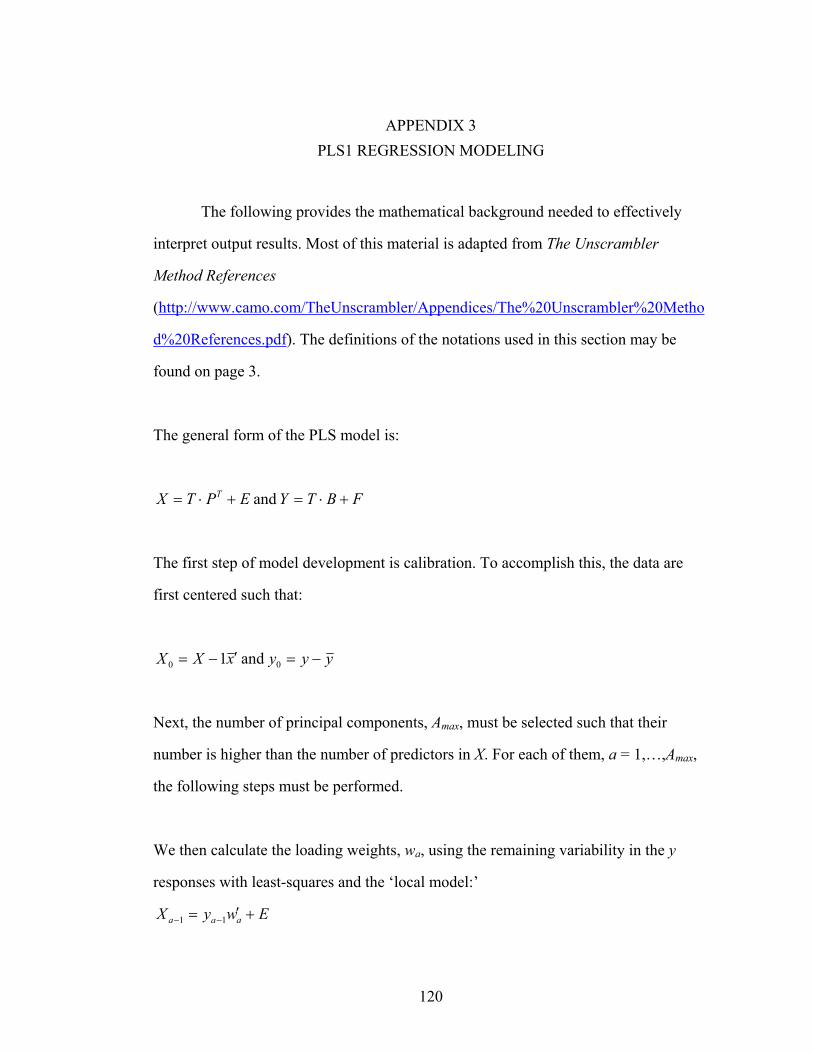
120
APPENDIX 3 PLS1 REGRESSION MODELING
The following provides the mathematical background needed to effectively
interpret output results. Most of this material is adapted from The Unscrambler
Method References
(http://www.camo.com/TheUnscrambler/Appendices/The%20Unscrambler%20Metho
d%20References.pdf). The definitions of the notations used in this section may be
found on page 3.
The general form of the PLS model is:
FBTYEPTX T +⋅=+⋅= and
The first step of model development is calibration. To accomplish this, the data are
first centered such that:
yyyxXX −=′−= 00 and 1
Next, the number of principal components, Amax, must be selected such that their
number is higher than the number of predictors in X. For each of them, a = 1,…,Amax,
the following steps must be performed.
We then calculate the loading weights, wa, using the remaining variability in the y
responses with least-squares and the ‘local model:’
EwyX aaa +′= −− 11
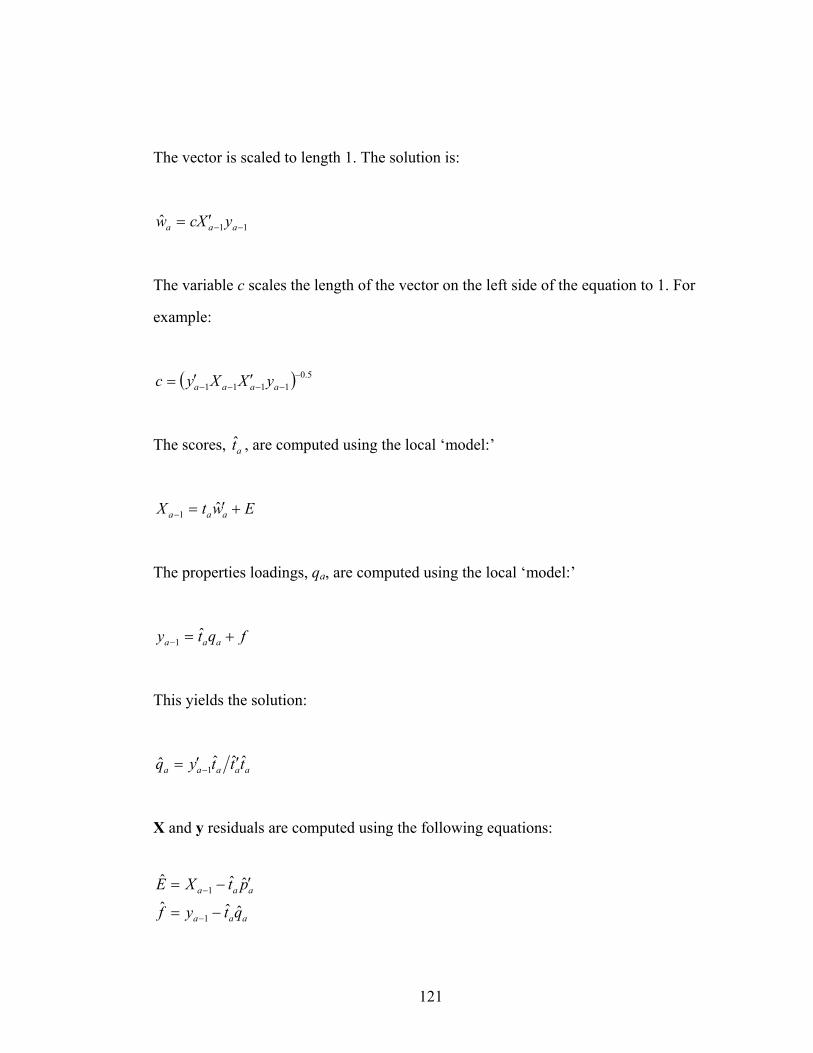
121
The vector is scaled to length 1. The solution is:
11ˆ −−′= aaa yXcw
The variable c scales the length of the vector on the left side of the equation to 1. For
example:
( ) 5.01111
−−−−− ′′= aaaa yXXyc
The scores, at̂ , are computed using the local ‘model:’
EwtX aaa +′=− ˆ1
The properties loadings, qa, are computed using the local ‘model:’
fqty aaa +=−ˆ
1
This yields the solution:
aaaaa tttyq ˆˆˆˆ 1 ′′= −
X and y residuals are computed using the following equations:
aaa
aaa
qtyf
ptXE
ˆˆˆˆˆˆ
1
1
−=
′−=
−
−
122
Summary statistics and A (number of valid PLS factors) are then computed. Predictors
are generated as follows:
( )bxyb
qWPWbˆˆ
ˆˆˆˆˆ
0
1
′−=
′=−
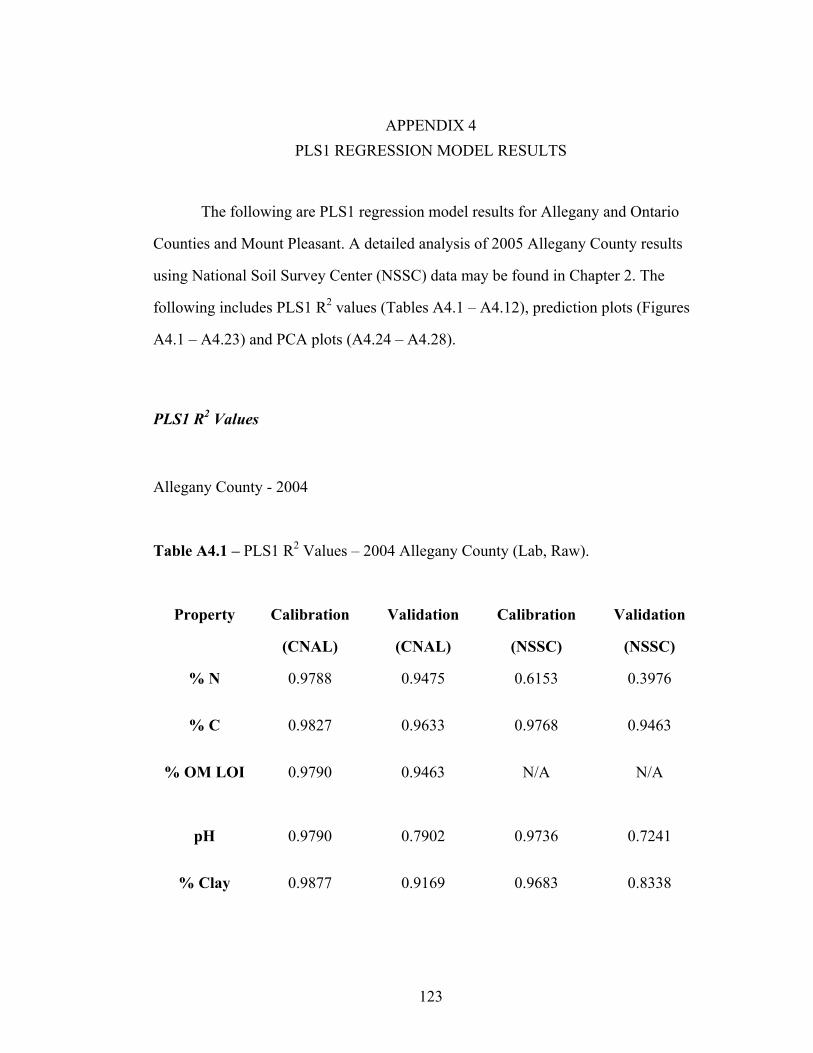
123
APPENDIX 4 PLS1 REGRESSION MODEL RESULTS
The following are PLS1 regression model results for Allegany and Ontario
Counties and Mount Pleasant. A detailed analysis of 2005 Allegany County results
using National Soil Survey Center (NSSC) data may be found in Chapter 2. The
following includes PLS1 R2 values (Tables A4.1 – A4.12), prediction plots (Figures
A4.1 – A4.23) and PCA plots (A4.24 – A4.28).
PLS1 R2 Values
Allegany County - 2004
Table A4.1 – PLS1 R2 Values – 2004 Allegany County (Lab, Raw).
Property Calibration
(CNAL)
Validation
(CNAL)
Calibration
(NSSC)
Validation
(NSSC)
% N 0.9788 0.9475 0.6153 0.3976
% C 0.9827 0.9633 0.9768 0.9463
% OM LOI 0.9790 0.9463 N/A
N/A
pH 0.9790 0.7902 0.9736 0.7241
% Clay 0.9877 0.9169 0.9683 0.8338
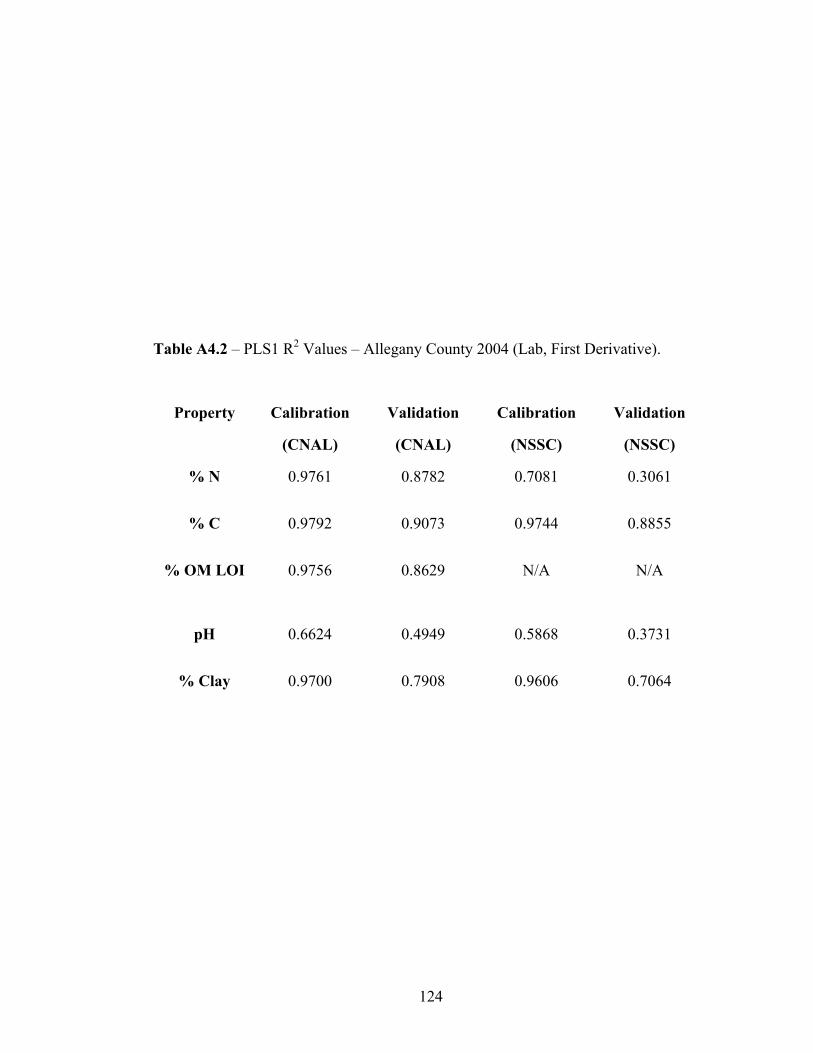
124
Table A4.2 – PLS1 R2 Values – Allegany County 2004 (Lab, First Derivative).
Property Calibration
(CNAL)
Validation
(CNAL)
Calibration
(NSSC)
Validation
(NSSC)
% N 0.9761 0.8782 0.7081 0.3061
% C 0.9792 0.9073 0.9744 0.8855
% OM LOI 0.9756 0.8629 N/A
N/A
pH 0.6624 0.4949 0.5868 0.3731
% Clay 0.9700 0.7908 0.9606 0.7064
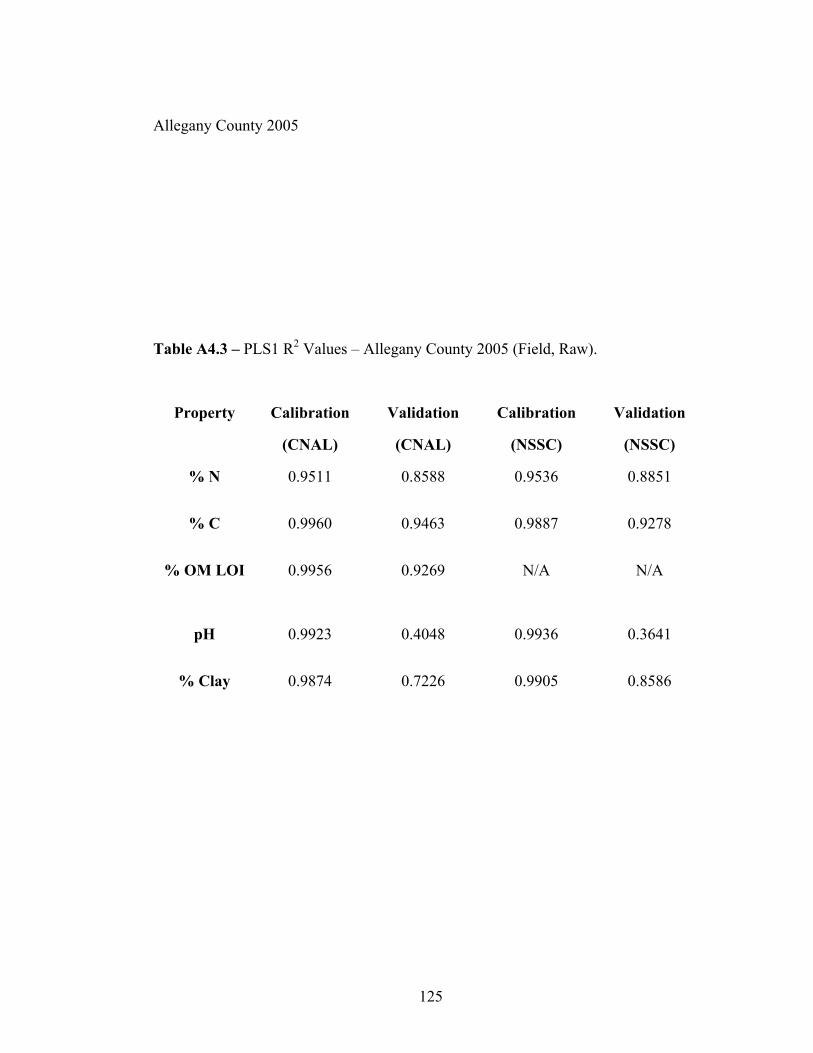
125
Allegany County 2005
Table A4.3 – PLS1 R2 Values – Allegany County 2005 (Field, Raw).
Property Calibration
(CNAL)
Validation
(CNAL)
Calibration
(NSSC)
Validation
(NSSC)
% N 0.9511 0.8588 0.9536 0.8851
% C 0.9960 0.9463 0.9887 0.9278
% OM LOI 0.9956 0.9269 N/A
N/A
pH 0.9923 0.4048 0.9936 0.3641
% Clay 0.9874 0.7226 0.9905 0.8586
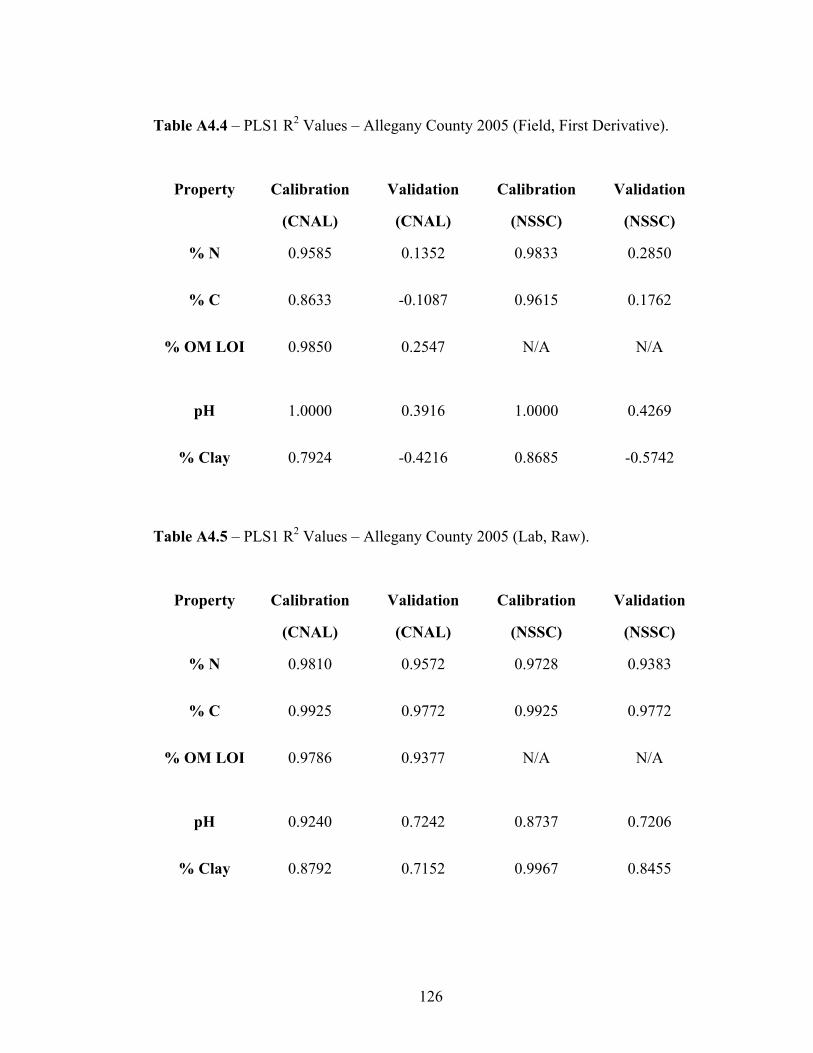
126
Table A4.4 – PLS1 R2 Values – Allegany County 2005 (Field, First Derivative).
Property Calibration
(CNAL)
Validation
(CNAL)
Calibration
(NSSC)
Validation
(NSSC)
% N 0.9585 0.1352 0.9833 0.2850
% C 0.8633 -0.1087 0.9615 0.1762
% OM LOI 0.9850 0.2547 N/A
N/A
pH 1.0000 0.3916 1.0000 0.4269
% Clay 0.7924 -0.4216 0.8685 -0.5742
Table A4.5 – PLS1 R2 Values – Allegany County 2005 (Lab, Raw).
Property Calibration
(CNAL)
Validation
(CNAL)
Calibration
(NSSC)
Validation
(NSSC)
% N 0.9810 0.9572 0.9728 0.9383
% C 0.9925 0.9772 0.9925 0.9772
% OM LOI 0.9786 0.9377 N/A
N/A
pH 0.9240 0.7242 0.8737 0.7206
% Clay 0.8792 0.7152 0.9967 0.8455
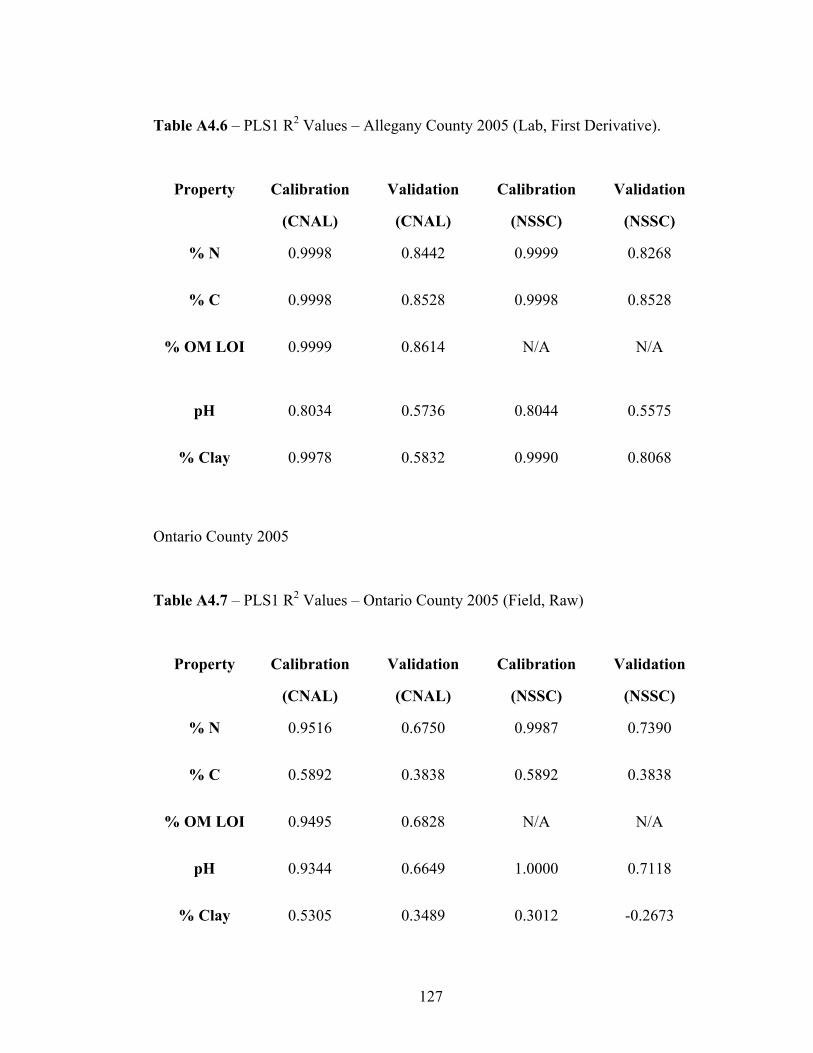
127
Table A4.6 – PLS1 R2 Values – Allegany County 2005 (Lab, First Derivative).
Property Calibration
(CNAL)
Validation
(CNAL)
Calibration
(NSSC)
Validation
(NSSC)
% N 0.9998 0.8442 0.9999 0.8268
% C 0.9998 0.8528 0.9998 0.8528
% OM LOI 0.9999 0.8614 N/A
N/A
pH 0.8034 0.5736 0.8044 0.5575
% Clay 0.9978 0.5832 0.9990 0.8068
Ontario County 2005
Table A4.7 – PLS1 R2 Values – Ontario County 2005 (Field, Raw)
Property Calibration
(CNAL)
Validation
(CNAL)
Calibration
(NSSC)
Validation
(NSSC)
% N 0.9516 0.6750 0.9987 0.7390
% C 0.5892 0.3838 0.5892 0.3838
% OM LOI 0.9495 0.6828 N/A N/A
pH 0.9344 0.6649 1.0000 0.7118
% Clay 0.5305 0.3489 0.3012 -0.2673
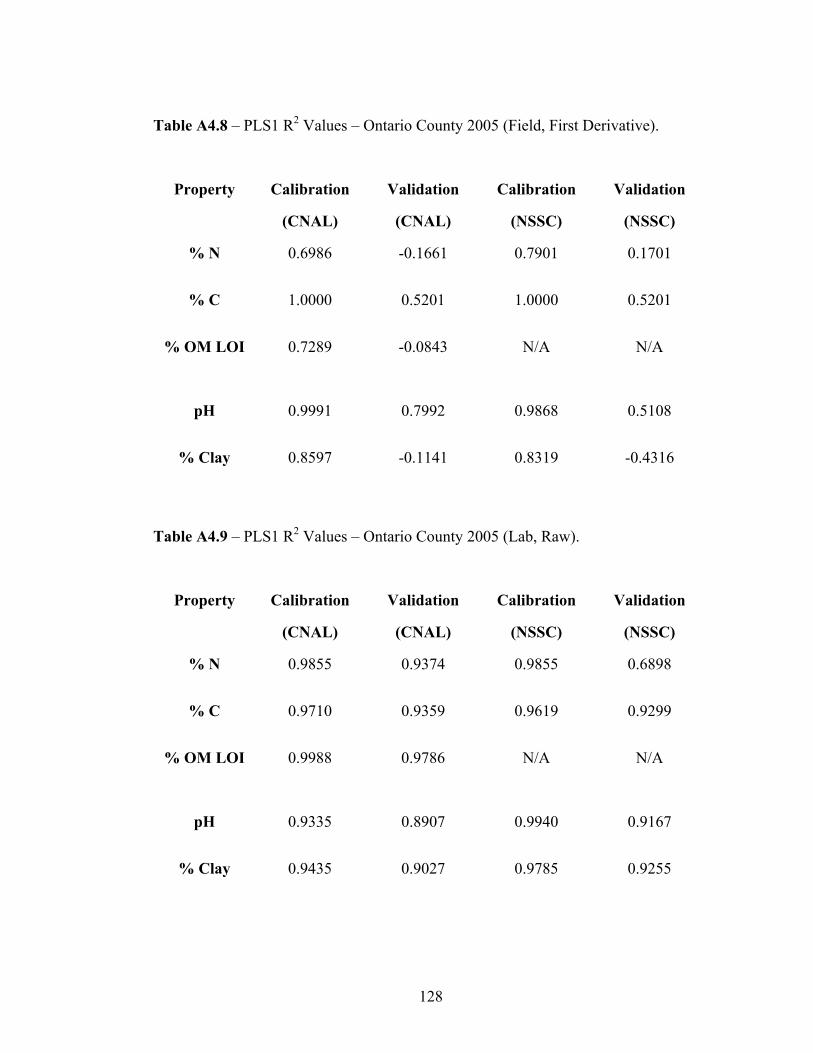
128
Table A4.8 – PLS1 R2 Values – Ontario County 2005 (Field, First Derivative).
Property Calibration
(CNAL)
Validation
(CNAL)
Calibration
(NSSC)
Validation
(NSSC)
% N 0.6986 -0.1661 0.7901 0.1701
% C 1.0000 0.5201 1.0000 0.5201
% OM LOI 0.7289 -0.0843 N/A
N/A
pH 0.9991 0.7992 0.9868 0.5108
% Clay 0.8597 -0.1141 0.8319 -0.4316
Table A4.9 – PLS1 R2 Values – Ontario County 2005 (Lab, Raw).
Property Calibration
(CNAL)
Validation
(CNAL)
Calibration
(NSSC)
Validation
(NSSC)
% N 0.9855 0.9374 0.9855 0.6898
% C 0.9710 0.9359 0.9619 0.9299
% OM LOI 0.9988 0.9786 N/A
N/A
pH 0.9335 0.8907 0.9940 0.9167
% Clay 0.9435 0.9027 0.9785 0.9255
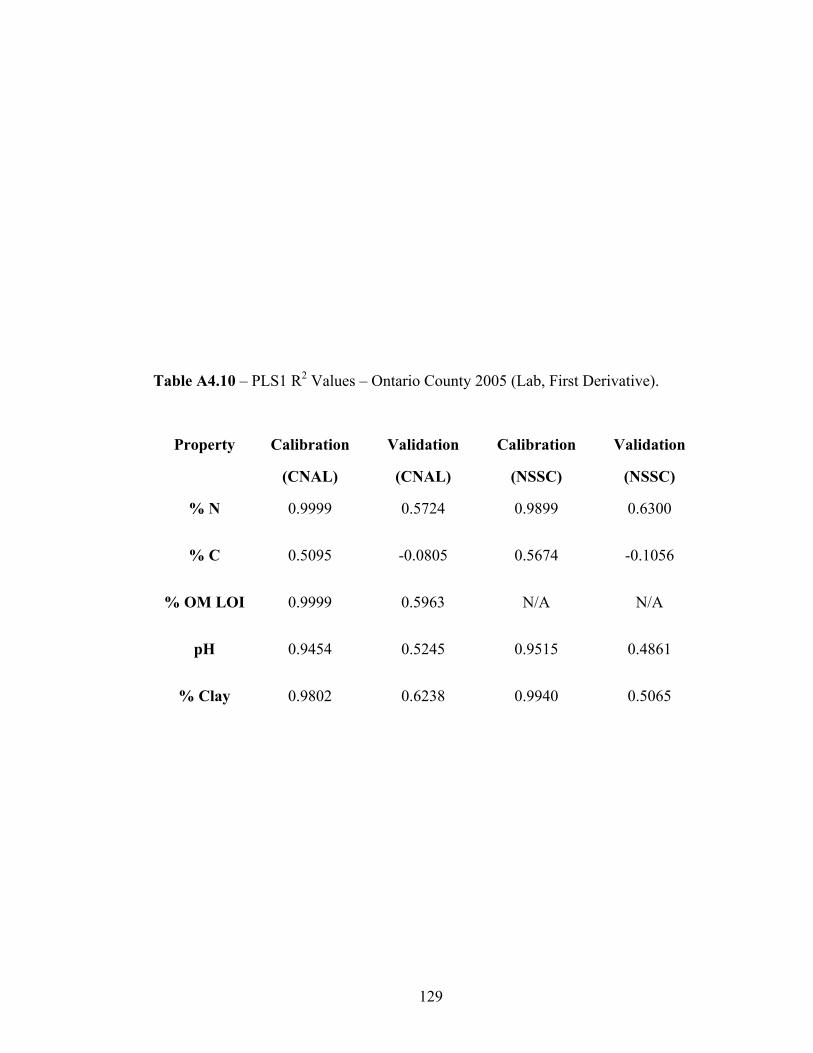
129
Table A4.10 – PLS1 R2 Values – Ontario County 2005 (Lab, First Derivative).
Property Calibration
(CNAL)
Validation
(CNAL)
Calibration
(NSSC)
Validation
(NSSC)
% N 0.9999 0.5724 0.9899 0.6300
% C 0.5095 -0.0805 0.5674 -0.1056
% OM LOI 0.9999 0.5963 N/A N/A
pH 0.9454 0.5245 0.9515 0.4861
% Clay 0.9802 0.6238 0.9940 0.5065
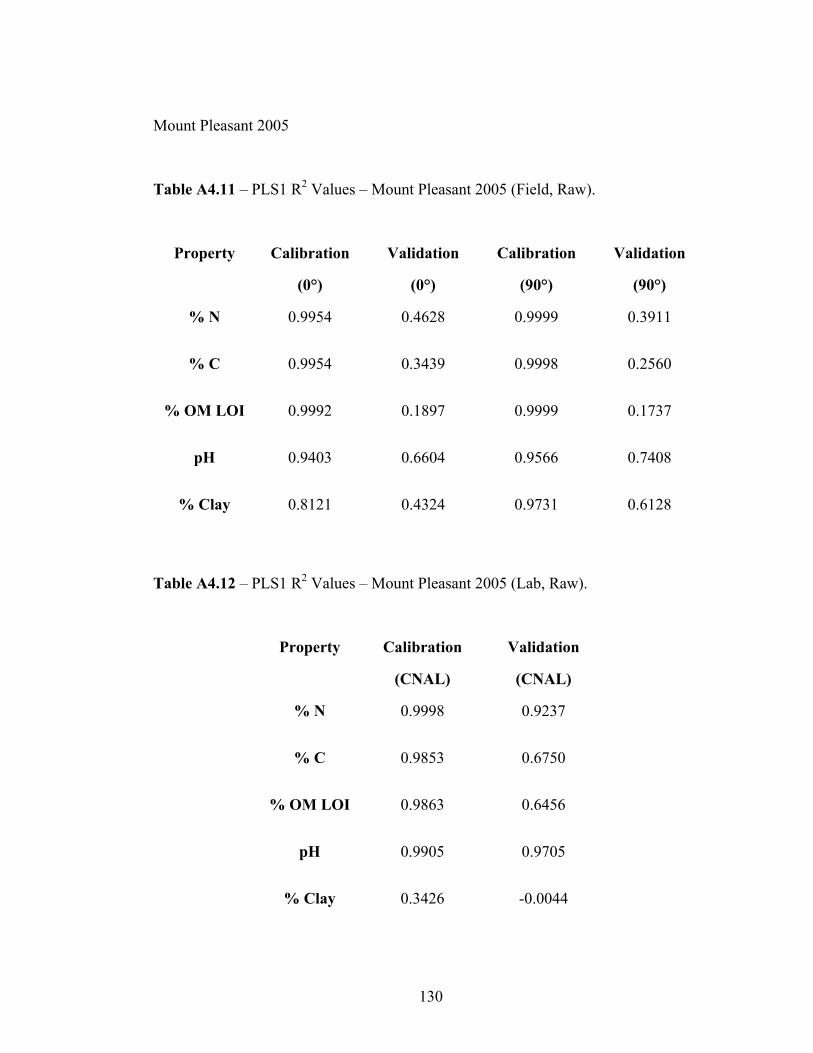
130
Mount Pleasant 2005
Table A4.11 – PLS1 R2 Values – Mount Pleasant 2005 (Field, Raw).
Property Calibration
(0°)
Validation
(0°)
Calibration
(90°)
Validation
(90°)
% N 0.9954 0.4628 0.9999 0.3911
% C 0.9954 0.3439 0.9998 0.2560
% OM LOI 0.9992 0.1897 0.9999 0.1737
pH 0.9403 0.6604 0.9566 0.7408
% Clay 0.8121 0.4324 0.9731 0.6128
Table A4.12 – PLS1 R2 Values – Mount Pleasant 2005 (Lab, Raw).
Property Calibration
(CNAL)
Validation
(CNAL)
% N 0.9998 0.9237
% C 0.9853 0.6750
% OM LOI 0.9863 0.6456
pH 0.9905 0.9705
% Clay 0.3426 -0.0044
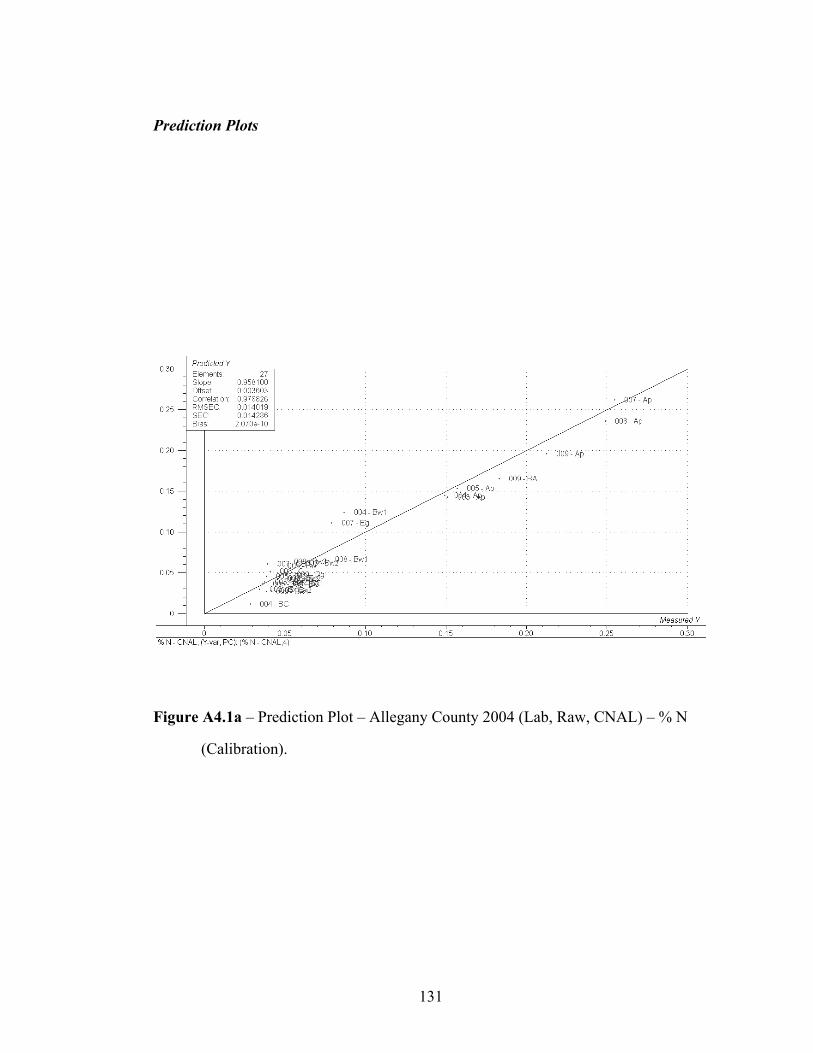
131
Prediction Plots
Figure A4.1a – Prediction Plot – Allegany County 2004 (Lab, Raw, CNAL) – % N
(Calibration).
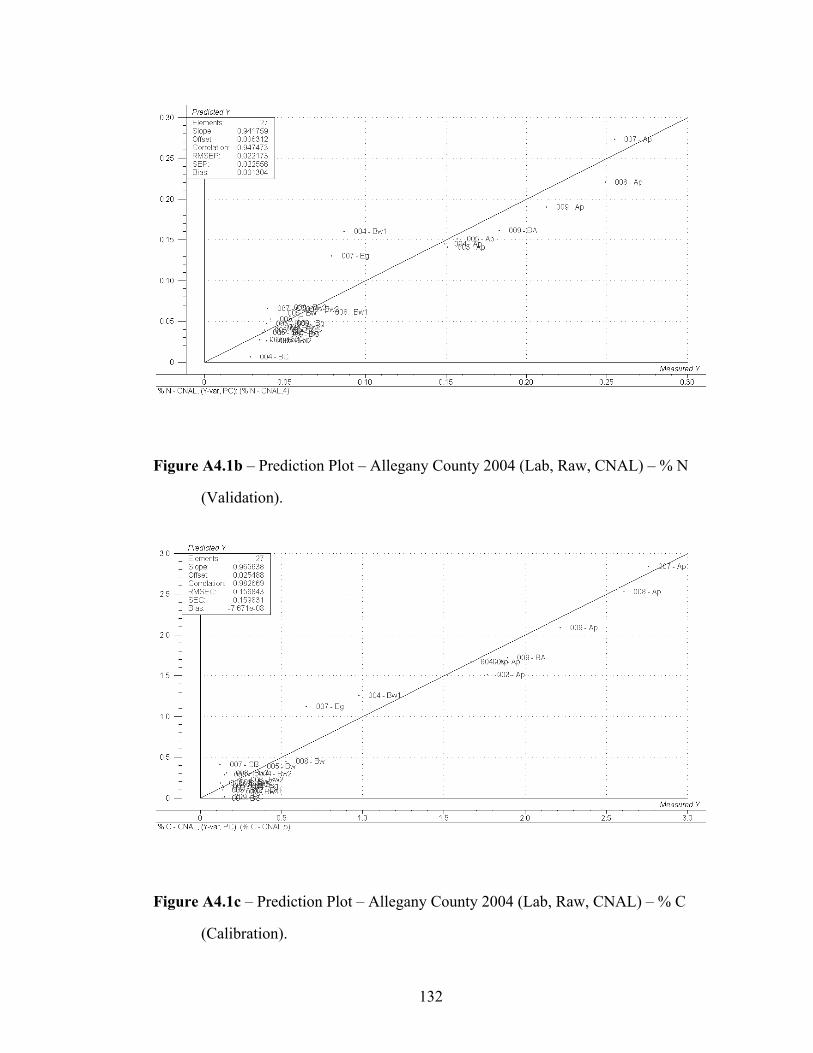
132
Figure A4.1b – Prediction Plot – Allegany County 2004 (Lab, Raw, CNAL) – % N
(Validation).
Figure A4.1c – Prediction Plot – Allegany County 2004 (Lab, Raw, CNAL) – % C
(Calibration).
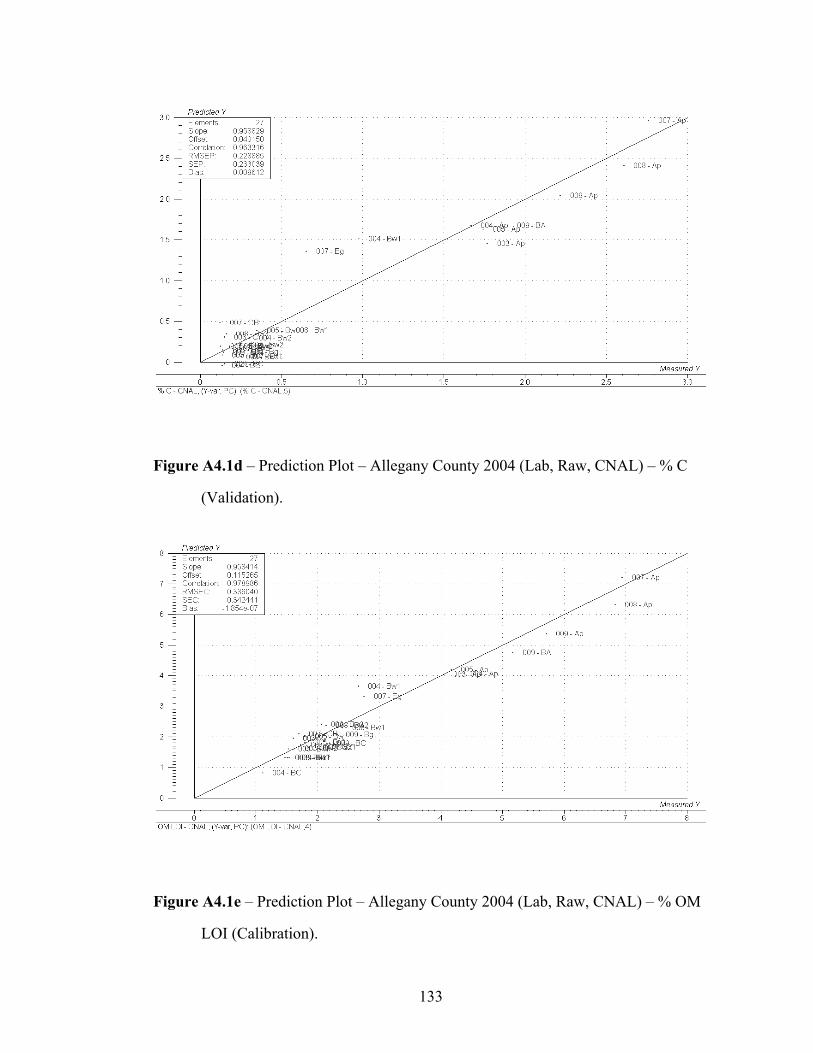
133
Figure A4.1d – Prediction Plot – Allegany County 2004 (Lab, Raw, CNAL) – % C
(Validation).
Figure A4.1e – Prediction Plot – Allegany County 2004 (Lab, Raw, CNAL) – % OM
LOI (Calibration).
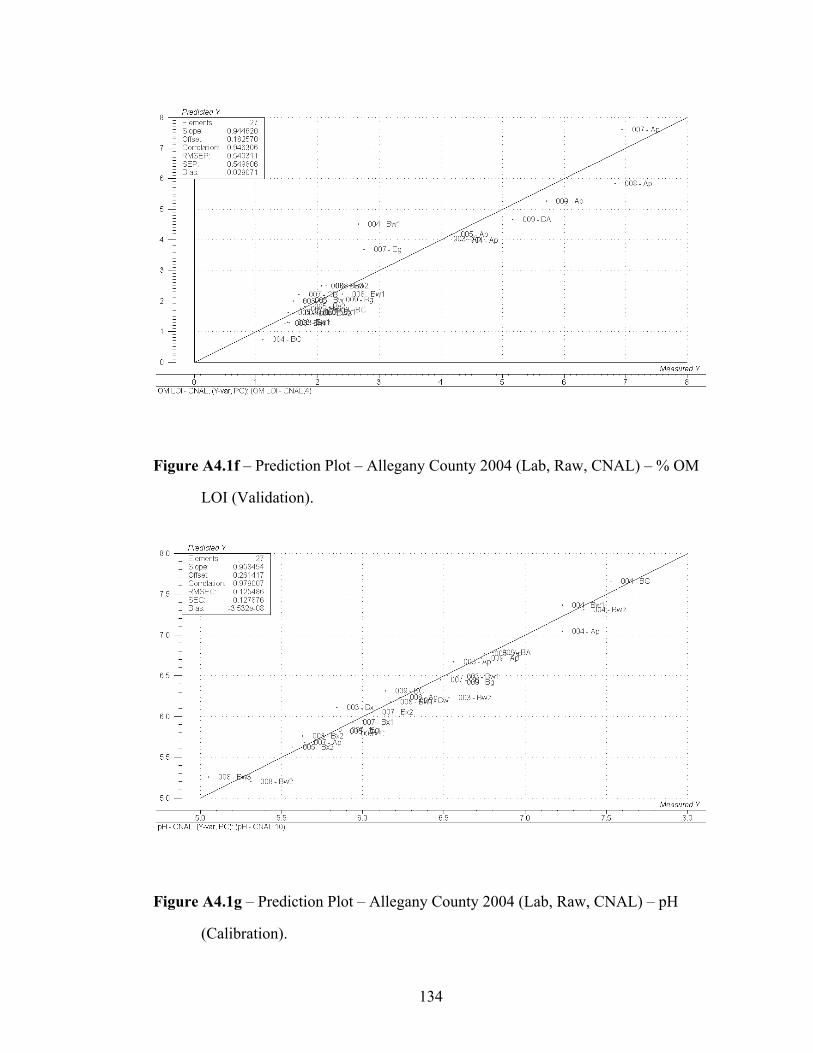
134
Figure A4.1f – Prediction Plot – Allegany County 2004 (Lab, Raw, CNAL) – % OM
LOI (Validation).
Figure A4.1g – Prediction Plot – Allegany County 2004 (Lab, Raw, CNAL) – pH
(Calibration).
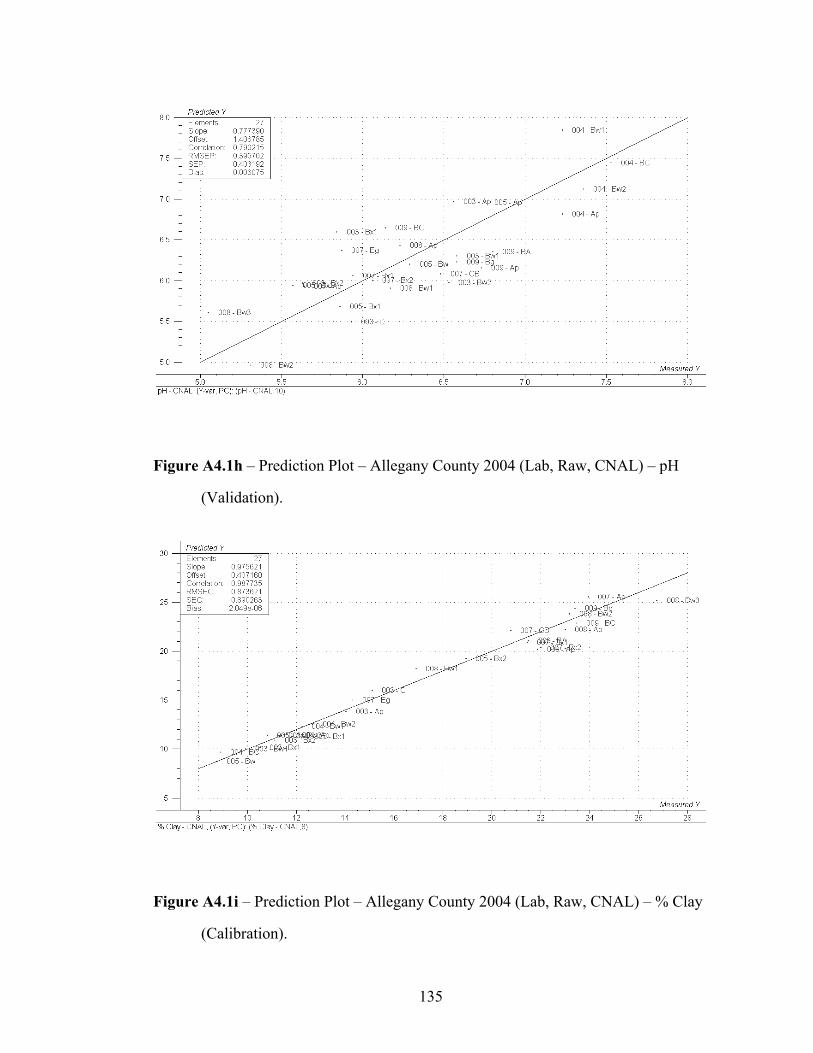
135
Figure A4.1h – Prediction Plot – Allegany County 2004 (Lab, Raw, CNAL) – pH
(Validation).
Figure A4.1i – Prediction Plot – Allegany County 2004 (Lab, Raw, CNAL) – % Clay
(Calibration).
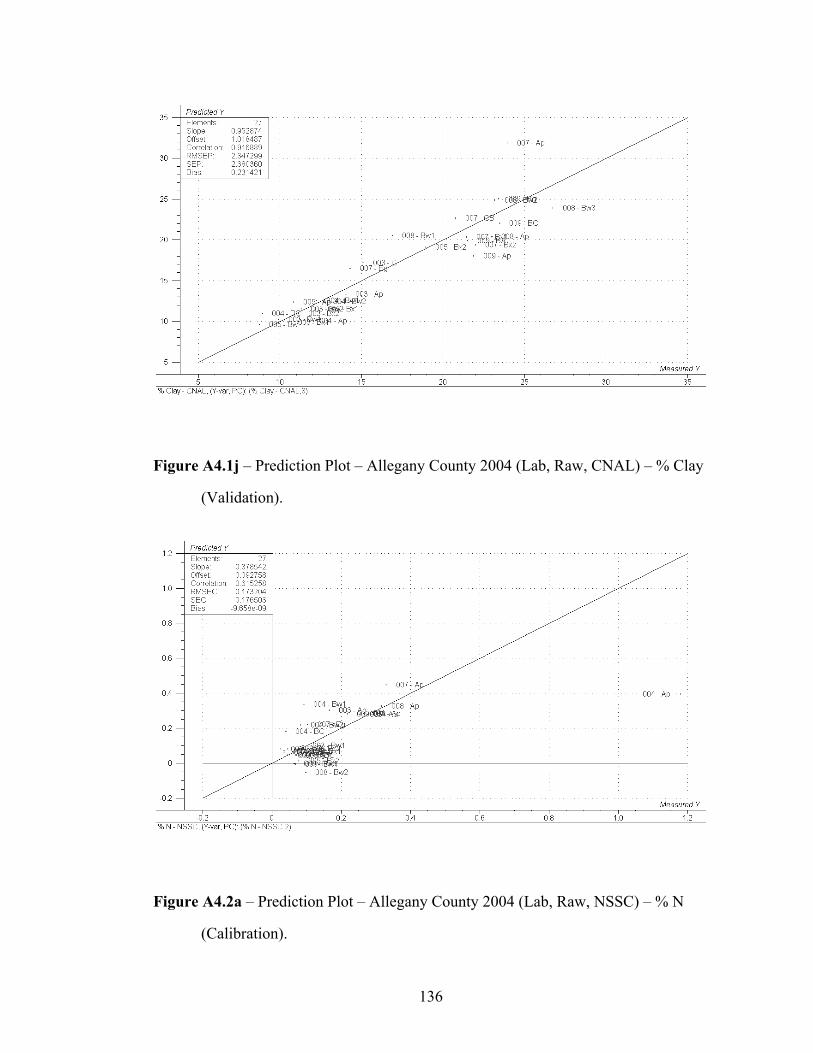
136
Figure A4.1j – Prediction Plot – Allegany County 2004 (Lab, Raw, CNAL) – % Clay
(Validation).
Figure A4.2a – Prediction Plot – Allegany County 2004 (Lab, Raw, NSSC) – % N
(Calibration).
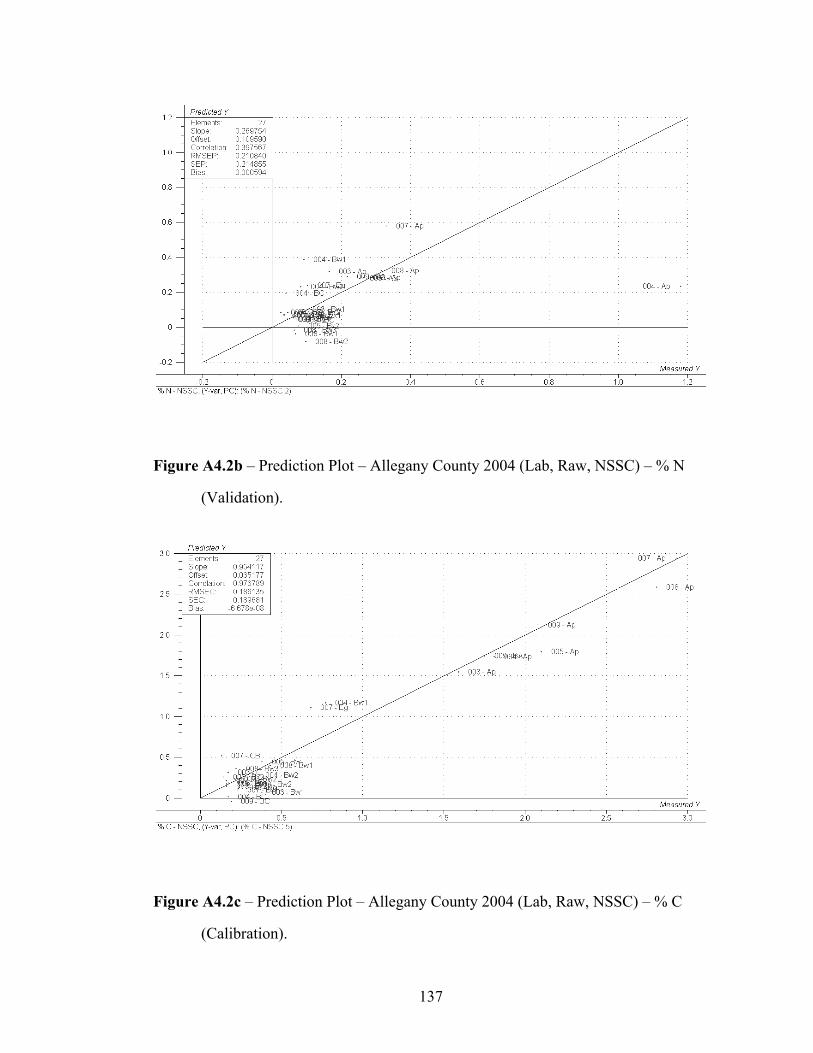
137
Figure A4.2b – Prediction Plot – Allegany County 2004 (Lab, Raw, NSSC) – % N
(Validation).
Figure A4.2c – Prediction Plot – Allegany County 2004 (Lab, Raw, NSSC) – % C
(Calibration).
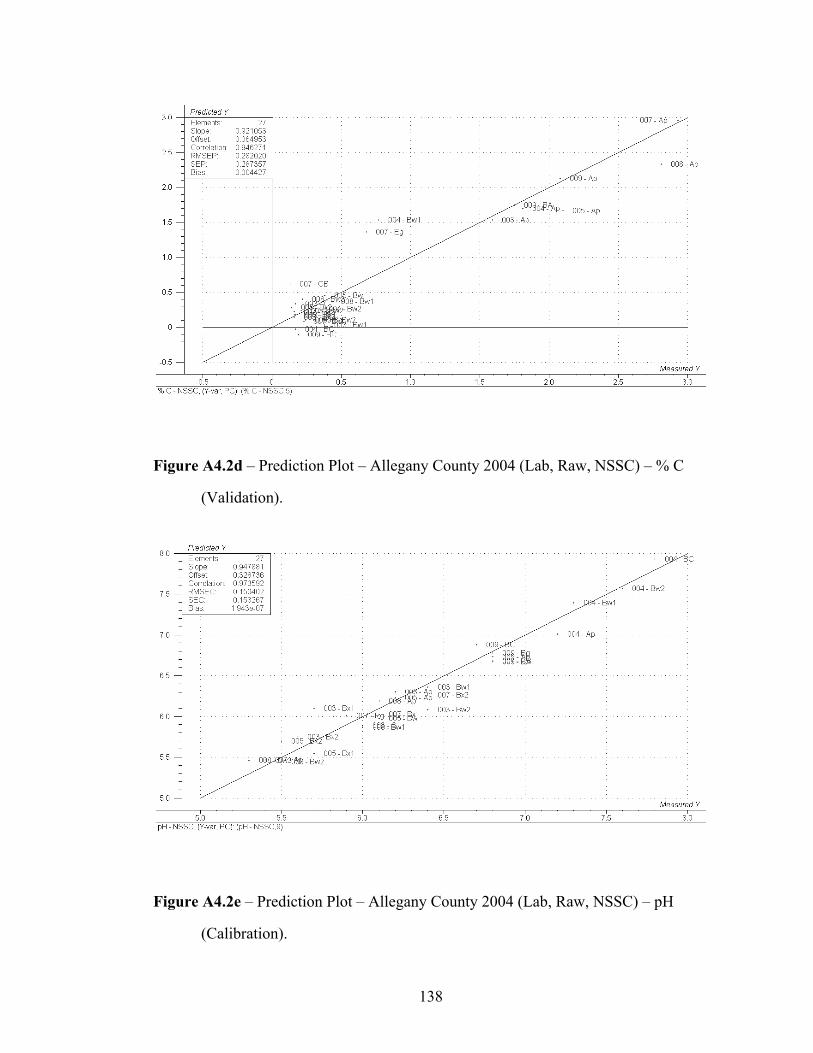
138
Figure A4.2d – Prediction Plot – Allegany County 2004 (Lab, Raw, NSSC) – % C
(Validation).
Figure A4.2e – Prediction Plot – Allegany County 2004 (Lab, Raw, NSSC) – pH
(Calibration).

139
Figure A4.2f – Prediction Plot – Allegany County 2004 (Lab, Raw, NSSC) – pH
(Validation).
Figure A4.2g – Prediction Plot – Allegany County 2004 (Lab, Raw, NSSC) – % Clay
(Calibration).
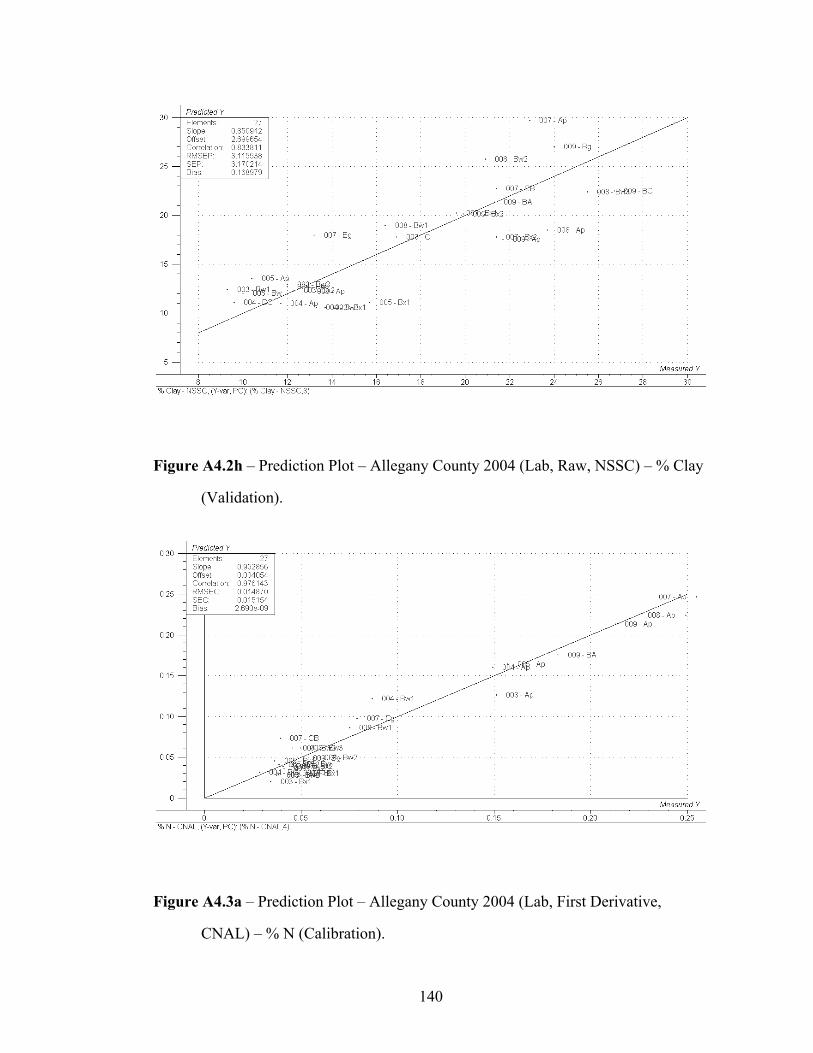
140
Figure A4.2h – Prediction Plot – Allegany County 2004 (Lab, Raw, NSSC) – % Clay
(Validation).
Figure A4.3a – Prediction Plot – Allegany County 2004 (Lab, First Derivative,
CNAL) – % N (Calibration).
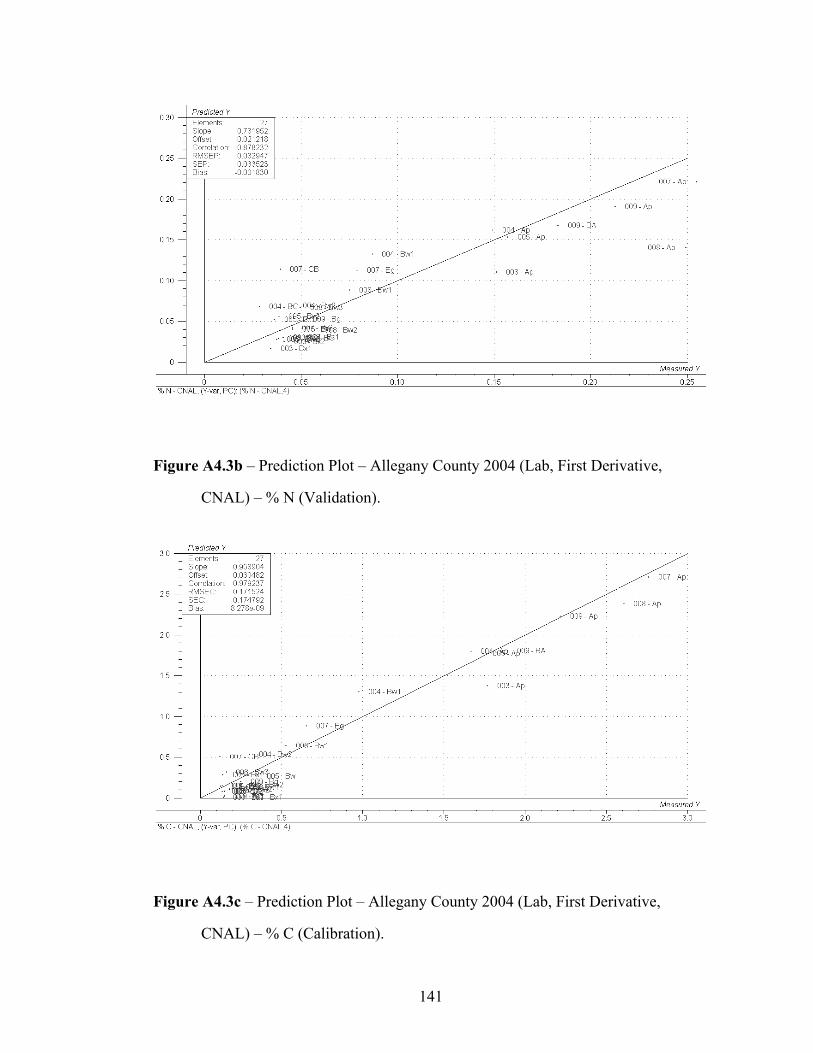
141
Figure A4.3b – Prediction Plot – Allegany County 2004 (Lab, First Derivative,
CNAL) – % N (Validation).
Figure A4.3c – Prediction Plot – Allegany County 2004 (Lab, First Derivative,
CNAL) – % C (Calibration).
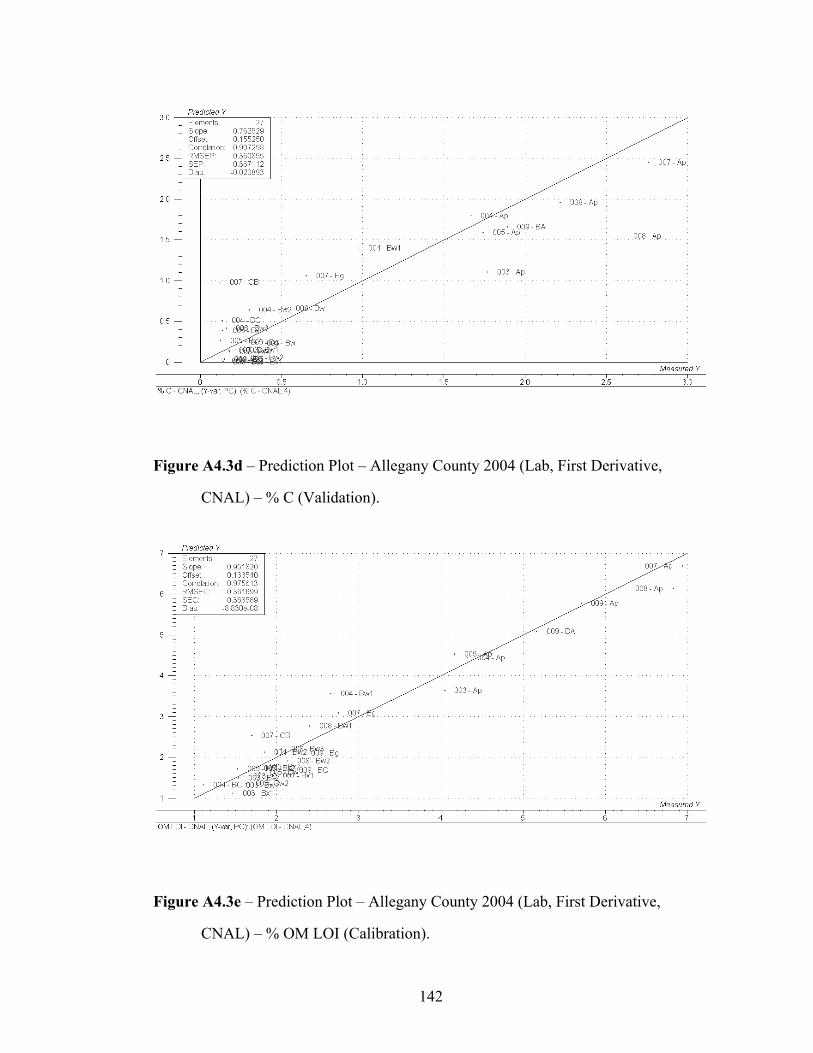
142
Figure A4.3d – Prediction Plot – Allegany County 2004 (Lab, First Derivative,
CNAL) – % C (Validation).
Figure A4.3e – Prediction Plot – Allegany County 2004 (Lab, First Derivative,
CNAL) – % OM LOI (Calibration).
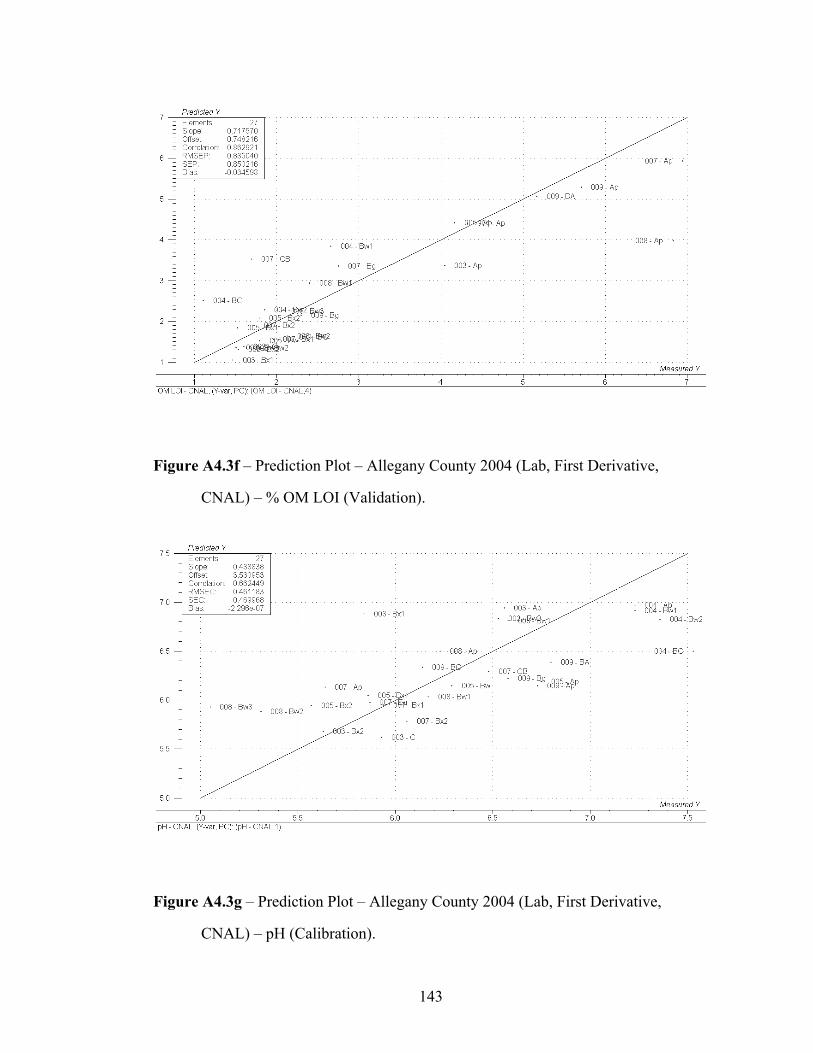
143
Figure A4.3f – Prediction Plot – Allegany County 2004 (Lab, First Derivative,
CNAL) – % OM LOI (Validation).
Figure A4.3g – Prediction Plot – Allegany County 2004 (Lab, First Derivative,
CNAL) – pH (Calibration).
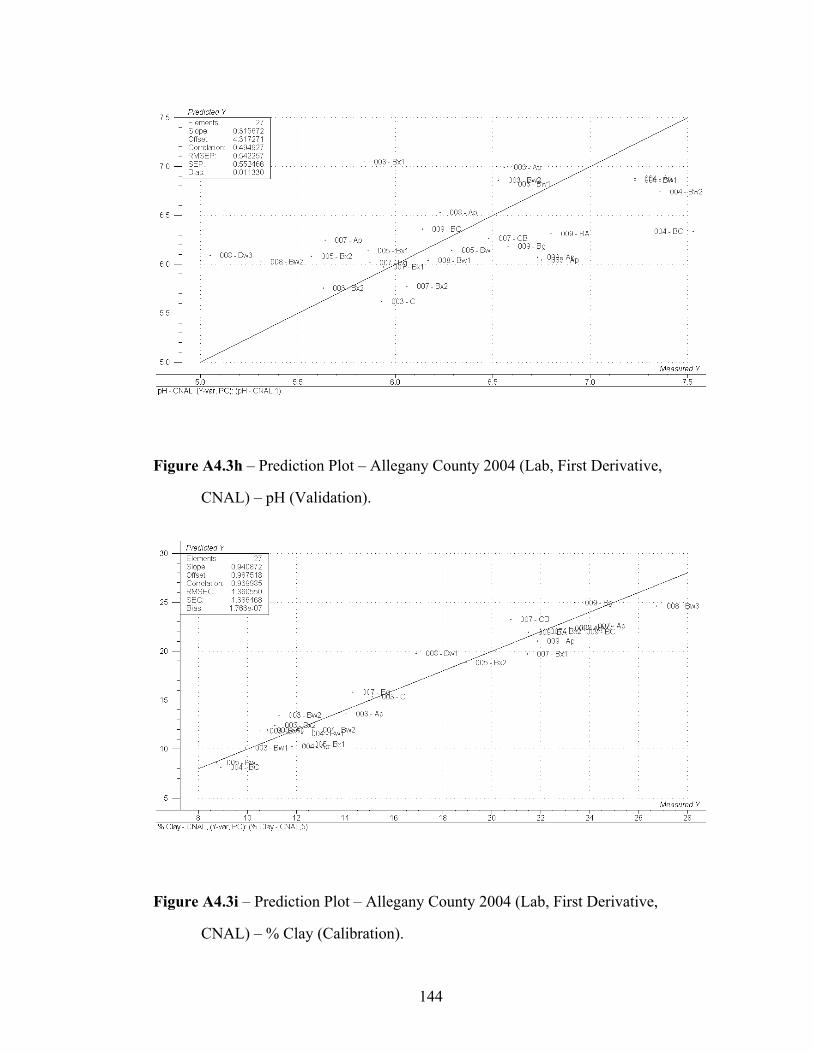
144
Figure A4.3h – Prediction Plot – Allegany County 2004 (Lab, First Derivative,
CNAL) – pH (Validation).
Figure A4.3i – Prediction Plot – Allegany County 2004 (Lab, First Derivative,
CNAL) – % Clay (Calibration).
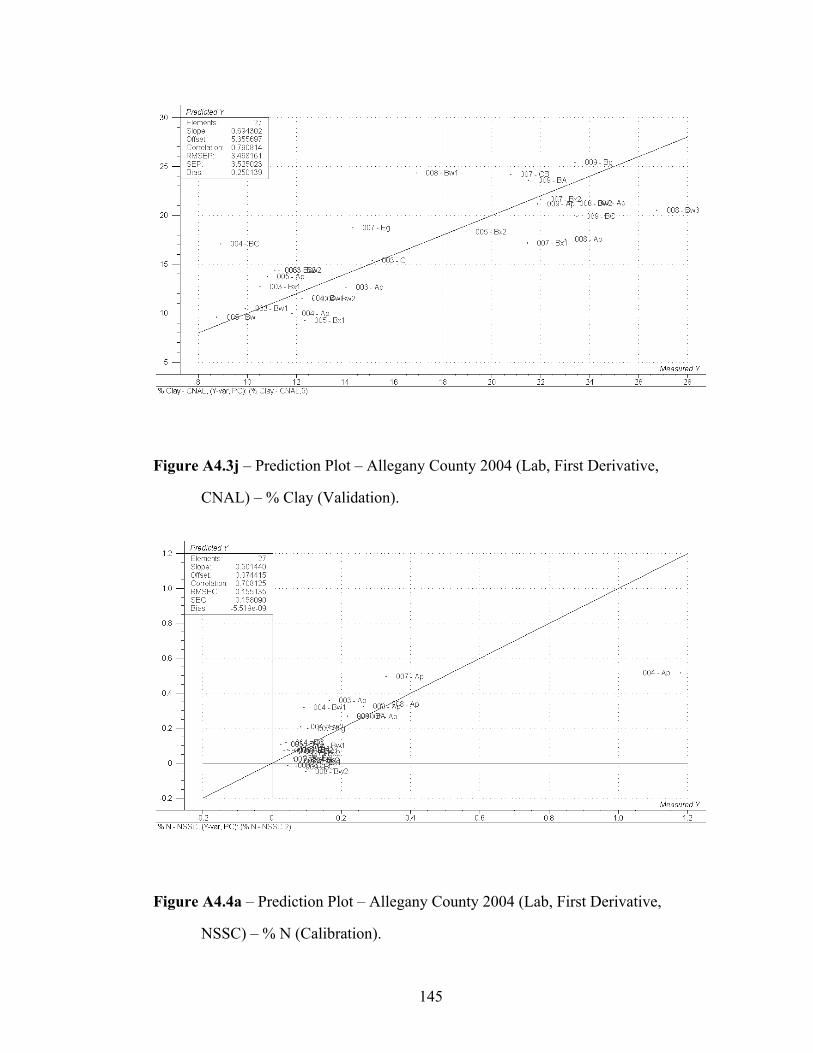
145
Figure A4.3j – Prediction Plot – Allegany County 2004 (Lab, First Derivative,
CNAL) – % Clay (Validation).
Figure A4.4a – Prediction Plot – Allegany County 2004 (Lab, First Derivative,
NSSC) – % N (Calibration).
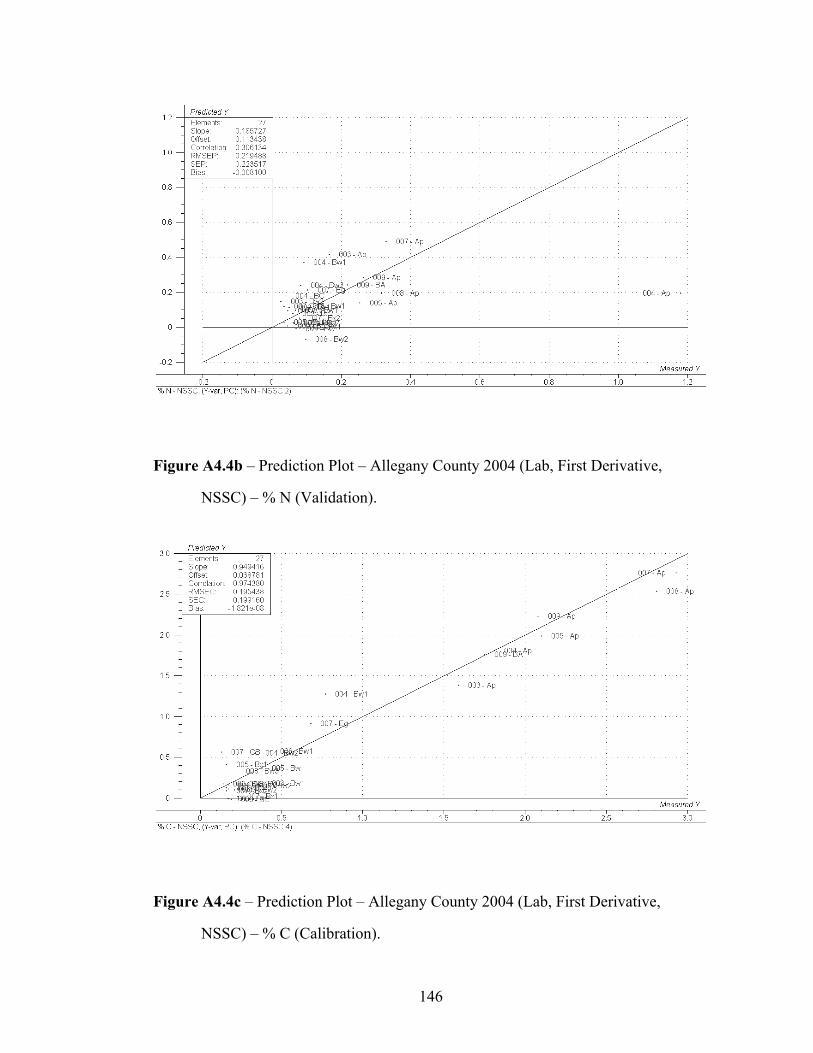
146
Figure A4.4b – Prediction Plot – Allegany County 2004 (Lab, First Derivative,
NSSC) – % N (Validation).
Figure A4.4c – Prediction Plot – Allegany County 2004 (Lab, First Derivative,
NSSC) – % C (Calibration).
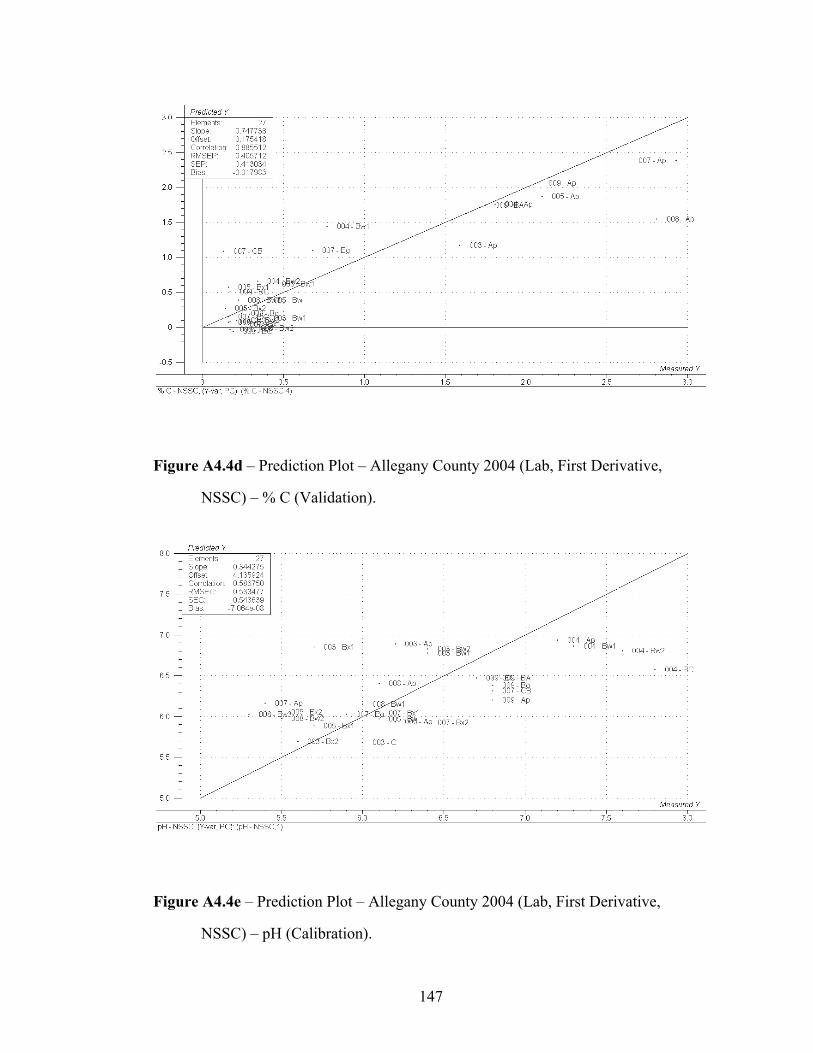
147
Figure A4.4d – Prediction Plot – Allegany County 2004 (Lab, First Derivative,
NSSC) – % C (Validation).
Figure A4.4e – Prediction Plot – Allegany County 2004 (Lab, First Derivative,
NSSC) – pH (Calibration).
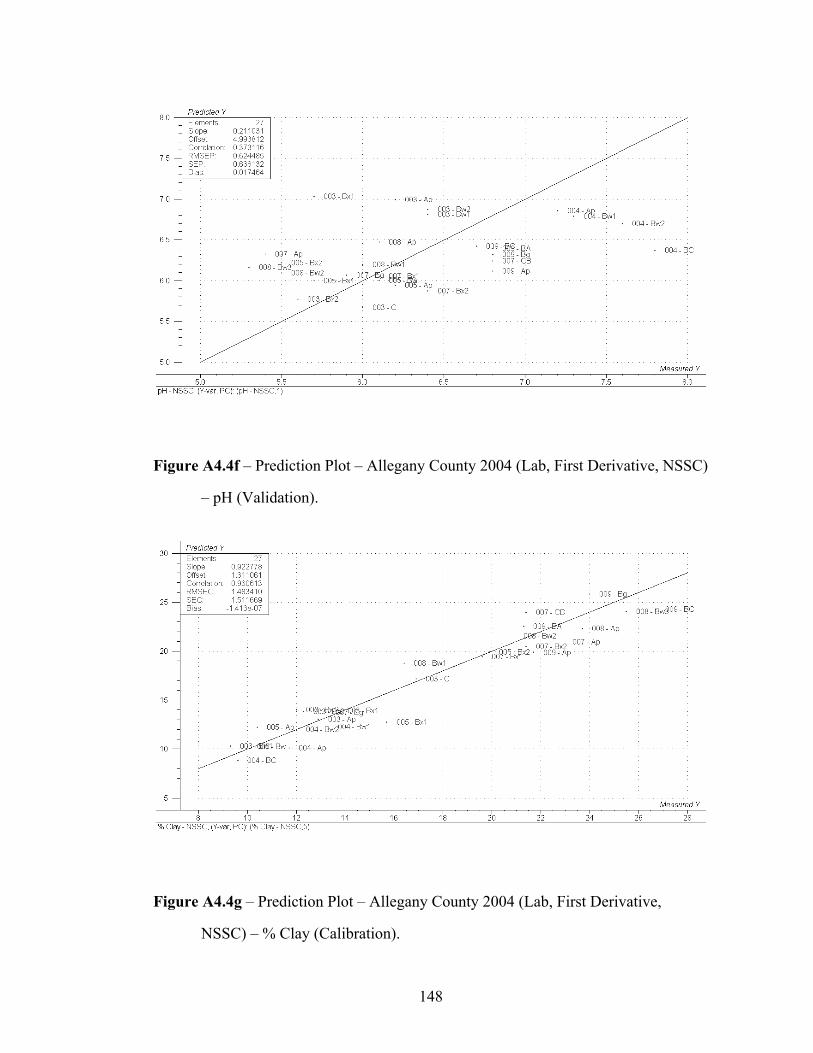
148
Figure A4.4f – Prediction Plot – Allegany County 2004 (Lab, First Derivative, NSSC)
– pH (Validation).
Figure A4.4g – Prediction Plot – Allegany County 2004 (Lab, First Derivative,
NSSC) – % Clay (Calibration).
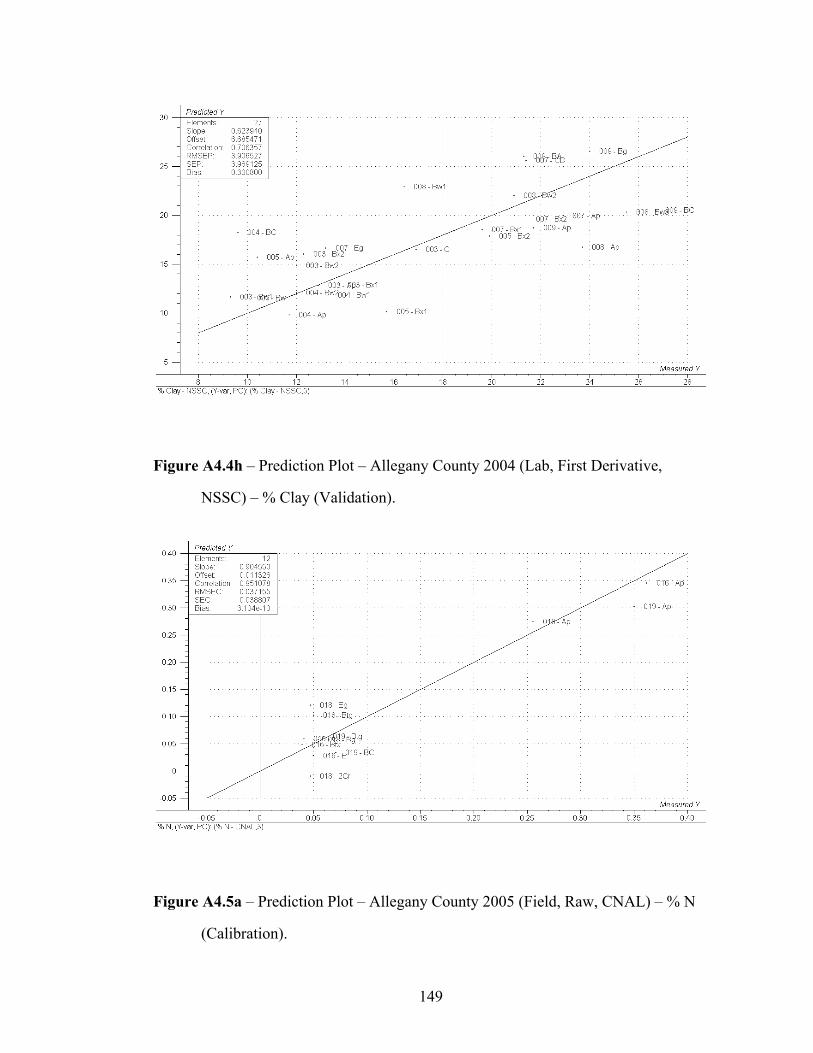
149
Figure A4.4h – Prediction Plot – Allegany County 2004 (Lab, First Derivative,
NSSC) – % Clay (Validation).
Figure A4.5a – Prediction Plot – Allegany County 2005 (Field, Raw, CNAL) – % N
(Calibration).
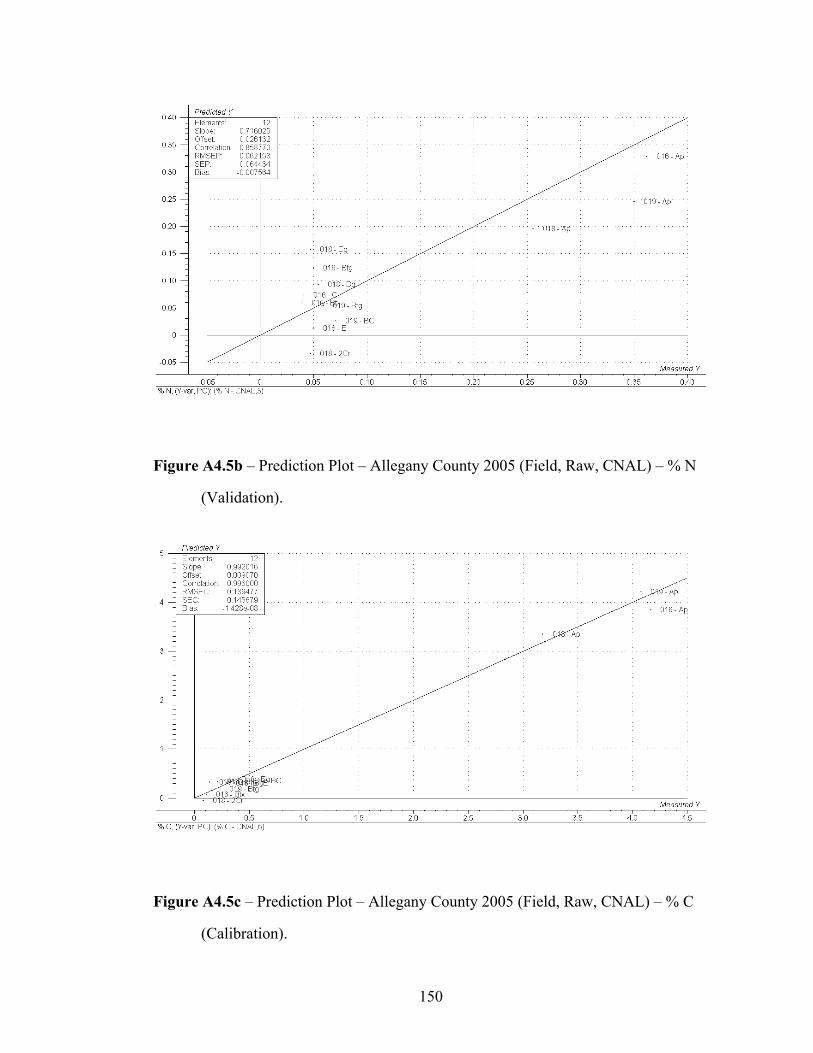
150
Figure A4.5b – Prediction Plot – Allegany County 2005 (Field, Raw, CNAL) – % N
(Validation).
Figure A4.5c – Prediction Plot – Allegany County 2005 (Field, Raw, CNAL) – % C
(Calibration).
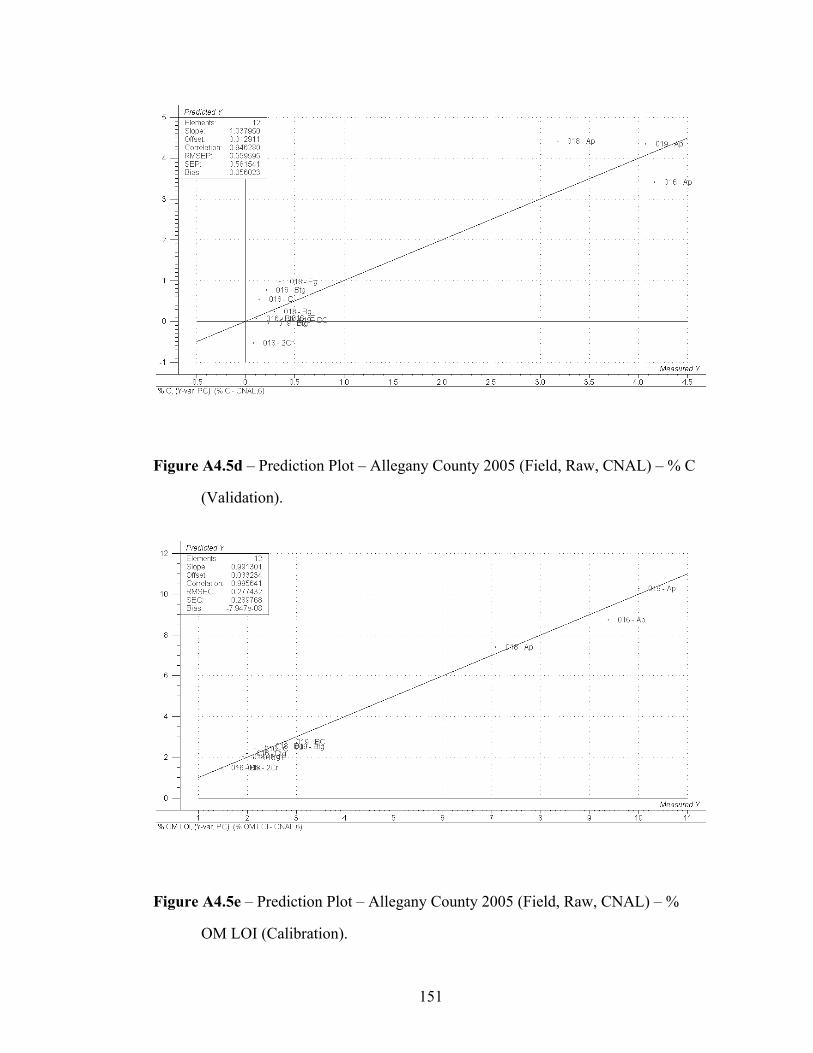
151
Figure A4.5d – Prediction Plot – Allegany County 2005 (Field, Raw, CNAL) – % C
(Validation).
Figure A4.5e – Prediction Plot – Allegany County 2005 (Field, Raw, CNAL) – %
OM LOI (Calibration).
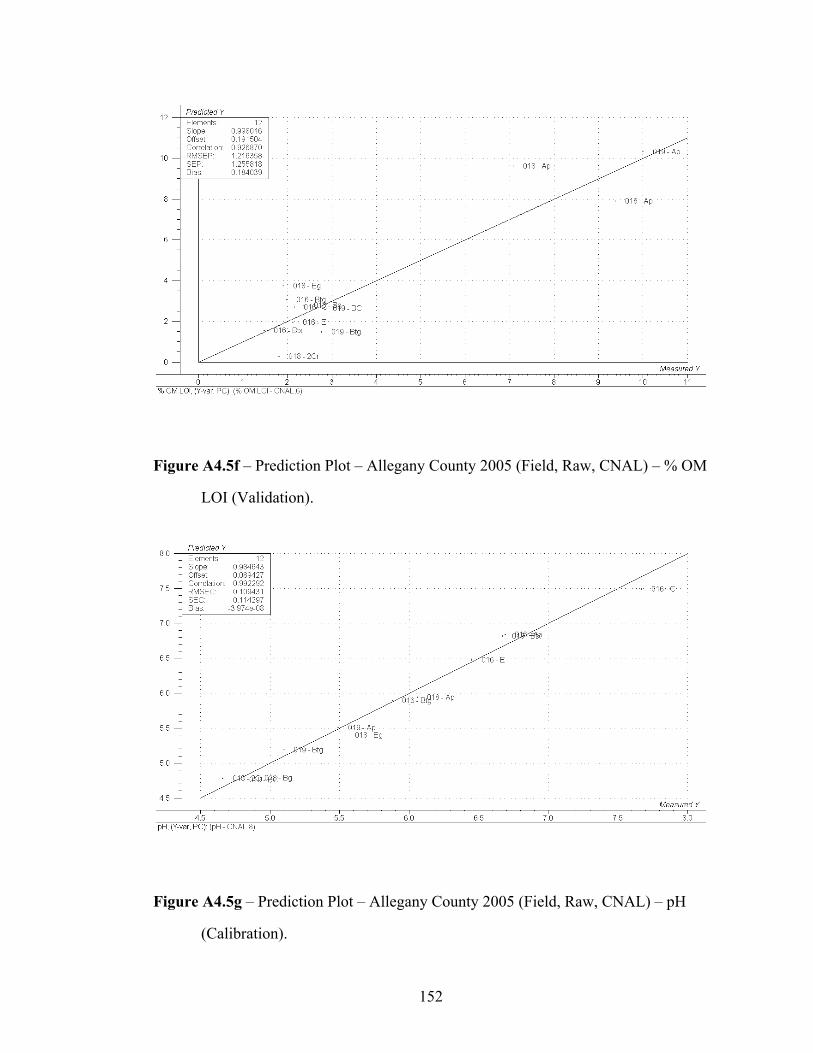
152
Figure A4.5f – Prediction Plot – Allegany County 2005 (Field, Raw, CNAL) – % OM
LOI (Validation).
Figure A4.5g – Prediction Plot – Allegany County 2005 (Field, Raw, CNAL) – pH
(Calibration).
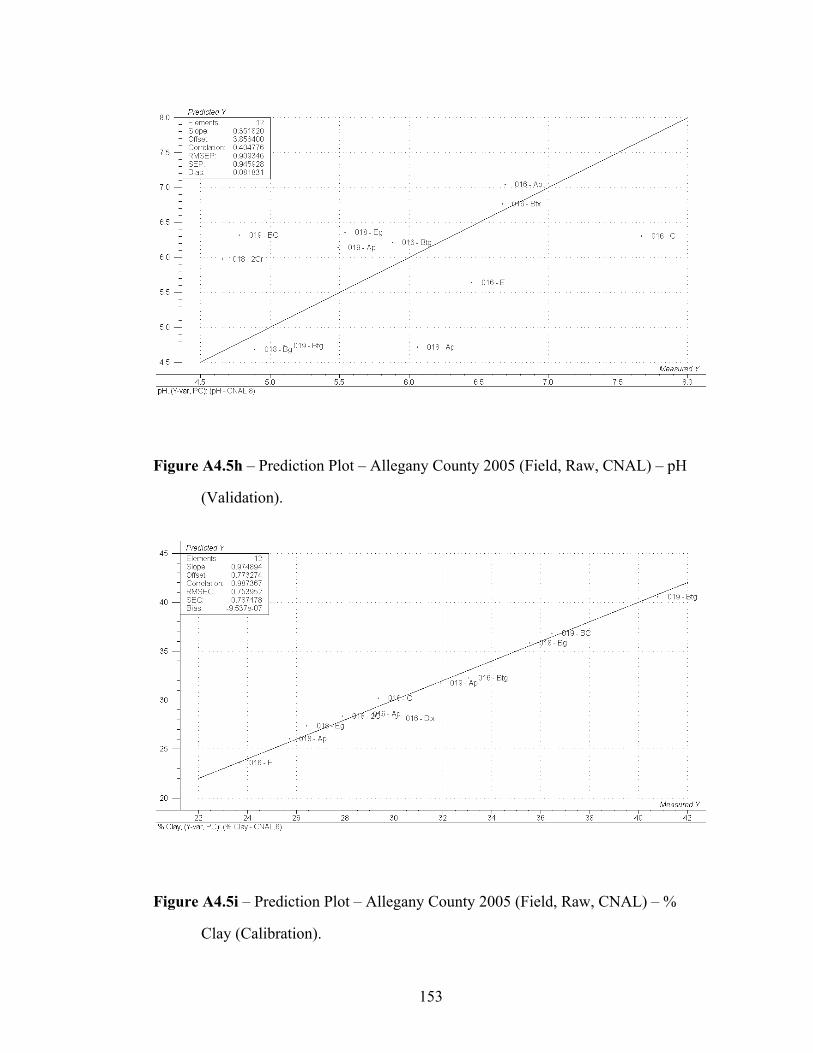
153
Figure A4.5h – Prediction Plot – Allegany County 2005 (Field, Raw, CNAL) – pH
(Validation).
Figure A4.5i – Prediction Plot – Allegany County 2005 (Field, Raw, CNAL) – %
Clay (Calibration).
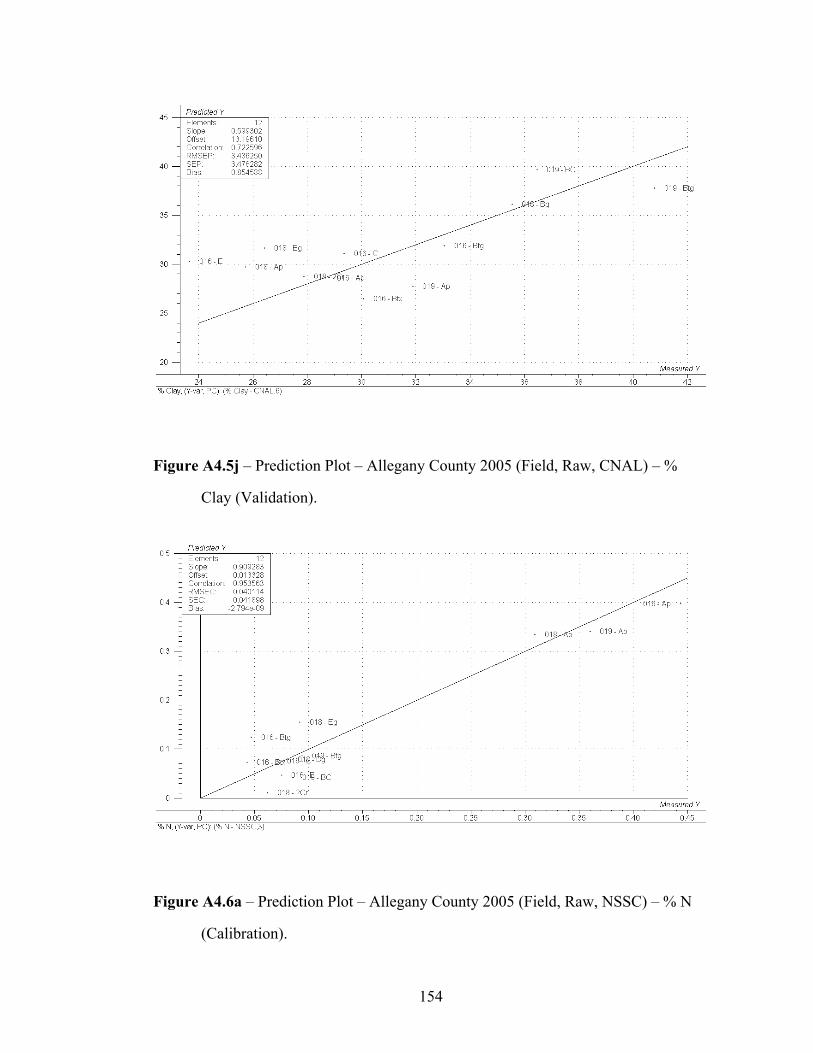
154
Figure A4.5j – Prediction Plot – Allegany County 2005 (Field, Raw, CNAL) – %
Clay (Validation).
Figure A4.6a – Prediction Plot – Allegany County 2005 (Field, Raw, NSSC) – % N
(Calibration).
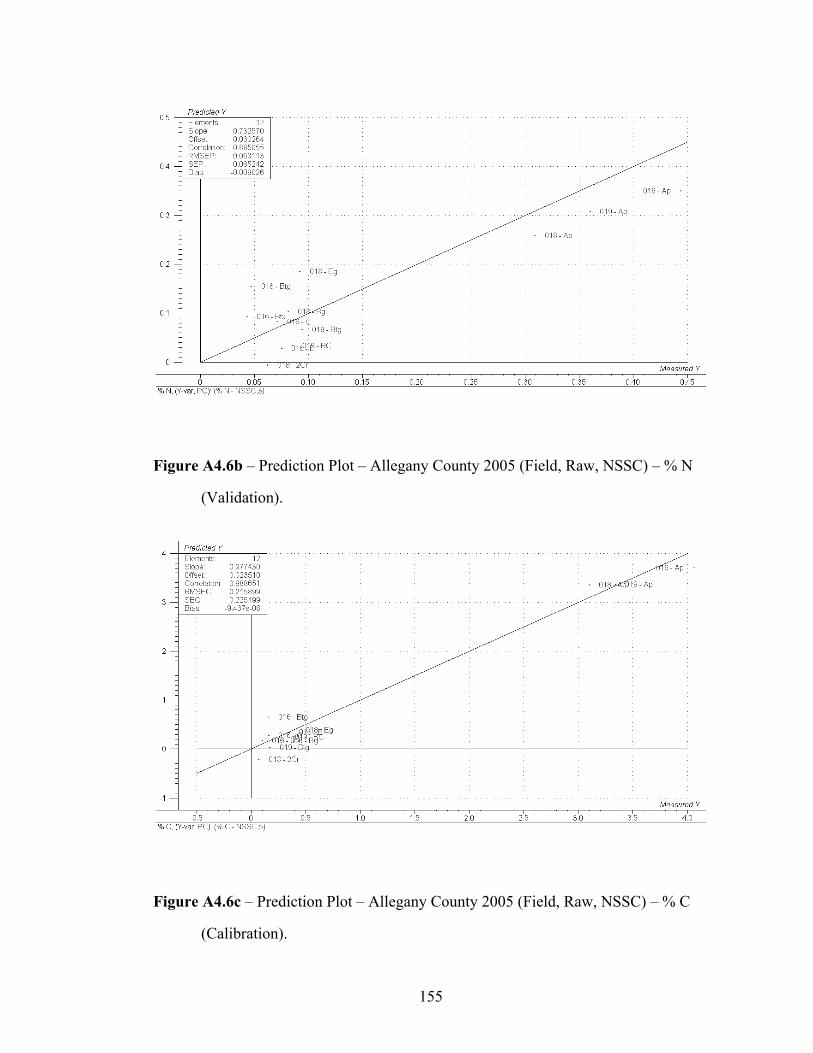
155
Figure A4.6b – Prediction Plot – Allegany County 2005 (Field, Raw, NSSC) – % N
(Validation).
Figure A4.6c – Prediction Plot – Allegany County 2005 (Field, Raw, NSSC) – % C
(Calibration).
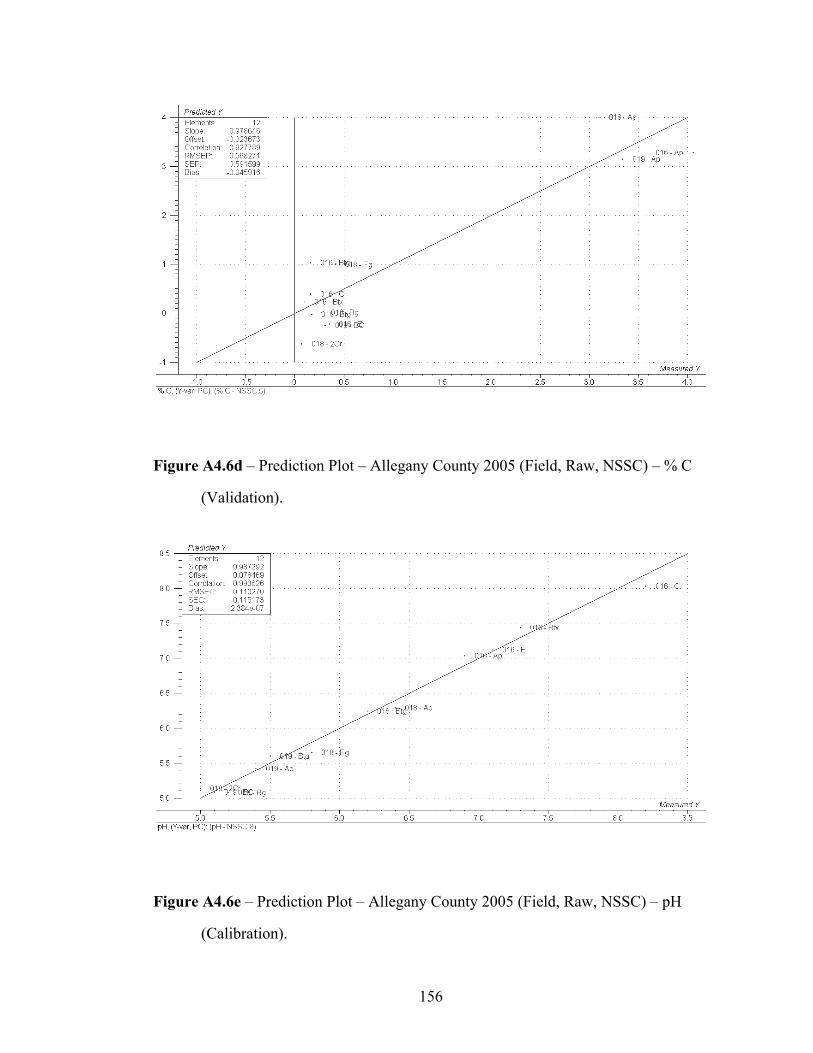
156
Figure A4.6d – Prediction Plot – Allegany County 2005 (Field, Raw, NSSC) – % C
(Validation).
Figure A4.6e – Prediction Plot – Allegany County 2005 (Field, Raw, NSSC) – pH
(Calibration).
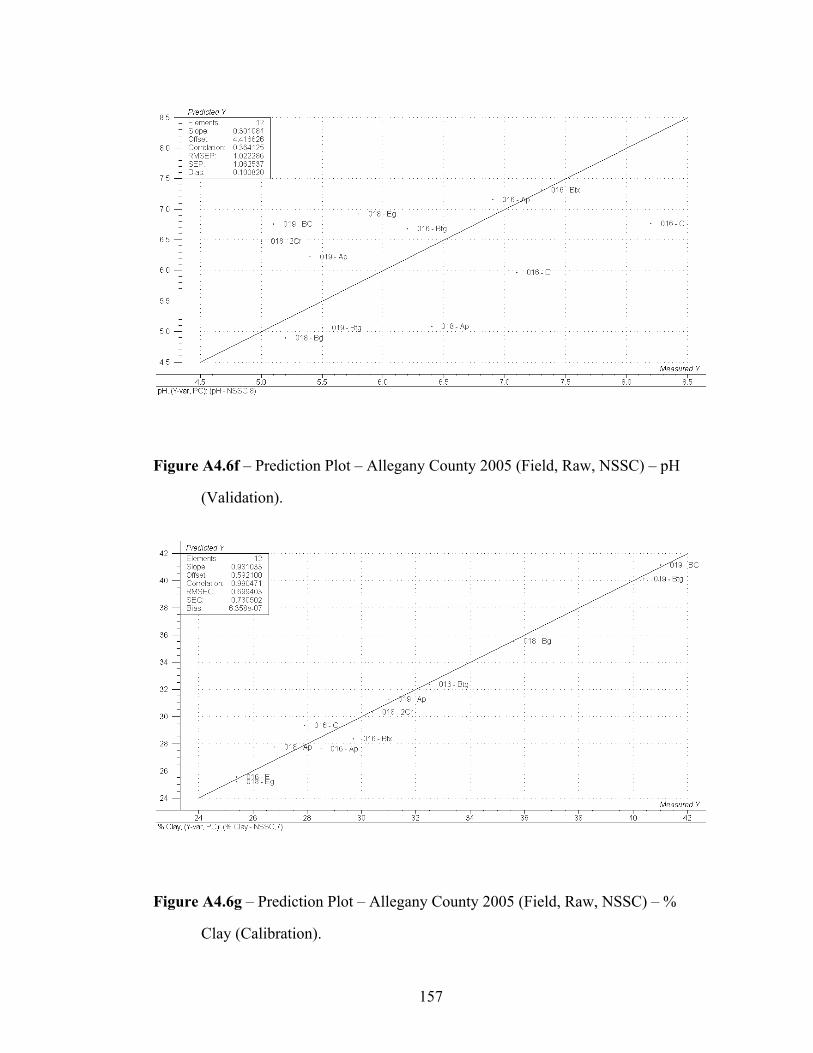
157
Figure A4.6f – Prediction Plot – Allegany County 2005 (Field, Raw, NSSC) – pH
(Validation).
Figure A4.6g – Prediction Plot – Allegany County 2005 (Field, Raw, NSSC) – %
Clay (Calibration).
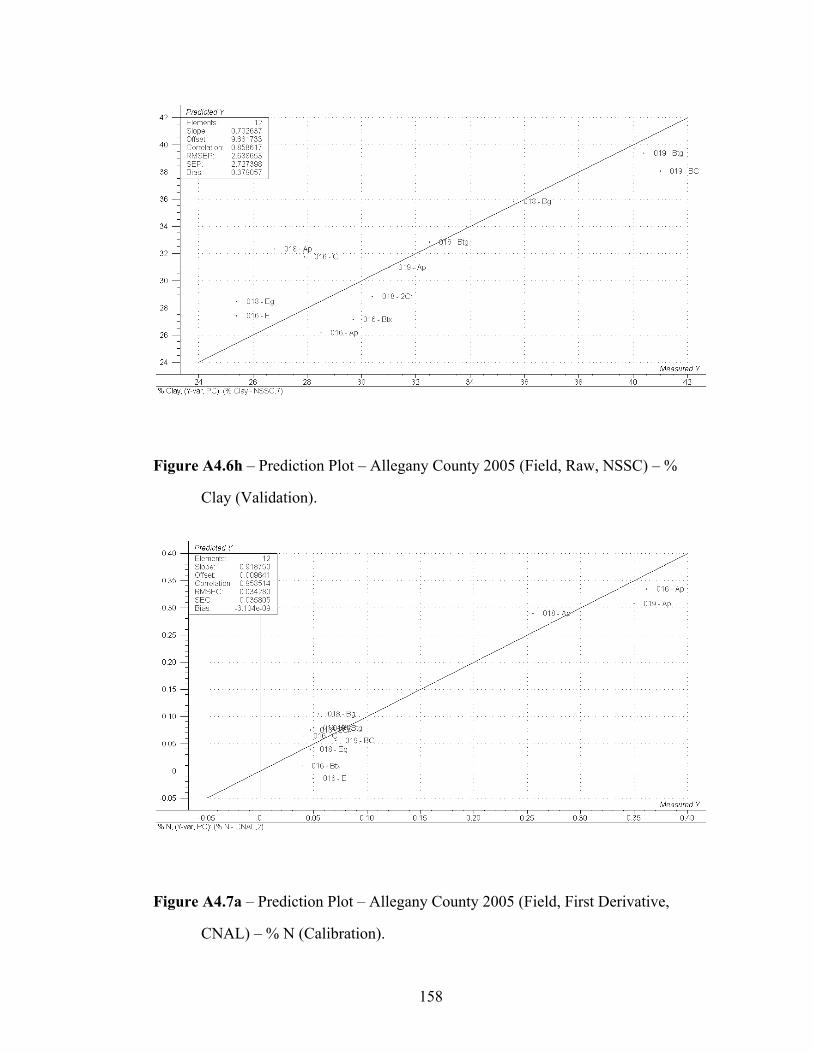
158
Figure A4.6h – Prediction Plot – Allegany County 2005 (Field, Raw, NSSC) – %
Clay (Validation).
Figure A4.7a – Prediction Plot – Allegany County 2005 (Field, First Derivative,
CNAL) – % N (Calibration).
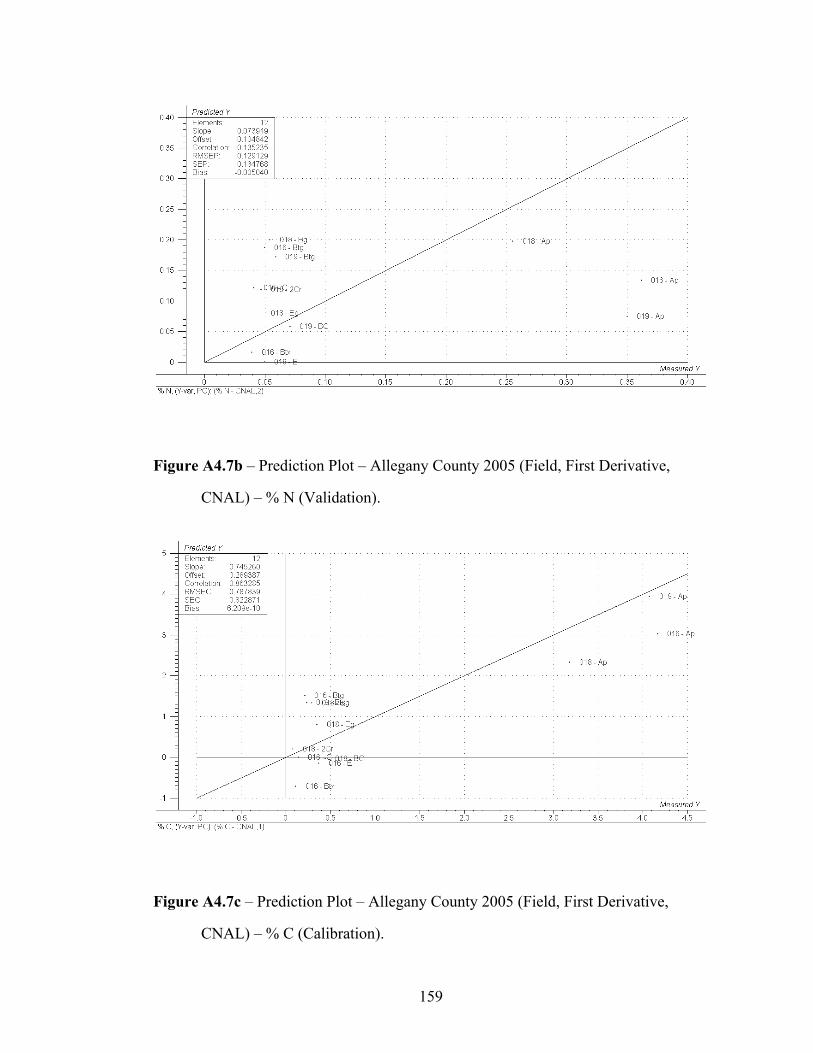
159
Figure A4.7b – Prediction Plot – Allegany County 2005 (Field, First Derivative,
CNAL) – % N (Validation).
Figure A4.7c – Prediction Plot – Allegany County 2005 (Field, First Derivative,
CNAL) – % C (Calibration).
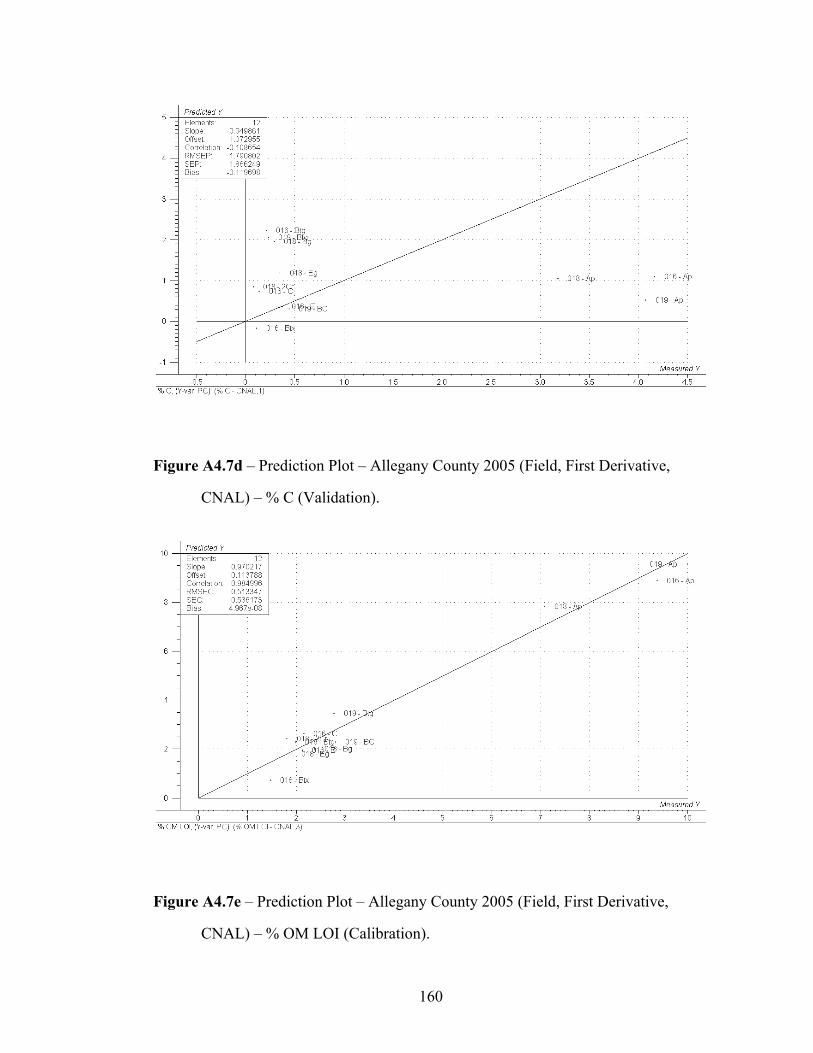
160
Figure A4.7d – Prediction Plot – Allegany County 2005 (Field, First Derivative,
CNAL) – % C (Validation).
Figure A4.7e – Prediction Plot – Allegany County 2005 (Field, First Derivative,
CNAL) – % OM LOI (Calibration).
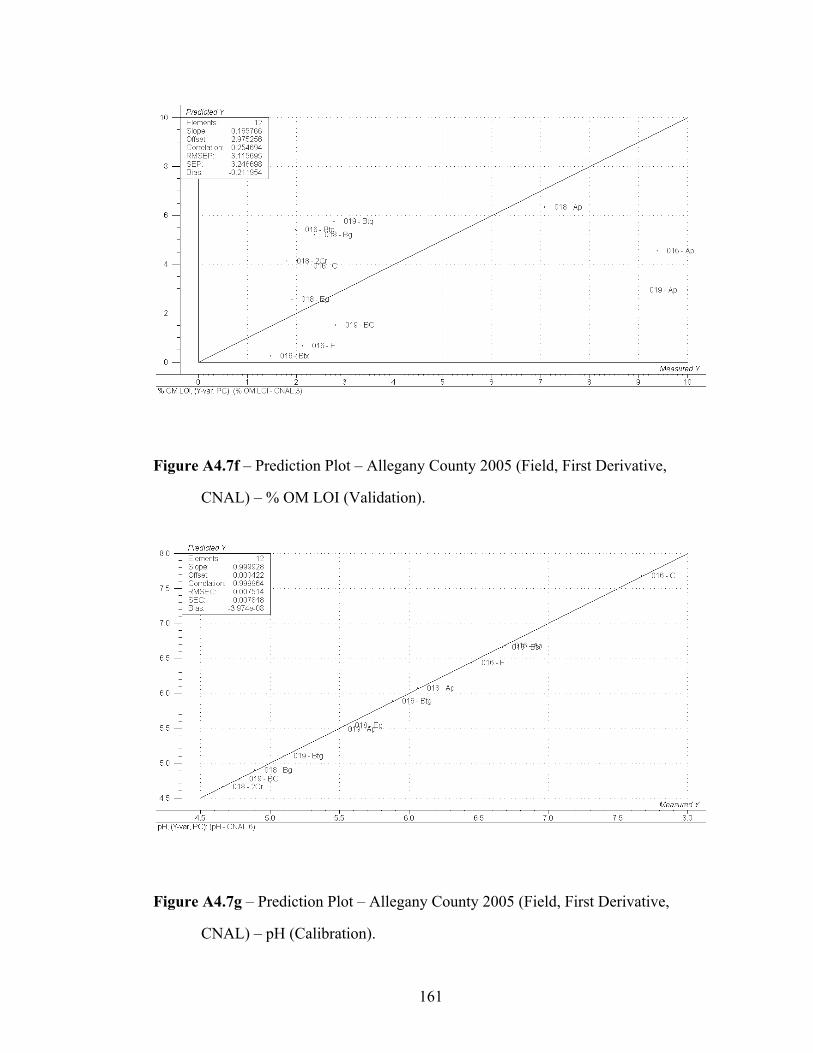
161
Figure A4.7f – Prediction Plot – Allegany County 2005 (Field, First Derivative,
CNAL) – % OM LOI (Validation).
Figure A4.7g – Prediction Plot – Allegany County 2005 (Field, First Derivative,
CNAL) – pH (Calibration).
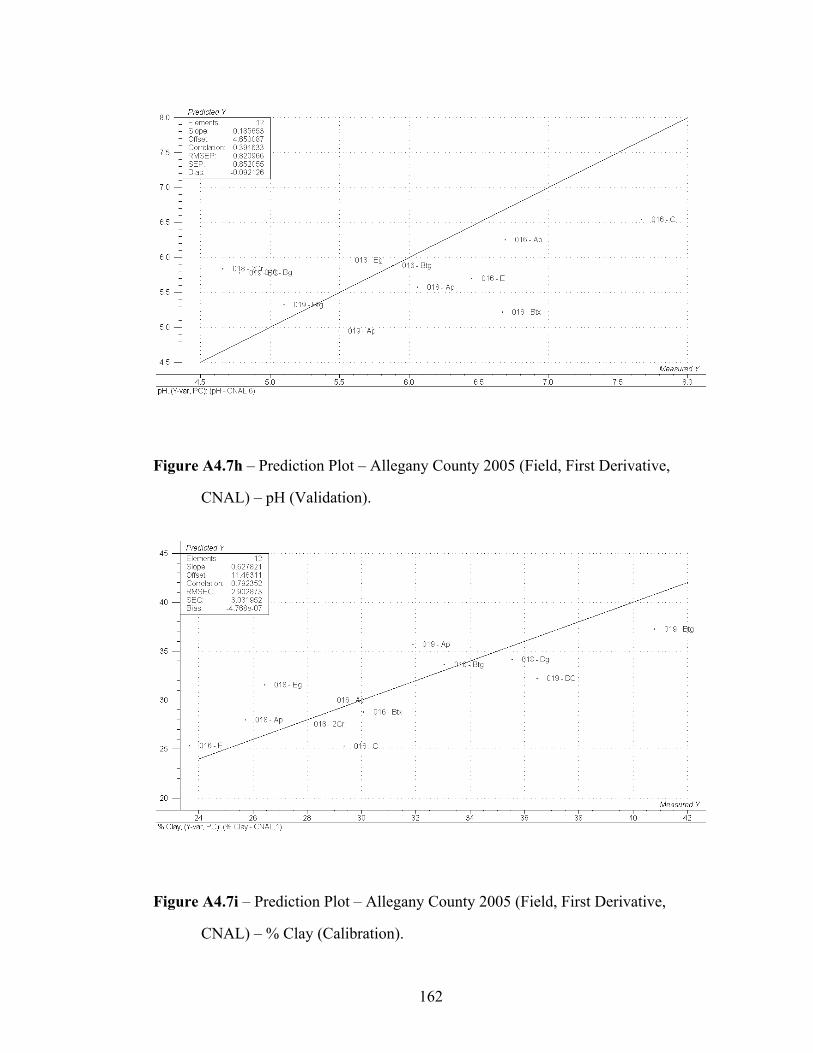
162
Figure A4.7h – Prediction Plot – Allegany County 2005 (Field, First Derivative,
CNAL) – pH (Validation).
Figure A4.7i – Prediction Plot – Allegany County 2005 (Field, First Derivative,
CNAL) – % Clay (Calibration).
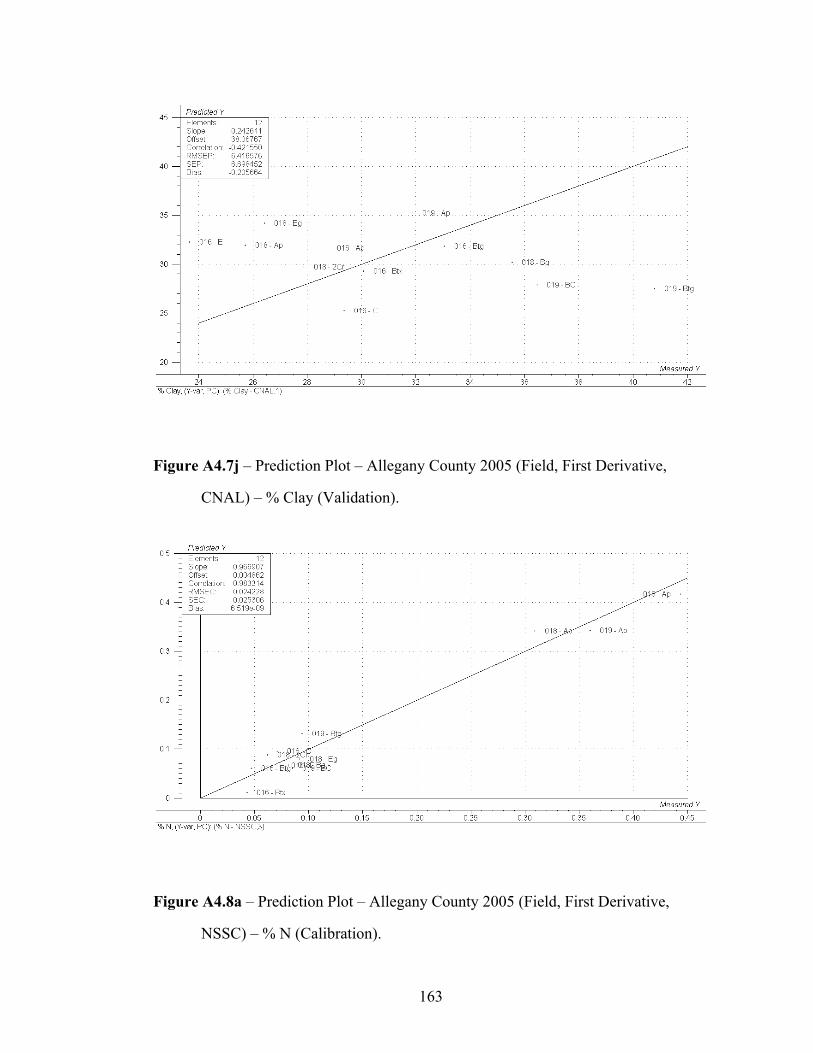
163
Figure A4.7j – Prediction Plot – Allegany County 2005 (Field, First Derivative,
CNAL) – % Clay (Validation).
Figure A4.8a – Prediction Plot – Allegany County 2005 (Field, First Derivative,
NSSC) – % N (Calibration).
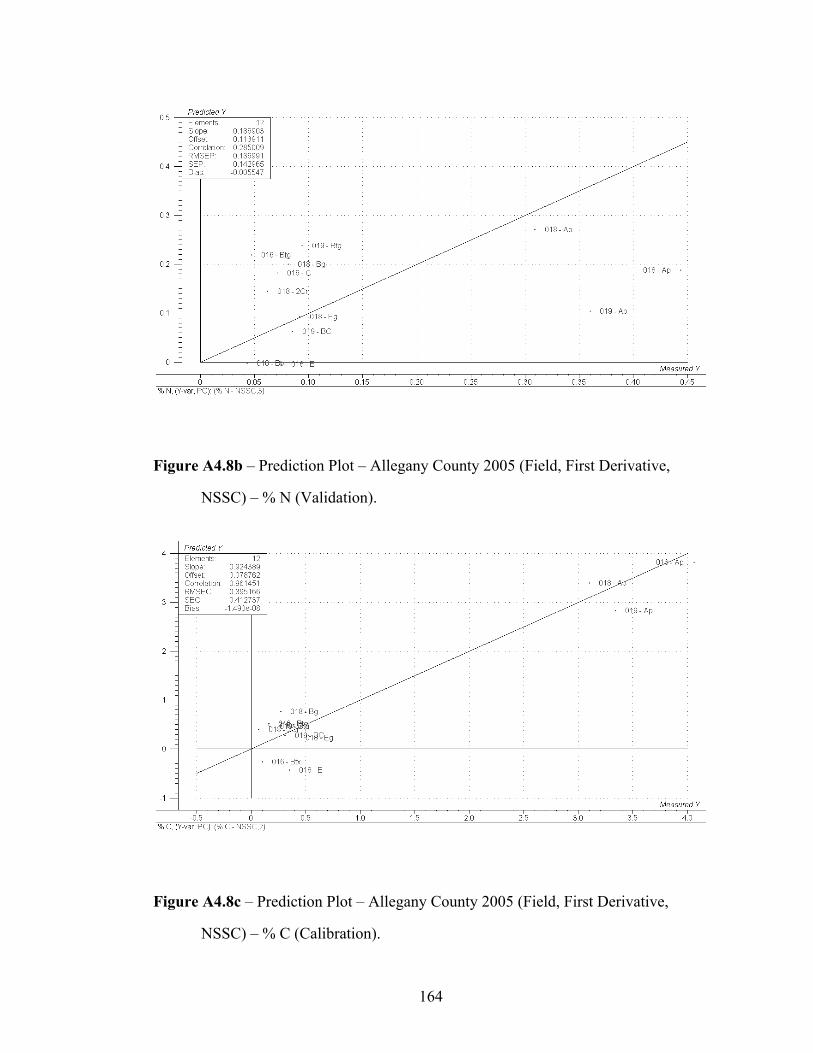
164
Figure A4.8b – Prediction Plot – Allegany County 2005 (Field, First Derivative,
NSSC) – % N (Validation).
Figure A4.8c – Prediction Plot – Allegany County 2005 (Field, First Derivative,
NSSC) – % C (Calibration).
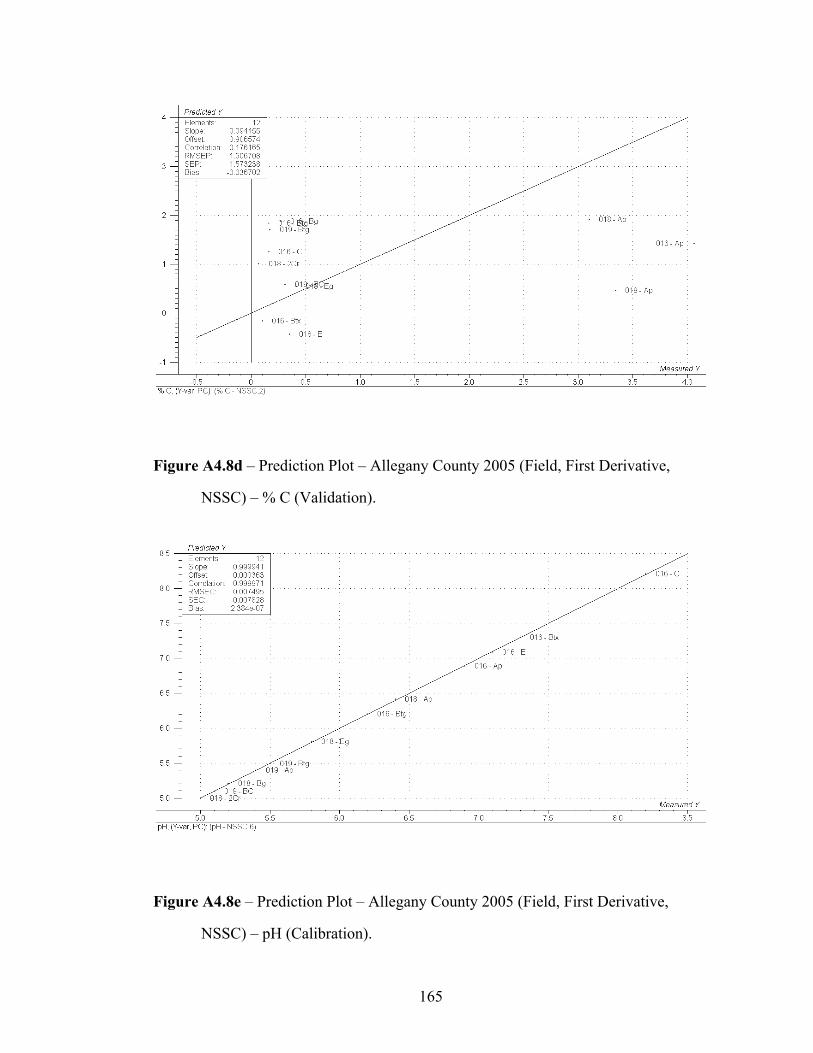
165
Figure A4.8d – Prediction Plot – Allegany County 2005 (Field, First Derivative,
NSSC) – % C (Validation).
Figure A4.8e – Prediction Plot – Allegany County 2005 (Field, First Derivative,
NSSC) – pH (Calibration).
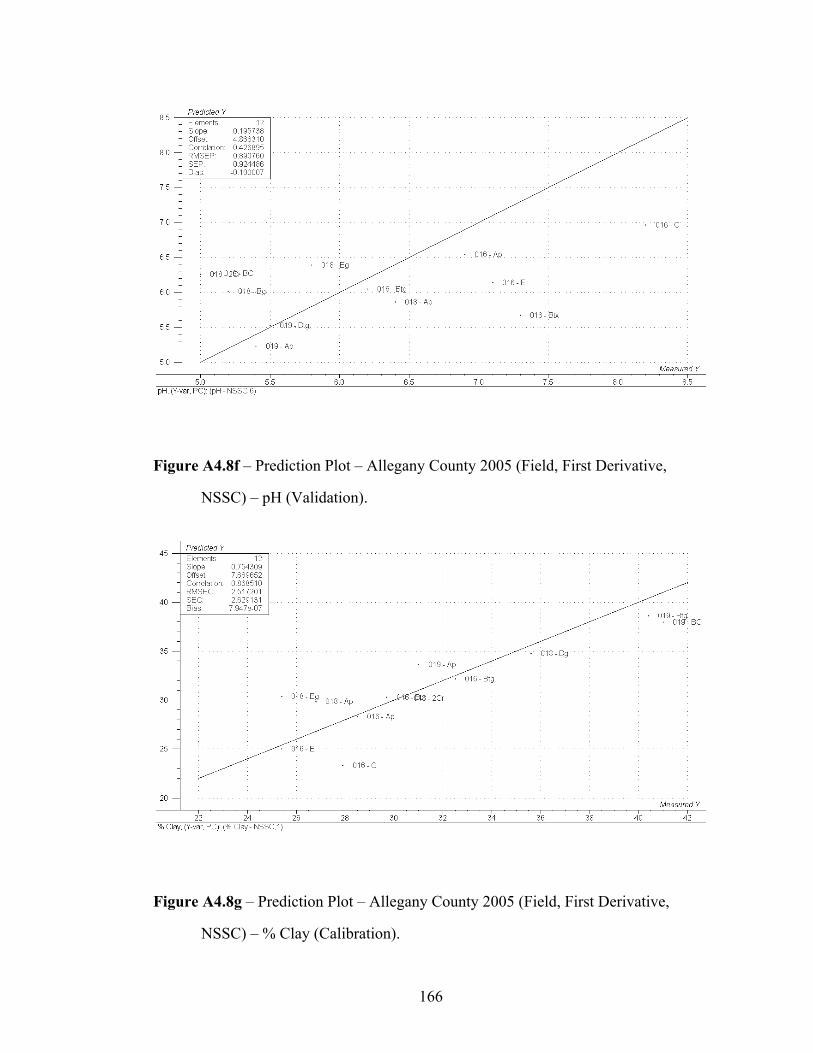
166
Figure A4.8f – Prediction Plot – Allegany County 2005 (Field, First Derivative,
NSSC) – pH (Validation).
Figure A4.8g – Prediction Plot – Allegany County 2005 (Field, First Derivative,
NSSC) – % Clay (Calibration).
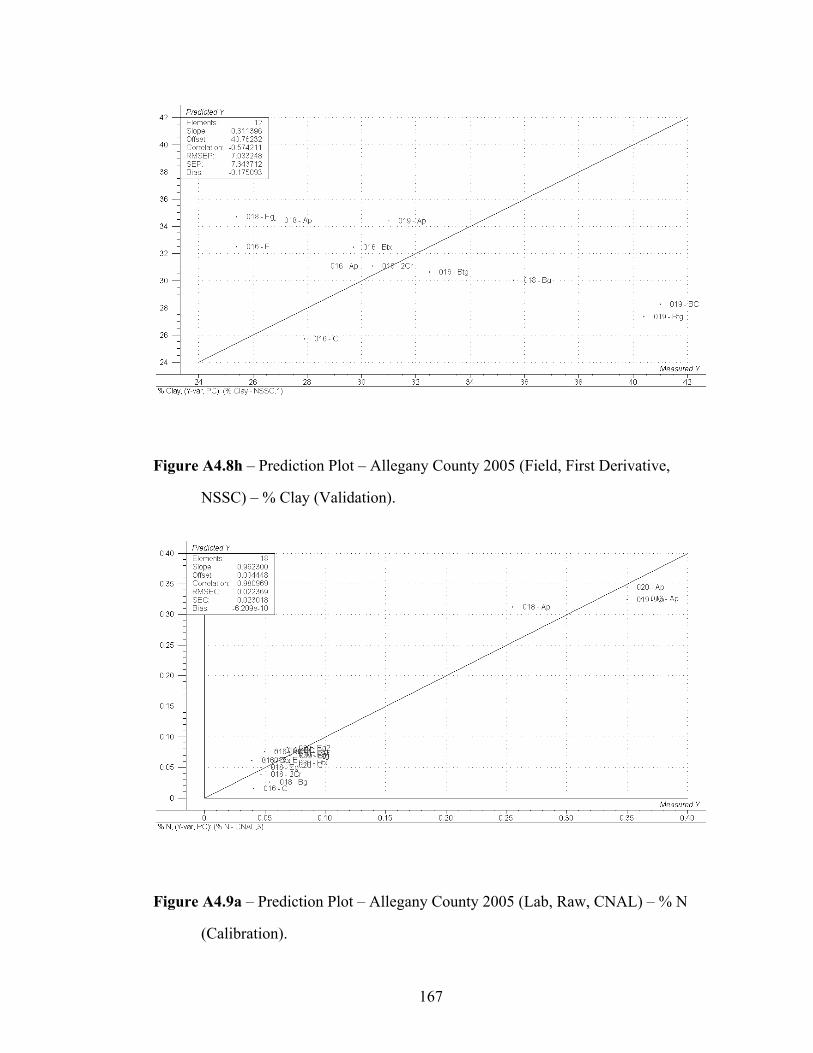
167
Figure A4.8h – Prediction Plot – Allegany County 2005 (Field, First Derivative,
NSSC) – % Clay (Validation).
Figure A4.9a – Prediction Plot – Allegany County 2005 (Lab, Raw, CNAL) – % N
(Calibration).
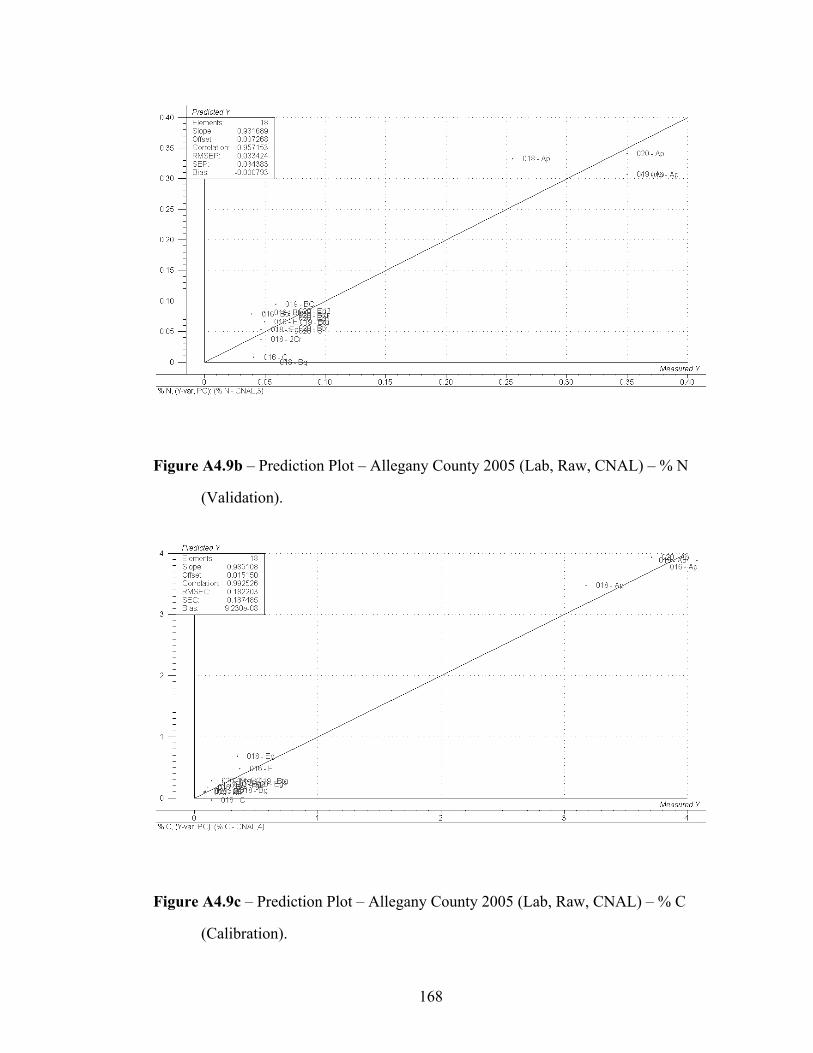
168
Figure A4.9b – Prediction Plot – Allegany County 2005 (Lab, Raw, CNAL) – % N
(Validation).
Figure A4.9c – Prediction Plot – Allegany County 2005 (Lab, Raw, CNAL) – % C
(Calibration).
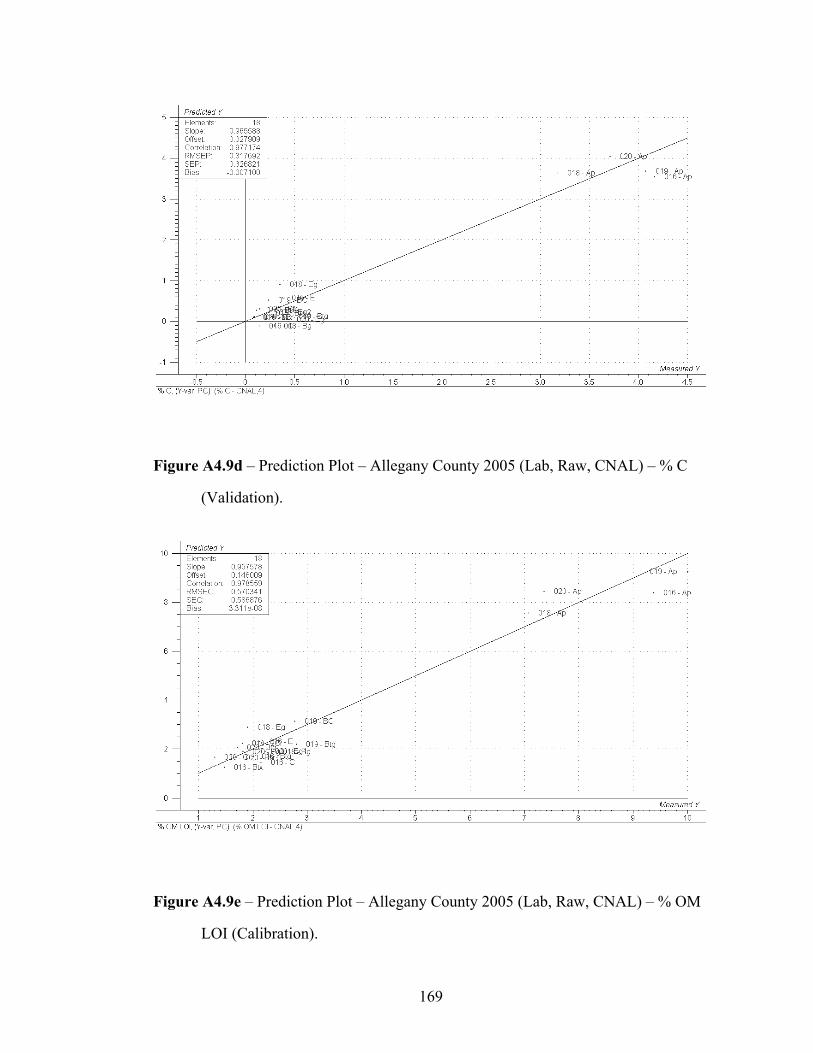
169
Figure A4.9d – Prediction Plot – Allegany County 2005 (Lab, Raw, CNAL) – % C
(Validation).
Figure A4.9e – Prediction Plot – Allegany County 2005 (Lab, Raw, CNAL) – % OM
LOI (Calibration).
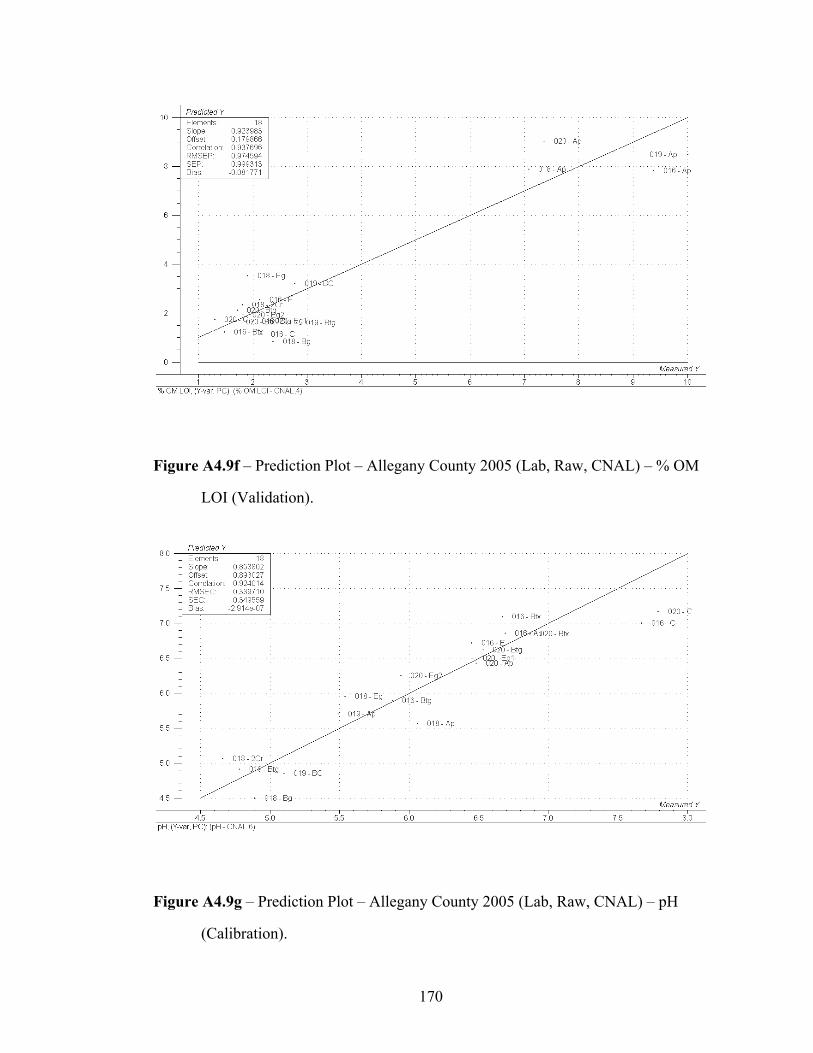
170
Figure A4.9f – Prediction Plot – Allegany County 2005 (Lab, Raw, CNAL) – % OM
LOI (Validation).
Figure A4.9g – Prediction Plot – Allegany County 2005 (Lab, Raw, CNAL) – pH
(Calibration).
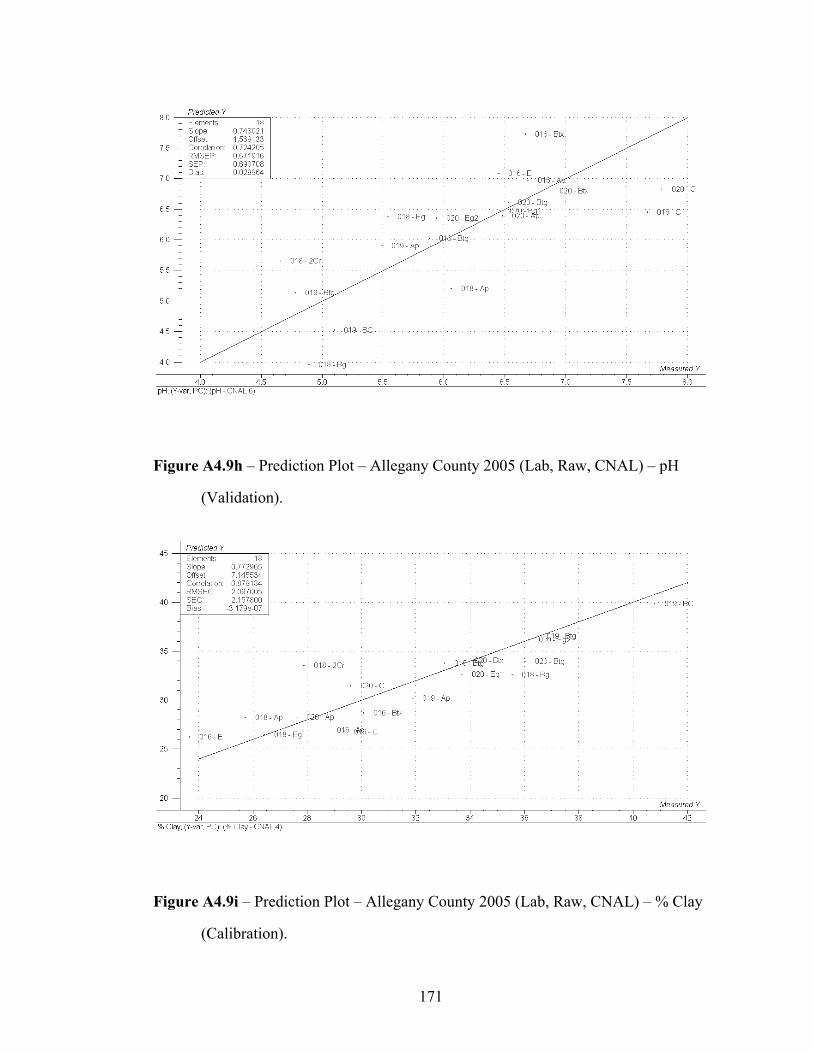
171
Figure A4.9h – Prediction Plot – Allegany County 2005 (Lab, Raw, CNAL) – pH
(Validation).
Figure A4.9i – Prediction Plot – Allegany County 2005 (Lab, Raw, CNAL) – % Clay
(Calibration).
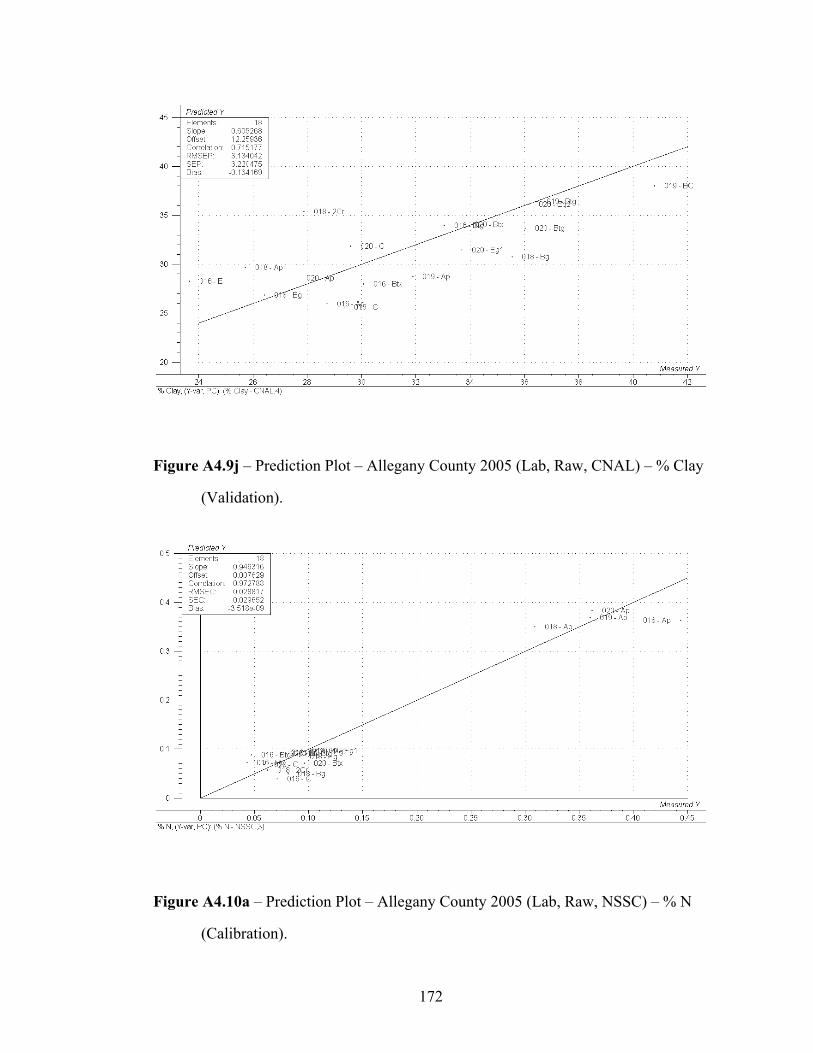
172
Figure A4.9j – Prediction Plot – Allegany County 2005 (Lab, Raw, CNAL) – % Clay
(Validation).
Figure A4.10a – Prediction Plot – Allegany County 2005 (Lab, Raw, NSSC) – % N
(Calibration).
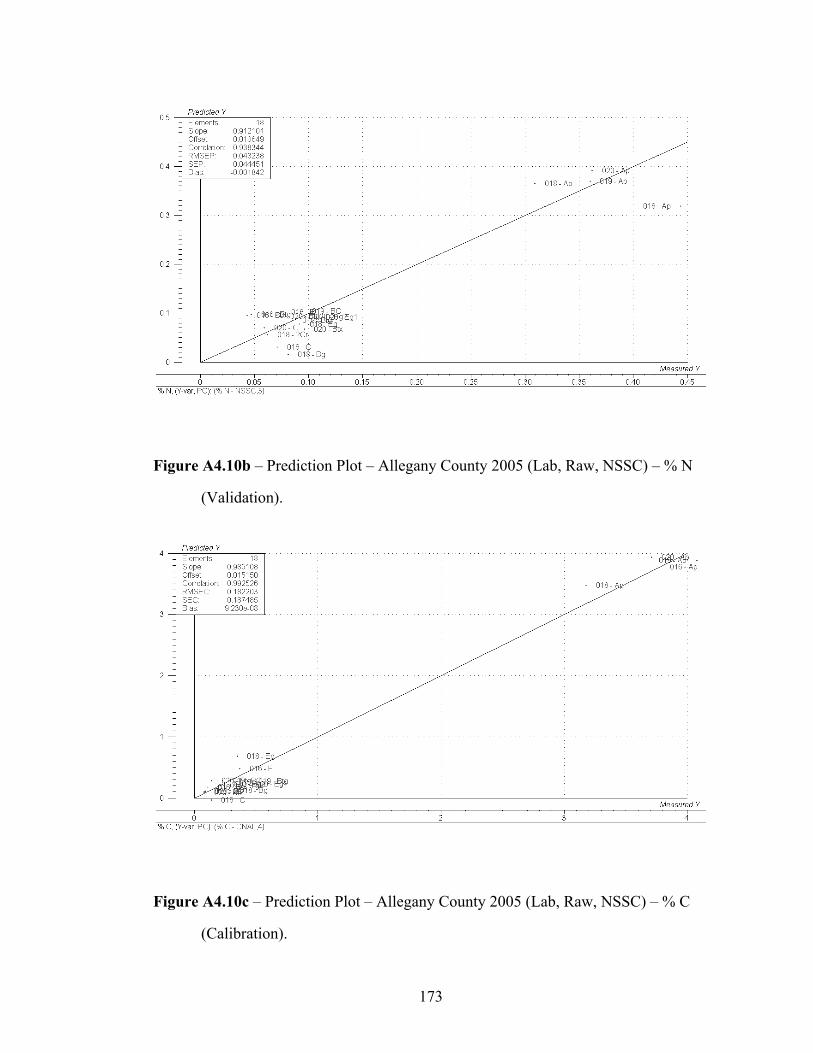
173
Figure A4.10b – Prediction Plot – Allegany County 2005 (Lab, Raw, NSSC) – % N
(Validation).
Figure A4.10c – Prediction Plot – Allegany County 2005 (Lab, Raw, NSSC) – % C
(Calibration).
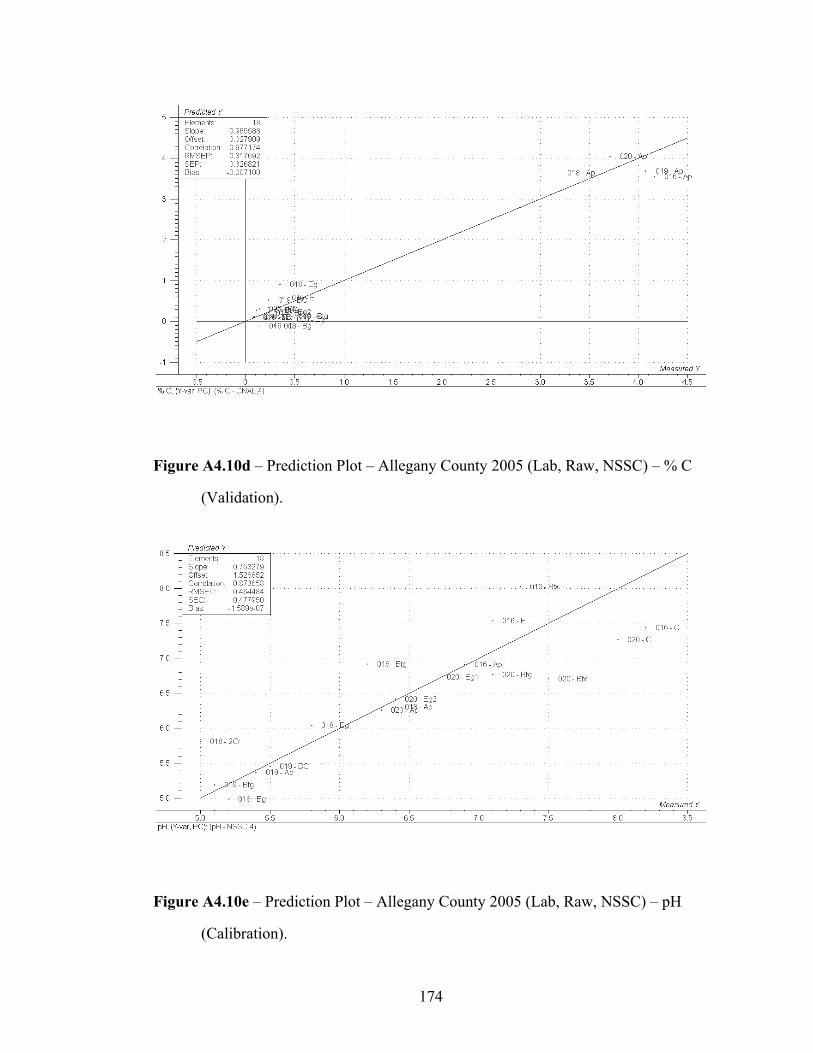
174
Figure A4.10d – Prediction Plot – Allegany County 2005 (Lab, Raw, NSSC) – % C
(Validation).
Figure A4.10e – Prediction Plot – Allegany County 2005 (Lab, Raw, NSSC) – pH
(Calibration).
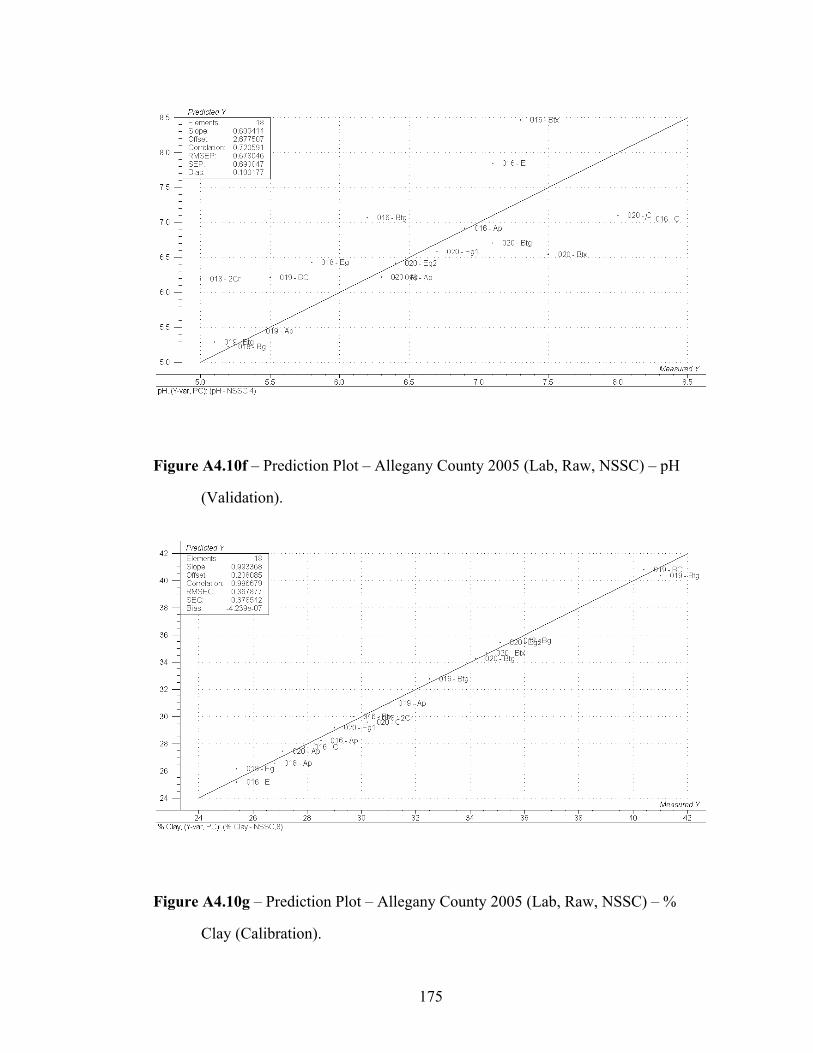
175
Figure A4.10f – Prediction Plot – Allegany County 2005 (Lab, Raw, NSSC) – pH
(Validation).
Figure A4.10g – Prediction Plot – Allegany County 2005 (Lab, Raw, NSSC) – %
Clay (Calibration).
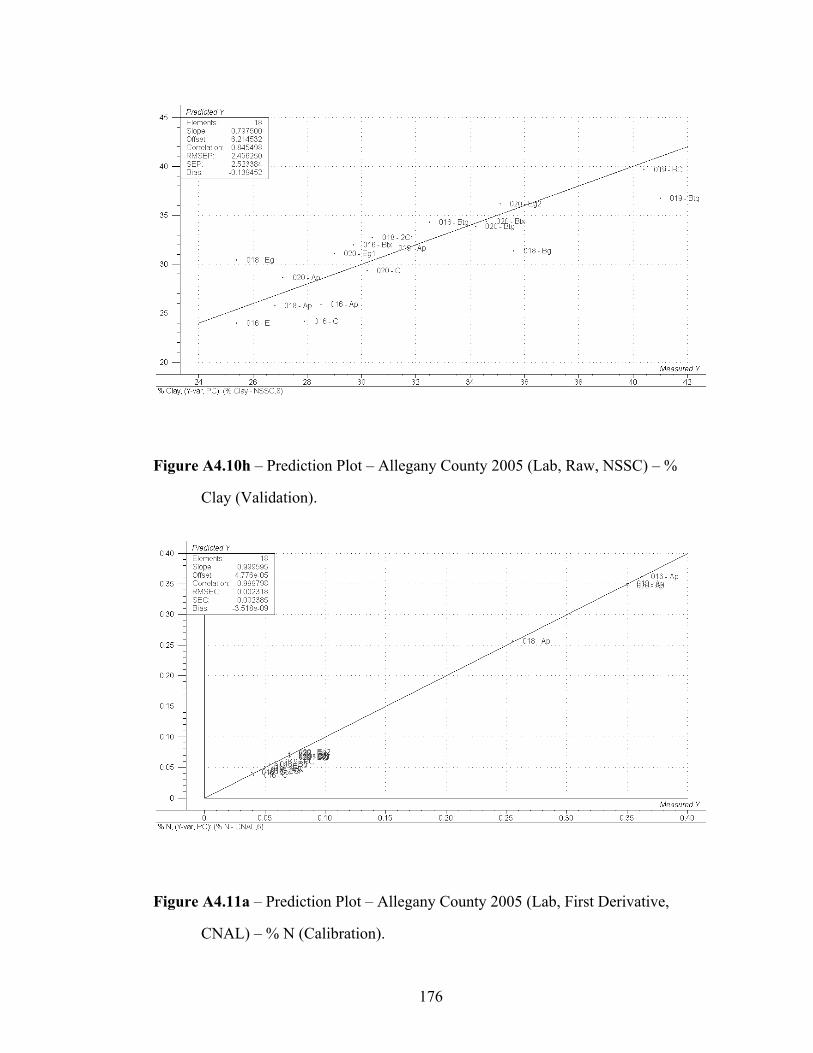
176
Figure A4.10h – Prediction Plot – Allegany County 2005 (Lab, Raw, NSSC) – %
Clay (Validation).
Figure A4.11a – Prediction Plot – Allegany County 2005 (Lab, First Derivative,
CNAL) – % N (Calibration).
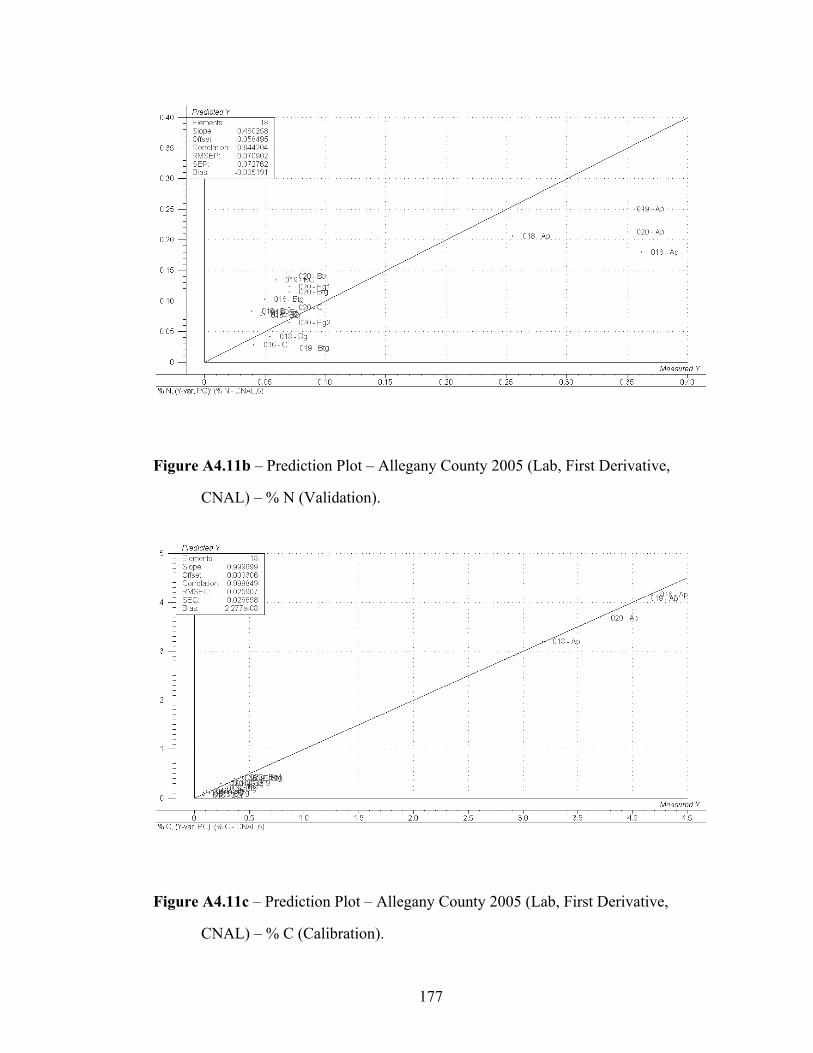
177
Figure A4.11b – Prediction Plot – Allegany County 2005 (Lab, First Derivative,
CNAL) – % N (Validation).
Figure A4.11c – Prediction Plot – Allegany County 2005 (Lab, First Derivative,
CNAL) – % C (Calibration).
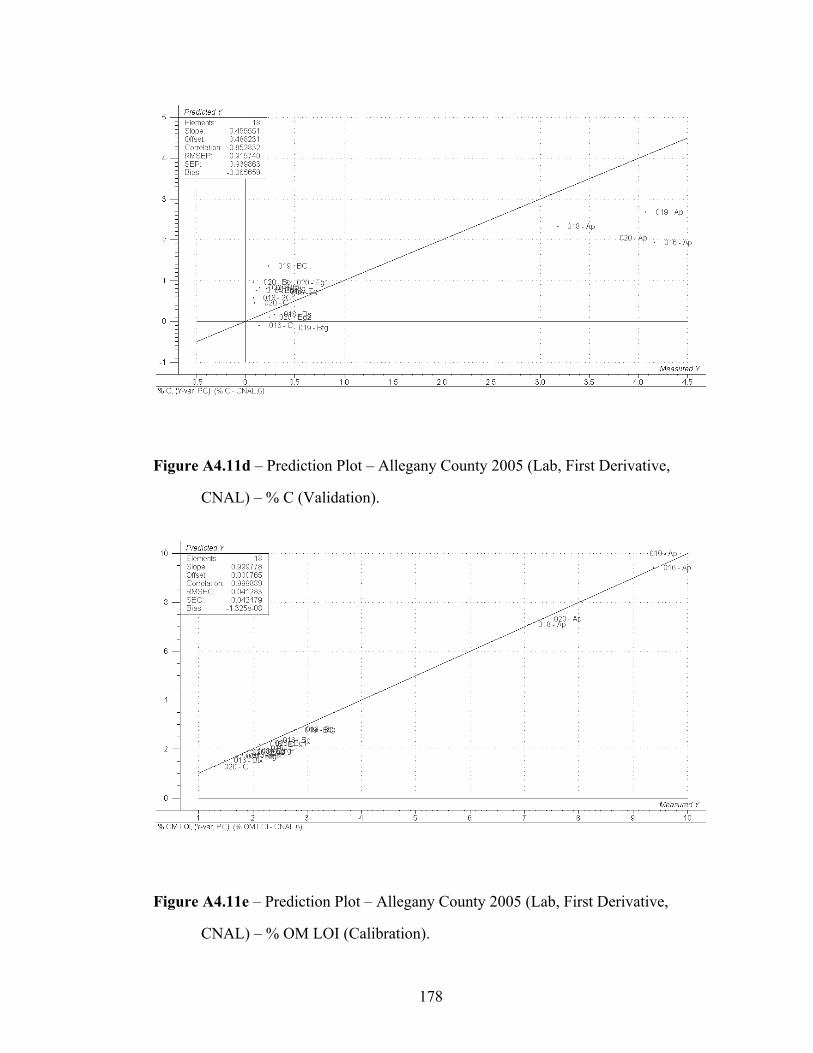
178
Figure A4.11d – Prediction Plot – Allegany County 2005 (Lab, First Derivative,
CNAL) – % C (Validation).
Figure A4.11e – Prediction Plot – Allegany County 2005 (Lab, First Derivative,
CNAL) – % OM LOI (Calibration).
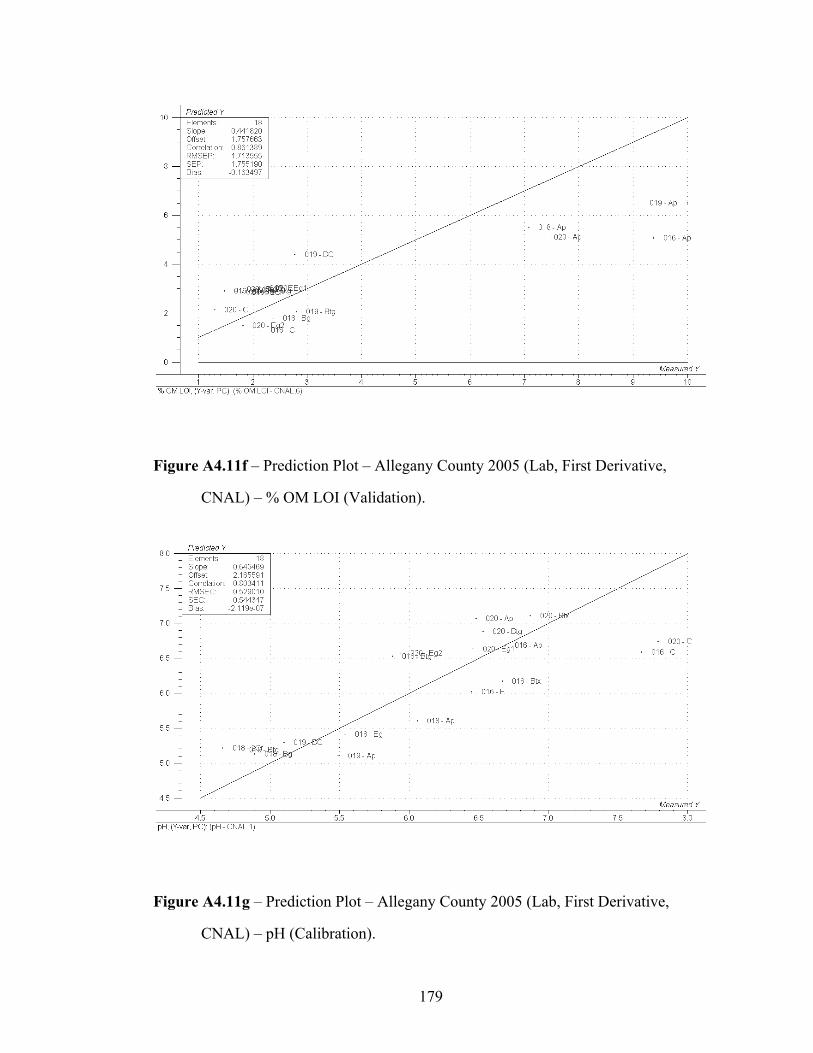
179
Figure A4.11f – Prediction Plot – Allegany County 2005 (Lab, First Derivative,
CNAL) – % OM LOI (Validation).
Figure A4.11g – Prediction Plot – Allegany County 2005 (Lab, First Derivative,
CNAL) – pH (Calibration).
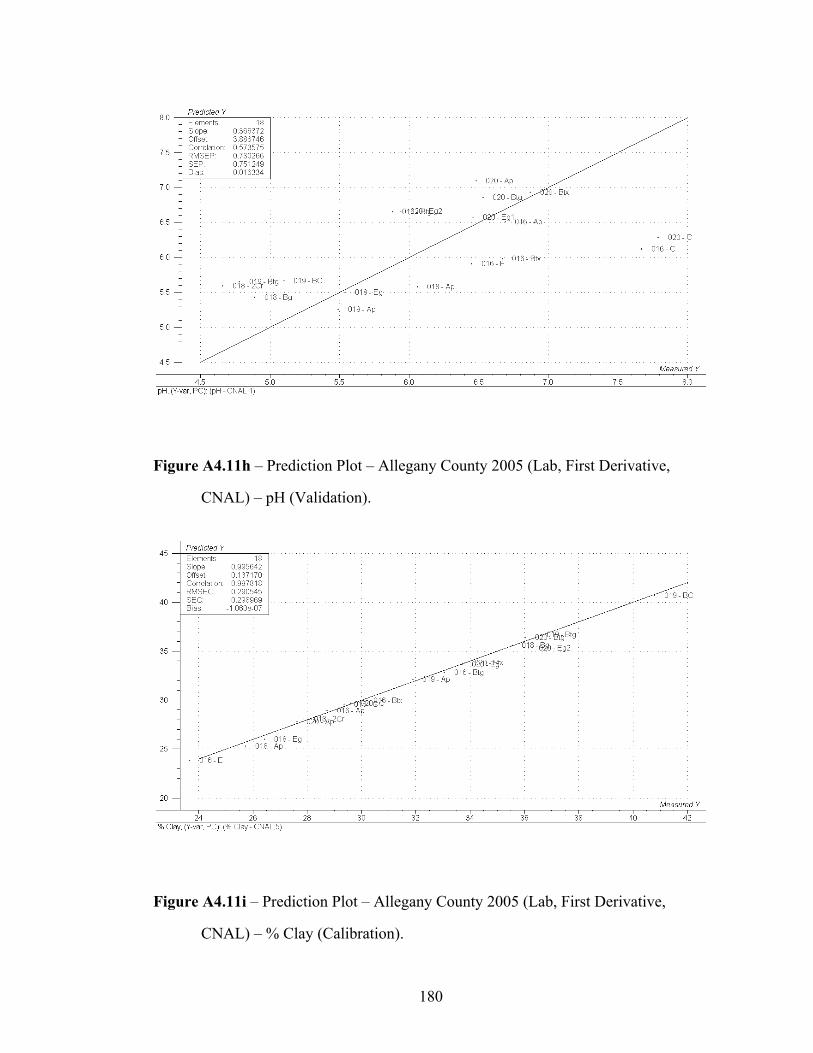
180
Figure A4.11h – Prediction Plot – Allegany County 2005 (Lab, First Derivative,
CNAL) – pH (Validation).
Figure A4.11i – Prediction Plot – Allegany County 2005 (Lab, First Derivative,
CNAL) – % Clay (Calibration).
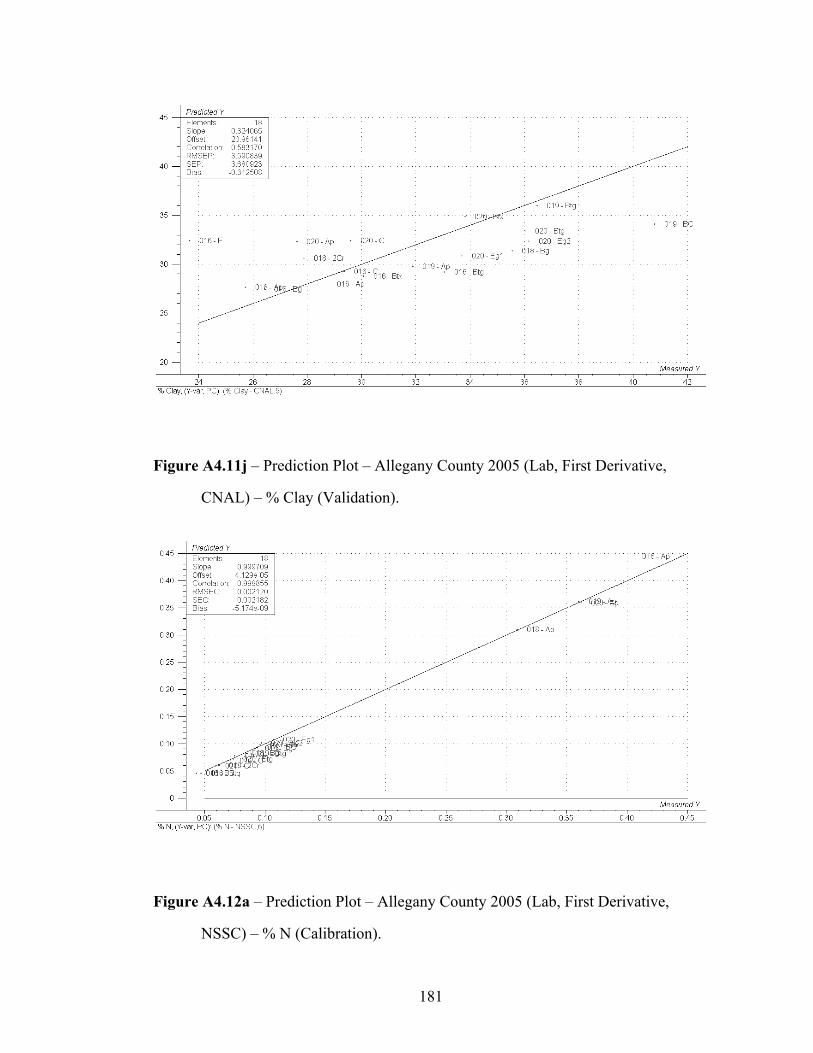
181
Figure A4.11j – Prediction Plot – Allegany County 2005 (Lab, First Derivative,
CNAL) – % Clay (Validation).
Figure A4.12a – Prediction Plot – Allegany County 2005 (Lab, First Derivative,
NSSC) – % N (Calibration).
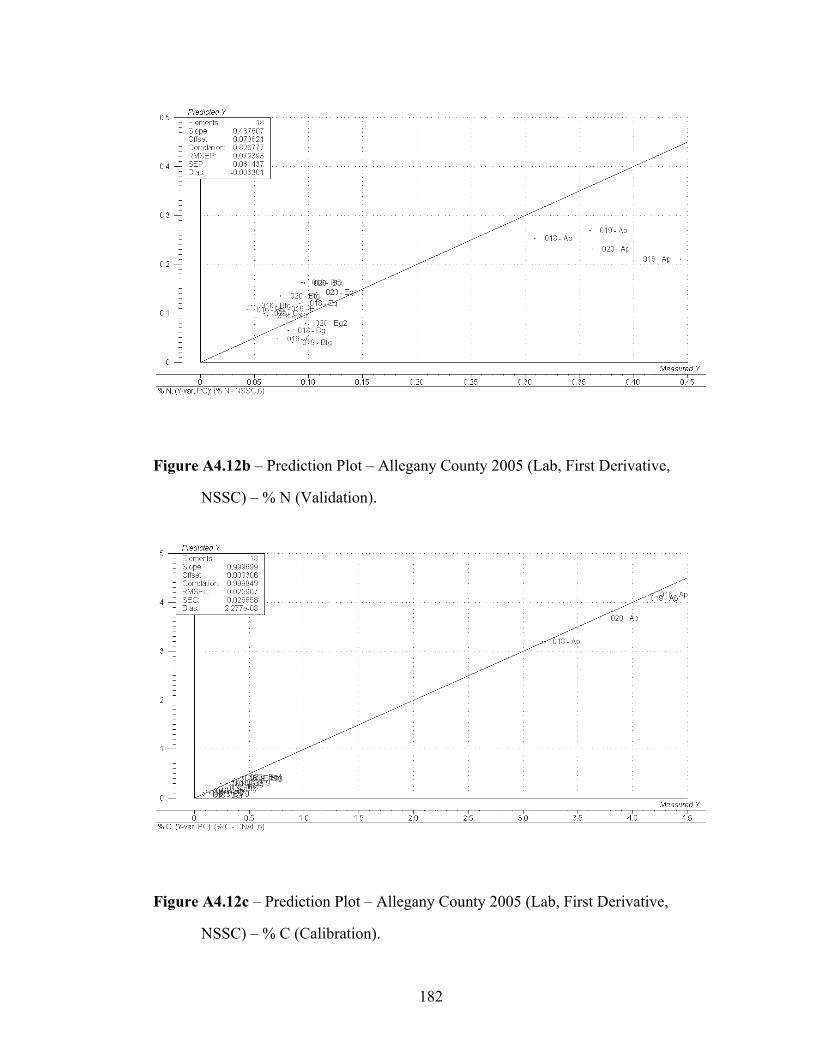
182
Figure A4.12b – Prediction Plot – Allegany County 2005 (Lab, First Derivative,
NSSC) – % N (Validation).
Figure A4.12c – Prediction Plot – Allegany County 2005 (Lab, First Derivative,
NSSC) – % C (Calibration).
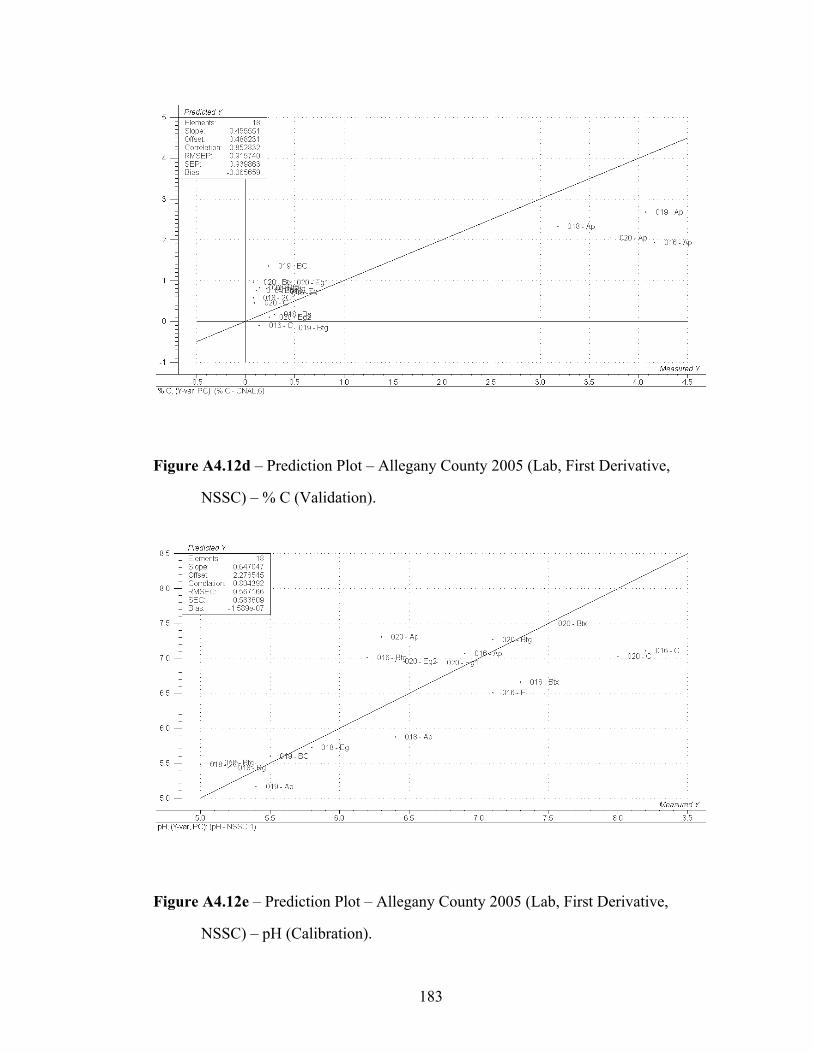
183
Figure A4.12d – Prediction Plot – Allegany County 2005 (Lab, First Derivative,
NSSC) – % C (Validation).
Figure A4.12e – Prediction Plot – Allegany County 2005 (Lab, First Derivative,
NSSC) – pH (Calibration).
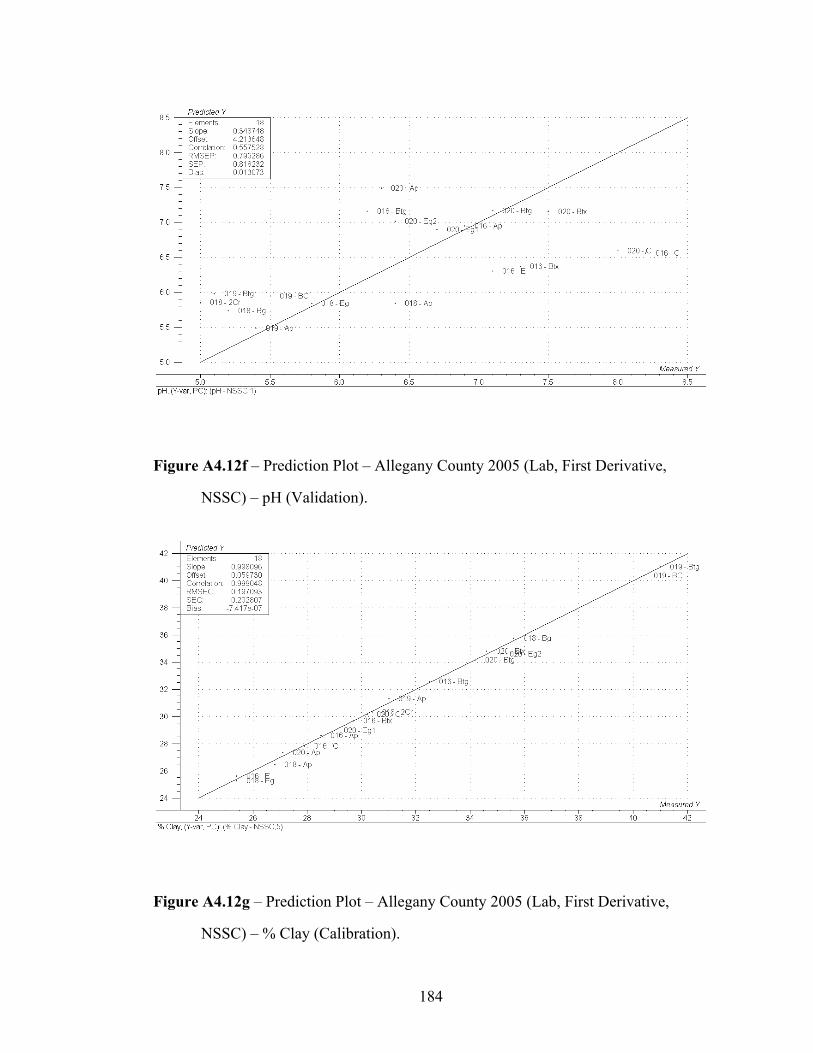
184
Figure A4.12f – Prediction Plot – Allegany County 2005 (Lab, First Derivative,
NSSC) – pH (Validation).
Figure A4.12g – Prediction Plot – Allegany County 2005 (Lab, First Derivative,
NSSC) – % Clay (Calibration).
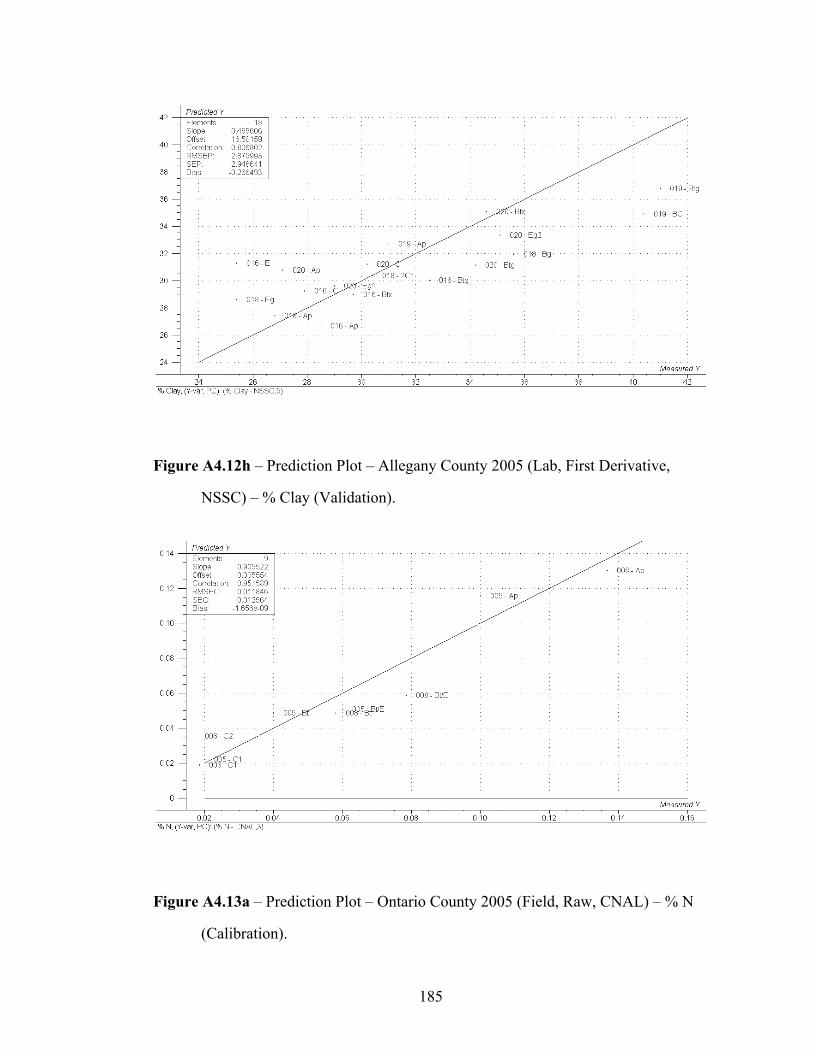
185
Figure A4.12h – Prediction Plot – Allegany County 2005 (Lab, First Derivative,
NSSC) – % Clay (Validation).
Figure A4.13a – Prediction Plot – Ontario County 2005 (Field, Raw, CNAL) – % N
(Calibration).
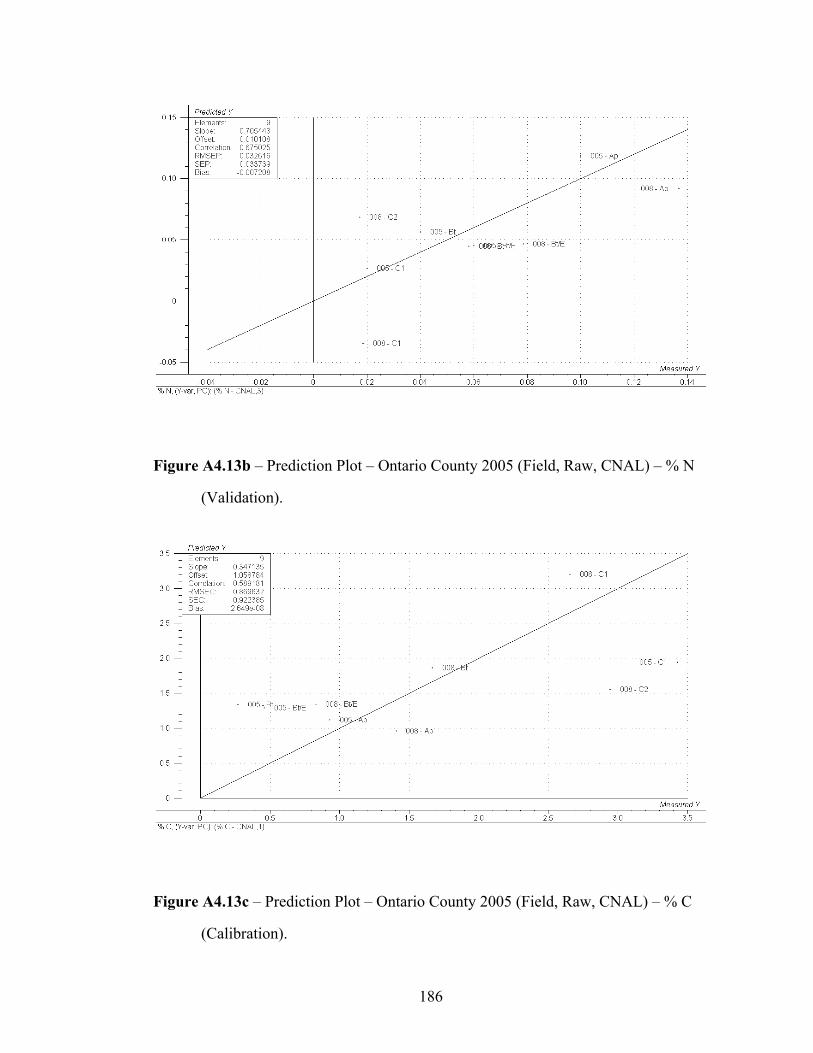
186
Figure A4.13b – Prediction Plot – Ontario County 2005 (Field, Raw, CNAL) – % N
(Validation).
Figure A4.13c – Prediction Plot – Ontario County 2005 (Field, Raw, CNAL) – % C
(Calibration).
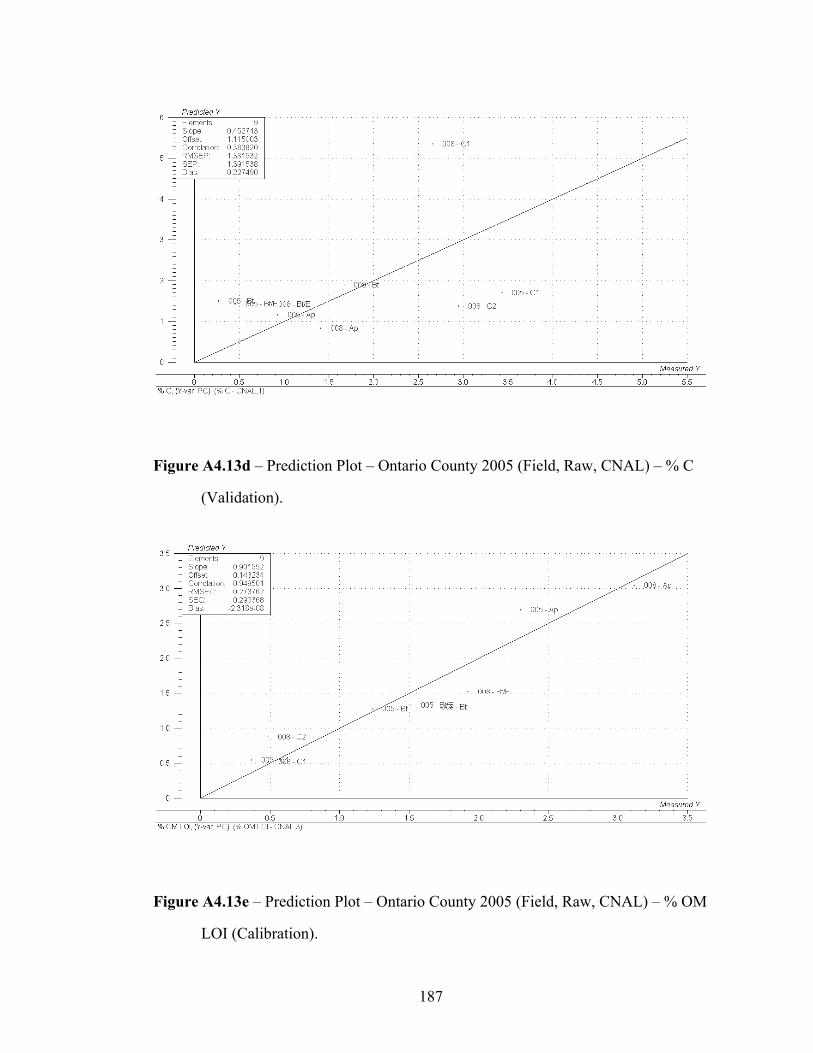
187
Figure A4.13d – Prediction Plot – Ontario County 2005 (Field, Raw, CNAL) – % C
(Validation).
Figure A4.13e – Prediction Plot – Ontario County 2005 (Field, Raw, CNAL) – % OM
LOI (Calibration).
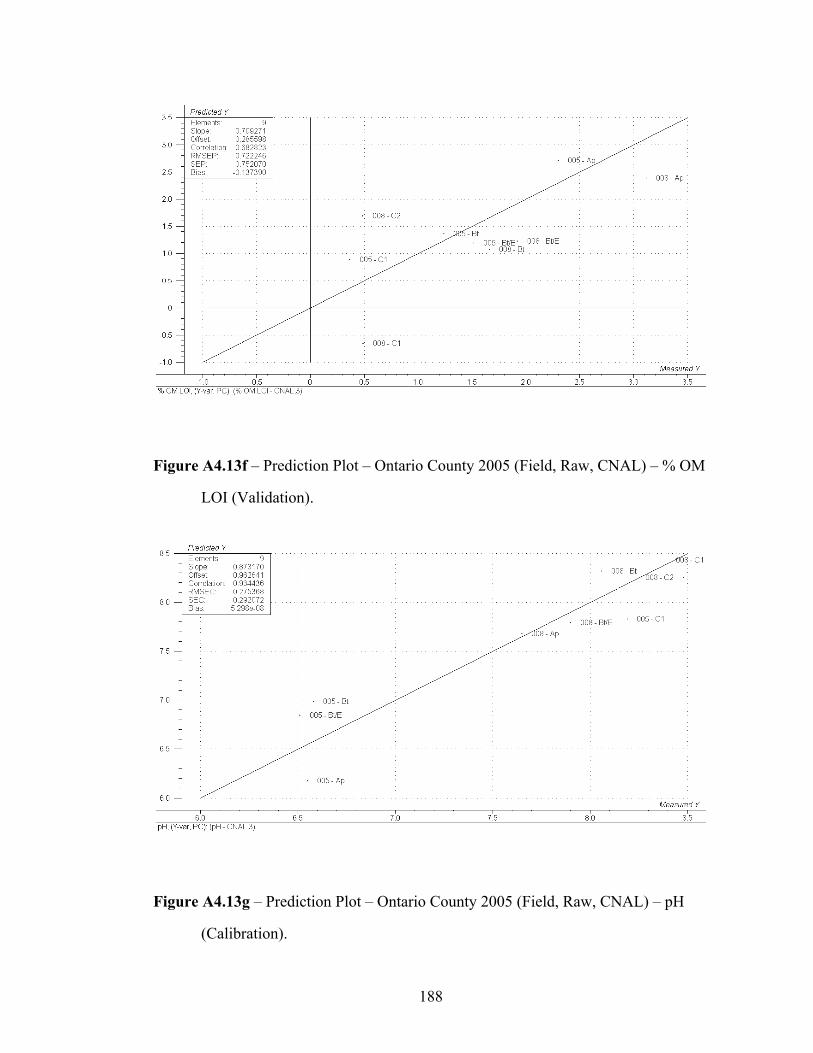
188
Figure A4.13f – Prediction Plot – Ontario County 2005 (Field, Raw, CNAL) – % OM
LOI (Validation).
Figure A4.13g – Prediction Plot – Ontario County 2005 (Field, Raw, CNAL) – pH
(Calibration).
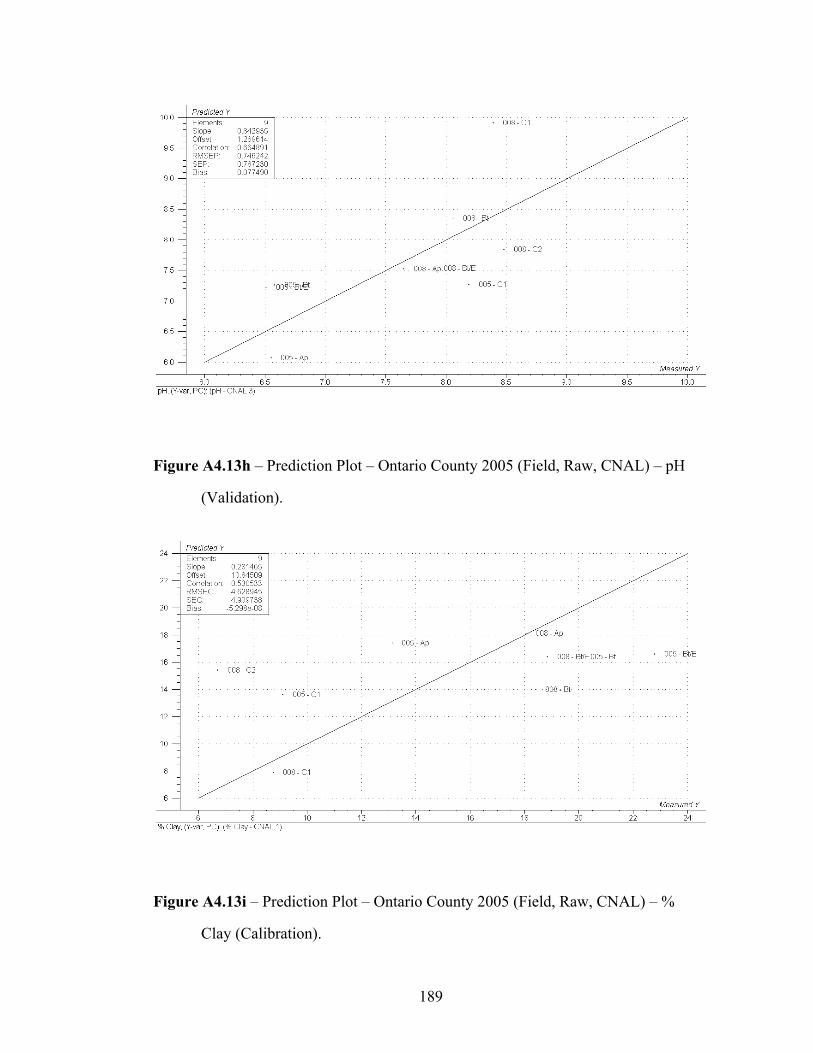
189
Figure A4.13h – Prediction Plot – Ontario County 2005 (Field, Raw, CNAL) – pH
(Validation).
Figure A4.13i – Prediction Plot – Ontario County 2005 (Field, Raw, CNAL) – %
Clay (Calibration).
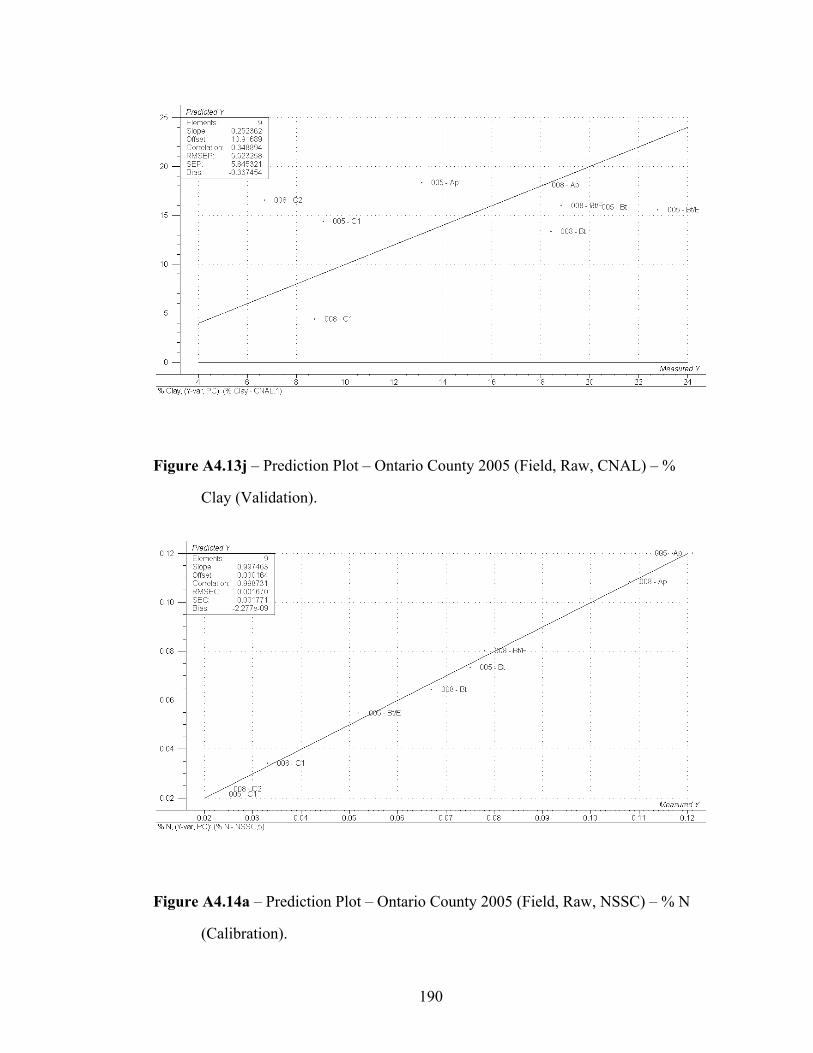
190
Figure A4.13j – Prediction Plot – Ontario County 2005 (Field, Raw, CNAL) – %
Clay (Validation).
Figure A4.14a – Prediction Plot – Ontario County 2005 (Field, Raw, NSSC) – % N
(Calibration).
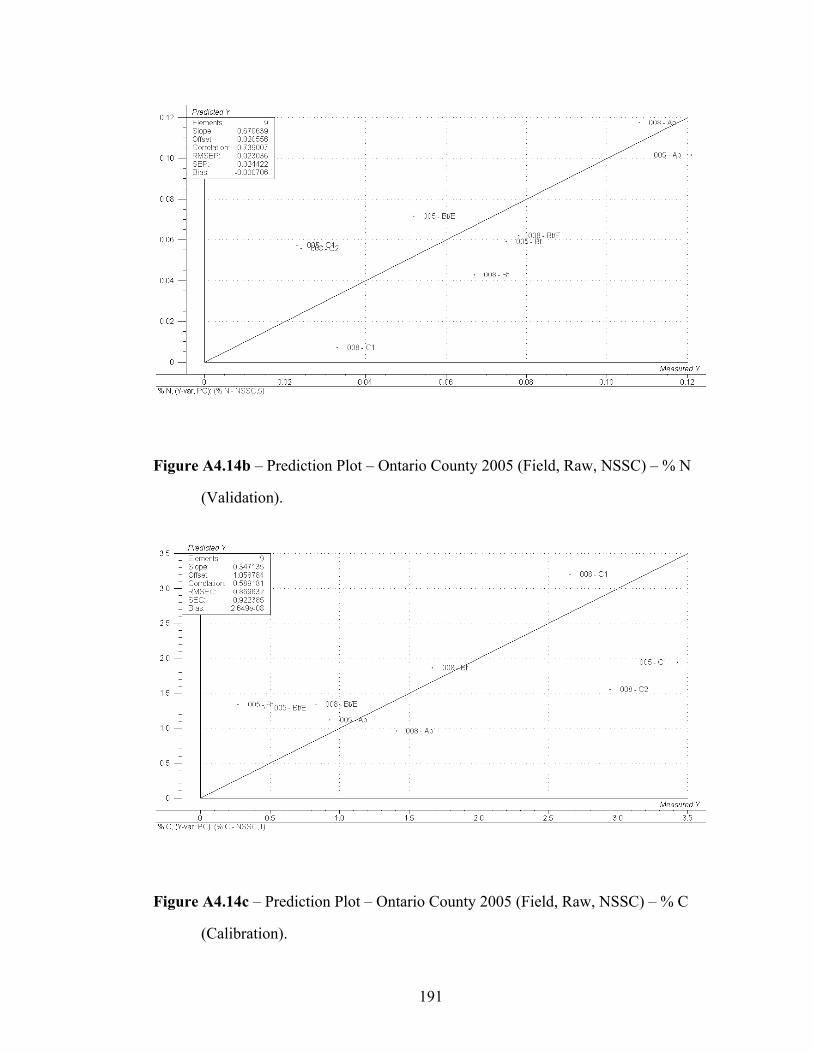
191
Figure A4.14b – Prediction Plot – Ontario County 2005 (Field, Raw, NSSC) – % N
(Validation).
Figure A4.14c – Prediction Plot – Ontario County 2005 (Field, Raw, NSSC) – % C
(Calibration).
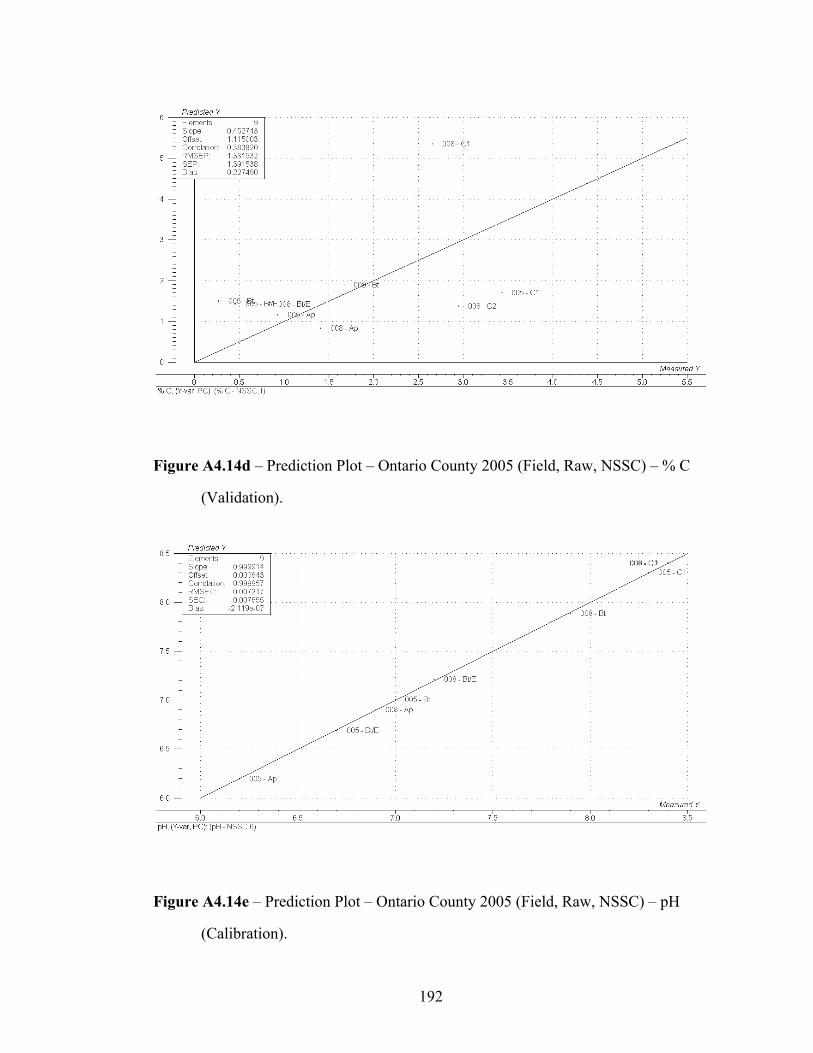
192
Figure A4.14d – Prediction Plot – Ontario County 2005 (Field, Raw, NSSC) – % C
(Validation).
Figure A4.14e – Prediction Plot – Ontario County 2005 (Field, Raw, NSSC) – pH
(Calibration).

193
Figure A4.14f – Prediction Plot – Ontario County 2005 (Field, Raw, NSSC) – pH
(Validation).
Figure A4.14g – Prediction Plot – Ontario County 2005 (Field, Raw, NSSC) – %
Clay (Calibration).
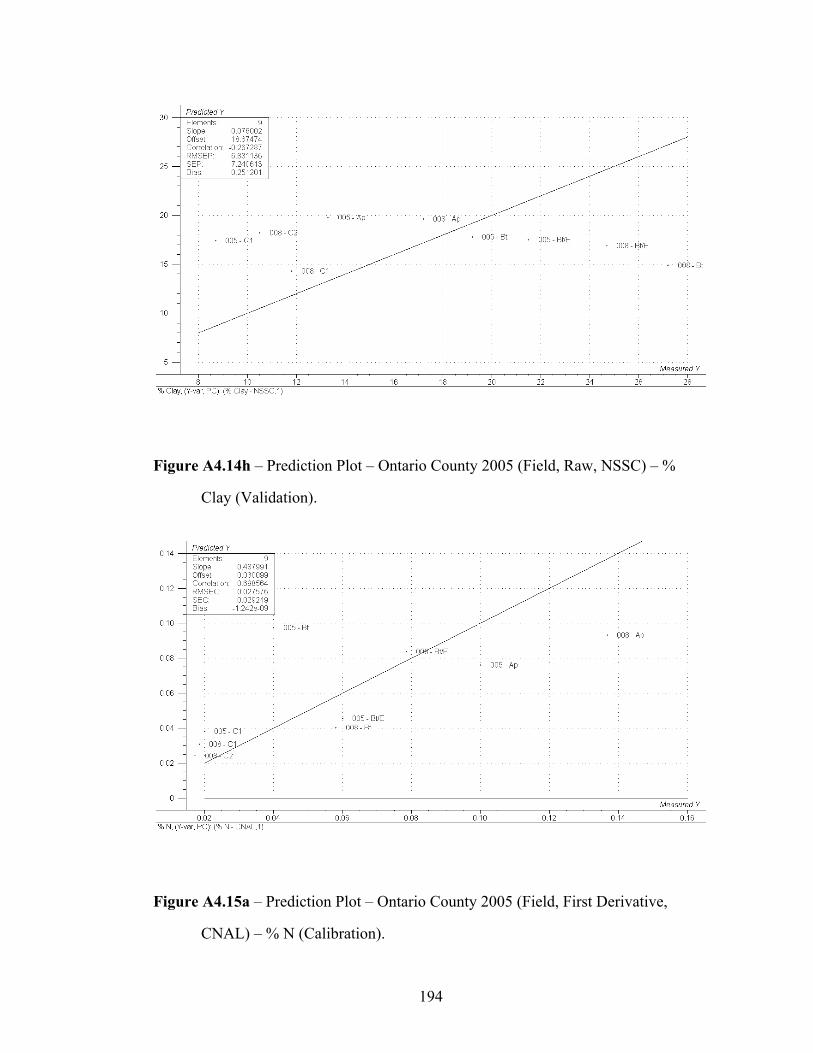
194
Figure A4.14h – Prediction Plot – Ontario County 2005 (Field, Raw, NSSC) – %
Clay (Validation).
Figure A4.15a – Prediction Plot – Ontario County 2005 (Field, First Derivative,
CNAL) – % N (Calibration).
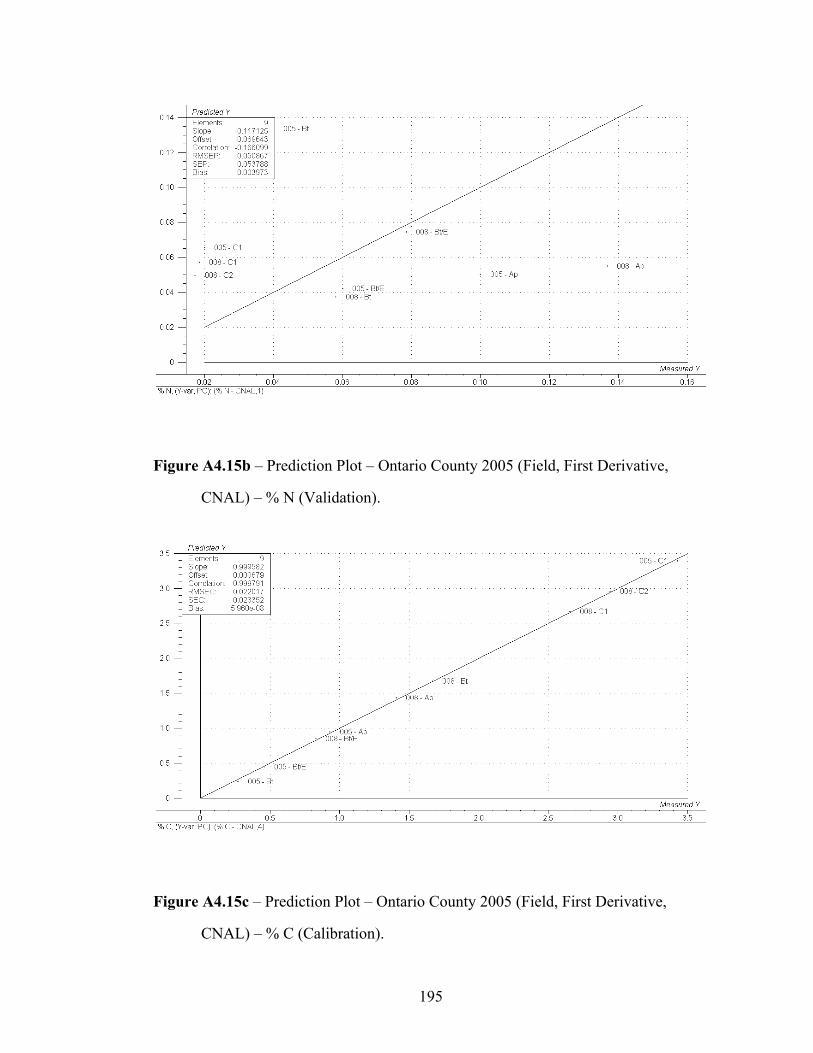
195
Figure A4.15b – Prediction Plot – Ontario County 2005 (Field, First Derivative,
CNAL) – % N (Validation).
Figure A4.15c – Prediction Plot – Ontario County 2005 (Field, First Derivative,
CNAL) – % C (Calibration).
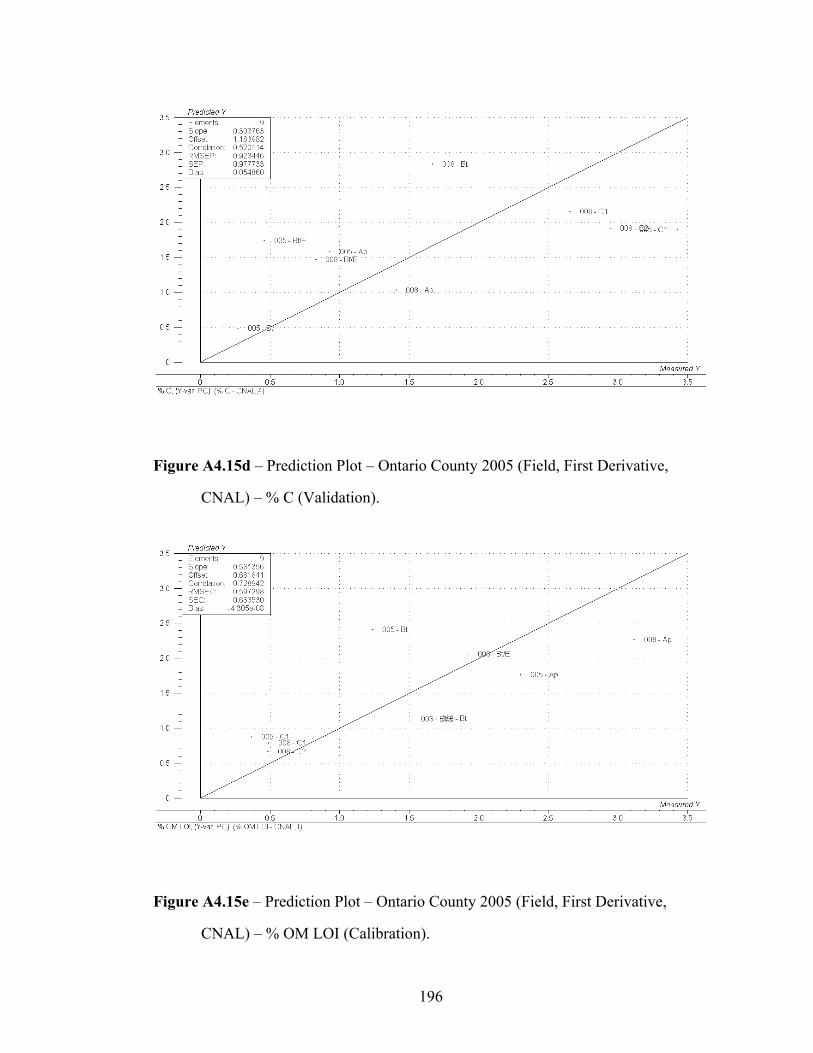
196
Figure A4.15d – Prediction Plot – Ontario County 2005 (Field, First Derivative,
CNAL) – % C (Validation).
Figure A4.15e – Prediction Plot – Ontario County 2005 (Field, First Derivative,
CNAL) – % OM LOI (Calibration).
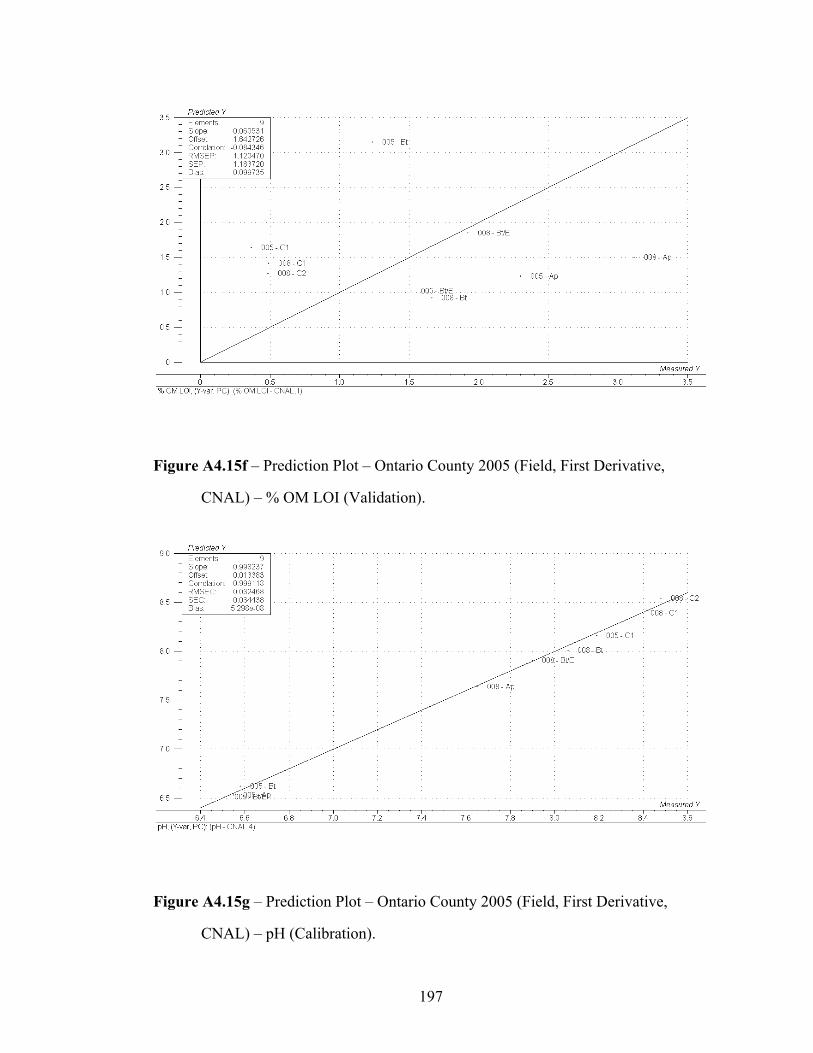
197
Figure A4.15f – Prediction Plot – Ontario County 2005 (Field, First Derivative,
CNAL) – % OM LOI (Validation).
Figure A4.15g – Prediction Plot – Ontario County 2005 (Field, First Derivative,
CNAL) – pH (Calibration).
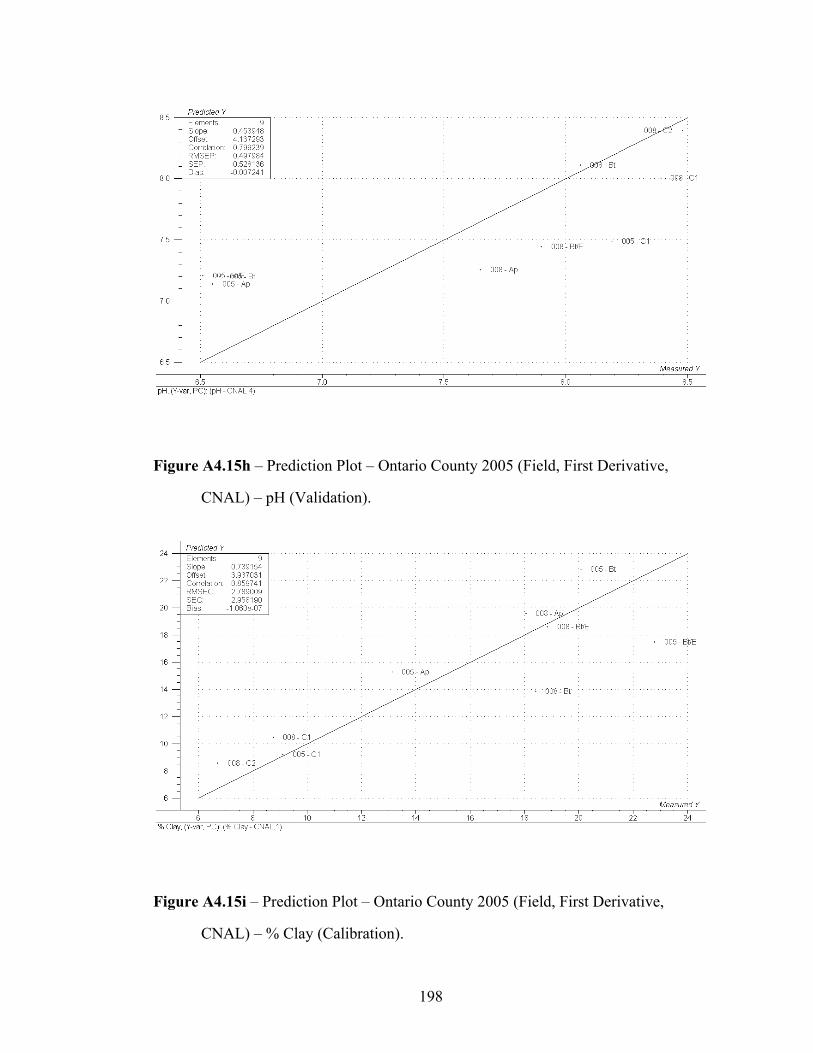
198
Figure A4.15h – Prediction Plot – Ontario County 2005 (Field, First Derivative,
CNAL) – pH (Validation).
Figure A4.15i – Prediction Plot – Ontario County 2005 (Field, First Derivative,
CNAL) – % Clay (Calibration).
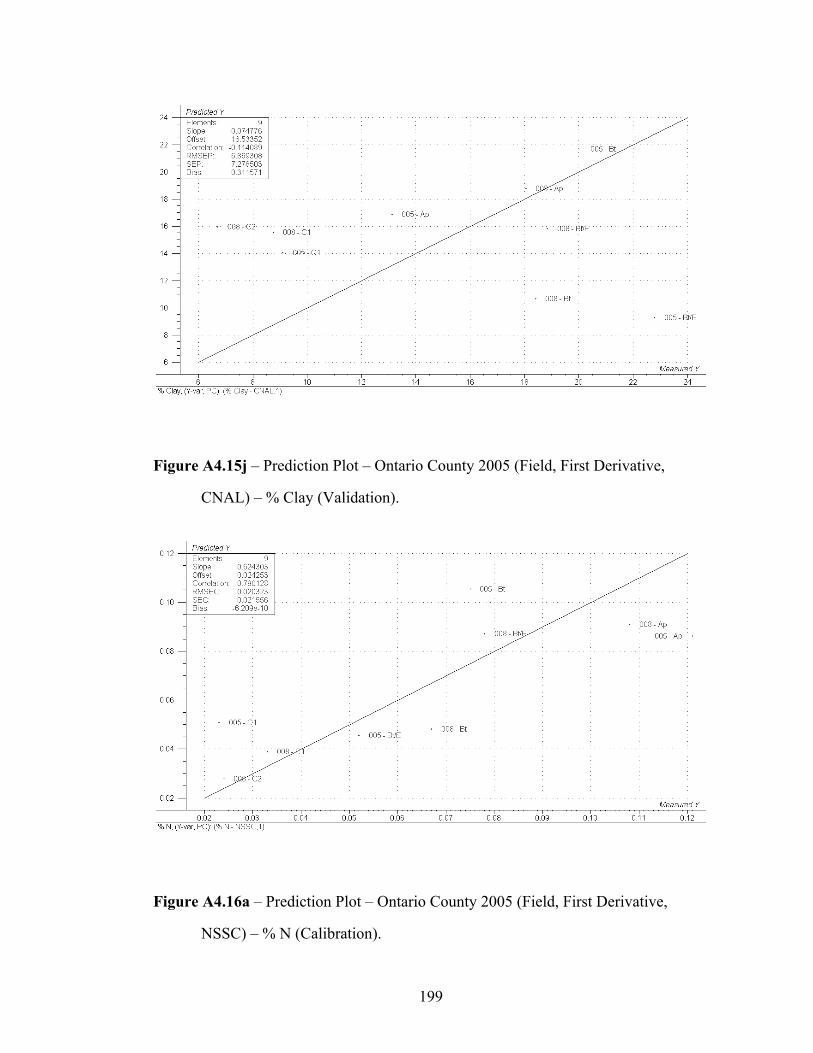
199
Figure A4.15j – Prediction Plot – Ontario County 2005 (Field, First Derivative,
CNAL) – % Clay (Validation).
Figure A4.16a – Prediction Plot – Ontario County 2005 (Field, First Derivative,
NSSC) – % N (Calibration).
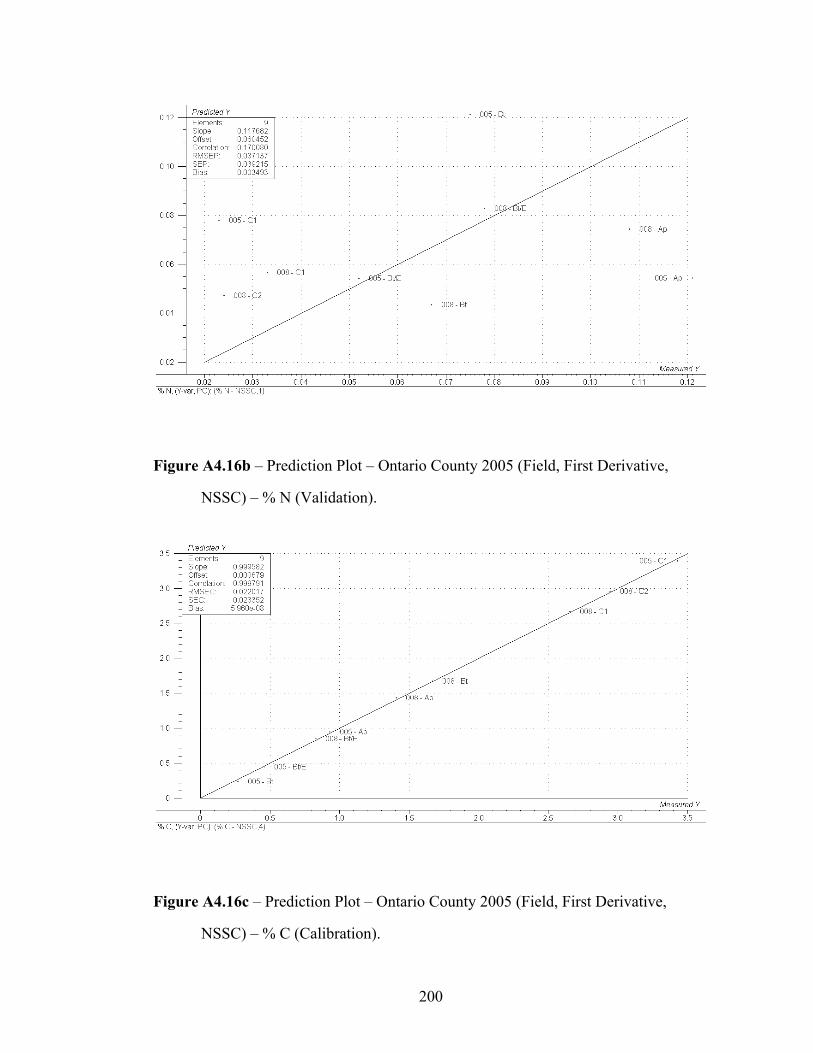
200
Figure A4.16b – Prediction Plot – Ontario County 2005 (Field, First Derivative,
NSSC) – % N (Validation).
Figure A4.16c – Prediction Plot – Ontario County 2005 (Field, First Derivative,
NSSC) – % C (Calibration).
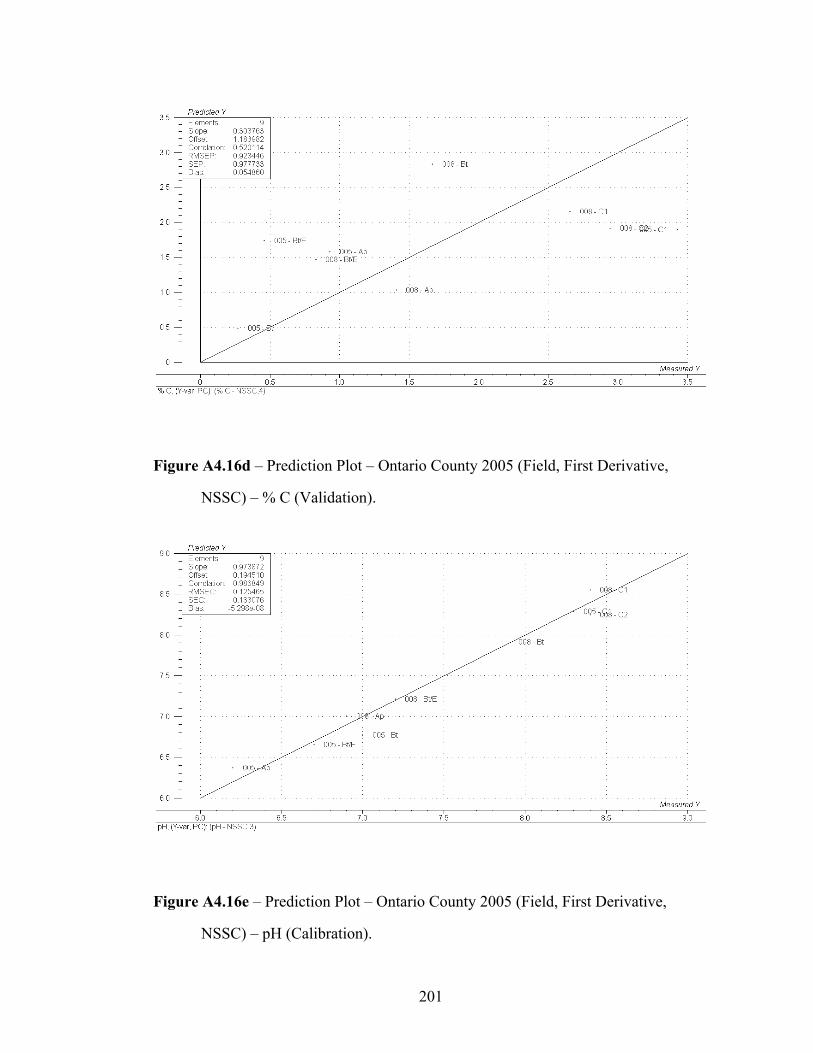
201
Figure A4.16d – Prediction Plot – Ontario County 2005 (Field, First Derivative,
NSSC) – % C (Validation).
Figure A4.16e – Prediction Plot – Ontario County 2005 (Field, First Derivative,
NSSC) – pH (Calibration).
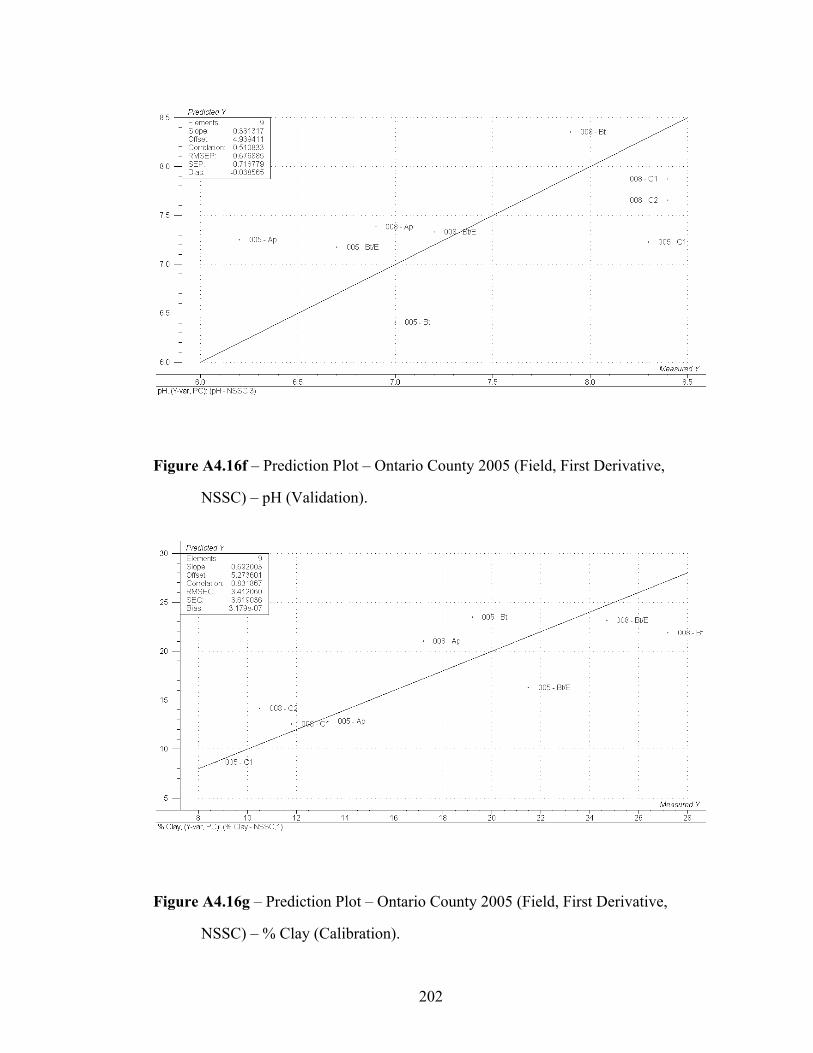
202
Figure A4.16f – Prediction Plot – Ontario County 2005 (Field, First Derivative,
NSSC) – pH (Validation).
Figure A4.16g – Prediction Plot – Ontario County 2005 (Field, First Derivative,
NSSC) – % Clay (Calibration).
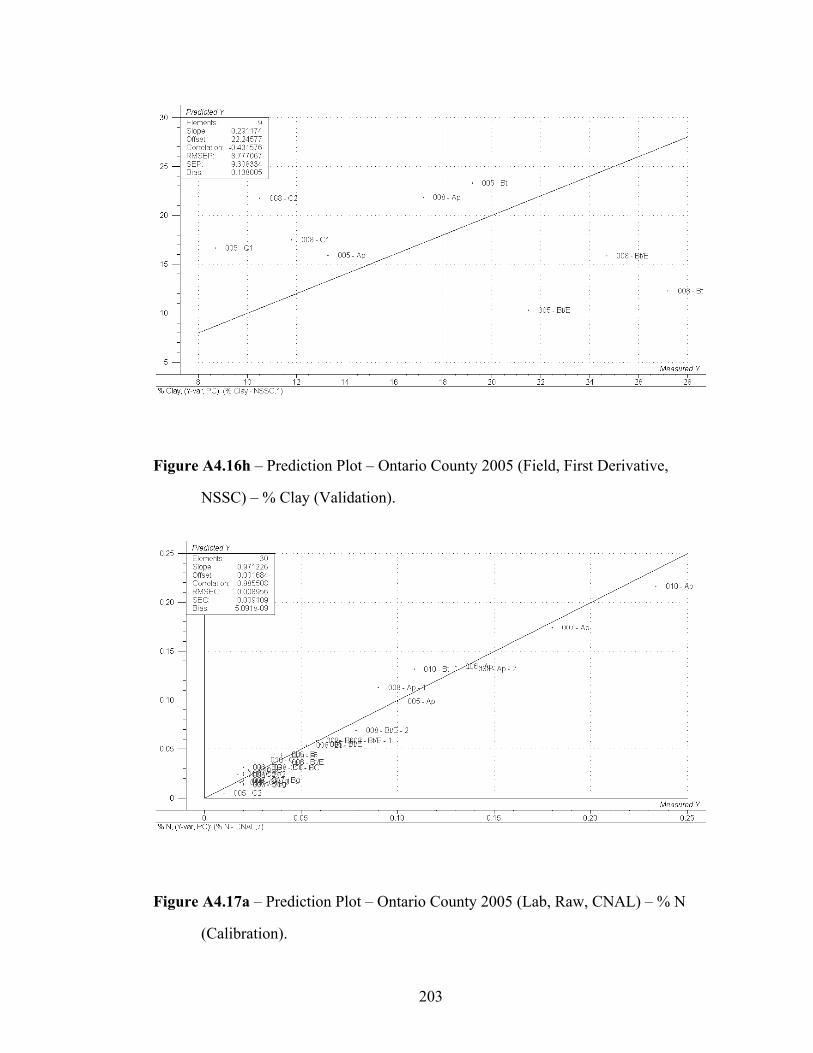
203
Figure A4.16h – Prediction Plot – Ontario County 2005 (Field, First Derivative,
NSSC) – % Clay (Validation).
Figure A4.17a – Prediction Plot – Ontario County 2005 (Lab, Raw, CNAL) – % N
(Calibration).
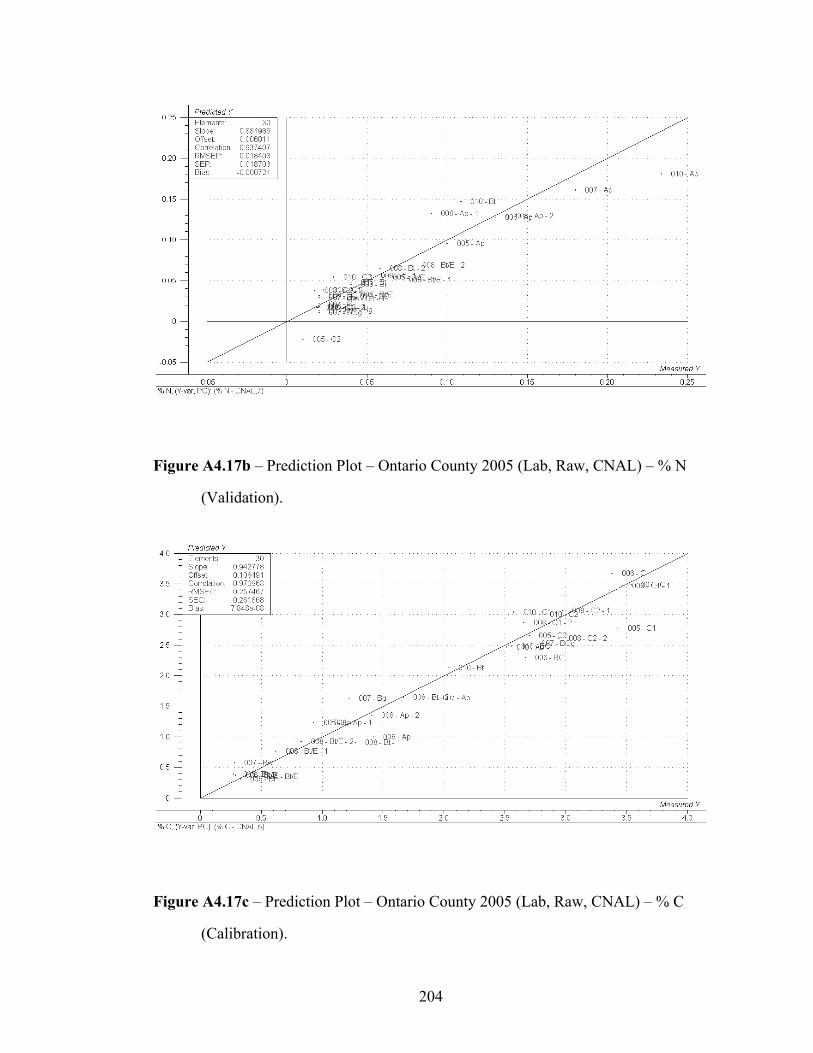
204
Figure A4.17b – Prediction Plot – Ontario County 2005 (Lab, Raw, CNAL) – % N
(Validation).
Figure A4.17c – Prediction Plot – Ontario County 2005 (Lab, Raw, CNAL) – % C
(Calibration).
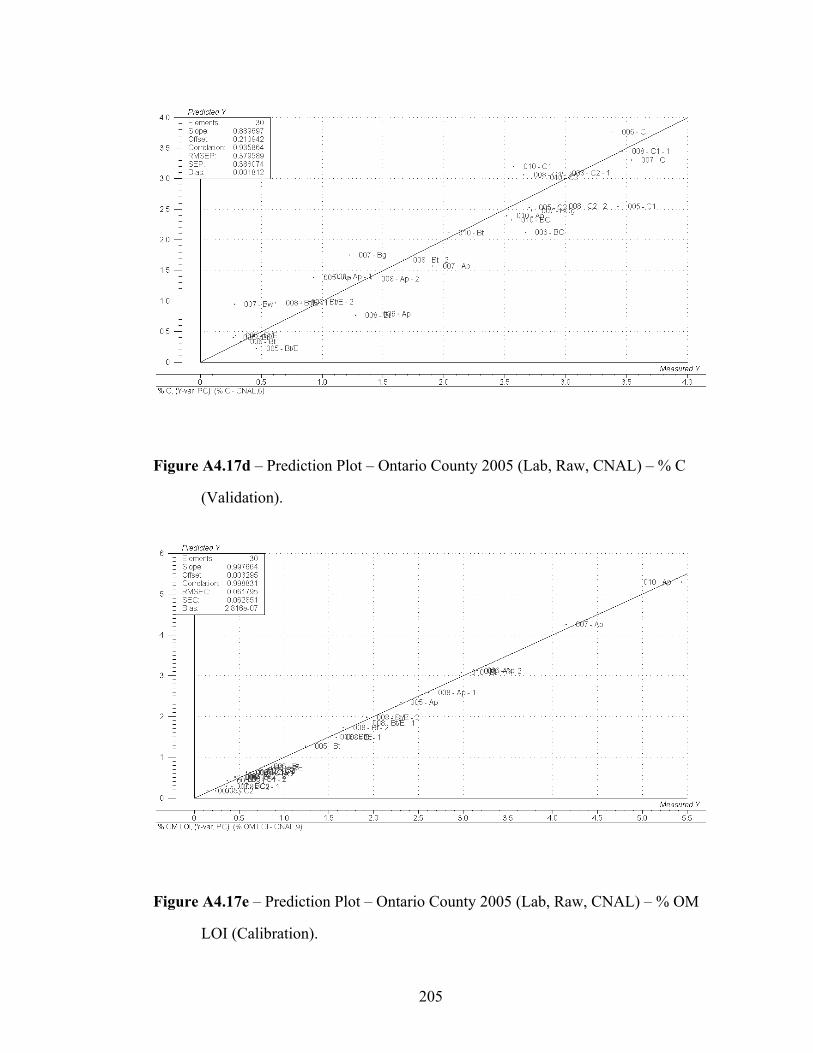
205
Figure A4.17d – Prediction Plot – Ontario County 2005 (Lab, Raw, CNAL) – % C
(Validation).
Figure A4.17e – Prediction Plot – Ontario County 2005 (Lab, Raw, CNAL) – % OM
LOI (Calibration).
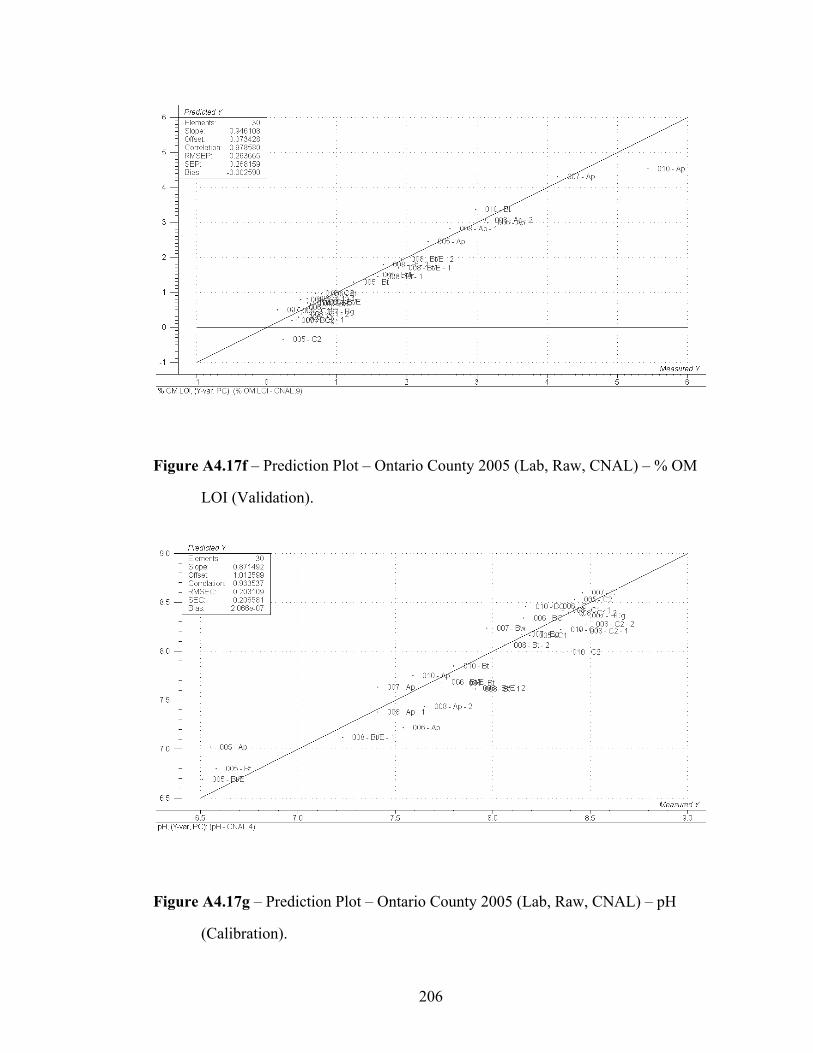
206
Figure A4.17f – Prediction Plot – Ontario County 2005 (Lab, Raw, CNAL) – % OM
LOI (Validation).
Figure A4.17g – Prediction Plot – Ontario County 2005 (Lab, Raw, CNAL) – pH
(Calibration).
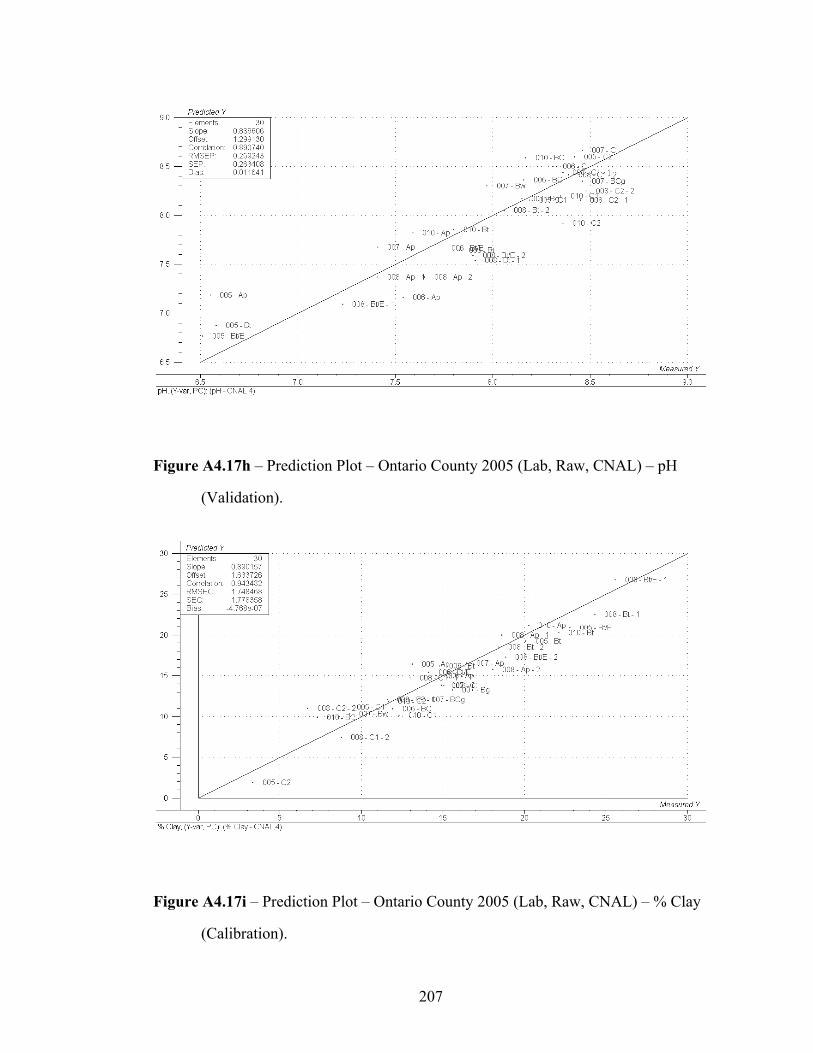
207
Figure A4.17h – Prediction Plot – Ontario County 2005 (Lab, Raw, CNAL) – pH
(Validation).
Figure A4.17i – Prediction Plot – Ontario County 2005 (Lab, Raw, CNAL) – % Clay
(Calibration).
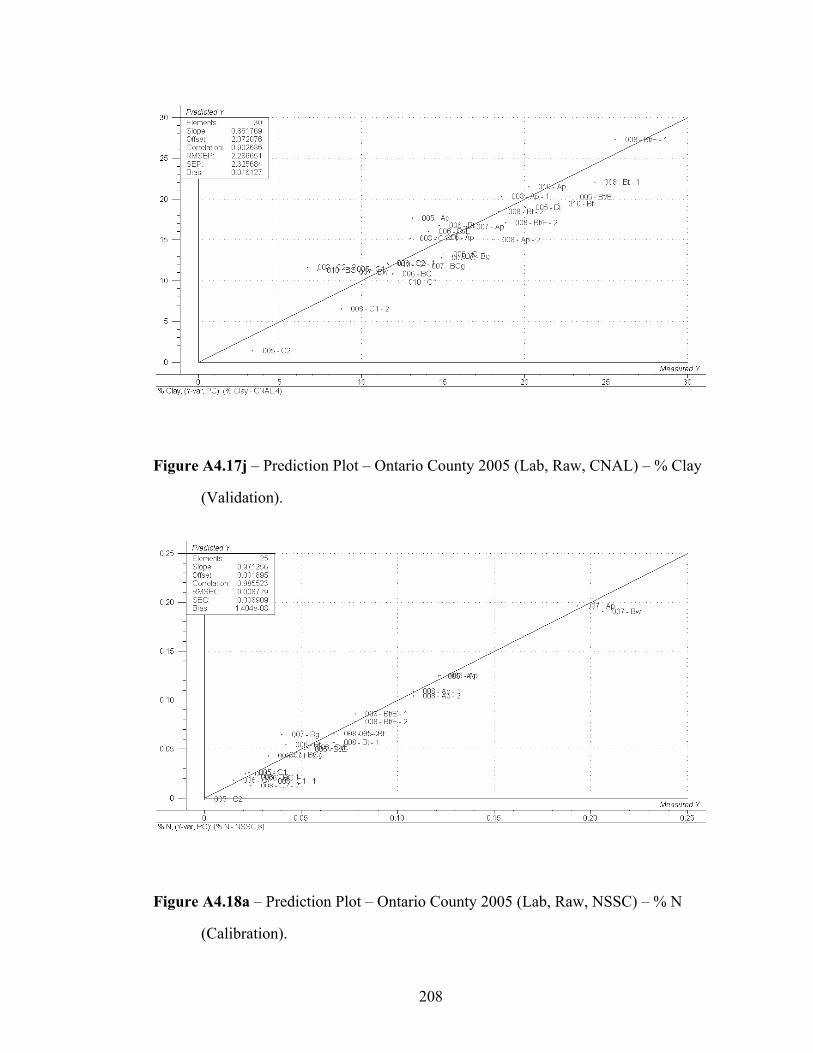
208
Figure A4.17j – Prediction Plot – Ontario County 2005 (Lab, Raw, CNAL) – % Clay
(Validation).
Figure A4.18a – Prediction Plot – Ontario County 2005 (Lab, Raw, NSSC) – % N
(Calibration).
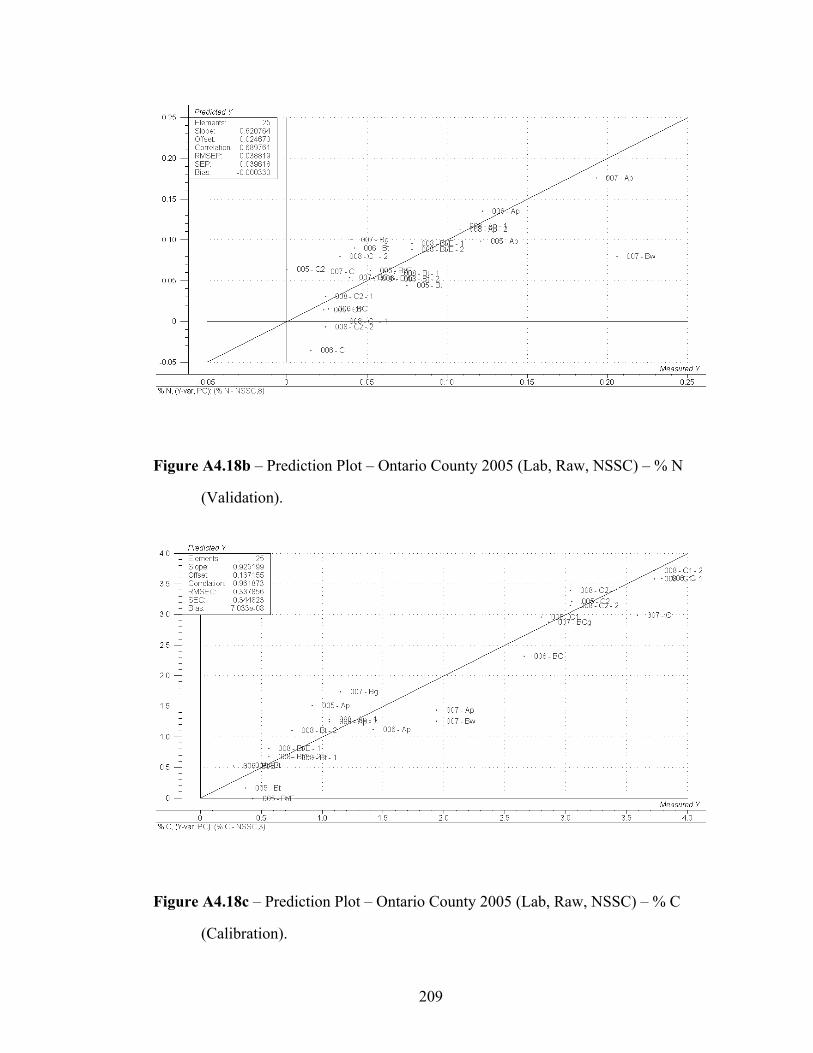
209
Figure A4.18b – Prediction Plot – Ontario County 2005 (Lab, Raw, NSSC) – % N
(Validation).
Figure A4.18c – Prediction Plot – Ontario County 2005 (Lab, Raw, NSSC) – % C
(Calibration).
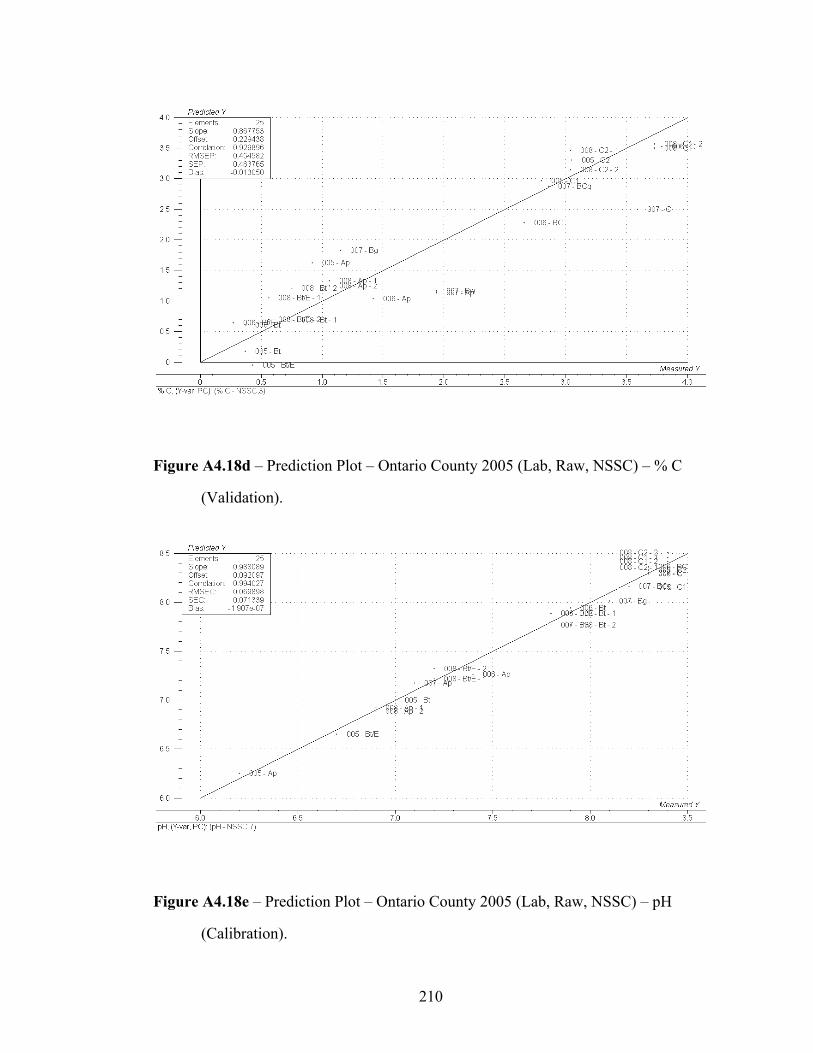
210
Figure A4.18d – Prediction Plot – Ontario County 2005 (Lab, Raw, NSSC) – % C
(Validation).
Figure A4.18e – Prediction Plot – Ontario County 2005 (Lab, Raw, NSSC) – pH
(Calibration).
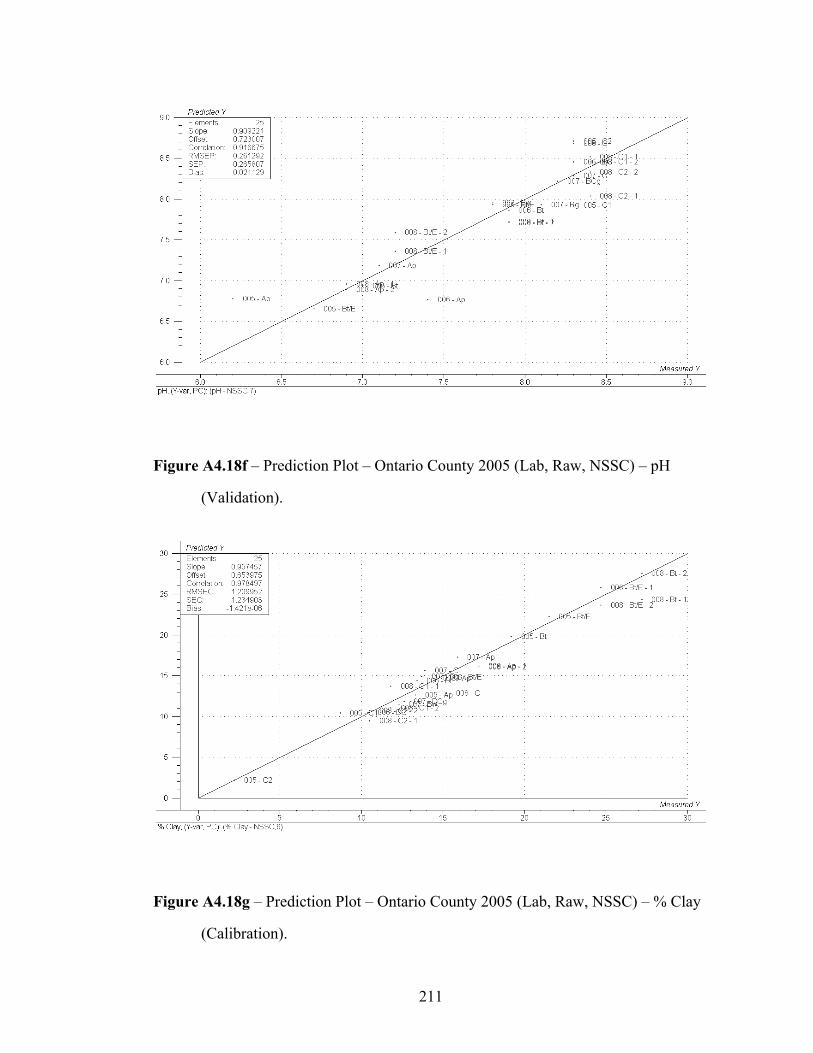
211
Figure A4.18f – Prediction Plot – Ontario County 2005 (Lab, Raw, NSSC) – pH
(Validation).
Figure A4.18g – Prediction Plot – Ontario County 2005 (Lab, Raw, NSSC) – % Clay
(Calibration).
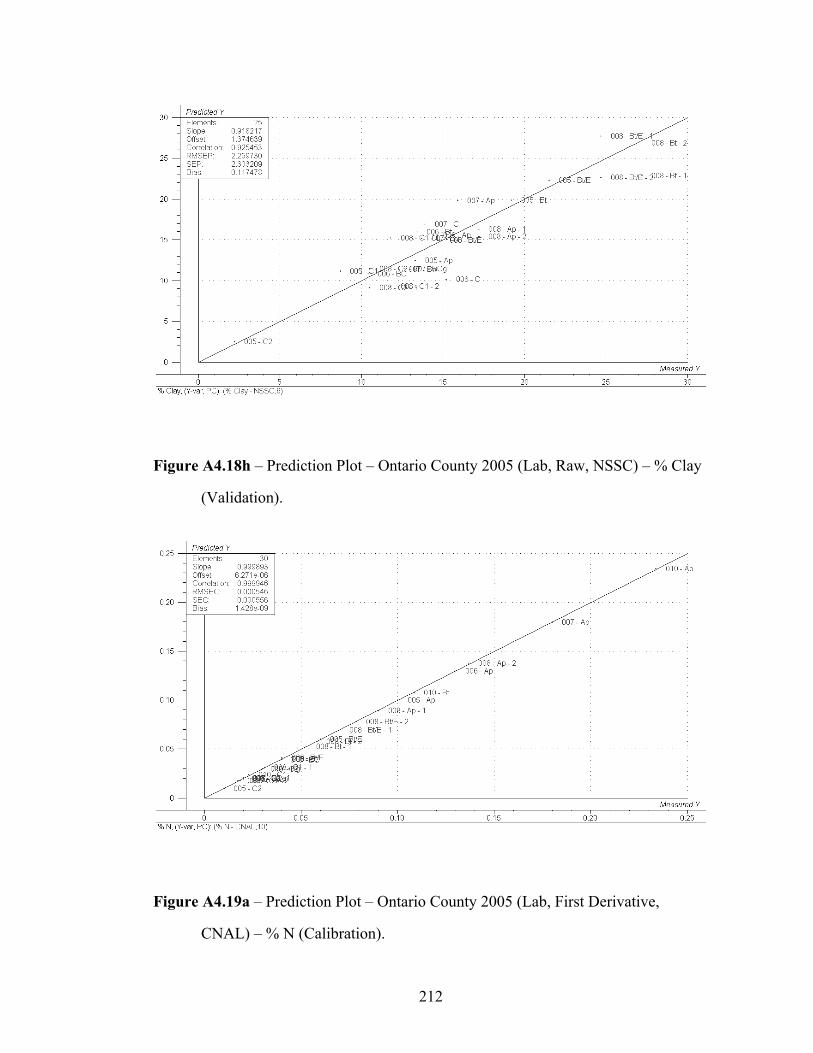
212
Figure A4.18h – Prediction Plot – Ontario County 2005 (Lab, Raw, NSSC) – % Clay
(Validation).
Figure A4.19a – Prediction Plot – Ontario County 2005 (Lab, First Derivative,
CNAL) – % N (Calibration).
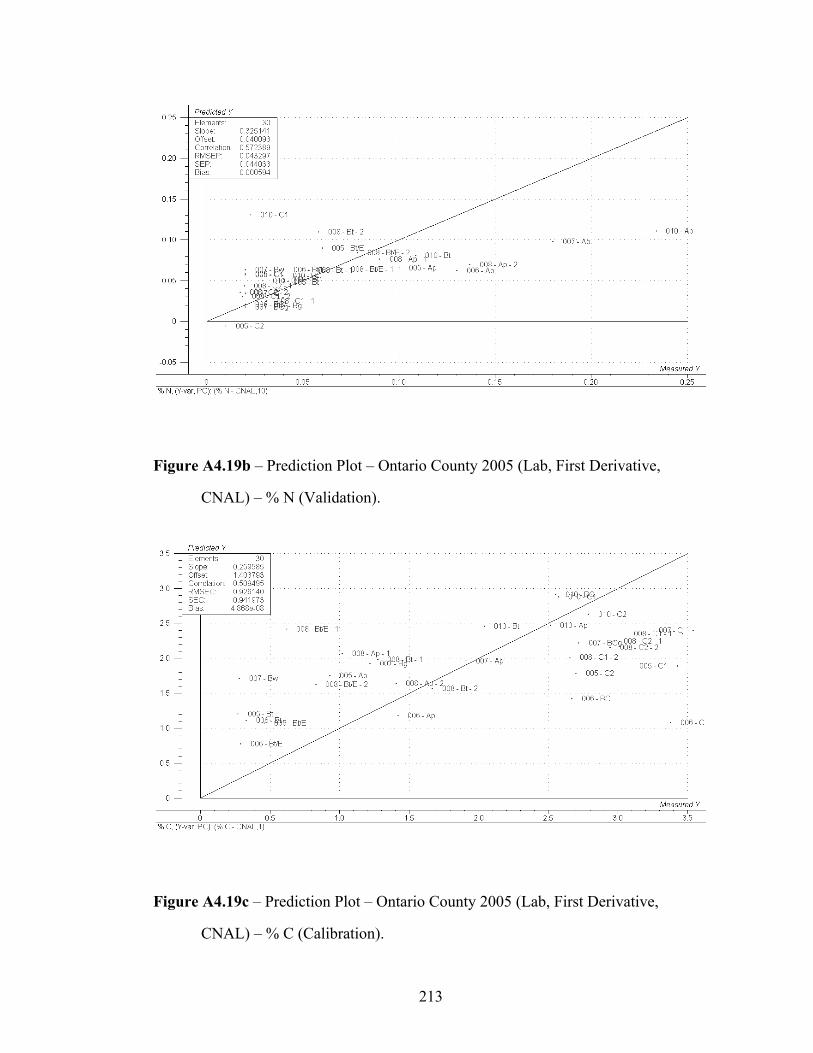
213
Figure A4.19b – Prediction Plot – Ontario County 2005 (Lab, First Derivative,
CNAL) – % N (Validation).
Figure A4.19c – Prediction Plot – Ontario County 2005 (Lab, First Derivative,
CNAL) – % C (Calibration).
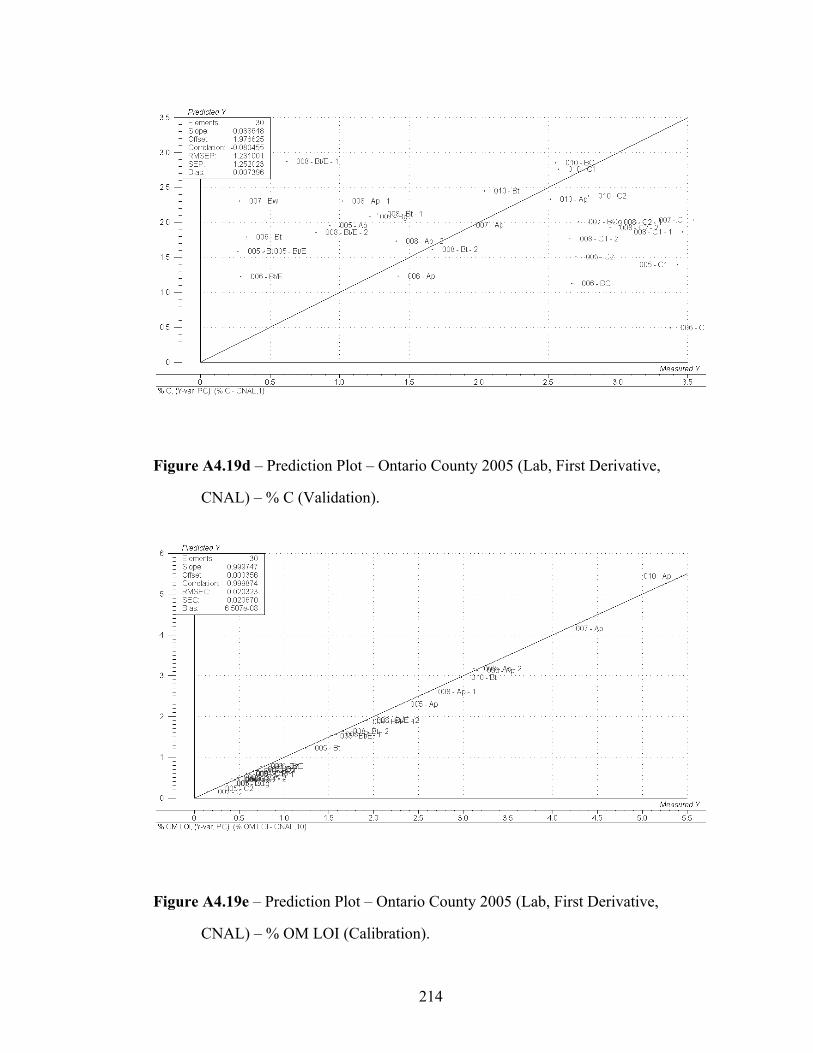
214
Figure A4.19d – Prediction Plot – Ontario County 2005 (Lab, First Derivative,
CNAL) – % C (Validation).
Figure A4.19e – Prediction Plot – Ontario County 2005 (Lab, First Derivative,
CNAL) – % OM LOI (Calibration).
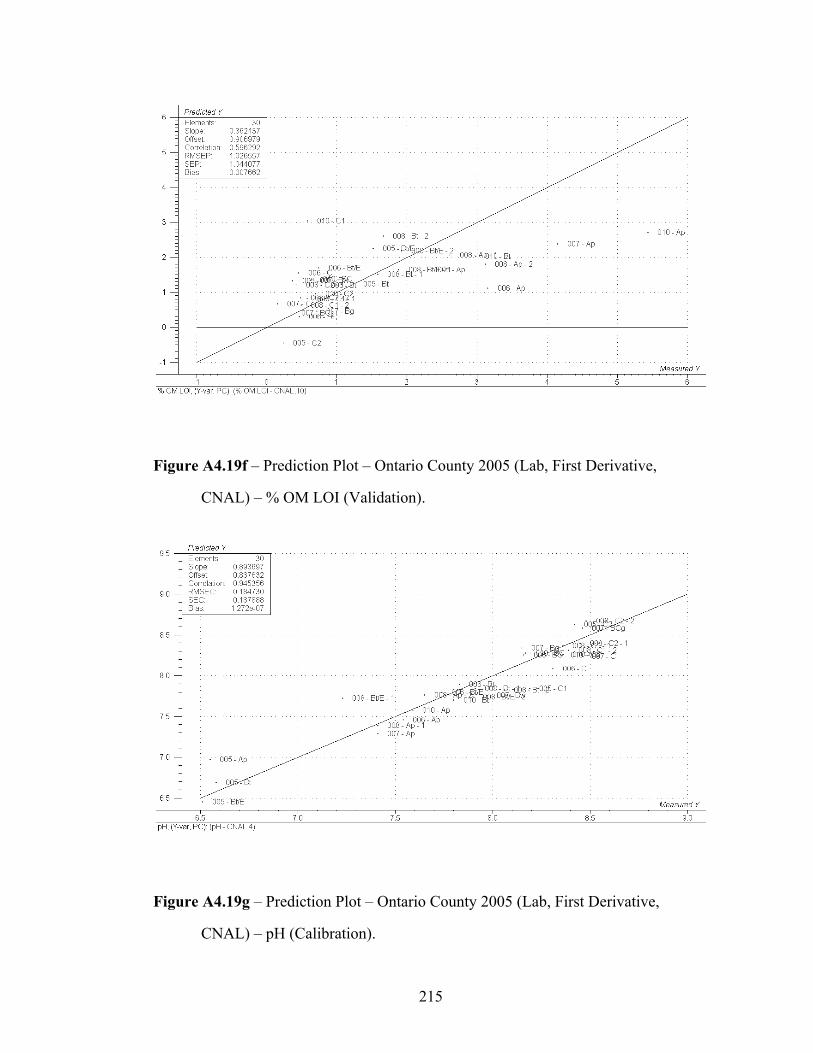
215
Figure A4.19f – Prediction Plot – Ontario County 2005 (Lab, First Derivative,
CNAL) – % OM LOI (Validation).
Figure A4.19g – Prediction Plot – Ontario County 2005 (Lab, First Derivative,
CNAL) – pH (Calibration).
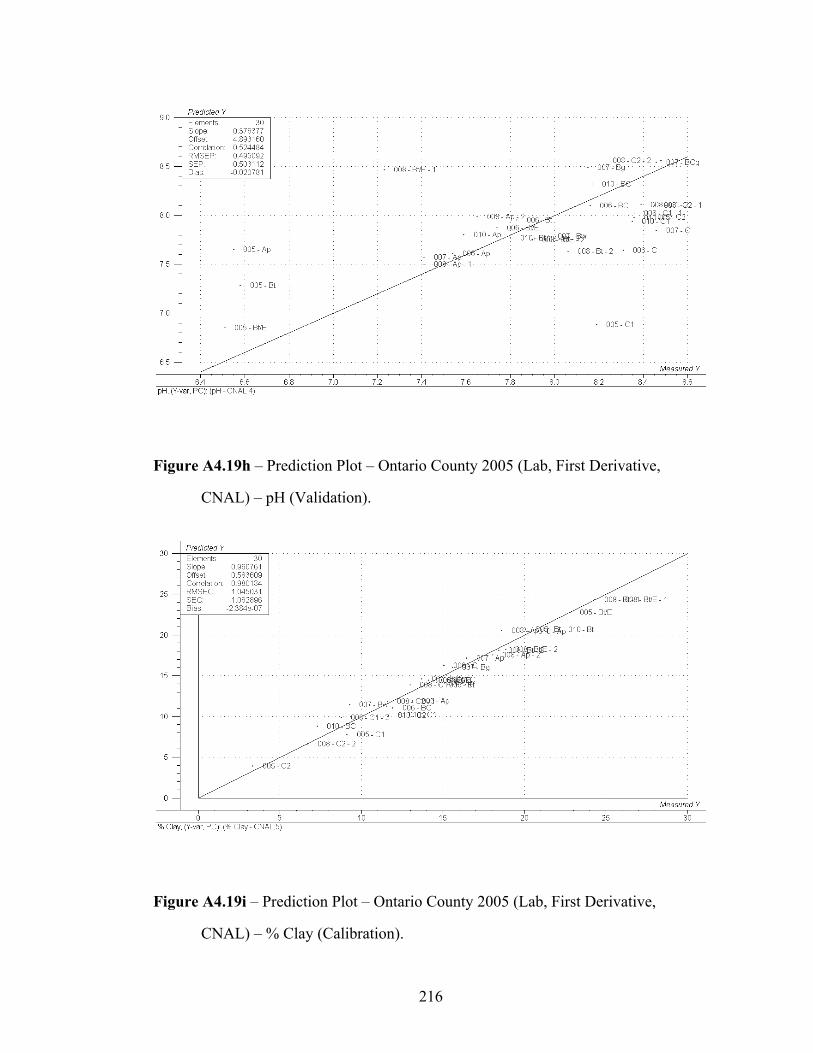
216
Figure A4.19h – Prediction Plot – Ontario County 2005 (Lab, First Derivative,
CNAL) – pH (Validation).
Figure A4.19i – Prediction Plot – Ontario County 2005 (Lab, First Derivative,
CNAL) – % Clay (Calibration).
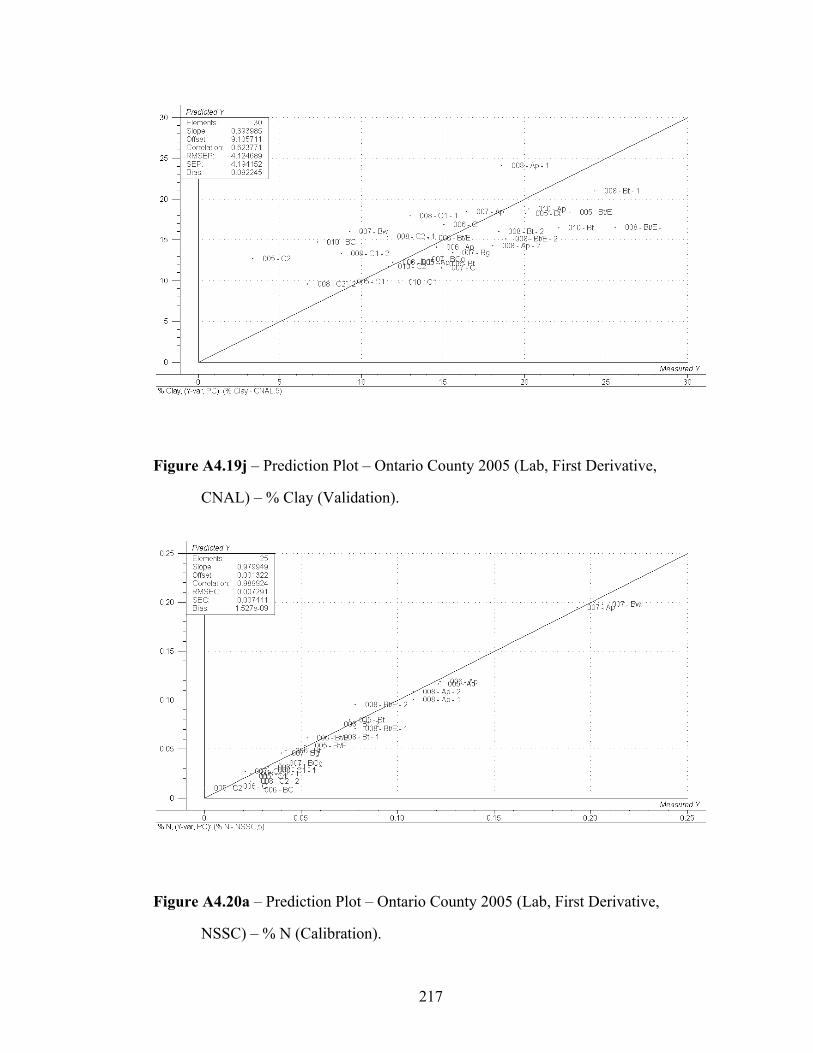
217
Figure A4.19j – Prediction Plot – Ontario County 2005 (Lab, First Derivative,
CNAL) – % Clay (Validation).
Figure A4.20a – Prediction Plot – Ontario County 2005 (Lab, First Derivative,
NSSC) – % N (Calibration).
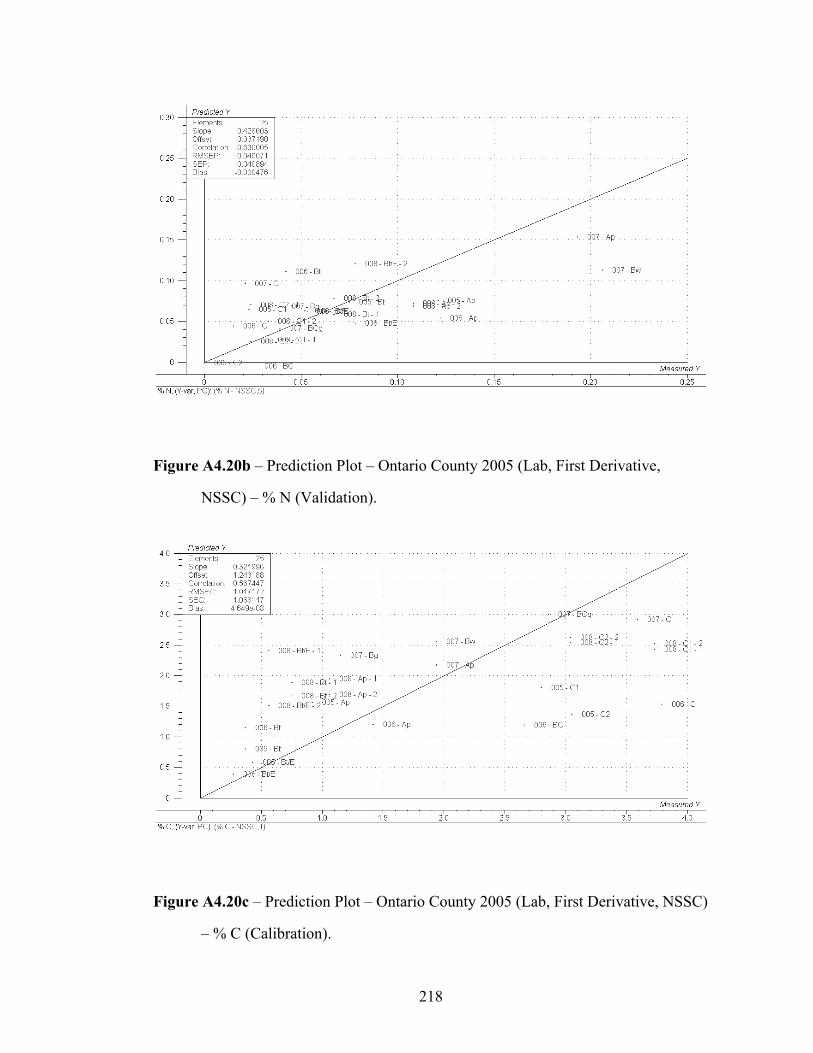
218
Figure A4.20b – Prediction Plot – Ontario County 2005 (Lab, First Derivative,
NSSC) – % N (Validation).
Figure A4.20c – Prediction Plot – Ontario County 2005 (Lab, First Derivative, NSSC)
– % C (Calibration).
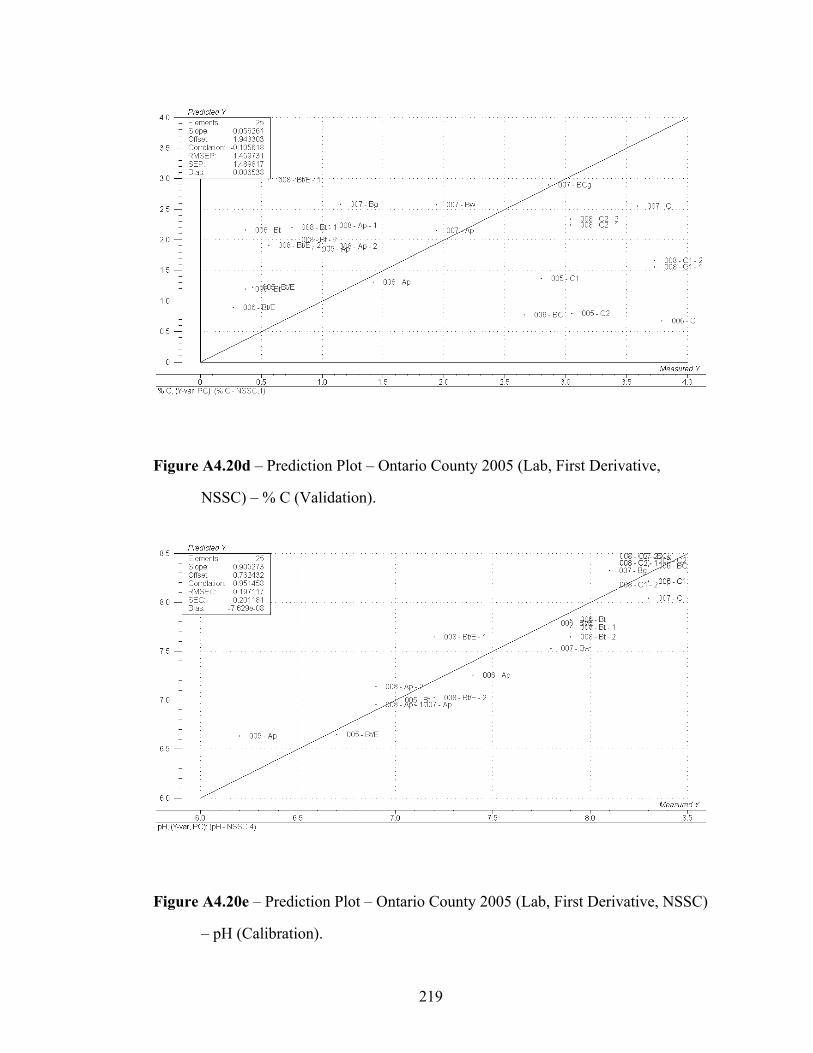
219
Figure A4.20d – Prediction Plot – Ontario County 2005 (Lab, First Derivative,
NSSC) – % C (Validation).
Figure A4.20e – Prediction Plot – Ontario County 2005 (Lab, First Derivative, NSSC)
– pH (Calibration).
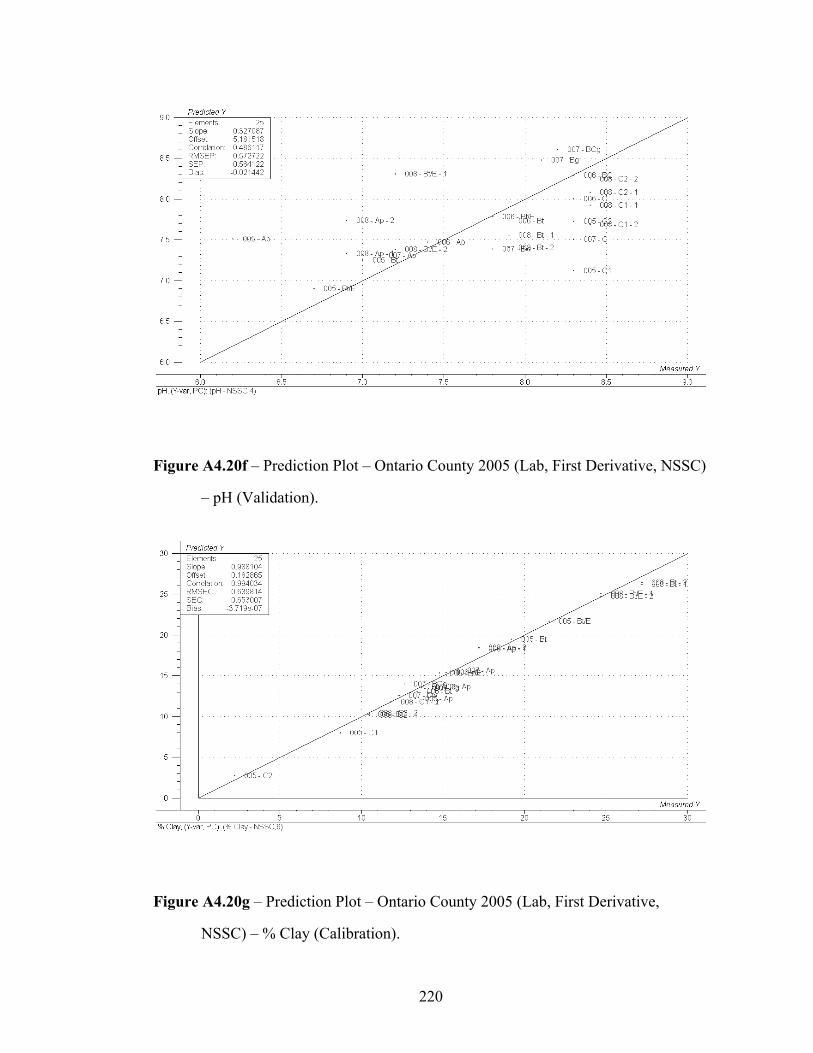
220
Figure A4.20f – Prediction Plot – Ontario County 2005 (Lab, First Derivative, NSSC)
– pH (Validation).
Figure A4.20g – Prediction Plot – Ontario County 2005 (Lab, First Derivative,
NSSC) – % Clay (Calibration).
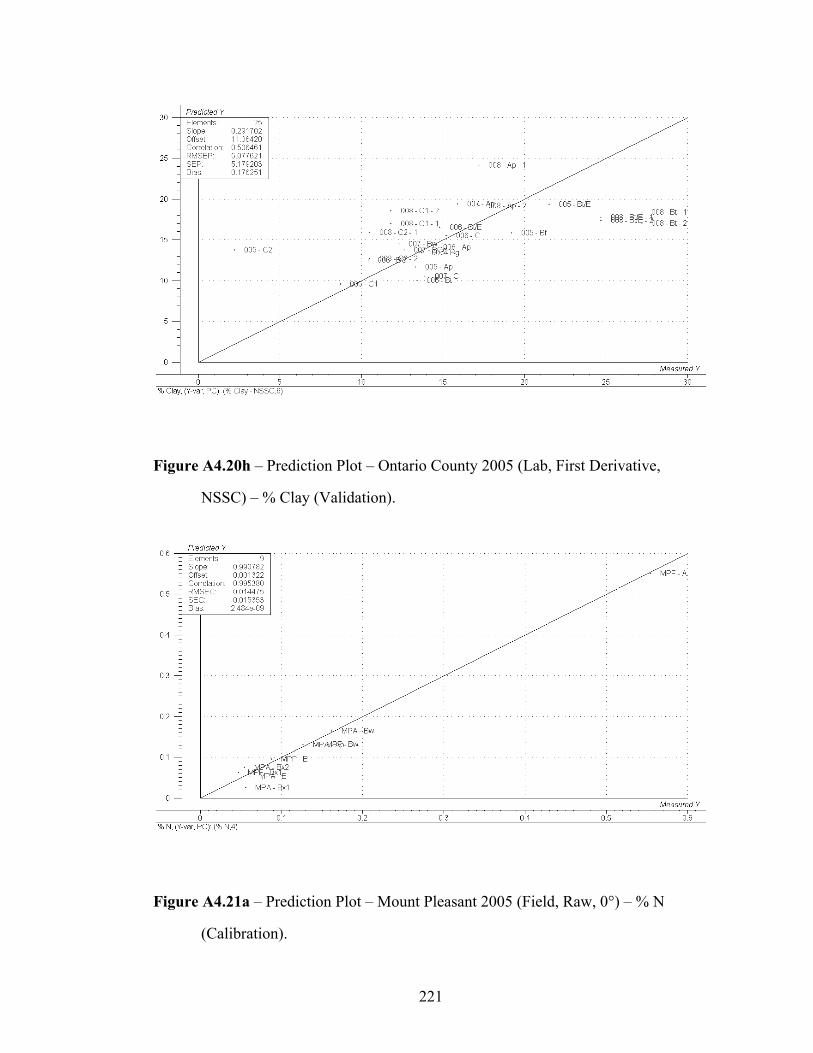
221
Figure A4.20h – Prediction Plot – Ontario County 2005 (Lab, First Derivative,
NSSC) – % Clay (Validation).
Figure A4.21a – Prediction Plot – Mount Pleasant 2005 (Field, Raw, 0°) – % N
(Calibration).
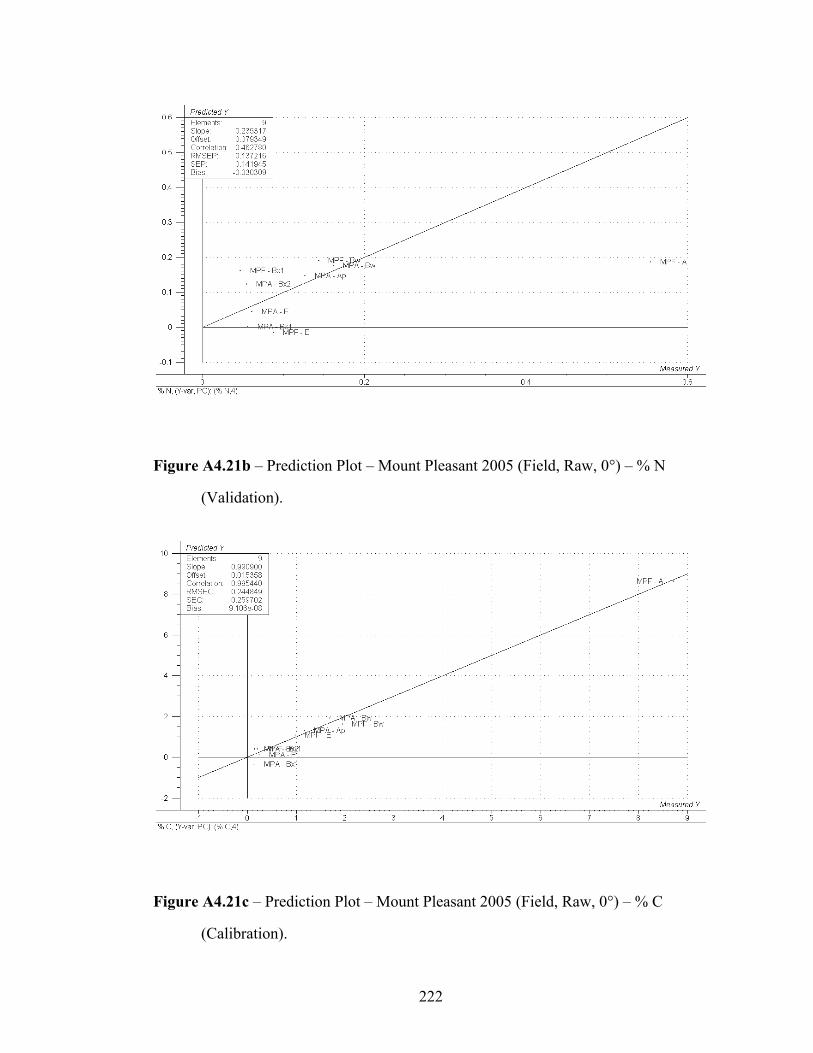
222
Figure A4.21b – Prediction Plot – Mount Pleasant 2005 (Field, Raw, 0°) – % N
(Validation).
Figure A4.21c – Prediction Plot – Mount Pleasant 2005 (Field, Raw, 0°) – % C
(Calibration).
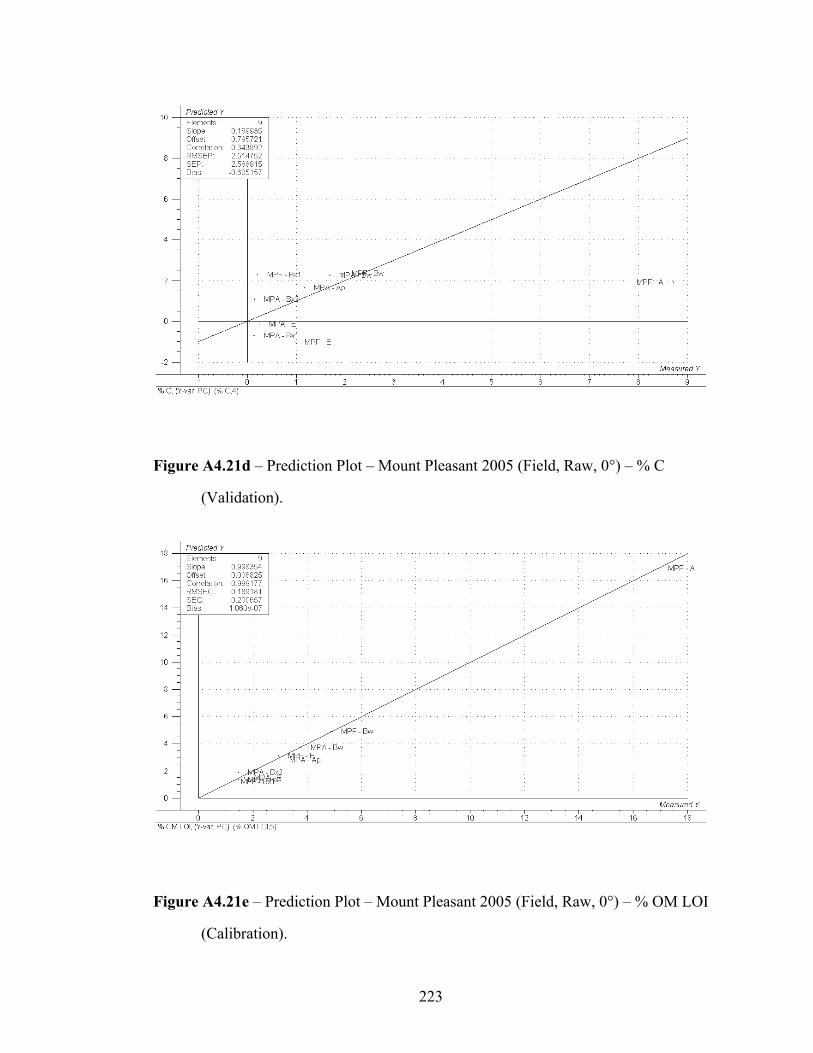
223
Figure A4.21d – Prediction Plot – Mount Pleasant 2005 (Field, Raw, 0°) – % C
(Validation).
Figure A4.21e – Prediction Plot – Mount Pleasant 2005 (Field, Raw, 0°) – % OM LOI
(Calibration).
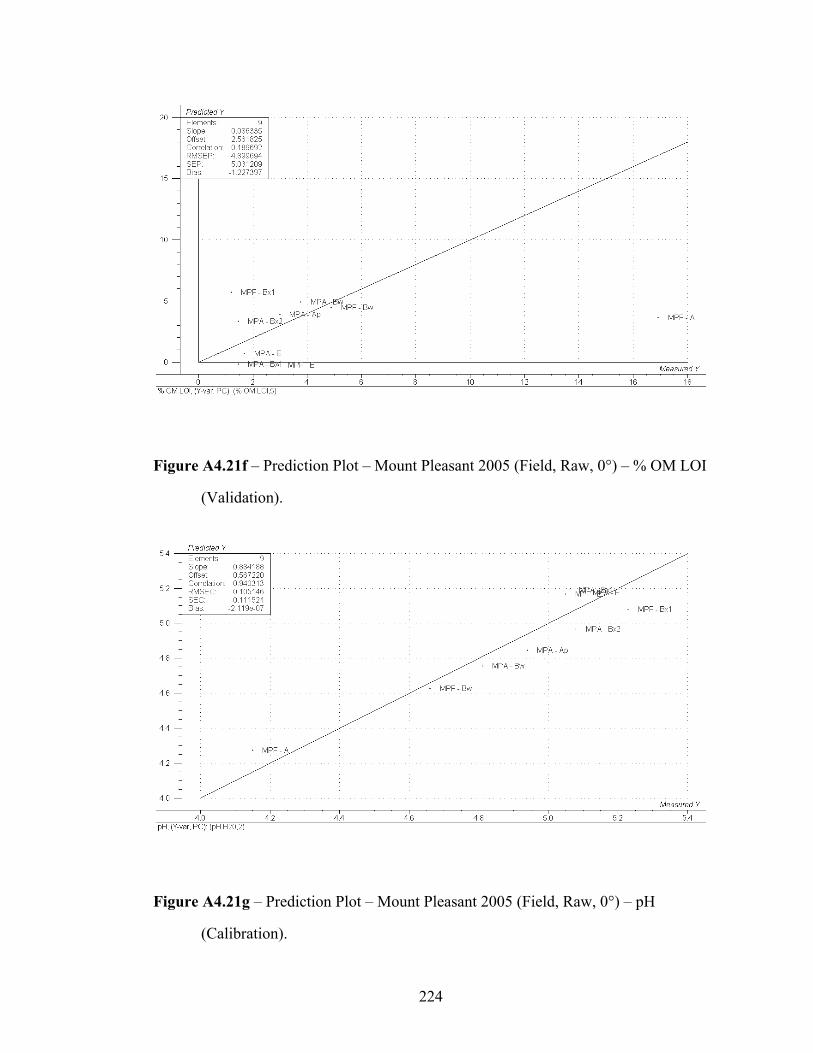
224
Figure A4.21f – Prediction Plot – Mount Pleasant 2005 (Field, Raw, 0°) – % OM LOI
(Validation).
Figure A4.21g – Prediction Plot – Mount Pleasant 2005 (Field, Raw, 0°) – pH
(Calibration).
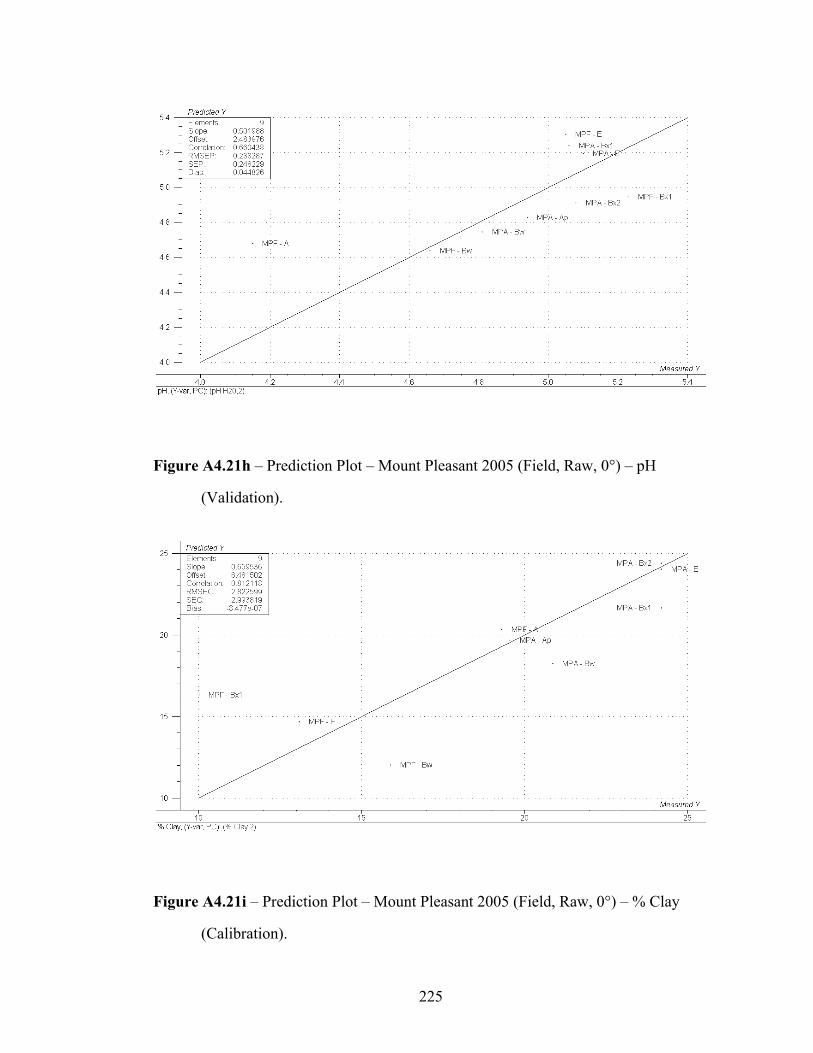
225
Figure A4.21h – Prediction Plot – Mount Pleasant 2005 (Field, Raw, 0°) – pH
(Validation).
Figure A4.21i – Prediction Plot – Mount Pleasant 2005 (Field, Raw, 0°) – % Clay
(Calibration).
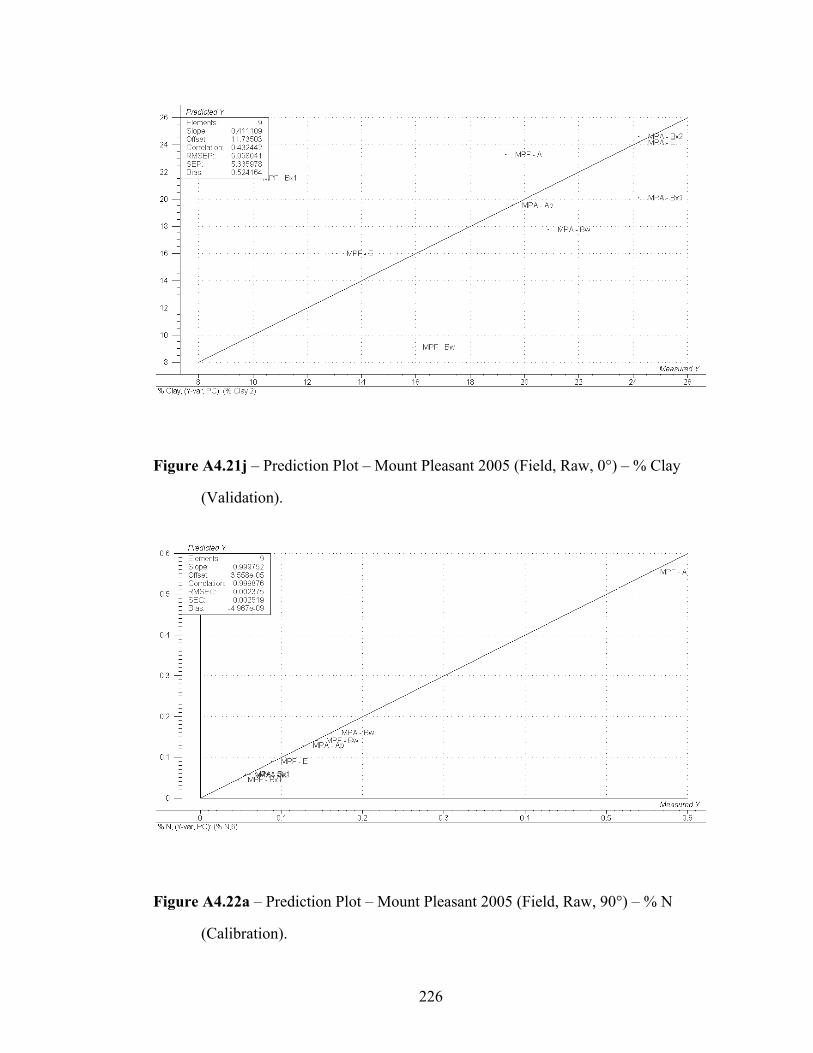
226
Figure A4.21j – Prediction Plot – Mount Pleasant 2005 (Field, Raw, 0°) – % Clay
(Validation).
Figure A4.22a – Prediction Plot – Mount Pleasant 2005 (Field, Raw, 90°) – % N
(Calibration).

227
Figure A4.22b – Prediction Plot – Mount Pleasant 2005 (Field, Raw, 90°) – % N
(Validation).
Figure A4.22c – Prediction Plot – Mount Pleasant 2005 (Field, Raw, 90°) – % C
(Calibration).
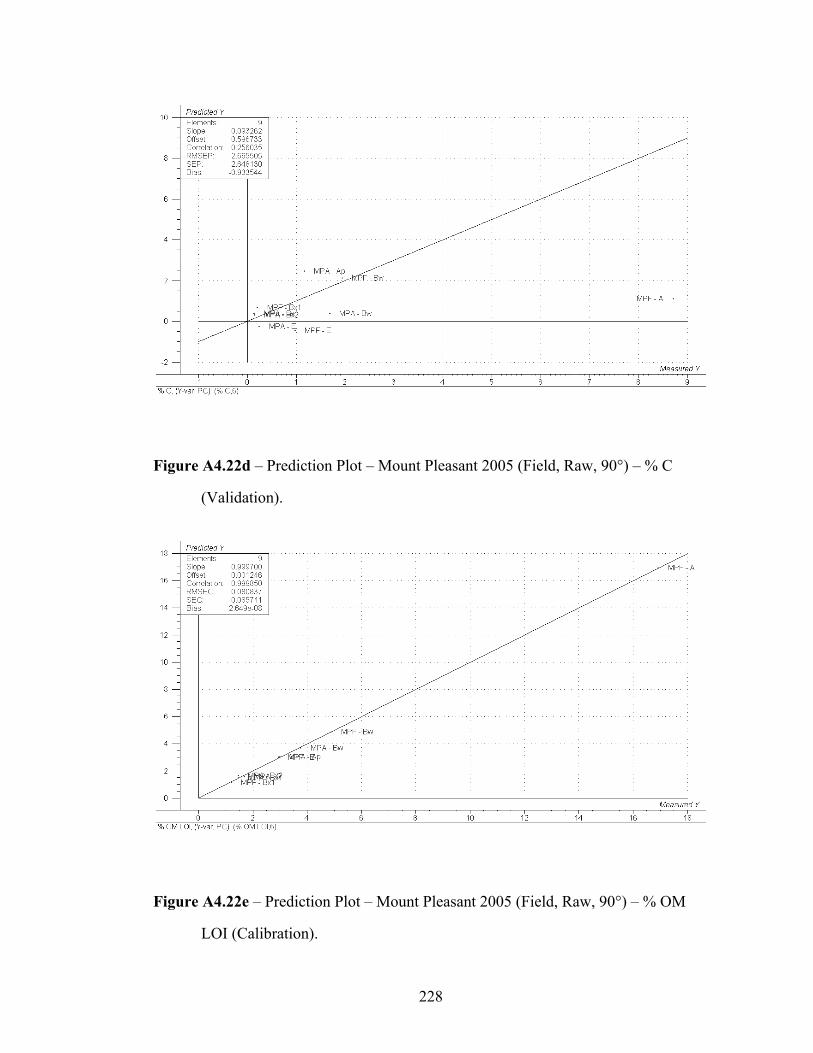
228
Figure A4.22d – Prediction Plot – Mount Pleasant 2005 (Field, Raw, 90°) – % C
(Validation).
Figure A4.22e – Prediction Plot – Mount Pleasant 2005 (Field, Raw, 90°) – % OM
LOI (Calibration).
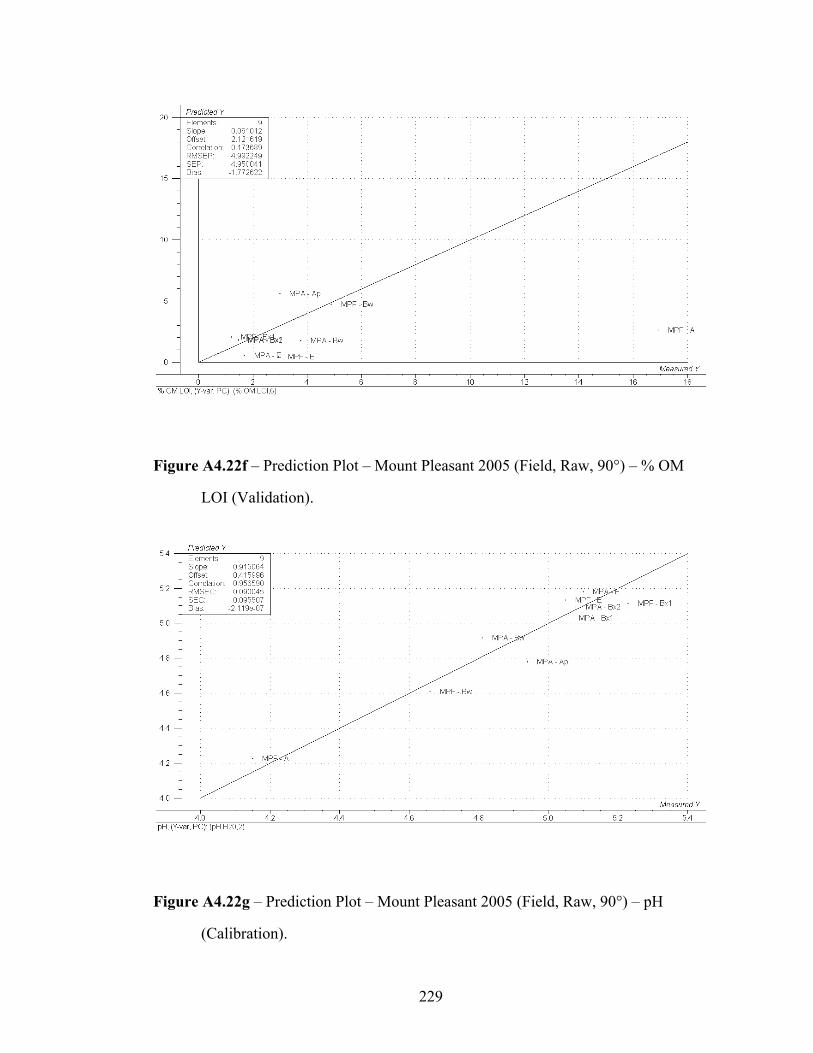
229
Figure A4.22f – Prediction Plot – Mount Pleasant 2005 (Field, Raw, 90°) – % OM
LOI (Validation).
Figure A4.22g – Prediction Plot – Mount Pleasant 2005 (Field, Raw, 90°) – pH
(Calibration).
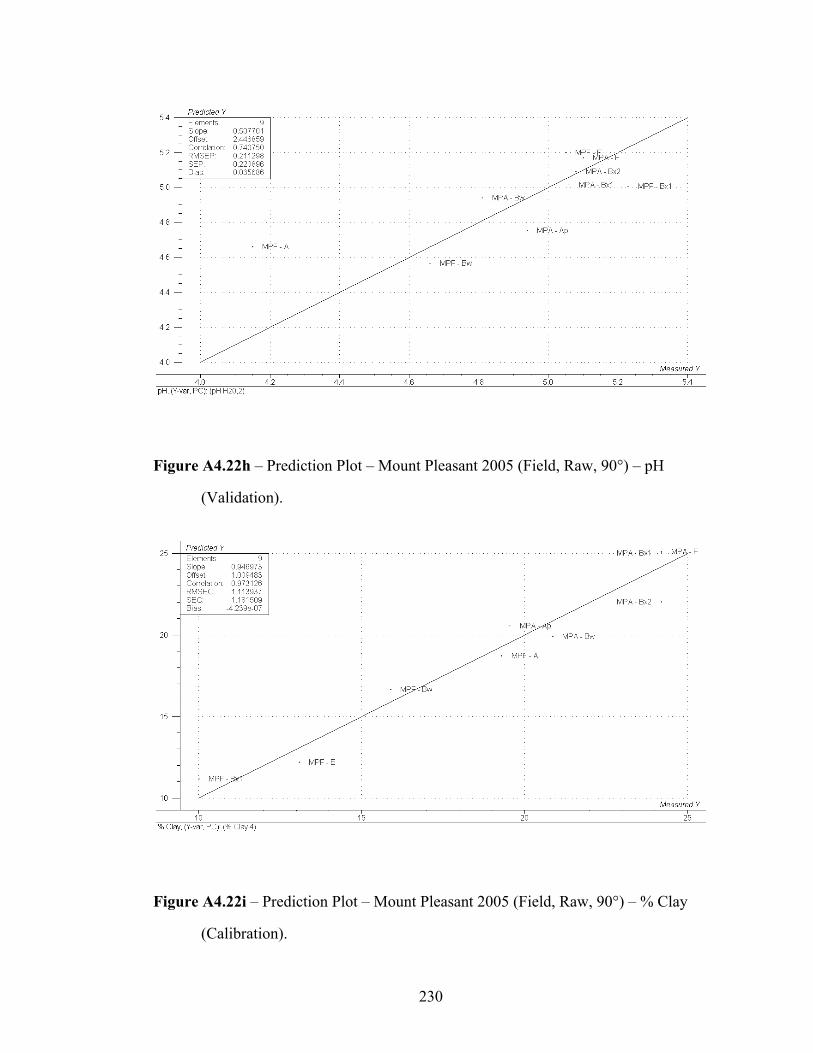
230
Figure A4.22h – Prediction Plot – Mount Pleasant 2005 (Field, Raw, 90°) – pH
(Validation).
Figure A4.22i – Prediction Plot – Mount Pleasant 2005 (Field, Raw, 90°) – % Clay
(Calibration).

231
Figure A4.22j – Prediction Plot – Mount Pleasant 2005 (Field, Raw, 90°) – % Clay
(Validation).
Figure A4.23a – Prediction Plot – Mount Pleasant 2005 (Lab, Raw) – % N
(Calibration).
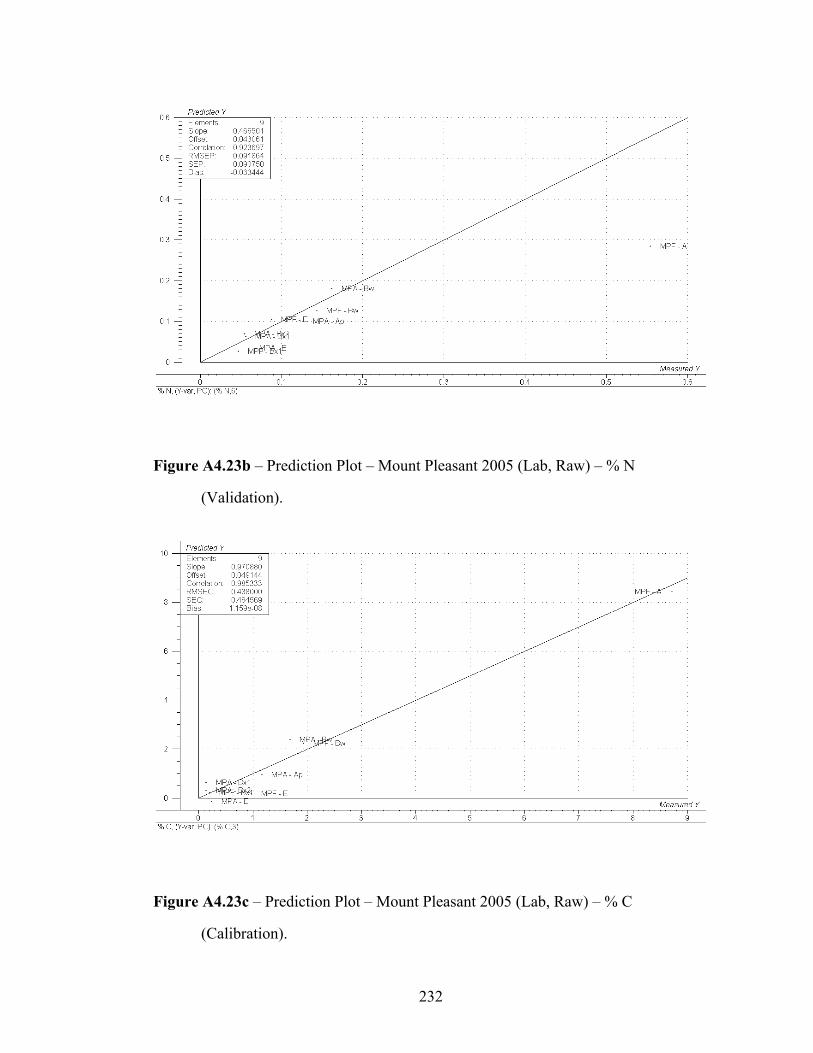
232
Figure A4.23b – Prediction Plot – Mount Pleasant 2005 (Lab, Raw) – % N
(Validation).
Figure A4.23c – Prediction Plot – Mount Pleasant 2005 (Lab, Raw) – % C
(Calibration).
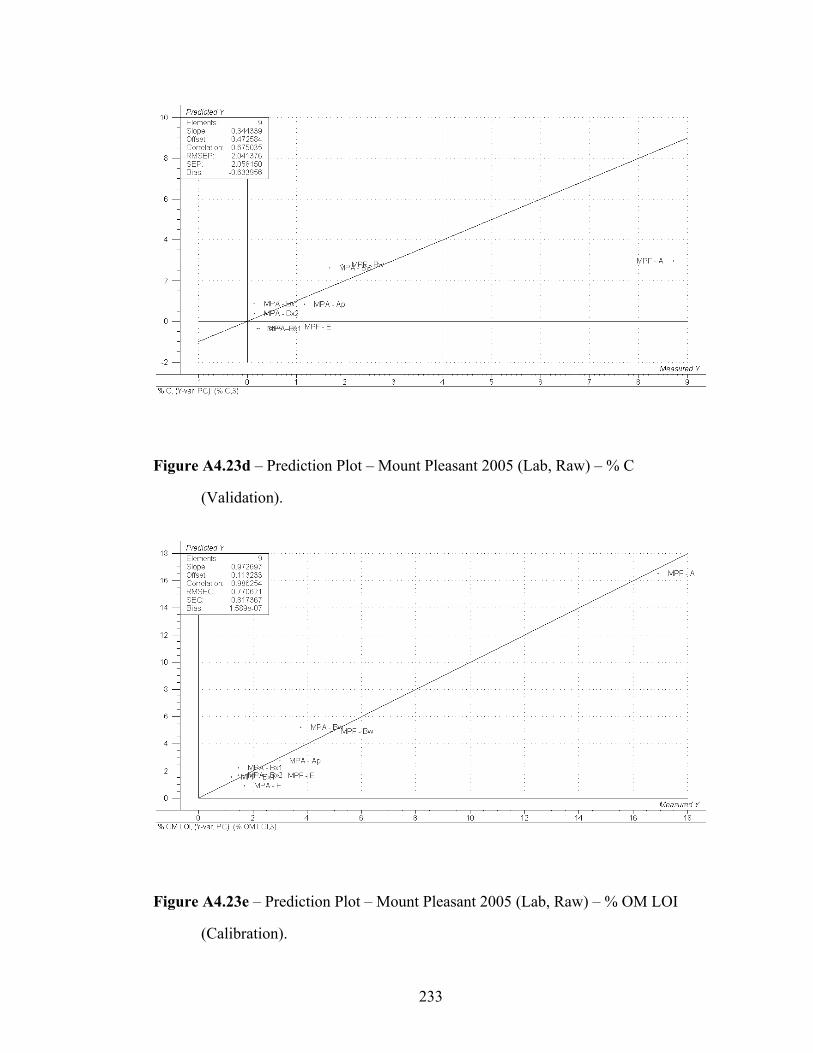
233
Figure A4.23d – Prediction Plot – Mount Pleasant 2005 (Lab, Raw) – % C
(Validation).
Figure A4.23e – Prediction Plot – Mount Pleasant 2005 (Lab, Raw) – % OM LOI
(Calibration).
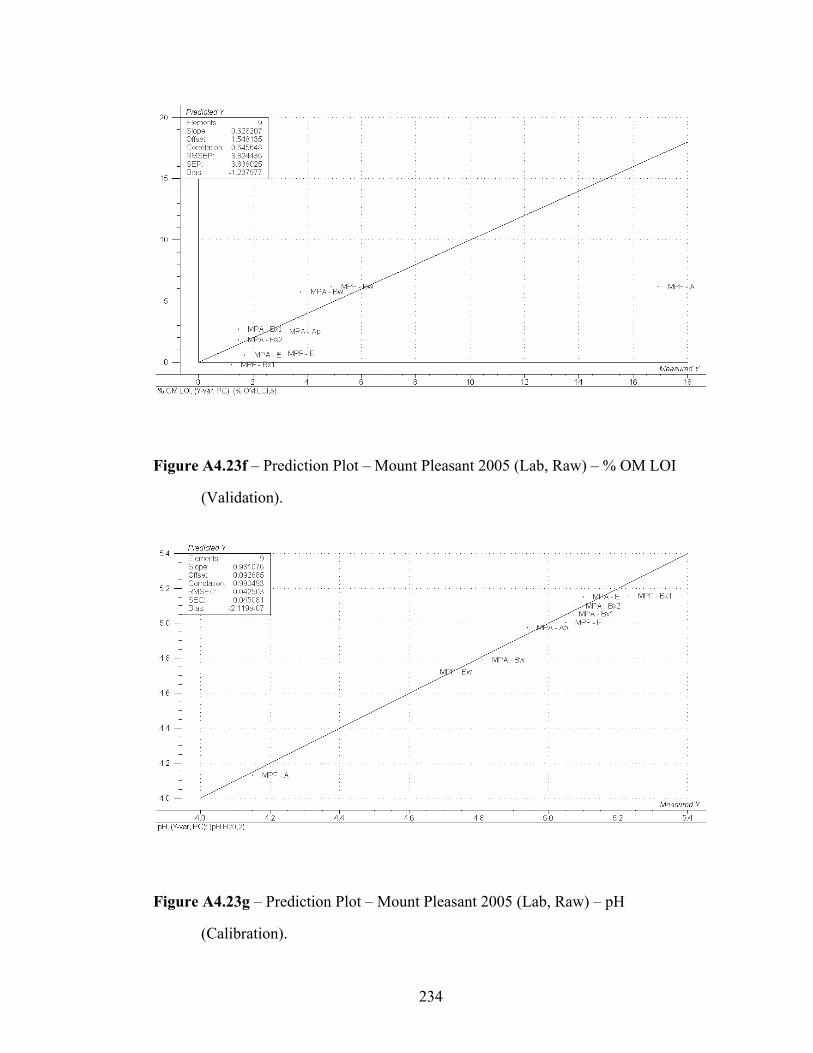
234
Figure A4.23f – Prediction Plot – Mount Pleasant 2005 (Lab, Raw) – % OM LOI
(Validation).
Figure A4.23g – Prediction Plot – Mount Pleasant 2005 (Lab, Raw) – pH
(Calibration).
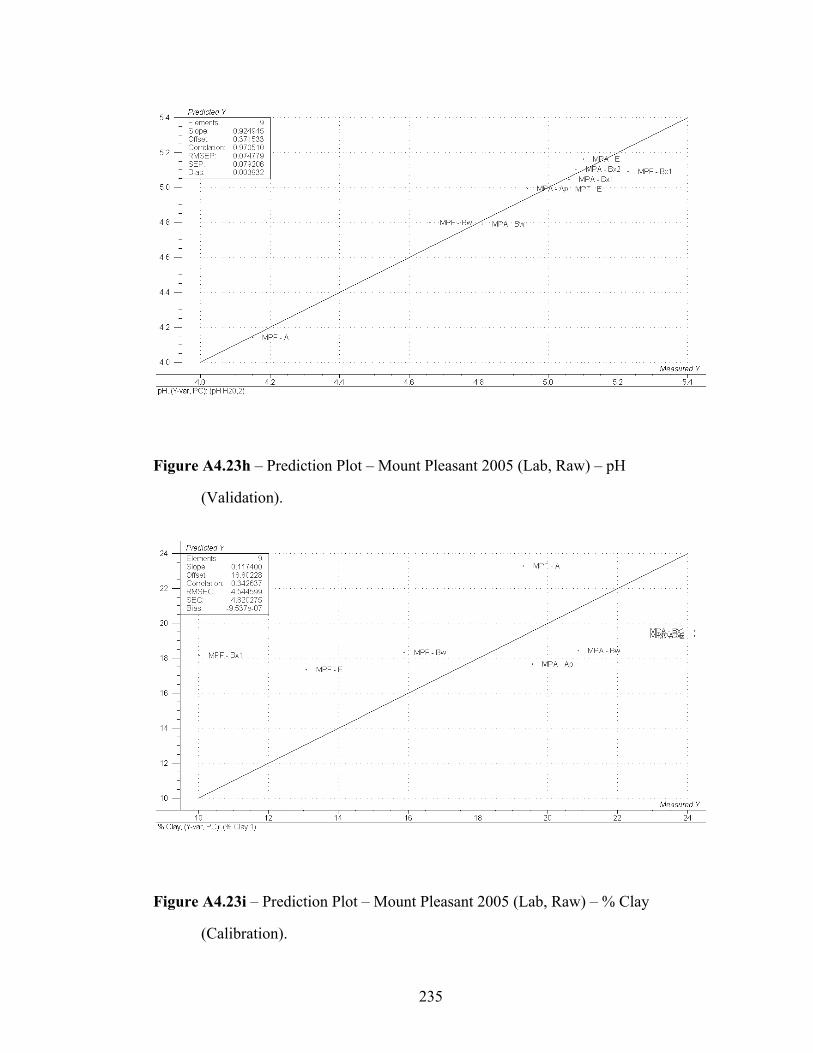
235
Figure A4.23h – Prediction Plot – Mount Pleasant 2005 (Lab, Raw) – pH
(Validation).
Figure A4.23i – Prediction Plot – Mount Pleasant 2005 (Lab, Raw) – % Clay
(Calibration).
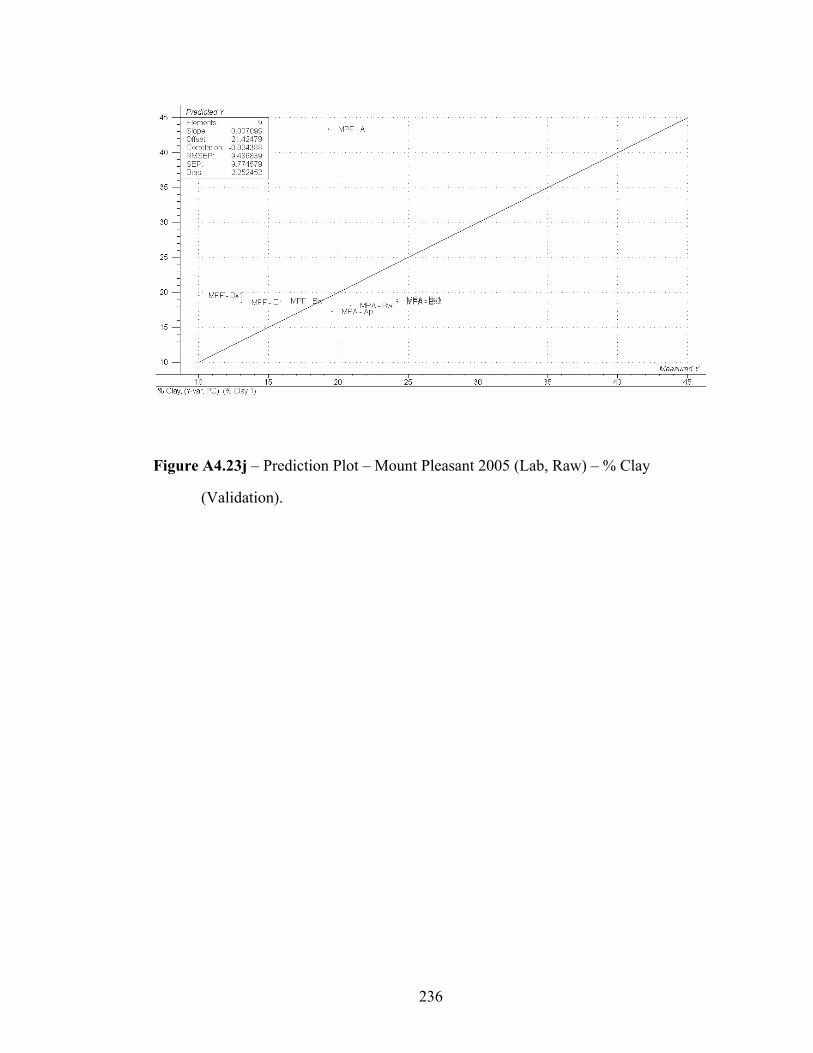
236
Figure A4.23j – Prediction Plot – Mount Pleasant 2005 (Lab, Raw) – % Clay
(Validation).
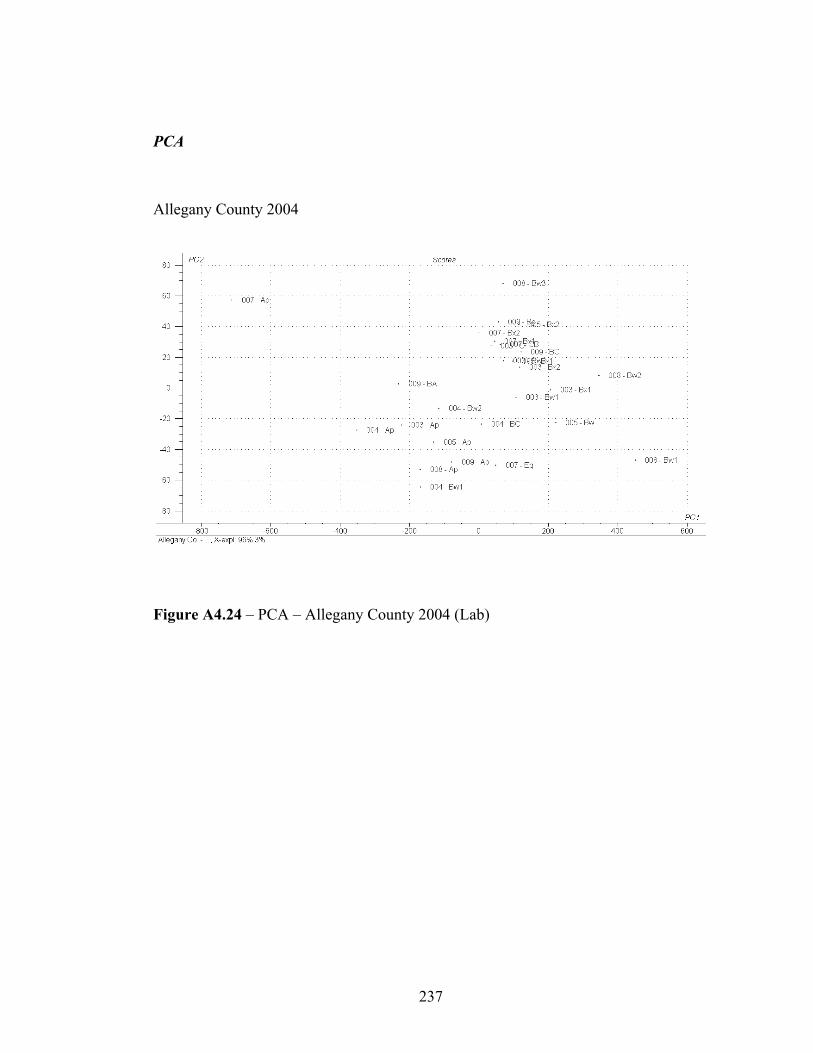
237
PCA
Allegany County 2004
Figure A4.24 – PCA – Allegany County 2004 (Lab)
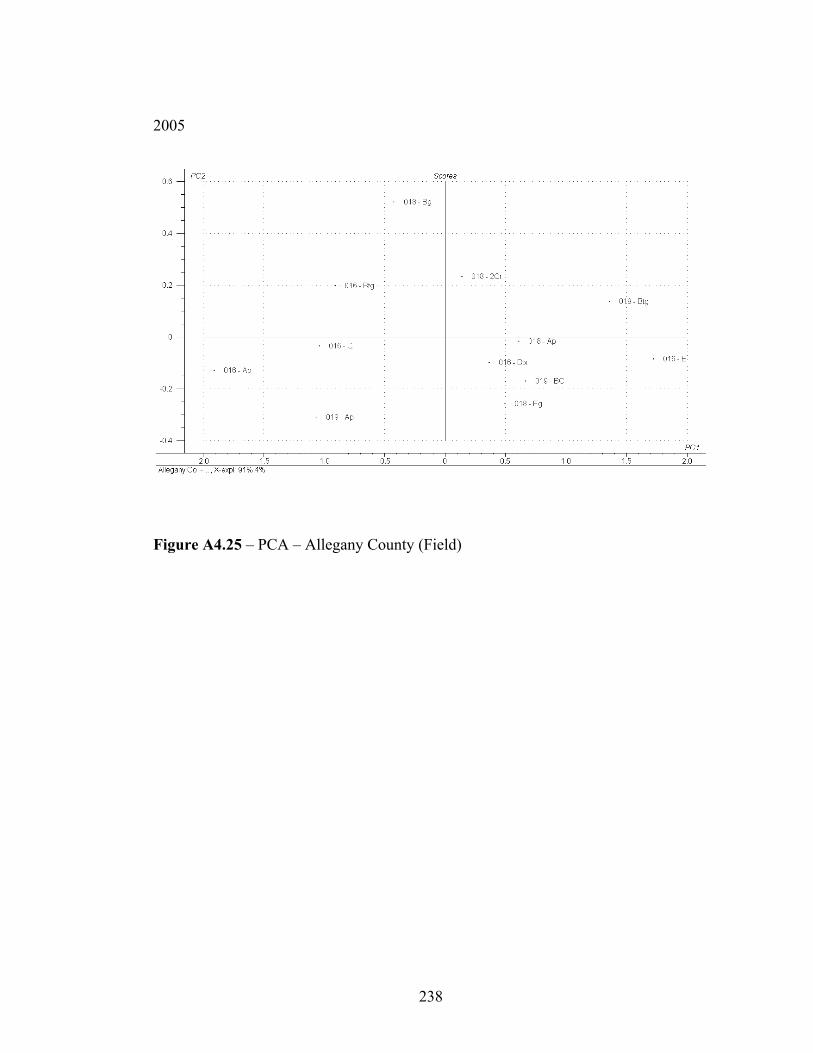
238
2005
Figure A4.25 – PCA – Allegany County (Field)
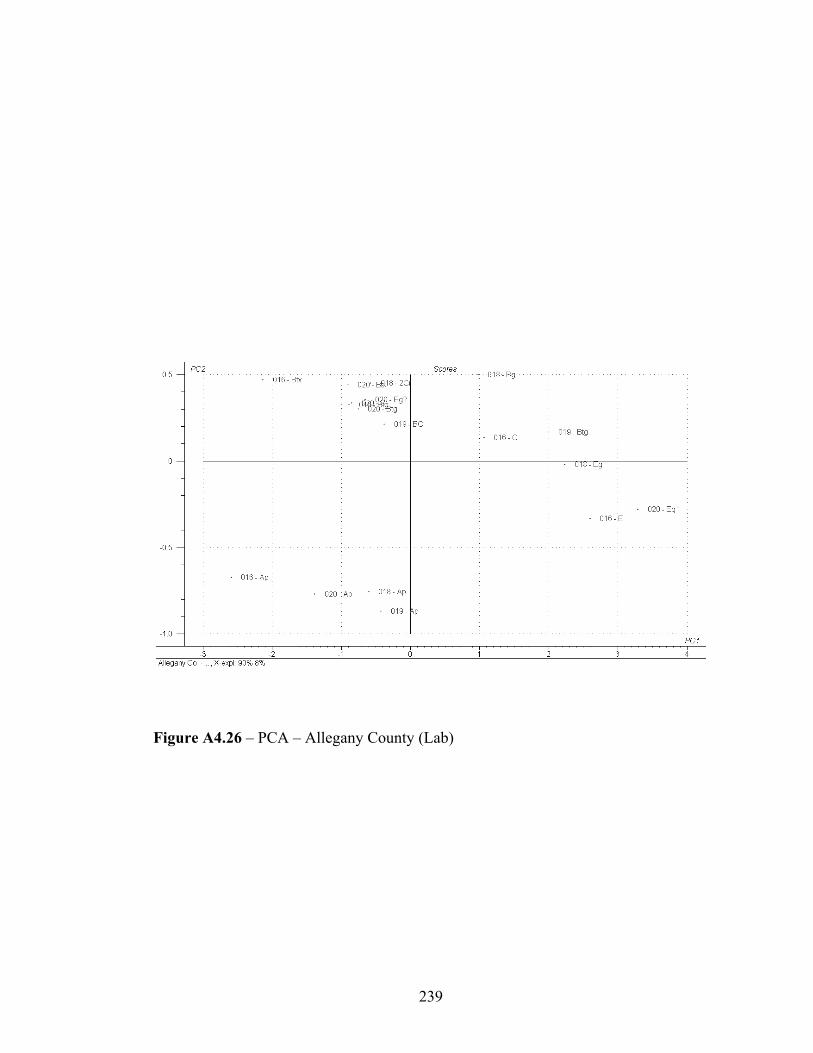
239
Figure A4.26 – PCA – Allegany County (Lab)
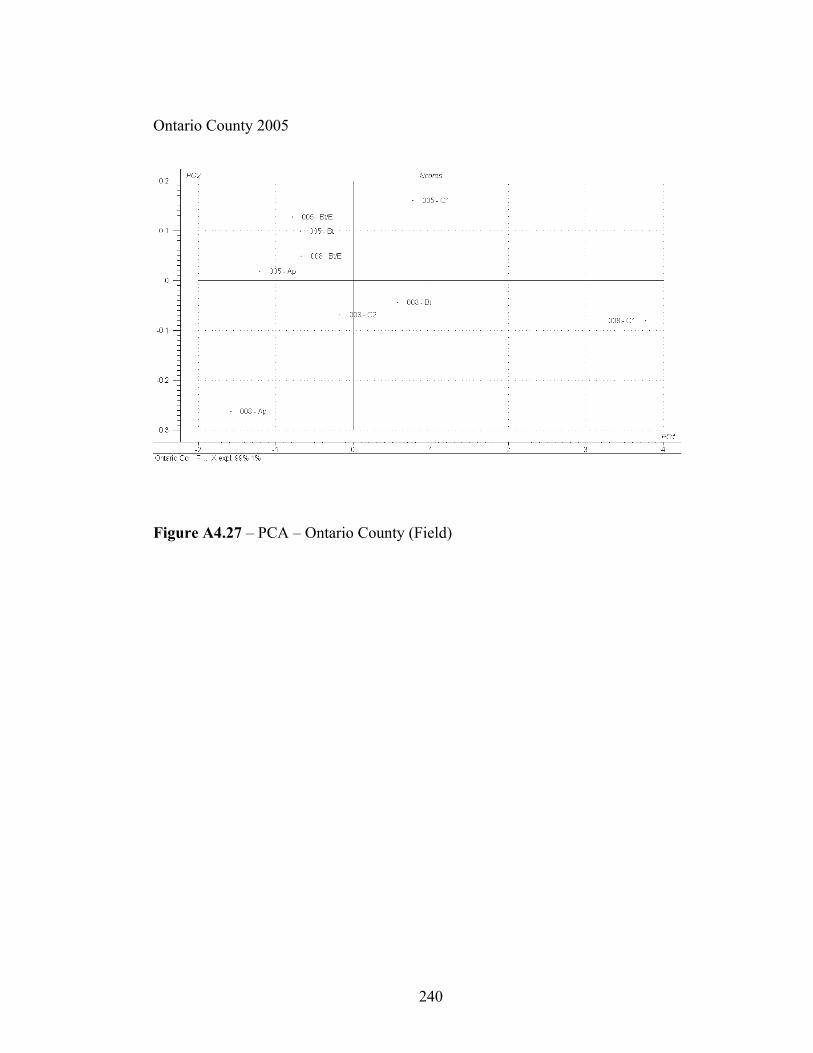
240
Ontario County 2005
Figure A4.27 – PCA – Ontario County (Field)
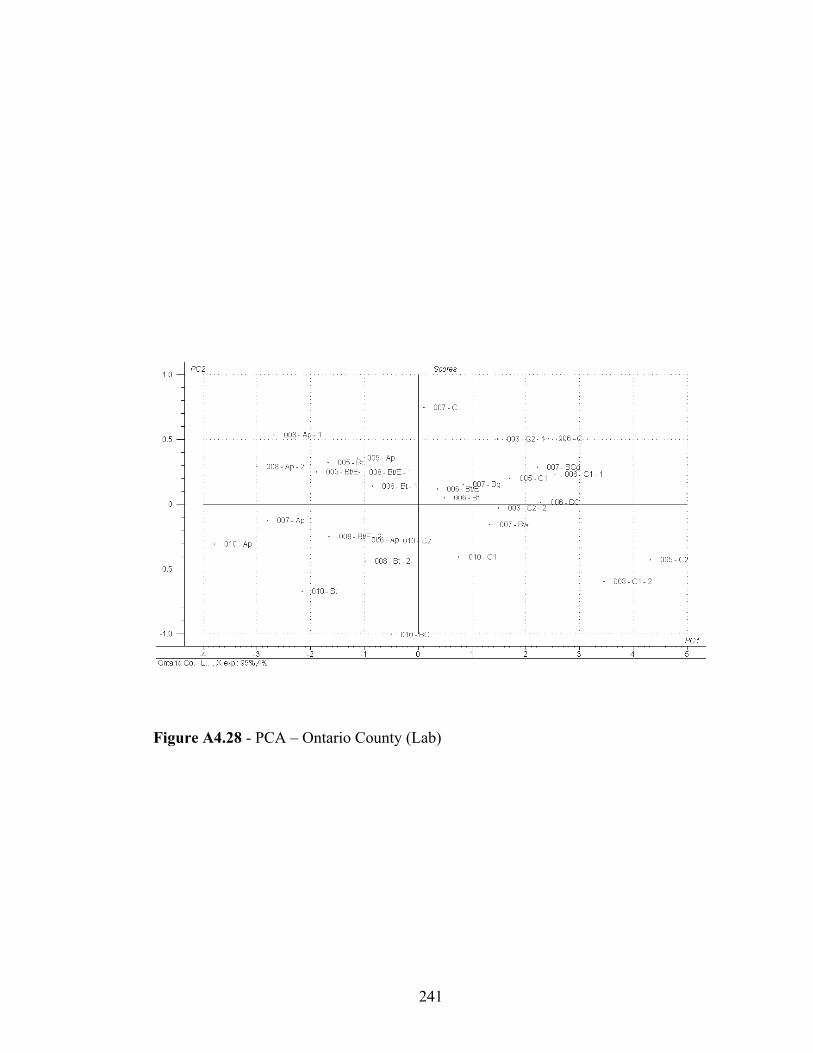
241
Figure A4.28 - PCA – Ontario County (Lab)
242
REFERENCES
ASTM. 2000. Standard test methods for moisture, ash, and organic matter of peat and
other organic soils. Method D 2974-00. American Society for Testing and
Materials. West Conshohocken, PA.
Barnes E. M., K. A. Sudduth, J. W. Hummel, S. M. Lesch, D. L. Corwin, C. Yang, C.
S. T. Daughtry, and W. C. Bausch. 2003. Remote- and ground-based sensor
techniques to map soil properties. Photogramm. Eng. Remote Sens. 69:619-
630.
Barnes, E. M., and M. G. Baker. 2000. Multispectral data for mapping soil texture:
possibilities and limitations. Applied Engineering in Agriculture 16:731-741.
Ben-Dor, E. 2002. Quantitative remote sensing of soil properties. Adv. Agron. 75:173-
251.
Ben-Dor, E., and A. Banin. 1995. Near-infrared analysis as a rapid method to
simultaneously evaluate several soil properties. Soil Sci. Soc. Am. J. 59:364-
372.
Blume, L.J., B.A. Schumacher, P.W. Shaffer et al. 1990. Handbook of Methods for
Acid Deposition Studies Laboratory Analyses for Soil Chemistry. EPA/600/4-
90/023. U.S. Environmental Protection Agency, Las Vegas, NV.
Broge, N. H., A. G. Thomsen, and M. H. Greve. 2004. Prediction of topsoil organic
matter and clay content from measurements of spectral reflectance and
electrical conductivity. Acta Agric. Scand., Sect. B, Soil and Plant Sci. 54:232-
240.
243
Brown, D. J., K. D. Shepherd, M. G. Walsh, M. D. Mays, and T. G. Reinsch. 2005a.
Global soil characterization with VNIR diffuse reflectance spectroscopy.
Geoderma 132:273-290.
Brown, D. J., R. S. Bricklemyer, and P. R. Miller, 2005b. Validation requirements for
diffuse reflectance soil characterization models with a case study of VNIR soil
C prediction in Montana. Geoderma 129:251-267.
Cozzolino, D., and A. Morón. 2003. The potential of near-infrared reflectance
spectroscopy to analyse soil chemical and physical characteristics. J. Agric.
Sci. (Cambridge) 140:65-71.
Cressie, N. A. C., 1993. Statistics for Spatial Data, Rev. ed. Wiley. New York.
Dalal, R. C., and R. J. Henry. 1986. Simultaneous determination moisture, organic
carbon and total nitrogen by near infrared spectroscopy. Soil Sci. Soc. Am. J.
50:120-123.
Dunn, B. W., H. G. Beecher, G. D. Batten, and S. Ciavarella. 2002. The potential of
near-infrared spectroscopy for soil analysis – a case study from the Riverine
Plain of south-eastern Australia. Australian Journal of Experimental
Agriculture 42:607-614.
Eckert, D. and J. T. Sims. 1995. Recommended Soil pH and Lime Requirement Tests.
p. 11-16. In J.Thomas Sims and A. Wolf (eds.) Recommended Soil Testing
Procedures for the Northeastern United States. Northeast Regional Bulletin
#493. Agricultural Experiment Station, University of Delaware, Newark, DE.
Esbensen, K. H. 2004. Multivariate Data Analysis in practice. CAMO Process AS.
Oslo, Norway.
Food and Agricultural Organization. 1998. World Reference Base for Soil Resources.
FAO, Rome.
Foth, H. D., and B. G. Ellis, 1988. Soil fertility. Wiley, New York.
244
Galvão, L. S., M. A. Pizzaro, and J. C. N. Epiphanio. 2001. Variations in reflectance
of tropical soils: spectral-chemical composition relationships from AVIRIS
data. Remote Sens. Environ. 75:245-255.
Gee, G.W. and D. Or. 2002. Particle size analysis. p. 255-293-411. In J. H. Dane and
G. C. Topp (ed.) Methods of Soil Analysis. Part 4. Physical and Mineralogical
Methods. Soil Science Society of America Book Series Number 5. American
Society of Agronomy, Madison, WI.
Geladi, P., Kowalski, B.R., 1986. Partial Least-squares regression: a tutorial. Anal.
Chim. Acta 185, 1 –17.
Glinka, K.D. 1927. Dokuchaiev’s Ideas in the Development of Pedology and Cognate
Sciences. 32 p. In Russian Pedology. Invest. I. Acad. Sci. USSR, Leningrad.
Ingleby, H. R. and T. G. Crowe. 2000. Reflectance models for predicting organic
carbon in Saskatchewan soils. Can. Agri. Eng. (42)2:57-63.
Islam, K., B. Singh, and A. McBratney, 2003. Simultaneous estimation of several soil
properties by ultra-violet, visible, and near-infrared reflectance spectroscopy.
Aust. J. Soil Res. 41:1101-1114.
Kariuki, P. C., T. Woldai and F. Van Der Meer. 2004. Effectiveness of spectroscopy
in identification of swelling indicator clay minerals. Int. J. Remote Sensing
25:455-469.
Lee, W. S., J. F. Sanchez, R. S. Mylavarapu, and J. S. Choe. 2003. Estimating
chemical properties of Florida soils using spectral reflectance. Trans. ASAE
46(5):1443–1453.
Lillesand, T. M., R. W. Kiefer, and J. W. Chipman. 2004. Remote sensing and image
interpretation. John Wiley & Sons, Ltd., New York.
Lobell, D. B., and G. P. Asner, 2002. Moisture effects on soil reflectance. Soil Sci.
Soc. Am. J. 66:722-727.
245
Malley, D. F., P. D. Martin, and E. Ben-Dor. 2004. Application in analysis of soils.
Near Infrared Spectroscopy in Agriculture. 44:729-784.
Martin, P. D., D. F. Malley, G. Manning, and L. Fuller. 2002. Determination of soil
organic carbon and nitrogen at the field level using near-infrared spectroscopy.
Can. J. Soil Sci. 82:413-422.
Milfred, C. J., and R. W. Kiefer, 1976. Analysis of soil variability with repetitive
aerial photography. Soil Sci. Soc. Am. J. 40:553-557.
Morón, A. and D. Cozzolino. 2002. Application of near infrared reflectance
spectroscopy for the analysis of organic C, total N and pH in soils of Uruguay.
J. Near Infrared Spectroscopy 10:215-221.
Nanni, M. R. and J. A. M. Demattê. 2006. Spectral Reflectance Methodology in
Comparison to Traditional Soil Analysis. Soil Sci. Soc. Am. J. 70:393-407.
Nelson, D.W. and L.E. Sommers. 1996. Total Carbon, Organic Carbon, and Organic
Matter. p 961-1010. In D.L. Sparks (ed). Methods of Soil Analysis, Part 3.
Chemical Methods. Soil Science Society of America Book Series Number 5.
American Society of Agronomy, Madison, WI.
Pella, E. 1990. Elemental organic analysis. Part 1. Am. Lab 22: 116-125.
Reeves, J. B. III, G. W. McCarty, and J. J. Meisinger. 1999. Near infrared reflectance
spectroscopy for the analysis of agricultural soils. J. Near Infrared Spectrosc.
7:179-193.
Salisbury, J. W., and D. M. D’Aria. 1992. Infrared (8-14 µm) remote sensing of soil
particle size. Remote Sens. Env. 42(2):157-165.
Shepherd, K. D. and M. G. Walsh, 2002. Development of reflectance spectral libraries
for characterization of soil properties. Soil Sci. Soc. Am. J. 66:988-998.
Shih, S. F., and J. D. Jordan. 1992. Landsat Mid-Infrared Data and GIS in Regional
Surface Soil-Moisture Assessment. Water Resour. Bull. 25(4):713-719.
246
Soil Survey Division Staff. 1993. Soil Survey Manual. Soil Conservation Service.
USDA-NRCS Agrc. Handb. 18. U. S. Gov. Print. Office, Washington, DC.
Soil Survey Division Staff. 1999. Soil Taxonomy: A basic system of soil classification
for making and interpreting soil surveys. USDA-NRCS Agric. Handb. 436. U.
S. Gov. Print. Office, Washington, DC.
Thomasson, J. A., R. Sui, M. S. Cox, and A. Al-Rajehy, 2001. Soil reflectance sensing
for determining soil properties in precision agriculture. Trans. ASAE
44(6):1445-1453.
Tsai, F. and W. Philpot, 1998. Derivative analysis of hyperspectral data. Remote Sens.
Environ. 66:41-51.
USDA-NRCS. 2005. National Soil Survey Handbook, Title 430-VI. [Online].
Available at http://soils.usda.gov/technical/handbook (accessed 30 January
2007; verified 30 January 2007) USDA-NRCS-NSSC, Lincoln, NE.
USEPA. 2002. Methods for the Determination of Total Organic Carbon (TOC) in
Soils and Sediments. USEPA Rep. NCEA-C- 1282, EMASC-001. U. S. Gov.
Print. Office, Washington, DC.
Walkley, A. and I. A. Black, 1934. An examination of the Degtjareff method for
determining organic carbon in soils: Effect of variations in digestion conditions
and of inorganic soil constituents. Soil Sc. Soc. Am. J. 63:251-263.
Weidong, L., F. Baret, G. Xingfa, T. Qingxi, Z. Lanfen, and Z. Bing, 2002. Relating
soil surface moisture to reflectance. Remote Sens. Environ. 81:238-246.
Whiting, M. L., L. Li, and S. L. Ustin. 2004. Predicting water content using Gaussian
model on soil spectra. Remote Sens. Environ. 89:535-552.
Wold, S., Sjostrom, M., Eriksson, L., 2001. PLS-regression: a basic tool of
chemometrics. Chemom. Intell. Lab. Syst. 58, 109– 130.

247
Zhang, X., N. H. Younan, and C. G. O’Hara. 2005. Wavelet domain statistical
hyperspectral soil texture classification. IEEE Trans. Geosci. Remote Sens.
(43)3:615-618.