Hyperspectral remote sensing of foliar nitrogen...
13
Hyperspectral remote sensing of foliar nitrogen content Yuri Knyazikhin a,1 , Mitchell A. Schull b , Pauline Stenberg c , Matti Mõttus d , Miina Rautiainen c , Yan Yang a , Alexander Marshak e , Pedro Latorre Carmona f , Robert K. Kaufmann a , Philip Lewis g , Mathias I. Disney g , Vern Vanderbilt h , Anthony B. Davis i , Frédéric Baret j , Stéphane Jacquemoud k , Alexei Lyapustin e , and Ranga B. Myneni a a Department of Earth and Environment, Boston University, Boston, MA 02215; b Hydrology and Remote Sensing Laboratory, US Department of Agriculture– Agricultural Research Service, Beltsville, MD 20705; Departments of c Forest Sciences and d Geosciences and Geography, University of Helsinki, FI-00014, Helsinki, Finland; e Climate and Radiation Laboratory, Code 613, National Aeronautics and Space Administration Goddard Space Flight Center, Greenbelt, MD 20771; f Departamento de Lenguajes y Sistemas Informáticos, Universidad Jaume I, 12071 Castellón, Spain; g Department of Geography and National Centre for Earth Observation, University College London, London WC1E 6BT, United Kingdom; h Biospheric Science Branch, Earth Science Division, National Aeronautics and Space Administration–Ames Research Center, Moffet Field, CA 94035; i Jet Propulsion Laboratory, California Institute of Technology, Pasadena, CA 91109; j Unité Mixte de Recherche 1114 Environnement Méditerranéen et Modélisation des Agro-Hydrosystèmes, Institut National de la Recherche Agronomique Site Agroparc, 84914 Avignon, France; and k Institut de Physique du Globe de Paris–Sorbonne Paris Cité, Université Paris Diderot, Unité Mixte de Recherche Centre National de la Recherche Scientifique 7154, 75013 Paris, France Edited by Robert E. Dickinson, University of Texas at Austin, Austin, TX, and approved October 30, 2012 (received for review June 18, 2012) A strong positive correlation between vegetation canopy bidirec- tional reflectance factor (BRF) in the near infrared (NIR) spectral region and foliar mass-based nitrogen concentration (%N) has been reported in some temperate and boreal forests. This re- lationship, if true, would indicate an additional role for nitrogen in the climate system via its influence on surface albedo and may offer a simple approach for monitoring foliar nitrogen using satellite data. We report, however, that the previously reported correlation is an artifact—it is a consequence of variations in can- opy structure, rather than of %N. The data underlying this rela- tionship were collected at sites with varying proportions of foliar nitrogen-poor needleleaf and nitrogen-rich broadleaf species, whose canopy structure differs considerably. When the BRF data are corrected for canopy-structure effects, the residual reflectance variations are negatively related to %N at all wavelengths in the interval 423–855 nm. This suggests that the observed positive cor- relation between BRF and %N conveys no information about %N. We find that to infer leaf biochemical constituents, e.g., N content, from remotely sensed data, BRF spectra in the interval 710–790 nm provide critical information for correction of structural influences. Our analysis also suggests that surface characteristics of leaves impact remote sensing of its internal constituents. This further decreases the ability to remotely sense canopy foliar nitrogen. Finally, the analysis presented here is generic to the problem of remote sensing of leaf-tissue constituents and is therefore not a spe- cific critique of articles espousing remote sensing of foliar %N. radiative effect | spurious regression | plant ecology | carbon cycle T he importance of nitrogen in terrestrial ecosystem carbon dynamics and related potential climatic feedbacks is well known (1–4). The interaction between carbon and nitrogen at the leaf level is among one of the fundamental mechanisms control- ling the dynamics of the terrestrial carbon cycle (5, 6). Leaf-level processes influence absorption and scattering of solar radiation by foliage. In addition, the architecture of individual plants, their spatial distribution, and reflectivity of the ground (or understory) beneath a vegetation canopy also determine the angular patterns of reflected radiation (7), or the bidirectional reflectance factor (BRF, dimensionless), which is measured by air- and satellite- borne sensors. The BRF describes surface reflective properties in the absence of atmosphere and is a standard product from a new generation of global imaging spectro-radiometers (8–10). All of the above factors must be taken into account to link satellite data and leaf-level physiological processes. A strong positive correlation between canopy BRF at the near infrared (NIR) wavelengths (800−850 nm) and canopy mass- based foliar nitrogen concentration (%N) (in grams per 100 g of dry foliage mass) has been reported in some temperate and boreal forests (11). These sites represent sufficiently dense can- opies and include a range of forest types. A similar correlation was also reported to be valid between broadband canopy albedo (400–2500 nm) and %N, not surprisingly, because vegetation canopy reflectance at wavelengths greater than 800 nm is an order of magnitude larger than that in the shorter wavelength region of the solar spectrum, i.e., the photosynthetically active radiation (PAR) (400–700 nm) region, save for a few wavelength intervals of water absorption bands. The significance of this result, if true, is threefold. First, it may indicate an additional and overlooked role for nitrogen in the climate system via its influence on surface albedo and thus bio- sphere–atmosphere interactions, as hypothesized in ref. 11. Second, it may offer a simple and effective approach for moni- toring foliar nitrogen using broadband satellite data, as suggested in refs. 11–13. Finally, it may serve as the basis for a new pa- rameterization of surface albedo that would provide a natural link to ecosystem processes, as proposed in ref. 14. An examination of the reported relationship between NIR BRF and %N reveals in ref. 11 at least two incongruencies. First, this positive correlation is a counterintuitive example of radiative transfer processes—an increase in the foliar absorbing con- stituents should enhance absorption and accordingly decrease reflection. This physical argument suggests other factors, e.g., canopy structure (15), which not only suppress the absorption effect, but also become dominant determinants of the system’s behavior. In their analyses the authors of refs. 11 and 14 argued that vegetation canopy structure had no influence on the ob- served relationship on the basis of the absence of correlation between NIR BRF and proxies of canopy structure such as leaf area index (LAI) and canopy height (Fig. 1). However, this lack of correlation is well known in vegetation remote sensing liter- Author contributions: Y.K. and P.S. designed research; Y.K., M.A.S., R.K.K., V.V., A.B.D., F.B., S.J., and A.L. performed research; Y.K., P.S., M.M., M.R., A.M., P.L., and M.I.D. con- tributed new reagents/analytic tools; Y.K., M.A.S., Y.Y., P.L.C., and R.K.K. analyzed data; and Y.K., P.S., M.M., M.R., and R.B.M. wrote the paper. The authors declare no conflict of interest. This article is a PNAS Direct Submission. Freely available online through the PNAS open access option. 1 To whom correspondence should be addressed. E-mail: [email protected]. This article contains supporting information online at www.pnas.org/lookup/suppl/doi:10. 1073/pnas.1210196109/-/DCSupplemental. www.pnas.org/cgi/doi/10.1073/pnas.1210196109 PNAS Early Edition | 1 of 8 ENVIRONMENTAL SCIENCES PNAS PLUS
Transcript of Hyperspectral remote sensing of foliar nitrogen...

Hyperspectral remote sensing of foliarnitrogen contentYuri Knyazikhina,1, Mitchell A. Schullb, Pauline Stenbergc, Matti Mõttusd, Miina Rautiainenc, Yan Yanga,Alexander Marshake, Pedro Latorre Carmonaf, Robert K. Kaufmanna, Philip Lewisg, Mathias I. Disneyg,Vern Vanderbilth, Anthony B. Davisi, Frédéric Baretj, Stéphane Jacquemoudk, Alexei Lyapustine,and Ranga B. Mynenia
aDepartment of Earth and Environment, Boston University, Boston, MA 02215; bHydrology and Remote Sensing Laboratory, US Department of Agriculture–Agricultural Research Service, Beltsville, MD 20705; Departments of cForest Sciences and dGeosciences and Geography, University of Helsinki, FI-00014,Helsinki, Finland; eClimate and Radiation Laboratory, Code 613, National Aeronautics and Space Administration Goddard Space Flight Center, Greenbelt,MD 20771; fDepartamento de Lenguajes y Sistemas Informáticos, Universidad Jaume I, 12071 Castellón, Spain; gDepartment of Geography and NationalCentre for Earth Observation, University College London, London WC1E 6BT, United Kingdom; hBiospheric Science Branch, Earth Science Division, NationalAeronautics and Space Administration–Ames Research Center, Moffet Field, CA 94035; iJet Propulsion Laboratory, California Institute of Technology,Pasadena, CA 91109; jUnité Mixte de Recherche 1114 Environnement Méditerranéen et Modélisation des Agro-Hydrosystèmes, Institut National de laRecherche Agronomique Site Agroparc, 84914 Avignon, France; and kInstitut de Physique du Globe de Paris–Sorbonne Paris Cité, Université Paris Diderot,Unité Mixte de Recherche Centre National de la Recherche Scientifique 7154, 75013 Paris, France
Edited by Robert E. Dickinson, University of Texas at Austin, Austin, TX, and approved October 30, 2012 (received for review June 18, 2012)
A strong positive correlation between vegetation canopy bidirec-tional reflectance factor (BRF) in the near infrared (NIR) spectralregion and foliar mass-based nitrogen concentration (%N) hasbeen reported in some temperate and boreal forests. This re-lationship, if true, would indicate an additional role for nitrogen inthe climate system via its influence on surface albedo and mayoffer a simple approach for monitoring foliar nitrogen usingsatellite data. We report, however, that the previously reportedcorrelation is an artifact—it is a consequence of variations in can-opy structure, rather than of %N. The data underlying this rela-tionship were collected at sites with varying proportions of foliarnitrogen-poor needleleaf and nitrogen-rich broadleaf species,whose canopy structure differs considerably. When the BRF dataare corrected for canopy-structure effects, the residual reflectancevariations are negatively related to %N at all wavelengths in theinterval 423–855 nm. This suggests that the observed positive cor-relation between BRF and %N conveys no information about %N.We find that to infer leaf biochemical constituents, e.g., N content,from remotely sensed data, BRF spectra in the interval 710–790 nmprovide critical information for correction of structural influences.Our analysis also suggests that surface characteristics of leavesimpact remote sensing of its internal constituents. This furtherdecreases the ability to remotely sense canopy foliar nitrogen.Finally, the analysis presented here is generic to the problem ofremote sensing of leaf-tissue constituents and is therefore not a spe-cific critique of articles espousing remote sensing of foliar %N.
radiative effect | spurious regression | plant ecology | carbon cycle
The importance of nitrogen in terrestrial ecosystem carbondynamics and related potential climatic feedbacks is well
known (1–4). The interaction between carbon and nitrogen at theleaf level is among one of the fundamental mechanisms control-ling the dynamics of the terrestrial carbon cycle (5, 6). Leaf-levelprocesses influence absorption and scattering of solar radiation byfoliage. In addition, the architecture of individual plants, theirspatial distribution, and reflectivity of the ground (or understory)beneath a vegetation canopy also determine the angular patternsof reflected radiation (7), or the bidirectional reflectance factor(BRF, dimensionless), which is measured by air- and satellite-borne sensors. The BRF describes surface reflective properties inthe absence of atmosphere and is a standard product from a newgeneration of global imaging spectro-radiometers (8–10). All ofthe above factors must be taken into account to link satellite dataand leaf-level physiological processes.A strong positive correlation between canopy BRF at the near
infrared (NIR) wavelengths (800−850 nm) and canopy mass-
based foliar nitrogen concentration (%N) (in grams per 100 g ofdry foliage mass) has been reported in some temperate andboreal forests (11). These sites represent sufficiently dense can-opies and include a range of forest types. A similar correlationwas also reported to be valid between broadband canopy albedo(400–2500 nm) and %N, not surprisingly, because vegetationcanopy reflectance at wavelengths greater than 800 nm is anorder of magnitude larger than that in the shorter wavelengthregion of the solar spectrum, i.e., the photosynthetically activeradiation (PAR) (400–700 nm) region, save for a few wavelengthintervals of water absorption bands.The significance of this result, if true, is threefold. First, it may
indicate an additional and overlooked role for nitrogen in theclimate system via its influence on surface albedo and thus bio-sphere–atmosphere interactions, as hypothesized in ref. 11.Second, it may offer a simple and effective approach for moni-toring foliar nitrogen using broadband satellite data, as suggestedin refs. 11–13. Finally, it may serve as the basis for a new pa-rameterization of surface albedo that would provide a naturallink to ecosystem processes, as proposed in ref. 14.An examination of the reported relationship between NIR
BRF and %N reveals in ref. 11 at least two incongruencies. First,this positive correlation is a counterintuitive example of radiativetransfer processes—an increase in the foliar absorbing con-stituents should enhance absorption and accordingly decreasereflection. This physical argument suggests other factors, e.g.,canopy structure (15), which not only suppress the absorptioneffect, but also become dominant determinants of the system’sbehavior. In their analyses the authors of refs. 11 and 14 arguedthat vegetation canopy structure had no influence on the ob-served relationship on the basis of the absence of correlationbetween NIR BRF and proxies of canopy structure such as leafarea index (LAI) and canopy height (Fig. 1). However, this lackof correlation is well known in vegetation remote sensing liter-
Author contributions: Y.K. and P.S. designed research; Y.K., M.A.S., R.K.K., V.V., A.B.D.,F.B., S.J., and A.L. performed research; Y.K., P.S., M.M., M.R., A.M., P.L., and M.I.D. con-tributed new reagents/analytic tools; Y.K., M.A.S., Y.Y., P.L.C., and R.K.K. analyzed data;and Y.K., P.S., M.M., M.R., and R.B.M. wrote the paper.
The authors declare no conflict of interest.
This article is a PNAS Direct Submission.
Freely available online through the PNAS open access option.1To whom correspondence should be addressed. E-mail: [email protected].
This article contains supporting information online at www.pnas.org/lookup/suppl/doi:10.1073/pnas.1210196109/-/DCSupplemental.
www.pnas.org/cgi/doi/10.1073/pnas.1210196109 PNAS Early Edition | 1 of 8
ENVIRONMEN
TAL
SCIENCE
SPN
ASPL
US

ature as “reflectance saturation,” commonly observed in densevegetation (16, 17); i.e., the surface reflectance reaches anasymptote and thus is insensitive to LAI and/or canopy height.Fig. 1 demonstrates that the level of NIR reflectance at which
saturation occurs depends on the species, which is indicative of3D effects of vegetation structure because species differ in theirstructural attributes (e.g., Red Oak/Maple vs. Red Pine). That is,the same amount of leaf area can be distributed in many ways toform canopies of varying topology: e.g., as canopies of conical orellipsoidal tree crowns. The BRF values can be different al-though the canopy LAI and height are same in all cases (18, 19).Moreover, the effects of 3D structure on radiative processes canaffect the sensitivity of canopy NIR reflectance to leaf opticalproperties (20). Therefore, the hypothesis that canopy structurehas no influence on the relationship between NIR BRF and %Nsimply because the data were limited to dense canopies requiresfurther analysis.Second, in their theoretical analyses (14, 21), the authors do
not address the physics of how radiation interacts with foliageand traverses in the 3D vegetation canopy, which is the mecha-nism that generates the remotely measured signal and constitutesthe basis for monitoring nitrogen from space. Light scattered bya leaf includes two components, specular and diffuse. The firstcomponent emanates from light reflected at the air–cuticle in-terface. This portion of reflected radiation is, in general, but notalways, partly polarized and exhibits a weak spectral dependency(22). It does not interact with pigments inside the leaf, butdepends on the properties of the leaf surface (22–27), andtherefore conveys no information about the constitution of theleaf tissue. Fresnel reflection is the principal cause of light po-larization at the leaf surface (22, 23). The diffuse component,which results from radiation interactions within the leaf interiorand any large particles on the leaf surface (hair, dust, and micro-to millimeter-scale wax structures), is not polarized. Its spectralbehavior is mainly determined by the intrinsic optical propertiesof leaf constituents. The fraction of leaf surface reflected radi-ation can be greater than that of the diffuse field and it variesgreatly between species (24, 27–29). This can weaken the sensi-
tivity of canopy reflectance to the amount of leaf constituents.For instance, in the spectral band about 650 nm, where chloro-phyll absorption is strong, a polarized reflectance of 9% mayaccount for 58% of the total radiation reflected by the leaf (28).In the NIR (800–850 nm) where pigments do not absorb any-more, variation between species in the radiation scattered fromthe leaf interior can be comparable to or smaller than that of theleaf surface reflected radiation (SI Text 3). Thus, scattering froma leaf contains radiation fields that convey information about leafinterior and leaf surface characteristics, both of which are furthertransformed by the multiple scattering process, which in turn isstrongly affected by the 3D canopy structure. The problem ofleaf surface and leaf interior physics and the 3D radiativetransfer process needs to be untangled if one wishes to remotelysense the content of certain constituents inside the leaf.These two incongruencies, namely influence of canopy struc-
ture and its transformation of signals generated by interaction ofradiation with leaves, justify a reexamination of the previouslyreported positive relationship between canopy NIR reflectanceand foliar %N (11). The problem investigated here, with the dataused in ref. 11, is generic to the issue of remote sensing of leafconstituents and is therefore not a specific critique.
Results and DiscussionCanopy Structure Is the Dominant Factor That Positively Relates NIRBRF and Foliar %N. Fig. 2 shows that both canopy %N and NIRBRF are strongly and positively related to broadleaf fraction ofleaf area (BfLAI, in m2/m2). The BfLAI characterizes variationsin forest structure due to changing proportions of structurallydifferent broad- and needleleaf species. We examine its role inthis relationship.The nonlinear %N vs. BfLAI relationship follows from equa-
tions used to estimate canopy foliar %N from field data (Materialsand Methods). The plots are characterized by a strong gradient inthe proportion of needle- and broadleaf species. The contributionsfrom leaves and needles to the canopy %N depend on thebroadleaf fraction of the leaf dry mass (BfM, in g/g), which is anincreasing function of the BfLAI (Materials and Methods).The difference in the leaf (%nL = 2.17 g/100 g) and needle
Fig. 1. BRF in the near infrared (NIR) spectral band (800–850 nm) vs. leaf areaindex (LAI) and vs. LVIS canopy height (Materials and Methods) for the Har-vard Forest. Values of LAI and LVIS height vary between 2.9 and 6 (mean =4.6; SD = 0.76) and between 10 m and 30 m (mean = 23.5 m; SD = 3.3), re-spectively. Different species tend to occupy different locations along thevertical axis, suggesting a dependence of NIR BRF on 3D forest structure al-though it does not correlate with two important canopy structural charac-teristics—LAI and canopy height.
Fig. 2. Canopy foliar %N vs. BfLAI (vertical axis on the left side) and BRF inthe near infrared (NIR) spectral band (800–850 nm) vs. BfLAI (vertical axis onthe right side) relationships for the Bartlett Forest (Table 1). The former canaccurately be approximated by equations (solid line) that relate %N,broadleaf fraction of the leaf dry mass (BfM), and BfLAI (Materials andMethods and SI Text 1): RRMSE = 10%. Values of R2, slope, and intercept ofthe measured %N vs. approximated %N regression line are 0.89, 0.997, and0.001, respectively (SI Text 1).
2 of 8 | www.pnas.org/cgi/doi/10.1073/pnas.1210196109 Knyazikhin et al.

(%nN = 1.24 g/100 g) nitrogen concentrations is responsiblefor a positive tendency in %N from pure (meaning 100%,hereafter) needle- to pure broadleaf plots. The differences indry mass per leaf (mL = 66.3 g/m2) and needle (mN = 224.2 g/m2)area determine the convexity of the relationship. Thus, BfLAI isthe structural variable that controls contributions from needlesand leaves and consequently determines variations in canopy %N.The NIR BRF vs. BfLAI relationship (Fig. 2) has the fol-
lowing interpretation. First, due to high dry matter content ina needle, absorption by needles could be stronger compared withthat of leaves (30). Second, due to relatively strong needlescattering in the NIR spectral band (23, 31), the structure ofa coniferous shoot gives rise to multiple photon–needle inter-actions within a shoot (32–34). The shoot acts as a “photontrap,” within which photons travel until they are either absorbedor scattered out. Photons scattered out of one shoot can in turnbe either trapped by another shoot or escape the canopy. Eachwithin-shoot interaction increases the likelihood of photon ab-sorption; thus, the shoots appear darker compared with needles(34–36). Because this effect is not present in broadleaf canopies,NIR reflectance tends to be greater than its coniferous coun-terpart (32). In dense, mixed canopies, an increase in the fractionof broadleaf trees therefore tends to make the forest canopiesappear brighter in the NIR spectral region. The topology of theupper surface of a canopy is another factor that causes an in-crease in the NIR BRF from pure needle- to pure broadleaf leafforests. This effect is discussed later.Finally, Fig. 3 shows the relationship between NIR BRF and
%N, which follows from Fig. 2. Indeed, the lowest BRF valuescorrespond to pure needle-leaf forests (Fig. 2) where only nitro-gen-poor needles contribute to the mean canopy foliar nitrogenconcentration. An increase in the fraction of broadleaf speciesenhances the contributions from nitrogen-rich flat leaves to %N,lowers the foliar dry matter content, and dampens the darkeningeffect of shoot structure. The former augments %N whereas thetwo latter factors make the canopy appear brighter, as discussedabove. This suggests that canopy structure is the dominant factorthat governs variations in NIR BRF and %N and consequentlyresults in the spurious relationship between the canopy reflectanceand foliar nitrogen. Therefore, NIR and/or SW broadband satel-lite data cannot be directly linked to leaf-level processes.These empirical results are based on data from the Bartlett
Forest. Our goal is to understand the physics behind empirical
relationships, identify the role of canopy structure on the NIR BRFvs. %N relationship across all study areas, and if needed developa method to account for canopy structural influence in remotesensing of leaf tissue constituents. We begin with an analysis of theradiative transfer process in a vegetation canopy and specificationof variables that account for the cumulative effects of canopystructural properties at different scales on canopy reflectance.
Understanding the Multiple-Scattering Process Is Critical to QuantifyingCanopy Structure. The study sites represent closed-canopy forestswith relatively high LAI values (11). Our analyses of NDVI values(defined in Table 1) and BRF spectra (SI Text 7) suggest that theimpact of canopy background, be it bare ground or understoryvegetation, on canopy reflectance is negligible. The canopystructure and optical properties of the leaves in the canopy are thedominant factors that determine the spectral BRF. As reported inref. 11 and confirmed in Fig. 1, there is no relationship betweenNIR BRF and proxies of structure such as LAI and canopyheight; i.e., the reflectances are saturated. Is the lack of corre-lation with proxies of structure evidence for a negligible role ofstructure in variations of NIR BRF and consequently a biggerrole of leaf optics on canopy reflectance? As Figs. 1 and 2suggest, structure can affect the magnitude of the saturatedBRF. Here, we identify a structural variable that controls var-iations in BRF under saturation conditions.Solar radiation reflected by a vegetation canopy and measured
by a satellite-borne sensor results from photons that enter thecanopy, interact with the green foliage and nongreen woody ma-terial (branches, trunks, etc.), travel between interactions insidethe vegetation canopy, and finally escape the canopy through gapstoward to the sensor. To simplify the problem at hand, we con-sider green foliage matter in the canopy only. For sufficientlydense vegetation where the impact of canopy background is neg-ligible the photon–canopy interactions, or equivalently the radia-tive transfer process in vegetation canopies, depend on (i) howindividual leaves scatter the radiation, i.e., leaf optics, and (ii) howthe foliage is distributed in the canopy space, i.e., canopy struc-ture. We use the leaf albedo, ωλ, to characterize the scatteringability of the foliage in the canopy. This variable is the fraction ofradiation incident on the leaf that is reflected or transmitted (SIText 3). Scattering from a leaf responds differently at differentwavelengths to changes in leaf properties such as pigment con-centrations, chemical constituents, internal structure, and leafsurface properties. The leaf albedo spectrum therefore is the onlyoptical variable that conveys information about leaf biochemicalconstituents, e.g., nitrogen content.Leaf optical properties, however, cannot be directly measured
from space because the radiation scattered from leaves andexiting the canopy in the direction of the sensor is strongly af-fected by the 3D canopy structure. The canopy structural orga-nization acts as a labyrinth for photons. Photons enter the“labyrinth” and run into leaves. A fraction of these incomingphotons disappears as a result of absorption, whereas the re-mainder are scattered from leaves, i.e., change the direction oftheir travel. The scattered photons in turn can either hit leavesagain or escape the vegetation through gaps between the foliage.The photons wander between interactions throughout the laby-rinth until they either are absorbed or exit the canopy.We use the concept of recollision probability, p, to quantify the
complexity of canopy structural organization. This is the proba-bility that a photon scattered by material in the canopy will in-teract with matter in the canopy again (31, 35, 37, 38). If, forexample, a vegetation canopy can be treated as a “big leaf” (i.e.,no structure, LAI = 1), the recollision probability is zero becausephotons reflected from or transmitted through such a leaf willnot encounter another leaf. If one cuts this big leaf into “smallpieces” and uniformly distributes these pieces in the canopyspace, i.e., a simple structure is introduced with the leaf area
Fig. 3. Relationship between canopy BRF in the NIR spectral band (800–850nm) and canopy foliar %N. The regression line is for the Bartlett Forest plotsshown in Fig. 2; for all sites y = 0.146x + 0.076, R2 = 0.797.
Knyazikhin et al. PNAS Early Edition | 3 of 8
ENVIRONMEN
TAL
SCIENCE
SPN
ASPL
US

unaltered, the recollision probability changes its value from 0 toabout 0.3 (35). The recollision probability depends on canopygeometrical properties at different scales such as the spatialdistribution of trees on the ground, tree crown shape and size,and within-crown foliage arrangement (33–35, 39–42). Thegreater its value is, the higher the likelihood of photon absorp-tion and consequently fewer photons exit the vegetation. For thesame amount of foliage area, for example, the recollision prob-ability for coniferous forests is larger compared with that forbroadleaf species due to the difference in the small-scale struc-tural organization, i.e., coniferous shoot vs. flat leaf, respectively(35). This makes the coniferous forests appear darker in the NIRregion compared with their broadleaf counterparts (32), as dis-cussed above and illustrated in Figs. 1 and 2.The probability that a photon scattered by canopy elements will
not recollide, i.e., exit the canopy through gaps between foliageelements inside the canopy, is 1 − p. Some of these photons willbe registered by the sensor on a satellite viewing the canopy alongthe direction, Ω. Using Stenberg’s (43) definition of a gap—a point on the leaf surface within the canopy that is visible fromoutside the canopy along the direction Ω—a “directional gapdensity,” ρ(Ω), can be defined (SI Text 2). The quantity ρ(Ω)LAIquantifies the fraction of leaf area inside the canopy that is visiblefrom outside the canopy along a given direction. The directionalgap density therefore depends on the leaf area inside the canopyand how these leaves are distributed within the canopy space;i.e., it is a function of the canopy structure.It should be noted that a fraction of photons incident on the
canopy can pass through the vegetation without experiencinga collision and thus do not participate in the radiative transferprocess discussed above. A fraction of intercepted photons, i0,termed the canopy interceptance, initiates the process of photon–canopy interactions. This variable depends on canopy structureand can vary with the solar direction. However, it is close to unityin the case of dense vegetation canopies. The wavelength-de-pendent leaf albedo, ωλ, along with three spectrally invariant(wavelength-independent) quantities—canopy interceptance, rec-ollision probability, and directional gap density—determines theangular patterns of reflected and diffusely transmitted radiationfields (SI Text 2).
The three spectrally invariant parameters can be combinedinto one variable, a directional area scattering factor (DASF),
DASF ¼ ρðΩÞ i01− p
:
This variable is the canopy BRF if the foliage does not absorbradiation (SI Text 2). In this case, photons travel between inter-actions until they exit the canopy. The factor i0/(1 − p) is themean number of interactions before a photon exits the canopy(31, 37, 38). Multiply scattered photons thus densely fill the 3Dcanopy space and consequently sample a significant portion offoliage area. The mean number of interactions therefore pro-vides an estimate of the total area of leaves (SI Text 2). Thus,DASF ∼ ρ(Ω)LAI. It is an estimate of the ratio between the leafarea that forms the canopy boundary as seen along a given di-rection and the total (one-sided) leaf area. Thus, the DASFactually characterizes the texture of the canopy’s “upper bound-ary.” In nonabsorbing canopies, the exitant radiation field isdetermined entirely by the structural construction of the vege-tation canopy.In reality, foliage absorbs solar radiation. Absorption exhibits
a strong spectral dependency. This causes a deviation betweenthe measured BRF and DASF. At weakly absorbing wavelengths,however, the effect of multiple scattering is strong. For example,in the NIR (800–850 nm) spectral band where foliage absorbslittle radiation, a photon can undergo up to 10 interactions be-fore it either is absorbed or exits the canopy (figure 3a in ref. 31).Consequently, incoming photons in this spectral region permeatethe vegetation canopy, from the top to the bottom, and the moreinteractions the photons undergo, the more densely scatteredphotons fill the 3D canopy space. Thus, the upper and lowersides of the leaves are illuminated by multiply scattered photons.This is similar to the radiative transfer in a nonabsorbing canopy.However, the number of photons scattered by leaves is reduceddue to absorption. Scattered photons can be treated as radiationsources on foliage surfaces. The magnitude of these sourcesdepends on the leaf albedo. In weakly absorbing wavelengths, theexitant radiation field becomes dependent on both canopystructure and leaf albedo.
Table 1. Site description
Site Lat, oN Long, oWSolar zenith angleat AVIRIS flight, ° Description
No. 20 × 20-mplots
Mean (SD) over plots
NDVI* %N
Austin Cary MemorialForest†, FL
29.75 82.20 25.89 Planted and natural pine 4 0.72 (0.01) 0.90 (0.05)
Bartlett ExperimentalForest‡, NH
44.05 71.28 33.16 Mixed northern hardwood 13 0.88 (0.03) 1.52 (0.42)
Duke Forest§, NC 35.97 79.09 33.19 Pine, pine–hardwood,upland hardwood, andbottomland hardwood
16 0.88 (0.04) 1.57 (0.40)
Harvard Forest¶, MA 42.54 72.17 35.11 Mixed temperate forest 19 0.89 (0.02) 1.77 (0.29)Howland Forest║, ME 45.20 68.74 35.59 Boreal-northern hardwood
transitional forest18 0.87 (0.01) 1.02 (0.10)
Wind River ExperimentalForest**, WA
45.82 121.95 25.22 Temperate evergreen 15 0.86 (0.03) 1.10 (0.22)
Lat, latitude; long, longitude.*NDVI is defined here as the difference between AVIRIS plot BRFs in the nadir direction at 855 nm and 655 nm normalized by their sum.†http://sfrc.ufl.edu/handbook/acf.html.‡www.fs.fed.us/ne/durham/4155/bartlett.htm.§www.dukeforest.duke.edu/.¶http://harvardforest.fas.harvard.edu/.║http://howlandforest.org/.**www.fs.fed.us/pnw/exforests/wind-river/index.shtml.
4 of 8 | www.pnas.org/cgi/doi/10.1073/pnas.1210196109 Knyazikhin et al.

The recollision probability and DASF can be retrieved fromspectral BRF if leaf albedo at two or more weakly absorbingwavelengths is known (SI Text 2), but such information is notavailable when interpreting satellite data. Therefore, our nextstep is to show that whereas leaf albedo is required to obtain twostructural variables, ρ(Ω)i0 and 1− p, their ratio, which defines theDASF, can be estimated from the BRF spectrum in the 710- to790-nm interval without prior knowledge or ancillary informationregarding leaf scattering properties. To understand this, we beginwith an analysis of how radiation interacts with individual leaves.
Spectral BRF in the Interval Between 710 and 790 nm Is Required toDerive DASF and Remove the Effect of Canopy Structure. Radiationscattered by a green leaf includes information from two dissim-ilar sources—the surface and the interior of the leaf (SI Text 3).In the PAR, the amount of radiation exiting from the leaf in-terior is mainly governed by the photosynthetically active pig-ments and decreases with their increasing concentrations. In theNIR, where such pigments do not absorb and there is no sig-nificant absorption by water, the main factors determining scat-tering from the leaf interior are its anatomical structure and theamount of dry matter. The latter exhibits a weak but significantabsorption (44). The leaf cuticle acts as a “barrier” for photonsto enter the mesophyll and be absorbed, thus tending to increasethe leaf albedo. The fraction of radiation incident on leaf surfacethat does not penetrate the leaf is determined by leaf surfaceproperties. This fraction of reflected radiation is largely wave-length independent and varies with the direction of incidentradiation (22, 23, 25, 28).In the interval between 710 nm and 800 nm, the spectral be-
havior of the radiation scattered from the leaf interior is mainlydetermined by the absorption spectra of chlorophyll and drymatter (Fig. 4). The chlorophyll absorption spectrum declinesrapidly with wavelength and vanishes at about 770 nm. Thisgenerates a sharp jump in the spectrum of leaf albedo from itsminimum to a plateau around 800 nm. The magnitude of thisplateau is controlled by the amount of dry matter and mesophyllstructure. The dry matter exhibits little absorption and its spec-trum is flat in this spectral range. In this spectral interval, leafscattering is strong enough to trigger the multiple-scatteringprocess that has significant impact on canopy reflectance.Empirical (33, 46) and theoretical (39) analyses show that the
spectral distribution of radiation reflected from the leaf interior inthe interval between 710 nm and 790 nm is related to a known
intrinsic leaf scattering spectrum and the wavelength-independentwithin-leaf recollision probability. This is similar to how the can-opy reflectance is related to the recollision probability and leafalbedo (SI Text 4). This intrinsic leaf reference spectrum is mainlydetermined by the absorption spectra of chlorophyll and drymatter (Fig. 4), whereas the within-leaf recollision probability is afunction of their concentrations and mesophyll structure. Tech-nically, it means that the BRF in the 710- to 790-nm spectral in-terval can be expressed in terms of either actual leaf albedo andspectral invariants—the recollision probability and directionalgap density—or the known reference spectrum and the spectralinvariants transformed to new values, which become dependenton canopy structure, leaf surface properties, mesophyll struc-ture, and amount of chlorophyll and dry matter (SI Text 5). It wasfound (33), however, that the ratio, ρ(Ω)/(1 − p), is independentof the leaf spectrum used to express the BRF (SI Text 5). Thisproperty underlies a simple algorithm for retrieving the DASFfrom the BRF spectrum in the 710- to 790-nm spectral interval,which does not rely on information about leaf scattering prop-erties. It was used to generate DASF values from NationalAeronautics and Space Administration (NASA)’s AirborneVisible/Infrared Imaging Spectrometer (AVIRIS) data acrossall study areas. Technical details are given in SI Text 5 and Fig.S1A. Note that this technique results in the sensitivity of theDASF to leaf surface properties (SI Text 5).Fig. 5 shows a strong positive correlation between the DASF
in the zenith direction and BfLAI. In this example, the nadir-viewing AVIRIS sensor can see about 25% of the foliage area ofconifer forests. This is due to dense packing of needles in shoots.In a broadleaf forest, the flat leaves allow the sensor to see up to50% of its leaf area. These differences can be attributed also tothe topology of the upper surface of the canopy (33). Accordingto common assumptions, broadleaf trees have spherical- to el-lipsoidal-shaped crowns whereas the needle species are ellip-soidal to conical in shape. In broadleaf forests, the crowns forma fairly smooth or continuous canopy upper surface. This featurelowers the likelihood of photons escaping the canopy throughgaps in oblique (i.e., off-zenith) directions. Gaps, as seen upwardfrom leaf surfaces, are more likely to be concentrated around thevertical direction. In needle-leaf forests, the upper canopy
Fig. 4. Absorption spectra of chlorophyll ab (in cm2/mg), dry matter (in cm2/dg), and water (in cm−1) (vertical axis on the left side) and spectrum of leafalbedo (vertical axis on the right side) from the PROSPECT-5 model (45). Inthese units values of typical concentrations of these absorbing pigments areon the order of 0.05. Impact of water absorption can be neglected.
Fig. 5. Correlation between the directional area scattering factor (DASF) inthe zenith direction and broadleaf fraction of leaf area. The regression line isfor the Bartlett Forest for which BfLAI values were obtained from in situspecies fractions of the canopy leaf dry mass. Values of the BfLAI for othersites were obtained by converting %BN data (SI Text 1). The regression linefor all plots is y = 0.231x + 0.239, R2 = 0.835.
Knyazikhin et al. PNAS Early Edition | 5 of 8
ENVIRONMEN
TAL
SCIENCE
SPN
ASPL
US

exhibits high heterogeneity because of pointed tree crowns (47).This increases the probability of seeing a gap from foliage sur-faces in off-zenith directions and distributes the gaps overa wider range of directions, thus lowering the gaps in any par-ticular direction. Thus, the compositional mix of needle- andbroadleaf species in a canopy determines a positive tendency inthe near-zenith DASF from pure needle- to pure broadleafforests. A detailed analysis of its sensitivity to conical- and el-lipsoidal-shaped trees can be found in ref. 33, figure 8.Fig. 6 shows that BRF in the NIR spectral band (800–850 nm)
is almost proportional to the DASF, a parameter that describesreflectance of nonabsorbing canopies. As discussed earlier, this isthe effect of multiple scattering at weakly absorbing wavelengths,which makes the canopy radiative regime very similar to that ofthe nonabsorbing canopy. Note that the canopy radiative regimesdiffer significantly between strongly absorbing, e.g., PAR region,and weakly absorbing wavelengths. This can result in weak or nocorrelation between BRF and DASF at absorbing wavelengths.The deviation of canopy BRF from its nonabsorbing counterpartDASF must, however, be due to leaf absorption. Recall that onlyphotons that enter the leaf interior can be absorbed, and thefraction of those photons is determined by leaf surface proper-ties. Therefore, the difference between wavelength-independentDASF and BRF spectra is a function of leaf interior and leafsurface properties. Thus, the DASF provides critical informationto remove the effect of canopy structure on the relationshipbetween hyperspectral canopy reflectance and leaf properties.Fig. 6 also demonstrates that the canopy structure is the domi-nant factor responsible for variation in NIR BRF under thesaturation conditions. This extends the empirical result fromdata collected at the Bartlett site, which documents the impor-tance of canopy structure, to all study areas. Consequently,without knowledge of canopy structure, NIR and/or SW broad-band satellite data cannot be directly linked to leaf-level pro-cesses and therefore used to monitor foliar nitrogen from space.
Spectral Reflectance Corrected for Forest Structure Effect IsNegatively Related to %N. We use the BRF to DASF ratio tosuppress the sensitivity of BRF to canopy structure. This ratio isan estimate of a well-defined physical quantity called the can-opy scattering coefficient, Wλ (SI Text 6), i.e., the fraction of
intercepted radiation that has been reflected from, or diffu-sively transmitted through, the vegetation (35, 39, 48). Thecanopy scattering coefficient is a function of leaf interior andsurface properties.As Fig. 7A illustrates, the scattering coefficient mimics the
shape and magnitude of typical leaf albedo spectra documentedin the literature (49). It decreases with increasing canopy foliar%N. Unlike BRF that exhibits either positive (Fig. 3) or no re-lation (SI Text 6 and Fig. S2) with nitrogen in the PAR and NIRregions, the scattering coefficient is negatively correlated withfoliar %N at all wavelengths in the interval between 423 and 855nm; i.e., the higher the foliar nitrogen concentration is, the morethe foliage absorbs. This is illustrated in Fig. 7B, which shows theR2 coefficient of Wλ vs. %N negative correlation as a function ofwavelength. Notably, the R2 mirrors the chlorophyll absorptionspectrum. This can be interpreted as follows. When leaf ab-sorption is high, the diffuse component of the leaf albedodecreases, and consequently the surface scattering dominates (SIText 3 and Eq. S3.2). Conversely, when leaf absorption is low, thesurface contribution is reduced compared with the diffuse com-ponent. In Fig. 7B we see that the principal foliage pigmentsabsorb in the same region, in the vicinity of 445 nm (50). Thisresults in a negligible contribution from the diffuse componentof the leaf albedo, thus making the leaf albedo, and consequentlyWλ, more sensitive to foliage surface properties rather than itsinterior (SI Text 3). The opposite is seen where absorptionspectra of the principal pigments, except chlorophyll, declinerapidly and vanish before the green spectral region (555 nm). Anincrease in chlorophyll absorption near the red spectral region(645 nm), followed by a sharp decrease beyond, is accompaniedby the respective increase and decrease of the contribution ofsurface reflected radiation to the leaf albedo and consequentlyits sensitivity to the leaf interior. This behavior is consistentwith observed patterns of leaf scattering; that is, the contribu-tion of the leaf surface reflected radiation to the leaf albedo issmall when its diffuse component is large, as in the NIR region,and is large when the diffuse component is small, as in thepigment-absorbing blue and red spectral bands (23, 26, 28).This result suggests that leaf surface properties have an impacton canopy BRF.
ConclusionsThe previously reported positive correlation between forestcanopy reflectance and foliar %N (11) is a counterintuitive ex-ample of the physics of radiative transfer in a medium—an in-crease in the amount of absorbing foliar constituents enhancesabsorption and correspondingly decreases canopy reflectance.This physical argument suggests that other factors, i.e., canopystructure, which suppress not only the absorption effect, becomedominant determinants of the system’s behavior. Our analysesreinforce this physically based deduction: The distribution ofgaps through which photons escape the canopy is the dominantmechanism that generates a positive correlation between ob-served NIR canopy reflectance and %N. The distribution of gapscan be characterized by the DASF, which is an estimate of theratio of the leaf area that forms the canopy upper boundary, asseen along a given direction, to the total leaf area. The DASF“distils” the positive relationship between reflectance and %N(Fig. 6), and the residual information in the reflectance that isnot due to this structural variable is negatively related to foliarnitrogen in the PAR and NIR spectral regions (Fig. 7). Thisfinding suggests that the observed NIR BRF vs. %N positivecorrelation conveys no information about %N. Thus, to infer leafbiochemical constituents, e.g., N content, from remotely senseddata, the DASF provides critical information for correction ofcanopy structural influences. For vegetation canopies with a darkbackground, or sufficiently dense vegetation where the impact ofcanopy background is negligible, the DASF can be directly re-
Fig. 6. Relationship between canopy BRF in NIR spectral band (800–850 nm)and directional area scattering factor (DASF) in the zenith direction for 129plots across our study area. The DASF is a key structural parameter re-sponsible for variation in NIR BRF.
6 of 8 | www.pnas.org/cgi/doi/10.1073/pnas.1210196109 Knyazikhin et al.

trieved from the BRF spectrum in the 710- to 790-nm interval,without involving canopy reflectance models, prior knowledge,or ancillary information regarding leaf scattering properties.In addition, characteristics of the leaf surface are also important
to remote sensing of foliage pigments. Radiation reflected fromleaf surfaces does not penetrate the leaf and therefore conveysno information about its interior. Radiation reflected by the leafsurface can vary greatly between species (23, 29). The canopyreflectance therefore becomes sensitive to both species-specificcanopy architecture and leaf surface features. This furtherdecreases the ability to remotely sense canopy foliar nitrogencontent from hyperspectral data. Reflectance measurementsalone cannot distinguish radiation scattered from leaf surfaceand interior tissue (24). Polarization measurements may beuseful to correct for this additional source of uncertainty be-cause radiation reflected from the leaf surface is partly polarizedwhereas that from the leaf interior is not.Hyperspectral remote sensing of leaf biochemical constituents
relies on the fact that scattering from a leaf responds differentlyat different wavelengths to changes in leaf properties such aspigment concentrations, other chemical constituents, internalstructures, and leaf surface characteristics. Three-dimensionalradiative transfer theory provides the most physically consistentlinkage between leaf scattering and canopy reflectance. Mostof the existing approaches to interpret reflectance spectra,however, neglect this fundamental linkage. This can lead tomisinterpretation of satellite data. Three-dimensional radia-tive transfer should therefore be an integral part of hyperspectralremote sensing to ensure success of hyperspectral missions, e.g.,the planned NASA Hyperspectral Infrared Imager (51) missionrecommended for implementation by the US National ResearchCouncil (52).
Materials and MethodsField Data. This research is focused on six sites located in the eastern UnitedStates and Washington State (Table 1). The sites represent closed-canopyforests and are characterized by a strong gradient in the proportion ofneedle- and broadleaf species. Their detailed description can be found in ref.12. Data used in our research were sampled between 2001 and 2006 duringthe peak growing season on 85 plots across the six research sites (Table 1)according to a protocol documented in refs. 11, 12, and 53. At each 20 × 20-mplot green leaves were sampled from several heights in the canopy andtheir mass-based foliar nitrogen concentration (in grams per 100 g of dryfoliage mass) and dry mass per foliage area (in g·m−2) were measured underlaboratory conditions. Foliage area was defined as one-sided leaf area fordeciduous species and as the projected needle area for conifers (11, 12, 53).Foliar biomass distribution by species was determined using an opticalcamera point-quadrat method combined with leaf mass per area meas-urements (53). Plot level foliar %N is calculated as the mean of foliar Nconcentration among all species, weighted by species canopy foliar massfraction (11, 12). The accuracy of the methodology was assessed with data
collected at the Bartlett Experimental Forest. The estimated foliar mass-based nitrogen concentrations compared well with values derived fromlitter-fall collection (11, 12, 53). A detailed description of the approach andits validation can be found in refs. 12 and 53.
Species Composition and %N. In our analysis we stratified trees into needle-and broadleaf species. An equation for plot-level foliar %N takes the form
%N ¼ %nLBfMþ%nNð1−BfMÞ ¼ %nN þ ð%nL −%nNÞBfM;
where %nN and %nL represent the mass-based nitrogen concentration of anaverage needle and leaf, respectively, and BfM is the broadleaf fraction ofthe canopy leaf dry mass (in g/g). This variable can be expressed as
BfM ¼ mL BfLAImL BfLAIþmN ð1−BfLAIÞ ¼
θ BfLAI1− ð1− θÞ BfLAI:
Here mL and mN are the dry mass per foliage area of an average leaf andneedle (in g·m−2), θ = mL/mN, and BfLAI is the broadleaf fraction of leaf area.Note that the BfM is an increasing function of BfLAI. The ratio θ determinesits convexity. For the Bartlett Forest, %nL = 2.17 (SD = 0.4), mL = 66.3 (SD =14.2), %nN = 1.24 (SD = 0.26), mN = 224.2 (SD = 67.8), and θ = 0.30. Theseestimates are based on data reported in ref. 53. A solid line in Fig. 2 showsplot-level %N as a function of BfLAI.
Data available to this research included the canopy foliar %N (all sites) andits portions, %BN, from broadleaf species (all sites except Wind River Ex-perimental Forest); i.e., %BN = %nL·BfM. For the Bartlett Forest, distributionof the species canopy foliar dry mass fraction for 14 plots was also available.These data and species leaf mass per area (53) were used to obtain BfM andBfLAI for 13 plots in the Bartlett Forest for which AVIRIS BRF data (nextsection) were available. A Tikhonov regularization technique (54) is used toreconstruct field BfLAI from %BN data for the remaining sites (SI Text 1). LAIdata collected in August of 2002, at 25 m resolution as part of the BigfootMODIS validation campaign, were used for the Harvard Forest (55). LAIvalues of all sites except Austin Cary Memorial Forest (LAI = 2.9) exceeded4.5 (11).
Airborne Data. Hyperspectral data were acquired by NASA’s AVIRIS in May–June 2002 and August 2003. AVIRIS is a nadir-viewing sensor that registersradiance in 224 spectral bands, from 400 to 2,500 nm, with a 10-nm nominalbandwidth (56). Data spatial resolution is ∼17 m. A standard processingsystem (12) is used to obtain atmospherically corrected BRF. We excludednoisy data below 423 nm and used data from the 423- to 855-nm spectralregion. The AVIRIS includes four sensors, two of which overlap at ∼655 nm.Duplicate bands at 655.09, 664.79, and 675.78 nm were not used. MeanAVIRIS BRF over [800, 850 nm] weighted by a normalized solar radiancespectrum is taken as NIR BRF (11).
To account for geolocation uncertainties, we calculated themean BRFs andtheir SDs over a 3 × 3 pixel patch (51 × 51 m) centered on plot locations. Weused the mean spectral BRF to characterize the reflectance of a plot. Themost probable value of the coefficient of variation (SD-to-mean ratio) wastaken as the relative precision of the observations. Its value was specifiedfrom the histogram of the coefficient over all plots and wavelengthsbetween 440 nm and 1,000 nm. The histogram has a sharp peak at 4.8%
Fig. 7. (A) Canopy scattering coefficient Wλ as a function of wavelength for three plots at the Bartlett Forest representing broadleaf (%N = 1.91), mixed (%N =1.45), and needle leaf (%N = 1.22) forests. (B) Spectral variation in the R2 coefficient of Wλ vs. %N negative correlation (solid line) and absorption coefficient ofchlorophyll (dotted line). The absorption spectrum at 1 nm spectral resolution from the PROSPECT-5 model (45) is normalized to match the maximum R2 value.
Knyazikhin et al. PNAS Early Edition | 7 of 8
ENVIRONMEN
TAL
SCIENCE
SPN
ASPL
US

(SD = 2.1%); 78% of the values are around the peak and below 10%. Therelative precision of AVIRIS BRFs is set to 4.8%.
Airborne Laser Vegetation Imaging Sensor (LVIS) datawere acquired in thesummer of 2003 over Howland, Harvard, and Bartlett Forests (57). We use theLVIS H100 product as the height measure. Point data collected from theH100 height measures are sampled into a raster grid dataset at a 28-mnominal resolution, using a window average scheme (42). The Bigfoot LAIdata and LVIS H100 height are used to generate Fig. 1.
Accuracy Metrics. We used the relative root mean square error (RRMSE) toquantify the proximity between observed, X, and estimated, Y, vectors; i.e.,
RRMSEðX;YÞ ¼ 1M
∑M
λ¼1
ðXλ −YλÞ2Y2λ
!1=2:
Here Xλ and Yλ represent components of X and Y. A value of RRMSE belowthe relative precision indicates a good accuracy.
ACKNOWLEDGMENTS. We thank Dr. S. V. Ollinger and L. Lepine forproviding data on canopy foliar mass-based nitrogen concentration anddistribution of the species canopy foliar dry mass fraction published in ref.11. This research was funded by the National Aeronautics and Space Admin-istration Earth Science Division.
1. Heimann M, Reichstein M (2008) Terrestrial ecosystem carbon dynamics and climatefeedbacks. Nature 451(7176):289–292.
2. LeBauer DS, Treseder KK (2008) Nitrogen limitation of net primary productivity interrestrial ecosystems is globally distributed. Ecology 89(2):371–379.
3. Magnani F, et al. (2007) The human footprint in the carbon cycle of temperate andboreal forests. Nature 447(7146):848–850.
4. Oren R, et al. (2001) Soil fertility limits carbon sequestration by forest ecosystems ina CO2-enriched atmosphere. Nature 411(6836):469–472.
5. Reich PB, et al. (1999) Generality of leaf trait relationships: A test across six biomes.Ecology 80(6):1955–1969.
6. Wright IJ, et al. (2004) The worldwide leaf economics spectrum. Nature 428(6985):821–827.
7. Ross J (1981) The Radiation Regime and Architecture of Plant Stands (Dr. W. Junk, TheHague).
8. Diner DJ, et al. (1999) New directions in earth observing: Scientific applications ofmultiangle remote sensing. Bull Am Meteorol Soc 80(11):2209–2228.
9. Justice CO, et al. (1998) The Moderate Resolution Imaging Spectroradiometer (MODIS):Land remote sensing for global change research. Ieee T Geosci Remote 36(4):1228–1249.
10. Deschamps PY, et al. (1994) The Polder mission - instrument characteristics andscientific objectives. Ieee T Geosci Remote 32(3):598–615.
11. Ollinger SV, et al. (2008) Canopy nitrogen, carbon assimilation, and albedo intemperate and boreal forests: Functional relations and potential climate feedbacks.Proc Natl Acad Sci USA 105(49):19336–19341.
12. Martin ME, Plourde LC, Ollinger SV, Smith ML, McNeil BE (2008) A generalizablemethod for remote sensing of canopy nitrogen across a wide range of forestecosystems. Remote Sens Environ 112(9):3511–3519.
13. Smith ML, Martin ME, Plourde L, Ollinger SV (2003) Analysis of hyperspectral data forestimation of temperate forest canopy nitrogen concentration: Comparison betweenan airborne (AVIRIS) and a spaceborne (Hyperion) sensor. IEEE T Geosci Remote 41(6):1332–1337.
14. Hollinger DY, et al. (2010) Albedo estimates for land surfacemodels and support for a newparadigm based on foliage nitrogen concentration. Glob Change Biol 16(2):696–710.
15. Bartlett MK, Ollinger SV, Hollinger DY, Wicklein HF, Richardson AD (2011) Canopy-scale relationships between foliar nitrogen and albedo are not observed in leafreflectance and transmittance within temperate deciduous tree species. Botany 89(7):491–497.
16. Myneni RB, et al. (2002) Global products of vegetation leaf area and fractionabsorbed PAR from year one of MODIS data. Remote Sens Environ 83(1–2):214–231.
17. Knyazikhin Y, et al. (1998) Estimation of vegetation canopy leaf area index andfraction of absorbed photosynthetically active radiation from atmosphere-correctedMISR data. J Geophys Res-Atmos 103(D24):32239–32256.
18. Huang D, et al. (2008) Stochastic transport theory for investigating the three-dimensional canopy structure from space measurements. Remote Sens Environ 112(1):35–50.
19. Rautiainen M, Stenberg P, Nilson T, Kuusk A (2004) The effect of crown shape on thereflectance of coniferous stands. Remote Sens Environ 89(1):41–52.
20. Samanta A, et al. (2012) Seasonal changes in leaf area of Amazon forests from leafflushing and abscission. J Geophys Res 117(G1):G01015.
21. Ollinger SV (2011) Sources of variability in canopy reflectance and the convergentproperties of plants. New Phytol 189(2):375–394.
22. Vanderbilt VC, Grant L, Ustin SL (1991) Polarization of light by vegetation. Photon-Vegetation Interactions: Applications in Plant Physiology and Optical RemoteSensing, eds Myneni RB, Ross J (Springer, Berlin), pp 191–228.
23. Grant L (1987) Diffuse and specular characteristics of leaf reflectance. Remote SensEnviron 22(2):309–322.
24. Grant L, Daughtry CST, Vanderbilt VC (1987) Variations in the polarized leafreflectance of Sorghum bicolor. Remote Sens Environ 21(3):333–339.
25. Bousquet L, Lacherade S, Jacquemoud S, Moya I (2005) Leaf BRDF measurements andmodel for specular and diffuse components differentiation. Remote Sens Environ98(2–3):201–211.
26. Combes D, et al. (2007) A new spectrogoniophotometer to measure leaf spectral anddirectional optical properties. Remote Sens Environ 109(1):107–117.
27. Comar A, Baret F, Viénot F, Yan L, de Solan B (2012) Wheat leaf bidirectionalreflectance measurements: Description and quantification of the volume, specularand hot-spot scattering features. Remote Sens Environ 121(0):26–35.
28. Grant L, Daughtry CST, Vanderbilt VC (1993) Polarized and specular reflectancevariation with leaf surface features. Physiol Plant 88(1):1–9.
29. McClendon JH (1984) The micro-optics of leaves.1. Patterns of reflection from theepidermis. Am J Bot 71(10):1391–1397.
30. Zarco-Tejada PJ, et al. (2004) Needle chlorophyll content estimation through modelinversion using hyperspectral data from boreal conifer forest canopies. Remote SensEnviron 89(2):189–199.
31. Huang D, et al. (2007) Canopy spectral invariants for remote sensing and modelapplications. Remote Sens Environ 106(1):106–122.
32. Rautiainen M, Stenberg P (2005) Application of photon recollision probability inconiferous canopy reflectance simulations. Remote Sens Environ 96(1):98–107.
33. Schull MA, et al. (2011) Canopy spectral invariants, Part 2: Application to classification offorest types from hyperspectral data. J Quant Spectrosc Radiat Transf 112(4):736–750.
34. Smolander S, Stenberg P (2003) A method to account for shoot scale clumping inconiferous canopy reflectance models. Remote Sens Environ 88(4):363–373.
35. Smolander S, Stenberg P (2005) Simple parameterizations of the radiation budget ofuniform broadleaved and coniferous canopies. Remote Sens Environ 94(3):355–363.
36. Rautiainen M, et al. (2012) A note on upscaling coniferous needle spectra to shootspectral albedo. Remote Sens Environ 117(0):469–474.
37. Knyazikhin Y, Schull MA, Xu L, Myneni RB, Samanta A (2011) Canopy spectralinvariants. Part 1: A new concept in remote sensing of vegetation. J Quant SpectroscRadiat Transf 112(4):727–735.
38. Knyazikhin Y, Marshak A, Myneni RB (2005) Three-dimensional radiative transfer invegetation canopies and cloud-vegetation interaction. Three Dimensional RadiativeTransfer in theCloudyAtmosphere, edsMarshakA,DavisAB (Springer, Berlin), pp617–652.
39. Lewis P, Disney M (2007) Spectral invariants and scattering across multiple scales fromwithin-leaf to canopy. Remote Sens Environ 109(2):196–206.
40. Rautiainen M, Mottus M, Stenberg P (2009) On the relationship of canopy LAI andphoton recollision probability in boreal forests. Remote Sens Environ 113(2):458–461.
41. Mõttus M, Stenberg P, Rautiainen M (2007) Photon recollision probability inheterogeneous forest canopies: Compatibility with a hybrid GO model. J GeophysRes-Atmos 112(D3):D03104.
42. Schull MA, et al. (2007) Physical interpretation of the correlation between multi-anglespectral data and canopy height. Geophys Res Lett 34(18):L18405.
43. Stenberg P (2007) Simple analytical formula for calculating average photon recollisionprobability in vegetation canopies. Remote Sens Environ 109(2):221–224.
44. Fourty T, Baret F, Jacquemoud S, Schmuck G, Verdebout J (1996) Leaf opticalproperties with explicit description of its biochemical composition: Direct and inverseproblems. Remote Sens Environ 56(2):104–117.
45. Féret JB, et al. (2008) PROSPECT-4 and 5: Advances in the leaf optical properties modelseparating photosynthetic pigments. Remote Sens Environ 112(6):3030–3043.
46. Latorre Carmona P, Schull M, Knyazikhin Y, Pla F (2010) The application of spectralinvariants for discrimination of crops using CHRIS-PROBA data. Hyperspectral Imageand Signal Processing: Evolution in Remote Sensing (WHISPERS), 2010 2nd Workshop,eds Benediktsson JA, Chanussot J, Waske B (Institute of Electrical and ElectronicEngineers, Piscataway, NJ), pp 1–4.
47. Rautiainen M, Mottus M, Stenberg P, Ervasti S (2008) Crown envelope shapemeasurements and models. Silva Fenn 42(1):19–33.
48. Marshak A, Knyazikhin Y, Chiu JC, Wiscombe WJ (2011) Spectrally invariantapproximation within atmospheric radiative transfer. J Atmos Sci 68(12):3094–3111.
49. Walter-Shea EA, Norman JM (1991) Leaf optical properties. Photon-VegetationInteractions: Applications in Plant Physiology and Optical Remote Sensing, edsMyneni RB, Ross J (Springer, Berlin), pp 229–252.
50. Gates DM, Keegan HJ, Schleter JC, Weidner VR (1965) Spectral properties of plants.Appl Opt 4(1):11–20.
51. Jet Propulsion Laboratory (2008) HyspIRI Whitepaper and workshop report. JPLPublication 2009:09-19.
52. National Research Council (2007) Earth Science and Applications from Space: NationalImperatives for the Next Decade and Beyond. Committee on Earth Science and Ap-plications from Space: A Community Assessment and Strategy for the Future (Na-tional Academy Press, Washington, DC).
53. Smith M-L, Martin ME (2001) A plot-based method for rapid estimation of forestcanopy chemistry. Can J For Res 31(3):549–555.
54. Tikhonov AN, Goncharsky AV, Stepanov VV, Yagola AG (1995) Numerical Methods forSolving Ill-Posed Problems, trans Hoksbergen RAM (Kluwer, Boston).
55. Cohen WB, Maiersperger TK, Pflugmacher D (2006) BigFoot Leaf Area Index Surfacesfor North and South American Sites, 2000-2003. Data set (Oak Ridge NationalLaboratory Distributed Active Archive Center, Oak Ridge, TN). Available at www.daac.ornl.gov. Accessed June 7, 2010.
56. Airborne Visible/Infrared Imaging Spectrometer (AVIRIS) Homepage (2009) Availableat http://aviris.jpl.nasa.gov. Accessed Oct. 28, 2009.
57. Laser Vegetation Imaging Sensor (LVIS) Homepage (2006) Available at http://lvis.gsfc.nasa.gov/index.php. Accessed Aug. 15, 2006.
8 of 8 | www.pnas.org/cgi/doi/10.1073/pnas.1210196109 Knyazikhin et al.

Supporting InformationKnyazikhin et al. 10.1073/pnas.1210196109SI Text 1. Comments on Equations for NitrogenConcentration and Broadleaf Fraction of Leaf Dry MassBroadleaf fraction of leaf dry mass (BfM) data can be accu-rately approximated by the equation for BfM (Materials andMethods) with θ = 0.30. Approximated vs. measured BfMvalues on the 1:1 plane are related as y = 0.98x − 0.01 withR2 = 0.99 and relative root mean square error (RRMSE) =18%. The estimates are for the Bartlett Experimental Forestfor which in situ canopy foliar dry mass fractions by specieswere available.Values of %nN and %nL were specified by fitting the equa-
tion for nitrogen concentration (%N) (Materials and Methods)and %N data, using a Tikhonov regularization technique (1):
αkn− n0k2þkAðn− n0Þ þ ðAn0 −NÞk2 →min:
Here α is a regularization parameter accounting for errors inthe equation for %N and data; n and n0 are vectors represent-ing unknown %nN, %nL and their mean values over the BartlettForest (Materials and Methods); A is an N × 2 matrix with rows(1 − BfM) and BfM; and vector N contains measured %N.α = −1.13 provides best agreement between measured andsimulated %N, resulting in %nL = 2.33 and %nN = 1.03.Values of %N approximated with the equation for %N vs.in situ %N on the 1:1 plane are related as y = 0.997x +0.001 with R2 = 0.89 and RRMSE = 10%. The retrieved %nLequation for BfM and %BN = %nL· BfM data were used toestimate broadleaf function of leaf area (BfLAI) for the re-maining sites.
SI Text 2. Canopy Bidirectional Reflectance Factor andDirectional Area Scattering FactorIf the impact of canopy background on canopy reflectance isnegligible, the spectral bidirectional reflectance factor (BRF)can be approximated in terms of the leaf albedo, ωλ, inter-ceptance, i0, directional gap density, ρ(Ω), and recollisionprobability, p, as (2, 3)
BRFλðΩÞ ¼ ρðΩÞi01−ωλp
ωλ: [S2.1]
Note that we suppress the dependency of the BRF on the di-rection of incident beam in our notations. Accuracy of thisequation is discussed in SI Text 7. This spectrally invariantrelationship is also applicable to the bidirectional transmit-tance factor (BTF) formulated for radiation diffusely transmit-ted through the vegetation, that is, radiance of diffuselytransmitted radiation normalized by F/π, where F is the inci-dent irradiance. A detailed analysis of the spectrally invariantrelationships can be found in ref. 3. Their validity for cloudyatmospheres is discussed in ref. 4.In a nonabsorbing canopy (ωλ ≡ 1), the angular variation of
BRF(Ω) and BTF(Ω) takes the form ρ(Ω)i0/(1 − p). The BRFcoincides with the directional area scattering factor (DASF). Innonabsorbing vegetation all intercepted photons will exit thecanopy via either the upper or the lower boundary. Hemi-spherical integrations of the BRF and BTF over up- (2π+) anddownward (2π−) directions, respectively, should therefore resultin the canopy interceptance i0; i.e.,
1π
Z2πþ
BRFðΩÞjμjdΩþ 1π
Z2π−
BTFðΩÞjμjdΩ
¼ 1π
i01− p
Z4π
ρðΩÞjμjdΩ ¼ i0: [S2.2]
Here μ is the cosine of the polar angle of Ω and 4π denotes theunit sphere. Thus, the directional gap density, ρ(Ω), and therecollision probability, p, are related as
1π
Z4π
ρðΩÞjμjdΩ ¼ 1− p: [S2.3]
The quantity ρ(Ω)/(1 − p) defines the average directional es-cape probability density; i.e., π−1ρ(Ω)jμjdΩ/(1 − p) is the prob-ability that a photon scattered by a leaf surface element in thecanopy will escape the canopy through a gap in the direction Ωabout solid angle Ω. Here we adapted Stenberg’s (5) definitionof a gap, which is a free line of sight through the canopy froma point on the foliage surface element ds in the direction Ω. Thedirectional gap density specifies the leaf area covered by suchlines per unit total leaf area per unit solid angle. Note that herewe apply a standard normalization used in remote sensing tomake angular-dependent variables dimensionless.The term i0/(1 − p) is the mean number of interactions with
nonabsorbing foliage that a photon undergoes before exiting thevegetation canopy (2, 3). An intuitive understanding of how themean number of interactions is related to the foliage area followsfrom results (5) on the physics of relationships between inter-ceptance, i0, recollision probability, p, and leaf area index (LAI)for simple canopies illuminated by a diffuse radiation field. Inthis case i0 gives the probability that photons entering the veg-etation through gaps will be intercepted by the foliage. Thisquantity can also be evaluated as the probability that photonsfrom isotropic sources distributed uniformly over the total fo-liage surface areas will escape the vegetation canopy. Thus, i0 =LAI(1 − p) (5). It follows from this relationship that i0/(1 − p) =i0 + pi0 + p2i0 + . . . = LAI; thus the mean number of inter-actions with nonabsorbing foliage can be interpreted as the fo-liage area per unit ground area that an average photon trajectoryaccumulates over successive orders of scattering (the increasingpowers of p representing each successive scattering order).Theoretical understanding of such a relationship in the general
case follows from the expansion of the solution of the radiativetransfer equation in the successive orders of scattering, orNeumann series (3). In a nonabsorbing canopy the contributionfrom high-order scattered photons to radiation reflected by thevegetation strongly dominates that from photons having un-dergone few interactions. High-order scattered photons canaccurately be approximated by a positive eigenvector and cor-responding positive eigenvalue of the radiative transfer equation(2, 3). The eigenvalue coincides with the recollision probability.This property allows us to approximate the Neumann series bya geometrical progression (3) to which the above argument re-garding the average photon trajectory is applicable. It should benoted the Neumann series is sensitive to low-order scatteringterms. Their impact on the solution of the radiative transferequation depends on variation in the recollision probability withthe scattering order: The smaller the variation in p with scatteringorder is, the larger the range of foliage area that is sampled and
Knyazikhin et al. www.pnas.org/cgi/content/short/1210196109 1 of 5

consequently the more accurate the relationship between themean number of interactions and LAI. Model calculations suggestthat the recollision probability increases with scattering order andreaches a plateau after one to two scattering events for LAI up to10 (3). The monodirectional (nondiffuse) illumination condition isanother factor that can impact the accuracy of the relationshipbetween the mean number of interactions and leaf area. Theo-retical estimates of the convergence of the recollision probabilityand the directional gap density with the scattering order aredocumented in ref. 3. Techniques for estimating various meanquantities by averaging photon trajectories can be found in ref. 6.It follows from Eq. S2.1 that the recollision probability, p, and
ρ(Ω)i0 can be obtained from spectral BRF if leaf albedo at two ormore wavelengths is known, but such information is not availablewhen interpreting satellite data. An analysis of how radiationinteracts with individual leaves is needed to understand the ap-plicability range of the spectral invariant approach.
SI Text 3. Leaf AlbedoThe fraction of radiation, ωλ, reflected or transmitted by a leaf/needle surface element (leaf albedo) results from photon inter-actions with leaf surface and its interior,
ωλ ¼ iLϖλ þ sL: [S3.1]
Here iL is the leaf interceptance defined as the fraction of radi-ation incident on the leaf that enters the leaf interior. The frac-tion of surface reflected radiation, sL = 1 − iL, is assumed to bea wavelength-independent function of leaf surface propertiesand varies with the direction of incident radiation. The trans-formed leaf albedo, ϖλ, is defined as the fraction of radiationscattered from the leaf interior given that it interacts with in-ternal leaf constituents (7). This variable is assumed to be in-dependent of leaf surface properties and varies with leafanatomical structure and leaf absorbing constituents.Consider two different leaves, e.g., hazelnut leaf and coniferous
needle. The difference, Δωλ ¼ ω1λ −ω2λ between their albedospectra is
Δωλ ¼ − a2λi1L
�ΔiLi1L
þ Δaλa2λ
�: [S3.2]
Here aλ = 1 − ϖλ is the leaf absorptance, i.e., the probability thata photon will be absorbed by a leaf given that it interacts withinternal leaf constituents. Thus, the variation, Δωλ, in leaf scat-tered radiation is due to differences in leaf surface properties,ΔiL = i1L − i2L, and leaf interior, Δaλ ¼ − ðϖ1λ −ϖ2λÞ = −Δϖλ.The former can vary greatly between species (8), whereasthe latter is independent of leaf surface characteristics and isa function of the leaf interior tissue only. At wavelengths whereΔaλ/a2λ ∼ 0, it can be seen from Eq. S3.2 that the leaf albedo willbecome sensitive to differences in leaf surface features ratherthan its interior. This can occur at strongly absorbing wave-lengths, e.g., 445 nm, where the leaf absorptance, aλ, saturatesand becomes weakly sensitive to variation in the concentrations ofleaf biochemical constituents. In the near infrared (NIR), wherepigments do not absorb and the wavelength is still shorter thanregions of strong absorption by water, variation between species inthe radiation absorbed by the leaf interior, jΔaλ/a2λj, can be com-parable to or smaller than that of the leaf surface reflected radi-ation; i.e., jΔaλ/a2λj < jΔiL/i1Lj. This acts to weaken the sensitivityof the total leaf albedo, ωλ, to the amount of leaf constituents.
SI Text 4. Reference SpectrumAnalyses of leaf albedo spectra from the Boreal Ecosystem At-mosphere Study (BOREAS) campaign (9) and the SpectraBarrax Campaign (SPARC) of 2004 (10) suggest that, in the
spectral interval [710, 790 nm], transformed albedos of allspectra samples are related to a fixed spectrum, ϖ0λ, from theBOREAS set via the spectral invariant relationship (10, 11); i.e.,
ϖλ ¼ 1− pL1− pLϖ0λ
ϖ0λ: [S4.1]
The wavelength-independent within-leaf recollision probability,pL, varies with samples. In this interval the empirically derivedϖ0λ can be obtained from Lewis and Disney’s (7) approximationof the PROSPECT model (12) with the following parameters:chlorophyll content of 16 μg·cm−2, equivalent water thickness of0.005 cm−1, and dry matter content of 0.002 g·cm−2. This spec-trum is used as a reference albedo, ϖ0λ, in all our calculations.In the 710- to 790-nm spectral interval the diffuse leaf albedo
dominates; i.e.,
ωλ ≈ iLϖλ ¼ 1− pL1− pLϖ0λ
iLϖ0λ: [S4.2]
In this spectral interval, the reference albedo ϖ0λ is determinedby absorption spectra of chlorophyll, dry matter and water (Fig.4). Impact of water absorption can be neglected.
SI Text 5. Retrieving DASF from Hyperspectral DataConsider the 710- to 790-nm spectral interval. By substituting Eq.S4.2 into Eq. S2.1 one obtains
BRFλðΩÞ ¼ iLρðΩÞð1− pLÞi01−ϖ0λ p1
ϖ0λ; [S5.1]
where p1 = pL + iLp(1 − pL). The spectral BRF can be stan-dardized to a single known albedo, ϖ0λ. Standardization accu-racy is discussed in SI Text 7 and illustrated in Fig. S1.Eq. S5.1 can be rearranged to
BRFλðΩÞϖ0λ
¼ p1BRFλðΩÞ þ iLρðΩÞð1− pLÞi0: [S5.2]
By plotting the ratio BRFλ(Ω)/ϖ0λ vs. BRFλ(Ω), a linear relation-ship is obtained (Fig. S1A), where the intercept and slope giveiLρ(Ω)(1 − pL)i0 and p1. The ratio between the intercept and(1 − p1) becomes independent of pL and gives the DASF in thefollowing form:
DASF ¼ ρðΩÞ iLi01− piL
: [S5.3]
For vegetation canopies with a dark background, or sufficientlydense vegetation where the impact of canopy background isnegligible, this parameter therefore can be derived from theBRF spectrum in [710 nm, 790 nm] without prior knowledge/ancillary information of the leaf albedo, using the following sim-ple algorithm:
Step 0. Calculate the reference leaf albedo, ϖ0λ, in the 710- to790-nm spectral interval using, e.g., the PROSPECT modelwith input specified in SI Text 4. This is a fixed spectrum usedby the algorithm.Step 1. Given the measured BRFλ(Ω) spectrum in the 710- to790-nm spectral interval, plot values of the ratio BRFλ(Ω)/ϖ0λ vs. values of BRFλ(Ω). A linear relationship will be ob-tained (Fig. S1A).Step 2. Find slope, k, intercept, b, and R2 of the BRFλ(Ω)/ϖ0λ vs. BRFλ(Ω) relationship.Step 3. The ratio b/(1 − k) is an estimate of the DASF whereasthe R2 coefficient is an indicator of the retrieval quality. A low
Knyazikhin et al. www.pnas.org/cgi/content/short/1210196109 2 of 5

R2 value suggests that conditions for the applicability of thealgorithm are not met; e.g., impact of canopy background isnot negligible.Step 4. Take the next BRFλ(Ω) spectrum and go to step 1.
SI Text 6. Canopy Scattering CoefficientEq. S2.1 can be rearranged as
BRFλðΩÞ ¼ ρðΩÞi01−ωλp
ωλ ¼ ρðΩÞi0iL1− piL
1− piL
1− ω̂λpiLω̂λ
!¼ DASF · Wλ;
[S6.1]
where
Wλ ¼ 1− piL1− ω̂λpiL
ω̂λ [S6.2]
is the canopy scattering coefficient and ω̂λ ¼ ωλ=iL = ϖλ + sL/iL.Smolander and Stenberg (13) introduced this coefficient underan assumption of iL = 1. In this case Wλ is insensitive to surfaceproperties. It depends on the transformed leaf albedo and thefactor (1 − p)/(1 − ϖλp) that accounts for the absorption due towithin-canopy photon multiple interactions. In our analyses weallow for variation in leaf surface properties by relaxing the as-sumption iL = 1. It should be noted that the normalization of theBRF by DASF gives an approximation of the canopy scatteringcoefficient. An integration of Eq. S2.1 over directions shouldprecede the normalization to obtain its value accurately.Fig. S2 shows correlations of BRFλ and Wλ with canopy foliar
%N at NIR (800–850 nm), red (645 nm), and green (557 nm)
wavelengths. One can see that BRF exhibits either positive or norelation with the canopy %N, whereas the canopy scatteringcoefficient is negatively related to %N. Similar relationships arevalid for broadband photosynthetically active radiation (PAR)(400–700 nm) BRF and W; that is, there is no correlation be-tween BRF and canopy foliar %N (y = 0.001x + 0.024, R2 =0.006), whereas the W is negatively correlated with foliar nitro-gen (y = −0.042x + 0.141, R2 = 0.428). We found that thescattering coefficient is negatively correlated with foliar %N atall wavelengths in the interval between 423 and 855 nm. This issummarized in Fig. 7B.
SI Text 7. Accuracy in the Standardization of the SpectralBRF to a Single Reference SpectrumAccuracy of Eq. S5.1 was assessed as follows. First, we used thereference albedo ϖ0λ and the Airborne Visible/Infrared ImagingSpectrometer (AVIRIS) BRF in the 710- to 790-nm spectralinterval to derive slope (k) and intercept (b) from the BRFλ/ϖ0λ vs. BRFλ relationship (Fig. S1A). Second, ϖ0λ, k, and b wereused to simulate BRF spectra (Fig. S1B). Finally, the RRMSEbetween measured and simulated BRFs was taken as a measureof the standardization accuracy.A very high accuracy within the 710- to 790-nm spectral interval
has been achieved. All plots passed the accuracy test RRMSE ≤4.8% (Materials and Methods). An overall RRMSE is 1.86%. Eq.S6.1 was used to calculate mean NIR BRF over the spectralinterval [800, 850 nm] (weighted by a normalized solar radiancespectrum). An overall RRMSE between measured and simu-lated NIR BRF is 1.63%. Note that a high accuracy can beachieved only if the impact of the canopy background on canopyreflectance is negligible.
1. Tikhonov AN, Goncharsky AV, Stepanov VV, Yagola AG (1995) Numerical Methods forSolving Ill-Posed Problems, trans Hoksbergen RAM (Kluwer, Boston).
2. Knyazikhin Y, Schull MA, Xu L, Myneni RB, Samanta A (2011) Canopy spectralinvariants. Part 1: A new concept in remote sensing of vegetation. J Quant SpectroscRadiat Transf 112(4):727–735.
3. Huang D, et al. (2007) Canopy spectral invariants for remote sensing and modelapplications. Remote Sens Environ 106(1):106–122.
4. Marshak A, Knyazikhin Y, Chiu JC, Wiscombe WJ (2011) Spectrally invariantapproximation within atmospheric radiative transfer. J Atmos Sci 68(12):3094–3111.
5. Stenberg P (2007) Simple analytical formula for calculating average photon recollisionprobability in vegetation canopies. Remote Sens Environ 109(2):221–224.
6. Marchuk GI, et al. (1980) The Monte Carlo Methods in Atmospheric Optics (Springer,Berlin).
7. Lewis P, Disney M (2007) Spectral invariants and scattering across multiple scales fromwithin-leaf to canopy. Remote Sens Environ 109(2):196–206.
8. Grant L (1987) Diffuse and specular characteristics of leaf reflectance. Remote SensEnviron 22(2):309–322.
9. Middleton E, Sullivan J (2000) BOREAS TE-10 Leaf Optical Properties for SSA Species.Data set (Oak Ridge National Laboratory Distributed Active Archive Center, OakRidge, TN). Available at http://daac.ornl.gov/cgi-bin/dsviewer.pl?ds_id=531. AccessedMay 16, 2008.
10. Latorre Carmona P, Schull M, Knyazikhin Y, Pla F (2010) The application of spectralinvariants for discrimination of crops using CHRIS-PROBA data. Hyperspectral Imageand Signal Processing: Evolution in Remote Sensing (WHISPERS), 2010 2nd Workshop,eds Benediktsson JA, Chanussot J, Waske B (Institute of Electrical and ElectronicEngineers, Piscataway, NJ), pp 1–4.
11. Schull MA, et al. (2011) Canopy spectral invariants, Part 2: Application to classificationof forest types from hyperspectral data. J Quant Spectrosc Radiat Transf 112(4):736–750.
12. Jacquemoud S, Baret F (1990) PROSPECT: A model of leaf optical-properties spectra.Remote Sens Environ 34(2):75–91.
13. Smolander S, Stenberg P (2005) Simple parameterizations of the radiation budgetof uniform broadleaved and coniferous canopies. Remote Sens Environ 94(3):355–363.
Knyazikhin et al. www.pnas.org/cgi/content/short/1210196109 3 of 5
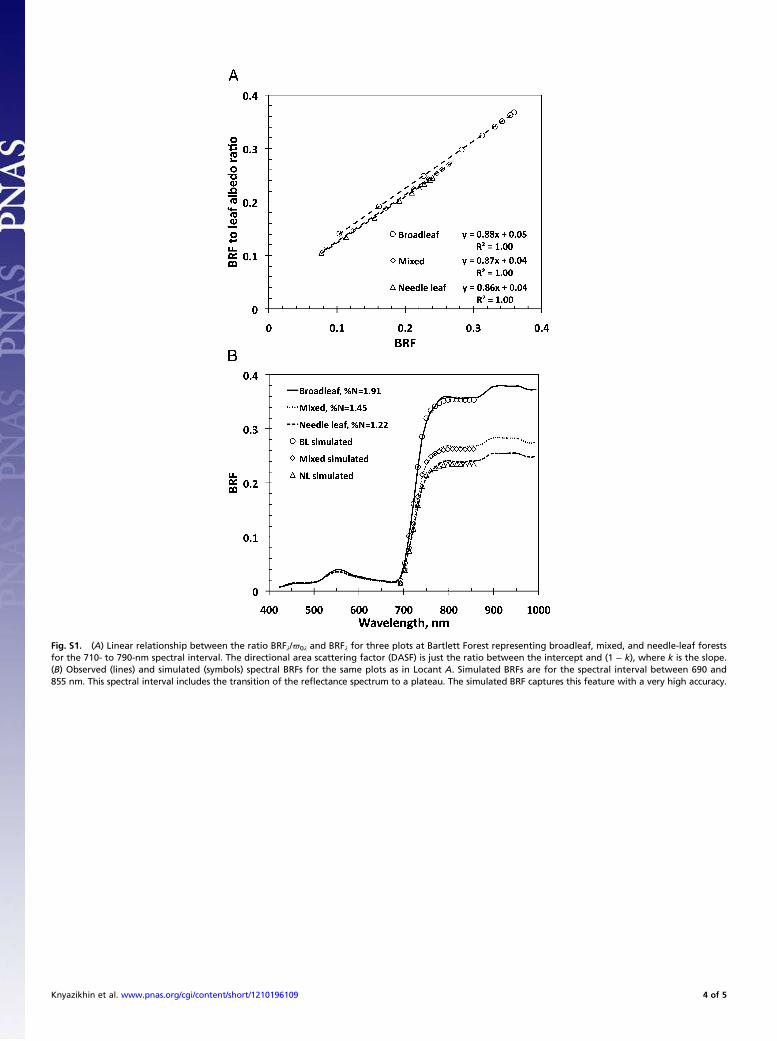
Fig. S1. (A) Linear relationship between the ratio BRFλ/ϖ0λ and BRFλ for three plots at Bartlett Forest representing broadleaf, mixed, and needle-leaf forestsfor the 710- to 790-nm spectral interval. The directional area scattering factor (DASF) is just the ratio between the intercept and (1 − k), where k is the slope.(B) Observed (lines) and simulated (symbols) spectral BRFs for the same plots as in Locant A. Simulated BRFs are for the spectral interval between 690 and855 nm. This spectral interval includes the transition of the reflectance spectrum to a plateau. The simulated BRF captures this feature with a very high accuracy.
Knyazikhin et al. www.pnas.org/cgi/content/short/1210196109 4 of 5

Fig. S2. Canopy BRF vs. canopy foliar %N (Left) and canopy scattering coefficient W vs. canopy foliar %N (Right) in the NIR, red, and green spectralwavelengths.
Knyazikhin et al. www.pnas.org/cgi/content/short/1210196109 5 of 5