Hydroxyapatite Formation Coexists with Amyloid-like Self ... · International Journal of Molecular...
15
International Journal of Molecular Sciences Article Hydroxyapatite Formation Coexists with Amyloid-like Self-Assembly of Human Amelogenin Jing Zhang 1,2,3 , Jian Wang 1 , Chengwei Ma 1 and Junxia Lu 1, * 1 School of Life Science and Technology, ShanghaiTech University, Shanghai 201210, China; [email protected] (J.Z.); [email protected] (J.W.); [email protected] (C.M.) 2 State Key Laboratory of Molecular Biology, CAS Center for Excellence in Molecular Cell Science, Shanghai Institute of Biochemistry and Cell Biology, Chinese Academy of Sciences, Shanghai 200031, China 3 University of Chinese Academy of Sciences, Beijing 100049, China * Correspondence: [email protected] Received: 18 February 2020; Accepted: 7 April 2020; Published: 22 April 2020 Abstract: Tooth enamel is formed in an extracellular environment. Amelogenin, the major component in the protein matrix of tooth enamel during the developing stage, could assemble into high molecular weight structures, regulating enamel formation. However, the molecular structure of amelogenin protein assembly at the functional state is still elusive. In this work, we found that amelogenin is able to induce calcium phosphate minerals into hydroxyapatite (HAP) structure in vitro at pH 6.0. Assessed using X-ray diffraction (XRD) and 31 P solid-state NMR (SSNMR) evidence, the formed HAP mimics natural enamel closely. The structure of amelogenin protein assembly coexisting with the HAP was also studied using atomic force microscopy (AFM), transmission electron microscopy (TEM) and XRD, indicating the β-amyloid structure of the protein. SSNMR was proven to be an important tool in detecting both the rigid and dynamic components of the protein assembly in the sample, and the core sequence 18 EVLTPLKWYQSI 29 was identified as the major segment contributing to the β-sheet secondary structure. Our research suggests an amyloid structure may be an important factor in controlling HAP formation at the right pH conditions with the help of other structural components in the protein assembly. Keywords: amelogenin; hydroxyapatite; enamel biomimetic; protein assembly structure; solid-state NMR 1. Introduction Enamel, the material covering and protecting the teeth, is composed of hydroxyapatite (HAP) crystals [1]. Different from bone or dentin, the elongated hydroxyapatite crystals are interwoven into a highly organized microstructure in enamel, bestowing enamel with extraordinary strength and resistance to fracture [2]. Amelogenin, as the major component of enamel protein, plays a key role in regulating enamel mineral morphology [3]. Mutation of amelogenin causes amelogenesis imperfect disorders in human [4]. Knockout of amelogenin in mice results in defective enamel formation [5]. Although not fully understood, the biomimetic approach has utilized amelogenin to regenerate enamel-like materials on teeth in gentle and close to physiological conditions [6]. Full-length amelogenin [7], leucine-rich amelogenin peptide (LRAP) [8] and other amelogenin-derived peptides [9] have all been tested and proved to have great potential in dentistry or biomaterials. Amelogenin belongs to the group of intrinsically disordered proteins. In acidic solution, it is disordered [10]. In neutral or weak basic condition, it tends to oligomerize into various high-molecular weight structures, which depends on the solution environment [11–13]. During amelogenesis, ameloblast cells excrete the proteins, 90% of which are amelogenin and its variants [3]. The proteins Int. J. Mol. Sci. 2020, 21, 2946; doi:10.3390/ijms21082946 www.mdpi.com/journal/ijms
Transcript of Hydroxyapatite Formation Coexists with Amyloid-like Self ... · International Journal of Molecular...

International Journal of
Molecular Sciences
Article
Hydroxyapatite Formation Coexists withAmyloid-like Self-Assembly of Human Amelogenin
Jing Zhang 1,2,3, Jian Wang 1, Chengwei Ma 1 and Junxia Lu 1,*1 School of Life Science and Technology, ShanghaiTech University, Shanghai 201210, China;
[email protected] (J.Z.); [email protected] (J.W.); [email protected] (C.M.)2 State Key Laboratory of Molecular Biology, CAS Center for Excellence in Molecular Cell Science, Shanghai
Institute of Biochemistry and Cell Biology, Chinese Academy of Sciences, Shanghai 200031, China3 University of Chinese Academy of Sciences, Beijing 100049, China* Correspondence: [email protected]
Received: 18 February 2020; Accepted: 7 April 2020; Published: 22 April 2020�����������������
Abstract: Tooth enamel is formed in an extracellular environment. Amelogenin, the major componentin the protein matrix of tooth enamel during the developing stage, could assemble into high molecularweight structures, regulating enamel formation. However, the molecular structure of amelogeninprotein assembly at the functional state is still elusive. In this work, we found that amelogenin isable to induce calcium phosphate minerals into hydroxyapatite (HAP) structure in vitro at pH 6.0.Assessed using X-ray diffraction (XRD) and 31P solid-state NMR (SSNMR) evidence, the formed HAPmimics natural enamel closely. The structure of amelogenin protein assembly coexisting with theHAP was also studied using atomic force microscopy (AFM), transmission electron microscopy (TEM)and XRD, indicating the β-amyloid structure of the protein. SSNMR was proven to be an importanttool in detecting both the rigid and dynamic components of the protein assembly in the sample,and the core sequence 18EVLTPLKWYQSI29 was identified as the major segment contributing to theβ-sheet secondary structure. Our research suggests an amyloid structure may be an important factorin controlling HAP formation at the right pH conditions with the help of other structural componentsin the protein assembly.
Keywords: amelogenin; hydroxyapatite; enamel biomimetic; protein assembly structure;solid-state NMR
1. Introduction
Enamel, the material covering and protecting the teeth, is composed of hydroxyapatite (HAP)crystals [1]. Different from bone or dentin, the elongated hydroxyapatite crystals are interwoveninto a highly organized microstructure in enamel, bestowing enamel with extraordinary strengthand resistance to fracture [2]. Amelogenin, as the major component of enamel protein, plays a keyrole in regulating enamel mineral morphology [3]. Mutation of amelogenin causes amelogenesisimperfect disorders in human [4]. Knockout of amelogenin in mice results in defective enamelformation [5]. Although not fully understood, the biomimetic approach has utilized amelogenin toregenerate enamel-like materials on teeth in gentle and close to physiological conditions [6]. Full-lengthamelogenin [7], leucine-rich amelogenin peptide (LRAP) [8] and other amelogenin-derived peptides [9]have all been tested and proved to have great potential in dentistry or biomaterials.
Amelogenin belongs to the group of intrinsically disordered proteins. In acidic solution, it isdisordered [10]. In neutral or weak basic condition, it tends to oligomerize into various high-molecularweight structures, which depends on the solution environment [11–13]. During amelogenesis,ameloblast cells excrete the proteins, 90% of which are amelogenin and its variants [3]. The proteins
Int. J. Mol. Sci. 2020, 21, 2946; doi:10.3390/ijms21082946 www.mdpi.com/journal/ijms

Int. J. Mol. Sci. 2020, 21, 2946 2 of 15
form a matrix template guiding apatite crystal formation into elongated structures. During enamelmaturation, the proteins are enzymatically removed to allow the crystal to expand in directionsperpendicular to its long axis [2]. Many studies have been carried out to learn the protein assemblystructures during amelogenesis. Transmission electron imaging techniques have identified amelogeninnanospheres in the enamel matrix [14], although structural information at the molecular level is stilllacking. Utilizing X-ray diffraction, Jodaikin et al. revealed the molecular structure of developingrat tooth enamel at the molecular level [15]. They found 0.47 nm reflections, indicating some of theorganic matrix proteins adopt a β-sheet conformation. Enamel matrices from the secretory stage andthe maturation stage of kallikrein-4 knockout mice stained positively with Congo red, suggestingan amyloid structure with β-sheet conformation [16]. Solid-state NMR also revealed the β-sheetsecondary structure for selectively 13C-labeled lysine residues of murine amelogenin at a functionalstate [17]. Therefore, a β-sheet conformation of amelogenin assembly has been proposed as thetemplate to guide the mineral deposition and the enamel formation [18]. In vitro, amelogenin is ableto form amyloid-like conformation in many conditions, from an oil-water emulsion system [19,20] tosimulated enamel fluid [13], which closely mimic physiological conditions. However, no work hasshown that amyloid-like conformation of amelogenin is functional in promoting enamel formation in abiomimetic environment.
In the present work, we found that the human full-length amelogenin (H175) was able to forman amyloid-like structure at a pH range from 4.5 to 6.0. However, only at pH 6.0, which is in thepH range for natural enamel development [18], was amelogenin with this amyloid-like structurefunctional in promoting HAP [Ca5(PO4)3OH] formation. In contrast, the brushite (CaHPO4·2H2O)was the main mineral deposit at pH 5.0 and 5.5 conditions with H175 and pH 6.0 condition withoutH175. The structure of HAP formed at pH 6.0 in the presence of H175 was characterized usingXRD and 31P solid-state NMR. Our results revealed that HAP formed by amelogenin in vitro closelyresembles HAP crystals, using XRD, and human enamel, using 31P 1D and 2D 1H-31P heteronuclearcorrelation (HETCOR) spectra. Solid-state NMR (SSNMR) was also carried out to obtain structuraldetails of H175 assemblies at pH 6.0 using uniformly [13C, 15N]-labeled protein, and the core sequence18EVLTPLKWYQSI29 participating in the amyloid formation was identified. Besides this main β-sheetregion, other rigid and dynamic parts in H175 are also discussed.
2. Results
2.1. H175 could Adopt Amyloid-Like Structure at Acidic pH Conditions
Previously, we have showed that LRAP can assemble into an amyloid-like structure at acidic pHconditions [21]. In this work, human full-length amelogenin (H175) was tested for the amyloid-likeassembly formation. In the presence of 33.4 mM CaCl2 and 20.9 mM KH2PO4, the protein aggregatesat the screened pH conditions (4.5, 5.0, 5.5). At pH 4.5, the aggregation is gel-like and transparent,after leaving the sample at 37 ◦C for several days. At pH 5.0 and 5.5, the aggregation is white andforms quickly upon pH adjustment using KOH. The samples were usually collected after 2 weeks’incubation or longer at 37 ◦C. The final mixtures were subjected to atomic force microscopy (AFM)examination (Figure 1a–c), showing smaller curvy aggregates at pH 4.5 and straight rod structures atpH 5.0 and 5.5. From the UV reading of the supernatant after ultracentrifugation of the mixture, wecan conclude that about 30% of H175 is left in the solution for pH 4.5 and 5.0 and about 20% of H175for pH 5.5 at the end of incubation. XRD of the total precipitates collected from ultracentrifugationclearly indicate two diffraction rings corresponding to the spacings of 4.8 Å and 10.1 Å for all three pHconditions (Figure 1d–f). The two distances are characteristic distances of the protein amyloid [22,23].Thus, the results indicate that H175 would form amyloid-like assemblies at acidic pHs.

Int. J. Mol. Sci. 2020, 21, 2946 3 of 15Int. J. Mol. Sci. 2019, 20, x FOR PEER REVIEW 3 of 15
Figure 1. AFM images, (a), (b) and (c), and XRD images, (d), (e) and (f), of H175 assemblies prepared
at pH 4.5, 5.0 and 5.5 at 37 °C. (a) (d) H175 assemblies at pH 4.5. The incubation period is 20 days. (b)
(e) H175 assemblies at pH 5.0. The incubation period is 20 days. (c) (f) H175 assemblies at pH 5.5. The
incubation period is 14 days. The arrows in XRD indicate the equatorial and meridional reflections at
10.1 Å and 4.8 Å, respectively. The other Debye rings in XRD indicate salt crystal reflection.
2.2. HAP is Formed at pH 6.0 in the Presence of H175 Amyloid
During enamel development and maturation, extracellular pH is rigorously regulated. It
oscillates from neutral (~7.2) to weakly acidic (5.5–6.2) conditions [18]. In order to test whether
amelogenin could adopt an amyloid structure at a natural pH condition, H175 was also incubated at
pH 6.0 with 33.4 mM CaCl2 and 20.9 mM KH2PO4. At this condition, a large amount of white sand‐
like precipitates were observed immediately after pH adjustment, indicating mineral salt formation.
Finally, about 20% of H175 is left in the supernatant after two weeks’ incubation. An AFM image of
the sample shows straight rod structures (Figure 2a), which tend to align to each other. Using a
transmission electron microscopy (TEM), we could observe more diverse structures (Figure 3) in the
sample. There are rod structures of protein assemblies in gray, parallelly associated with each other
(Figure 3a,b). We could also see images exhibiting darker needle‐like structures, extending in length
to hundreds of nanometers and bundling up in the perpendicular direction to its length (Figure 3b,c),
which are the mineral precipitates. In Figure 3b, it is clearly seen that those mineral precipitates
coexist with the gray protein rods. Sometimes, it may be difficult to distinguish them from each other.
Comparing to TEM images for other conditions (TEM images for samples at other pH values shown
in Figure S1), pH 6.0 is the only condition that a large amount of mineral precipitates could be
Figure 1. AFM images, (a–c), and XRD images, (d–f), of H175 assemblies prepared at pH 4.5, 5.0 and5.5 at 37 ◦C. (a,d) H175 assemblies at pH 4.5. The incubation period is 20 days. (b,e) H175 assembliesat pH 5.0. The incubation period is 20 days. (c,f) H175 assemblies at pH 5.5. The incubation periodis 14 days. The arrows in XRD indicate the equatorial and meridional reflections at 10.1 Å and 4.8 Å,respectively. The other Debye rings in XRD indicate salt crystal reflection.
2.2. HAP is Formed at pH 6.0 in the Presence of H175 Amyloid
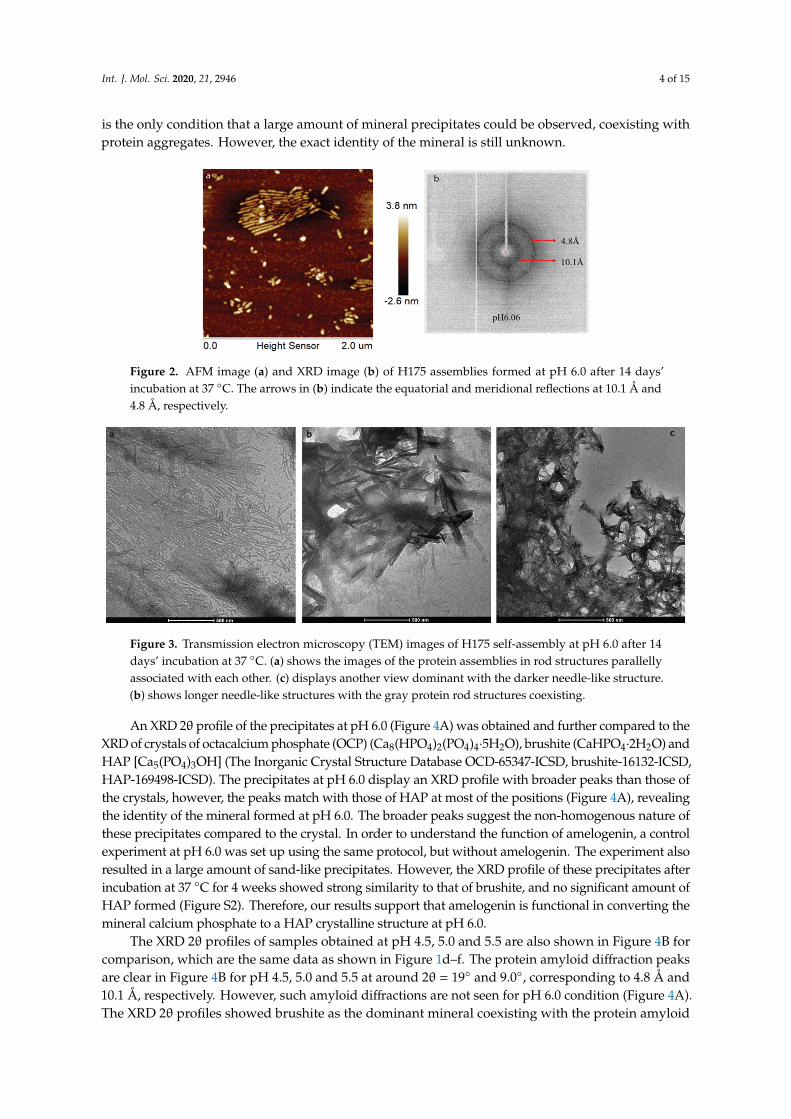
During enamel development and maturation, extracellular pH is rigorously regulated. It oscillatesfrom neutral (~7.2) to weakly acidic (5.5–6.2) conditions [18]. In order to test whether amelogenincould adopt an amyloid structure at a natural pH condition, H175 was also incubated at pH 6.0 with33.4 mM CaCl2 and 20.9 mM KH2PO4. At this condition, a large amount of white sand-like precipitateswere observed immediately after pH adjustment, indicating mineral salt formation. Finally, about 20%of H175 is left in the supernatant after two weeks’ incubation. An AFM image of the sample showsstraight rod structures (Figure 2a), which tend to align to each other. Using a transmission electronmicroscopy (TEM), we could observe more diverse structures (Figure 3) in the sample. There arerod structures of protein assemblies in gray, parallelly associated with each other (Figure 3a,b). Wecould also see images exhibiting darker needle-like structures, extending in length to hundreds ofnanometers and bundling up in the perpendicular direction to its length (Figure 3b,c), which are themineral precipitates. In Figure 3b, it is clearly seen that those mineral precipitates coexist with the grayprotein rods. Sometimes, it may be difficult to distinguish them from each other. Comparing to TEMimages for other conditions (TEM images for samples at other pH values shown in Figure S1), pH 6.0
Int. J. Mol. Sci. 2020, 21, 2946 4 of 15
is the only condition that a large amount of mineral precipitates could be observed, coexisting withprotein aggregates. However, the exact identity of the mineral is still unknown.
Int. J. Mol. Sci. 2019, 20, x FOR PEER REVIEW 4 of 15
observed, coexisting with protein aggregates. However, the exact identity of the mineral is still
unknown.
Figure 2. AFM image (a) and XRD image (b) of H175 assemblies formed at pH 6.0 after 14 days’
incubation at 37 °C. The arrows in (b) indicate the equatorial and meridional reflections at 10.1 Å and
4.8 Å, respectively.
Figure 3. Transmission electron microscopy (TEM) images of H175 self‐assembly at pH 6.0 after 14
days’ incubation at 37 °C. (a) shows the images of the protein assemblies in rod structures parallelly
associated with each other. (c) displays another view dominant with the darker needle‐like structure.
(b) shows longer needle‐like structures with the gray protein rod structures coexisting.
An XRD 2θ profile of the precipitates at pH 6.0 (Figure 4A) was obtained and further compared
to the XRD of crystals of octacalcium phosphate (OCP) (Ca8(HPO4)2(PO4)45H2O), brushite
(CaHPO42H2O) and HAP [Ca5(PO4)3OH] (The Inorganic Crystal Structure Database OCD‐65347‐
ICSD, brushite‐16132‐ICSD, HAP‐169498‐ICSD). The precipitates at pH 6.0 display an XRD profile
with broader peaks than those of the crystals, however, the peaks match with those of HAP at most
of the positions (Figure 4A), revealing the identity of the mineral formed at pH 6.0. The broader peaks
suggest the non‐homogenous nature of these precipitates compared to the crystal. In order to
understand the function of amelogenin, a control experiment at pH 6.0 was set up using the same
protocol, but without amelogenin. The experiment also resulted in a large amount of sand‐like
precipitates. However, the XRD profile of these precipitates after incubation at 37 °C for 4 weeks
showed strong similarity to that of brushite, and no significant amount of HAP formed (Figure S2).
Therefore, our results support that amelogenin is functional in converting the mineral calcium
phosphate to a HAP crystalline structure at pH 6.0.
The XRD 2θ profiles of samples obtained at pH 4.5, 5.0 and 5.5 are also shown in Figure 4B for
comparison, which are the same data as shown in Figure 1d–f. The protein amyloid diffraction peaks
are clear in Figure 4B for pH 4.5, 5.0 and 5.5 at around 2θ = 19° and 9.0°, corresponding to 4.8 Å and
10.1 Å, respectively. However, such amyloid diffractions are not seen for pH 6.0 condition (Figure
4A). The XRD 2θ profiles showed brushite as the dominant mineral coexisting with the protein
Figure 2. AFM image (a) and XRD image (b) of H175 assemblies formed at pH 6.0 after 14 days’incubation at 37 ◦C. The arrows in (b) indicate the equatorial and meridional reflections at 10.1 Å and4.8 Å, respectively.
Int. J. Mol. Sci. 2019, 20, x FOR PEER REVIEW 4 of 15
observed, coexisting with protein aggregates. However, the exact identity of the mineral is still
unknown.
Figure 2. AFM image (a) and XRD image (b) of H175 assemblies formed at pH 6.0 after 14 days’
incubation at 37 °C. The arrows in (b) indicate the equatorial and meridional reflections at 10.1 Å and
4.8 Å, respectively.
Figure 3. Transmission electron microscopy (TEM) images of H175 self‐assembly at pH 6.0 after 14
days’ incubation at 37 °C. (a) shows the images of the protein assemblies in rod structures parallelly
associated with each other. (c) displays another view dominant with the darker needle‐like structure.
(b) shows longer needle‐like structures with the gray protein rod structures coexisting.
An XRD 2θ profile of the precipitates at pH 6.0 (Figure 4A) was obtained and further compared
to the XRD of crystals of octacalcium phosphate (OCP) (Ca8(HPO4)2(PO4)45H2O), brushite
(CaHPO42H2O) and HAP [Ca5(PO4)3OH] (The Inorganic Crystal Structure Database OCD‐65347‐
ICSD, brushite‐16132‐ICSD, HAP‐169498‐ICSD). The precipitates at pH 6.0 display an XRD profile
with broader peaks than those of the crystals, however, the peaks match with those of HAP at most
of the positions (Figure 4A), revealing the identity of the mineral formed at pH 6.0. The broader peaks
suggest the non‐homogenous nature of these precipitates compared to the crystal. In order to
understand the function of amelogenin, a control experiment at pH 6.0 was set up using the same
protocol, but without amelogenin. The experiment also resulted in a large amount of sand‐like
precipitates. However, the XRD profile of these precipitates after incubation at 37 °C for 4 weeks
showed strong similarity to that of brushite, and no significant amount of HAP formed (Figure S2).
Therefore, our results support that amelogenin is functional in converting the mineral calcium
phosphate to a HAP crystalline structure at pH 6.0.
The XRD 2θ profiles of samples obtained at pH 4.5, 5.0 and 5.5 are also shown in Figure 4B for
comparison, which are the same data as shown in Figure 1d–f. The protein amyloid diffraction peaks
are clear in Figure 4B for pH 4.5, 5.0 and 5.5 at around 2θ = 19° and 9.0°, corresponding to 4.8 Å and
10.1 Å, respectively. However, such amyloid diffractions are not seen for pH 6.0 condition (Figure
4A). The XRD 2θ profiles showed brushite as the dominant mineral coexisting with the protein
Figure 3. Transmission electron microscopy (TEM) images of H175 self-assembly at pH 6.0 after 14days’ incubation at 37 ◦C. (a) shows the images of the protein assemblies in rod structures parallellyassociated with each other. (c) displays another view dominant with the darker needle-like structure.(b) shows longer needle-like structures with the gray protein rod structures coexisting.
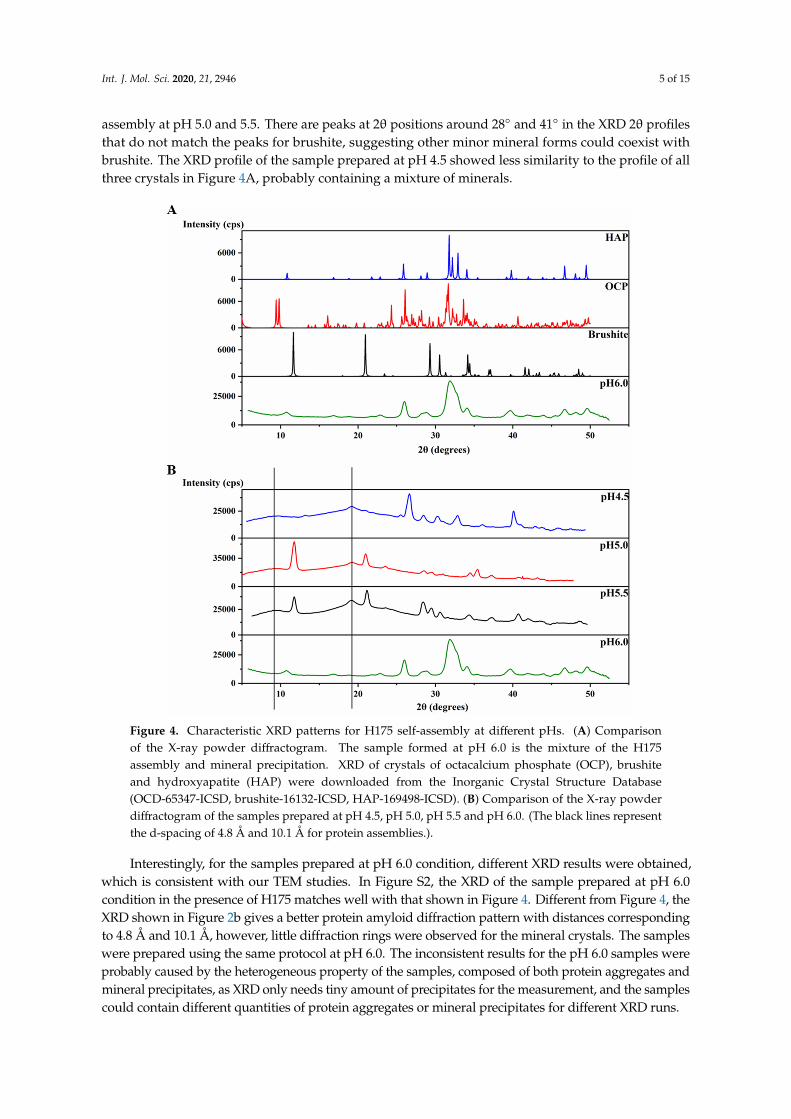
An XRD 2θ profile of the precipitates at pH 6.0 (Figure 4A) was obtained and further compared to theXRD of crystals of octacalcium phosphate (OCP) (Ca8(HPO4)2(PO4)4·5H2O), brushite (CaHPO4·2H2O) andHAP [Ca5(PO4)3OH] (The Inorganic Crystal Structure Database OCD-65347-ICSD, brushite-16132-ICSD,HAP-169498-ICSD). The precipitates at pH 6.0 display an XRD profile with broader peaks than those ofthe crystals, however, the peaks match with those of HAP at most of the positions (Figure 4A), revealingthe identity of the mineral formed at pH 6.0. The broader peaks suggest the non-homogenous nature ofthese precipitates compared to the crystal. In order to understand the function of amelogenin, a controlexperiment at pH 6.0 was set up using the same protocol, but without amelogenin. The experiment alsoresulted in a large amount of sand-like precipitates. However, the XRD profile of these precipitates afterincubation at 37 ◦C for 4 weeks showed strong similarity to that of brushite, and no significant amount ofHAP formed (Figure S2). Therefore, our results support that amelogenin is functional in converting themineral calcium phosphate to a HAP crystalline structure at pH 6.0.
The XRD 2θ profiles of samples obtained at pH 4.5, 5.0 and 5.5 are also shown in Figure 4B forcomparison, which are the same data as shown in Figure 1d–f. The protein amyloid diffraction peaksare clear in Figure 4B for pH 4.5, 5.0 and 5.5 at around 2θ = 19◦ and 9.0◦, corresponding to 4.8 Å and10.1 Å, respectively. However, such amyloid diffractions are not seen for pH 6.0 condition (Figure 4A).The XRD 2θ profiles showed brushite as the dominant mineral coexisting with the protein amyloid
Int. J. Mol. Sci. 2020, 21, 2946 5 of 15
assembly at pH 5.0 and 5.5. There are peaks at 2θ positions around 28◦ and 41◦ in the XRD 2θ profilesthat do not match the peaks for brushite, suggesting other minor mineral forms could coexist withbrushite. The XRD profile of the sample prepared at pH 4.5 showed less similarity to the profile of allthree crystals in Figure 4A, probably containing a mixture of minerals.
Int. J. Mol. Sci. 2019, 20, x FOR PEER REVIEW 5 of 15
amyloid assembly at pH 5.0 and 5.5. There are peaks at 2θ positions around 28 and 41 in the XRD 2θ profiles that do not match the peaks for brushite, suggesting other minor mineral forms could
coexist with brushite. The XRD profile of the sample prepared at pH 4.5 showed less similarity to the
profile of all three crystals in Figure 4A, probably containing a mixture of minerals.
Interestingly, for the samples prepared at pH 6.0 condition, different XRD results were obtained,
which is consistent with our TEM studies. In Figure S2, the XRD of the sample prepared at pH 6.0
condition in the presence of H175 matches well with that shown in Figure 4. Different from Figure 4,
the XRD shown in Figure 2b gives a better protein amyloid diffraction pattern with distances
corresponding to 4.8 Å and 10.1 Å, however, little diffraction rings were observed for the mineral
crystals. The samples were prepared using the same protocol at pH 6.0. The inconsistent results for
the pH 6.0 samples were probably caused by the heterogeneous property of the samples, composed
of both protein aggregates and mineral precipitates, as XRD only needs tiny amount of precipitates
for the measurement, and the samples could contain different quantities of protein aggregates or
mineral precipitates for different XRD runs.
Figure 4. Characteristic XRD patterns for H175 self‐assembly at different pHs. (A) Comparison of the
X‐ray powder diffractogram. The sample formed at pH 6.0 is the mixture of the H175 assembly and
mineral precipitation. XRD of crystals of octacalcium phosphate (OCP), brushite and hydroxyapatite
(HAP) were downloaded from the Inorganic Crystal Structure Database (OCD‐65347‐ICSD, brushite‐
16132‐ICSD, HAP‐169498‐ICSD). (B) Comparison of the X‐ray powder diffractogram of the samples
prepared at pH 4.5, pH 5.0, pH 5.5 and pH 6.0. (The black lines represent the d‐spacing of 4.8 Å and
10.1 Å for protein assemblies.).
Figure 4. Characteristic XRD patterns for H175 self-assembly at different pHs. (A) Comparisonof the X-ray powder diffractogram. The sample formed at pH 6.0 is the mixture of the H175assembly and mineral precipitation. XRD of crystals of octacalcium phosphate (OCP), brushiteand hydroxyapatite (HAP) were downloaded from the Inorganic Crystal Structure Database(OCD-65347-ICSD, brushite-16132-ICSD, HAP-169498-ICSD). (B) Comparison of the X-ray powderdiffractogram of the samples prepared at pH 4.5, pH 5.0, pH 5.5 and pH 6.0. (The black lines representthe d-spacing of 4.8 Å and 10.1 Å for protein assemblies.).
Interestingly, for the samples prepared at pH 6.0 condition, different XRD results were obtained,which is consistent with our TEM studies. In Figure S2, the XRD of the sample prepared at pH 6.0condition in the presence of H175 matches well with that shown in Figure 4. Different from Figure 4, theXRD shown in Figure 2b gives a better protein amyloid diffraction pattern with distances correspondingto 4.8 Å and 10.1 Å, however, little diffraction rings were observed for the mineral crystals. The sampleswere prepared using the same protocol at pH 6.0. The inconsistent results for the pH 6.0 samples wereprobably caused by the heterogeneous property of the samples, composed of both protein aggregates andmineral precipitates, as XRD only needs tiny amount of precipitates for the measurement, and the samplescould contain different quantities of protein aggregates or mineral precipitates for different XRD runs.
Int. J. Mol. Sci. 2020, 21, 2946 6 of 15
2.3. 31P Solid-State NMR (SSNMR) Compared HAP Formed at pH 6.0 with the Natural Enamel
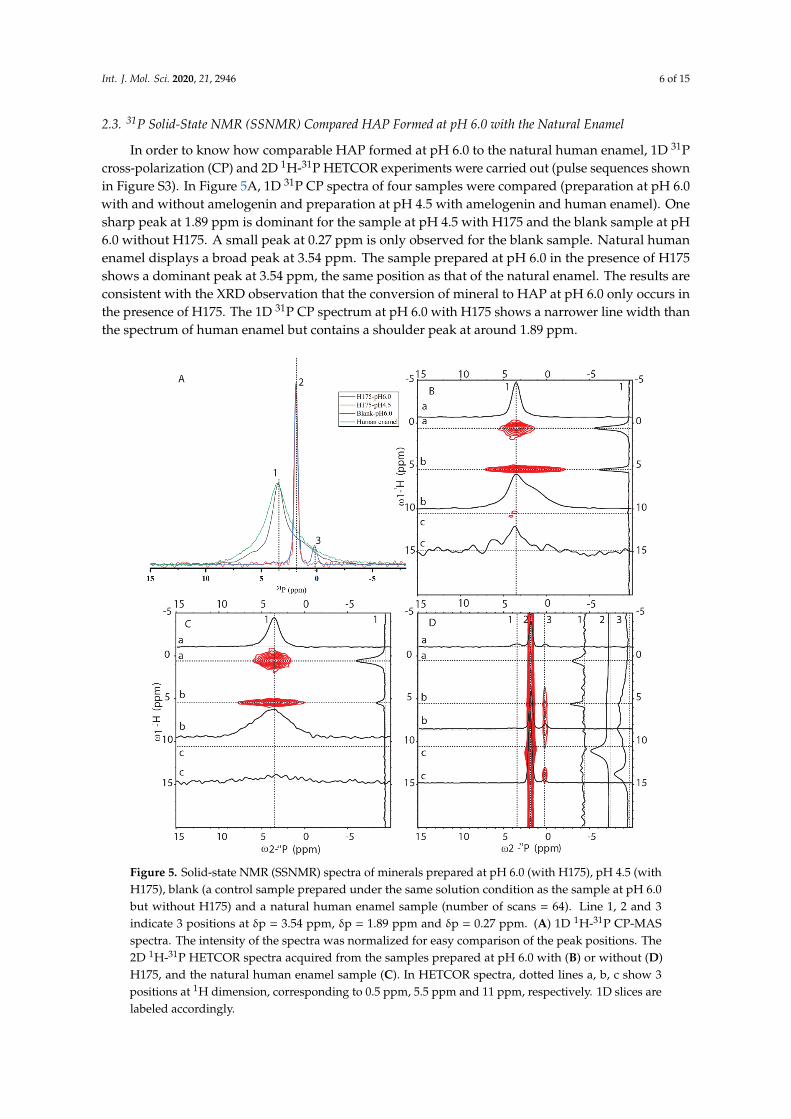
In order to know how comparable HAP formed at pH 6.0 to the natural human enamel, 1D 31Pcross-polarization (CP) and 2D 1H-31P HETCOR experiments were carried out (pulse sequences shownin Figure S3). In Figure 5A, 1D 31P CP spectra of four samples were compared (preparation at pH 6.0with and without amelogenin and preparation at pH 4.5 with amelogenin and human enamel). Onesharp peak at 1.89 ppm is dominant for the sample at pH 4.5 with H175 and the blank sample at pH6.0 without H175. A small peak at 0.27 ppm is only observed for the blank sample. Natural humanenamel displays a broad peak at 3.54 ppm. The sample prepared at pH 6.0 in the presence of H175shows a dominant peak at 3.54 ppm, the same position as that of the natural enamel. The results areconsistent with the XRD observation that the conversion of mineral to HAP at pH 6.0 only occurs inthe presence of H175. The 1D 31P CP spectrum at pH 6.0 with H175 shows a narrower line width thanthe spectrum of human enamel but contains a shoulder peak at around 1.89 ppm.Int. J. Mol. Sci. 2019, 20, x FOR PEER REVIEW 7 of 15
Figure 5. Solid‐state NMR (SSNMR) spectra of minerals prepared at pH 6.0 (with H175), pH 4.5 (with
H175), blank (a control sample prepared under the same solution condition as the sample at pH 6.0
but without H175) and a natural human enamel sample (number of scans = 64). Line 1, 2 and 3 indicate
3 positions at δp = 3.54 ppm, δp = 1.89 ppm and δp = 0.27 ppm. (A) 1D 1H‐31P CP‐MAS spectra. The
intensity of the spectra was normalized for easy comparison of the peak positions. The 2D 1H‐31P
HETCOR spectra acquired from the samples prepared at pH 6.0 with (B) or without (D) H175, and
the natural human enamel sample (C). In HETCOR spectra, dotted lines a, b, c show 3 positions at 1H
dimension, corresponding to 0.5 ppm, 5.5 ppm and 11 ppm, respectively. 1D slices are labeled
accordingly.
2.4. Amyloid‐like Assemblies of H175 are Facilitated by a Short Segment of Sequence
SSNMR was also used to elucidate the structure of H175 assemblies formed at pH 6.0. The same
sample for 31P SSNMR study of minerals was used in the protein structural investigation. The 2D CP
based 13C‐13C correlation spectrum with DARR mixing is shown in Figure 6A. The spectrum exhibits
a small number of peaks considering H175 with 175 residues in the sequence. The peak linewidth is
about 0.7 ppm for some well‐resolved peaks. However, it is difficult to assign the peaks since multi‐
dimensional NMR experiments, such as NCaCx, exhibit very weak signals (Figure 6B). The signal
intensity is limited by the small quantity of protein in the rotor, where most of the rotor volume is
taken by the mineral precipitation (about 10 mg of protein and a total sample weight of about 67 mg).
We then obtained an SSNMR 2D 13C‐13C correlation spectrum for the protein aggregates formed
at pH 4.5 for comparison. This sample had more protein and less mineral precipitation, since calcium
phosphate salt has higher solubility at this acidic condition. To our surprise, the 2D 13C spectrum is
almost the same as that for pH 6.0 (Figure 6C, overlay spectra in Figure S4), suggesting similar
Figure 5. Solid-state NMR (SSNMR) spectra of minerals prepared at pH 6.0 (with H175), pH 4.5 (withH175), blank (a control sample prepared under the same solution condition as the sample at pH 6.0but without H175) and a natural human enamel sample (number of scans = 64). Line 1, 2 and 3indicate 3 positions at δp = 3.54 ppm, δp = 1.89 ppm and δp = 0.27 ppm. (A) 1D 1H-31P CP-MASspectra. The intensity of the spectra was normalized for easy comparison of the peak positions. The2D 1H-31P HETCOR spectra acquired from the samples prepared at pH 6.0 with (B) or without (D)H175, and the natural human enamel sample (C). In HETCOR spectra, dotted lines a, b, c show 3positions at 1H dimension, corresponding to 0.5 ppm, 5.5 ppm and 11 ppm, respectively. 1D slices arelabeled accordingly.
Int. J. Mol. Sci. 2020, 21, 2946 7 of 15
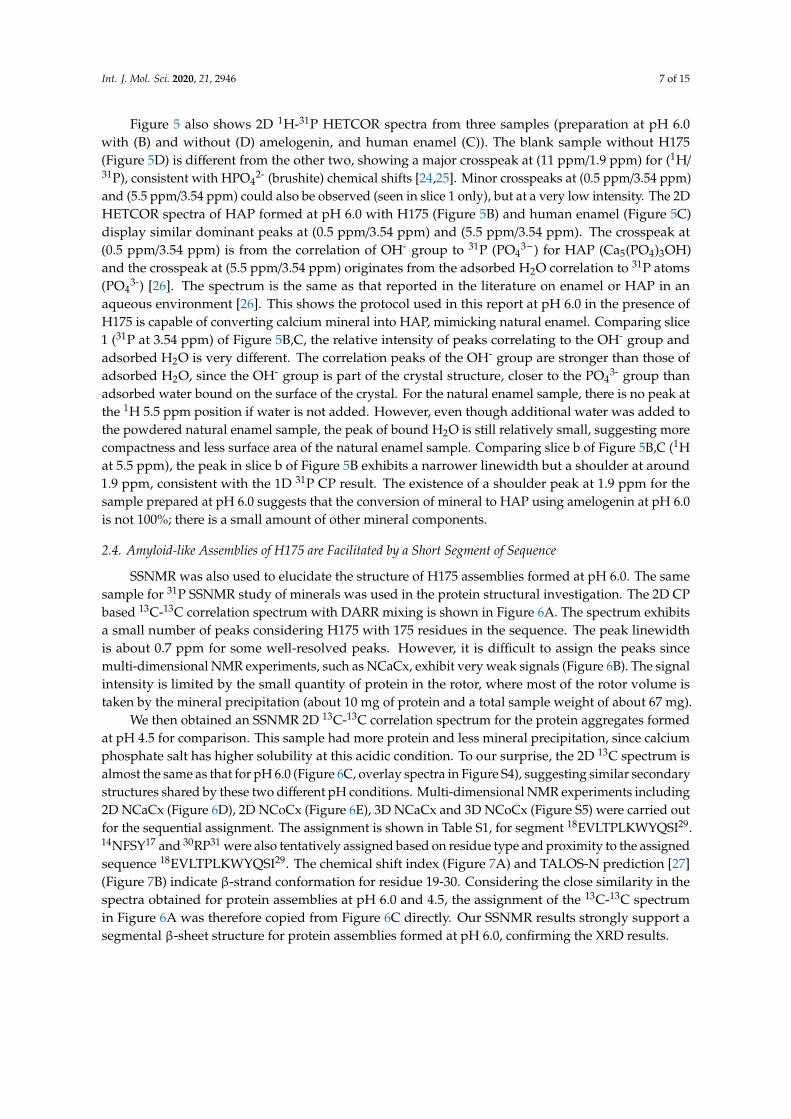
Figure 5 also shows 2D 1H-31P HETCOR spectra from three samples (preparation at pH 6.0with (B) and without (D) amelogenin, and human enamel (C)). The blank sample without H175(Figure 5D) is different from the other two, showing a major crosspeak at (11 ppm/1.9 ppm) for (1H/31P), consistent with HPO4
2- (brushite) chemical shifts [24,25]. Minor crosspeaks at (0.5 ppm/3.54 ppm)and (5.5 ppm/3.54 ppm) could also be observed (seen in slice 1 only), but at a very low intensity. The 2DHETCOR spectra of HAP formed at pH 6.0 with H175 (Figure 5B) and human enamel (Figure 5C)display similar dominant peaks at (0.5 ppm/3.54 ppm) and (5.5 ppm/3.54 ppm). The crosspeak at(0.5 ppm/3.54 ppm) is from the correlation of OH- group to 31P (PO4
3−) for HAP (Ca5(PO4)3OH)and the crosspeak at (5.5 ppm/3.54 ppm) originates from the adsorbed H2O correlation to 31P atoms(PO4
3-) [26]. The spectrum is the same as that reported in the literature on enamel or HAP in anaqueous environment [26]. This shows the protocol used in this report at pH 6.0 in the presence ofH175 is capable of converting calcium mineral into HAP, mimicking natural enamel. Comparing slice1 (31P at 3.54 ppm) of Figure 5B,C, the relative intensity of peaks correlating to the OH- group andadsorbed H2O is very different. The correlation peaks of the OH- group are stronger than those ofadsorbed H2O, since the OH- group is part of the crystal structure, closer to the PO4
3- group thanadsorbed water bound on the surface of the crystal. For the natural enamel sample, there is no peak atthe 1H 5.5 ppm position if water is not added. However, even though additional water was added tothe powdered natural enamel sample, the peak of bound H2O is still relatively small, suggesting morecompactness and less surface area of the natural enamel sample. Comparing slice b of Figure 5B,C (1Hat 5.5 ppm), the peak in slice b of Figure 5B exhibits a narrower linewidth but a shoulder at around1.9 ppm, consistent with the 1D 31P CP result. The existence of a shoulder peak at 1.9 ppm for thesample prepared at pH 6.0 suggests that the conversion of mineral to HAP using amelogenin at pH 6.0is not 100%; there is a small amount of other mineral components.
2.4. Amyloid-like Assemblies of H175 are Facilitated by a Short Segment of Sequence
SSNMR was also used to elucidate the structure of H175 assemblies formed at pH 6.0. The samesample for 31P SSNMR study of minerals was used in the protein structural investigation. The 2D CPbased 13C-13C correlation spectrum with DARR mixing is shown in Figure 6A. The spectrum exhibitsa small number of peaks considering H175 with 175 residues in the sequence. The peak linewidthis about 0.7 ppm for some well-resolved peaks. However, it is difficult to assign the peaks sincemulti-dimensional NMR experiments, such as NCaCx, exhibit very weak signals (Figure 6B). The signalintensity is limited by the small quantity of protein in the rotor, where most of the rotor volume istaken by the mineral precipitation (about 10 mg of protein and a total sample weight of about 67 mg).
We then obtained an SSNMR 2D 13C-13C correlation spectrum for the protein aggregates formedat pH 4.5 for comparison. This sample had more protein and less mineral precipitation, since calciumphosphate salt has higher solubility at this acidic condition. To our surprise, the 2D 13C spectrum isalmost the same as that for pH 6.0 (Figure 6C, overlay spectra in Figure S4), suggesting similar secondarystructures shared by these two different pH conditions. Multi-dimensional NMR experiments including2D NCaCx (Figure 6D), 2D NCoCx (Figure 6E), 3D NCaCx and 3D NCoCx (Figure S5) were carried outfor the sequential assignment. The assignment is shown in Table S1, for segment 18EVLTPLKWYQSI29.14NFSY17 and 30RP31 were also tentatively assigned based on residue type and proximity to the assignedsequence 18EVLTPLKWYQSI29. The chemical shift index (Figure 7A) and TALOS-N prediction [27](Figure 7B) indicate β-strand conformation for residue 19-30. Considering the close similarity in thespectra obtained for protein assemblies at pH 6.0 and 4.5, the assignment of the 13C-13C spectrumin Figure 6A was therefore copied from Figure 6C directly. Our SSNMR results strongly support asegmental β-sheet structure for protein assemblies formed at pH 6.0, confirming the XRD results.
Int. J. Mol. Sci. 2020, 21, 2946 8 of 15
Int. J. Mol. Sci. 2019, 20, x FOR PEER REVIEW 8 of 15
secondary structures shared by these two different pH conditions. Multi‐dimensional NMR
experiments including 2D NCaCx (Figure 6D), 2D NCoCx (Figure 6E), 3D NCaCx and 3D NCoCx
(Figure S5) were carried out for the sequential assignment. The assignment is shown in Table S1, for
segment 18EVLTPLKWYQSI29. 14NFSY17 and 30RP31 were also tentatively assigned based on residue
type and proximity to the assigned sequence 18EVLTPLKWYQSI29. The chemical shift index (Figure
7A) and TALOS‐N prediction [27] (Figure 7B) indicate β‐strand conformation for residue 19‐30.
Considering the close similarity in the spectra obtained for protein assemblies at pH 6.0 and 4.5, the
assignment of the 13C‐13C spectrum in Figure 6A was therefore copied from Figure 6C directly. Our
SSNMR results strongly support a segmental β‐sheet structure for protein assemblies formed at pH
6.0, confirming the XRD results.
Besides the assigned β‐sheet segment, there are some peaks clearly shown in both 13C‐13C spectra
(labeled in Figure 6A, C as An, In1, In2, Ln1, Ln2, Pn1, Pn2, Sn, Tn1, Vn1, Vn2). These peaks could
only be labeled according to the residue type. This strongly supports that other rigid segments exist
besides the β‐strand region 18EVLTPLKWYQSI29. The chemical shift values of these peaks are listed
in Table S2. The secondary chemical shifts were also calculated and showed mostly negative values
or small absolute values close to 0, suggesting those residues could adopt β‐sheet or random coil
secondary structures.
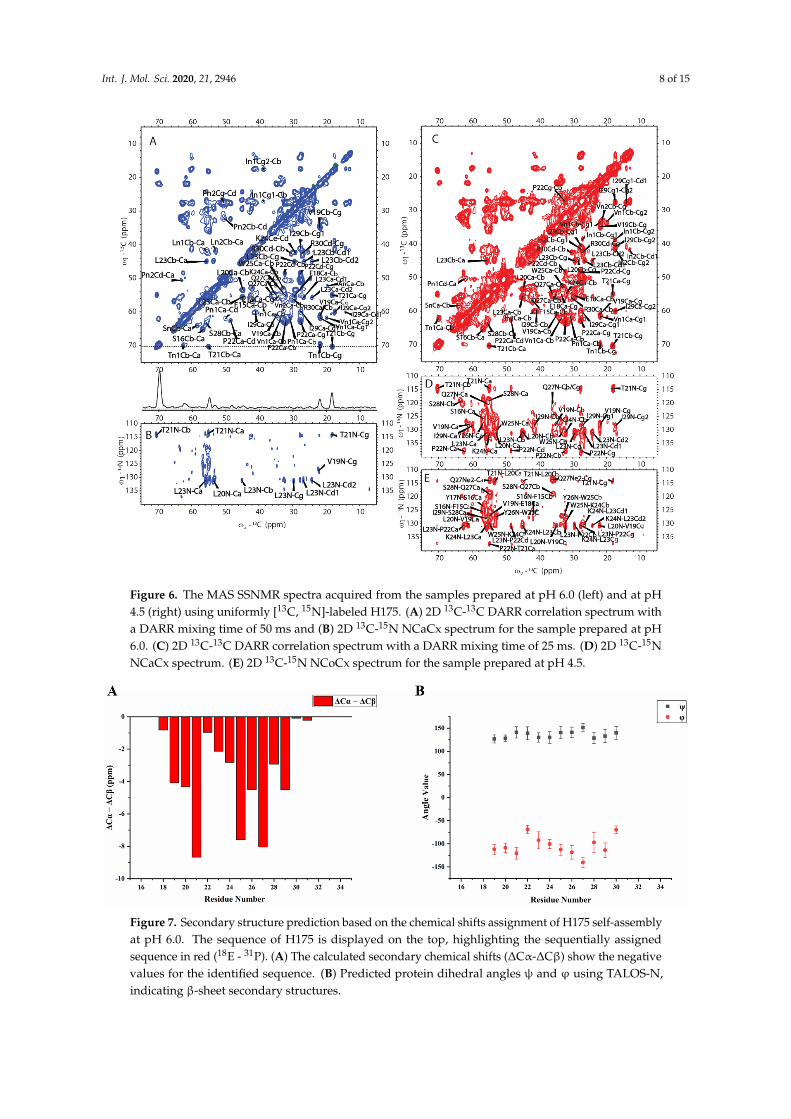
Figure 6. The MAS SSNMR spectra acquired from the samples prepared at pH 6.0 (left) and at pH 4.5
(right) using uniformly [13C, 15N]‐labeled H175. (A) 2D 13C‐13C DARR correlation spectrum with a
DARR mixing time of 50 ms and (B) 2D 13C‐15N NCaCx spectrum for the sample prepared at pH 6.0.
(C) 2D 13C‐13C DARR correlation spectrum with a DARR mixing time of 25 ms. (D) 2D 13C‐15N NCaCx
spectrum. (E) 2D 13C‐15N NCoCx spectrum for the sample prepared at pH 4.5.
2.5. H175 has Other Structural Components beside β‐amyloid
Figure 6. The MAS SSNMR spectra acquired from the samples prepared at pH 6.0 (left) and at pH4.5 (right) using uniformly [13C, 15N]-labeled H175. (A) 2D 13C-13C DARR correlation spectrum witha DARR mixing time of 50 ms and (B) 2D 13C-15N NCaCx spectrum for the sample prepared at pH6.0. (C) 2D 13C-13C DARR correlation spectrum with a DARR mixing time of 25 ms. (D) 2D 13C-15NNCaCx spectrum. (E) 2D 13C-15N NCoCx spectrum for the sample prepared at pH 4.5.
Int. J. Mol. Sci. 2019, 20, x FOR PEER REVIEW 9 of 15
From the cross‐polarization (CP)‐based 13C‐13C correlation spectrum, it can be concluded that the
rigid segments in H175 assemblies at pH 6.0 contain more than the identified β‐sheet sequence.
However, many residues are still missing in the SSNMR spectra. In order to find the dynamic
segment of H175 assemblies at pH 6.0 condition, insensitive nuclei enhanced by polarization transfer
(INEPT)‐based 2D total through bond correlation spectroscopy (TOBSY) was carried out, showing a
small number of peaks too (Figure 8A). The assignment based on the residue type is listed in Table
S2 for INEPT‐TOBSY. Judging from the secondary chemical shifts value, those residues could also
adopt β‐sheet or random coil secondary structures. Considering only a limited number of residues
are observed using both CP‐based and INEPT‐based experiments, these results indicate a large
number of residues in H175 assemblies are in disorder, or in motion with the intermediate timescale,
invisible for NMR.
A further comparison between the CP‐based 13C‐13C correlation spectrum (Figure 6A) and
INEPT‐ based TOBSY spectrum (Figure 8A) is shown in Figure 8B. To our surprise, there are several
peaks shown in both spectra. These peaks with the matched chemical shifts within 0.4 ppm include the crosspeaks for one I (In1/I2), two L residues (Ln1/L1) (Ln2/L2), two V residues (Vn1/V1) (Vn2/V2),
two P residues (Pn1/P2) (Pn2/P1), one S (Sn/S1) and one T (Tn1/T1). It is unclear whether those peaks
seen in both spectra represent the same residues in the sequence. There are also several E/Q residues
(E/Q1, E/Q2, E/Q3 in TOBSY) that probably also exist in both spectra, for example, E/Q2 in TOBSY is
very close to E18 in the CP‐based 13C‐13C correlation spectrum. However, most of these residues are
not located in the sequentially assigned β‐sheet region. If these overlapped peaks represent the same
residues in both spectra, it suggests these residues could be in two states, dynamic and rigid. The
average conformation of these dynamic residues could be the same as these residues in rigid state
upon the conformation becoming fixed. The results suggest that although a small part of H175 could
adopt β‐sheet conformation and be very rigid, the protein also has other structural components with
different dynamics.
INEPT‐based 2D TOBSY was also carried out for the sample prepared at pH 4.5 condition for
comparison (Figure S6A). By comparing the spectra of samples from pH 4.5 and pH 6.0, we found
the two spectra were similar only at some positions. Several peaks disappear for the pH 4.5 condition
(mostly Cα‐Cβ crosspeaks, Figure S6B). The results indicate that although the two samples have the
same β‐sheet segment and other rigid components, some other segments of protein could still be
different in the dynamics.
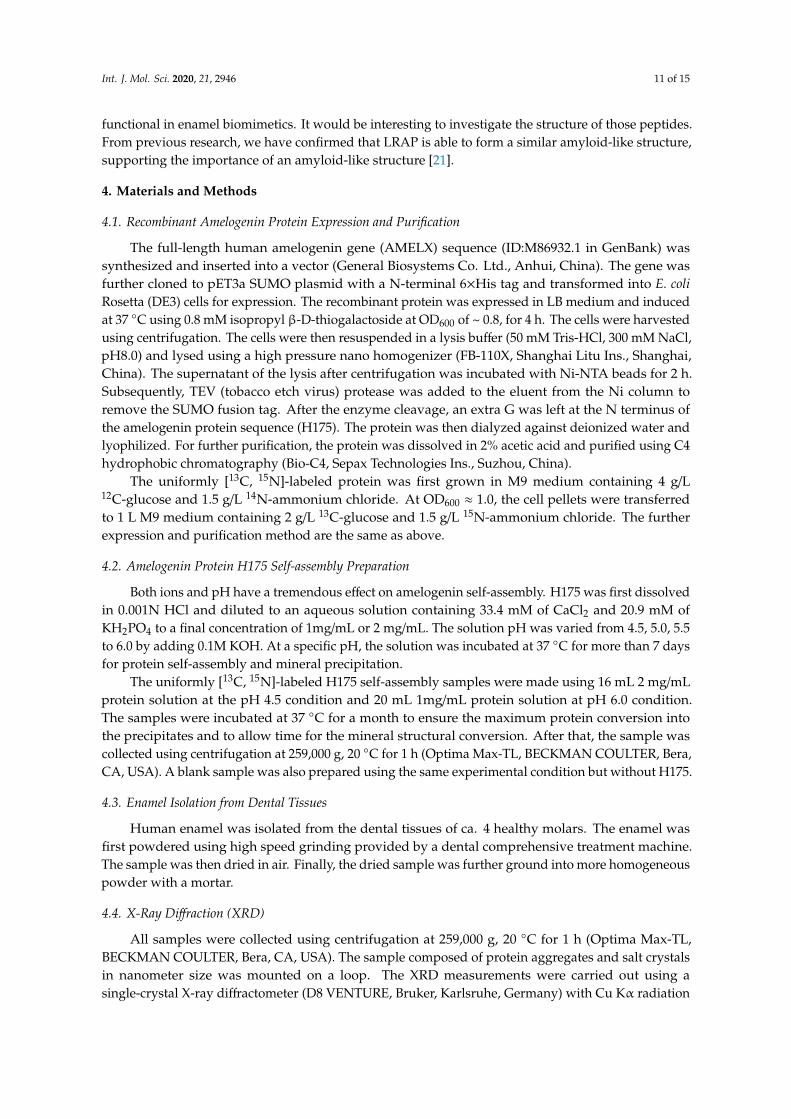
Figure 7. Secondary structure prediction based on the chemical shifts assignment of H175 self‐
assembly at pH 6.0. The sequence of H175 is displayed on the top, highlighting the sequentially
assigned sequence in red (18E ‐ 31P). (A) The calculated secondary chemical shifts (ΔCα‐ΔCβ) show the
Figure 7. Secondary structure prediction based on the chemical shifts assignment of H175 self-assemblyat pH 6.0. The sequence of H175 is displayed on the top, highlighting the sequentially assignedsequence in red (18E - 31P). (A) The calculated secondary chemical shifts (∆Cα-∆Cβ) show the negativevalues for the identified sequence. (B) Predicted protein dihedral angles ψ and ϕ using TALOS-N,indicating β-sheet secondary structures.

Int. J. Mol. Sci. 2020, 21, 2946 9 of 15
Besides the assigned β-sheet segment, there are some peaks clearly shown in both 13C-13C spectra(labeled in Figure 6A, C as An, In1, In2, Ln1, Ln2, Pn1, Pn2, Sn, Tn1, Vn1, Vn2). These peaks couldonly be labeled according to the residue type. This strongly supports that other rigid segments existbesides the β-strand region 18EVLTPLKWYQSI29. The chemical shift values of these peaks are listedin Table S2. The secondary chemical shifts were also calculated and showed mostly negative valuesor small absolute values close to 0, suggesting those residues could adopt β-sheet or random coilsecondary structures.
2.5. H175 has Other Structural Components beside β-amyloid
From the cross-polarization (CP)-based 13C-13C correlation spectrum, it can be concluded thatthe rigid segments in H175 assemblies at pH 6.0 contain more than the identified β-sheet sequence.However, many residues are still missing in the SSNMR spectra. In order to find the dynamicsegment of H175 assemblies at pH 6.0 condition, insensitive nuclei enhanced by polarization transfer(INEPT)-based 2D total through bond correlation spectroscopy (TOBSY) was carried out, showing asmall number of peaks too (Figure 8A). The assignment based on the residue type is listed in TableS2 for INEPT-TOBSY. Judging from the secondary chemical shifts value, those residues could alsoadopt β-sheet or random coil secondary structures. Considering only a limited number of residues areobserved using both CP-based and INEPT-based experiments, these results indicate a large number ofresidues in H175 assemblies are in disorder, or in motion with the intermediate timescale, invisiblefor NMR.
Int. J. Mol. Sci. 2019, 20, x FOR PEER REVIEW 10 of 15
negative values for the identified sequence. (B) Predicted protein dihedral angles ψ and φ using
TALOS‐N, indicating β‐sheet secondary structures.
Figure 8. (A) 2D 13C‐13C INEPT‐TOBSY spectrum of H175 assemblies formed at pH 6.0 using
uniformly [13C, 15N]‐labeled protein. (B) Comparison between 2D DARR spectrum (red) and 2D
INEPT‐TOBSY spectrum (blue) of H175 assemblies prepared at pH 6.0.
3. Discussion
Essential conditions for HAP formation
Our experiments were carried out in the presence of both calcium ions and phosphate ions.
Without the protein, the calcium phosphate mineral would start to precipitate at a slight acidic
condition, since Ca(H2PO4)2 is highly soluble and CaHPO4 is not soluble with Ksp = 10−6.90 [28]. The Ka2
of phosphoric acid is 10−7.21. At pH 6.0, there would be coexistence of both ions of [H(PO4)2‐] and
[H2(PO4)‐]. We observed a large amount of mineral precipitates formed at pH 6.0 and proved the main
component is brushite (CaHPO42H2O) using XRD and 31P NMR. This is consistent with the chemical
equilibrium prediction, and brushite could not be converted into other calcium phosphate forms after
4 weeks’ incubation. However, in the presence of H175, the mineral would be converted into HAP
[Ca5(PO4)3OH], which has much lower solubility with Ksp = 10−58.4 [28], and so far, how amelogenin
controls the mineral form is not fully understood.
The pH is also another important factor in determining the mineral precipitation. Although our
results indicate that the amyloid formation could happen in a big pH range (pH 4.5–6.0), the
precipitated mineral components could be very different. HAP could only form at pH 6.0. It has been
observed in many laboratories that amelogenin is functional in vitro in inducing HAP formation.
Most of the conditions used in the literature involving amelogenin are at near neutral pH (pH 7.4‐
7.6) with protein concentration at sub‐milligram/mL. This pH is just past pKa2 (7.21) of phosphoric
acid, therefore, more mineral precipitation would form. Our results clearly indicate that the pH value
is not necessarily so close to neutral. At pH 6.0, a slightly acid condition, HAP could still form with
the help of amelogenin. From NMR, the secondary structures for the rigid segment of H175
assemblies are the same at pH 4.5 and 6.0.
Could we draw the conclusion that amyloid‐like assemblies are functional in promoting HAP
formation? Although previous SSNMR studies have shown that amelogenin at functional conditions
have β‐sheet secondary structural components at some sites, the 2D 13C spectra of the uniformly 13C‐
labeled sample gave less information because of the low resolution and sensitivity [17]. With a higher
protein concentration (1–2 mg/mL), our experimental condition made it easier to collect the large
amount of protein assemblies needed for NMR study. Utilizing SSNMR, we were able to study the
Figure 8. (A) 2D 13C-13C INEPT-TOBSY spectrum of H175 assemblies formed at pH 6.0 using uniformly[13C, 15N]-labeled protein. (B) Comparison between 2D DARR spectrum (red) and 2D INEPT-TOBSYspectrum (blue) of H175 assemblies prepared at pH 6.0.
A further comparison between the CP-based 13C-13C correlation spectrum (Figure 6A) and INEPT-based TOBSY spectrum (Figure 8A) is shown in Figure 8B. To our surprise, there are several peaksshown in both spectra. These peaks with the matched chemical shifts within ±0.4 ppm include thecrosspeaks for one I (In1/I2), two L residues (Ln1/L1) (Ln2/L2), two V residues (Vn1/V1) (Vn2/V2),two P residues (Pn1/P2) (Pn2/P1), one S (Sn/S1) and one T (Tn1/T1). It is unclear whether those peaksseen in both spectra represent the same residues in the sequence. There are also several E/Q residues(E/Q1, E/Q2, E/Q3 in TOBSY) that probably also exist in both spectra, for example, E/Q2 in TOBSYis very close to E18 in the CP-based 13C-13C correlation spectrum. However, most of these residuesare not located in the sequentially assigned β-sheet region. If these overlapped peaks represent thesame residues in both spectra, it suggests these residues could be in two states, dynamic and rigid.

Int. J. Mol. Sci. 2020, 21, 2946 10 of 15
The average conformation of these dynamic residues could be the same as these residues in rigid stateupon the conformation becoming fixed. The results suggest that although a small part of H175 couldadopt β-sheet conformation and be very rigid, the protein also has other structural components withdifferent dynamics.
INEPT-based 2D TOBSY was also carried out for the sample prepared at pH 4.5 condition forcomparison (Figure S6A). By comparing the spectra of samples from pH 4.5 and pH 6.0, we found thetwo spectra were similar only at some positions. Several peaks disappear for the pH 4.5 condition(mostly Cα-Cβ crosspeaks, Figure S6B). The results indicate that although the two samples have thesame β-sheet segment and other rigid components, some other segments of protein could still bedifferent in the dynamics.
3. Discussion
Essential conditions for HAP formationOur experiments were carried out in the presence of both calcium ions and phosphate ions.
Without the protein, the calcium phosphate mineral would start to precipitate at a slight acidiccondition, since Ca(H2PO4)2 is highly soluble and CaHPO4 is not soluble with Ksp = 10−6.90 [28].The Ka2 of phosphoric acid is 10−7.21. At pH 6.0, there would be coexistence of both ions of [H(PO4)2-]and [H2(PO4)-]. We observed a large amount of mineral precipitates formed at pH 6.0 and proved themain component is brushite (CaHPO4·2H2O) using XRD and 31P NMR. This is consistent with thechemical equilibrium prediction, and brushite could not be converted into other calcium phosphateforms after 4 weeks’ incubation. However, in the presence of H175, the mineral would be convertedinto HAP [Ca5(PO4)3OH], which has much lower solubility with Ksp = 10−58.4 [28], and so far, howamelogenin controls the mineral form is not fully understood.
The pH is also another important factor in determining the mineral precipitation. Although ourresults indicate that the amyloid formation could happen in a big pH range (pH 4.5–6.0), the precipitatedmineral components could be very different. HAP could only form at pH 6.0. It has been observedin many laboratories that amelogenin is functional in vitro in inducing HAP formation. Most of theconditions used in the literature involving amelogenin are at near neutral pH (pH 7.4-7.6) with proteinconcentration at sub-milligram/mL. This pH is just past pKa2 (7.21) of phosphoric acid, therefore, moremineral precipitation would form. Our results clearly indicate that the pH value is not necessarily soclose to neutral. At pH 6.0, a slightly acid condition, HAP could still form with the help of amelogenin.From NMR, the secondary structures for the rigid segment of H175 assemblies are the same at pH 4.5and 6.0.
Could we draw the conclusion that amyloid-like assemblies are functional in promoting HAPformation? Although previous SSNMR studies have shown that amelogenin at functional conditionshave β-sheet secondary structural components at some sites, the 2D 13C spectra of the uniformly13C-labeled sample gave less information because of the low resolution and sensitivity [17]. With ahigher protein concentration (1–2 mg/mL), our experimental condition made it easier to collect the largeamount of protein assemblies needed for NMR study. Utilizing SSNMR, we were able to study thestructure of the mineral and the protein assembly at the same time using the same sample, providingan opportunity to study the functional state of the protein and its relationship with the minerals.Our SSNMR spectrum on uniformly 13C-labeled H175 shows a better resolution, indicating multiplestructure components including a β-sheet segment. However, the role of an amyloid-like structure indetermining HAP formation is still not conclusive. All the structural elements are important and playa role together in controlling HAP formation. Furthermore, the NMR signal is dominant for the biggerpopulation of the sample; it is still possible that two or more populations of protein assemblies existin the sample at pH 6.0. One population is dominant, containing the amyloid-like structure, whilethe other minor population with an unknown structure may play the real regulating role. A furtherinvestigation on amelogenin at other functional conditions is also needed to confirm the necessityof the amyloid-like structure in promoting HAP formation. Peptides derived from amelogenin are
Int. J. Mol. Sci. 2020, 21, 2946 11 of 15
functional in enamel biomimetics. It would be interesting to investigate the structure of those peptides.From previous research, we have confirmed that LRAP is able to form a similar amyloid-like structure,supporting the importance of an amyloid-like structure [21].
4. Materials and Methods
4.1. Recombinant Amelogenin Protein Expression and Purification
The full-length human amelogenin gene (AMELX) sequence (ID:M86932.1 in GenBank) wassynthesized and inserted into a vector (General Biosystems Co. Ltd., Anhui, China). The gene wasfurther cloned to pET3a SUMO plasmid with a N-terminal 6×His tag and transformed into E. coliRosetta (DE3) cells for expression. The recombinant protein was expressed in LB medium and inducedat 37 ◦C using 0.8 mM isopropyl β-D-thiogalactoside at OD600 of ~ 0.8, for 4 h. The cells were harvestedusing centrifugation. The cells were then resuspended in a lysis buffer (50 mM Tris-HCl, 300 mM NaCl,pH8.0) and lysed using a high pressure nano homogenizer (FB-110X, Shanghai Litu Ins., Shanghai,China). The supernatant of the lysis after centrifugation was incubated with Ni-NTA beads for 2 h.Subsequently, TEV (tobacco etch virus) protease was added to the eluent from the Ni column toremove the SUMO fusion tag. After the enzyme cleavage, an extra G was left at the N terminus ofthe amelogenin protein sequence (H175). The protein was then dialyzed against deionized water andlyophilized. For further purification, the protein was dissolved in 2% acetic acid and purified using C4hydrophobic chromatography (Bio-C4, Sepax Technologies Ins., Suzhou, China).
The uniformly [13C, 15N]-labeled protein was first grown in M9 medium containing 4 g/L12C-glucose and 1.5 g/L 14N-ammonium chloride. At OD600 ≈ 1.0, the cell pellets were transferredto 1 L M9 medium containing 2 g/L 13C-glucose and 1.5 g/L 15N-ammonium chloride. The furtherexpression and purification method are the same as above.
4.2. Amelogenin Protein H175 Self-assembly Preparation
Both ions and pH have a tremendous effect on amelogenin self-assembly. H175 was first dissolvedin 0.001N HCl and diluted to an aqueous solution containing 33.4 mM of CaCl2 and 20.9 mM ofKH2PO4 to a final concentration of 1mg/mL or 2 mg/mL. The solution pH was varied from 4.5, 5.0, 5.5to 6.0 by adding 0.1M KOH. At a specific pH, the solution was incubated at 37 ◦C for more than 7 daysfor protein self-assembly and mineral precipitation.
The uniformly [13C, 15N]-labeled H175 self-assembly samples were made using 16 mL 2 mg/mLprotein solution at the pH 4.5 condition and 20 mL 1mg/mL protein solution at pH 6.0 condition.The samples were incubated at 37 ◦C for a month to ensure the maximum protein conversion intothe precipitates and to allow time for the mineral structural conversion. After that, the sample wascollected using centrifugation at 259,000 g, 20 ◦C for 1 h (Optima Max-TL, BECKMAN COULTER, Bera,CA, USA). A blank sample was also prepared using the same experimental condition but without H175.
4.3. Enamel Isolation from Dental Tissues
Human enamel was isolated from the dental tissues of ca. 4 healthy molars. The enamel wasfirst powdered using high speed grinding provided by a dental comprehensive treatment machine.The sample was then dried in air. Finally, the dried sample was further ground into more homogeneouspowder with a mortar.
4.4. X-Ray Diffraction (XRD)
All samples were collected using centrifugation at 259,000 g, 20 ◦C for 1 h (Optima Max-TL,BECKMAN COULTER, Bera, CA, USA). The sample composed of protein aggregates and salt crystalsin nanometer size was mounted on a loop. The XRD measurements were carried out using asingle-crystal X-ray diffractometer (D8 VENTURE, Bruker, Karlsruhe, Germany) with Cu Kα radiation
Int. J. Mol. Sci. 2020, 21, 2946 12 of 15
(λ = 0.154184 nm) operating at an acceleration voltage of 50 kV and a current of 1 mA. The distancefrom crystal to detector was 50 mm with variable exposure time 20–60 s.
The sample diffraction was recorded at two temperatures, either 298 K or 150 K. For all samplesprepared at pH 4.5, pH 5.0 and pH 5.5 conditions and some samples prepared at pH 6.0, the diffractionwas measured at 298K, while for one sample prepared at pH 6.0 and the blank sample withoutprotein (shown in Figure S2), the diffraction was recorded at 150K to get better diffraction. The XRDimages were processed with the adxv.x86_64RHEL6 program (Scripps Research Institute, La Jolla, CA,USA). Then, the data were radially integrated and further processed with an X’Pert HighScore Plus(PANalytical B. V., Almelo, Netherlands) to be transformed into the powder pattern. The XRD of HAP,OCP and brushite were obtained from the Inorganic Crystal Structures Database (ICSD, FIZ KarlsruheGmbH, Germany).
4.5. Atomic Force Microscopy (AFM)
Aliquots (20 µL) of solution at different incubation periods were pipetted onto a freshly cleavedmica surface and kept for 30 min in a wet cell to avoid evaporation. Subsequently, the mica surface wasrinsed twice with 20 µL Milli-Q water by first keeping the water on the mica surface for 2 min and thenremoval of the water using a rubber suction bulb. AFM was carried out under the dry condition inthe tapping mode using Si cantilevers with a tip radius of 8–12 nm and 40 N/m force constant (modelRTESPA-300, Bruker, Camarillo, CA, USA) at about 300 kHz on a Dimension ICon AFM with a BrukerNanoscope V controller (Digital Instruments, Goleta, CA, USA).
4.6. Transmission Electron Microscopy (TEM)
5 µL of solution incubated for more than 7 days was taken out periodically and was analyzedusing TEM. The solution was first adsorbed onto a carbon-coated copper grid (300 meshes, BeijingZhongjingkeyi Technology Co., Ltd., Beijing, China) for 1 min, then blotted away using filter paper.Immediately after, the grid was washed with three drops of Milli-Q water. For negative staining, thegrid was stained with 5 µL of 2% uranyl acetate in water (w/v) for 10 s and dried quickly with filterpaper. To get a better staining effect, the grid was stained using another drop of 5 µL 2% uraniumacetate for 1 min and washed off with one drop of water again. Finally, the grid was air dried. The TEMimages were recorded on a Tecnai G2 Spirit Transmission Electron Microscope with an accelerationvoltage of 120 keV.
4.7. Magic Angle Spinning (MAS) Solid-State NMR Experiments
All NMR experiments were acquired on a 16.4 T (1H frequency, 700 MHz) Bruker AVANCE NEOspectrometer. 13C-13C and 13C-15N correlation spectra were collected with a 3.2 mm triple-resonanceHCN Bruker probe under 15 kHz MAS, while a 3.2 mm HCP MAS probe was utilized to perform all1H-31P experiments under the same MAS rates. 13C chemical shifts were externally referenced to DSSby setting a downfield 13C signal of adamantine to 40.48 ppm, and 15N chemical shifts were indirectlyreferenced to liquid ammonia (0 ppm). 31P chemical shifts were indirectly referenced to 85% H3PO4
(0 ppm) using the resonance frequency ratio 0.404807420. All the experiments were collected with a 2 srecycle delay.
2D 13C-13C DARR [29,30], INEPT-TOBSY [31,32], 15N-13C NCa, NCaCX, NCo, NCoCx and 3DNCaCx and NCoCx [33–37] spectra were acquired to get resonance assignments with the samplesprepared at pH 4.5 and pH 6.0 conditions. The sample temperature was set to 273 K for all the MASexperiments, except the 2D DARR and INEPT-TOBSY experiments for the sample at pH 4.5, wherethe temperature was set to 293 K. For both the samples at pH 4.5 and pH 6.0, the band-selectivetransfers [38] of NCa and NCo experiments were implemented with a contact time of 4 ~ 5.5 ms,while 15N (centered at 120 ppm) rf-field strengths were optimized to 5/2 ωr (37.5 kHz), and 13Ca(centered at 53 ppm) and 13Co (centered at 173 ppm) rf-field strengths were optimized to 3/2 ωr(22.5 kHz) and 7/2 ωr (52.5 kHz), respectively. 2D DARR spectra were recorded using a CP contact

Int. J. Mol. Sci. 2020, 21, 2946 13 of 15
time of 1.8 ms and 1H fields of 79.77 kHz. The mixing time was varied from 25 to 500 ms. During theacquisition, SPINAL-64 [39] 1H decoupling was applied with the 1H field strength of 83.3 kHz. The 2D13C-13C INEPT-TOBSY experiment was recorded with a TOBSY mixing time of 11.2 ms using the P91
6
mixing sequence.1D 1H-31P CP and 2D 1H-31P HETCOR [40] experiments were also performed for all the four
samples, which were the natural human enamels, H175 assemblies incubated at pH 4.5, H175 assembliesincubated at pH 6.0 and the blank sample incubated at pH 6.0 without proteins. All the measurementswere done at 288 K. The CP contact time was 1.5 ms with 1H fields of 75.85 kHz, and the 1H 90◦ pulsewas 3.2 µs. During the acquisition, SPINAL-64 [38] 1H decoupling was also applied with a 1H fieldstrength of 83.3 kHz.
All 2D spectra were processed using TopSpin 4.0.2 (Bruker Biospin, Rheinstetten, Germany)and apodized in all dimensions with a shifted sine-bell window function (SSB = 2). Subsequently,the spectra were analyzed in detail using Sparky.
Supplementary Materials: Supplementary materials can be found at http://www.mdpi.com/1422-0067/21/8/2946/s1.
Author Contributions: Conceptualization, J.L., J.Z. and C.M.; investigation, J.L., J.Z., J.W. and C.M.;writing—original draft preparation, J.L. and J.Z. All authors have read and agreed to the published version ofthe manuscript.
Funding: The work is supported by grants from the National Science Foundation of China (No. 31770790 to J.L.),and from Yangfan program of Shanghai municipal government (19YF1433500 to J.W.).
Acknowledgments: We would like to thank the Biomolecular NMR Facility at the School of Life Science andTechnology, ShanghaiTech University for SSNMR studies and the Molecular and Cellular Biology Core Facility forFPLC, ultracentrifugation instrumentation. TEM images were taken at the Bio-Electron Microscopy Facility ofShanghaiTech University. The authors would also like to thank the support from the Analytical InstrumentationCenter (contract no. SPST-AIC 10112914), the School of Physical Science and Technology at ShanghaiTechUniversity. We thank Na Yu for single-crystal crystallography and Xin-yan Wang for AFM.
Conflicts of Interest: The authors declare no conflicts of interest. The funders had no role in the design of thestudy; in the collection, analyses, or interpretation of data; in the writing of the manuscript, or in the decision topublish the results.
Abbreviations
HAP hydroxyapatiteOCP octacalcium phosphateXRD x-ray diffractionSSNMR solid-state NMRHETCOR heteronuclear correlationAFM atomic force microscopeTEM transmission electron microscopeLRAP leucine-rich amelogenin peptideCP cross-polarizationTEVINEPTTOBSY
tobacco etch virusinsensitive nuclei enhanced by polarization transfertotal through bond correlation spectroscopy
References
1. Skinner, H.C.W.; Jahren, A.H. Biomineralization. Treatise Geochem. 2003, 8, 117–184.2. Moradian-Oldak, J. The regeneration of tooth enamel. Dimens Dent. Hyg. 2009, 7, 12–15. [PubMed]3. Simmer, J.P.; Fincham, A.G. Molecular Mechanisms of Dental Enamel Formation. Crit. Rev. Oral. Biol. Med.
1995, 6, 84–108. [CrossRef] [PubMed]4. Gadhia, K.; McDonald, S.; Arkutu, N.; Malik, K. Amelogenesis imperfecta: An introduction. Br. Dent. J.
2012, 212, 377–379. [CrossRef] [PubMed]

Int. J. Mol. Sci. 2020, 21, 2946 14 of 15
5. Gibson, C.W.; Yuan, Z.A.; Hall, B.; Longenecker, G.; Chen, E.; Thyagarajan, T.; Sreenath, T.; Wright, J.T.;Decker, S.; Piddington, R.; et al. Amelogenin-deficient mice display an amelogenesis imperfecta phenotype.J. Biol. Chem. 2001, 276, 31871–31875. [CrossRef] [PubMed]
6. Ruan, Q.; Moradian-Oldak, J. Amelogenin and Enamel Biomimetics. J. Mater. Chem. B 2015, 3, 3112–3129.[CrossRef] [PubMed]
7. Fan, Y.; Sun, Z.; Moradian-Oldak, J. Controlled remineralization of enamel in the presence of amelogeninand fluoride. Biomaterials 2009, 30, 478–483. [CrossRef]
8. Kwak, S.Y.; Litman, A.; Margolis, H.C.; Yamakoshi, Y.; Simmer, J.P. Biomimetic Enamel RegenerationMediated by Leucine-Rich Amelogenin Peptide. J. Dent. Res. 2017, 96, 524–530. [CrossRef]
9. Dogan, S.; Fong, H.; Yucesoy, D.T.; Cousin, T.; Gresswell, C.; Dag, S.; Huang, G.; Sarikaya, M. BiomimeticTooth Repair: Amelogenin-Derived Peptide Enables in Vitro Remineralization of Human Enamel. ACSBiomater. Sci. Eng. 2018, 4, 1788–1796. [CrossRef]
10. Buchko, G.W.; Tarasevich, B.J.; Bekhazi, J.; Snead, M.L.; Shaw, W.J. A solution NMR investigation into theearly events of amelogenin nanosphere self-assembly initiated with sodium chloride or calcium chloride.Biochemistry 2008, 47, 13215–13222. [CrossRef]
11. Fincham, A.G.; Moradian-Oldak, J.; Simmer, J.P.; Sarte, P.; Lau, E.C.; Dieswisch, T.; Slavkin, H.C. Self-assemblyof a recombinant amelogenin protein generates supramolecular structures. J. Struct. Biol. 1994, 112, 103–109.[CrossRef] [PubMed]
12. Yang, X.; Sun, Z.; Ma, R.; Fan, D.; Moradian-Oldak, J. Amelogenin “nanorods” formation during proteolysisby Mmp-20. J. Struct Biol. 2011, 176, 220–228. [CrossRef] [PubMed]
13. Engelberth, S.A.; Bacino, M.S.; Sandhu, S.; Li, W.; Bonde, J.; Habelitz, S. Progression of Self-Assembly ofAmelogenin Protein Supramolecular Structures in Simulated Enamel Fluid. Biomacromolecules 2018, 19,3917–3924. [CrossRef] [PubMed]
14. Fincham, A.G.; Moradian-Oldak, J.; Diekwisch, T.G.H.; Lyaruu, D.M.; Wright, J.T.; Bringas, P.J.; Slavkin, H.C.Evidence for Amelogenin “nanospheres” as functional components of secretory-stage enamel matrix. J.Struct Biol. 1995, 115, 50–59. [CrossRef]
15. Jodaikin, A.; Traub, W.; Weiner, S. Protein conformation in rat tooth enamel. Arch. Oral. Biol. 1986, 31,685–689. [CrossRef]
16. Carneiro, K.M.; Zhai, H.; Zhu, L.; Horst, J.A.; Sitlin, M.; Nguyen, M.; Wagner, M.; Simpliciano, C.; Milder, M.;Chen, C.L.; et al. Amyloid-like ribbons of amelogenins in enamel mineralization. Sci. Rep. 2016, 6, 23105.[CrossRef]
17. Lu, J.X.; Xu, Y.S.; Buchko, G.W.; Shaw, W.J. Mineral association changes the secondary structure and dynamicsof murine amelogenin. J. Dent. Res. 2013, 92, 1000–1004. [CrossRef]
18. Lacruz, R.S.; Habelitz, S.; Wright, J.T.; Paine, M.L. Dental Enamel Formation and Implications for Oral Healthand Disease. Physiol. Rev. 2017, 97, 939–993. [CrossRef]
19. Martinez-Avila, O.M.; Wu, S.; Cheng, Y.; Lee, R.; Khan, F.; Habelitz, S. Self-assembly of amelogenin proteinsat the water-oil interface. Eur. J. Oral. Sci. 2011, 119 (Suppl. 1), 75–82. [CrossRef]
20. He, X.; Wu, S.; Martinez-Avila, O.; Cheng, Y.; Habelitz, S. Self-aligning amelogenin nanoribbons in oil-watersystem. J. Struct Biol. 2011, 174, 203–212. [CrossRef]
21. Ma, C.W.; Zhang, J.; Dong, X.Q.; Lu, J.X. Amyloid structure of high-order assembly of Leucine-rich amelogeninrevealed by solid-state NMR. J. Struct Biol. 2019, 206, 29–35. [CrossRef] [PubMed]
22. Sanii, B.; Martinez-Avila, O.; Simpliciano, C.; Zuckermann, R.N.; Habelitz, S. Matching 4.7-angstrom XRDSpacing in Amelogenin Nanoribbons and Enamel Matrix. J. Dent. Res. 2014, 93, 918–922. [CrossRef][PubMed]
23. Maji, S.K.; Wang, L.; Greenwald, J.; Riek, R. Structure-activity relationship of amyloid fibrils. Febs. Lett. 2009,583, 2610–2617. [CrossRef] [PubMed]
24. Yesinowski, J.P.; Eckert, H. Hydrogen Environments in Calcium Phosphates:1H MAS NMR at High SpinningSpeeds. J. Am. Chem. Soc. 1987, 109, 6274–6282. [CrossRef]
25. Leroy, C.; Aussenac, F.; Bonhomme-Coury, L.; Osaka, A.; Hayakawa, S.; Babonneau, F.; Coelho-Diogo, C.;Bonhomme, C. Hydroxyapatites: Key Structural Questions and Answers from Dynamic Nuclear Polarization.Anal. Chem. 2017, 89, 10201–10207. [CrossRef]
26. Cho, G.; Wu, Y.; Ackerman, J.L. Detection of hydroxyl ions in bone mineral by solid-state NMR spectroscopy.Science 2003, 300, 1123–1127. [CrossRef]

Int. J. Mol. Sci. 2020, 21, 2946 15 of 15
27. Shen, Y.; Bax, A. Protein backbone and sidechain torsion angles predicted from NMR chemical shifts usingartificial neural networks. J. Biomol. NMR 2013, 56, 227–241. [CrossRef]
28. Chow, L.C. Solubility of calcium phosphates. Monogr. Oral. Sci. 2001, 18, 94–111.29. Tarasevich, B.J.; Lea, S.; Bernt, W.; Engelhard, M.; Shaw, W.J. Adsorption of amelogenin onto self-assembled
and fluoroapatite surfaces. J. Phys. Chem. B 2009, 113, 1833–1842. [CrossRef]30. Tarasevich, B.J.; Lea, S.; Bernt, W.; Engelhard, M.H.; Shaw, W.J. Changes in the quaternary structure of
amelogenin when adsorbed onto surfaces. Biopolymers 2009, 91, 103–107. [CrossRef]31. Baldus, M.; Meier, B.H. Total Correlation Spectroscopy in the Solid State. The Use of Scalar Couplings to
Determine the Through-Bond Connectivity. J. Magn. Reson. 1996, 121, 65–69. [CrossRef]32. Baldus, M.; Iuliucci, R.J.; Meier, B.H. Probing Through-Bond Connectivities and Through-Space Distances
in Solids by Magic-Angle-Spinning Nuclear Magnetic Resonance. J. Am. Chem. Soc. 1997, 119, 1121–1124.[CrossRef]
33. Pauli, J.; Baldus, M.; van Rossum, B.; de Groot, H.; Oschkinat, H. Backbone and side-chain 13C and 15Nsignal assignments of the alpha-spectrin SH3 domain by magic angle spinning solid-state NMR at 17.6 Tesla.Chembiochem 2001, 2, 272–281. [CrossRef]
34. Igumenova, T.I.; Wand, A.J.; McDermott, A.E. Assignment of the backbone resonances for microcrystallineubiquitin. J. Am. Chem. Soc. 2004, 126, 5323–5331. [CrossRef]
35. Marulanda, D.; Tasayco, M.L.; McDermott, A.; Cataldi, M.; Arriaran, V.; Polenova, T. Magic angle spinningsolid-state NMR spectroscopy for structural studies of protein interfaces. resonance assignments ofdifferentially enriched Escherichia coli thioredoxin reassembled by fragment complementation. J. Am. Chem.Soc. 2004, 126, 16608–16620. [CrossRef]
36. Shi, L.; Ahmed, M.A.; Zhang, W.; Whited, G.; Brown, L.S.; Ladizhansky, V. Three-dimensional solid-stateNMR study of a seven-helical integral membrane proton pump–structural insights. J. Mol. Biol. 2009, 386,1078–1093. [CrossRef]
37. Sperling, L.J.; Berthold, D.A.; Sasser, T.L.; Jeisy-Scott, V.; Rienstra, C.M. Assignment strategies for largeproteins by magic-angle spinning NMR: The 21-kDa disulfide-bond-forming enzyme DsbA. J. Mol. Biol.2010, 399, 268–282. [CrossRef]
38. Baldus, M.; Petkova, A.T.; Herzfeld, J.; Griffin, R.G. Cross polarization in the tilted frame: Assignment andspectral simplification in heteronuclear spin systems. Mol. Phys. 1998, 95, 1197–1207. [CrossRef]
39. Fung, B.M.; Khitrin, A.K.; Ermolaev, K. An improved broadband decoupling sequence for liquid crystals andsolids. J. Magn. Reson. 2000, 142, 97–101. [CrossRef]
40. Mathew, R.; Gunawidjaja, P.N.; Izquierdo-Barba, I.; Jansson, K.; Garcia, A.; Arcos, D.; Vallet-Regi, M.;Eden, M. Solid-State P and H NMR Investigations of Amorphous and Crystalline Calcium PhosphatesGrown Biomimetically From a Mesoporous Bioactive Glass. J. Phys. Chem. C Nanomater. Interfaces 2011, 115,20572–20582. [CrossRef]
© 2020 by the authors. Licensee MDPI, Basel, Switzerland. This article is an open accessarticle distributed under the terms and conditions of the Creative Commons Attribution(CC BY) license (http://creativecommons.org/licenses/by/4.0/).