
Hydrothermal Sintering and Oxidation of an Alumina ...
17
catalysts Article Hydrothermal Sintering and Oxidation of an Alumina-Supported Nickel Methanation Catalyst Studied Using In Situ Magnetometry Malebelo Maphutha, Dominic de Oliveira , Thulani M. Nyathi , Mohamed I. Fadlalla , Robert Henkel, Nico Fischer and Michael Claeys * Citation: Maphutha, M.; de Oliveira, D.; Nyathi, T.M.; Fadlalla, M.I.; Henkel, R.; Fischer, N.; Claeys, M. Hydrothermal Sintering and Oxidation of an Alumina-Supported Nickel Methanation Catalyst Studied Using In Situ Magnetometry. Catalysts 2021, 11, 636. https://doi.org/ 10.3390/catal11050636 Academic Editor: Manfred Erwin Schuster Received: 22 April 2021 Accepted: 13 May 2021 Published: 16 May 2021 Publisher’s Note: MDPI stays neutral with regard to jurisdictional claims in published maps and institutional affil- iations. Copyright: © 2021 by the authors. Licensee MDPI, Basel, Switzerland. This article is an open access article distributed under the terms and conditions of the Creative Commons Attribution (CC BY) license (https:// creativecommons.org/licenses/by/ 4.0/). Catalysis Institute and c*change (DSI-NRF Centre of Excellence in Catalysis), Department of Chemical Engineering, University of Cape Town, Rondebosch 7701, South Africa; [email protected] (M.M.); [email protected] (D.d.O.); [email protected] (T.M.N.); [email protected] (M.I.F.); [email protected] (R.H.); nico.fi[email protected] (N.F.) * Correspondence: [email protected] Abstract: The presented study investigated the effects of temperature (350–650 ◦ C) and gas environ- ment (pure Ar versus aH 2 O/H 2 partial pressure ratio (P H2O /P H2 ) of 5) on the extent of sintering and oxidation of Al 2 O 3 -supported Ni 0 nanoparticles (≈4 nm). We note that a P H2O /P H2 of 5 corresponds to a simulated CO conversion of 94% during methanation. Sintering and oxidation were studied using in situ magnetometry, while ex situ TEM analyses confirmed the particle sizes before and after the magnetometry-based experiments. It was found that increasing the temperature from 350 to 650 ◦ C in Ar at atmospheric pressure causes a negligible change to the average size and degree of reduction (DOR) of the starting Ni 0 nanoparticles. However, studying the same temperature window under hydrothermal conditions at 10 bar causes significant particle growth (≈9 nm) and the development of a bimodal distribution. Furthermore, the presence of steam decreases the DOR of Ni 0 from 86.2% after initial activation to 22.2% due to oxidation. In summary, this study reports on the expected sintering and oxidation of Ni-based catalysts under high CO conversion condi- tions at elevated temperatures during methanation. Importantly, we were able to demonstrate how magnetometry-based analyses can provide similar size information (and changes thereof) as those observed with TEM but with the added advantage that this information can be obtained in situ. Keywords: CO methanation; Ni/Al 2 O 3 catalyst; hydrothermal sintering; particle size distribution; hydrothermal oxidation; in situ magnetometry 1. Introduction Oil is currently the main source of fuels and chemicals worldwide; however, due to the depleting oil reserves, there is great research effort focused on the development of new, sustainable, and environmentally friendly fuel sources and/or processes. Natural gas (mainly methane) is a possible fuel source due to its combustion efficiency, clean nature, and high calorific value [1]. Synthetic/substitute natural gas (SNG) can be produced from biomass [2], coal gasification to syngas (i.e., a mixture of carbon monoxide (CO) and hydrogen (H 2 )) [3], coke oven gas [4], as well as carbon dioxide (CO 2 ) and carbon monoxide (CO) methanation [1,5]. The latter process is a key step in the production of natural gas, and it can be carried out over noble metals (e.g., palladium (Pd), iridium (Ir), platinum (Pt), and ruthenium (Ru)) [6–8] and base metals (e.g., nickel (Ni), iron (Fe), cobalt (Co), and molybdenum (Mo)) [6,7,9,10]. Due to the economic infeasibility of an industrial application of noble metal-based catalysts in the CO methanation process, extensive re- search is focused on the use of Ni-based catalysts due to their high activity, selectivity, and affordability [1,11,12]. However, since CO methanation is a highly exothermic reaction (see Equation (1))—resulting in the formation of hotspots along the catalyst bed—the formation Catalysts 2021, 11, 636. https://doi.org/10.3390/catal11050636 https://www.mdpi.com/journal/catalysts
Transcript of Hydrothermal Sintering and Oxidation of an Alumina ...

catalysts
Article
Hydrothermal Sintering and Oxidation of anAlumina-Supported Nickel Methanation Catalyst StudiedUsing In Situ Magnetometry
Malebelo Maphutha, Dominic de Oliveira , Thulani M. Nyathi , Mohamed I. Fadlalla , Robert Henkel,Nico Fischer and Michael Claeys *
�����������������
Citation: Maphutha, M.; de Oliveira,
D.; Nyathi, T.M.; Fadlalla, M.I.;
Henkel, R.; Fischer, N.; Claeys, M.
Hydrothermal Sintering and
Oxidation of an Alumina-Supported
Nickel Methanation Catalyst Studied
Using In Situ Magnetometry. Catalysts
2021, 11, 636. https://doi.org/
10.3390/catal11050636
Academic Editor: Manfred
Erwin Schuster
Received: 22 April 2021
Accepted: 13 May 2021
Published: 16 May 2021
Publisher’s Note: MDPI stays neutral
with regard to jurisdictional claims in
published maps and institutional affil-
iations.
Copyright: © 2021 by the authors.
Licensee MDPI, Basel, Switzerland.
This article is an open access article
distributed under the terms and
conditions of the Creative Commons
Attribution (CC BY) license (https://
creativecommons.org/licenses/by/
4.0/).
Catalysis Institute and c*change (DSI-NRF Centre of Excellence in Catalysis), Department of ChemicalEngineering, University of Cape Town, Rondebosch 7701, South Africa; [email protected] (M.M.);[email protected] (D.d.O.); [email protected] (T.M.N.); [email protected] (M.I.F.);[email protected] (R.H.); [email protected] (N.F.)* Correspondence: [email protected]
Abstract: The presented study investigated the effects of temperature (350–650 ◦C) and gas environ-ment (pure Ar versus a H2O/H2 partial pressure ratio (PH2O/PH2) of 5) on the extent of sintering andoxidation of Al2O3-supported Ni0 nanoparticles (≈4 nm). We note that a PH2O/PH2 of 5 correspondsto a simulated CO conversion of 94% during methanation. Sintering and oxidation were studiedusing in situ magnetometry, while ex situ TEM analyses confirmed the particle sizes before and afterthe magnetometry-based experiments. It was found that increasing the temperature from 350 to650 ◦C in Ar at atmospheric pressure causes a negligible change to the average size and degreeof reduction (DOR) of the starting Ni0 nanoparticles. However, studying the same temperaturewindow under hydrothermal conditions at 10 bar causes significant particle growth (≈9 nm) andthe development of a bimodal distribution. Furthermore, the presence of steam decreases the DORof Ni0 from 86.2% after initial activation to 22.2% due to oxidation. In summary, this study reportson the expected sintering and oxidation of Ni-based catalysts under high CO conversion condi-tions at elevated temperatures during methanation. Importantly, we were able to demonstrate howmagnetometry-based analyses can provide similar size information (and changes thereof) as thoseobserved with TEM but with the added advantage that this information can be obtained in situ.
Keywords: CO methanation; Ni/Al2O3 catalyst; hydrothermal sintering; particle size distribution;hydrothermal oxidation; in situ magnetometry
1. Introduction
Oil is currently the main source of fuels and chemicals worldwide; however, due tothe depleting oil reserves, there is great research effort focused on the development ofnew, sustainable, and environmentally friendly fuel sources and/or processes. Natural gas(mainly methane) is a possible fuel source due to its combustion efficiency, clean nature,and high calorific value [1]. Synthetic/substitute natural gas (SNG) can be producedfrom biomass [2], coal gasification to syngas (i.e., a mixture of carbon monoxide (CO)and hydrogen (H2)) [3], coke oven gas [4], as well as carbon dioxide (CO2) and carbonmonoxide (CO) methanation [1,5]. The latter process is a key step in the production ofnatural gas, and it can be carried out over noble metals (e.g., palladium (Pd), iridium (Ir),platinum (Pt), and ruthenium (Ru)) [6–8] and base metals (e.g., nickel (Ni), iron (Fe), cobalt(Co), and molybdenum (Mo)) [6,7,9,10]. Due to the economic infeasibility of an industrialapplication of noble metal-based catalysts in the CO methanation process, extensive re-search is focused on the use of Ni-based catalysts due to their high activity, selectivity, andaffordability [1,11,12]. However, since CO methanation is a highly exothermic reaction (seeEquation (1))—resulting in the formation of hotspots along the catalyst bed—the formation
Catalysts 2021, 11, 636. https://doi.org/10.3390/catal11050636 https://www.mdpi.com/journal/catalysts

Catalysts 2021, 11, 636 2 of 17
of carbonaceous material (i.e., coke), particle growth (i.e., sintering) and oxidation of theNi particles becomes more facile [1].
CO(g) + 3H2(g)→ CH4(g) + H2O(g) ∆Ho298.15 K = −206.2 kJ/mol (1)
Sintering is a structural modification of the active surface leading to the loss of activesites [13]. Two main sintering mechanisms are proposed in the literature: (i) atomicmigration, where atoms detach from one crystallite, and thereafter, migrate and attach toanother crystallite, and (ii) crystallite migration, where whole crystallites migrate over thesupport and coalesce [14,15]. These two mechanisms are temperature dependent, wheresintering via atomic migration can be expected to take place when the process temperaturereaches the so-called Hüttig temperature (THüttig (K) = 0.3·(Tmetal melting (K)), while sinteringvia crystallite migration can be expected at the so-called Tamman temperature (TTamman(K) = 0.5·Tmetal melting (K)). It is important to note that the calculation of THüttig and TTammanis normally based on the melting point of the bulk metal; however, a decrease in the meltingpoint is expected when the crystallite size of the metal decreases, which is predicted by theGibbs–Thomson correlation [16]. Therefore, the sintering of relatively small crystallites canbe expected to take place below the THüttig and TTamman calculated for bulk metals. Thiscatalyst deactivation mechanism is thought to be the main route for the loss of activityover Ni-based catalysts during CO methanation [17–19]. The reaction is typically carriedout in the temperature range of 250–700 ◦C [20], and due to this wide operating range,which covers both the THüttig and TTamman for Ni, it is important to determine the effect oftemperature on the sintering of the catalyst nanoparticles. CO methanation over Ni-basedcatalysts is operated above 250 ◦C, since below 230 ◦C, Ni-carbonyl species are formedand can be transferred from one particle to another, which also contributes to the sinteringprocess [21]. Therefore, different approaches are taken to prevent or limit the sintering ofNi crystallites during this catalytic process. These approaches include strengthening thenanoparticle–support interaction via the use of suitable supports and promoters [10,12],and the confinement of the Ni crystallites in the pores of a mesoporous support, whichconsequently limits the migration of the crystallites on the support [1,11,22].
Regarding Ni oxidation as a deactivation mechanism, the equivalent oxidation poten-tial has to be reached in the presence of a mixture of an oxidising (e.g., H2O) and reducingagent (e.g., H2) in order for the oxidation of Ni particles to occur. This effect is dependenton the crystallite size and the nature of the nanoparticle–support interaction [14,23–25].van Steen et al. [26] determined the thermodynamic threshold for the oxidation of Conanoparticles as a function of the Co crystallite domain size, morphology, starting crystalphase, and importantly, the H2O/H2 partial pressure ratio (PH2O/PH2), which representsconversion. The results from their calculations clearly demonstrated the ease at which theoxidation of small Co crystallites occurs, while the larger Co crystallites only oxidise at highPH2O/PH2. Sehested et al. [27] studied the influence of different steam reforming reactionparameters (i.e., time, atmosphere, and temperature), as well as catalyst composition (i.e.,Ni–support interaction and dopants) on the sintering of Ni particles. Their results showedthat high PH2O/PH2 result in a faster Ni sintering rate, which is attributed to the forma-tion of a Ni-(OH)x species. The authors also reported the formation of nickel aluminate(NiAl2O4) and nickel oxide (NiO) at high temperatures and PH2O/PH2. Champon et al. [28]showed that an increase in the H2O/H2 ratio results in increased sintering of Ni, whichwas successfully modelled by a generalised power-law expression.
Claeys et al. [15,29,30] studied the sintering of Co-based Fischer–Tropsch (FT) catalystsunder industrially relevant conditions using an in-house developed in situ magnetometer.One of the studies [15] demonstrated that the sintering of Co particles takes place when thereaction environment consists of high CO and H2O partial pressures, and that the particlegrowth occurs due to the migration of Co sub-carbonyl species over the hydroxylatedsupport. Another study from the group [30] showed irreversible deactivation of a Co-basedcatalyst under high H2O partial pressures due to oxidation and sintering of the oxidisedCo particles via migration and coalescence. Since the use of the in situ magnetometer

Catalysts 2021, 11, 636 3 of 17
allows for studying catalysts under industrially relevant reaction conditions, we opted toinvestigate the effect of a simulated CO methanation reaction environment (i.e., PH2O/PH2)on the sintering and oxidation of Al2O3-supported Ni nanoparticles. The experiments wereconducted under (i) different temperatures (350, 450, 550, and 650 ◦C) and (ii) different gasenvironments (pure Ar, and a PH2O/PH2 of 5). The chosen PH2O/PH2 of 5 corresponds to aCO conversion level of 94% during methanation. It should be noted that these conversionlevels in CO hydrogenation are only attainable at the two lower temperatures (350 and450 ◦C) applied in this study as the reaction is thermodynamically limited. Nonetheless,the same hydrothermal conditions were applied at the two high reaction temperatureswhere maximum theoretical conversions are 90% (550 ◦C) and 75% (650 ◦C), respectively.The Ni crystallite size distribution (and changes thereof) is determined via the Langevinmethod for superparamagnetic materials, as well as transmission electron microscopy(TEM) analysis.
2. Results and Discussion2.1. Ex Situ PXRD and TEM
The Ni-loaded Al2O3 support obtained after drying at 100 ◦C was analysed usingPXRD; however, the obtained diffraction pattern (in Figure S1) shows no reflexes fromNiO or NiAl2O4. The only reflexes observed are those from the Al2O3 support. This couldbe a result of the low-targeted Ni loading of 4 wt% and/or the amorphous nature of theNi-based phases caused by the low-temperature drying. As described in Section 3.1, thedried impregnated support was reduced in hydrogen at 500 ◦C, and thereafter, it wasexposed to different temperatures (350, 450, 550, and 650 ◦C) and different gas environ-ments (pure Ar at atmospheric pressure, and a PH2O/PH2 of 5 at 10 bar). Then, ex situTEM analysis was performed on the (passivated) reduced and spent samples obtainedafter the tests conducted in the in situ magnetometer at 650 ◦C in an Ar and a H2O/H2atmosphere, respectively.
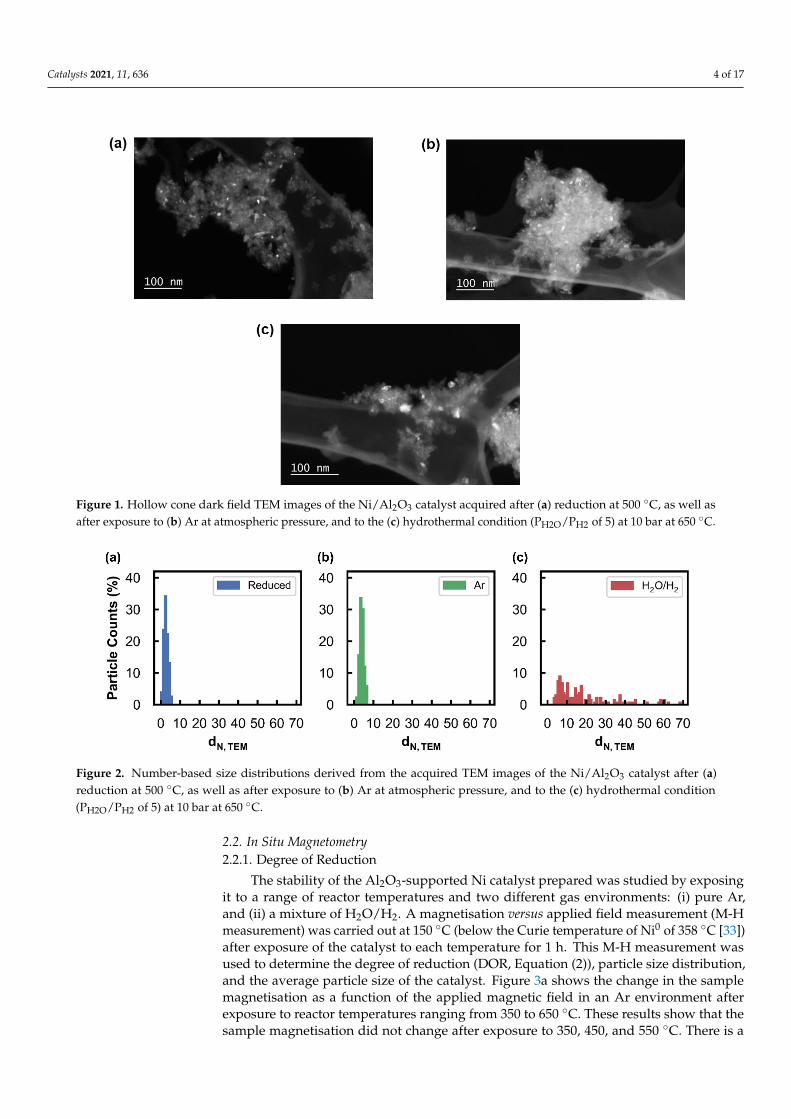
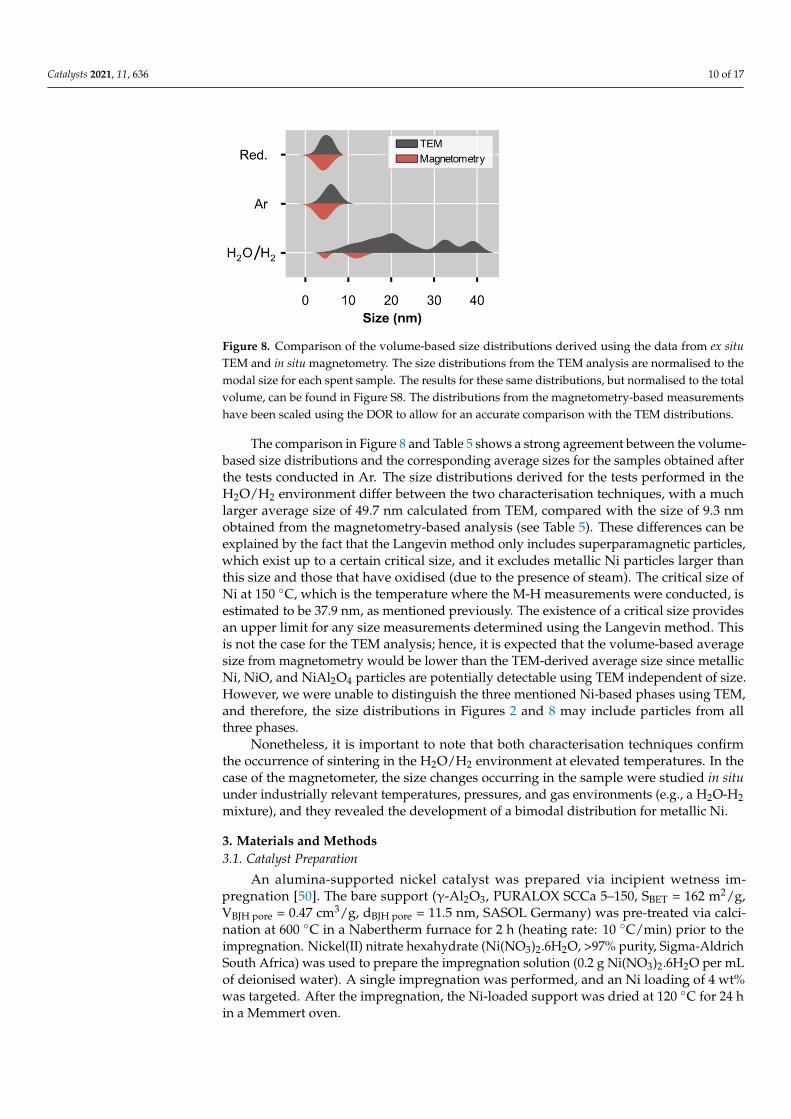
Figure 1 shows the TEM images acquired, Figure 2 shows the derived number-basedsize distributions, and Table 1 summarises the number-based average particle sizes (andassociated standard deviations). Figure 1a indicates that the reduced sample has relativelysmall Ni particles, which is also confirmed by the average size of 2.7 ± 1.1 nm (Table 1).After exposing the reduced catalyst to different temperatures in an Ar atmosphere, itcan be observed that the particles show no significant growth (Figure 2b) and as a result,they exhibit an average size of 4.0 ± 1.1 nm, which is similar to the size obtained forthe reduced catalyst. The sintering resistance of the Ni particles during this experimentmay be a result of the stabilising effect from the Al2O3 support through the existenceof strong nanoparticle–support interactions [31]. However, after exposing the freshlyreduced catalyst to a steam/hydrogen atmosphere, significant particle growth is observed(Figure 2c), up to an average crystallite size of 18.9 ± 15.3 nm. Furthermore, the wide sizedistribution of this spent sample shows the presence of a few particles that are in the rangeof 20–70 nm. This particle growth can be attributed to the combination of the high H2Oconcentration and the high reaction temperatures reached, which has also been reportedfor other metal-based catalysts [32].
Table 1. Summary of the number-based average particle sizes and standard deviations derived fromTEM analysis.
Condition dn, TEM(nm)
Post-reduction at 500 ◦C, atmospheric pressure 2.7 ± 1.1Post-exposure to Ar at 650 ◦C, atmospheric pressure 4.0 ± 1.1
Post-exposure to PH2O/PH2 = 5 at 650 ◦C, 10 bar 18.9 ± 15.3
Catalysts 2021, 11, 636 4 of 17Catalysts 2021, 11, x FOR PEER REVIEW 4 of 18
Figure 1. Hollow cone dark field TEM images of the Ni/Al2O3 catalyst acquired after (a) reduction at 500 °C, as well as
after exposure to (b) Ar at atmospheric pressure, and to the (c) hydrothermal condition (PH2O/PH2 of 5) at 10 bar at 650 °C.
Figure 2. Number-based size distributions derived from the acquired TEM images of the Ni/Al2O3 catalyst after (a) reduc-
tion at 500 °C, as well as after exposure to (b) Ar at atmospheric pressure, and to the (c) hydrothermal condition (PH2O/PH2
of 5) at 10 bar at 650 °C.
Table 1. Summary of the number-based average particle sizes and standard deviations de-
rived from TEM analysis.
Condition dn, TEM
(nm)
Post-reduction at 500 °C, atmospheric pressure 2.7 ± 1.1
Post-exposure to Ar at 650 °C, atmospheric pressure 4.0 ± 1.1
Post-exposure to PH2O/PH2 = 5 at 650 °C, 10 bar 18.9 ± 15.3
2.2. In situ Magnetometry.
2.2.1. Degree of Reduction
Figure 1. Hollow cone dark field TEM images of the Ni/Al2O3 catalyst acquired after (a) reduction at 500 ◦C, as well asafter exposure to (b) Ar at atmospheric pressure, and to the (c) hydrothermal condition (PH2O/PH2 of 5) at 10 bar at 650 ◦C.
Catalysts 2021, 11, x FOR PEER REVIEW 4 of 18
Figure 1. Hollow cone dark field TEM images of the Ni/Al2O3 catalyst acquired after (a) reduction at 500 °C, as well as
after exposure to (b) Ar at atmospheric pressure, and to the (c) hydrothermal condition (PH2O/PH2 of 5) at 10 bar at 650 °C.
Figure 2. Number-based size distributions derived from the acquired TEM images of the Ni/Al2O3 catalyst after (a) reduc-
tion at 500 °C, as well as after exposure to (b) Ar at atmospheric pressure, and to the (c) hydrothermal condition (PH2O/PH2
of 5) at 10 bar at 650 °C.
Table 1. Summary of the number-based average particle sizes and standard deviations de-
rived from TEM analysis.
Condition dn, TEM
(nm)
Post-reduction at 500 °C, atmospheric pressure 2.7 ± 1.1
Post-exposure to Ar at 650 °C, atmospheric pressure 4.0 ± 1.1
Post-exposure to PH2O/PH2 = 5 at 650 °C, 10 bar 18.9 ± 15.3
2.2. In situ Magnetometry.
2.2.1. Degree of Reduction
Figure 2. Number-based size distributions derived from the acquired TEM images of the Ni/Al2O3 catalyst after (a)reduction at 500 ◦C, as well as after exposure to (b) Ar at atmospheric pressure, and to the (c) hydrothermal condition(PH2O/PH2 of 5) at 10 bar at 650 ◦C.
2.2. In Situ Magnetometry2.2.1. Degree of Reduction
The stability of the Al2O3-supported Ni catalyst prepared was studied by exposingit to a range of reactor temperatures and two different gas environments: (i) pure Ar,and (ii) a mixture of H2O/H2. A magnetisation versus applied field measurement (M-Hmeasurement) was carried out at 150 ◦C (below the Curie temperature of Ni0 of 358 ◦C [33])after exposure of the catalyst to each temperature for 1 h. This M-H measurement wasused to determine the degree of reduction (DOR, Equation (2)), particle size distribution,and the average particle size of the catalyst. Figure 3a shows the change in the samplemagnetisation as a function of the applied magnetic field in an Ar environment afterexposure to reactor temperatures ranging from 350 to 650 ◦C. These results show that thesample magnetisation did not change after exposure to 350, 450, and 550 ◦C. There is a

Catalysts 2021, 11, 636 5 of 17
slight decrease in the magnetisation observed after exposure to 650 ◦C, which is due to amisalignment of the reactor during this measurement and not due to any phase changesoccurring in the sample, since Ar would not oxidise the catalyst. The results presentedin Figure 3b, which were obtained after the tests in the H2O/H2 environment, show adecrease in the magnetisation with an increase in the treatment temperature. As detailedin Section 3.3, a loss in magnetisation corresponds to a phase change of the ferromagneticmetallic Ni to a non-ferromagnetic phase, such as NiO and/or NiAl2O4. Therefore, theresults in Figure 3b show the detection of oxidation using the magnetometer, which canfurther be quantified and expressed as a (change in the) degree of reduction (DOR), basedon a calibration of the magnetometer with a known mass of metallic Ni (see calibration incurve in Figure S2). Table 2 shows the DOR of the sample after exposure to the differenttemperatures under both gas environments.
Catalysts 2021, 11, x FOR PEER REVIEW 5 of 18
The stability of the Al2O3-supported Ni catalyst prepared was studied by exposing it
to a range of reactor temperatures and two different gas environments: (i) pure Ar, and
(ii) a mixture of H2O/H2. A magnetisation versus applied field measurement (M-H meas-
urement) was carried out at 150 °C (below the Curie temperature of Ni0 of 358 °C [33])
after exposure of the catalyst to each temperature for 1 h. This M-H measurement was
used to determine the degree of reduction (DOR, Equation (2)), particle size distribution,
and the average particle size of the catalyst. Figure 3a shows the change in the sample
magnetisation as a function of the applied magnetic field in an Ar environment after ex-
posure to reactor temperatures ranging from 350 to 650 °C. These results show that the
sample magnetisation did not change after exposure to 350, 450, and 550 °C. There is a
slight decrease in the magnetisation observed after exposure to 650 °C, which is due to a
misalignment of the reactor during this measurement and not due to any phase changes
occurring in the sample, since Ar would not oxidise the catalyst. The results presented in
Figure 3b, which were obtained after the tests in the H2O/H2 environment, show a de-
crease in the magnetisation with an increase in the treatment temperature. As detailed in
Section 3.3., a loss in magnetisation corresponds to a phase change of the ferromagnetic
metallic Ni to a non-ferromagnetic phase, such as NiO and/or NiAl2O4. Therefore, the re-
sults in Figure 3b show the detection of oxidation using the magnetometer, which can
further be quantified and expressed as a (change in the) degree of reduction (DOR), based
on a calibration of the magnetometer with a known mass of metallic Ni (see calibration in
curve in Figure S2). Table 2 shows the DOR of the sample after exposure to the different
temperatures under both gas environments.
Figure 3. Full M-H measurement results measured at 150 °C after exposure to different temperatures under (a) Ar at
atmospheric pressure, and the (b) hydrothermal condition (PH2O/PH2 of 5) at 10 bar.
The DOR decreases from 80.8 to 22.2% after the tests at 350 and 650 °C, respectively,
in the H2O/H2 environment, while the DOR remained relatively constant between 350 °C
(86.2%) and 550 °C (82.8%) during the tests conducted in Ar. The lower DOR at 650 °C in
Ar (70.7%) was due to the misalignment of the sample as previously mentioned. Oxidation
in the Ar environment was not expected; however, the addition of steam can lead to the
oxidation of Ni0 to NiO, or to NiAl2O4 by reacting with the Al2O3 support. The oxidation
to NiAl2O4 is thermodynamically more feasible than the oxidation to NiO at lower
PH2O/PH2 for bulk materials (Figure S3); however, the oxidation of metals is a size-depend-
ent phenomenon due to the decreased coordination of surface atoms [26,34]. This results
in a lower PH2O/PH2 threshold for the oxidation of smaller nanoparticles when compared
with the corresponding bulk material. Metallic Ni is the only ferromagnetic material in
this study that is detectable with the magnetometer, and there is a possibility of both oxi-
Figure 3. Full M-H measurement results measured at 150 ◦C after exposure to different temperatures under (a) Ar atatmospheric pressure, and the (b) hydrothermal condition (PH2O/PH2 of 5) at 10 bar.
Table 2. Degree of reduction after each tested temperature under different gas environments.
Temperature (◦C)Degree of Reduction (%)
Ar H2O/H2 = 5
350 86.2 80.8450 85.6 67.4550 82.8 54.0650 - * 22.2
* The DOR (70.7%) is lower due to the misalignment of the reactor during this measurement. Further results forthis measurement remain unaffected by the misalignment.
The DOR decreases from 80.8 to 22.2% after the tests at 350 and 650 ◦C, respectively,in the H2O/H2 environment, while the DOR remained relatively constant between 350 ◦C(86.2%) and 550 ◦C (82.8%) during the tests conducted in Ar. The lower DOR at 650 ◦C inAr (70.7%) was due to the misalignment of the sample as previously mentioned. Oxidationin the Ar environment was not expected; however, the addition of steam can lead tothe oxidation of Ni0 to NiO, or to NiAl2O4 by reacting with the Al2O3 support. Theoxidation to NiAl2O4 is thermodynamically more feasible than the oxidation to NiO atlower PH2O/PH2 for bulk materials (Figure S3); however, the oxidation of metals is a size-dependent phenomenon due to the decreased coordination of surface atoms [26,34]. Thisresults in a lower PH2O/PH2 threshold for the oxidation of smaller nanoparticles whencompared with the corresponding bulk material. Metallic Ni is the only ferromagneticmaterial in this study that is detectable with the magnetometer, and there is a possibility ofboth oxidation mechanisms occurring under the H2O/H2 environment. Therefore, the loss

Catalysts 2021, 11, 636 6 of 17
in magnetisation of the sample with increasing temperature can be attributed to either ofthe two oxidation mechanisms. However, the nature of the oxide phase(s) formed cannotbe confirmed with the current in situ technique.
The oxidation of Ni under simulated reaction conditions has been observed in otherstudies, particularly at very high PH2O/PH2 (i.e., at ratios greater than 20) [27]. In thecurrent study, significant oxidation is identified using a magnetometry-based technique ata relatively low PH2O/PH2 of 5. The observation of oxidation at low PH2O/PH2 is possibledue to the small starting metallic Ni particles (2.7 ± 1.1 nm) [23,26], while oxidation athigher PH2O/PH2 in a previous study was detected for larger starting particles (14.2 nm)using XRD [27]. We note that the particles used in the present work are very small fordetection using XRD, and this is in addition to the low Ni loading on the Al2O3 support.However, the ability to still study the oxidation and sintering of such small Ni particlesdemonstrates the higher sensitivity of the in situ magnetometer when compared withXRD [35].
2.2.2. Magnetometry-Based Size Analysis
To obtain size information from the results in Figure 3, the normalised magnetisation(M/Ms) can be calculated and analysed (see Figure 4). The remnant magnetisation at anapplied field of 0 T (i.e., in the absence of an external magnetic field) is shown in Figure 5.This has been used to calculate γ (see Equation (3) [36]), which is the weight fraction ofnon-superparamagnetic particles (that are ferromagnetic and thermally blocked) with a sizegreater than the critical size (Dc) of 20 nm at room temperature for the superparamagneticbehaviour of metallic Ni [37]. However, since the M-H measurements were recordedat 150 ◦C, the critical size is estimated as ≈23 nm according to the dependence of Dc ∝T
13 [38]. These results can be found in Table 3. The γ value varies between 1.8 and 3.4 wt%
after exposure of the reduced catalyst to different temperatures under Ar, indicating nosignificant nanoparticle growth above the critical size of metallic Ni. However, the sampletested in the presence of steam does show a significant increase in γ from 2.2 wt% after550 ◦C to 8.4 wt% after exposure to 650 ◦C, which is indicative of sintering and substantialparticle growth above the critical size. The low γ values calculated for all tests (which areless than 10 wt%) make these results suitable for analysis using the Langevin equation (seeEquation (4) [36]), as the sample after each tested condition predominantly consisted ofsuperparamagnetic material [36,39].
Catalysts 2021, 11, x FOR PEER REVIEW 7 of 18
Figure 4. Normalised magnetisation (M/Ms) as a function of the applied magnetic field measured at 150 °C after exposure
to different temperatures under (a) Ar at atmospheric pressure, and the (b) hydrothermal condition (PH2O/PH2 of 5) at 10
bar.
Figure 5. Magnified region of the normalised magnetisation plots in Figure 4 to display the remnant magnetisation around
0 T measured at 150 °C after exposure to different temperatures under (a) Ar at atmospheric pressure, and the (b) hydro-
thermal condition (PH2O/PH2 of 5) at 10 bar.
The application of the Langevin method for obtaining size information through a
linear combination of Langevin curves as a function of size is described in Section 3.3. The
M-H curves for the tests carried out in Ar (Figure 4a) show little (or no) change in shape,
which qualitatively indicates no significant changes to the size of the metallic Ni particles.
However, the change in the shape of the M-H curves in Figure 4b after exposure to ele-
vated temperatures provides an indication of the size changes occurring during the hy-
drothermal tests (PH2O/PH2 of 5). A depiction of the effect of size on the Langevin curve can
be found in Figure S4. The linear combination of these Langevin curves for different crys-
tallite sizes was used to derive full volume-based size distributions after each tested tem-
perature under the two gas environments.
Figure 4. Normalised magnetisation (M/Ms) as a function of the applied magnetic field measured at 150 ◦C after exposure todifferent temperatures under (a) Ar at atmospheric pressure, and the (b) hydrothermal condition (PH2O/PH2 of 5) at 10 bar.

Catalysts 2021, 11, 636 7 of 17
Catalysts 2021, 11, x FOR PEER REVIEW 7 of 18
Figure 4. Normalised magnetisation (M/Ms) as a function of the applied magnetic field measured at 150 °C after exposure
to different temperatures under (a) Ar at atmospheric pressure, and the (b) hydrothermal condition (PH2O/PH2 of 5) at 10
bar.
Figure 5. Magnified region of the normalised magnetisation plots in Figure 4 to display the remnant magnetisation around
0 T measured at 150 °C after exposure to different temperatures under (a) Ar at atmospheric pressure, and the (b) hydro-
thermal condition (PH2O/PH2 of 5) at 10 bar.
The application of the Langevin method for obtaining size information through a
linear combination of Langevin curves as a function of size is described in Section 3.3. The
M-H curves for the tests carried out in Ar (Figure 4a) show little (or no) change in shape,
which qualitatively indicates no significant changes to the size of the metallic Ni particles.
However, the change in the shape of the M-H curves in Figure 4b after exposure to ele-
vated temperatures provides an indication of the size changes occurring during the hy-
drothermal tests (PH2O/PH2 of 5). A depiction of the effect of size on the Langevin curve can
be found in Figure S4. The linear combination of these Langevin curves for different crys-
tallite sizes was used to derive full volume-based size distributions after each tested tem-
perature under the two gas environments.
Figure 5. Magnified region of the normalised magnetisation plots in Figure 4 to display the remnant magnetisationaround 0 T measured at 150 ◦C after exposure to different temperatures under (a) Ar at atmospheric pressure, and the(b) hydrothermal condition (PH2O/PH2 of 5) at 10 bar.
Table 3. Calculated γ values after each tested temperature under the different gas environments.
Temperature (◦C)γ (wt %)
Ar H2O/H2 = 5
350 2.8 0.9450 1.8 1.5550 3.4 2.2650 1.8 8.4
The application of the Langevin method for obtaining size information through alinear combination of Langevin curves as a function of size is described in Section 3.3.The M-H curves for the tests carried out in Ar (Figure 4a) show little (or no) change inshape, which qualitatively indicates no significant changes to the size of the metallic Niparticles. However, the change in the shape of the M-H curves in Figure 4b after exposureto elevated temperatures provides an indication of the size changes occurring during thehydrothermal tests (PH2O/PH2 of 5). A depiction of the effect of size on the Langevin curvecan be found in Figure S4. The linear combination of these Langevin curves for differentcrystallite sizes was used to derive full volume-based size distributions after each testedtemperature under the two gas environments.
2.2.3. Methods Used with the Langevin Equation
Volume-based size distributions were determined using three different methods basedon the Langevin equation, viz., the lognormal, bimodal, and least squares method. Asummary of the residual sum of squares obtained from this analysis for all three methodshas been presented in Figure 6a, and an example of the determined size distributionsusing each method for the test performed at 550 ◦C in the H2O/H2 environment canbe found in Figure 6b. The results for the other temperatures tested under the H2O/H2environment can be found in Figure S5. The results for the lognormal and bimodal fits showthe probability distribution shapes as expected, since the method used generates lognormalsize distributions with a known mean and standard deviation. The best lognormal andbimodal fits that describe the experimental data with the lowest residuals were identified.The least squares method differs from the lognormal and bimodal methods in that any sizedistribution (i.e., a distribution not generated by a lognormal function) is possible. Theleast squares fit shows similar results to the bimodal method, with two peaks occurringin similar size regions (see Figure 6b). The residuals that were calculated for these three

Catalysts 2021, 11, 636 8 of 17
methods show that the best fits to the experiments were obtained using the least squaresmethod at all temperatures (see Figure 6a). Therefore, the least squares method was usedin further comparisons of the size distributions for the other tested temperatures under thedifferent gas environments.
Catalysts 2021, 11, x FOR PEER REVIEW 8 of 18
Table 3. Calculated γ values after each tested temperature under the different gas environments.
Temperature (°C) 𝛄 (𝐰𝐭 %)
Ar H2O/H2 = 5
350 2.8 0.9
450 1.8 1.5
550 3.4 2.2
650 1.8 8.4
2.2.3. Methods used with the Langevin Equation
Volume-based size distributions were determined using three different methods
based on the Langevin equation, viz., the lognormal, bimodal, and least squares method.
A summary of the residual sum of squares obtained from this analysis for all three meth-
ods has been presented in Figure 6a, and an example of the determined size distributions
using each method for the test performed at 550 °C in the H2O/H2 environment can be
found in Figure 6b. The results for the other temperatures tested under the H2O/H2 envi-
ronment can be found in Figure S5. The results for the lognormal and bimodal fits show
the probability distribution shapes as expected, since the method used generates lognor-
mal size distributions with a known mean and standard deviation. The best lognormal
and bimodal fits that describe the experimental data with the lowest residuals were iden-
tified. The least squares method differs from the lognormal and bimodal methods in that
any size distribution (i.e., a distribution not generated by a lognormal function) is possible.
The least squares fit shows similar results to the bimodal method, with two peaks occur-
ring in similar size regions (see Figure 6b). The residuals that were calculated for these
three methods show that the best fits to the experiments were obtained using the least
squares method at all temperatures (see Figure 6a). Therefore, the least squares method
was used in further comparisons of the size distributions for the other tested temperatures
under the different gas environments.
Figure 6. (a) Comparison of the residual sum of squares for the three Langevin-based methods applied for each tempera-
ture tested under the hydrothermal condition (PH2O/PH2 of 5) at 10 bar. (b) Example of volume-based size distributions
derived from the linear combination fitting of Langevin curves to the experimental data obtained under the hydrothermal
condition at 550 °C.
2.2.4. Derivation of Size Distributions from Magnetometry Data
Figure 7 shows the volume-based size distributions that were determined from the
magnetometry data in Figure 4 by applying the Langevin method (the fits from this
method can be found in Figures S6 and S7). These distributions show the stability of the
Figure 6. (a) Comparison of the residual sum of squares for the three Langevin-based methods applied for each temperaturetested under the hydrothermal condition (PH2O/PH2 of 5) at 10 bar. (b) Example of volume-based size distributions derivedfrom the linear combination fitting of Langevin curves to the experimental data obtained under the hydrothermal conditionat 550 ◦C.
2.2.4. Derivation of Size Distributions from Magnetometry Data
Figure 7 shows the volume-based size distributions that were determined from themagnetometry data in Figure 4 by applying the Langevin method (the fits from this methodcan be found in Figures S6 and S7). These distributions show the stability of the nanopar-ticles under the Ar gas environment in the temperature range studied. More specifically,the volume-based average size varied between 4.1 and 4.2 nm (see Table 4), with onlya slight broadening of the distributions observed at 550 and 650 ◦C (Figure 7a). In theH2O/H2 environment, the results show an increase in the average size with increasingtemperature, from 4.2 to 9.3 nm (Table 4), as well as a broadening and development ofa bimodal distribution (Figure 7b). The increased sintering in the presence of steam canbe attributed to the possible formation of Ni(OH)x surface species, which facilitate themobility of Ni nanoparticles [19,40,41]. In previous studies, it has been reported that theoperating conditions, such as temperature, may cause the catalyst to sinter, with an increasein the sintering rate at elevated temperatures (650–800 ◦C) [41–44]. It is believed that atommigration is dominant at higher temperatures, while particle migration dominates at lowertemperatures. In situ TEM studies have provided insights into the sintering of supportednickel catalysts through the observation of both mechanisms occurring at various tempera-tures. These studies have shown that catalyst properties such as interparticle separation,initial particle size, pore structure, and support heterogeneity affect the mechanism bywhich sintering occurs [40,45–47]. The size distributions presented in Figure 7b may sug-gest that particle migration and coalescence is dominant, especially since the position ofthe lower size bimodal peak at 550 and 650 ◦C shows a minimal change. This indicates thatthe smaller metallic Ni nanoparticles present in the sample do not decrease significantly insize, which would be characteristic of atom migration [48,49]. As previously mentioned,the in situ magnetometer can only study the physicochemical changes of the metallic Nipresent in the sample, which is the active phase in the application of interest. According tothermodynamics, smaller nanoparticles in the system may be more susceptible to oxida-tion [26]. Therefore, due to the occurrence of oxidation in the reactor, a large percentageof smaller nanoparticles may be unaccounted for in the size distributions in Figure 7b,

Catalysts 2021, 11, 636 9 of 17
particularly after the test at 650 ◦C under the hydrothermal condition (see DOR data inTable 2).
Catalysts 2021, 11, x FOR PEER REVIEW 9 of 18
nanoparticles under the Ar gas environment in the temperature range studied. More spe-
cifically, the volume-based average size varied between 4.1 and 4.2 nm (see Table 4), with
only a slight broadening of the distributions observed at 550 and 650 °C (Figure 7a). In the
H2O/H2 environment, the results show an increase in the average size with increasing
temperature, from 4.2 to 9.3 nm (Table 4), as well as a broadening and development of a
bimodal distribution (Figure 7b). The increased sintering in the presence of steam can be
attributed to the possible formation of Ni(OH)x surface species, which facilitate the mobil-
ity of Ni nanoparticles [19,40,41]. In previous studies, it has been reported that the oper-
ating conditions, such as temperature, may cause the catalyst to sinter, with an increase
in the sintering rate at elevated temperatures (650–800 °C) [41–44]. It is believed that atom
migration is dominant at higher temperatures, while particle migration dominates at
lower temperatures. In situ TEM studies have provided insights into the sintering of sup-
ported nickel catalysts through the observation of both mechanisms occurring at various
temperatures. These studies have shown that catalyst properties such as interparticle sep-
aration, initial particle size, pore structure, and support heterogeneity affect the mecha-
nism by which sintering occurs [40,45–47]. The size distributions presented in Figure 7b
may suggest that particle migration and coalescence is dominant, especially since the po-
sition of the lower size bimodal peak at 550 and 650 °C shows a minimal change. This
indicates that the smaller metallic Ni nanoparticles present in the sample do not decrease
significantly in size, which would be characteristic of atom migration [48,49]. As previ-
ously mentioned, the in situ magnetometer can only study the physicochemical changes
of the metallic Ni present in the sample, which is the active phase in the application of
interest. According to thermodynamics, smaller nanoparticles in the system may be more
susceptible to oxidation [26]. Therefore, due to the occurrence of oxidation in the reactor,
a large percentage of smaller nanoparticles may be unaccounted for in the size distribu-
tions in Figure 7b, particularly after the test at 650 °C under the hydrothermal condition
(see DOR data in Table 2).
Figure 7. Volume-based size distributions derived from the magnetometry data in Figure 4 (via the Langevin method) as
a function of temperature under (a) Ar at atmospheric pressure, and the (b) hydrothermal condition (PH2O/PH2 of 5) at 10
bar.
Figure 7. Volume-based size distributions derived from the magnetometry data in Figure 4 (via the Langevin method) as afunction of temperature under (a) Ar at atmospheric pressure, and the (b) hydrothermal condition (PH2O/PH2 of 5) at 10 bar.
Table 4. Volume-based average sizes calculated from the magnetometry data (via the Langevinmethod) for each temperature tested under the different gas environments.
Temperature (◦C)dv, mag
Ar H2O/H2 = 5
350 4.1 ± 0.8 4.2 ± 0.7450 4.1 ± 0.9 4.6 ± 1.6550 4.1 ± 1.2 7.4 ± 2.2650 4.2 ± 3.1 9.3 ± 2.9
2.2.5. Comparison of the Size Analysis from the TEM and Magnetometry Studies
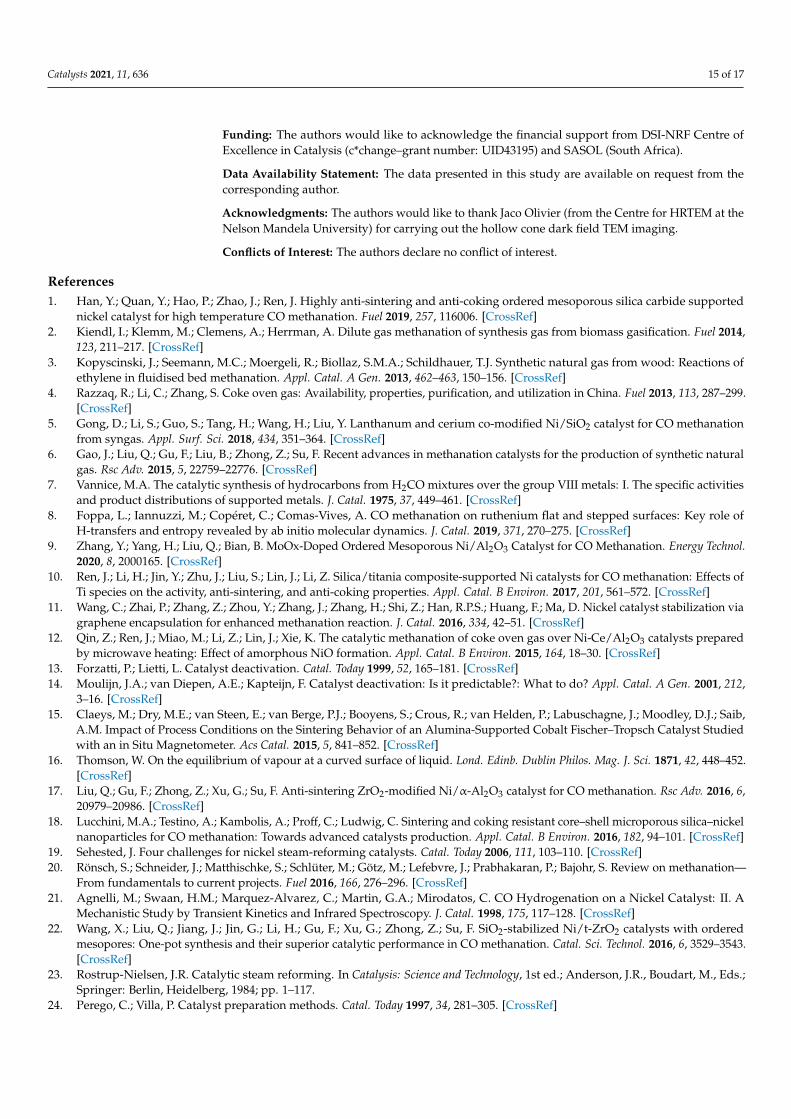
The volume-based size distributions derived from the magnetometry data (via theLangevin method) can be compared with those derived from ex situ TEM analysis, asshown in Figure 8. It should be highlighted that the size distributions emanating from theLangevin method are volume-based, whereas the particle counts (in Figure 2) from the TEManalysis are number-based. However, the TEM-derived number-based size distributionshave been converted to volume-based distributions to allow for a comparison with themagnetometry-derived ones (see Figure 8). The size distributions from the magnetometrystudies have been scaled according to the calculated DOR (see Table 2) to account for thevolume of metallic Ni in the sample measured using the magnetometer relative to thevolume of sample detectable using TEM (i.e., metallic and oxidised Ni). Table 5 gives asummary of the volume-based average sizes from the two characterisation techniques.
Table 5. Summary of the volume-based average particle sizes and standard deviations from the TEMand magnetometry studies.
Condition dv, TEM(nm)
dv, mag(nm)
Post-reduction at 500 ◦C, atmospheric pressure 3.8 ± 1.0 4.0 ± 0.8Post-exposure to Ar at 650 ◦C, atmospheric pressure 4.9 ± 1.1 4.2 ± 3.1
Post-exposure to PH2O/PH2 = 5 at 650 ◦C, 10 bar 49.7 ± 14.8 9.3 ± 2.9
Catalysts 2021, 11, 636 10 of 17Catalysts 2021, 11, x FOR PEER REVIEW 11 of 18
Figure 8. Comparison of the volume-based size distributions derived using the data from ex situ
TEM and in situ magnetometry. The size distributions from the TEM analysis are normalised to
the modal size for each spent sample. The results for these same distributions, but normalised to
the total volume, can be found in Figure S8. The distributions from the magnetometry-based
measurements have been scaled using the DOR to allow for an accurate comparison with the TEM
distributions.
Table 5. Summary of the volume-based average particle sizes and standard deviations
from the TEM and magnetometry studies.
Condition dv, TEM
(nm)
dv, mag
(nm)
Post-reduction at 500 °C, atmospheric pressure 3.8 ± 1.0 4.0 ± 0.8
Post-exposure to Ar at 650 °C, atmospheric pressure 4.9 ± 1.1 4.2 ± 3.1
Post-exposure to PH2O/PH2 = 5 at 650 °C, 10 bar 49.7 ± 14.8 9.3 ± 2.9
3. Materials and Methods
3.1. Catalyst Preparation
An alumina-supported nickel catalyst was prepared via incipient wetness impregna-
tion [50]. The bare support (γ-Al2O3, PURALOX SCCa 5–150, SBET = 162 m2/g, VBJH pore = 0.47
cm3/g, dBJH pore = 11.5 nm, SASOL Germany) was pre-treated via calcination at 600 °C in a
Nabertherm furnace for 2 h (heating rate: 10 °C/min) prior to the impregnation. Nickel(II)
nitrate hexahydrate (Ni(NO3)2.6H2O, >97% purity, Sigma-Aldrich South Africa) was used
to prepare the impregnation solution (0.2 g Ni(NO3)2.6H2O per mL of deionised water). A
single impregnation was performed, and an Ni loading of 4 wt % was targeted. After the
impregnation, the Ni-loaded support was dried at 120 °C for 24 h in a Memmert oven.
3.2. Ex situ Catalyst Characterisation
Powder X-ray diffraction (PXRD) was performed in a Bruker D8 Advance Laboratory
X-ray diffractometer operated at 35 kV and 40 mA, which was equipped with a cobalt
source (λKα1 = 1.78897 Å ) and a position-sensitive detector (VANTEC, Bruker AXS). The
optics of the diffractometer were set to parallel beam geometry. A 2θ range of 20–130° was
chosen as the measurement window. A step size of 0.01° and a time per step of 0.4 s was
used, giving a total scan time of 1 h 14 min.
Transmission electron microscopy (TEM) was performed using a JEOL JEM-2100
(LaB6) microscope operated at an accelerating voltage of 200 kV in TEM mode. Hollow
cone diffractive (HCD) imaging was done using a hardware implemented beam deflector
system. The images were generated with a beam tilt of approximately 5.9 mrad using an
objective aperture centred around the midpoint of the Ni(111) and NiO(012) diffraction
peaks. This enabled a hollow cone dark field image to be created by preferentially using
diffracted electrons originating from Ni and NiO phases. The regions with Ni and/or NiO
Figure 8. Comparison of the volume-based size distributions derived using the data from ex situTEM and in situ magnetometry. The size distributions from the TEM analysis are normalised to themodal size for each spent sample. The results for these same distributions, but normalised to the totalvolume, can be found in Figure S8. The distributions from the magnetometry-based measurementshave been scaled using the DOR to allow for an accurate comparison with the TEM distributions.
The comparison in Figure 8 and Table 5 shows a strong agreement between the volume-based size distributions and the corresponding average sizes for the samples obtained afterthe tests conducted in Ar. The size distributions derived for the tests performed in theH2O/H2 environment differ between the two characterisation techniques, with a muchlarger average size of 49.7 nm calculated from TEM, compared with the size of 9.3 nmobtained from the magnetometry-based analysis (see Table 5). These differences can beexplained by the fact that the Langevin method only includes superparamagnetic particles,which exist up to a certain critical size, and it excludes metallic Ni particles larger thanthis size and those that have oxidised (due to the presence of steam). The critical size ofNi at 150 ◦C, which is the temperature where the M-H measurements were conducted, isestimated to be 37.9 nm, as mentioned previously. The existence of a critical size providesan upper limit for any size measurements determined using the Langevin method. Thisis not the case for the TEM analysis; hence, it is expected that the volume-based averagesize from magnetometry would be lower than the TEM-derived average size since metallicNi, NiO, and NiAl2O4 particles are potentially detectable using TEM independent of size.However, we were unable to distinguish the three mentioned Ni-based phases using TEM,and therefore, the size distributions in Figures 2 and 8 may include particles from allthree phases.
Nonetheless, it is important to note that both characterisation techniques confirmthe occurrence of sintering in the H2O/H2 environment at elevated temperatures. In thecase of the magnetometer, the size changes occurring in the sample were studied in situunder industrially relevant temperatures, pressures, and gas environments (e.g., a H2O-H2mixture), and they revealed the development of a bimodal distribution for metallic Ni.
3. Materials and Methods3.1. Catalyst Preparation
An alumina-supported nickel catalyst was prepared via incipient wetness im-pregnation [50]. The bare support (γ-Al2O3, PURALOX SCCa 5–150, SBET = 162 m2/g,VBJH pore = 0.47 cm3/g, dBJH pore = 11.5 nm, SASOL Germany) was pre-treated via calci-nation at 600 ◦C in a Nabertherm furnace for 2 h (heating rate: 10 ◦C/min) prior to theimpregnation. Nickel(II) nitrate hexahydrate (Ni(NO3)2.6H2O, >97% purity, Sigma-AldrichSouth Africa) was used to prepare the impregnation solution (0.2 g Ni(NO3)2.6H2O per mLof deionised water). A single impregnation was performed, and an Ni loading of 4 wt%was targeted. After the impregnation, the Ni-loaded support was dried at 120 ◦C for 24 hin a Memmert oven.

Catalysts 2021, 11, 636 11 of 17
3.2. Ex Situ Catalyst Characterisation
Powder X-ray diffraction (PXRD) was performed in a Bruker D8 Advance LaboratoryX-ray diffractometer operated at 35 kV and 40 mA, which was equipped with a cobaltsource (λKα1 = 1.78897 Å) and a position-sensitive detector (VANTEC, Bruker AXS). Theoptics of the diffractometer were set to parallel beam geometry. A 2θ range of 20–130◦ waschosen as the measurement window. A step size of 0.01◦ and a time per step of 0.4 s wasused, giving a total scan time of 1 h 14 min.
Transmission electron microscopy (TEM) was performed using a JEOL JEM-2100(LaB6) microscope operated at an accelerating voltage of 200 kV in TEM mode. Hollowcone diffractive (HCD) imaging was done using a hardware implemented beam deflectorsystem. The images were generated with a beam tilt of approximately 5.9 mrad using anobjective aperture centred around the midpoint of the Ni(111) and NiO(012) diffractionpeaks. This enabled a hollow cone dark field image to be created by preferentially usingdiffracted electrons originating from Ni and NiO phases. The regions with Ni and/or NiOthat strongly diffract in this direction will appear brighter in the generated image. The ob-served particles in the acquired images were measured using the freeware ImageJ 1.15a [51].Based on counting between 120 and 200 particles, the number- and volume-based size dis-tributions, average sizes, and standard deviations were determined using the approach andequations in the book chapter by Bergeret and Gallezot (also see Equations (S1)–(S4)) [52].
3.3. Magnetism and Magnetometry
Magnetometry-based measurements were carried out using an in situ magnetome-ter [32,53,54] developed by the University of Cape Town and SASOL, South Africa. Themagnetometer is capable of operating at temperatures up to 900 ◦C and pressures of 50 bar.A 1
2 inch stainless steel fixed bed reactor is placed at an air gap of 48 mm between twopole caps of the electromagnet (Bruker Analytik GmbH), which reaches a maximum fieldstrength of 2 T under current-control mode. Magnetisation measurements can be taken un-der reaction conditions allowing for the determination of particle size and chemical phasechanges occurring in samples with ferromagnetic material. In this study, only metallicNi is detectable using the magnetometer since it is ferromagnetic, having a high mass-specific magnetisation (55.1 emu/g at 27 ◦C [55]) and a relatively high Curie temperature(358 ◦C [33]). The low mass-specific magnetisation of NiO (0.097 emu/g at 27 ◦C [56])makes it undetectable in the magnetometer. This implies that the degree of reduction (DOR)can only be based on the magnetisation of the metallic Ni in the sample. The DOR can becalculated (Equation (2)) using the sample magnetisation, the loaded mass of unreducedNi, and the instrument calibration based on a known mass of Ni (see Figure S2).
DOR (%) =Msample ×mknown
Mcalibration × Xloading ×munreduced sample(2)
Msample is the measured sample magnetisation of the sample (in emu) at a giventemperature, Mcalibration is the expected magnetisation of metallic Ni determined fromthe calibration curve at the same temperature, Xloading is the targeted loading of Ni in thesample (4 wt%), munreduced sample is the mass of unreduced sample (1.5 g) loaded in thereactor, and mknown is the known mass of calibration sample (0.1 g).
Magnetisation measurements (M) taken as a function of the applied magnetic field (H),i.e., an M-H measurement, allows for the hysteresis behaviour of ferromagnetic materialsto be studied. In these measurements, the saturation magnetisation can be measured athigh field strengths, where the magnetic dipole moments within the magnetic domainsof the material are in the direction of the applied field. Upon removal of the magneticfield, these ferromagnetic materials retain a portion of their magnetisation (i.e., remnantmagnetisation (Mr)), thus displaying hysteresis behaviour in the field loop. Below acertain critical size (which is ≈20 nm for metallic Ni at room temperature [37]), thesematerials no longer display remnant magnetisation in the absence of a magnetic field,

Catalysts 2021, 11, 636 12 of 17
thus displaying superparamagnetic behaviour. It should be noted that the critical sizefor superparamagnetism is temperature dependent, and while the critical size of Ni isnot known at higher temperatures, it is thought that its dependence on temperature canbe described according to Dc ∝ T
13 [38]. The weight fraction of non-superparamagnetic
particles (that are ferromagnetic and thermally blocked) having a size larger than the criticalsize—represented by the symbol γ—can be calculated from the saturation magnetisation(Ms) and the remnant magnetisation (Mr), as seen in Equation (3). The superparamagneticbehaviour of Ni nanoparticles can be described by the Langevin equation (Equation (4)) [36],from which size distributions can be determined by performing a linear combination ofLangevin curves that approximate the experimental M-H results [34]. This techniqueallows for full volume-based size distributions below the critical size of metallic Ni to beobtained under reaction conditions. Samples with a γ value less than 10% are deemedto have a suitably high percentage of superparamagnetic material for analysis using theLangevin method.
γ (wt.−%) =2×Mr
Ms(3)
MMs
= coth(
ρ× σs × π × H × d3
6× k× T
)−
(6× k× T
ρ× σs × π × H × d3
)(4)
In Equation (4), M is the magnetisation of the sample, Ms is the saturation magnetisa-tion of the sample at high field strength, ρ is the material density, σs is the mass-specificsaturation magnetisation, k is the Boltzmann constant, H is the external magnetic fieldstrength, T is the absolute temperature, and d is the volume-based particle size.
The experimental results required for this size analysis were obtained by recordingthe magnetisation as a function of the field strength from −2 T to +2 T and back to −2 T,with 65 measurements being taken over this range in 38 min. This measurement is referredto as an M-H measurement, as also mentioned above. Three approaches were taken indetermining the size distribution that best fit the experimental M-H measurements. Thefirst method involved calculating experimental Langevin curves from a range of lognormalsize distributions with varying mean and standard deviation values. The fit with the lowestresidual sum of squares to the experimental data was identified as the best fit. The secondmethod involved a similar approach; however, the generated distributions comprised oftwo lognormal distributions and the best fit was identified as before. The third methodwas by performing least squares minimisation of the problem in Equation (5) subject tothe constraints that all frequencies in the distribution are positive (Equation (6)). Thisminimisation problem was solved using a sequential quadratic programming (SQP) [57]algorithm implemented in SciPy [58]. In Equations (5) and (6), v(di) is the volume fractionof the nanoparticles of size di and L(di) is the Langevin equation evaluated at a size of di.
MMs
=n
∑i = 1
v(di)× L(di) (5)
v(di) > 0 (6)
3.3.1. In Situ Reduction Studies in a Hydrogen Atmosphere
First, 1.5 g of the Ni-loaded support was activated in situ before performing the ther-mally induced sintering and oxidation studies at different temperatures (350, 450, 550 and650 ◦C) and gas environments (i.e., in a flow of Ar, and a flow of PH2O/PH2 = 5, respec-tively). The sample was reduced at atmospheric pressure by flowing 50 mL(NTP)/min/gcatof H2 while heating the reactor from room temperature to 500 ◦C (heating rate: 5 ◦C/min),and then keeping this final temperature for 12 h. The Curie temperature of metallic Ni is358 ◦C [33], and above this temperature, Ni will not display any magnetisation; i.e., it willbecome paramagnetic. To obtain a meaningful M-H measurement, this had to be takenat a temperature well below the Curie temperature. Therefore, the sample was cooled to150 ◦C (cooling rate: 10 ◦C/min) under an Ar flow (100 mL(NTP)/min), which served

Catalysts 2021, 11, 636 13 of 17
as the reference temperature for taking M-H measurements in all subsequent tests (seeSections 3.3.2 and 3.3.3). Upon reaching 150 ◦C, a full M-H measurement (38 min) wasperformed by taking 65 magnetisation readings from −2 to +2 T and then back to −2 T.
For the purpose of characterising the reduced catalyst ex situ, the reactor was cooledto room temperature, and then, carbon dioxide was flowed over the sample for 1 h topassivate the metallic Ni nanoparticles.
3.3.2. In Situ Sintering Studies in an Inert Atmosphere
The effects of elevated temperature on crystallite growth were investigated by ex-posing the reduced catalyst to different temperatures, i.e., 350, 450, 550, and 650 ◦C.These tests were conducted at atmospheric pressure in an inert environment (Ar flow:100 mL(NTP)/min). After reduction, the reactor was cooled to 350 ◦C (cooling rate:10 ◦C/min), which was held for 1 h. Thereafter, the reactor was cooled down from 350to 150 ◦C (cooling rate: 10 ◦C/min) before taking an M-H measurement. The reactor washeated again from 150 to 400 ◦C (heating rate: 5 ◦C/min) and then to 450 ◦C (heating rate:1 ◦C/min), which was kept constant for 1 h before decreasing the temperature back to150 ◦C in order to record an M-H measurement. The remaining tests at 550 and 650 ◦Cwere also conducted in a similar manner as described above.
After the final test at 650 ◦C, the reactor was cooled to room temperature in Ar(100 mL(NTP)/min). Then, carbon dioxide was flowed through the reactor for 1 h topassivate the metallic Ni for further ex situ characterisation.
3.3.3. In Situ Sintering and Oxidation Studies in a Steam/Hydrogen Atmosphere
The effect of water vapour on crystallite growth and oxidation of the reduced cat-alyst was investigated by co-feeding steam and hydrogen into the reactor at 350, 450,550, and 650 ◦C. The reactor was pressurised to 10 bar by flowing 100 mL(NTP)/minof Ar. Thereafter, the reactor was bypassed by allowing Ar to flow through a stainlesssteel SiC-filled 150 mL vaporising vessel (heated to 180 ◦C). The gas was switched fromAr to H2 (25 mL(NTP)/min); then, an HPLC pump was used to flow 0.10 mL/min ofdeionised liquid water to the vaporising vessel, to allow for a steam/hydrogen partialpressure ratio (PH2O/PH2) of 5. Then, the gas flow was reverted to the reactor to beginthe experimental condition. A PH2O/PH2 of 5 corresponds to a CO conversion to CH4of 94% (see Equation (7)); therefore, this experimental condition simulates the effects ofwater vapour at the high conversions associated with the methanation process, despite thethermodynamic infeasibility at high temperatures (550 and 650 ◦C).
pH2O
pH2
=x
3− 3x(7)
pH2OpH2
is the steam/hydrogen partial pressure ratio and x is the fractional conversion ofCO to CH4 (i.e., 0 ≤ x < 1), assuming the chemical reaction in Equation (7).
The reactor was cooled from 500 to 350 ◦C after reduction (cooling rate: 10 ◦C/min).At 350 ◦C, the gaseous H2O/H2 mixture flowed through the reactor for 1 h. Thereafter, theflowing gas was changed to Ar (100 mL(NTP)/min), the vaporising vessel was bypassed,and then the reactor was cooled to 150 ◦C (cooling rate: 10 ◦C/min). The liquid waterfrom the HPLC pump was diverted away from the vaporising vessel to the purge. Thesystem was depressurised to atmospheric pressure and the Ar was flowed for an additional30 min at 150 ◦C to ensure that all H2O and H2 have been purged before taking M-Hmeasurements. This process was repeated for the subsequent tests at 450, 550, and 650 ◦C.
The spent catalyst sample was passivated by flowing CO2 through the reactor for1 h at room temperature and atmospheric pressure, prior to unloading, in preparation forfurther ex situ characterisation.

Catalysts 2021, 11, 636 14 of 17
4. Summary and Conclusions
Nickel-based catalysts are widely used for the hydrogenation of CO to CH4 due totheir relatively low cost as well as high activity and selectivity towards CH4. However,these catalysts can experience different deactivation mechanisms during methanation, withsintering and oxidation being among the well-known ones. Therefore, our current workhas investigated the extent of sintering and oxidation of reduced Al2O3-supported Ninanoparticles using in situ magnetometry under simulated CO methanation conditions,involving different temperatures and gas environments. Since metallic Ni is ferromagnetic,changes to its chemical and/or physical characteristics under reaction conditions could bemonitored using magnetometry.
We have shown that increasing the temperature from 350 to 650 ◦C (every 100 ◦C)under an Ar flow at atmospheric pressure does not cause significant changes to the averagesize and DOR of the starting metallic Ni particles. The minimal (or absence of) sinteringmay be due to the presence of the Al2O3 support and consequently, the existence of strongnanoparticle–support interactions. The chemical phase stability of the metallic Ni canbe attributed to the inertness of Ar. When the gas environment is changed from Ar tohydrothermal conditions (PH2O/PH2 of 5) at 10 bar, and the temperature is increasedfrom 350 to 650 ◦C, the metallic Ni particles gradually oxidise (i.e., lose their relativemagnetisation), which causes a decrease in the DOR from 86.2 to 22.2%. The oxidation ofthe metallic phase (to possibly NiO and/or NiAl2O4) is attributed to the presence of H2O,which is a relatively strong oxidising agent. Furthermore, co-feeding steam and hydrogencaused a significant growth in the average size of the un-oxidised metallic particles from 4.2to 9.3 nm (based on magnetometry) as well as the development of a bimodal distribution.This sintering behaviour can be attributed to the possible formation of Ni(OH)x surfacespecies, resulting in particle migration. Sintering in the presence of steam has also beenobserved for other metallic particles (e.g., Co [15,38]). Ex situ TEM analysis of the spentcatalysts also confirmed the sintering of the Ni-based particles after the hydrothermaltreatment showing an increase in the volume-based average size of 3.8 to 49.7 nm.
Thus, we have confirmed the sintering and oxidation of Ni catalysts under hydrother-mal conditions using magnetometry-based in situ characterisation. We have also shownthat magnetometry-based analyses can be used to obtain size information (i.e., volume-based size distributions and average sizes of superparamagnetic particles) that is analogousto the size information from TEM analyses, in that they both confirm the occurrence ofsintering. More importantly, the magnetometry-based studies could be conducted in situ,i.e., without removal of the catalyst from the reactor.
Supplementary Materials: The following are available online at https://www.mdpi.com/article/10.3390/catal11050636/s1, Figure S1: Ex situ PXRD pattern of the bare and Ni-loaded Al2O3 support(radiation source: Co Kα1 = 1.78897 Å), Table S1: ICDD PDF-2 entries of all chemical/crystal phasesrelevant to the current study, Figure S2: Calibration curve for the magnetometer based on 0.1 g ofunreduced and unsupported NiO, Figure S3: Thermodynamics of the oxidation of metallic Ni toNiO and NiAl2O4 showing the partial pressure ratio of steam to hydrogen equilibrium position asa function of temperature, Figure S4: Langevin equation evaluated at sizes ranging from 1 nm to10 nm, Figure S5: Comparison of size distributions determined by lognormal, bimodal and leastsquares methods for Langevin analysis of measurements taken under H2O environment at (a) 350 ◦C,(b) 450 ◦C, (c) 550 ◦C and (d) 650 ◦C, Figure S6: Calculated (-) and experimentally measured(o) Langevin curves for catalyst tested in Ar environment at (a) 350 ◦C, (b) 450 ◦C, (c) 550 ◦Cand (d) 650 ◦C, Figure S7: Calculated (-) and experimentally measured (o) Langevin curves forcatalyst tested in H2O environment at (a) 350 ◦C, (b) 450 ◦C, (c) 550 ◦C and (d) 650 ◦C. Figure S8:Comparison of the volume-based size distributions derived using the data from ex situ TEM andin situ magnetometry, with the size distributions normalised to their respective areas.
Author Contributions: Conceptualisation: M.C.; Formal analysis: D.d.O., T.M.N., M.I.F. and N.F.;Investigation: M.M. and R.H.; Supervision: M.C.; Writing—original draft: D.d.O., T.M.N., and M.I.F.;Writing—review and editing: N.F., M.C. All authors have read and agreed to the published versionof the manuscript.
Catalysts 2021, 11, 636 15 of 17
Funding: The authors would like to acknowledge the financial support from DSI-NRF Centre ofExcellence in Catalysis (c*change–grant number: UID43195) and SASOL (South Africa).
Data Availability Statement: The data presented in this study are available on request from thecorresponding author.
Acknowledgments: The authors would like to thank Jaco Olivier (from the Centre for HRTEM at theNelson Mandela University) for carrying out the hollow cone dark field TEM imaging.
Conflicts of Interest: The authors declare no conflict of interest.
References1. Han, Y.; Quan, Y.; Hao, P.; Zhao, J.; Ren, J. Highly anti-sintering and anti-coking ordered mesoporous silica carbide supported
nickel catalyst for high temperature CO methanation. Fuel 2019, 257, 116006. [CrossRef]2. Kiendl, I.; Klemm, M.; Clemens, A.; Herrman, A. Dilute gas methanation of synthesis gas from biomass gasification. Fuel 2014,
123, 211–217. [CrossRef]3. Kopyscinski, J.; Seemann, M.C.; Moergeli, R.; Biollaz, S.M.A.; Schildhauer, T.J. Synthetic natural gas from wood: Reactions of
ethylene in fluidised bed methanation. Appl. Catal. A Gen. 2013, 462–463, 150–156. [CrossRef]4. Razzaq, R.; Li, C.; Zhang, S. Coke oven gas: Availability, properties, purification, and utilization in China. Fuel 2013, 113, 287–299.
[CrossRef]5. Gong, D.; Li, S.; Guo, S.; Tang, H.; Wang, H.; Liu, Y. Lanthanum and cerium co-modified Ni/SiO2 catalyst for CO methanation
from syngas. Appl. Surf. Sci. 2018, 434, 351–364. [CrossRef]6. Gao, J.; Liu, Q.; Gu, F.; Liu, B.; Zhong, Z.; Su, F. Recent advances in methanation catalysts for the production of synthetic natural
gas. Rsc Adv. 2015, 5, 22759–22776. [CrossRef]7. Vannice, M.A. The catalytic synthesis of hydrocarbons from H2CO mixtures over the group VIII metals: I. The specific activities
and product distributions of supported metals. J. Catal. 1975, 37, 449–461. [CrossRef]8. Foppa, L.; Iannuzzi, M.; Copéret, C.; Comas-Vives, A. CO methanation on ruthenium flat and stepped surfaces: Key role of
H-transfers and entropy revealed by ab initio molecular dynamics. J. Catal. 2019, 371, 270–275. [CrossRef]9. Zhang, Y.; Yang, H.; Liu, Q.; Bian, B. MoOx-Doped Ordered Mesoporous Ni/Al2O3 Catalyst for CO Methanation. Energy Technol.
2020, 8, 2000165. [CrossRef]10. Ren, J.; Li, H.; Jin, Y.; Zhu, J.; Liu, S.; Lin, J.; Li, Z. Silica/titania composite-supported Ni catalysts for CO methanation: Effects of
Ti species on the activity, anti-sintering, and anti-coking properties. Appl. Catal. B Environ. 2017, 201, 561–572. [CrossRef]11. Wang, C.; Zhai, P.; Zhang, Z.; Zhou, Y.; Zhang, J.; Zhang, H.; Shi, Z.; Han, R.P.S.; Huang, F.; Ma, D. Nickel catalyst stabilization via
graphene encapsulation for enhanced methanation reaction. J. Catal. 2016, 334, 42–51. [CrossRef]12. Qin, Z.; Ren, J.; Miao, M.; Li, Z.; Lin, J.; Xie, K. The catalytic methanation of coke oven gas over Ni-Ce/Al2O3 catalysts prepared
by microwave heating: Effect of amorphous NiO formation. Appl. Catal. B Environ. 2015, 164, 18–30. [CrossRef]13. Forzatti, P.; Lietti, L. Catalyst deactivation. Catal. Today 1999, 52, 165–181. [CrossRef]14. Moulijn, J.A.; van Diepen, A.E.; Kapteijn, F. Catalyst deactivation: Is it predictable?: What to do? Appl. Catal. A Gen. 2001, 212,
3–16. [CrossRef]15. Claeys, M.; Dry, M.E.; van Steen, E.; van Berge, P.J.; Booyens, S.; Crous, R.; van Helden, P.; Labuschagne, J.; Moodley, D.J.; Saib,
A.M. Impact of Process Conditions on the Sintering Behavior of an Alumina-Supported Cobalt Fischer–Tropsch Catalyst Studiedwith an in Situ Magnetometer. Acs Catal. 2015, 5, 841–852. [CrossRef]
16. Thomson, W. On the equilibrium of vapour at a curved surface of liquid. Lond. Edinb. Dublin Philos. Mag. J. Sci. 1871, 42, 448–452.[CrossRef]
17. Liu, Q.; Gu, F.; Zhong, Z.; Xu, G.; Su, F. Anti-sintering ZrO2-modified Ni/α-Al2O3 catalyst for CO methanation. Rsc Adv. 2016, 6,20979–20986. [CrossRef]
18. Lucchini, M.A.; Testino, A.; Kambolis, A.; Proff, C.; Ludwig, C. Sintering and coking resistant core–shell microporous silica–nickelnanoparticles for CO methanation: Towards advanced catalysts production. Appl. Catal. B Environ. 2016, 182, 94–101. [CrossRef]
19. Sehested, J. Four challenges for nickel steam-reforming catalysts. Catal. Today 2006, 111, 103–110. [CrossRef]20. Rönsch, S.; Schneider, J.; Matthischke, S.; Schlüter, M.; Götz, M.; Lefebvre, J.; Prabhakaran, P.; Bajohr, S. Review on methanation—
From fundamentals to current projects. Fuel 2016, 166, 276–296. [CrossRef]21. Agnelli, M.; Swaan, H.M.; Marquez-Alvarez, C.; Martin, G.A.; Mirodatos, C. CO Hydrogenation on a Nickel Catalyst: II. A
Mechanistic Study by Transient Kinetics and Infrared Spectroscopy. J. Catal. 1998, 175, 117–128. [CrossRef]22. Wang, X.; Liu, Q.; Jiang, J.; Jin, G.; Li, H.; Gu, F.; Xu, G.; Zhong, Z.; Su, F. SiO2-stabilized Ni/t-ZrO2 catalysts with ordered
mesopores: One-pot synthesis and their superior catalytic performance in CO methanation. Catal. Sci. Technol. 2016, 6, 3529–3543.[CrossRef]
23. Rostrup-Nielsen, J.R. Catalytic steam reforming. In Catalysis: Science and Technology, 1st ed.; Anderson, J.R., Boudart, M., Eds.;Springer: Berlin, Heidelberg, 1984; pp. 1–117.
24. Perego, C.; Villa, P. Catalyst preparation methods. Catal. Today 1997, 34, 281–305. [CrossRef]

Catalysts 2021, 11, 636 16 of 17
25. Reuel, R.C.; Bartholomew, C.H. Effects of support and dispersion on the CO hydrogenation activity/selectivity properties ofcobalt. J. Catal. 1984, 85, 78–88. [CrossRef]
26. van Steen, E.; Claeys, M.; Dry, M.E.; van de Loosdrecht, J.; Viljoen, E.L.; Visagie, J.L. Stability of nanocrystals: Thermodynamicanalysis of oxidation and re-reduction of cobalt in water/hydrogen mixtures. J. Phys. Chem. B 2005, 109, 3575–3577. [CrossRef]
27. Sehested, J.; Gelten, J.A.; Helveg, S. Sintering of nickel catalysts: Effects of time, atmosphere, temperature, nickel-carrierinteractions, and dopants. Appl. Catal. A Gen. 2006, 309, 237–246. [CrossRef]
28. Champon, I.; Bengaouer, A.; Chaise, A.; Thomas, S.; Roger, A.-C. Modelling the Sintering of Nickel Particles Supported onγ-Alumina under Hydrothermal Conditions. Catalysts 2020, 10, 1477. [CrossRef]
29. Wolf, M.; Fischer, N.; Claeys, M. Water-induced deactivation of cobalt-based Fischer–Tropsch catalysts. Nat. Catal. 2020, 3,962–965. [CrossRef]
30. Wolf, M.; Fischer, N.; Claeys, M. Capturing the interconnectivity of water-induced oxidation and sintering of cobalt nanoparticlesduring the Fischer-Tropsch synthesis in situ. J. Catal. 2019, 374, 199–207. [CrossRef]
31. Argyle, M.D.; Bartholomew, C.H. Heterogeneous Catalyst Deactivation and Regeneration: A Review. Catalysts 2015, 5, 145–269.[CrossRef]
32. Fischer, N.; Claeys, M. In situ characterization of Fischer–Tropsch catalysts: A review. J. Phys. D Appl. Phys. 2020, 53, 293001.[CrossRef]
33. Knacke, O.; Kubaschewski, O.; Hesselmann, K. Thermochemical Properties of Inorganic Substances, 2nd ed.; Springer: Berlin,Germany, 1991.
34. Wolf, M.; Kotze, H.; Fischer, N.; Claeys, M. Size dependent stability of cobalt nanoparticles on silica under high conversionFischer-Tropsch environment. Faraday Discuss. 2017, 197, 243–268. [CrossRef]
35. Nyathi, T.M.; Fischer, N.; York, A.P.E.; Morgan, D.J.; Hutchings, G.J.; Gibson, E.K.; Wells, P.P.; Catlow, C.R.A.; Claeys, M. Impactof Nanoparticle–Support Interactions in Co3O4/Al2O3 Catalysts for the Preferential Oxidation of Carbon Monoxide. Acs Catal.2019, 9, 7166–7178. [CrossRef] [PubMed]
36. Dalmon, J. Magnetic measurements and catalysis. In Catalyst Characterization: Physical Techniques for Solid Materials, 1st ed.; Imelik,B., Vedrine, J.C., Eds.; Springer: New York, NY, USA, 1994; pp. 585–607.
37. Ishizaki, T.; Yatsugi, K.; Akedo, K. Effect of Particle Size on the Magnetic Properties of Ni Nanoparticles Synthesized withTrioctylphosphine as the Capping Agent. Nanomaterials 2016, 6, 172. [CrossRef]
38. Moodley, D.; Claeys, M.; van Steen, E.; van Helden, P.; Kistamurthy, D.; Weststrate, K.-J.; Niemantsverdriet, H.; Saib, A.; Erasmus,W.; van de Loosdrecht, J. Sintering of cobalt during FTS: Insights from industrial and model systems. Catal. Today 2020, 342, 59–70.[CrossRef]
39. Wolf, M.; Gibson, E.K.; Olivier, E.J.; Neethling, J.H.; Catlow, C.R.A.; Fischer, N.; Claeys, M. Water-Induced Formation ofCobalt-Support Compounds under Simulated High Conversion Fischer–Tropsch Environment. Acs Catal. 2019, 9, 4902–4918.[CrossRef]
40. Sehested, J.; Larsen, N.W.; Falsig, H.; Hinnemann, B. Sintering of nickel steam reforming catalysts: Effective mass diffusionconstant for Ni-OH at nickel surfaces. Catal. Today 2014, 228, 22–31. [CrossRef]
41. Sehested, J. Sintering of nickel steam-reforming catalysts: Effects of temperature and steam and hydrogen pressures. J. Catal.2004, 223, 432–443. [CrossRef]
42. Rasmussen, F.B.; Sehested, J.; Teunissen, H.T.; Molenbroek, A.M.; Clausen, B.S. Sintering of Ni/Al2O3 catalysts studied byanomalous small angle X-ray scattering. Appl. Catal. A Gen. 2004, 267, 165–173. [CrossRef]
43. Sehested, J. Sintering of nickel steam-reforming catalysts. J. Catal. 2003, 217, 417–426. [CrossRef]44. Bartholomew, C.H.; Sorensen, W.L. Sintering kinetics of silica-and alumina-supported nickel in hydrogen atmosphere. J. Catal.
1983, 81, 131–141. [CrossRef]45. Prieto, G.; Zecevic, J.; Friedrich, H.; de Jong, K.P.; de Jongh, P.E. Towards stable catalysts by controlling collective properties of
supported metal nanoparticles. Nat. Mater. 2013, 12, 34–39. [CrossRef] [PubMed]46. Challa, S.R.; Delariva, A.T.; Hansen, T.W.; Helveg, S.; Sehested, J.; Hansen, P.L.; Garzon, F.; Datye, A.K. Relating rates of catalyst
sintering to the disappearance of individual nanoparticles during Ostwald ripening. J. Am. Chem. Soc. 2011, 133, 20672–20675.[CrossRef] [PubMed]
47. DeLaRiva, A.T.; Hansen, T.W.; Challa, S.R.; Datye, A.K. In situ transmission electron microscopy of catalyst sintering. J. Catal.2013, 308, 291–305. [CrossRef]
48. Bellare, A.; Dadyburjor, D.B.; Kelley, M.J. Evolution of bimodal distributions in the sintering of model supported metal catalysts.J. Catal. 1989, 117, 78–90. [CrossRef]
49. Kolb, M.; Agnelli, M.; Mirodatos, C. Kinetics of Bimodal Grain Size Distribution of a Ni Catalyst During Hydrogenation of CO. InStudies in Surface Science and Catalysis; Guczi, L., Solymosi, F., TÉTÉNyi, P., Eds.; Elsevier B.V.: Amsterdam, The Netherlands, 1993;Volume 75, pp. 2833–2836.
50. Bartholomew, C.H.; Pannell, R.B. The stoichiometry of hydrogen and carbon monoxide chemisorption on alumina- and silica-supported nickel. J. Catal. 1980, 65, 390–401. [CrossRef]
51. Schneider, C.A.; Rasband, W.S.; Eliceiri, K.W. NIH Image to ImageJ: 25 years of image analysis. Nat. Methods 2012, 9, 671–675.[CrossRef]

Catalysts 2021, 11, 636 17 of 17
52. Bergeret, G.; Gallezot, P. Particle Size and Dispersion Measurements. In Handbook of Heterogeneous Catalysis; Ertl, G., Knözinger,H., Schüth, F., Weitkamp, J., Eds.; Wiley-VCH Verlag GmbH & Co. KGaA: Weinheim, Germany, 2008; pp. 738–765.
53. Claeys, M.C.M.; van Steen, E.W.J.; Visagie, J.L.; van de Loosdrecht, J. Magnetometer. U.S. Patent 8773118B2, 8 July 2014.54. Fischer, N.; Clapham, B.; Feltes, T.; van Steen, E.; Claeys, M. Size-Dependent Phase Transformation of Catalytically Active
Nanoparticles Captured In Situ. Angew. Chem. Int. Ed. 2014, 53, 1342–1345. [CrossRef] [PubMed]55. Crangle, J.; Goodman, G.M.; Sucksmith, W. The magnetization of pure iron and nickel. Proc. R. Soc. Lond. A Math. Phys. Sci. 1971,
321, 477–491. [CrossRef]56. Shahzad, F.; Nadeem, K.; Weber, J.; Krenn, H.; Knoll, P. Magnetic behavior of NiO nanoparticles determined by SQUID
magnetometry. Mater. Res. Express 2017, 4, 086102. [CrossRef]57. Kraft, D. A Software Package for Sequential Quadratic Programming; DLR German Aerospace Center-Institute for Flight Mechanics:
Koln, Germany, 1988.58. Virtanen, P.; Gommers, R.; Oliphant, T.E.; Haberland, M.; Reddy, T.; Cournapeau, D.; Burovski, E.; Peterson, P.; Weckesser, W.;
Bright, J. SciPy 1.0: Fundamental algorithms for scientific computing in Python. Nat. Methods 2020, 17, 261–272. [CrossRef][PubMed]


![Effect of sintering temperature on microstructure and electrical ... · sintered SrBi 2Ta 2O 9 ceramic was reported [30]. Hydrothermal synthesis of ceramic powders has gained considerable](https://static.fdocuments.net/doc/165x107/5e4c4aff753cfb3ad22691fb/effect-of-sintering-temperature-on-microstructure-and-electrical-sintered-srbi.jpg)