Synthesis and Sintering of Nanocrystalline Alumina and ...
121
Synthesis and Sintering of Nanocrystalline Alumina and Aluminum Nitride by Martin Lawrence Panchula M.S. Materials Science, Iowa State University, 1994 B.S. Ceramic Engineering, Iowa State University, 1994 Submitted to the Department of Materials Science and Engineering in Partial Fulfillment of the Requirements for the Degree of Doctor of Philosophy in Ceramics at the MASSACHUSETTS INSTITUTE OF TECHNOLOGY September 1999 © 1999 Massachusetts Institute of Technology. All rights reserved. Signature of Author: Department of Materials Science and Engineering August 6, 1999 Certified by: Jackie Y.'-Ying Associate Professor of Chemical Engineering Thesis Supervisor Read by: Yet-Min Chiang C/ocera Professor of eramics Accepted by: Linn W. Hobbs John F. Elliott Professor of Materials Chairman, Departmental Committee on Graduate Students I IT1
Transcript of Synthesis and Sintering of Nanocrystalline Alumina and ...
Synthesis and Sintering of Nanocrystalline Alumina andAluminum Nitride
by
Martin Lawrence Panchula
M.S. Materials Science, Iowa State University, 1994
B.S. Ceramic Engineering, Iowa State University, 1994
Submitted to the Department of Materials Science and Engineering in Partial Fulfillment ofthe Requirements for the Degree of
Doctor of Philosophy in Ceramics
at the
MASSACHUSETTS INSTITUTE OF TECHNOLOGY
September 1999
© 1999 Massachusetts Institute of Technology. All rights reserved.
Signature of Author:Department of Materials Science and Engineering
August 6, 1999
Certified by:Jackie Y.'-Ying
Associate Professor of Chemical EngineeringThesis Supervisor
Read by:Yet-Min Chiang
C/ocera Professor of eramics
Accepted by:Linn W. Hobbs
John F. Elliott Professor of MaterialsChairman, Departmental Committee on Graduate Students
I IT1
Synthesis and Sintering of Nanocrystalline Alumina andAluminum Nitride
by
Martin Lawrence Panchula
Submitted to the Department of Materials Science & Engineeringon August 6, 1999 in Partial Fulfillment of the Requirements
for the Degree of Doctor of Philosophy in Ceramics
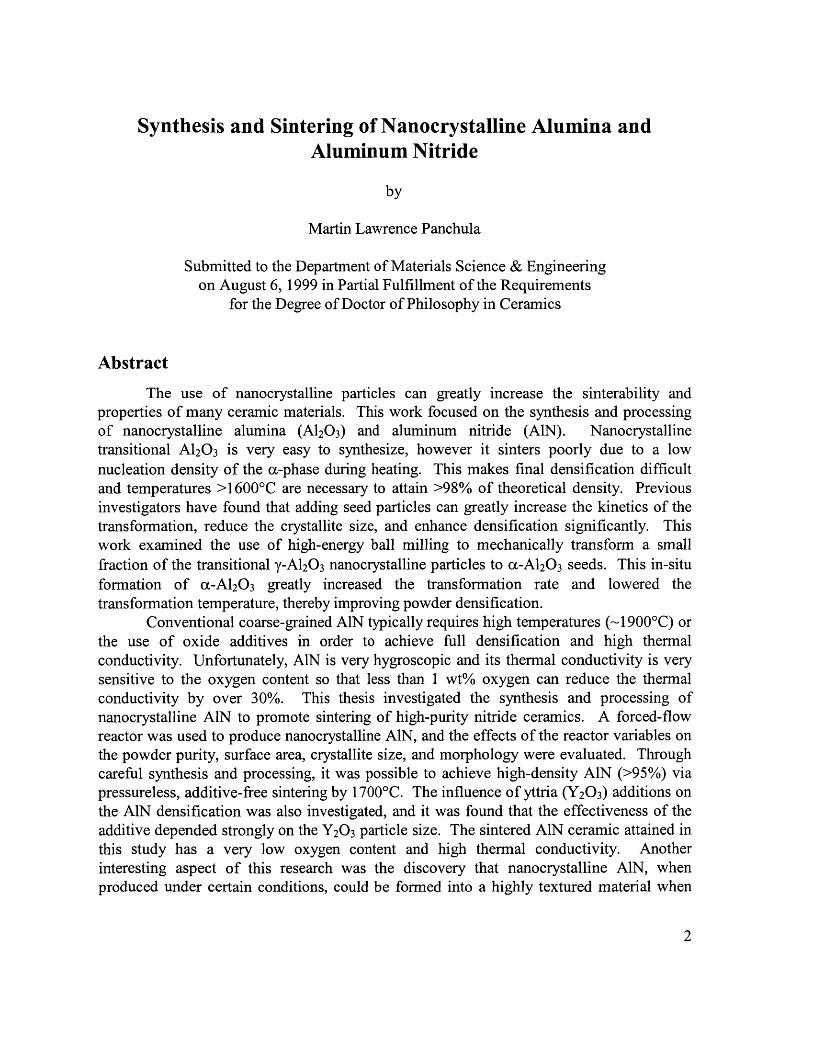
Abstract
The use of nanocrystalline particles can greatly increase the sinterability andproperties of many ceramic materials. This work focused on the synthesis and processingof nanocrystalline alumina (A120 3) and aluminum nitride (AlN). Nanocrystallinetransitional A12 0 3 is very easy to synthesize, however it sinters poorly due to a lownucleation density of the a-phase during heating. This makes final densification difficultand temperatures >1600'C are necessary to attain >98% of theoretical density. Previousinvestigators have found that adding seed particles can greatly increase the kinetics of thetransformation, reduce the crystallite size, and enhance densification significantly. Thiswork examined the use of high-energy ball milling to mechanically transform a smallfraction of the transitional y-A120 3 nanocrystalline particles to a-A120 3 seeds. This in-situformation of a-A120 3 greatly increased the transformation rate and lowered thetransformation temperature, thereby improving powder densification.
Conventional coarse-grained AlN typically requires high temperatures (~1 900'C) orthe use of oxide additives in order to achieve full densification and high thermalconductivity. Unfortunately, AlN is very hygroscopic and its thermal conductivity is verysensitive to the oxygen content so that less than 1 wt% oxygen can reduce the thermalconductivity by over 30%. This thesis investigated the synthesis and processing ofnanocrystalline AlN to promote sintering of high-purity nitride ceramics. A forced-flowreactor was used to produce nanocrystalline AlN, and the effects of the reactor variables onthe powder purity, surface area, crystallite size, and morphology were evaluated. Throughcareful synthesis and processing, it was possible to achieve high-density AlN (>95%) viapressureless, additive-free sintering by 1700'C. The influence of yttria (Y20 3) additions onthe AlN densification was also investigated, and it was found that the effectiveness of theadditive depended strongly on the Y20 3 particle size. The sintered AlN ceramic attained inthis study has a very low oxygen content and high thermal conductivity. Anotherinteresting aspect of this research was the discovery that nanocrystalline AlN, whenproduced under certain conditions, could be formed into a highly textured material when
2

hot pressed. Such bulk textured AIN materials are unique, and offer interesting possibilitiesfor piezoelectric applications, especially at high temperatures.
Thesis Supervisor: Jackie Y. YingTitle: Associate Professor of Chemical Engineering
3
Acknowledgments
I thank my advisor, Professor Jackie Ying, for the opportunity to work in her
laboratory with an exceptional group of researchers. The effort required to support such a
group is very much appreciated. I also thank my committee members, Professors Yet-Ming
Chiang and Sam Allen, for their helpful discussions and interest in this research.
I appreciate the friendship and assistance of Dr. Darren Castro, the designer and
builder of the forced-flow reactor that made the research on nanocrystalline AlN possible. I
thank Beatrice Wang for her help with the mechanical seeding and hot pressing of y-A120 3.
The assistance of Andrey Zarur for high-resolution TEM and light scattering studies and
Michael Wong and Mark Fokema for photoacoustic FTIR and DRIFT measurements is
greatly appreciated. The efforts of undergraduate students Jessica West, Reginald Rogers,
and Ranjit Survanshi, are also acknowledged. Finally, the friendship and assistance of the
many other members of the group must be recognized; without their presence the lab would
have certainly been a less interesting and educational place to work.
My thanks are also extended to Vista Chemical Company and H. C. Starck, Inc. for
samples of their products. Special thanks are given to Mike Frongillo of the Center for
Materials Science and Engineering for all his assistance and patient training with the
electron microscopes.
Finally, my greatest appreciation is reserved for my wife, Lynann, and my family.
Lynann's patient support permitted me the freedom to pursue a Ph.D. program, and the
influence of my parents and family on my goals, values, and accomplishments cannot be
overstated. I also acknowledge my grandmother, Delia Carri6n Fischer, to whom this thesis
is dedicated. Although she passed away before I completed my Ph.D., she was always one
of my proudest supporters and instilled within me, and the rest of her family, a love for
education and life.
This research was sponsored by the Office of Naval Research, Robert Bosch GmbH,
and the MIT Sloan Fund. Financial support also came from the National Science
Foundation Graduate Fellowship program.
4
Table of Contents
T itle P age ............................................................................................ ........................... 1
A b stract.................................................................................................... . ---------.. .......... 2
A cknow ledgm ents ..........................................................................................---............ ..... 4
T able of C ontents................................................................................. . -... ---..............-- 5
List of Figures................................................................................ ...... --------..................... 8
L ist of T ables ................................................................. ................---------------...................... 13
1. Introduction .......................................................................... ................----................... 14
1.1 Nanocrystalline Materials............................................................................. 14
1.1.1 Definition............................................... 14
1.1.2 Properties ................................................................................... 14
1.1.3 U ses and A pplications .................................................................................... 15
1.1.4 Nanoparticle Synthesis Methods ................................................................... 17
1.2 A lum ina ................................................................... .... ........................................... 18
1.2 .1 Introduction ................................................................................ .... .. ...... 18
1.2.2 Metastable Forms and Phase Transformations ............................................. 18
1.2.3 R esearch Objectives ............................................................................... ... 20
1.3 Aluminum Nitride ................................................................ ........ 21
1.3.1 Introduction ........................................................................... 21
1.3.2 Conventional Processing ....................................................................... 22
1.3.3 Research Objectives ......................................................................... 24
1.4 References ................................................................... ..........- -. 25
2. Transformation Kinetics of Mechanically Seeded Alumina..................................... 28
2.1 Introduction ................................................................................ 28
2.1.1 Background...................................................................... 28
2.1.1.1 Isostructural Seeding .......................................................... ......... ..... 29
2.1.1.2 c-A12O3 Seeding .................................................................... ... 30
2.1.1.3 High-Energy Approaches .............................................................. 30
5
2.2 Experim ental............................................................................................................. 32
2.3 Effects of High-Energy Ball M illing ................................................................... 33
2.3.1 Effect of M illing Tim e.................................................................................. 33
2.3.2 Effects on Phase Transform ation Tem perature ............................................. 35
2.3.3 Transform ation under Isotherm al Heat Treatm ents....................................... 37
2.3.4 Application of JM AK M odel............................................................................ 39
2.4 M odeling of Phase Transform ations in Finite Particles ........................................ 44
2.4.1 Derivation of Spherical Finite Particle M odel............................................. 44
2.4.2 Finite Size Effects on Seeded and Unseeded Systems ................................. 46
2.4.3 Effect of Finite Particle Size on Evaluation of Transformation Kinetics......... 50
2.5 Conclusions .............................................................................................................. 52
2.6 References ................................................................................................................ 53
3. Densification and Microstructural Characterization of Alumina ............................. 58
3.1 Post-HEBM Processing ............................................................................................ 58
3.2 Densification............................................................................................................. 59
3.2.1 Effect of Seeding on Alum ina Densification................................................ 60
3.3 M icrostructure ...................................................................................................... 67
3.3.1 Fracture Surfaces ........................................................................................... 67
3.3.2 Polished and Etched Surfaces...................................................................... 69
3.3.3 Grain Growth................................................................................................ 70
3.4 Conclusions .............................................................................................................. 72
3.5 References ................................................................................................................ 73
4. Synthesis of N anocrystalline Alum inum Nitride.......................................................... 75
4.1 Reactor Design and M odifications ........................................................................ 75
4.1.1 Reactor V ariables and Effects ...................................................................... 77
4.1.2 Synthesis M ethods......................................................................................... 78
4.1.2.1 Ex-Situ N itridation .................................................................................... 78
4.1.2.2 In-Situ N itridation..................................................................................... 81
6
4.2 Reactor Characterization ...................................................................................... 82
4.2.1 Effects of Reactor Pressure and Gas Com position........................................ 83
4.2.2 Effect of Gas Velocity .................................................................................. 85
4.3 Particle Characterization....................................................................................... 86
4.3.1 Electron M icroscopy.................................................................................... 86
4.3.2 Chem ical Analysis......................................................................................... 89
4.3.3 Surface analysis ............................................................................................. 90
4.4 Conclusions .............................................................................................................. 92
4.5 References ............................................................................................................. 93
5. Densification and Characterization of Aluminum Nitride .................... 95
5.1 Pressureless D ensification .................................................................................... 95
5.1.1 Effect of Synthesis Conditions ...................................................................... 96
5.1.2 Additive-free Sintering .................................................................................. 97
5.1.3 Effect of Y20 3 Additions................................................................................ 101
5.2 Therm al Conductivity Properties............................................................................ 108
5.3 H ot Pressing.................................................................................... . .... 112
5.4 Conclusions ................................................................................................ 117
5.5 References ................................................................................................. 117
6. Conclusions ......................................................................................... ...... 120
7
List of Figures
Figure 1-1. Grain boundary volume fraction and surface area as a function ofcrystallite size or particle size, respectively. Grain boundary volume fraction wascalculated assuming a 5 A-thick grain boundary; surface area was calculated fordense m onodisperse spherical AlN particles ................................................................... 15
Figure 1-2. Schematic of alumina phase transformations with thermal treatments,from W efers and M isra [1] ............................................................................................... 19
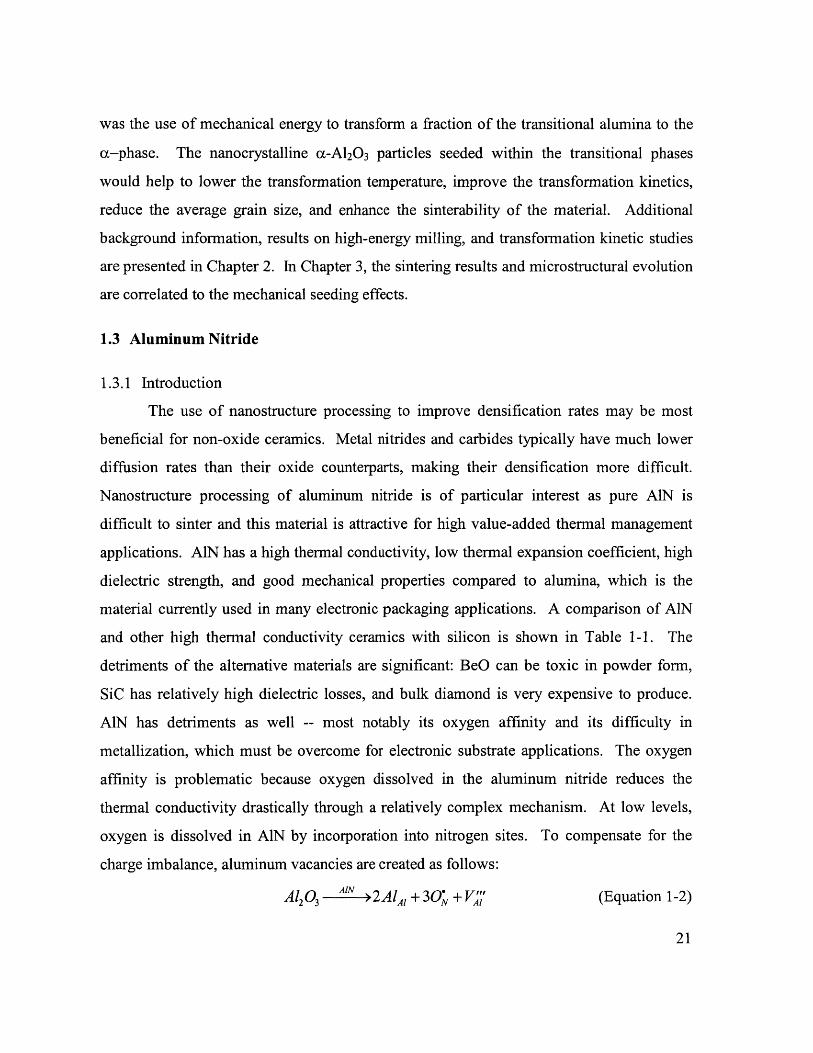
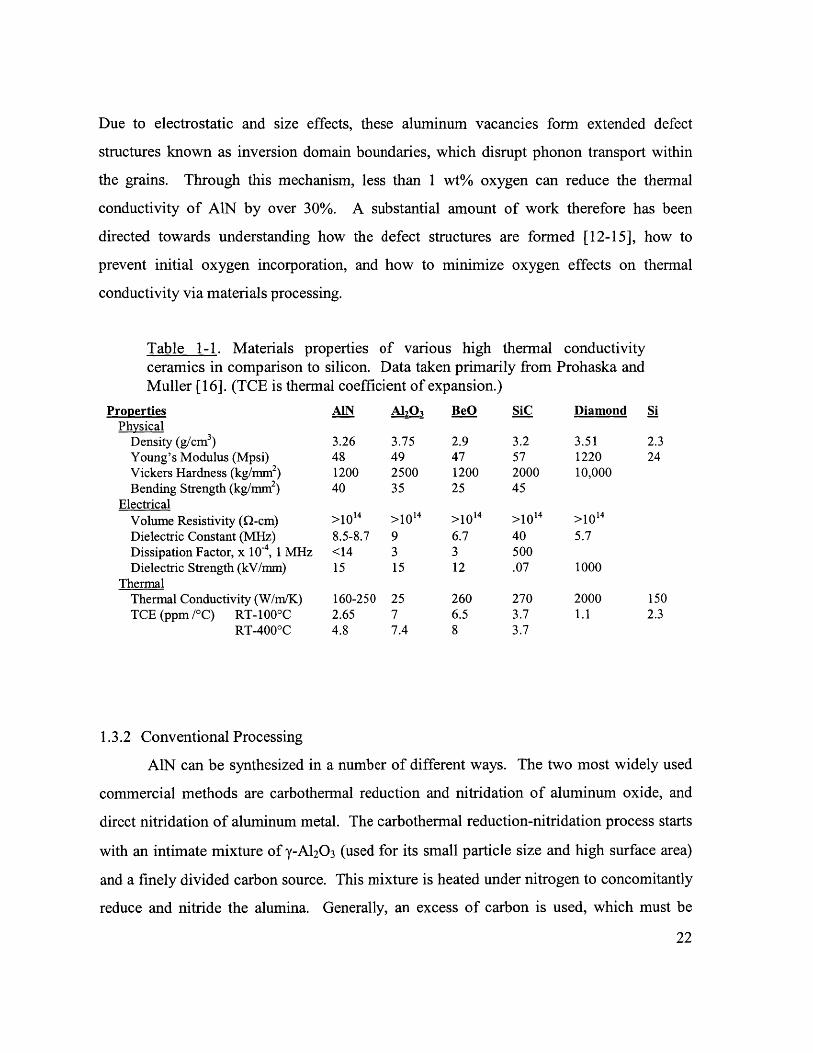
Figure 1-3. Fracture surfaces of y-A120 3 hot pressed for 30 minutes under 50 MPa at(a) 1100 C, (b) 1200'C, and (c) 1400'C. ......................................................................... 20
Figure 2-1. X-ray diffraction patterns of y-A12 03 powder after milling for differentperiods with a W C/Co ball-and-vial set. ......................................................................... 34
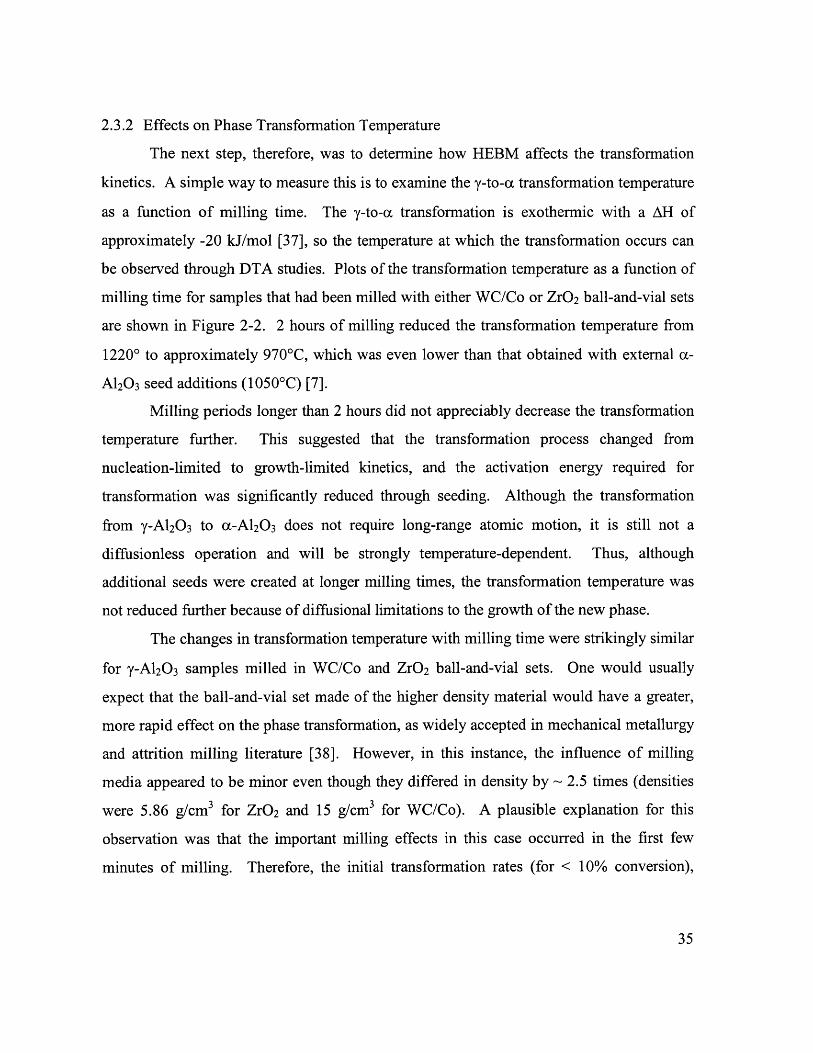
Figure 2-2. Transformation exothermic peak temperature and B.E.T. surface area asa function of milling time for y-A120 3 milled with (a) WC/Co and (b) ZrO2 ball-and-v ial sets. ................................................................................................................................ 3 6
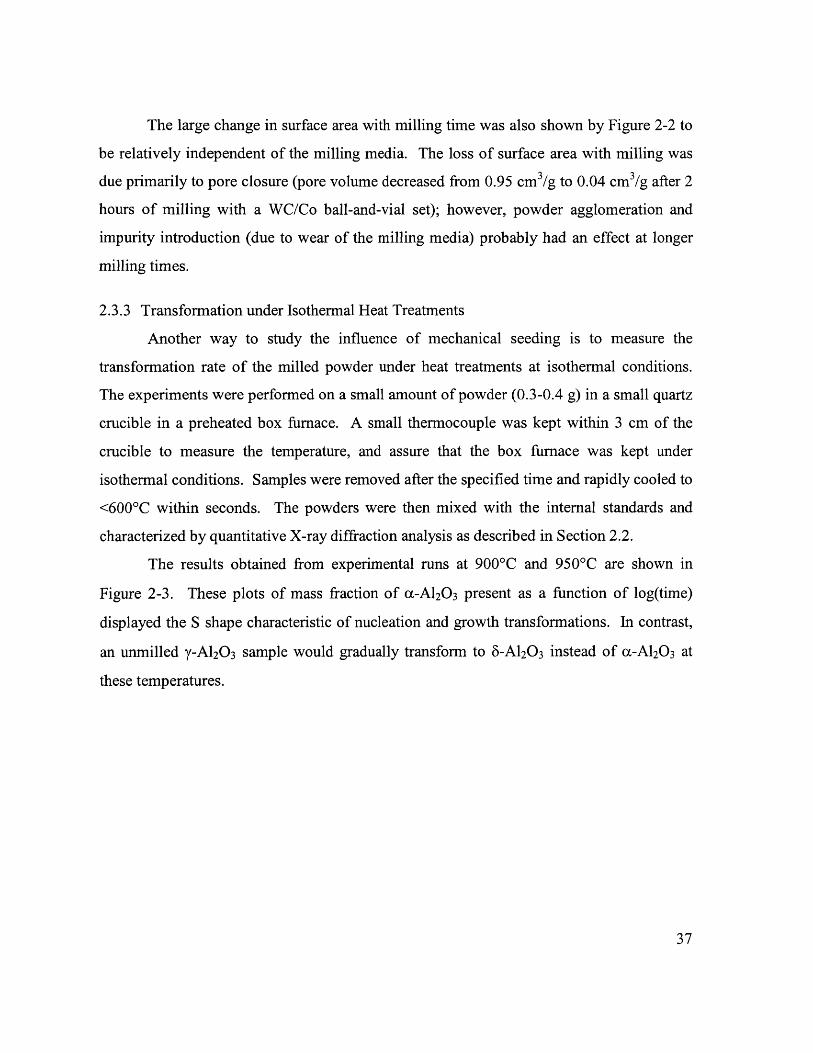
Figure 2-3. Mass fraction of a-A120 3 present in the y-A120 3 samples after they hadbeen milled in a WC/Co ball-and-vial set and heat treated for various time periods(in seconds) at (a) 900'C and (b) 950'C........................................................................... 38
Figure 2-4. Linearized plots of the transformation data of Figure 2-3 obtained fromisothermal heat treatments at (a) 900'C and (b) 950'C, showing a reasonable fitwith the JMAK generalized transformation model (Equation 2-4). The y-A120 3samples studied were milled in a WC/Co ball-and-vial set and heat treatedisothermally for various time periods (in seconds).......................................................... 41
Figure 2-5. Error analysis for the linearized transformation data shown in Figure 2-4, assuming an uncertainty of (a) 3% and (b) 5% in the mass fraction of x-A120 3determined through quantitative XRD analysis............................................................... 42
Figure 2-6. An Arrhenius plot of the kinetic results obtained through JMAK fittingof the isothermal transformation data for y-A120 3 samples milled in a WC/Co ball-an d -v ial set............................................................................................................................ 4 3
Figure 2-7. Cross-section of particle and nucleation volumes at different times. ............ 45
Figure 2-8. An exploded view of the cone of influence expanding backwards in timefrom a point q through a spherical particle. The impinged region for the conevolume is given as a function of particle size R, distance from center of particle s,and grow th rate G . ................................................................................................................ 45
Figure 2-9. Isothermal transformation plots as a function of time (in seconds) forunseeded systems (spontaneous nucleation I at 106 events/cm 3.s) of different particlesizes (G = 4 ^ /s)................................................................................................................... 49
8
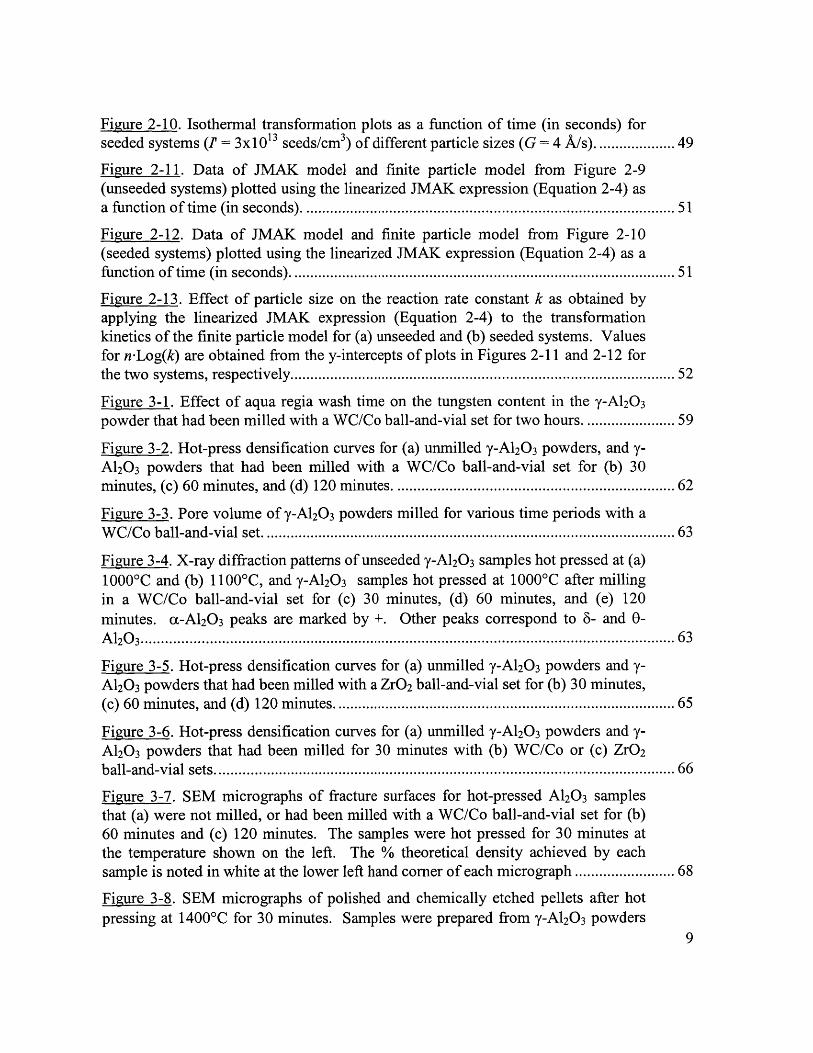
Figure 2-10. Isothermal transformation plots as a function of time (in seconds) forseeded systems (1' = 3x10 13 seeds/cm 3) of different particle sizes (G = 4 A/s)................ 49
Figure 2-11. Data of JMAK model and finite particle model from Figure 2-9(unseeded systems) plotted using the linearized JMAK expression (Equation 2-4) asa function of tim e (in seconds). ......................................................................................... 51
Figure 2-12. Data of JMAK model and finite particle model from Figure 2-10(seeded systems) plotted using the linearized JMAK expression (Equation 2-4) as afunction of tim e (in seconds)............................................................................................. 51
Figure 2-13. Effect of particle size on the reaction rate constant k as obtained byapplying the linearized JMAK expression (Equation 2-4) to the transformationkinetics of the finite particle model for (a) unseeded and (b) seeded systems. Valuesfor n-Log(k) are obtained from the y-intercepts of plots in Figures 2-11 and 2-12 forthe tw o system s, respectively........................................................................................... 52
Figure 3-1. Effect of aqua regia wash time on the tungsten content in the y-A120 3powder that had been milled with a WC/Co ball-and-vial set for two hours. ................... 59
Figure 3-2. Hot-press densification curves for (a) unmilled y-A120 3 powders, and y-A12 0 3 powders that had been milled with a WC/Co ball-and-vial set for (b) 30minutes, (c) 60 m inutes, and (d) 120 minutes. .................................................................. 62
Figure 3-3. Pore volume of y-A120 3 powders milled for various time periods with aW C /C o ball-and-vial set .................................................................................................... 63
Figure 3-4. X-ray diffraction patterns of unseeded y-A120 3 samples hot pressed at (a)1 0000 C and (b) 11 000 C, and y-A120 3 samples hot pressed at 1000'C after millingin a WC/Co ball-and-vial set for (c) 30 minutes, (d) 60 minutes, and (e) 120minutes. a-A120 3 peaks are marked by +. Other peaks correspond to 6- and 0-A 120 3..................................................................................................................................... 6 3
Figure 3-5. Hot-press densification curves for (a) unmilled y-A120 3 powders and y-A120 3 powders that had been milled with a ZrO2 ball-and-vial set for (b) 30 minutes,(c) 60 m inutes, and (d) 120 m inutes................................................................................. 65
Figure 3-6. Hot-press densification curves for (a) unmilled y-A120 3 powders and y-A120 3 powders that had been milled for 30 minutes with (b) WC/Co or (c) ZrO2
b all-an d -v ial sets................................................................................................................... 66
Figure 3-7. SEM micrographs of fracture surfaces for hot-pressed A12 0 3 samplesthat (a) were not milled, or had been milled with a WC/Co ball-and-vial set for (b)60 minutes and (c) 120 minutes. The samples were hot pressed for 30 minutes atthe temperature shown on the left. The % theoretical density achieved by eachsample is noted in white at the lower left hand corner of each micrograph ..................... 68
Figure 3-8. SEM micrographs of polished and chemically etched pellets after hotpressing at 1400'C for 30 minutes. Samples were prepared from y-A120 3 powders
9
that had been milled with a WC/Co ball-and-vial set for (a) 30 minutes and (b) 120m in u tes. ................................................................................................................................ 7 0
Figure 3-9. Grain growth trajectories for hot-pressed alumina samples that had beenmilled in a WC/Co ball-and-vial set for (a) 30 minutes, (b) 60 minutes, and (c) 120minutes. Grain sizes for samples <90% dense (open symbols) and 90% dense(filled symbols) were estimated from fracture surfaces and polished/etched surfaces,resp ectiv ely ........................................................................................................................... 72
Figure 4-1. Schematic of the forced-flow reactor used in the production ofnanocrystalline metals and metal nitrides (adapted from D.T. Castro [1])....................... 76
Figure 4-2. Nitridation of nanocrystalline aluminum vs. commercial aluminum(Aldrich) when heated in a nitrogen atmosphere in the TGA........................................... 80
Figure 4-3. X-ray diffraction patterns of (a) the starting nanocrystalline aluminumpowder, and (b) the nanocrystalline AlN powder produced by ex-situ nitridation ofnanocrystalline aluminum with nitrogen in the TGA at 900*C........................................ 80
Figure 4-4. X-ray diffraction patterns of powders produced in the forced-flowreactor with (a) 45 vol% nitrogen, (b) 45 vol% nitrogen with the microwaveoperated at 800 W, and (c) 27 vol% ammonia; helium was used as the carrier gas inall cases.................................................................................................................................82
Figure 4-5. Crystallite sizes of AlN produced at various reactor pressures with (a)helium and (b) nitrogen as the carrier gas. The variability in the data was due todifferences in the gas velocity used (see Section 4.2.2), and the increased error inScherrer's analysis as the crystallite size approached 100 nm. ......................................... 84
Figure 4-6. Surface areas of AlN produced at various reactor pressures with(a) helium and (b) nitrogen as the carrier gas. The variability in the data at a givenpressure was due to differences in the gas velocity used (see Section 4.2.2)................... 84
Figure 4-7. Surface areas and crystallite sizes of AlN powders produced with aHe/NH 3 gas mixture at 10 mbar under different gas velocities........................................ 86
Figure 4-8. TEM micrograph of nanocrystalline AlN produced at 7 mbar in a 2.3-slpm gas stream with 27 vol% NH3 and 73 vol% He...................................................... 87
Figure 4-9. Transmission electron micrographs of nanocrystalline AlN powderssynthesized in the forced-flow reactor via in-situ nitridation with NH 3. The powderswere produced with (a,b) nitrogen or (c,d) helium as the carrier gas. The reactorpressure was 20 mbar for samples (a) and (c), and 30 mbar for samples (b) and (d).The scale bar is 100 nm .................................................................................................... 88
Figure 4-10. High-resolution TEM micrographs of (a) nanocrystalline and(b) com m ercial A lN pow ders .......................................................................................... 89
10
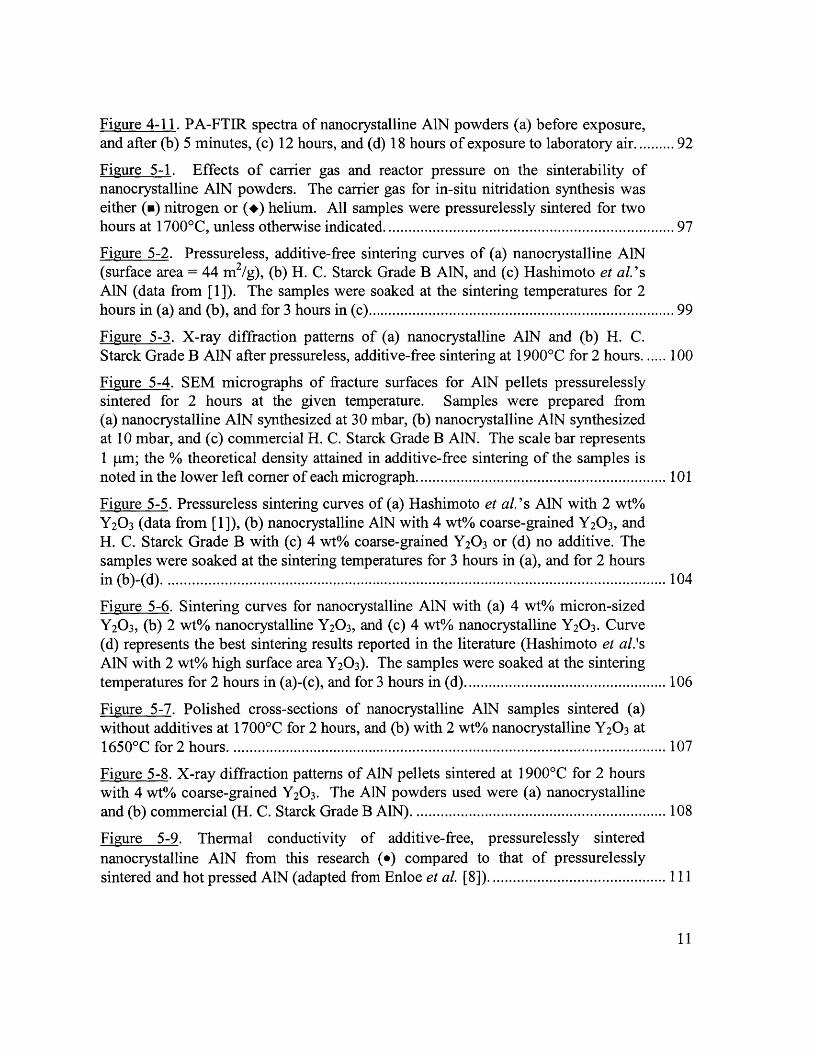
Figure 4-11. PA-FTIR spectra of nanocrystalline AIN powders (a) before exposure,and after (b) 5 minutes, (c) 12 hours, and (d) 18 hours of exposure to laboratory air.......... 92
Figure 5-1. Effects of carrier gas and reactor pressure on the sinterability ofnanocrystalline AIN powders. The carrier gas for in-situ nitridation synthesis waseither (m) nitrogen or (+) helium. All samples were pressurelessly sintered for twohours at 1700'C, unless otherwise indicated................................................................... 97
Figure 5-2. Pressureless, additive-free sintering curves of (a) nanocrystalline AJN(surface area = 44 m2/g), (b) H. C. Starck Grade B AIN, and (c) Hashimoto et al. 'sAlN (data from [1]). The samples were soaked at the sintering temperatures for 2hours in (a) and (b), and for 3 hours in (c)........................................................................ 99
Figure 5-3. X-ray diffraction patterns of (a) nanocrystalline AlN and (b) H. C.Starck Grade B AlN after pressureless, additive-free sintering at 1900'C for 2 hours...... 100
Figure 5-4. SEM micrographs of fracture surfaces for AlN pellets pressurelesslysintered for 2 hours at the given temperature. Samples were prepared from(a) nanocrystalline AlN synthesized at 30 mbar, (b) nanocrystalline AlN synthesizedat 10 mbar, and (c) commercial H. C. Starck Grade B AlN. The scale bar represents1 ptm; the % theoretical density attained in additive-free sintering of the samples isnoted in the lower left corner of each micrograph.............................................................. 101
Figure 5-5. Pressureless sintering curves of (a) Hashimoto et al.'s AlN with 2 wt%Y2 0 3 (data from [1]), (b) nanocrystalline AIN with 4 wt% coarse-grained Y2 0 3, andH. C. Starck Grade B with (c) 4 wt% coarse-grained Y20 3 or (d) no additive. Thesamples were soaked at the sintering temperatures for 3 hours in (a), and for 2 hoursin (b )-(d ). ............................................................................................................................ 104
Figure 5-6. Sintering curves for nanocrystalline AlN with (a) 4 wt% micron-sizedY2 0 3 , (b) 2 wt% nanocrystalline Y20 3, and (c) 4 wt% nanocrystalline Y2 0 3. Curve(d) represents the best sintering results reported in the literature (Hashimoto et al.'sAlN with 2 wt% high surface area Y20 3). The samples were soaked at the sinteringtemperatures for 2 hours in (a)-(c), and for 3 hours in (d).................................................. 106
Figure 5-7. Polished cross-sections of nanocrystalline AIN samples sintered (a)without additives at 1700'C for 2 hours, and (b) with 2 wt% nanocrystalline Y2 0 3 at1650'C for 2 hours. ............................................................................................................ 107
Figure 5-8. X-ray diffraction patterns of AlN pellets sintered at 1900'C for 2 hourswith 4 wt% coarse-grained Y20 3. The AlN powders used were (a) nanocrystallineand (b) comm ercial (H. C. Starck Grade B AlN). .............................................................. 108
Figure 5-9. Thermal conductivity of additive-free, pressurelessly sinterednanocrystalline AlN from this research (*) compared to that of pressurelesslysintered and hot pressed AlN (adapted from Enloe et al. [8])............................................ 111
11
Figure 5-10. Densification of nanocrystalline AIN powder produced at 7 mbar in aHe/NH3 gas stream. The samples were hot pressed at 10 0C/min with the appliedpressure specified and held at 1900'C for 1 hour (except otherwise noted). ..................... 113
Figure 5-11. X-ray diffraction patterns of AIN pellets after hot pressing at 50 MPaand 1900'C for 1 hour. The powders used were (a) nanocrystalline AIN synthesizedat 10 mbar in a He/NH3 gas stream and (b) H. C. Starck Grade B AIN............................. 115
Figure 5-12. Ratio of the (002) XRD peak height in hot-pressed nanocrystalline AINsample and that in an untextured AIN standard as a function of tilt angle......................... 116
12
List of Tables
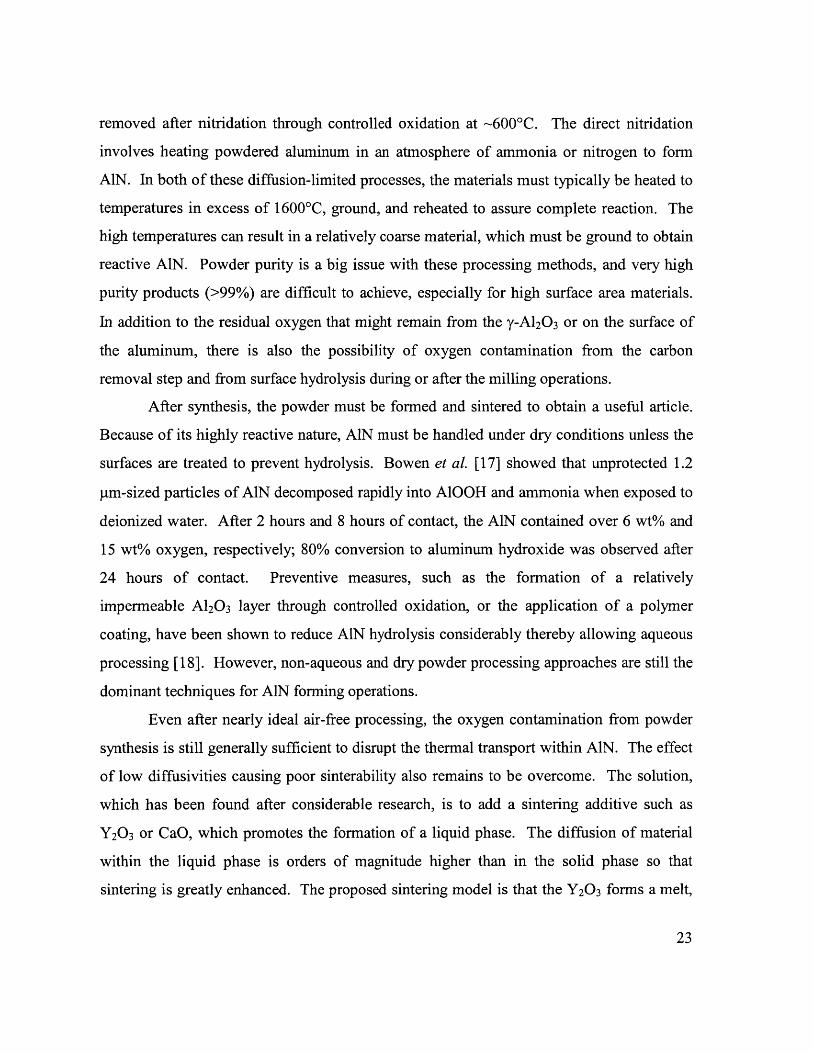
Table 1-1. Materials properties of various high thermal conductivity ceramics incomparison to silicon. Data taken primarily from Prohaska and Muller [16]. (TCEis therm al coefficient of expansion.) ................................................................................. 22
Table 2-1. Activation energies associated with the y-to-a phase transformation forv ariou s sy stem s..................................................................................................................... 4 3
Table 3-1. Chemical analysis of y-A120 3 samples milled with WC/Co or ZrO2 ball-and-vial sets. WC/Co-milled samples were washed with aqua regia for ~15 hoursb efore an aly sis......................................................................................................................62
Table 4-1. Forced-flow reactor variables, ranges of conditions, and standardoperating conditions for in-situ synthesis of nanocrystalline AlN (see Section 4.1.2for d etails)............................................................................................................................. 7 8
Table 4-2. Comparison of commercial and nanocrystalline AlN powders....................... 90
Table 5-1. Laser flash thermal diffusivity results for AlN samples pressurelesslysintered at 1900'C for 2 hours. Y20 3 additives used were low surface area powders. ...... 109
13
1. Introduction
1.1 Nanocrystalline Materials
1.1.1 Definition
Nanocrystalline is a term used to describe a crystalline material with a particle or
grain size less than 100 nm. Conventional materials, both bulk (such as steel or concrete)
and powdered (such as sand or table salt), typically have grain sizes on the orders of
microns to millimeters. By reducing the grain or particle size to the nanometer regime, the
specific surface area and grain boundary volume of these materials are greatly increased,
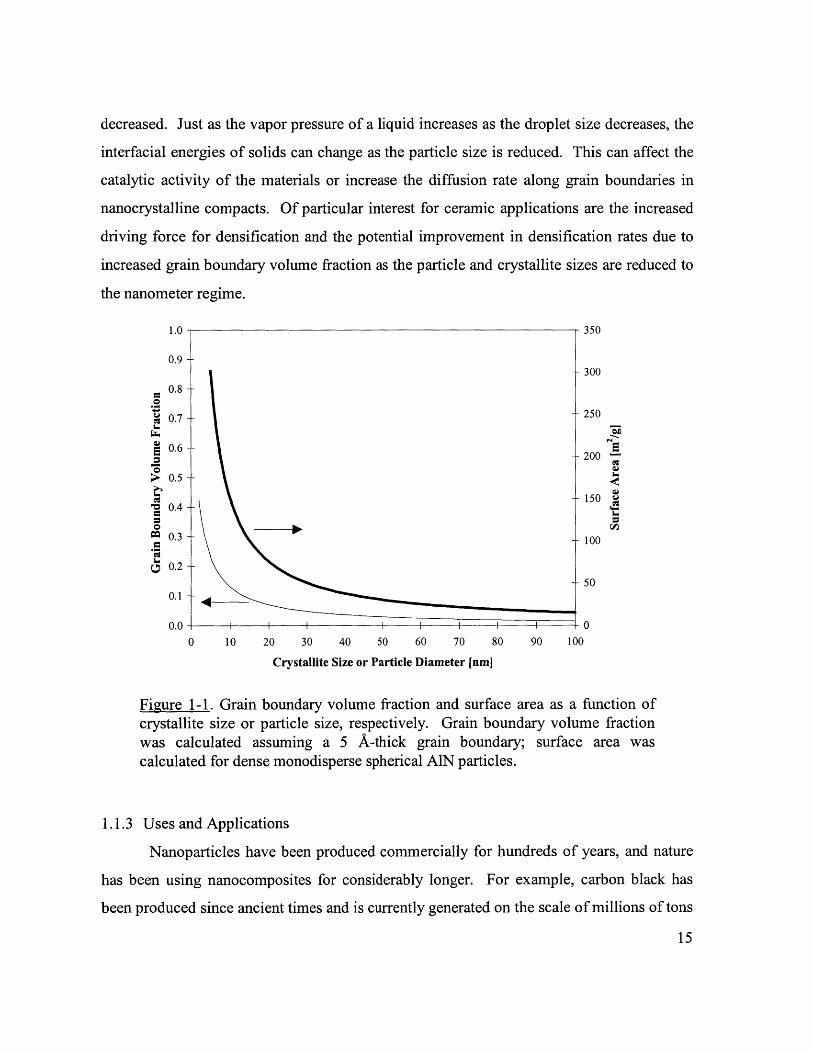
which can have a large effect on the properties of the materials. Figure 1-1 shows the
change in surface area and grain boundary volume fraction as the particle or grain size of a
material is decreased. If the surface or grain boundary structure or chemistry is different
from the bulk, then the nanocrystalline materials should exhibit behavior different from
their microcrystalline form. The properties of the material can also change due to quantum
confinement effects rather than interfacial effects. Electronic properties (as observed in
quantum dots and wires), magnetic properties (exhibited through superparamagnetism or
giant magnetoresistance), and optical properties (such as a shift in the absorption edge) can
be dominated by quantum confinement effects. It is these differences between the bulk and
nanocrystalline systems and the associated potential applications that have spawned
numerous research programs on nanocrystalline materials around the world.
1.1.2 Properties
The creation of a surface or interface, such as cleaving a crystal, requires an increase
in the energy of the system. The interfaces produced are locations of higher bond strains
and relatively high disorder compared to the bulk crystal. In addition, interfaces can
produce charge effects by adsorption of charged species onto the surface, or through the
intrinsically produced ion concentration gradients in the near-interface region. These
effects become more pronounced as the particle size and the radius of curvature are
14
decreased. Just as the vapor pressure of a liquid increases as the droplet size decreases, the
interfacial energies of solids can change as the particle size is reduced. This can affect the
catalytic activity of the materials or increase the diffusion rate along grain boundaries in
nanocrystalline compacts. Of particular interest for ceramic applications are the increased
driving force for densification and the potential improvement in densification rates due to
increased grain boundary volume fraction as the particle and crystallite sizes are reduced to
the nanometer regime.
1.0- 350
0.9300
0.8
250S0.7
0.6 -200
0.5 --
1500.4
0.3 -- 100
r 0.250
0.1
0.0 - I I I I I I I -0
0 10 20 30 40 50 60 70 80 90 100
Crystallite Size or Particle Diameter [nm]
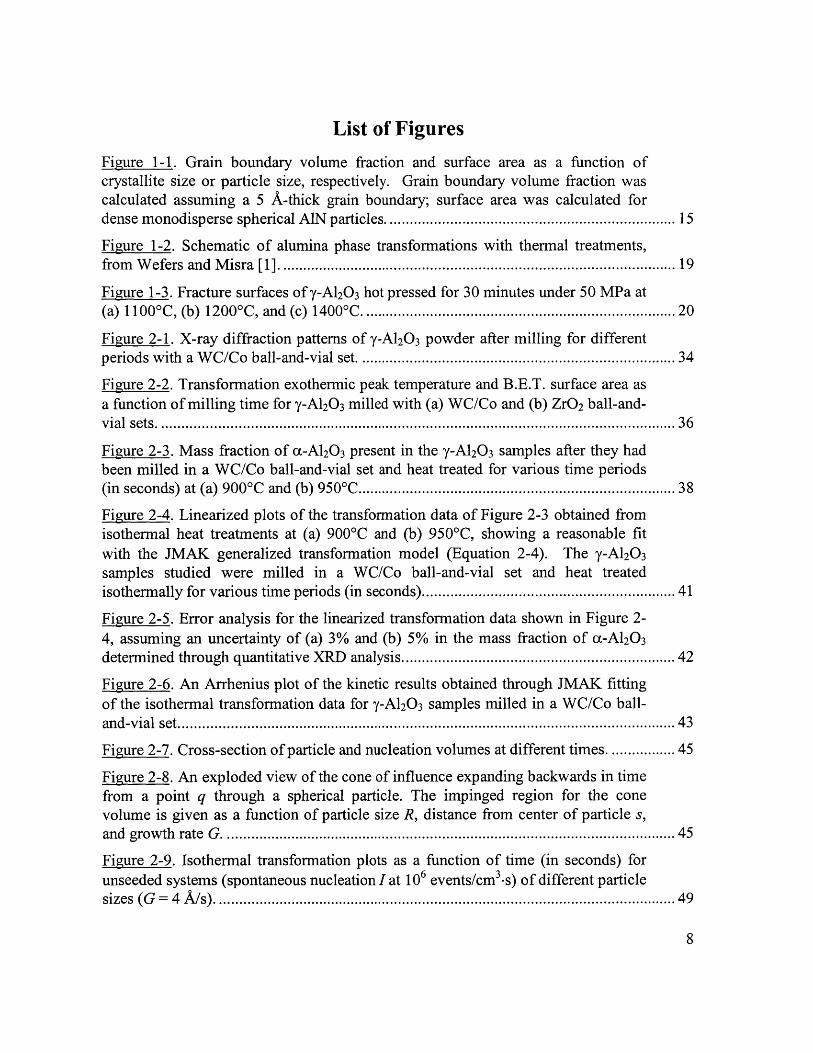
Figure 1-1. Grain boundary volume fraction and surface area as a function ofcrystallite size or particle size, respectively. Grain boundary volume fractionwas calculated assuming a 5 A-thick grain boundary; surface area wascalculated for dense monodisperse spherical AlN particles.
1.1.3 Uses and Applications
Nanoparticles have been produced commercially for hundreds of years, and nature
has been using nanocomposites for considerably longer. For example, carbon black has
been produced since ancient times and is currently generated on the scale of millions of tons
15
per year for use in automobile tires and other products. Large quantities of silica and titania
nanoparticles are also produced for abrasive and pigment applications. Biologically,
nanocomposites such as bone (which is made of nanocrystalline carbonated apatite and
collagen) are used where a light-weight, high elastic modulus, and high fracture toughness
material is required. The highly complex nanostructures that have been constructed by
nature for millions of years (e.g. seashells) are only now being simulated and replicated by
human technology, albeit generally at a much simpler level.
Most of the current research on nanocrystalline materials is focused on high value-
added, engineered systems whereby the material is designed at the nanometer scale to
optimize specific properties for catalytic, electronic, optical, or magnetic applications. Also
of interest is the generation of nanoparticles for production of bulk ceramic articles. The
goal of such research is to understand, optimize, and reduce the costs of nanoparticle
synthesis and processing to (i) produce materials that can be densified at lower temperatures
and (ii) enhance the properties or lower the cost of specialized products. The improved
densification of nanoparticulate compacts is due in part to the high surface areas of these
materials, which result in a large driving force for sintering. The decrease in diffusion
distances and the increased grain boundary volume in nanoparticulate systems also enhance
the densification kinetics. These effects are illustrated through a generalized densification
rate equation,
dp 1dt N exp(-Q/R T) (Equation 1-1)dt G
where the sintering rate (dp/dt) is inversely proportional to the grain size (G) to the third or
fourth power (N), depending on whether surface or grain boundary diffusion dominates the
sintering. Thus, by decreasing the particle size by a factor of 10, the sintering rate could
increase by a factor of 1000 or more. This would have a direct impact on the cost of
producing dense parts by reducing the temperature and/or time necessary to achieve full
density. In addition, the milder sintering conditions might allow the nanocrystalline
structure to be retained after densification, and the ultrafine grain size could lead to
16
improved mechanical properties such as hardness, strength, and wear resistance. However,
the high costs of nanoparticle production, materials handling difficulties, and purity issues
have thus far limited the widespread commercial application of nanocrystalline ceramics.
1.1.4 Nanoparticle Synthesis Methods
Ceramic nanoparticles are produced by many different methods that can be broadly
categorized as wet-chemical synthesis, combustion synthesis, attrition, and gas-phase
reaction techniques. Wet-chemical synthesis techniques encompass precipitation,
hydrolysis-condensation reactions, salt reactions followed by calcination, etc. whereby the
particle morphology is defined while in a liquid medium. Combustion synthesis techniques
include flash pyrolysis of oxidizer/fuel mixtures, flame pyrolysis, and rapid evaporation
techniques whereby the particles are formed very rapidly as the reactants undergo rapid
heating. The attrition techniques, which have been used mostly for the preparation of
nanocrystalline and amorphous metallic systems, utilize mechanical energy to obtain a
nanocrystalline structure from typically microcrystalline starting materials. The gas-phase
techniques, such as plasma reactions, evaporation-condensation reactions, and sputtering,
usually rely on the homogeneous condensation of particles in the gas phase to produce the
desired nanocrystals.
Each of these techniques has a number of advantages and disadvantages, and they
are used in different applications depending on the composition, quantity, and purity that
need to be produced. Since the mid 1980's, there have been significant research efforts
devoted to these nanoparticle synthesis processes. The three synthesis techniques examined
in this thesis were chemical precipitation, mechanical attrition, and gas-phase evaporation-
condensation. Nanostructured alumina was obtained via precipitation and attrition, while
nanocrystalline aluminum nitride particles were produced directly via a condensation-
reaction process.
17
1.2 Alumina
1.2.1 Introduction
Alumina is one of the most widely used and studied ceramic materials. Over 30
million tons are produced each year, and although the majority of this is used for aluminum
production, a considerable amount of alumina is utilized for abrasive, electronic, refractory,
thermal management, optical, and catalytic applications. While the use of alumina in these
various applications has involved a considerable amount of investigation and scientific
understanding, much remains unknown about this material. In part, this is due to the wide
variety of transitional aluminas and hydroxides that can be formed during the synthesis of
alumina (see Section 1.2.2) and the fact that impurities, even at very low levels, can have
significant effects on the electrical properties, phase stability, and diffusion rates. In fact,
the general transformation mechanisms between the different transitional forms were not
agreed upon until recently, and the translational pathways for the topotactical
transformations of the transitional aluminas are still not well understood.
1.2.2 Metastable Forms and Phase Transformations
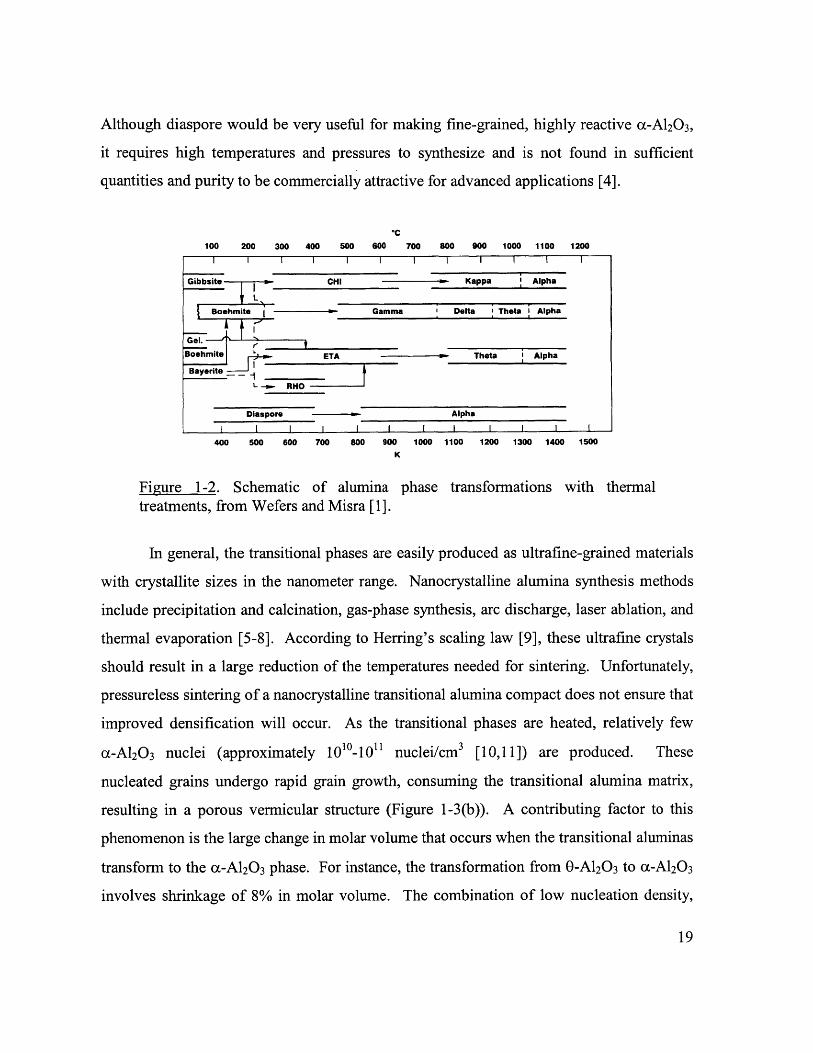
Alumina can exist in a surprisingly large number of structural configurations as
shown in Figure 1-2. If you add to this list the five common hydroxides of alumina, then 14
forms of alumina are observed at atmospheric pressures. The technical report by Wefers
and Misra [1] gives an excellent review of the hydrated and non-hydrated forms of alumina,
and describes the structural differences among the forms as well as the methods to produce
them. Generally, cc-Al 2O3 is considered the thermodynamically stable phase although
recent studies have suggested that at a very fine particle size, y-A120 3 may be the lower
energy crystal structure due to surface energy contributions [2,3]. As shown in Figure 1-2,
the hydroxide phases from which the aluminas are derived can have a large effect on the
crystal forms that evolve during thermal treatments. The only hydrated phase that does not
produce transitional alumina phases during heating is diaspore (Al2O3 -H2O), which
transforms directly to c-A12 0 3 after dehydration at temperatures greater than 500'C.
18
Although diaspore would be very useful for making fine-grained, highly reactive cc-A120 3 ,
it requires high temperatures and pressures to synthesize and is not found in sufficient
quantities and purity to be commercially attractive for advanced applications [4].
.C100 200 300 400 500 600 700 800 900 1000 1100 1200
I I I I I I I I I I
Gibbsite CHI - Kappa Alpha
Boehmite Gamma I Delta I Theta Alpha
Boaehmite , ETA Theta Alpha
Bayerite
L-- RHO
Diaspore Alpha
I I 7 1 1 1 I I I I 1
400 500 600 700 800 900 1000 1100 1200 1300 1400 1500K
Figure 1-2. Schematic of alumina phase transformations with thermaltreatments, from Wefers and Misra [1].
In general, the transitional phases are easily produced as ultrafine-grained materials
with crystallite sizes in the nanometer range. Nanocrystalline alumina synthesis methods
include precipitation and calcination, gas-phase synthesis, arc discharge, laser ablation, and
thermal evaporation [5-8]. According to Herring's scaling law [9], these ultrafine crystals
should result in a large reduction of the temperatures needed for sintering. Unfortunately,
pressureless sintering of a nanocrystalline transitional alumina compact does not ensure that
improved densification will occur. As the transitional phases are heated, relatively few
x-A120 3 nuclei (approximately 1010-1011 nuclei/cm 3 [10,11]) are produced. These
nucleated grains undergo rapid grain growth, consuming the transitional alumina matrix,
resulting in a porous vermicular structure (Figure 1-3(b)). A contributing factor to this
phenomenon is the large change in molar volume that occurs when the transitional aluminas
transform to the (x-A120 3 phase. For instance, the transformation from O-A12 0 3 to c-A120 3
involves shrinkage of 8% in molar volume. The combination of low nucleation density,
19
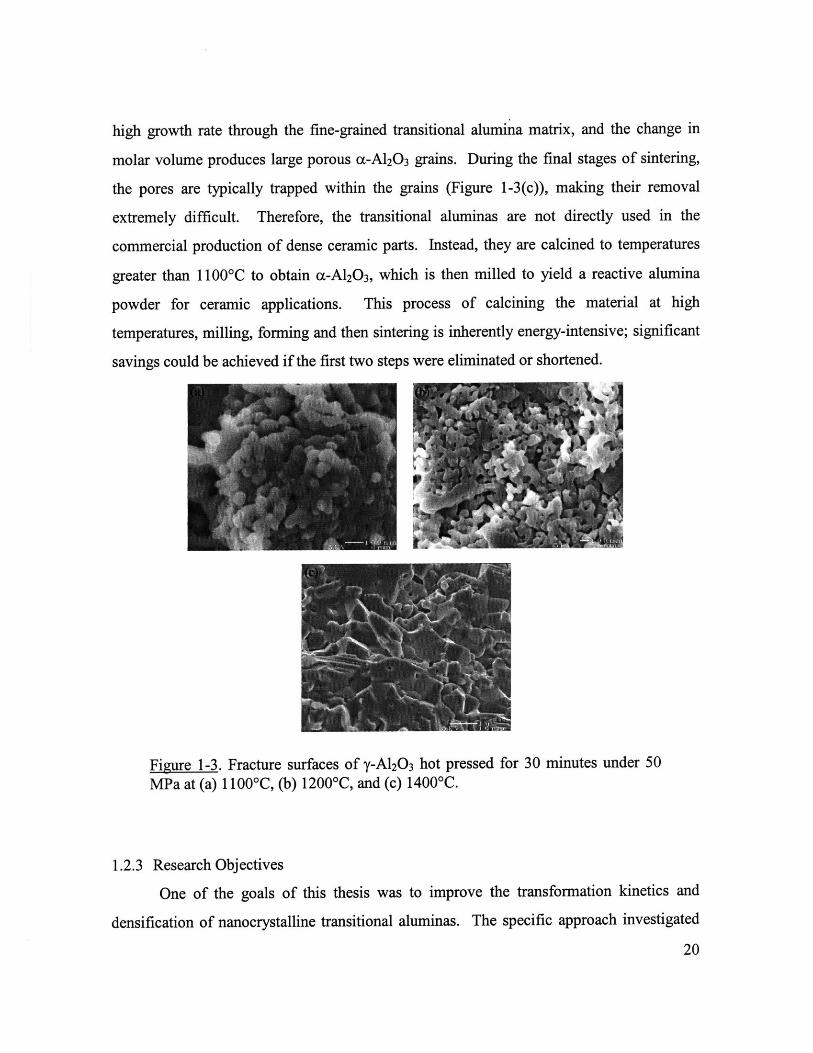
high growth rate through the fine-grained transitional alumina matrix, and the change in
molar volume produces large porous a-A1203 grains. During the final stages of sintering,
the pores are typically trapped within the grains (Figure 1-3(c)), making their removal
extremely difficult. Therefore, the transitional aluminas are not directly used in the
commercial production of dense ceramic parts. Instead, they are calcined to temperatures
greater than 1 100'C to obtain a-A120 3, which is then milled to yield a reactive alumina
powder for ceramic applications. This process of calcining the material at high
temperatures, milling, forming and then sintering is inherently energy-intensive; significant
savings could be achieved if the first two steps were eliminated or shortened.
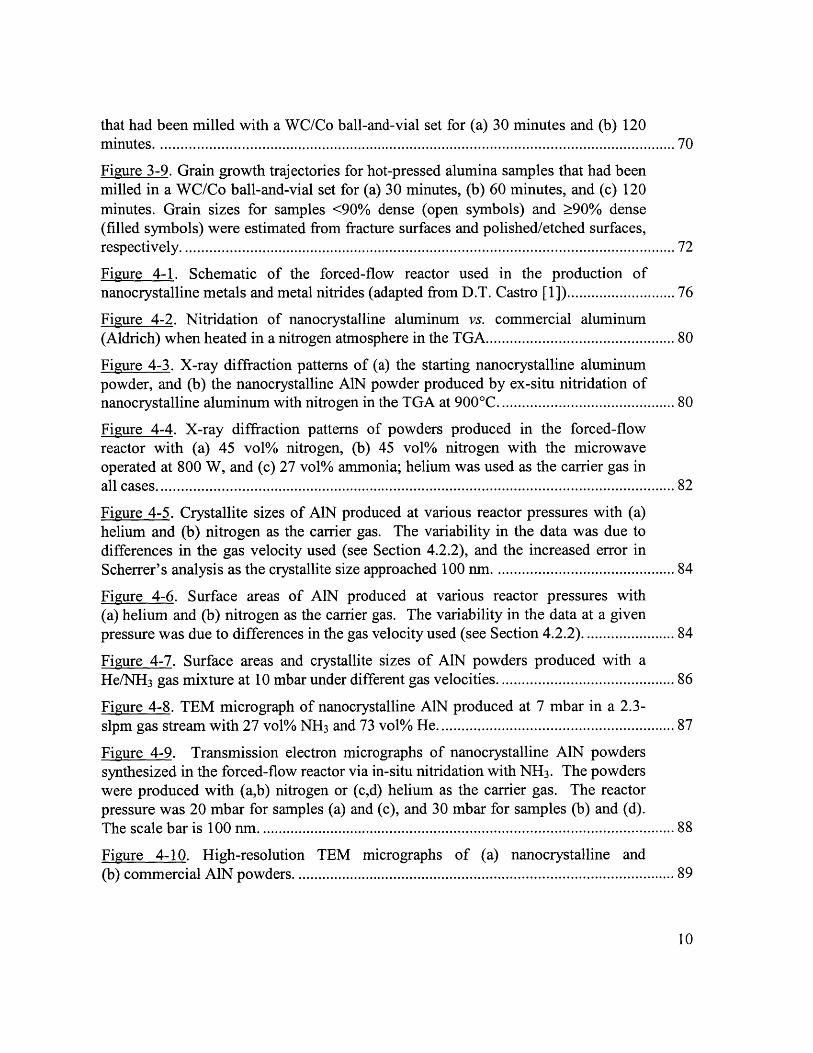
Figure 1-3. Fracture surfaces of y-A120 3 hot pressed for 30 minutes under 50MPa at (a) 1100 C, (b) 1200*C, and (c) 1400'C.
1.2.3 Research Objectives
One of the goals of this thesis was to improve the transformation kinetics and
densification of nanocrystalline transitional aluminas. The specific approach investigated
20
was the use of mechanical energy to transform a fraction of the transitional alumina to the
u-phase. The nanocrystalline x-A120 3 particles seeded within the transitional phases
would help to lower the transformation temperature, improve the transformation kinetics,
reduce the average grain size, and enhance the sinterability of the material. Additional
background information, results on high-energy milling, and transformation kinetic studies
are presented in Chapter 2. In Chapter 3, the sintering results and microstructural evolution
are correlated to the mechanical seeding effects.
1.3 Aluminum Nitride
1.3.1 Introduction
The use of nanostructure processing to improve densification rates may be most
beneficial for non-oxide ceramics. Metal nitrides and carbides typically have much lower
diffusion rates than their oxide counterparts, making their densification more difficult.
Nanostructure processing of aluminum nitride is of particular interest as pure AIN is
difficult to sinter and this material is attractive for high value-added thermal management
applications. AlN has a high thermal conductivity, low thermal expansion coefficient, high
dielectric strength, and good mechanical properties compared to alumina, which is the
material currently used in many electronic packaging applications. A comparison of AIN
and other high thermal conductivity ceramics with silicon is shown in Table 1-1. The
detriments of the alternative materials are significant: BeO can be toxic in powder form,
SiC has relatively high dielectric losses, and bulk diamond is very expensive to produce.
AlN has detriments as well -- most notably its oxygen affinity and its difficulty in
metallization, which must be overcome for electronic substrate applications. The oxygen
affinity is problematic because oxygen dissolved in the aluminum nitride reduces the
thermal conductivity drastically through a relatively complex mechanism. At low levels,
oxygen is dissolved in AlN by incorporation into nitrogen sites. To compensate for the
charge imbalance, aluminum vacancies are created as follows:
A12032A1 + 30' +VA" (Equation 1-2)
21
Due to electrostatic and size effects, these aluminum vacancies form extended defect
structures known as inversion domain boundaries, which disrupt phonon transport within
the grains. Through this mechanism, less than 1 wt% oxygen can reduce the thermal
conductivity of AlN by over 30%. A substantial amount of work therefore has been
directed towards understanding how the defect structures are formed [12-15], how to
prevent initial oxygen incorporation, and how to minimize oxygen effects on thermal
conductivity via materials processing.
Table 1-1. Materials properties of various high thermal conductivityceramics in comparison to silicon. Data taken primarily from Prohaska andMuller [16]. (TCE is thermal coefficient of expansion.)
Properties AN All% BeO SiC Diamond SiPhysical
Density (g/cm 3) 3.26 3.75 2.9 3.2 3.51 2.3Young's Modulus (Mpsi) 48 49 47 57 1220 24Vickers Hardness (kg/mm2) 1200 2500 1200 2000 10,000Bending Strength (kg/mm2 ) 40 35 25 45
ElectricalVolume Resistivity (Q-cm) >1014 >10 >l0 >1014 >10
Dielectric Constant (MHz) 8.5-8.7 9 6.7 40 5.7Dissipation Factor, x 10-4, 1 MHz <14 3 3 500Dielectric Strength (kV/mm) 15 15 12 .07 1000
ThermalThermal Conductivity (W/m/K) 160-250 25 260 270 2000 150TCE (ppm /PC) RT-1000 C 2.65 7 6.5 3.7 1.1 2.3
RT-4000 C 4.8 7.4 8 3.7
1.3.2 Conventional Processing
AIN can be synthesized in a number of different ways. The two most widely used
commercial methods are carbothermal reduction and nitridation of aluminum oxide, and
direct nitridation of aluminum metal. The carbothermal reduction-nitridation process starts
with an intimate mixture of y-A120 3 (used for its small particle size and high surface area)
and a finely divided carbon source. This mixture is heated under nitrogen to concomitantly
reduce and nitride the alumina. Generally, an excess of carbon is used, which must be
22
removed after nitridation through controlled oxidation at ~60 0 'C. The direct nitridation
involves heating powdered aluminum in an atmosphere of ammonia or nitrogen to form
AlN. In both of these diffusion-limited processes, the materials must typically be heated to
temperatures in excess of 1600'C, ground, and reheated to assure complete reaction. The
high temperatures can result in a relatively coarse material, which must be ground to obtain
reactive AlN. Powder purity is a big issue with these processing methods, and very high
purity products (>99%) are difficult to achieve, especially for high surface area materials.
In addition to the residual oxygen that might remain from the y-A120 3 or on the surface of
the aluminum, there is also the possibility of oxygen contamination from the carbon
removal step and from surface hydrolysis during or after the milling operations.
After synthesis, the powder must be formed and sintered to obtain a useful article.
Because of its highly reactive nature, AlN must be handled under dry conditions unless the
surfaces are treated to prevent hydrolysis. Bowen et al. [17] showed that unprotected 1.2
ptm-sized particles of AlN decomposed rapidly into AlOOH and ammonia when exposed to
deionized water. After 2 hours and 8 hours of contact, the AlN contained over 6 wt% and
15 wt% oxygen, respectively; 80% conversion to aluminum hydroxide was observed after
24 hours of contact. Preventive measures, such as the formation of a relatively
impermeable A12 0 3 layer through controlled oxidation, or the application of a polymer
coating, have been shown to reduce AIN hydrolysis considerably thereby allowing aqueous
processing [18]. However, non-aqueous and dry powder processing approaches are still the
dominant techniques for AlN forming operations.
Even after nearly ideal air-free processing, the oxygen contamination from powder
synthesis is still generally sufficient to disrupt the thermal transport within AlN. The effect
of low diffusivities causing poor sinterability also remains to be overcome. The solution,
which has been found after considerable research, is to add a sintering additive such as
Y2 0 3 or CaO, which promotes the formation of a liquid phase. The diffusion of material
within the liquid phase is orders of magnitude higher than in the solid phase so that
sintering is greatly enhanced. The proposed sintering model is that the Y20 3 forms a melt,
23
which initially wets the grain boundaries, promoting material transport and densification.
However, as the A12 0 3 content in the melt increases, the interfacial energy between the melt
and the AIN grains increases. The increase in interfacial energy causes the secondary phase
to retreat from the grain boundaries to the triple points. The dissolution of A12 0 3 into the
liquid phase effectively scavenges oxygen from the AlN grains, thereby increasing the
thermal conductivity. The degree of oxygen removal is reportedly proportional to the heat
of formation of the associated aluminate. Unfortunately, the heats of reaction for many of
the possible aluminates at the sintering temperatures were not known, so many experiments
with lanthanide oxides and basic oxides at various concentrations have been conducted to
determine the optimal sintering additive or mixture of additives [19-21]. The model is
complicated by recent reports that suggest that the oxygen does not diffuse out of the grains,
but the grains themselves are dissolved and reprecipitated [22]. This argument is based in
large part on the low oxygen/nitrogen interdiffusion values observed for polycrystalline
AIN [23]. The authors calculated the observed O/N interdiffusion rate to be approximately
2 orders of magnitude too low for solid-state diffusion to effectively purify the AlN grains.
However, another paper [24] reported values for the O/N interdiffusion that were 1-2 orders
of magnitude higher, and suggested a strong relationship between oxygen conductivity in
the grain boundary and the yttrium content in the grain boundary at high temperatures.
Many more experiments will have to be conducted before the purification mechanism is
fully understood. Nevertheless, AlN with 2-15 wt% Y2 0 3 additive can be pressureless
sintered to full density and can attain a thermal conductivity as high as 200 W/m-K. It has
also been shown that if the secondary phases are removed from the samples, either through
extended heat treatments at high temperatures or other means, the thermal conductivity can
approach 260 W/m-K.
1.3.3 Research Objectives
One of the goals of this thesis is to produce a high-purity nanocrystalline aluminum
nitride powder that can be sintered without additives to full density. As described above, if
additives are not used and if the oxygen content of the grains can be kept very low, then the
24
detrimental effects associated with the secondary phases and impurities on the thermal
conductivity can be minimized. The first step in achieving this research objective is to
produce high-purity nanocrystalline AIN powder. This was accomplished through the use
of a novel forced-flow reactor built by Darren Castro [25] of our laboratory. Reactor
modifications and process optimization, along with powder characterization, are described
in Chapter 4. Processing, sintering, microstructure, and properties of AlN are discussed in
Chapter 5.
1.4 References
[1] K. Wefers and C. Misra, "Oxides and Hydroxides of Aluminum," Alcoa Technical
Paper 19, Rev. Alcoa Technical Center, 1987, p. 47.
[2] J. M. McHale, A. Auroux, A. J. Perrotta, and A. Navrotsky, "Surface Energies and
Thermodynamic Phase Stability in Nanocrystalline Aluminas," Science, 277, 788-91
(1997).
[3] J. M. McHale, A. Navrotsky, and A. J. Perrotta, "Effects of Increased Surface Area
and Chemisorbed H20 on the Relative Stability of Nanocrystalline y-A120 3 and u-
A120 3," J. Phys. Chem. B, 101 [4] 603-13 (1996).
[4] T. Tsuchida and K. Kodaira, "Hydrothermal Synthesis and Characterization of
Diaspore, P-Al 2 03-H20," JMater. Sci., 25 [10] 4423-26 (1990).
[5] T. Hirayama, "High-Temperature Characteristics of Transition A120 3 Powder with
Ultrafine Spherical Particles," J. Am. Ceram. Soc., 70 [6] C 122-24 (1987).
[6] C. E. Warble, "Surface Structure of Spherical Gamma-Alumina," J. Mater. Sci., 20,
2512-16 (1985).
[7] E. Borsela, S. Botti, R. Giorgi, S. Martelli, S. Turtu, and G. Zappa, "Laser-Driven
Synthesis of Nanocrystalline Alumina Powders from Gas-Phase Precursors," Appl.
Phys. Lett., 63 [10] 1345-47 (1993).
25
[8] G. P. Johnston, R. Muenchausen, D. M. Smith, W. Fahrenholtz, and S. Foltyn,
"Reactive Laser Ablation Synthesis of Nanosize Alumina Powder," J. Am. Ceram.
Soc., 75 [12] 3293-98 (1992).
[9] C. Herring, "Effect of Change of Scale on Sintering Phenomena," J. Appl. Phys., 21,
301-03 (1950).
[10] W. A. Yarbrough and R. Roy, "Microstructural Evolution in Sintering of AlOOH
Gels," J. Mater. Res., 2 [4] 494-515 (1987).
[11] G. L. Messing and J. C. Huling, "Transformation, Microstructure Development and
Sintering in Nucleated Alumina Gels"; pp. 669-79 in Processing of Ceramics,
Proceedings of the 3 European Ceramic Society Conference, Vol. 1. Edited by P.
Duran and J.F. Fernandez. Faenze Editrice Iberica S.L., 1993.
[12] J. H. Harris, R. A. Youngman, and R. G. Teller, "On the Nature of the Oxygen-
Related Defect in Aluminum Nitride," J. Mater. Res., 5 [8] 1763-73 (1990).
[13] A. Westwood, R. Youngman, M. McCartney, A. Cormack, and M. Notis, "Oxygen
Incorporation in Aluminum Nitride via Extended Defects: Part I. Refinement of the
Structural Model for the Planar Inversion Domain Boundary," J Mater. Res., 10 [5]
1270-86 (1995).
[14] A. Westwood, R. Youngman, M. McCartney, A. Cormack, and M. Notis, "Oxygen
Incorporation in Aluminum Nitride via Extended Defects: Part II. Structure of Curved
Inversion Domain Boundaries and Defect Formation," J. Mater. Res., 10 [5] 1287-
1300 (1995).
[15] A. Berger, "Nucleation and Growth of Inversion Domains in AlN: Part I, Study of
Fundamental Processes," J. Am. Ceram. Soc., 78 [1] 153-60 (1995).
[16] G. W. Prohaska and G. R. Miller, "Aluminum Nitride: A Review of the Knowledge
Base for Physical Property Development," Mater. Res. Soc. Symp. Proc., 167, 215-27
(1990).
26
[17] P. Bowen, J. G. Highfield, A. Mocellin, and T. A. Ring, "Degradation of Aluminum
Nitride Powder in an Aqueous Environment," J. Am. Ceram. Soc., 73 [3] 724-28
(1990).
[18] E. G. Groat and T. J. Mroz, "Aqueous Slip Casting of Stabilized AIN Powders," Bull.
Am. Ceram. Soc., 73 [11] 75-78 (1994).
[19] K. Watari, A. Tsuzuki, and Y. Torii, "Effect of Rare-Earth Oxide Addition on the
Thermal Conductivity of Sintered Aluminum Nitride," J. Mater. Sci. Lett., 11, 1508-
10 (1992).
[20] T. B. Troczynski and P. S. Nicholson, "Effect of Additives on the Pressureless
Sintering of Aluminum Nitride between 15000 and 1800'C," J Am. Ceram. Soc., 72
[8] 1488-91 (1989).
[21] P. S. de Baranda, A. K. Knudsen, and E. Ruh, "Effect of Yttria on the Thermal
Conductivity of Aluminum Nitride," J. Am. Ceram. Soc., 77 [7] 1846-50 (1994).
[22] A. V. Virkar, T. B. Jackson, and R. A. Cutler, "Thermodynamic and Kinetic Effects
of Oxygen Removal on the Thermal Conductivity of Aluminum Nitride," J Am.
Ceram. Soc., 72 [11] 2031-42 (1989).
[23] M. Stemitzke and G. Mller, "EELS Study of Oxygen Diffusion in Aluminum
Nitride," J. Am. Ceram. Soc., 77 [3] 737-42 (1994).
[24] H. Solmon, D. Robinson, and R. Dieckmann, "Oxygen Transport in Aluminum
Nitride Substrates," J. Am. Ceram. Soc., 77 [11] 2841-48 (1994).
[25] D. T. Castro, Synthesis, Processing, and Properties of Nanocrystalline Nitrides, Sc.D.
Thesis. Massachusetts Institute of Technology, Cambridge, MA, 1997.
27
2. Transformation Kinetics of Mechanically Seeded Alumina
2.1 Introduction
This chapter describes the effects of high-energy ball milling (HEBM) on the y-to-X
phase transformation kinetics of A12 0 3. The background section (2.1.1) describes several
methods previously used to affect the transformation kinetics and some of their limitations.
In the experimental section (2.2), the equipment and methods of sample preparation are
described, and the efficacies of the HEBM process and other methods reported in the
literature are compared based upon experimentally determined phase transformation
activation energies. Finally, a phase transformation model for finite particle systems is
derived and used to evaluate the validity of applying the Johnson-Mehl-Avrami-
Kolmogorov (JMAK) model to a seeded alumina system.
2.1.1 Background
The difficulties associated with densifying the nanocrystalline transitional aluminas
are well documented, and several different approaches to solving this problem have been
reported. As described in Chapter 1, the fundamental problem in transitional alumina
densification lies in the low nucleation density of the c-A120 3 phase [1, 2]. This problem is
further aggravated by the change in molar volume of approximately 8% associated with the
O-to-ca transformation. In addition, the grain growth rate during the transformation is
significantly higher than the sintering rate, so pores become surrounded by the newly
transformed "vermicular" a-A120 3 grains. Upon further densification, the pores become
trapped within the grains, and the pathway for their removal becomes bulk diffusion rather
than grain boundary diffusion. Since bulk diffusion is 1-2 orders of magnitude slower than
grain boundary diffusion, the pores remain trapped within the grains. These intragranular
pores effectively prevent theoretical density from being achieved unless very high
temperatures and long sintering times are used. The successful approaches to tackling these
densification problems typically involve enhancing the nucleation rate, decreasing the grain
growth rate, improving the sintering kinetics, or a combination thereof. By increasing the
28
nucleation density, the average grain size of the transformed particles can be reduced and
the sintering kinetics (as described by Equation 1-1) are increased. These effects can result
in significant improvements in the sintering behavior of alumina.
2.1.1.1 Isostructural Seeding
One simple way to enhance the nucleation rate is to add seed particles that have the
same structure as the desired phase. The seed particles provide locations with a lower
surface energy barrier for transformation, which results in easier nucleation. The reduction
in the nucleation barrier depends on the structural similarity between the new phase and the
seed particle. The nucleation density, and therefore the resulting crystallite size, will be
determined by the heterogeneous interfacial area, which is determined by the particle size
and number of seeds that are added.
Many different materials have been added to the transitional alumina phases, both as
solid particles and in solution, to determine their effect on the transformation rate. For
instance, Xue and Chen [3] investigated the effect of a wide variety of additives on the y-to-
x phase transformation. They found that B2 0 3 , SiO 2, and ZrO 2 additions retarded the
transformation while additives that promoted a liquid phase, such as ZnF2, CuO, V205 , and
Li2 0, increased the transformation kinetics, probably by increasing the growth rate during
transformation. Sintering studies using alumina seeded with these materials were not
performed.
As discussed previously, however, one would expect that those materials that are
isostructural with x-A120 3 would reduce the transformation barrier most significantly. For
example, Fe 2O 3 and Cr2O 3 additions have been investigated and were found to have a large
effect on the transformation kinetics [4, 5]. Boehmite (AlOOH) gels seeded with ca-Fe 2O3
showed an increase in the transformation kinetics that corresponded to a 17% decrease in
the transformation activation energy. The increased nucleation density resulted in a finer
microstructure, and improved the densification kinetics considerably. Instead of creating
the characteristic vermicular microstructure, the seeding resulted in the formation of small,
dense x-A120 3 grains. After pressureless sintering at 13000 C for 2 hours, the Fe20 3-seeded
29
compacts (with 1014 seeds/cm 3) were fully dense, while unseeded compacts had achieved
only 80% of theoretical density.
Although these results are interesting, the presence of impurities, even at low
concentrations, is generally not desirable. This is especially true for electronic and optical
applications where the alumina purity must be 99.9% or higher, and transition metal
impurities should be kept in the ppm range.
2.1.1.2 a-A203 Seeding
The obvious solution to the problem of impurities is to use c-A120 3 particles to seed
the y-to-cc phase transformation. In this way, the purity may be retained while improving
the transformation kinetics at the same time. This method has been studied extensively by
Professor Gary Messing's group at Pennsylvania State University [6-12] and other
researchers [1, 13-15]. Their approach has been to grind a-A120 3 to produce submicron
particles, which were then classified and harvested via sedimentation. The seed particles
were then dispersed in a boehmite sol to obtain intimate contact between the seeds and the
boehmite particles. After gelling and drying, the material was lightly ground and densified
by hot pressing, sinter forging, or pressureless sintering. Seeding and processing the
boehmite sols in this manner produced powders that could be densified at very low
sintering temperatures and, when sinter-forged, could generate fully dense material with
230 nm-sized grains [12]. This method and variations of this process have been patented,
primarily for the synthesis of abrasive grains rather than bulk articles [16-18].
2.1.1.3 High-Energy Approaches
The approaches described above rely on the external addition of seed particles or the
introduction of a liquid phase to enhance the transformation kinetics. It is also possible to
increase the density of nuclei through mechanical operations on the powder or compact.
There are two arguments that have been invoked to describe the effects of pressure and
mechanical energy on the nucleation process. The first argument is based upon the fact that
nucleation will most likely occur in locations where the local packing of the aluminum and
30
oxygen atoms is similar to a-Al2O3, or where defects reduce the energy requirement for
nucleation. This desired atomic packing and/or defect presence will most likely occur at the
interface between two particles. This argument was used by Pach et al. [19] to describe the
influence of particle packing (which was changed in boehmite gels via cold isostatic
pressing) on the transformation kinetics. They stated that "there is a higher number of
potential nucleation sites ... at a higher average coordination number of alumina particles"
[19]. At higher pressures, a denser packing was obtained, increasing the number and area of
particle-particle contacts, thereby enhancing the kinetics of nucleation and growth. A
similar argument was used to explain differences observed in a-A120 3 nucleation in
boehmite gels that had been prepared differently, but had not been subjected to significant
external pressures [20]. In this case, both the microstructure and the atomic arrangement of
the gels were different due to the different methods of preparation, so it was difficult to
determine which dominated the nucleation kinetics.
The second argument used to explain the effect of pressure on the nucleation
kinetics is that the applied pressure directly creates c-A120 3 nuclei. This argument is based
upon the observed effect of pressure on the transformation of transitional alumina to a-
A120 3 [21]. In their study, Ishitobi et al. showed that ri-A120 3 could be transformed directly
into c-A120 3 in less than 5 minutes at temperatures as low as 6000 C under an applied
pressure of 1.5 GPa. While this combination of pressures and temperatures is not easily
achieved with conventional compaction techniques, high-energy processes such as dynamic
shock compaction, explosive compaction [22], and high-energy milling [23-30] have been
shown to produce sufficient increases in localized temperature and pressure to generate u-
A120 3 directly from the transitional phases.
Depending on the amount and type of energy introduced into the system and the
speed at which it is applied, one or more of the above mechanisms may be affecting the
nucleation density. During these high-energy processes, a significant amount of particle
rearrangement can occur, and superplastic deformation of the nanometer-sized grains has
also been reported. In addition, some of the alumina can be amorphized during these high-
31
energy processes, which may enhance not only the nucleation rate but also the subsequent
growth rate.
Theoretically, the relative effects of pressure on the phase transformation and the
particle rearrangement to reduce the nucleation barrier could be experimentally determined.
However, the complexity of the system makes this a daunting task. In addition to the
effects discussed earlier, it has been reported that the presence of water [31], impurities [1-
3], degree of crystallinity [32], crystallite size, previous thermal history, surface area [33,
34], and even the presence of large electric fields [35] can influence the phase
transformation kinetics of alumina. Given the variety of synthesis routes and chemical
precursors for alumina, it is not surprising that researchers have come to different
conclusions concerning the relative importance and the effects of these parameters on the
phase transformations of alumina.
2.2 Experimental
The starting y-A120 3 for these experiments was obtained by calcining boehmite
(AlOOH) at temperatures between 550'C and 700'C for 4 hours in air. This was found to
give a high surface area y-A120 3 with a crystallite size of -8 nim. The boehmite precursor
used for most of these experiments was Catapal* B, generously donated by Vista Chemical
Company (Houston, Texas). Additional boehmite samples, primarily those containing
MgO as a dopant, were synthesized in the laboratory. These samples were prepared by
adding 250 ml of a 0.4 M Al(NO 3)3 (99.9%, Fluka Chemical Company) ethanolic solution
dropwise to a stirred solution of 200 ml ethanol, 200 ml of water and 100 ml of ammonium
hydroxide (30%). The resulting solution was aged overnight and washed with ethanol via
centrifugation. There were no detectable differences in the transformation kinetics of the
differently prepared y-A120 3 samples.
High-energy ball milling was conducted in a SPEX 8000 Mixer/Mill (SPEX
CertiPrep, Metuchen, New Jersey) with a ball-to-powder weight ratio of 5:1. The milling
vials and balls used were either WC/Co (3 balls, total ball weight ~ 30 g) or ZrO2 (2 balls,
32
total ball weight ~ 12 g). All milling was performed on dry y-A120 3 powder without any
additives.
Surface area and pore size distribution of the powders were determined by nitrogen
adsorption using a Micromeritics ASAP 2000 analyzer. Since the phase transformation is
exothermic, the transformation temperature was investigated using a Perkin Elmer System 7
Differential Thermal Analyzer. Differential thermal analysis (DTA) was performed at a
heating rate of 10 C/min under flowing nitrogen using platinum sample cups.
X-ray diffraction (XRD) was performed for phase identification and quantitative
analysis with a Siemens D5000 0-0 diffractometer (40 kV and 40 mA) using Cu-K,
radiation and a nickel filter. The internal standards used for quantitative analysis were
either elemental silicon (Si) or fluorite (CaF2). Prior to analysis, the internal standard was
added to the sample so that a standard-to-sample weight ratio of 1:4 was used. Mixing was
performed by hand in an agate mortar and pestle. The ratio of the peak areas of the internal
standard and c-A120 3 was then compared to a previously prepared calibration curve to
obtain the fraction of c-A120 3 present in the sample. The peaks analyzed depended on the
internal standard. With CaF2 as the standard, the (012) peak of a-A12O3 and the (111) peak
of CaF2 were measured; with Si as the standard, the (110) peak of a-A120 3 and the (311)
peak of Si were used. The average c-A120 3 content from two measurements was used in
each case; the sample was removed from the XRD slide after the first analysis, mixed, and
then reloaded for the second analysis.
2.3 Effects of High-Energy Ball Milling
2.3.1 Effect of Milling Time
The first step in this research was to reproduce previous researchers' claims that
nanocrystalline a-A120 3 could be produced through high-energy milling of the transitional
phases. An initial powder charge of 6 g of y-A120 3 in the WC/Co ball-and-vial set was
subjected to 12 hours of milling in the SPEX 8000 Mixer/Mill. A small amount of powder,
33
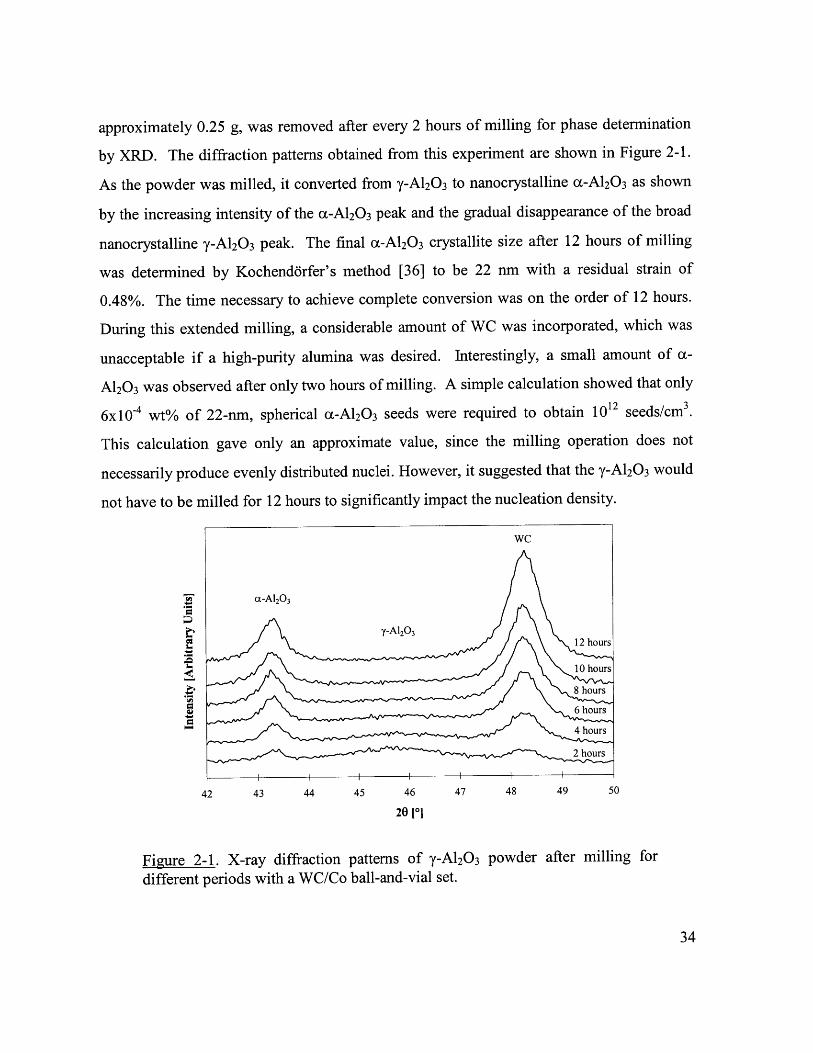
approximately 0.25 g, was removed after every 2 hours of milling for phase determination
by XRD. The diffraction patterns obtained from this experiment are shown in Figure 2-1.
As the powder was milled, it converted from y-A120 3 to nanocrystalline a-A120 3 as shown
by the increasing intensity of the cc-Al 2O3 peak and the gradual disappearance of the broad
nanocrystalline y-A120 3 peak. The final c-Al2O3 crystallite size after 12 hours of milling
was determined by Kochend6rfer's method [36] to be 22 nm with a residual strain of
0.48%. The time necessary to achieve complete conversion was on the order of 12 hours.
During this extended milling, a considerable amount of WC was incorporated, which was
unacceptable if a high-purity alumina was desired. Interestingly, a small amount of a-
A120 3 was observed after only two hours of milling. A simple calculation showed that only
6x10~4 wt% of 22-nm, spherical a-A12 03 seeds were required to obtain 1012 seeds/cm 3.
This calculation gave only an approximate value, since the milling operation does not
necessarily produce evenly distributed nuclei. However, it suggested that the y-A120 3 would
not have to be milled for 12 hours to significantly impact the nucleation density.
WC
(X-A1203
b y-A'20312 hours
10 hours
8 hours
6 hours
42 43 44 45 46 47 48 49 50
20 [*1
Figure 2-1. X-ray diffraction patterns of y-A1203 powder after milling fordifferent periods with a WC/Co ball-and-vial set.
34
2.3.2 Effects on Phase Transformation Temperature
The next step, therefore, was to determine how HEBM affects the transformation
kinetics. A simple way to measure this is to examine the y-to-cc transformation temperature
as a function of milling time. The y-to-a transformation is exothermic with a AH of
approximately -20 kJ/mol [37], so the temperature at which the transformation occurs can
be observed through DTA studies. Plots of the transformation temperature as a function of
milling time for samples that had been milled with either WC/Co or ZrO2 ball-and-vial sets
are shown in Figure 2-2. 2 hours of milling reduced the transformation temperature from
12200 to approximately 970'C, which was even lower than that obtained with external cc-
A12 0 3 seed additions (1050'C) [7].
Milling periods longer than 2 hours did not appreciably decrease the transformation
temperature further. This suggested that the transformation process changed from
nucleation-limited to growth-limited kinetics, and the activation energy required for
transformation was significantly reduced through seeding. Although the transformation
from y-A120 3 to c-A120 3 does not require long-range atomic motion, it is still not a
diffusionless operation and will be strongly temperature-dependent. Thus, although
additional seeds were created at longer milling times, the transformation temperature was
not reduced further because of diffusional limitations to the growth of the new phase.
The changes in transformation temperature with milling time were strikingly similar
for y-A120 3 samples milled in WC/Co and ZrO2 ball-and-vial sets. One would usually
expect that the ball-and-vial set made of the higher density material would have a greater,
more rapid effect on the phase transformation, as widely accepted in mechanical metallurgy
and attrition milling literature [38]. However, in this instance, the influence of milling
media appeared to be minor even though they differed in density by ~ 2.5 times (densities
were 5.86 g/cm 3 for ZrO2 and 15 g/cm 3 for WC/Co). A plausible explanation for this
observation was that the important milling effects in this case occurred in the first few
minutes of milling. Therefore, the initial transformation rates (for < 10% conversion),
35
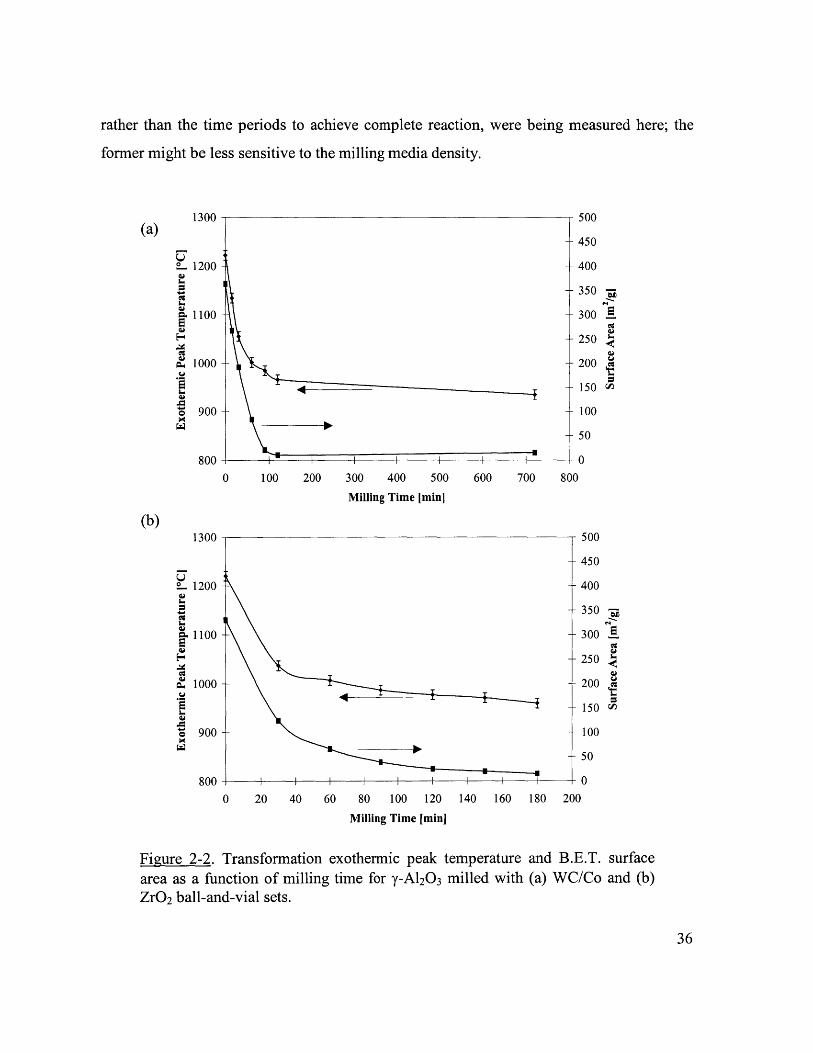
rather than the time periods to achieve complete reaction, were being measured here; the
former might be less sensitive to the milling media density.
(a)1300
1200 -
1100
1000 -
S900 -
(b)
800
1300
L 1200
91100
$ 1000
S900
800
- 500
- 450
- 400
- 350
- 300
- 250
- 200
- 150
- 100
0 100 200 300 400 500 600 700 800
Milling Time [min]
"a
50
500
450
400
350
300
250
200
150 (
100
50
0
0 20 40 60 80 100 120 140 160 180 200
Milling Time [min]
Figure 2-2. Transformation exothermic peak temperature and B.E.T. surfacearea as a function of milling time for y-A120 3 milled with (a) WC/Co and (b)ZrO2 ball-and-vial sets.
36
4-
- I I I I
0
, , I
The large change in surface area with milling time was also shown by Figure 2-2 to
be relatively independent of the milling media. The loss of surface area with milling was
due primarily to pore closure (pore volume decreased from 0.95 cm 3/g to 0.04 cm 3/g after 2
hours of milling with a WC/Co ball-and-vial set); however, powder agglomeration and
impurity introduction (due to wear of the milling media) probably had an effect at longer
milling times.
2.3.3 Transformation under Isothermal Heat Treatments
Another way to study the influence of mechanical seeding is to measure the
transformation rate of the milled powder under heat treatments at isothermal conditions.
The experiments were performed on a small amount of powder (0.3-0.4 g) in a small quartz
crucible in a preheated box furnace. A small thermocouple was kept within 3 cm of the
crucible to measure the temperature, and assure that the box furnace was kept under
isothermal conditions. Samples were removed after the specified time and rapidly cooled to
<600'C within seconds. The powders were then mixed with the internal standards and
characterized by quantitative X-ray diffraction analysis as described in Section 2.2.
The results obtained from experimental runs at 9000 C and 950 0C are shown in
Figure 2-3. These plots of mass fraction of cc-Al 2O3 present as a function of log(time)
displayed the S shape characteristic of nucleation and growth transformations. In contrast,
an unmilled y-A120 3 sample would gradually transform to 8-A12 0 3 instead of a-A12 0 3 at
these temperatures.
37
(a)1.0 1
0.9
0.8 460.7
0.6 -
0.5 -
0.4 -
0.3 -
-
0.1
0.02.0
(b)1.0
2.5
0.9
0.8 4
to0
C'
0.7 -
0.6 -
0.5 -
0.4
0.3
0.2
0.1
0.0 - -
1.0 1.5
3.0
2.0
3.5Log(time)
2.5Log(time)
4.0
3.0
4.5
3.5
5.0
4.0
Figure 2-3. Mass fraction of o-A120 3 present in the y-A120 3 samples after theyhad been milled in a WC/Co ball-and-vial set and heat treated for various timeperiods (in seconds) at (a) 900'C and (b) 950*C.
38
-'- 120 min milled
-u-60 min milled
+'30 min milled
+ 120 min milled
60 min milled
30 min milled
.
2.3.4 Application of JMAK Model
The data obtained from the transformation studies under isothermal heat treatments
can be used to determine the transformation kinetics by applying the Johnson-Mehl-
Avrami-Kolmogorov (JMAK) model. The JMAK equation for a model system with
homogeneous nucleation and growth is
X =1-exp - (Equation 2-1)3
where X is the fraction transformed in time t as a function of the growth rate G and
nucleation rate L For a system with preexisting nuclei (seeds) with a nuclei density of I',
the JMAK model becomes
X =1- exp (Equation 2-2)S3
Various special cases of these basic equations have been derived using the concept of
extended volume fraction (for wires, thin films, grain boundary nucleation, surface
nucleation, etc.) [39-43]. From these expressions, the transformation of an idealized
material may be obtained if the geometry, growth rate, and nucleation rate (or seed density)
are known. However, in most cases, these quantities are unknown and the reverse operation
is desired, namely the determination of the transformation kinetics from a set of
transformation data. This may be obtained by simplifying Equations 2-1 and 2-2 to the
following generalized JMAK expression:
X =1- exp(- (kt) ) (Equation 2-3)
This relationship combines the nucleation and growth kinetics into a single reaction rate, k.
The equation can be transformed so that the data can be easily fitted using linear least-
squares regression,
Log(Lni 1 = n -Log(k) +n -Log(t) (Equation 2-4)
A plot of Log(-Ln(1-X)) vs. Log(t) should result in a line with a slope of n and a y-intercept
of n-Log(k), which allows the so-called Avrami exponent n and the reaction kinetic constant
39
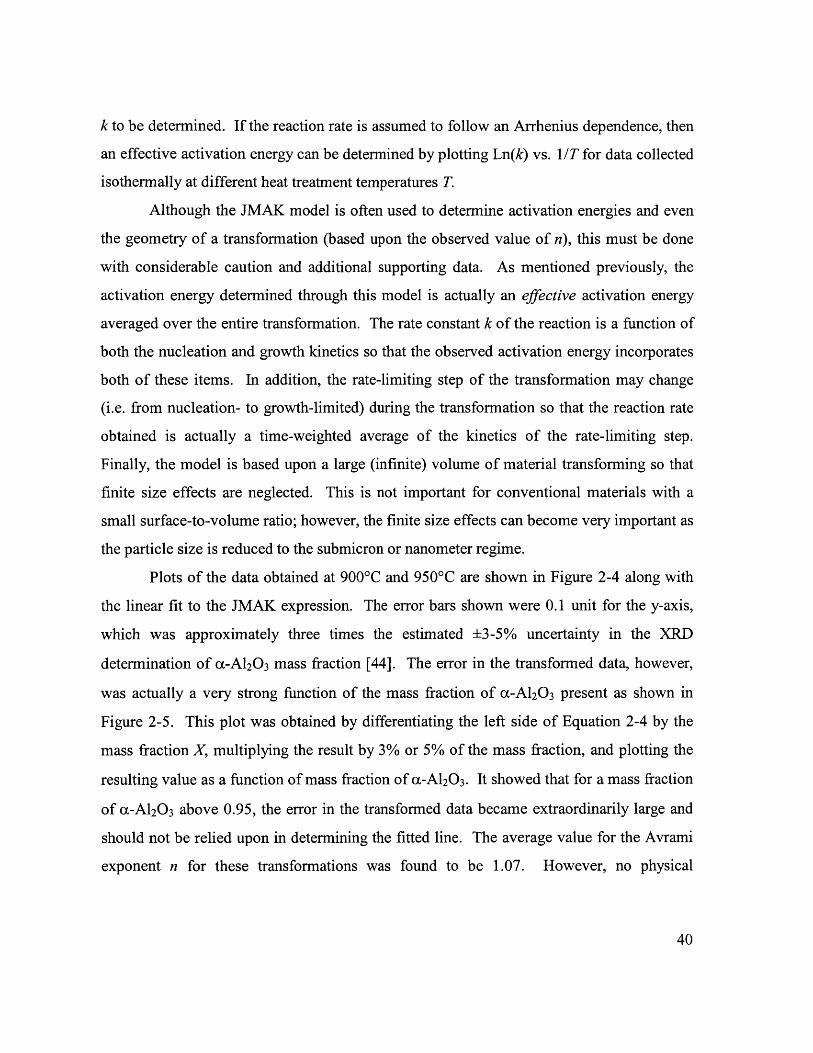
k to be determined. If the reaction rate is assumed to follow an Arrhenius dependence, then
an effective activation energy can be determined by plotting Ln(k) vs. I/T for data collected
isothermally at different heat treatment temperatures T.
Although the JMAK model is often used to determine activation energies and even
the geometry of a transformation (based upon the observed value of n), this must be done
with considerable caution and additional supporting data. As mentioned previously, the
activation energy determined through this model is actually an effective activation energy
averaged over the entire transformation. The rate constant k of the reaction is a function of
both the nucleation and growth kinetics so that the observed activation energy incorporates
both of these items. In addition, the rate-limiting step of the transformation may change
(i.e. from nucleation- to growth-limited) during the transformation so that the reaction rate
obtained is actually a time-weighted average of the kinetics of the rate-limiting step.
Finally, the model is based upon a large (infinite) volume of material transforming so that
finite size effects are neglected. This is not important for conventional materials with a
small surface-to-volume ratio; however, the finite size effects can become very important as
the particle size is reduced to the submicron or nanometer regime.
Plots of the data obtained at 900'C and 950'C are shown in Figure 2-4 along with
the linear fit to the JMAK expression. The error bars shown were 0.1 unit for the y-axis,
which was approximately three times the estimated ±3-5% uncertainty in the XRD
determination of c-A120 3 mass fraction [44]. The error in the transformed data, however,
was actually a very strong function of the mass fraction of a-A120 3 present as shown in
Figure 2-5. This plot was obtained by differentiating the left side of Equation 2-4 by the
mass fraction X, multiplying the result by 3% or 5% of the mass fraction, and plotting the
resulting value as a function of mass fraction of x-A120 3. It showed that for a mass fraction
of a-A120 3 above 0.95, the error in the transformed data became extraordinarily large and
should not be relied upon in determining the fitted line. The average value for the Avrami
exponent n for these transformations was found to be 1.07. However, no physical
40
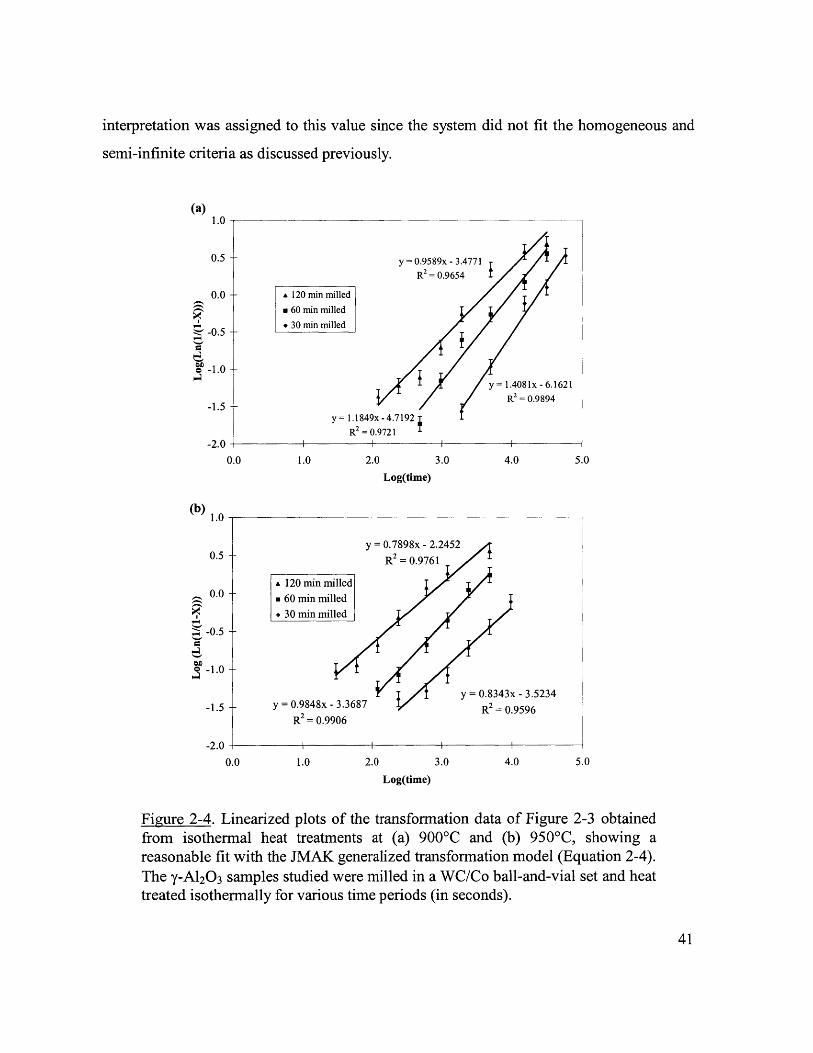
interpretation was assigned to this value since the system did not fit the homogeneous and
semi-infinite criteria as discussed previously.
A 120 min milled
* 60 min milled
* 30 min milled
y =0.9589x - 3.4771
R= 0.9654
y = 1.4081x - 6.1621R2= 0.9894
x -4.7192T
R2 = 0.9721yv= 1.1849
1.0 2.0 3.0
Log(time)
4.0
0.0
-0.5
-1.0--
-1.5
-2.0 -
0.0
A 120 min m
* 60 min mi
* 30 min mi
y = 0.9848x2R = 0.9
y = 0.7898x - 2.2452
R2 = 0.9761
illed
lied
led
y = 0.8 343x= 0.
-3.5234
9596- 3.3687
906
1.0 2.0 3.0 4.0 5.0
Log(time)
Figure 2-4. Linearized plots of the transformation data of Figure 2-3 obtainedfrom isothermal heat treatments at (a) 900'C and (b) 950'C, showing areasonable fit with the JMAK generalized transformation model (Equation 2-4).The y-A120 3 samples studied were milled in a WC/Co ball-and-vial set and heattreated isothermally for various time periods (in seconds).
41
(a)1.0 1
0.5
0.0 +-0.5 -
0 1.0
.1.5 +
-2.0
0.0
(b)1.0 1
5.0
0.5 -
C.
R 2
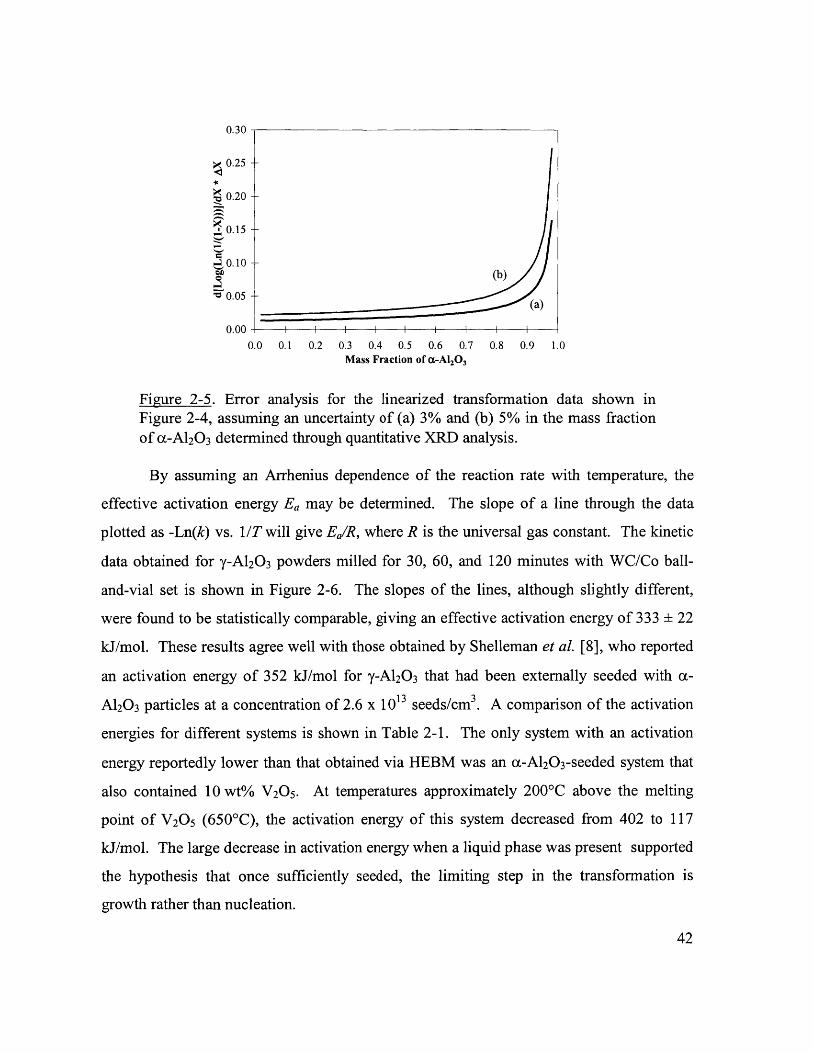
0.30
0.25
0.20
0.15
04 0.10(b)
0.05 --(a)
0.00 I I I I I I I0.0 0.1 0.2 0.3 0.4 0.5 0.6 0.7 0.8 0.9 1.0
Mass Fraction of a-A120,
Figure 2-5. Error analysis for the linearized transformation data shown inFigure 2-4, assuming an uncertainty of (a) 3% and (b) 5% in the mass fractionof a-A120 3 determined through quantitative XRD analysis.
By assuming an Arrhenius dependence of the reaction rate with temperature, the
effective activation energy Ea may be determined. The slope of a line through the data
plotted as -Ln(k) vs. I/T will give Ea/R, where R is the universal gas constant. The kinetic
data obtained for y-A120 3 powders milled for 30, 60, and 120 minutes with WC/Co ball-
and-vial set is shown in Figure 2-6. The slopes of the lines, although slightly different,
were found to be statistically comparable, giving an effective activation energy of 333 ± 22
kJ/mol. These results agree well with those obtained by Shelleman et al. [8], who reported
an activation energy of 352 kJ/mol for y-A120 3 that had been externally seeded with x-
A120 3 particles at a concentration of 2.6 x 10¹³ seeds/cm 3 . A comparison of the activation
energies for different systems is shown in Table 2-1. The only system with an activation
energy reportedly lower than that obtained via HEBM was an cc-Al 2 O3-seeded system that
also contained 10 wt% V20 5 . At temperatures approximately 200'C above the melting
point of V2 0 5 (650'C), the activation energy of this system decreased from 402 to 117
kJ/mol. The large decrease in activation energy when a liquid phase was present supported
the hypothesis that once sufficiently seeded, the limiting step in the transformation is
growth rather than nucleation.
42
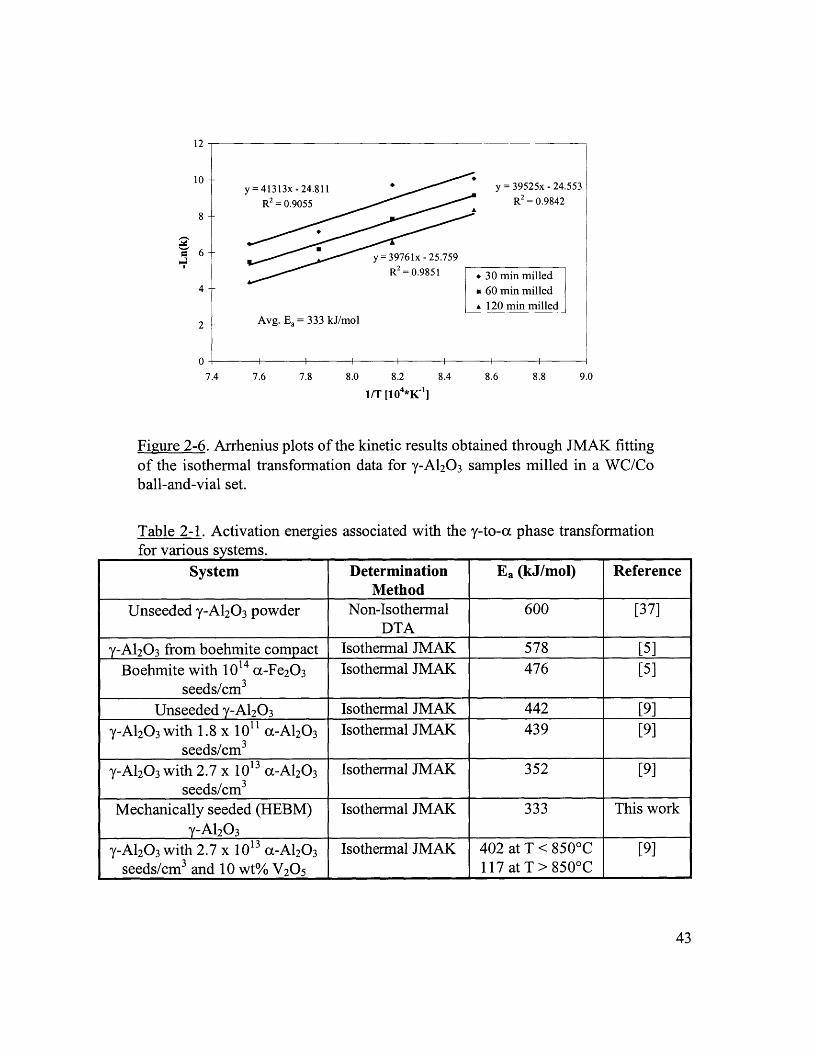
12 ,
10 +
8
6!
4-
2
07
y = 41313x - 24.811
R2= 0.9055
y = 39761x - 25.759R2=0.9851
Avg. Ea = 333 kJ/mol
.4 7.6
y = 39525x - 24.553R = 0.9842
30 min milled60 min milled
120 min milled
7.8 8.0 8.2 8.4 8.6 8.8
l/T 110 4*K1 ]
9.0
Figure 2-6. Arrhenius plots of the kinetic results obtained through JMAK fittingof the isothermal transformation data for y-A120 3 samples milled in a WC/Coball-and-vial set.
Table 2-1. Activation energies associated with the y-to-L phase transformationfor various systems.
System Determination Ea (kJ/mol) ReferenceMethod
Unseeded y-A12 03 powder Non-Isothermal 600 [37]DTA
y-A12 0 3 from boehmite compact Isothermal JMAK 578 [5]Boehmite with 1014 x-Fe 2O3 Isothermal JMAK 476 [5]
seeds/cm 3
Unseeded y-A120 3 Isothermal JMAK 442 [9]y-A120 3 with 1.8 x 10¹¹ c-Al2 0 3 Isothermal JMAK 439 [9]
seeds/cm 3
y-A120 3 with 2.7 x 10¹³ a-A120 3 Isothermal JMAK 352 [9]seeds/cm 3
Mechanically seeded (HEBM) Isothermal JMAK 333 This worky-A120 3
y-A120 3 with 2.7 x 10¹³ cc-Al2 O3 Isothermal JMAK 402 at T < 850'C [9]seeds/cm 3 and 10 wt% V20 5 117 at T > 850 0C
43
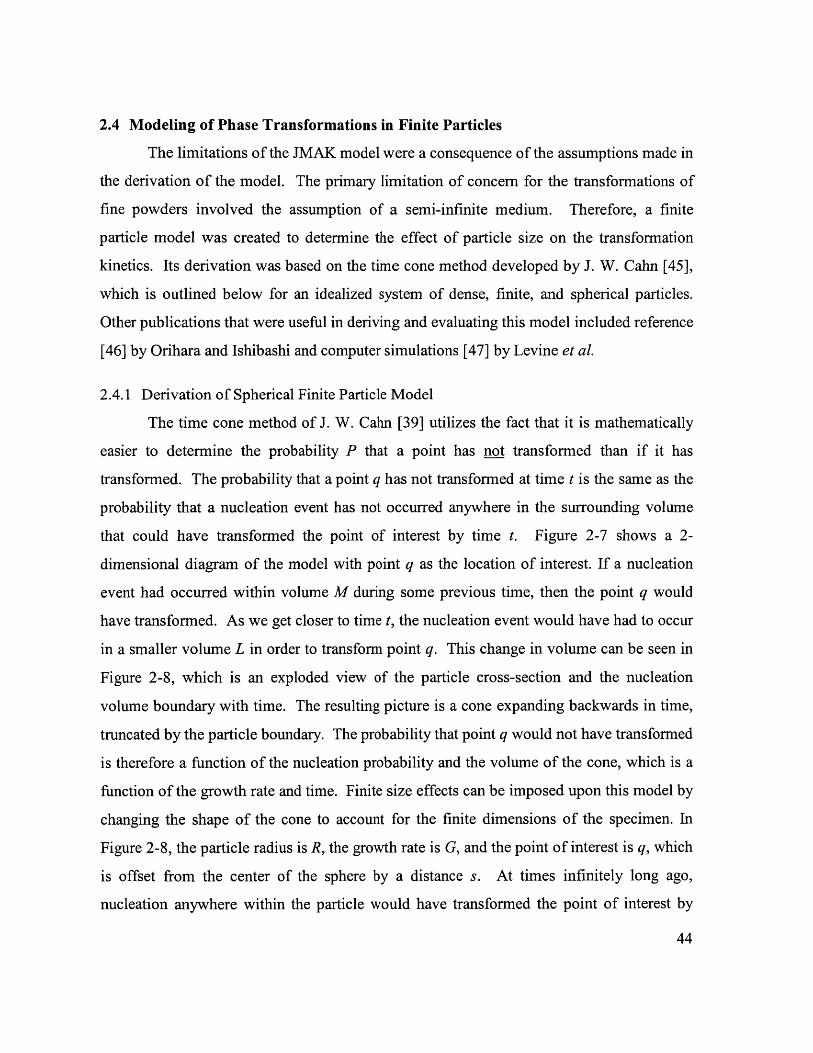
2.4 Modeling of Phase Transformations in Finite Particles
The limitations of the JMAK model were a consequence of the assumptions made in
the derivation of the model. The primary limitation of concern for the transformations of
fine powders involved the assumption of a semi-infinite medium. Therefore, a finite
particle model was created to determine the effect of particle size on the transformation
kinetics. Its derivation was based on the time cone method developed by J. W. Cahn [45],
which is outlined below for an idealized system of dense, finite, and spherical particles.
Other publications that were useful in deriving and evaluating this model included reference
[46] by Orihara and Ishibashi and computer simulations [47] by Levine et al.
2.4.1 Derivation of Spherical Finite Particle Model
The time cone method of J. W. Cahn [39] utilizes the fact that it is mathematically
easier to determine the probability P that a point has not transformed than if it has
transformed. The probability that a point q has not transformed at time t is the same as the
probability that a nucleation event has not occurred anywhere in the surrounding volume
that could have transformed the point of interest by time t. Figure 2-7 shows a 2-
dimensional diagram of the model with point q as the location of interest. If a nucleation
event had occurred within volume M during some previous time, then the point q would
have transformed. As we get closer to time t, the nucleation event would have had to occur
in a smaller volume L in order to transform point q. This change in volume can be seen in
Figure 2-8, which is an exploded view of the particle cross-section and the nucleation
volume boundary with time. The resulting picture is a cone expanding backwards in time,
truncated by the particle boundary. The probability that point q would not have transformed
is therefore a function of the nucleation probability and the volume of the cone, which is a
function of the growth rate and time. Finite size effects can be imposed upon this model by
changing the shape of the cone to account for the finite dimensions of the specimen. In
Figure 2-8, the particle radius is R, the growth rate is G, and the point of interest is q, which
is offset from the center of the sphere by a distance s. At times infinitely long ago,
nucleation anywhere within the particle would have transformed the point of interest by
44
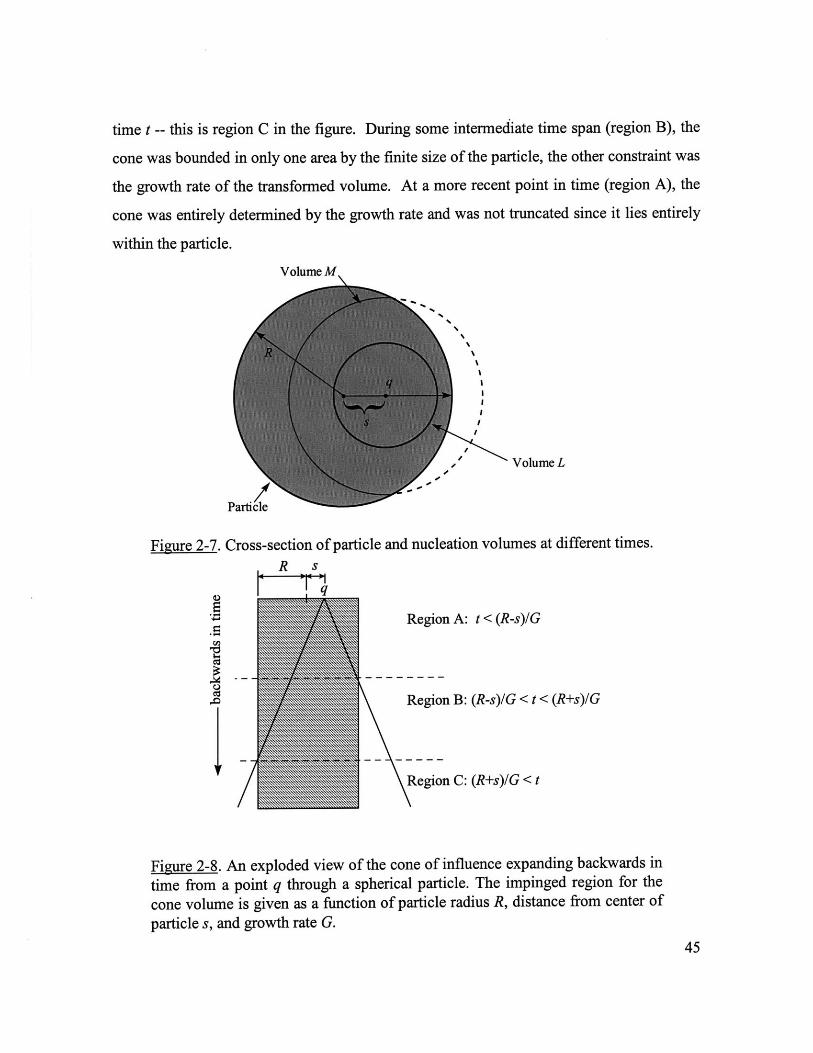
time t -- this is region C in the figure. During some intermediate time span (region B), the
cone was bounded in only one area by the finite size of the particle, the other constraint was
the growth rate of the transformed volume. At a more recent point in time (region A), the
cone was entirely determined by the growth rate and was not truncated since it lies entirely
within the particle.
Volume \
Volume L
Figure 2-7. Cross-section of particle and nucleation volumes at different times.
R s
Region A: t < (R-s)/G
Region B: (R-s)/G < t < (R+s)/G
Region C: (R+s)IG < t
Figure 2-8. An exploded view of the cone of influence expanding backwards in
time from a point q through a spherical particle. The impinged region for the
cone volume is given as a function of particle radius R, distance from center of
particle s, and growth rate G.
45
In this derivation, the primary assumptions are that the nucleation events (or seeds)
are randomly distributed within the particle, and that the nucleation events can be described
by a Poisson distribution. In addition, surfaces are assumed to have no effect other than to
define the limits of the volume (i.e. surface nucleation is not considered). Finally, it is
assumed that there are no particle-particle interactions (e.g. the transformed surface of one
particle acting as a seed for another). The mathematical limits of the time cone can be
described by the parameters s, R, G, and t. As shown in Figure 2-8, there are three different
integration limits for the boundaries of the time-cone, so numerical integration must be
used. In order to set up this problem, an array of 100 points were evenly spaced along the
radius of a particle. The cone volume was calculated for each point at each time step,
multiplied by the probability of nucleation, and numerically integrated over time. This
would give the expected number of nuclei in the volume at time t, which is <N>c using
Cahn's notation. The probability that this point has not transformed is then:
P= e-<N>c (Equation 2-5)
This probability for each point along the radius is then weighted to account for the
difference in relative volume that each point represents due to the spherical geometry of the
particle. The fraction that has transformed is then given by 1-P. A spreadsheet was used to
perform the repetitive calculations necessary to create the model.
Values for the growth rate and nucleation rate were approximated by fitting Avrami
curves to literature data [2] for compacts of seeded and unseeded y-A120 3 systems
transformed isothermally at 1050'C. This approach would only provide an order of
magnitude approximation for these values, but it should give some insight into the effect of
particle size on the transformation kinetics of finite y-A120 3 particles.
2.4.2 Finite Size Effects on Seeded and Unseeded Systems
The plots obtained by applying the above model and fitted data to particles of
various diameters are shown in Figures 2-9 and 2-10. These plots were produced by using a
growth rate of 4 A/s, and either a homogeneous nucleation rate of 106 events/CM3-s or a seed
46
density of 3x10¹³ seeds/cm 3 . In both figures, the transformation curves for a semi-infinite
material are also plotted using the JMAK model for spherical transformation volumes
(using Equations 2-1 and 2-2 for the unseeded and seeded cases, respectively).
Reduction of the particle size significantly affects the time necessary to achieve
complete conversion in the case of spontaneous nucleation (Figure 2-9). As the particle
size is reduced, the volume within which a nucleation event can occur is also reduced so
that nucleation is much less likely to occur. Since the growth phase of the transformation
will be relatively rapid compared to the time scale of nucleation within small particles, the
transformation kinetics become essentially nucleation-controlled. The greatest disparity
between this finite particle model and a real system may be attributed to neglecting particle-
particle interactions in the former. In a real system, particle-particle interactions would
undoubtedly occur and could greatly reduce the time required for complete transformation.
In fact, the microstructure of transformed alumina suggests that particle-particle interactions
do take place under spontaneous nucleation conditions. The transformed c-A120 3 areas
have been described as (i) porous single crystals (several times larger than the parent y-
A12 0 3 crystallites) or (ii) made up of several crystallites with low-angle grain boundaries.
In either case, the structure is very similar to what might be expected if particle-particle
interactions occurred on a large scale with minimal sintering during phase transformation.
The effect of a reduced particle size on the transformation of a seeded system is less
significant due to the fact that the nucleation is not time-dependent. In this case, the
number of nuclei per particle is determined by the size of the particle. As the particle size
decreases, the number of nuclei per particle decreases so that transformation becomes
growth-controlled. In the extreme case, there are fewer nuclei than particles and the
transformation does not proceed to completion. This is illustrated in Figure 2-10 whereby
the finest particles ( 0.3 pm-sized) do not approach full conversion due to the shortage of
nuclei. This upper limit in transformation is partially due to the restriction that spontaneous
nucleation cannot occur in this system. A comparison of the time scales for spontaneous
nucleation of smaller particles and transformation times for a seeded system suggests that
47
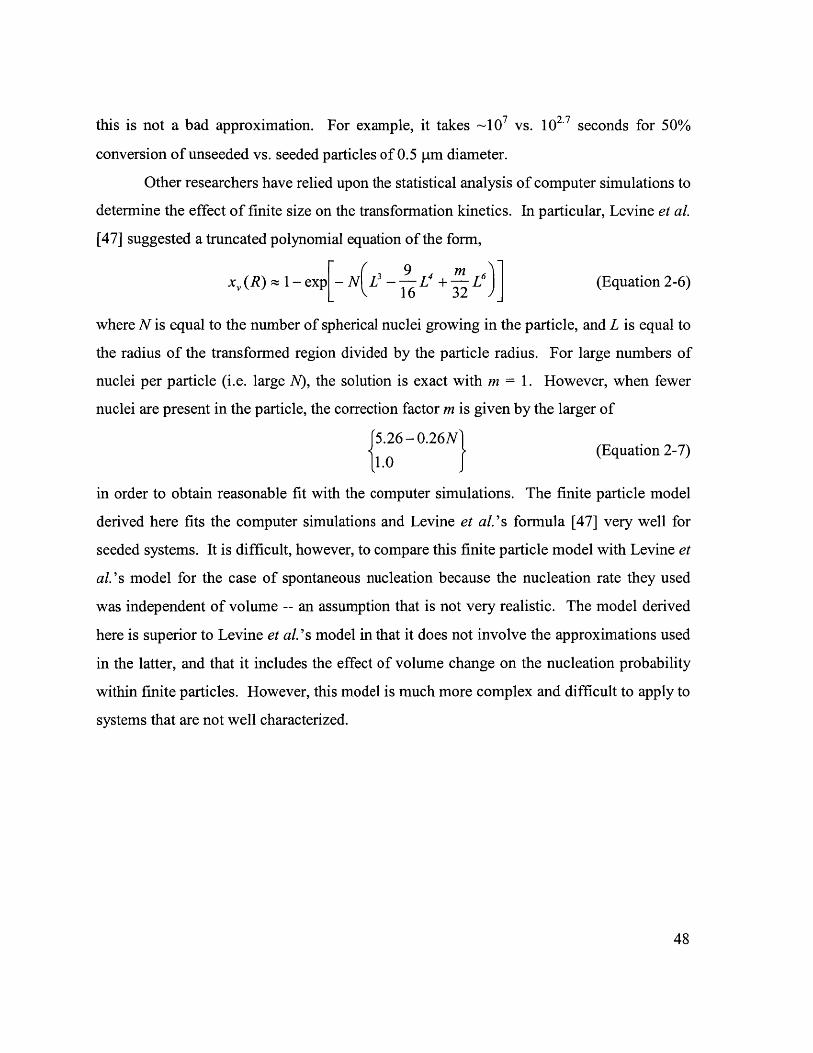
this is not a bad approximation. For example, it takes ~107 vs. 102.7 seconds for 50%
conversion of unseeded vs. seeded particles of 0.5 pm diameter.
Other researchers have relied upon the statistical analysis of computer simulations to
determine the effect of finite size on the transformation kinetics. In particular, Levine et al.
[47] suggested a truncated polynomial equation of the form,
x,(R) ~~ I- exp[- N L - - L4 + - L6 (Equation 2-6)16 32_
where N is equal to the number of spherical nuclei growing in the particle, and L is equal to
the radius of the transformed region divided by the particle radius. For large numbers of
nuclei per particle (i.e. large N), the solution is exact with m = 1. However, when fewer
nuclei are present in the particle, the correction factor m is given by the larger of
5.26 -0.26N
1.0 (Equation 2-7)
in order to obtain reasonable fit with the computer simulations. The finite particle model
derived here fits the computer simulations and Levine et al.'s formula [47] very well for
seeded systems. It is difficult, however, to compare this finite particle model with Levine et
al.'s model for the case of spontaneous nucleation because the nucleation rate they used
was independent of volume -- an assumption that is not very realistic. The model derived
here is superior to Levine et al.'s model in that it does not involve the approximations used
in the latter, and that it includes the effect of volume change on the nucleation probability
within finite particles. However, this model is much more complex and difficult to apply to
systems that are not well characterized.
48
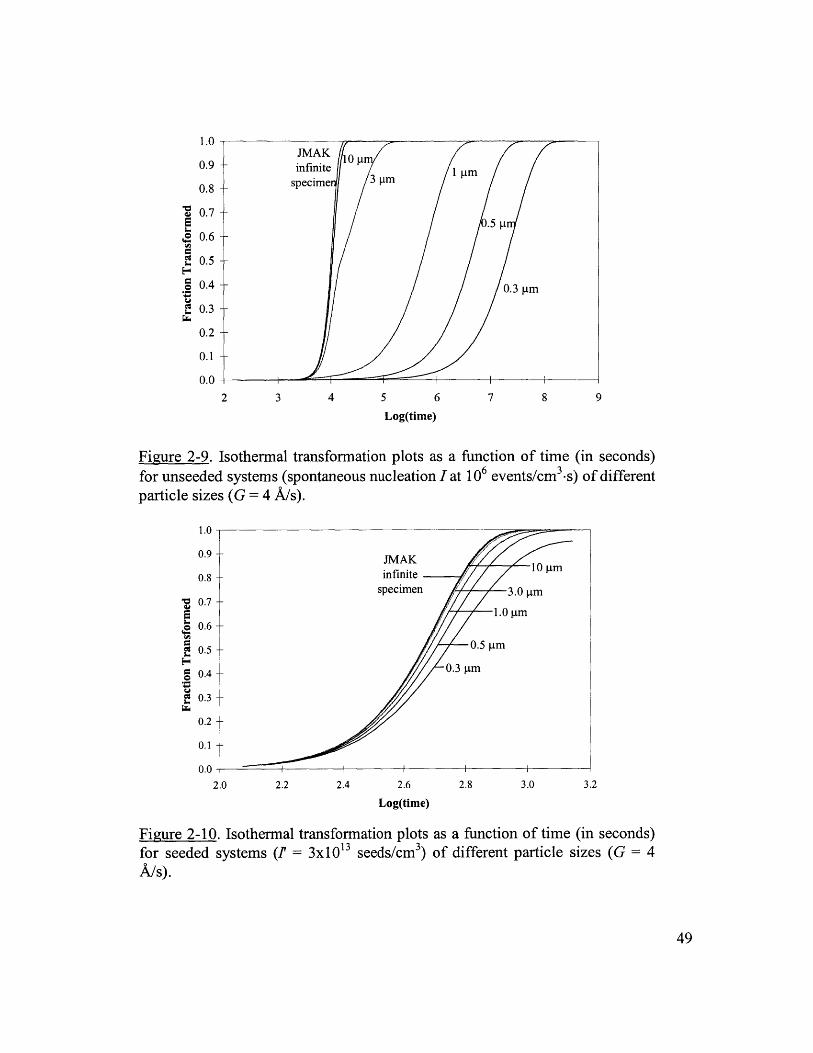
EI-C
~4~U,
ClCl
C
Cl
1.0
0.9
0.8
0.7
0.6
0.5
0.4 t
0.3
0.2
0.1
0.02 3 4 5 6 7 8 9
Log(time)
Figure 2-9. Isothermal transformation plots as a function of time (in seconds)for unseeded systems (spontaneous nucleation I at 106 events/cm 3 -s) of differentparticle sizes (G = 4 /s).
1.0
0.9
0.8
V
40-
0.7
0.6
0.5
0.4
0.3
0.2
0.1
0.0
2.0 2.2 2.4 2.6 2.8 3.0 3.2
Log(time)
Figure 2-10. Isothermal transformation plots as a function of time (in seconds)for seeded systems (1 = 3x10 13 seeds/cm 3) of different particle sizes (G = 4^/s).
49
JMAK 10 pjinfinite 1 pm
specime 3 pm
0.5 p
0.3 pm
JMAKinfinite 10 pIm
specimen 3.0 pm
1.0 pm
0.5 pm
0.3 pm
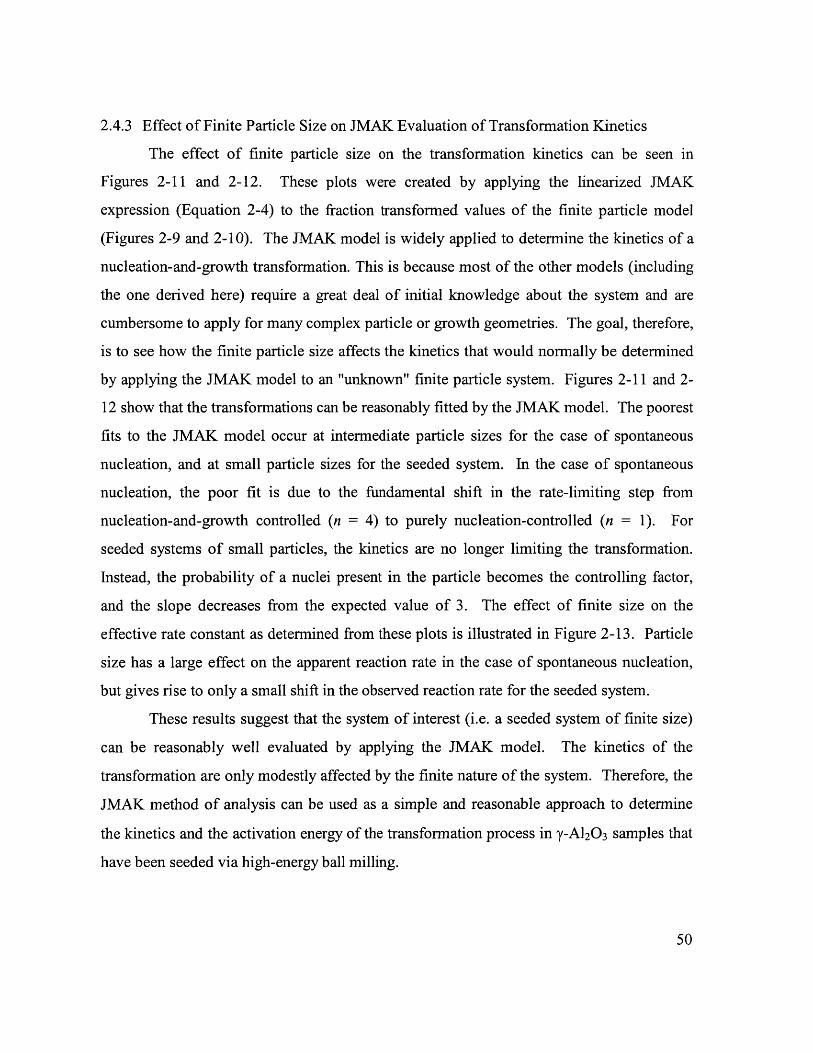
2.4.3 Effect of Finite Particle Size on JMAK Evaluation of Transformation Kinetics
The effect of finite particle size on the transformation kinetics can be seen in
Figures 2-11 and 2-12. These plots were created by applying the linearized JMAK
expression (Equation 2-4) to the fraction transformed values of the finite particle model
(Figures 2-9 and 2-10). The JMAK model is widely applied to determine the kinetics of a
nucleation-and-growth transformation. This is because most of the other models (including
the one derived here) require a great deal of initial knowledge about the system and are
cumbersome to apply for many complex particle or growth geometries. The goal, therefore,
is to see how the finite particle size affects the kinetics that would normally be determined
by applying the JMAK model to an "unknown" finite particle system. Figures 2-11 and 2-
12 show that the transformations can be reasonably fitted by the JMAK model. The poorest
fits to the JMAK model occur at intermediate particle sizes for the case of spontaneous
nucleation, and at small particle sizes for the seeded system. In the case of spontaneous
nucleation, the poor fit is due to the fundamental shift in the rate-limiting step from
nucleation-and-growth controlled (n = 4) to purely nucleation-controlled (n = 1). For
seeded systems of small particles, the kinetics are no longer limiting the transformation.
Instead, the probability of a nuclei present in the particle becomes the controlling factor,
and the slope decreases from the expected value of 3. The effect of finite size on the
effective rate constant as determined from these plots is illustrated in Figure 2-13. Particle
size has a large effect on the apparent reaction rate in the case of spontaneous nucleation,
but gives rise to only a small shift in the observed reaction rate for the seeded system.
These results suggest that the system of interest (i.e. a seeded system of finite size)
can be reasonably well evaluated by applying the JMAK model. The kinetics of the
transformation are only modestly affected by the finite nature of the system. Therefore, the
JMAK method of analysis can be used as a simple and reasonable approach to determine
the kinetics and the activation energy of the transformation process in y-A120 3 samples that
have been seeded via high-energy ball milling.
50
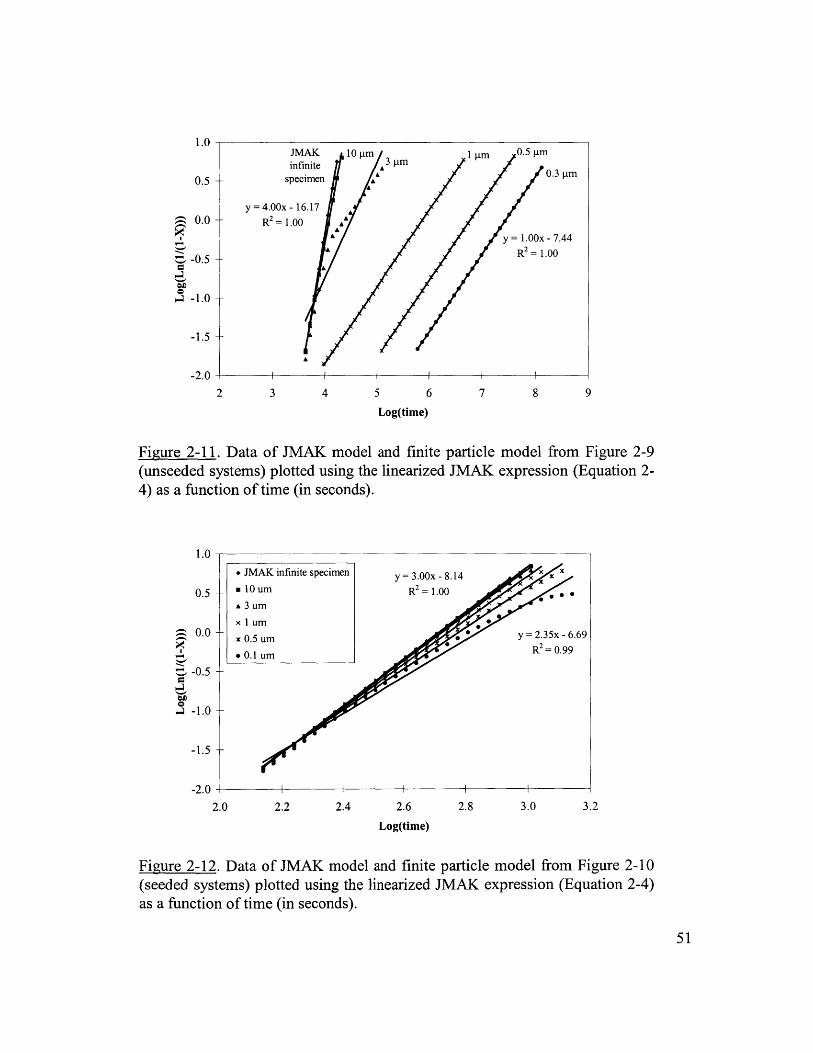
JMAK 10 im 31 m 0.5 iminfinite A 3 m
specimen A 0.3 pm
y 4.00x - 16.17R=1.00 £
Ay= 1.00x - 7.44
R2= 1.00
3 4 5 6 7 8
Log(time)
Figure 2-11. Data of JMAK model and finite particle(unseeded systems) plotted using the linearized JMAK4) as a function of time (in seconds).
1.0 -
0.5 -
0.0 -
-0.5
-1.0-
-1.5 --
C
-2.0
2.0 2.2 2.4 2.6 2.8 3.0
Log(time)
model from Figure 2-9expression (Equation 2-
31
3.2
Figure 2-12. Data of JMAK model and finite particle model from Figure 2-10(seeded systems) plotted using the linearized JMAK expression (Equation 2-4)as a function of time (in seconds).
51
1.0
0.5
0.0 ±-0.5
C1.0 -
-1.5
-2.0 12 9
* JM. 10h 3 u
xlu
x 0.5* 0.1
AK infinite specimen y = 3.00x - 8.14 Xum 1.00m
m
um * y = 2.35x - 6.
um R2= 0.9969
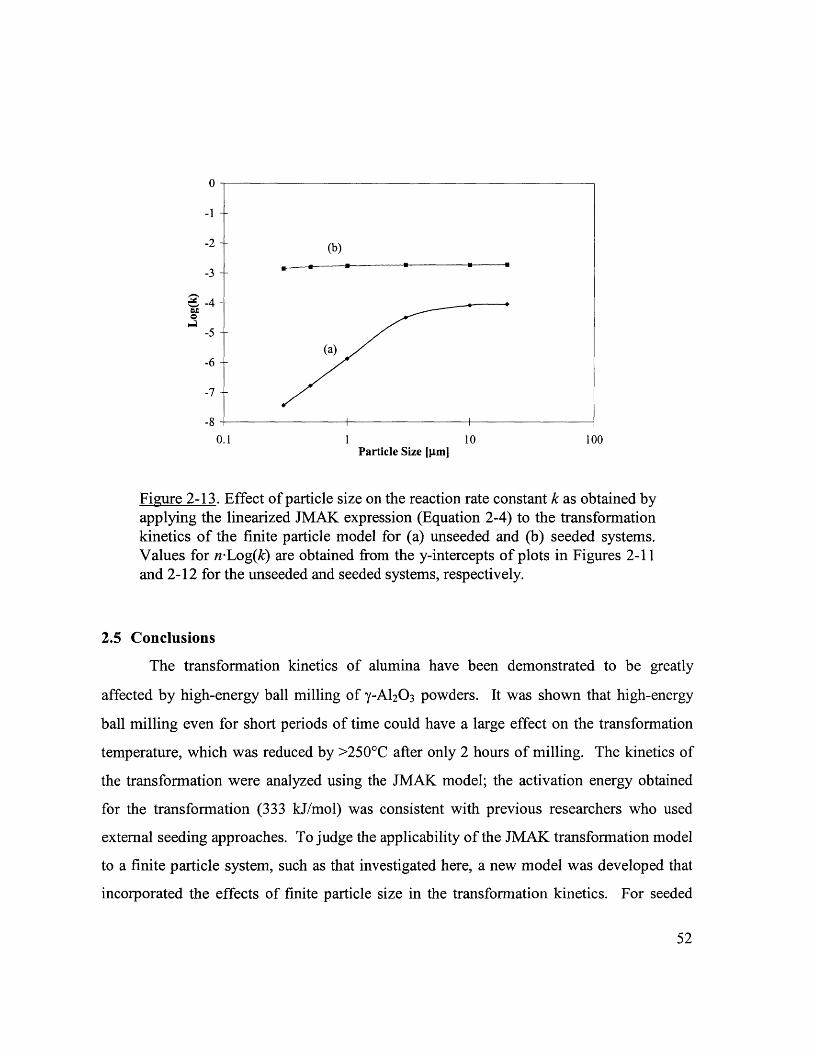
0
-1 --
-2 (b)
-3 --
-4
-5
(a)-6
-7
-80.1 1 10 100
Particle Size Im]
Figure 2-13. Effect of particle size on the reaction rate constant k as obtained byapplying the linearized JMAK expression (Equation 2-4) to the transformationkinetics of the finite particle model for (a) unseeded and (b) seeded systems.Values for n-Log(k) are obtained from the y-intercepts of plots in Figures 2-11and 2-12 for the unseeded and seeded systems, respectively.
2.5 Conclusions
The transformation kinetics of alumina have been demonstrated to be greatly
affected by high-energy ball milling of y-A120 3 powders. It was shown that high-energy
ball milling even for short periods of time could have a large effect on the transformation
temperature, which was reduced by >250'C after only 2 hours of milling. The kinetics of
the transformation were analyzed using the JMAK model; the activation energy obtained
for the transformation (333 kJ/mol) was consistent with previous researchers who used
external seeding approaches. To judge the applicability of the JMAK transformation model
to a finite particle system, such as that investigated here, a new model was developed that
incorporated the effects of finite particle size in the transformation kinetics. For seeded
52
systems with particle sizes greater than 0.3 pim, the JMAK model and the finite particle
model gave nearly equivalent results. This suggests that the JMAK model can be reliably
employed to approximate the activation energy for seeded finite systems. On the other
hand, the JMAK model does not work well for cases of strictly homogeneous, bulk
nucleation in the absence of particle-particle interactions. Incorporating the effects of
surface nucleation and particle-particle interactions into the finite particle model would
better approximate real systems.
2.6 References
[1] W. A. Yarbrough and R. Roy, "Microstructural Evolution in Sintering of AlOOH
Gels," J. Mater. Res., 2 [4] 494-515 (1987).
[2] G. L. Messing and J. C. Huling, "Transformation, Microstructure Development and
Sintering in Nucleated Alumina Gels"; pp. 669-79 in Processing of Ceramics,
Proceedings of the 3rd European Ceramic Society Conference, Vol. 1. Edited by P.
Duran and J. F. Fernandez. Faenze Editrice Iberica S.L., 1993.
[3] L. A. Xue and I. W. Chen, "Influence of Chemical Additives on the y-to-cc
Transformation of Alumina," J. Mater. Sci. Lett., 11 [8] 443-45 (1992).
[4] J. McArdle, G. Messing, L. Tietz, and C. Carter, "Solid-Phase Epitaxy of Boehmite-
Derived c-Alumina on Hematite Seed Particles," J. Am. Ceram. Soc., 72 [5] 864-67
(1989).
[5] J. McArdle and G. Messing, "Transformation, Microstructure Development, and
Densification in c-Fe2O3-Seeded Boehmite-Derived Alumina," J. Am. Ceram. Soc.,
76 [1] 214-22 (1993).
[6] M. Kumagai and G. L. Messing, "Enhanced Densification of Boehmite Sol-Gels by
cc-Alumina Seeding," J Am. Ceram. Soc., 67 [11] C230-31 (1984).
[7] M. Kumagai and G. L. Messing, "Controlled Transformation and Sintering of a
Boehmite Sol-Gel by cc-Alumina Seeding," J. Am. Ceram. Soc., 68 [9] 500-05 (1985).
53
[8] R. A. Shelleman, G. L. Messing, and M. Kumagai, "Alpha Alumina Transformation
in Seeded Boehmite Gels," J. Non-Cryst. Solids, 82, 277-85 (1986).
[9] R. A. Shelleman and G. L. Messing, "Liquid-Phase-Assisted Transformation of
Seeded y-Alumina," J. Am. Ceram. Soc., 71 [5] 317-22 (1988).
[10] G. L. Messing and M. Kumagai, "Low-Temperature Sintering of a-Alumina-Seeded
Boehmite Gels," Am. Ceram. Soc. Bull., 73 [10] 88-91 (1994).
[11] C. S. Nordahl and G. L. Messing, "Transformation and Densification of
Nanocrystalline 0-Alumina during Sinter Forging," J. Am. Ceram. Soc., 79 [12] 3149-
54 (1996).
[12] 0. Kwon, C. S. Nordahl, and G. L. Messing, "Submicrometer Transparent Alumina
by Sinter Forging Seeded y-A120 3 Powders," J. Am. Ceram. Soc., 78 [2] 491-94
(1995).
[13] L. Pach, R. Roy, and S. Komarneni, "Nucleation of Alpha Alumina in Boehmite Gel,"
J. Mater. Res., 5 [2] 278-85 (1990).
[14] E. Prouzet, D. Fargeot, and J. F. Baumard, "Sintering of Boehmite-Derived Transition
Alumina Seeded with Corundum," J. Mater. Sci. Lett., 9, 779-81 (1990).
[15] I. P. Kilbride and A. J. Barker, "Enhanced Densification by Seeding of Extruded
Boehmite Gels Derived by Hydrothermal Decomposition of Basic Aluminium
Acetate," Brit. Ceram. Trans., 93 [5] 187-91 (1994).
[16] P. S. Jayan, N. Ananthaseshan, B. Subramaniam, and M. V. Murugappan, "Process
for the Preparation of Alumina Abrasives," U.S. Pat. No. 5782940, Jul. 21, 1998.
[17] T. E. Cottringer, R. H. van de Werde, R. Bauer, and W. A. Yarbrough, "Abrasive
Material and Method," U.S. Patent No. 5395407, Mar. 7, 1995.
[18] T. E. Wood, "hnpregnation Method for Transformation of Transition Alumina to a
Alpha Alumina," U.S. Patent No. 5139978, Aug. 18, 1992.
[19] L. Pach, S. Kovalik, J. Majling, and J. Kozankova, "Effect of Pressure on a-Alumina
Nucleation in Boehmite Gel," J. Eur. Ceram. Soc., 12, 249-55 (1993).
54
[20] T. Nishio and Y. Fujiki, "Phase Transformation Kinetics of Precursor Gel to c-
Alumina," J Mater. Sci., 29 [13] 3408-14 (1994).
[21] Y. Ishitobi, M. Shimada, and M. Koizumi, "Sintering of Dense Alumina by Direct
Transformation from Eta to Alpha A12 0 3 Under High Pressure," Proc. Round Table
Meet. Spec., 113-33 (1979).
[22] E. K. Beauchamp and M. J. Carr, "Kinetics of Phase Change in Explosively Shock-
Treated Alumina," J. Am. Ceram. Soc., 73 [1] 49-53 (1990).
[23] 0. V. Andryushkova, V. A. Ushakov, G. N. Kryukova, 0. A. Kirichenko, and V. A.
Poluboyarov, "Solid Phase Transformation of Mechanically Activated Alumina
During Thermal Treatment," Chem. Sust. Dev., 4, 15-26 (1996).
[24] L. Kacsalova, "Transformation of Bayerite into ac-A120 3 Under Mechanical Impact,"
Acta Chim. Acad. Sci. Hung., 99 [2] 115-20 (1979).
[25] M. L. Panchula and J. Y. Ying, "Mechanical Synthesis of Nanocrystalline a-A120 3
Seeds for Enhanced Transformation Kinetics," Nanostr. Mater., 9 [1-8] 161-64
(1996).
[26] M. L. Panchula and J. Y. Ying, "Enhanced Transformation and Sintering of
Transitional Alumina through Mechanical Seeding"; pp. 319-333 in Nanostructured
Materials. Edited by G.-M. Chow and N. Noskova. Kluwer Academic Publishers,
Dordrecht, The Netherlands, 1998.
[27] A. Tonejc, C. Kosanovic, M. Stubicar, A. M. Tonejc, B. Subotic, and I. Smit,
"Equivalence of Ball Milling and Thermal Treatment for Phase Transitions in the
A120 3 System," J. Alloys Comp., 204, L1-3 (1994).
[28] A. Tonejc, M. Stubicar, A. M. Tonejc, K. Kosanovic, B. Subotic, and I. Smit,
"Transformation of y-AlOOH (Boehmite) and Al(OH) 3 (Gibbsite) to a-A120 3
(Corundum) Induced by High Energy Ball Milling," J. Mater. Sci. Lett., 13 [7] 519-20
(1994).
55
[29] P. A. Zielinski, R. Schulz, S. Kaliaguine, and A. Van Neste, "Structural
Transformations of Alumina by High Energy Ball Milling," J. Mater. Res., 8 [11]
2985-92 (1993).
[30] M. V. Zdujic, 0. B. Milosevic, and Lj. C. Karanovic, "Mechanochemical Treatment
of ZnO and A120 3 Powders by Ball Milling," Mater. Lett., 13, 125-29 (1992).
[31] R. B. Bagwell and G. L. Messing, "Effect of Seeding and Water Vapor on the
Nucleation and Growth of a-A1203 from y-A12 0 3," J Am. Ceram. Soc., 82 [4] 825-32
(1999).
[32] S. K. Mehta, A. Kalsotra, and M. Murat, "A New Approach to Phase Transformations
in Gibbsite: The Role of Crystallinity," Therm. A cta, 205, 191-203 (1992).
[33] J. M. McHale, A. Auroux, A. J. Perrotta, and A. Navrotsky, "Surface Energies and
Thermodynamic Phase Stability in Nanocrystalline Aluminas," Science, 277, 788-91
(1997).
[34] J. M. McHale, A. Navrotsky, and A. J. Perrotta, "Effects of Increased Surface Area
and Chemisorbed H20 on the Relative Stability of Nanocrystalline y-AI20 3 and x-
A120 3," J. Phys. Chem. B, 101 [4] 603-13 (1996).
[35] K. J. D. Mackenzie and G. Hosseini, "Effect of Electric Fields on the Transformation
of Gamma to Alpha Alumina," Trans. J Brit. Ceram. Soc., 77 [6] 172-76 (1976).
[36] A. Kochendorfer, Z. Kristallogr., 105, 393 (1944).
[37] H. Schaper and L. L. Van Reijen, "A Quantitative Investigation of the Phase
Transformation of Gamma to Alpha Alumina With High Temperature DTA," Therm.
Acta, 77, 383-93 (1984).
[38] C. C. Koch, "Mechanical Milling and Alloying"; Chapter 5, pp. 194-245 in
Processing of Metals and Alloys, Materials Science and Technology, Vol. 15. Edited
by R. W. Cahn, P. Haasen, and E. J. Kramer. VCH, New York, NY, 1991.
[39] J. W. Cahn, "The Kinetics of Grain Boundary Nucleated Reactions," Acta Metall., 4
449-59 (1956).
[40] M. Avrami, "Kinetics of Phase Change I," J. Chem. Phys., 7, 1103-12 (1939).
56
[41] M. Avrami, "Kinetics of Phase Change II," J. Chem. Phys., 8, 212-24 (1940).
[42] M. Avrami, "Kinetics of Phase Change I," J. Chem. Phys., 9, 177-84 (1941).
[43] M. C. Weinberg and D. P. Bimie III, "Transformation Kinetics for Randomly
Oriented Anistropic Particles," J. Non-Cryst. Solids, 189, 161-66 (1995).
[44] H. P. Klug and L. E. Alexander, X-ray Diffraction Procedures. John Wiley & Sons,
New York, NY, 1974.
[45] J. W. Cahn, "The Time Cone Method for Nucleation and Growth Kinetics on a Finite
Domain," Mater. Res. Soc. Symp. Proc., 398, 425-37 (1996).
[46] H. Orihara and Y. Ishibashi, "A Statistical Theory of Nucleation and Growth in Finite
Systems," J Phys. Soc. Jpn., 61 [6] 1919-25 (1992).
[47] L. E. Levine, K. L. Narayan, and K. F. Kelton, "Finite Size Corrections for the
Johnson-Mehl-Avrami-Kolmogorov Equation," J. Mater. Res., 12 [1] 124-32 (1997).
57
3. Densification and Microstructural Characterization of Alumina
This chapter describes the effects of mechanical seeding on the sinterability of
alumina powder. After high-energy ball milling, the powder was washed for impurity
removal, jar milled to reduce particle agglomeration, and then hot pressed. Density as a
function of hot pressing temperature was reported for samples milled with WC/Co and
ZrO2 ball-and-vial sets. The differences in the densification behavior between these
samples were discussed and related to the seeding effects and milling detritus. Fracture
surfaces as well as polished and etched surfaces of the densified samples were examined to
illustrate the morphological differences between seeded and unseeded alumina samples.
3.1 Post-HEBM Processing
After HEBM, the powder contained significant amounts of WC/Co or ZrO 2
impurities due to wear of the milling media and container. Samples milled in WC/Co
containers could be purified with aqua regia before further processing. Unfortunately, the
ZrO2 impurities could not be removed by a similar technique because of the chemical
stability of ZrO2. The removal of the WC/Co was performed by mixing approximately 5 g
of milled alumina in a solution of 120 ml of 37 vol% hydrochloric acid, 40 ml of 69 vol%
nitric acid, and 40 ml of water in a Teflon beaker. The acid solution is highly corrosive and
must be handled with extreme care. The water was added to prevent the aqua regia from
releasing "objectionable quantities of chlorine and other gases" [1]. Following the aqua
regia wash, the powders were further washed by centrifugation with water and ethanol, and
then dried. A plot of the tungsten content, determined by chemical analysis (Luvak, Inc.
Waltham MA), as a function of washing time is shown in Figure 3-1 for the powder that
had been milled in a WC/Co ball-and-vial set for two hours. By washing the powder for 12
hours, it was possible to reduce the tungsten content to approximately 0.02 wt%. This is
equivalent to a W/Al molar ratio of 55 ppm.
In order to remove agglomerates and produce a more uniform powder, the samples
that had been high-energy milled and washed with aqua regia were jar milled in
polypropylene containers with ethanol and ZrO2 media for 12 hours. Particle size
58
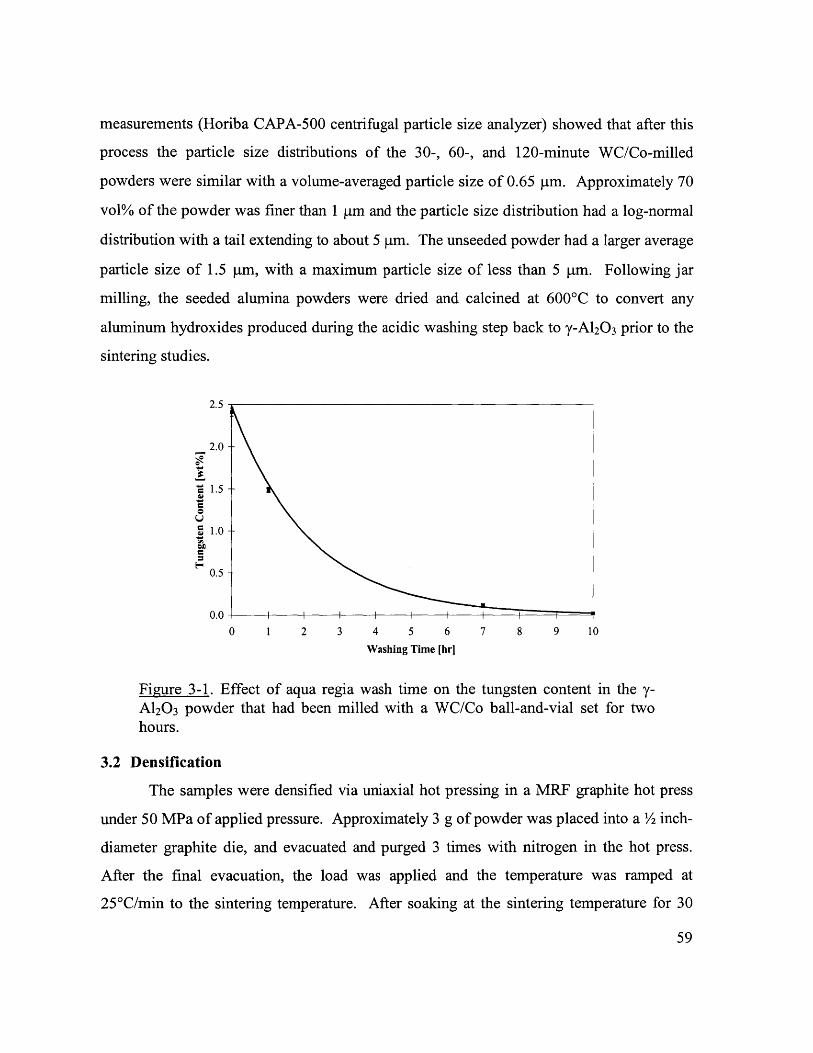
measurements (Horiba CAPA-500 centrifugal particle size analyzer) showed that after this
process the particle size distributions of the 30-, 60-, and 120-minute WC/Co-milled
powders were similar with a volume-averaged particle size of 0.65 pm. Approximately 70
vol% of the powder was finer than 1 pm and the particle size distribution had a log-normal
distribution with a tail extending to about 5 tm. The unseeded powder had a larger average
particle size of 1.5 ptm, with a maximum particle size of less than 5 pm. Following jar
milling, the seeded alumina powders were dried and calcined at 600'C to convert any
aluminum hydroxides produced during the acidic washing step back to y-A120 3 prior to the
sintering studies.
2.5
2.0-
*5 1.5
5 1.0-
0.5
0.00 1 2 3 4 5 6 7 8 9 10
Washing Time [hri
Figure 3-1. Effect of aqua regia wash time on the tungsten content in the y-A120 3 powder that had been milled with a WC/Co ball-and-vial set for twohours.
3.2 Densification
The samples were densified via uniaxial hot pressing in a MRF graphite hot press
under 50 MPa of applied pressure. Approximately 3 g of powder was placed into a /2 inch-
diameter graphite die, and evacuated and purged 3 times with nitrogen in the hot press.
After the final evacuation, the load was applied and the temperature was ramped at
250C/min to the sintering temperature. After soaking at the sintering temperature for 30
59
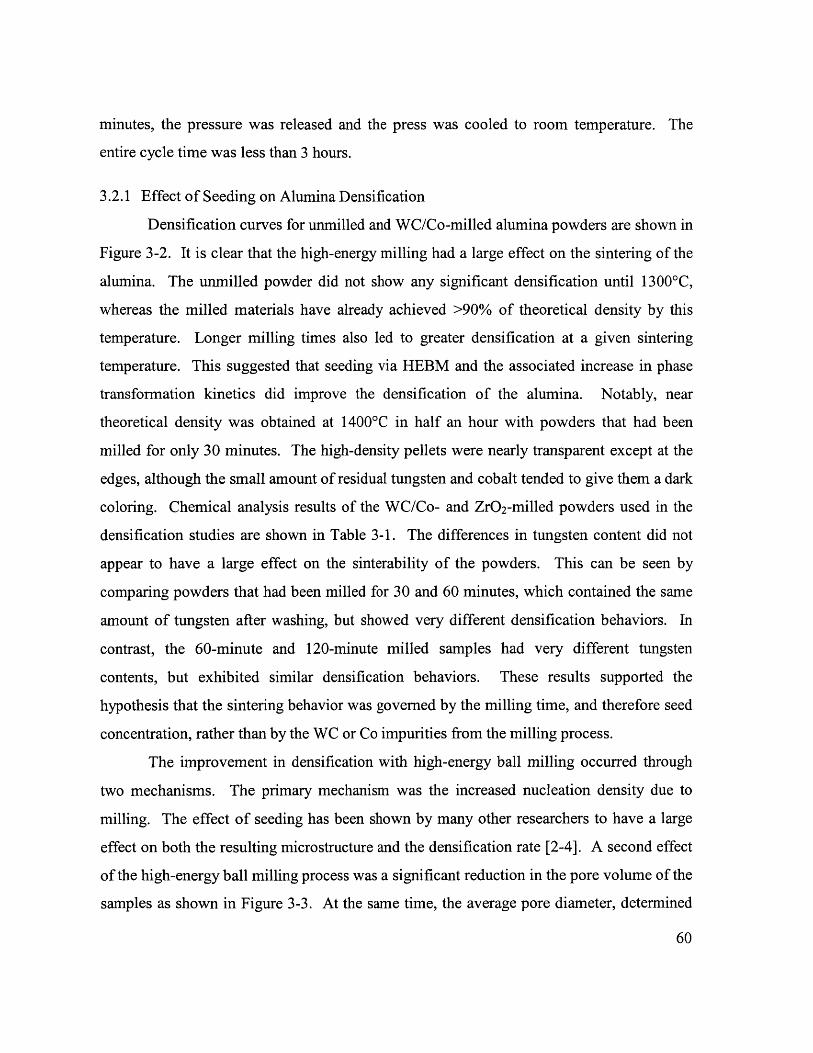
minutes, the pressure was released and the press was cooled to room temperature. The
entire cycle time was less than 3 hours.
3.2.1 Effect of Seeding on Alumina Densification
Densification curves for unmilled and WC/Co-milled alumina powders are shown in
Figure 3-2. It is clear that the high-energy milling had a large effect on the sintering of the
alumina. The unmilled powder did not show any significant densification until 1300'C,
whereas the milled materials have already achieved >90% of theoretical density by this
temperature. Longer milling times also led to greater densification at a given sintering
temperature. This suggested that seeding via HEBM and the associated increase in phase
transformation kinetics did improve the densification of the alumina. Notably, near
theoretical density was obtained at 1400C in half an hour with powders that had been
milled for only 30 minutes. The high-density pellets were nearly transparent except at the
edges, although the small amount of residual tungsten and cobalt tended to give them a dark
coloring. Chemical analysis results of the WC/Co- and ZrO2-milled powders used in the
densification studies are shown in Table 3-1. The differences in tungsten content did not
appear to have a large effect on the sinterability of the powders. This can be seen by
comparing powders that had been milled for 30 and 60 minutes, which contained the same
amount of tungsten after washing, but showed very different densification behaviors. In
contrast, the 60-minute and 120-minute milled samples had very different tungsten
contents, but exhibited similar densification behaviors. These results supported the
hypothesis that the sintering behavior was governed by the milling time, and therefore seed
concentration, rather than by the WC or Co impurities from the milling process.
The improvement in densification with high-energy ball milling occurred through
two mechanisms. The primary mechanism was the increased nucleation density due to
milling. The effect of seeding has been shown by many other researchers to have a large
effect on both the resulting microstructure and the densification rate [2-4]. A second effect
of the high-energy ball milling process was a significant reduction in the pore volume of the
samples as shown in Figure 3-3. At the same time, the average pore diameter, determined
60
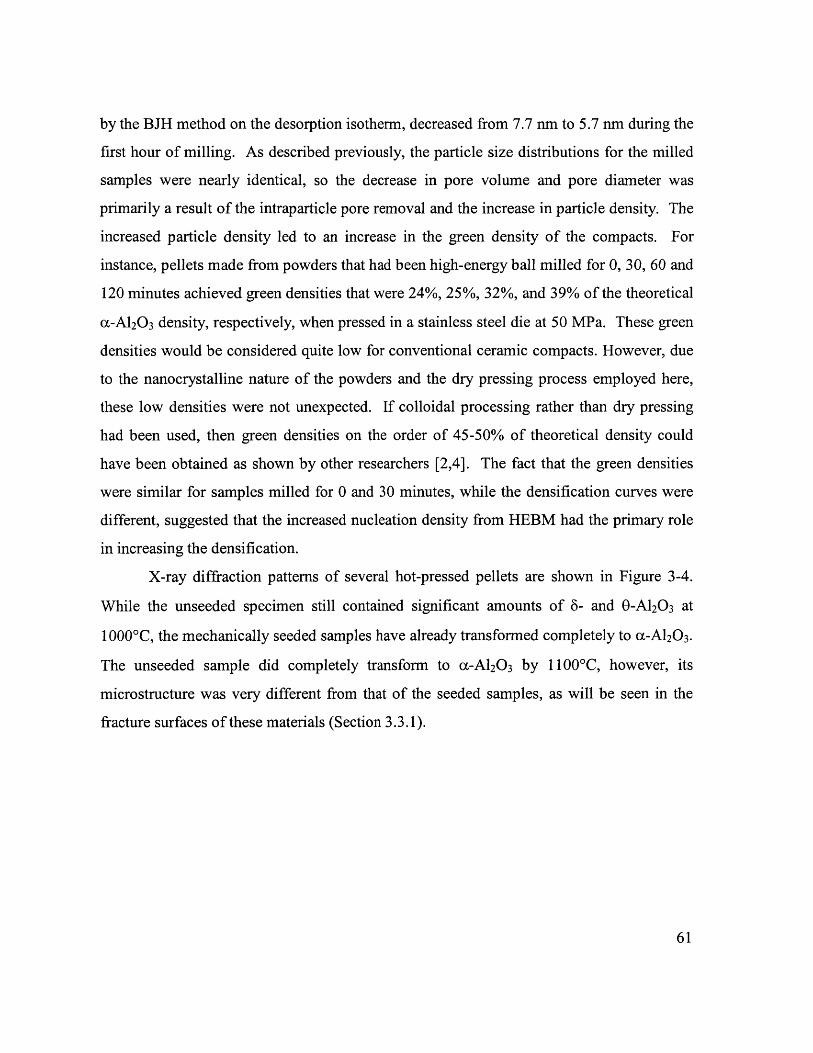
by the BJH method on the desorption isotherm, decreased from 7.7 nm to 5.7 nm during the
first hour of milling. As described previously, the particle size distributions for the milled
samples were nearly identical, so the decrease in pore volume and pore diameter was
primarily a result of the intraparticle pore removal and the increase in particle density. The
increased particle density led to an increase in the green density of the compacts. For
instance, pellets made from powders that had been high-energy ball milled for 0, 30, 60 and
120 minutes achieved green densities that were 24%, 25%, 32%, and 39% of the theoretical
a-A120 3 density, respectively, when pressed in a stainless steel die at 50 MPa. These green
densities would be considered quite low for conventional ceramic compacts. However, due
to the nanocrystalline nature of the powders and the dry pressing process employed here,
these low densities were not unexpected. If colloidal processing rather than dry pressing
had been used, then green densities on the order of 45-50% of theoretical density could
have been obtained as shown by other researchers [2,4]. The fact that the green densities
were similar for samples milled for 0 and 30 minutes, while the densification curves were
different, suggested that the increased nucleation density from HEBM had the primary role
in increasing the densification.
X-ray diffraction patterns of several hot-pressed pellets are shown in Figure 3-4.
While the unseeded specimen still contained significant amounts of 8- and 0-A120 3 at
I 0000 C, the mechanically seeded samples have already transformed completely to a-A12 0 3.
The unseeded sample did completely transform to a-A120 3 by 1 1000 C, however, its
microstructure was very different from that of the seeded samples, as will be seen in the
fracture surfaces of these materials (Section 3.3.1).
61
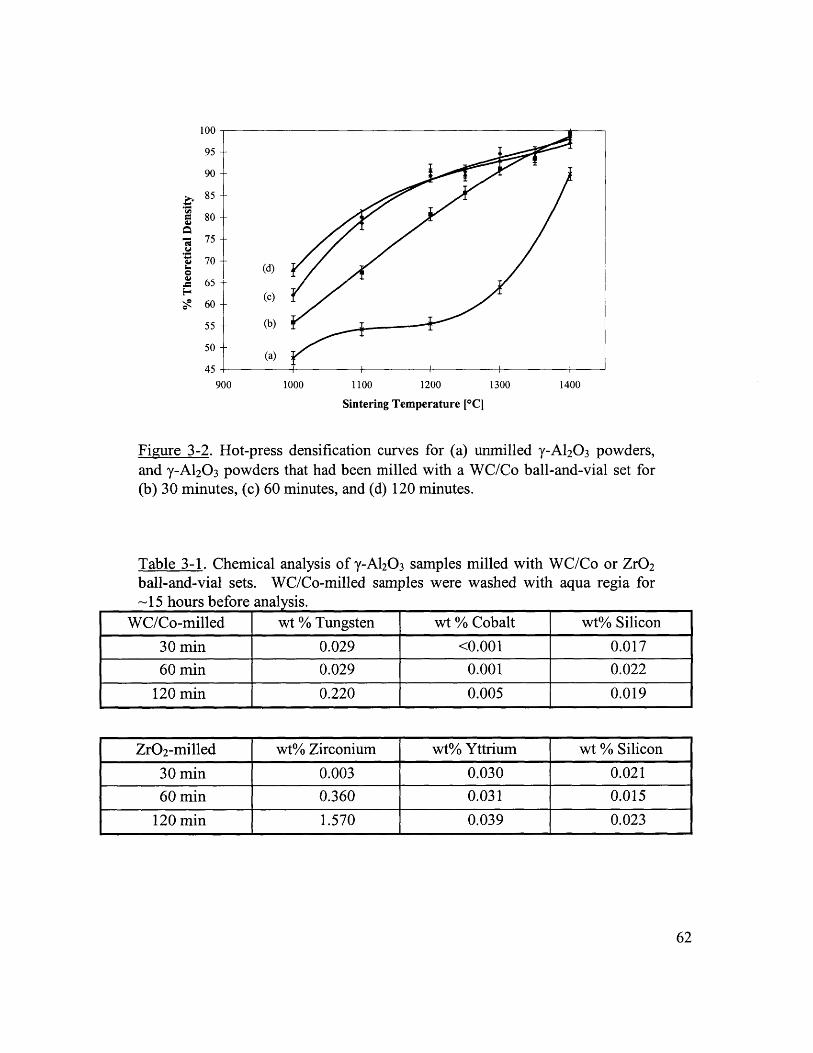
0
100
95
90
85
80
75
70
60
55
50
45
900 1000 1100 1200 1300 1400
Sintering Temperature [*C1
Figure 3-2. Hot-press densification curves for (a) unmilled y-A120 3 powders,and y-A120 3 powders that had been milled with a WC/Co ball-and-vial set for(b) 30 minutes, (c) 60 minutes, and (d) 120 minutes.
Table 3-1. Chemical analysis of y-AI20 3 samples milled with WC/Co or ZrO2ball-and-vial sets. WC/Co-milled samples were washed with aqua regia for-15 hours before analysis.
WC/Co-milled wt % Tungsten wt % Cobalt wt% Silicon
30 min 0.029 <0.001 0.017
60 min 0.029 0.001 0.022
120 min 0.220 0.005 0.019
ZrO2-milled wt% Zirconium wt% Yttrium wt % Silicon
30 min 0.003 0.030 0.021
60 min 0.360 0.031 0.015
120 min 1.570 0.039 0.023
62
(d)
(c)
(b)
-- (a)
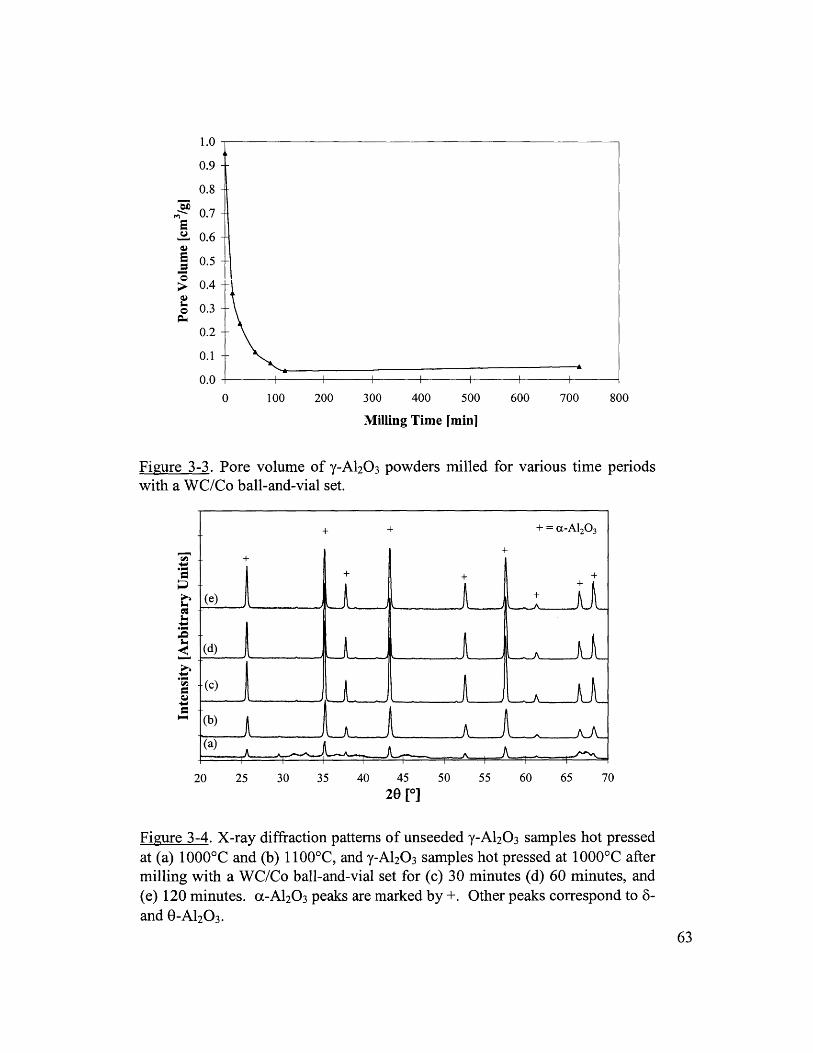
1.0
0.9 -
0.8 -
0.7 -
0.6 -
0.5
> 0.4--
o 0.3
0.2
0.1
0.0 -0 100 200 300 400 500 600 700 800
Milling Time [min]
Figure 3-3. Pore volume of y-A120 3 powders milled for various time periodswith a WC/Co ball-and-vial set.
+ + +c-10
__ ++
+ + ++
(e)+
(d)
(b)
(a)
20 25 30 35 40 45 50 55 60 65 70
20 [0]
Figure 3-4. X-ray diffraction patterns of unseeded y-A120 3 samples hot pressedat (a) 1 0000 C and (b) 11 000 C, and y-AI 20 3 samples hot pressed at 1 0000 C aftermilling with a WC/Co ball-and-vial set for (c) 30 minutes (d) 60 minutes, and(e) 120 minutes. a-Al20 3 peaks are marked by +. Other peaks correspond to 6-and 0-A120 3.
63
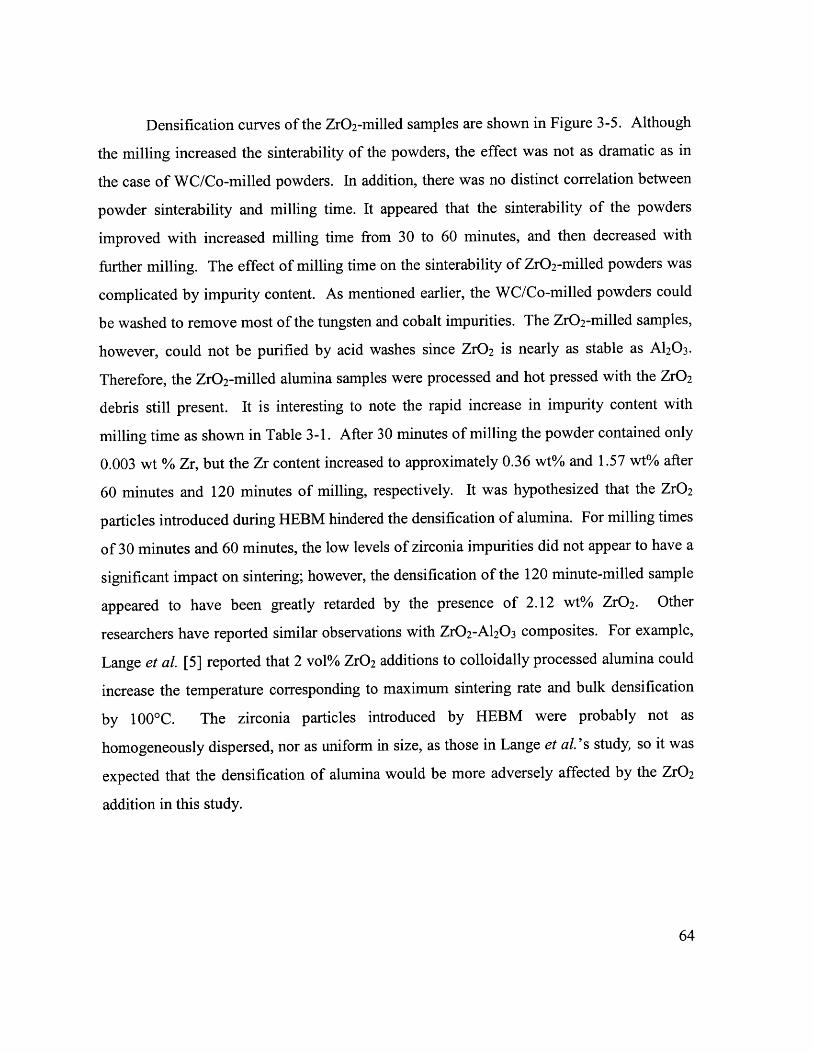
Densification curves of the ZrO2-milled samples are shown in Figure 3-5. Although
the milling increased the sinterability of the powders, the effect was not as dramatic as in
the case of WC/Co-milled powders. In addition, there was no distinct correlation between
powder sinterability and milling time. It appeared that the sinterability of the powders
improved with increased milling time from 30 to 60 minutes, and then decreased with
further milling. The effect of milling time on the sinterability of ZrO2-milled powders was
complicated by impurity content. As mentioned earlier, the WC/Co-milled powders could
be washed to remove most of the tungsten and cobalt impurities. The ZrO 2-milled samples,
however, could not be purified by acid washes since ZrO 2 is nearly as stable as A120 3.
Therefore, the ZrO2-milled alumina samples were processed and hot pressed with the ZrO2
debris still present. It is interesting to note the rapid increase in impurity content with
milling time as shown in Table 3-1. After 30 minutes of milling the powder contained only
0.003 wt % Zr, but the Zr content increased to approximately 0.36 wt% and 1.57 wt% after
60 minutes and 120 minutes of milling, respectively. It was hypothesized that the ZrO2
particles introduced during HEBM hindered the densification of alumina. For milling times
of 30 minutes and 60 minutes, the low levels of zirconia impurities did not appear to have a
significant impact on sintering; however, the densification of the 120 minute-milled sample
appeared to have been greatly retarded by the presence of 2.12 wt% ZrO 2. Other
researchers have reported similar observations with ZrO2-AI20 3 composites. For example,
Lange et al. [5] reported that 2 vol% ZrO2 additions to colloidally processed alumina could
increase the temperature corresponding to maximum sintering rate and bulk densification
by 1 000 C. The zirconia particles introduced by HEBM were probably not as
homogeneously dispersed, nor as uniform in size, as those in Lange et al.'s study, so it was
expected that the densification of alumina would be more adversely affected by the ZrO2
addition in this study.
64
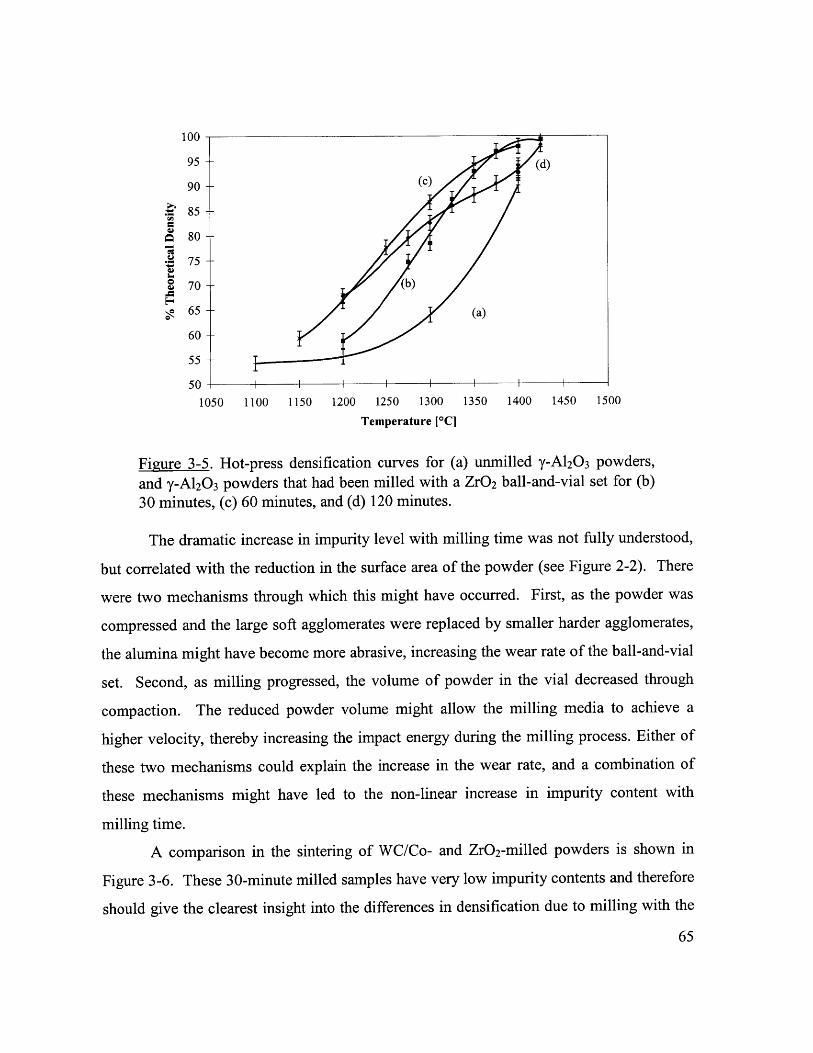
100
95 -(d)
90 (C)
. 85
$ 80
- 75
70 (b)
65 (a)
60
55
50 I I I I I I I
1050 1100 1150 1200 1250 1300 1350 1400 1450 1500
Temperature [*C]
Figure 3-5. Hot-press densification curves for (a) unmilled y-A120 3 powders,and y-A120 3 powders that had been milled with a ZrO2 ball-and-vial set for (b)30 minutes, (c) 60 minutes, and (d) 120 minutes.
The dramatic increase in impurity level with milling time was not fully understood,
but correlated with the reduction in the surface area of the powder (see Figure 2-2). There
were two mechanisms through which this might have occurred. First, as the powder was
compressed and the large soft agglomerates were replaced by smaller harder agglomerates,
the alumina might have become more abrasive, increasing the wear rate of the ball-and-vial
set. Second, as milling progressed, the volume of powder in the vial decreased through
compaction. The reduced powder volume might allow the milling media to achieve a
higher velocity, thereby increasing the impact energy during the milling process. Either of
these two mechanisms could explain the increase in the wear rate, and a combination of
these mechanisms might have led to the non-linear increase in impurity content with
milling time.
A comparison in the sintering of WC/Co- and ZrO2-milled powders is shown in
Figure 3-6. These 30-minute milled samples have very low impurity contents and therefore
should give the clearest insight into the differences in densification due to milling with the
65
two media. While both mechanically seeded samples densified better than the unmilled
sample, the WC/Co-milled powder began sintering at lower temperatures than the ZrO2-
milled sample. This is somewhat surprising given that the decreases in the transformation
temperatures and surface areas of the powders milled in the two media were fairly similar,
as discussed in Section 2.3.2. The source of the different sintering behaviors was not clear,
but might have to do with differences in the post-milling processing of the samples, or
might be attributed to the density difference between the milling media. It was possible that
the acid washing step, which both the unseeded and WC/Co-milled powders underwent,
reduced the agglomerate size or strength allowing for improved powder packing. The large
difference in the density of the milling media might also have affected the agglomerate
strength, agglomerate density, and particle packing in the green compact, leading to
different sinterabilities for the WC/Co-milled and ZrO2-milled materials.
100 -
95
90
85
80 (b)
1 75
70
65
/ 60
557
50
45
1000 1050 1100 1150 1200 1250 1300 1350 1400
Sintering Temperature [*C]
Figure 3-6. Hot-press densification curves for (a) unmilled y-A120 3 powders,and y-A120 3 powders that had been milled for 30 minutes with (b) WC/Co or(c) ZrO2 ball-and-vial sets.
66
3.3 Microstructure
As expected from the results of other researchers on externally seeded alumina
systems [6,7], the microstructure of the mechanically seeded alumina specimens was
considerably different from that of the unseeded alumina. Fracture surfaces, as well as
polished and etched surfaces, of the WC/Co-milled samples were used to investigate and
quantify the differences in microstructure associated with milling time and hot-pressing
temperature.
3.3.1 Fracture Surfaces
A JEOL 6320FV field emission gun scanning electron microscope was used to
examine sample fracture surfaces that had been coated with -60 A of a Au-Pd alloy to
prevent charging. Representative micrographs of the samples are shown in Figure 3-7. It
was clear from these images that mechanical seeding had a significant effect on the
microstructural development of A12 0 3. The unseeded material displayed the characteristic
vermicular structure observed in conventionally processed y-A120 3 powders, whereas the
mechanically seeded materials showed a very different, dense particle morphology, even
when hot pressed at low temperatures.
There might be two mechanisms through which the dense particle morphology
improved the densification. During the early stages of heat treatment (-950'C), the seeded
y-A120 3 underwent transformation to the oc-A120 3 phase with the associated -11 vol%
shrinkage. With the high nucleation density, however, the individual transformed volumes
were kept small and discrete so that grains with low connectivity could rearrange under the
applied load, thereby increasing sample density. During the final stages of hot pressing, this
discrete, dense particle morphology promoted densification because the residual porosity
was between the grains, and could be easily removed via grain boundary diffusion. In
contrast, the vermicular structure of the unseeded y-A120 3 greatly hindered densification
due to trapping of pores within the grains.
67
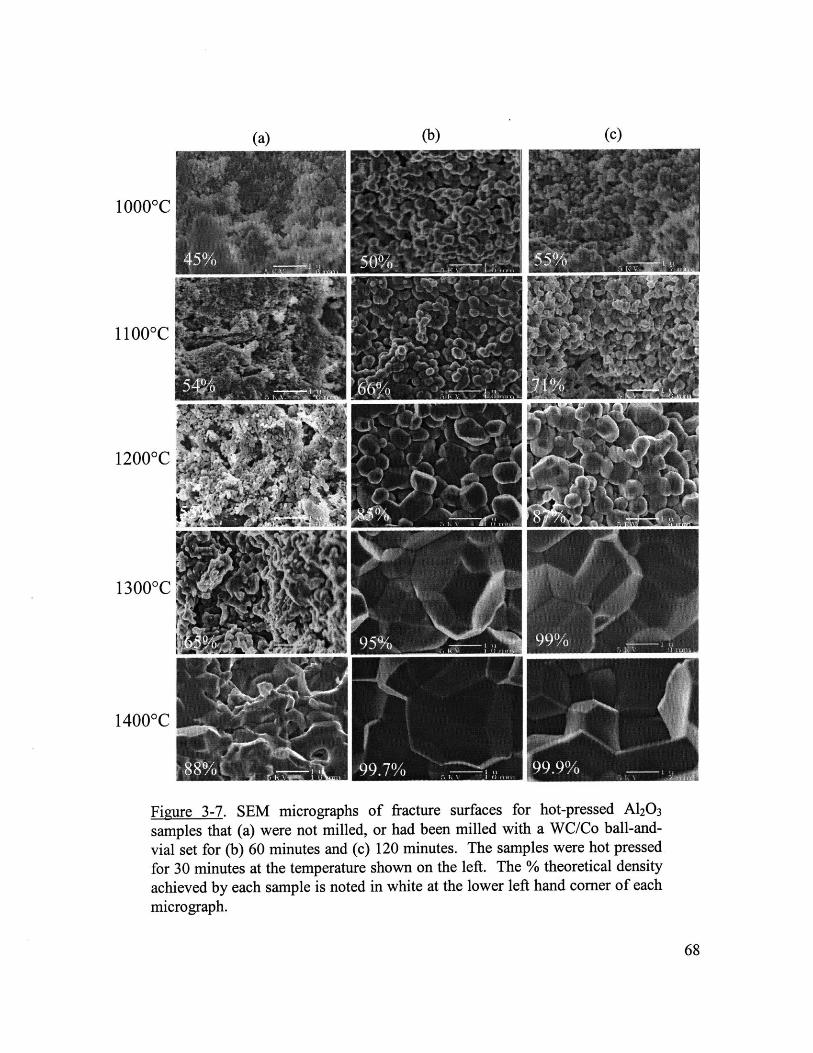
(b)
10000C
14000C
Figure 3-7. SEM micrographs of fracture surfaces for hot-pressed A120 3
samples that (a) were not milled, or had been milled with a WC/Co ball-and-
vial set for (b) 60 minutes and (c) 120 minutes. The samples were hot pressed
for 30 minutes at the temperature shown on the left. The % theoretical density
achieved by each sample is noted in white at the lower left hand corner of each
micrograph.
68
(c)(a)
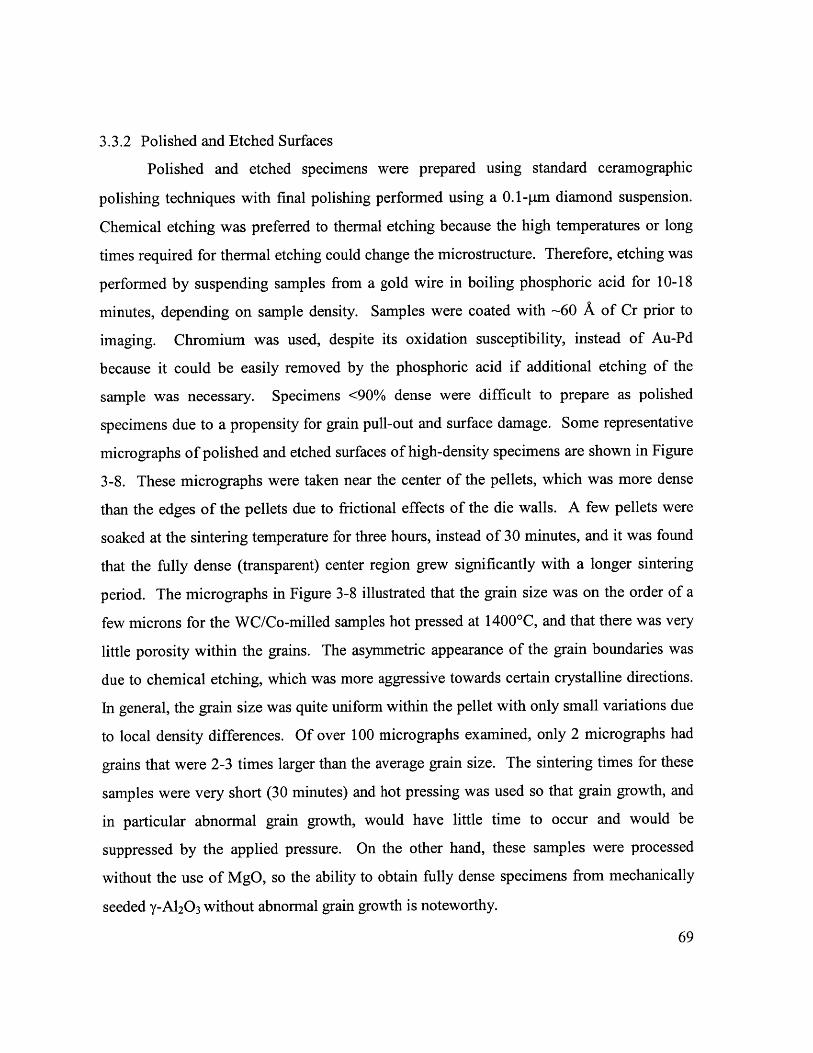
3.3.2 Polished and Etched Surfaces
Polished and etched specimens were prepared using standard ceramographic
polishing techniques with final polishing performed using a 0.1-pm diamond suspension.
Chemical etching was preferred to thermal etching because the high temperatures or long
times required for thermal etching could change the microstructure. Therefore, etching was
performed by suspending samples from a gold wire in boiling phosphoric acid for 10-18
minutes, depending on sample density. Samples were coated with ~60 A of Cr prior to
imaging. Chromium was used, despite its oxidation susceptibility, instead of Au-Pd
because it could be easily removed by the phosphoric acid if additional etching of the
sample was necessary. Specimens <90% dense were difficult to prepare as polished
specimens due to a propensity for grain pull-out and surface damage. Some representative
micrographs of polished and etched surfaces of high-density specimens are shown in Figure
3-8. These micrographs were taken near the center of the pellets, which was more dense
than the edges of the pellets due to frictional effects of the die walls. A few pellets were
soaked at the sintering temperature for three hours, instead of 30 minutes, and it was found
that the fully dense (transparent) center region grew significantly with a longer sintering
period. The micrographs in Figure 3-8 illustrated that the grain size was on the order of a
few microns for the WC/Co-milled samples hot pressed at 1400'C, and that there was very
little porosity within the grains. The asymmetric appearance of the grain boundaries was
due to chemical etching, which was more aggressive towards certain crystalline directions.
In general, the grain size was quite uniform within the pellet with only small variations due
to local density differences. Of over 100 micrographs examined, only 2 micrographs had
grains that were 2-3 times larger than the average grain size. The sintering times for these
samples were very short (30 minutes) and hot pressing was used so that grain growth, and
in particular abnormal grain growth, would have little time to occur and would be
suppressed by the applied pressure. On the other hand, these samples were processed
without the use of MgO, so the ability to obtain fully dense specimens from mechanically
seeded y-A12 03 without abnormal grain growth is noteworthy.
69
Figure 3-8. SEM micrographs of polished and chemically etched pellets after
hot pressing at 1400*C for 30 minutes. Samples were prepared from y-A1203powders that had been milled with a WC/Co ball-and-vial set for (a) 30 minutes
and (b) 120 minutes.
3.3.3 Grain Growth
In order to fully characterize this system, it is important to understand the effect of
mechanical seeding on the average grain size in the sintered pellets. Toward this end, the
lineal intercept method was applied to analyze the polished and etched surfaces of WC/Co-
milled specimens that had been sintered to 90% of theoretical density. More than 500
grain intercepts were measured for each sample from micrographs that had been taken at
random locations on the cross-sectional surface. The effect of porosity was taken into
account by using the modified lineal intercept method of Wurst and Nelson [8]. Grain sizes
of samples that were <90% dense were estimated from fracture surfaces. The average grain
size as a function of % theoretical density was plotted in Figure 3-9. The mechanically
seeded alumina underwent dramatic grain growth as the density exceeded 90%, which is
common for many systems. Based on the transformation temperature studies of this thesis
and the results of Messing and Huling [9], it would be logical to expect that as the milling
time increased, the seed density would increase, and the average grain size would therefore
decrease. This effect was apparent at low densities (i.e. immediately after the y-to-a phase
transformation), as shown by the decreasing grain size with increased milling time, but as
densification continued this trend was obscured. During the final stages of densification
70
(i.e. after >90% of theoretical density has been achieved) the grain sizes of the samples
became very similar, except for one outlying point. The coalescence of these trajectories
was believed to be a result of the use of hot pressing, which would tend to limit grain
growth. The samples that were milled for 30 minutes and 60 minutes have nearly the same
grain growth trajectory, while the 120-minute milled sample grew rapidly at the highest
sintering temperature, producing the outlying point, which might have to do with the high
tungsten impurity level. As shown in Table 3-1, the tungsten impurity concentrations in the
30-minute and 60-minute milled samples were similar, but the 120-minute milled sample
has -8 times as much tungsten. It is possible that tungsten enhanced grain growth at high
sintering temperatures, which would explain the large increase in grain size for the 120-
minute milled sample. The effect of tungsten on grain growth as a function of temperature
might be a topic for further investigation.
71
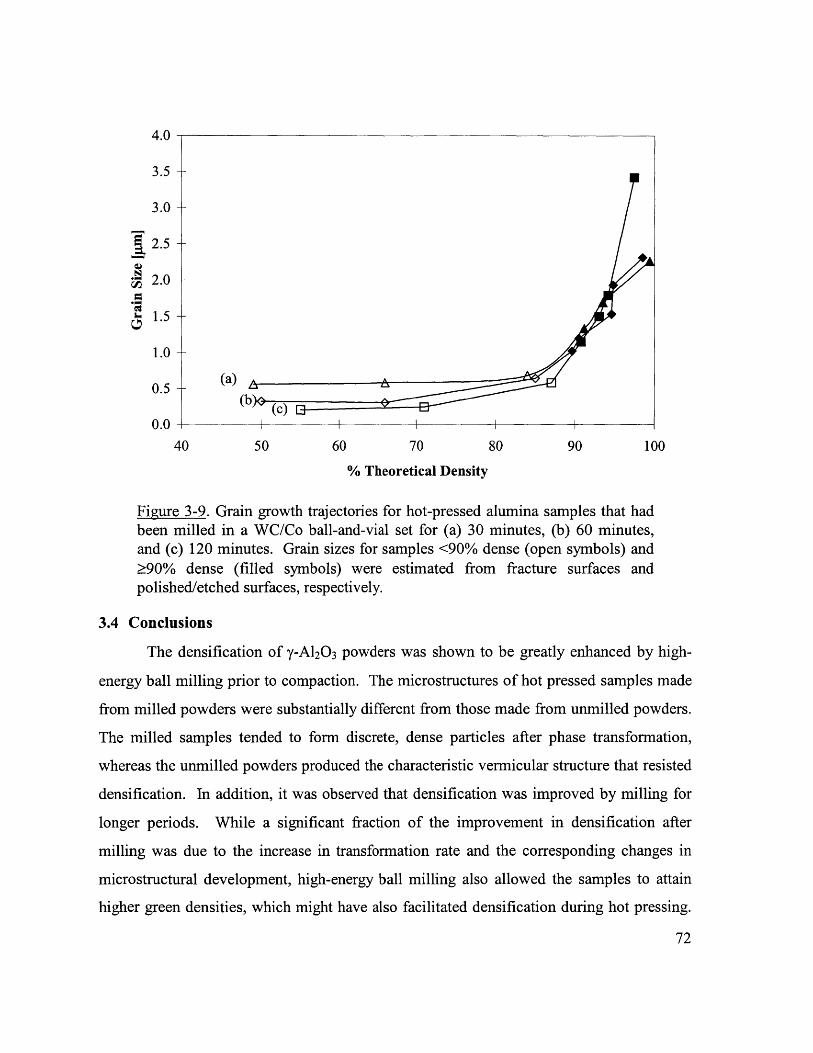
4.0
3.5
3.0
2.5
t2.0
1.5 -U
1.0
0.5 (a)
0.0 I |
40 50 60 70 80 90 100
% Theoretical Density
Figure 3-9. Grain growth trajectories for hot-pressed alumina samples that hadbeen milled in a WC/Co ball-and-vial set for (a) 30 minutes, (b) 60 minutes,and (c) 120 minutes. Grain sizes for samples <90% dense (open symbols) and90% dense (filled symbols) were estimated from fracture surfaces and
polished/etched surfaces, respectively.
3.4 Conclusions
The densification of y-A120 3 powders was shown to be greatly enhanced by high-
energy ball milling prior to compaction. The microstructures of hot pressed samples made
from milled powders were substantially different from those made from unmilled powders.
The milled samples tended to form discrete, dense particles after phase transformation,
whereas the unmilled powders produced the characteristic vermicular structure that resisted
densification. In addition, it was observed that densification was improved by milling for
longer periods. While a significant fraction of the improvement in densification after
milling was due to the increase in transformation rate and the corresponding changes in
microstructural development, high-energy ball milling also allowed the samples to attain
higher green densities, which might have also facilitated densification during hot pressing.
72
Finally, analysis of the mechanically seeded samples that were hot pressed to >90% of
theoretical density showed very similar grain sizes, which might be attributed to the use of
pressure-assisted densification. The various mechanically seeded alumina compacts were
successfully hot pressed to full density without abnormal grain growth and without the need
of MgO sintering additives.
3.5 References
[1] Handbook of Chemistry and Physics, 7 0th Edition, p. D-130. CRC Press, Inc., Boca
Raton, FL, 1990.
[2] M. Kumagai and G. L. Messing, "Enhanced Densification of Boehmite Sol-Gels by
x-Alumina Seeding," J Am. Ceram. Soc., 67 [11] C230-31 (1984).
[3] R. A. Shelleman, G. L. Messing, and M. Kumagai, "Alpha Alumina Transformation
in Seeded Boehmite Gels," J. Non-Cryst. Solids, 82, 277-85 (1986).
[4] M. Kumagai and G. L. Messing, "Controlled Transformation and Sintering of a
Boehmite Sol-Gel by ax-Alumina Seeding," J. Am. Ceram. Soc., 68 [9] 500-05
(1985).
[5] F. F. Lange, T. Yamaguchi, B. I. Davis, and P. E. D. Morgan, "Effect of ZrO2
Inclusions on the Sinterability of A12 0 3," J Am. Ceram. Soc., 71 [6] 446-48 (1998).
[6] J. McArdle and G. Messing, "Transformation, Microstructure Development, and
Densification in x-Fe 2O3-Seeded Boehmite-Derived Alumina," J. Am. Ceram. Soc.,
76 [1] 214-22 (1993).
[7] K. Hirao, M. Ohashi, M. E. Brito, and S. Kanzaki, "Processing Strategy for
Producing Highly Anistropic Silicon Nitride," J. Am. Ceram. Soc., 78 [6] 1687-90
(1995).
[8] J. C. Wurst and J. A. Nelson, "Lineal Intercept Technique for Measuring Grain Size
in Two-Phase Polycrystalline Ceramics," J. Am. Ceram. Soc., 55 [2] 109 (1972).
[9] G. L. Messing and J. C. Huling, "Transformation, Microstructure Development and
Sintering in Nucleated Alumina Gels"; pp. 669-79 in Processing of Ceramics,
73

Proceedings of the 3rd European Ceramic Society Conference, Vol. 1. Edited by P.
Duran and J. F. Fernandez. Faenze Editrice Iberica S.L., 1993.
74
4. Synthesis of Nanocrystalline Aluminum Nitride
AIN powders to be used in advanced ceramics applications should have a small
particle size to facilitate densification, a low oxygen content to maximize thermal
conductivity, and low impurity levels to keep dielectric losses to a minimum.
Commercially available powders typically contain 1-3 wt% oxygen and have an average
particle size of 1-4 microns. The commercial AlN substrates are generally produced with
yttria (Y20 3) and/or other oxide additives totaling 2-9 wt% to facilitate densification and to
scavenge oxygen from the AlN grains. As beneficial as the sintering aids are to the
densification and oxygen removal, the residual secondary phase from the incorporation of
sintering aids can reduce the thermal conductivity of AlN by 10-15%. In theory,
nanocrystalline AlN powders should densify at significantly lower temperatures than
commercial microcrystalline powders, so that sintering additives would not be necessary.
The first goal of this project, therefore, was to create and optimize a process for producing
nanocrystalline AlN powders. This chapter describes the synthesis of nanocrystalline AlN
and the physical and chemical properties of this powder.
4.1 Reactor Design and Modifications
The equipment used to produce the nanocrystalline AlN was a forced-flow reactor.
A schematic of the reactor, which was designed and built by D. T. Castro [1] of our
laboratory, is shown in Figure 4-1. The forced-flow reactor is a low-pressure reactor (1-30
mbar), which allows the production of high-purity and high surface area metal and metal
nitride particles. The reactor can be divided into four zones. The first zone, to the left in
Figure 4-1, is the evaporation chamber. In this area, a resistively heated graphite crucible is
used to evaporate the metal. Gases metered in by mass flow controllers (MFC) flow past
the crucible, quenching the metal or metal nitride vapors and capturing the particles. The
gas stream then carries the particles into the second zone, which consists of a quartz tube
within which a 2.45 GHz, 1000 W microwave plasma can be generated. The microwave
plasma is used to atomize nitrogen molecules in the gas stream and reheat the particles to
promote nitridation. This design of separate evaporation and reaction zones is important
75
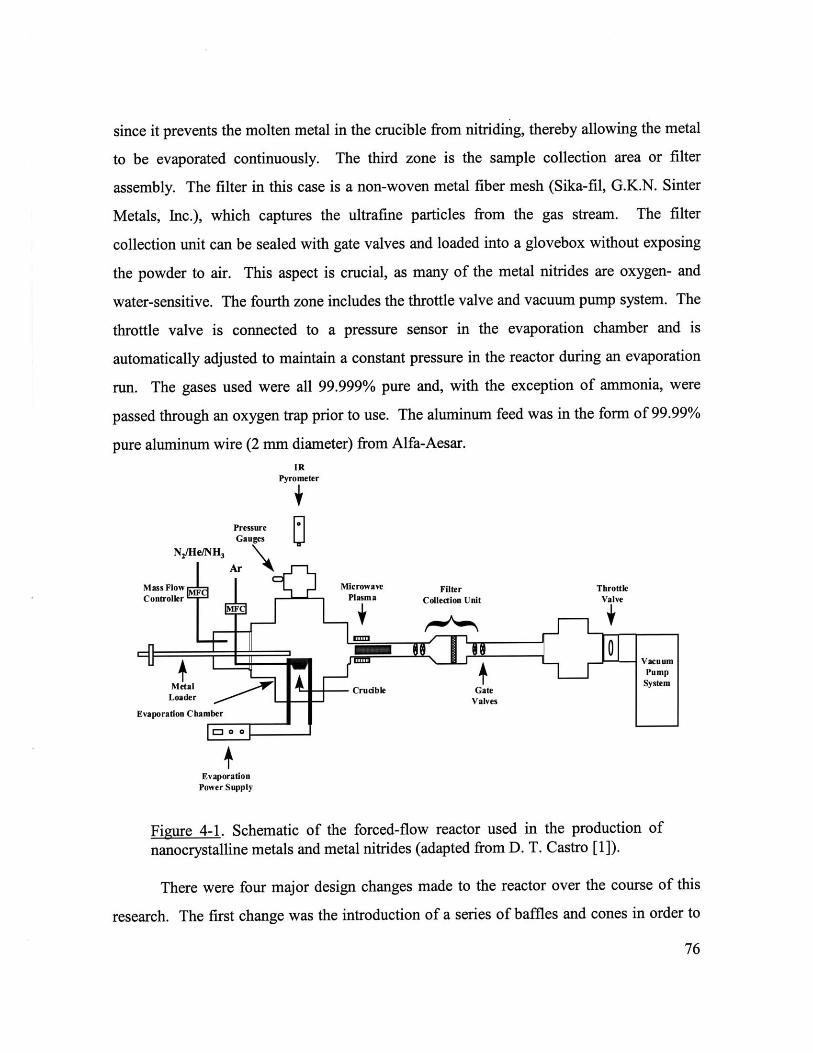
since it prevents the molten metal in the crucible from nitriding, thereby allowing the metal
to be evaporated continuously. The third zone is the sample collection area or filter
assembly. The filter in this case is a non-woven metal fiber mesh (Sika-fil, G.K.N. Sinter
Metals, Inc.), which captures the ultrafine particles from the gas stream. The filter
collection unit can be sealed with gate valves and loaded into a glovebox without exposing
the powder to air. This aspect is crucial, as many of the metal nitrides are oxygen- and
water-sensitive. The fourth zone includes the throttle valve and vacuum pump system. The
throttle valve is connected to a pressure sensor in the evaporation chamber and is
automatically adjusted to maintain a constant pressure in the reactor during an evaporation
run. The gases used were all 99.999% pure and, with the exception of ammonia, were
passed through an oxygen trap prior to use. The aluminum feed was in the form of 99.99%
pure aluminum wire (2 mm diameter) from Alfa-Aesar.IR
Pyrometer
PressureGauges
N2/He/NH 3
LAirMass Flow Microwave Filter ThrottleController Plasma Collection Unit Valve
+L~Vacuum
Metal Crucible Gatve System
Evaporation Chamber
C-3 0 0
Evaporation
Power Supply
Figure 4-1. Schematic of the forced-flow reactor used in the production of
nanocrystalline metals and metal nitrides (adapted from D. T. Castro [1]).
There were four major design changes made to the reactor over the course of this
research. The first change was the introduction of a series of baffles and cones in order to
76
M
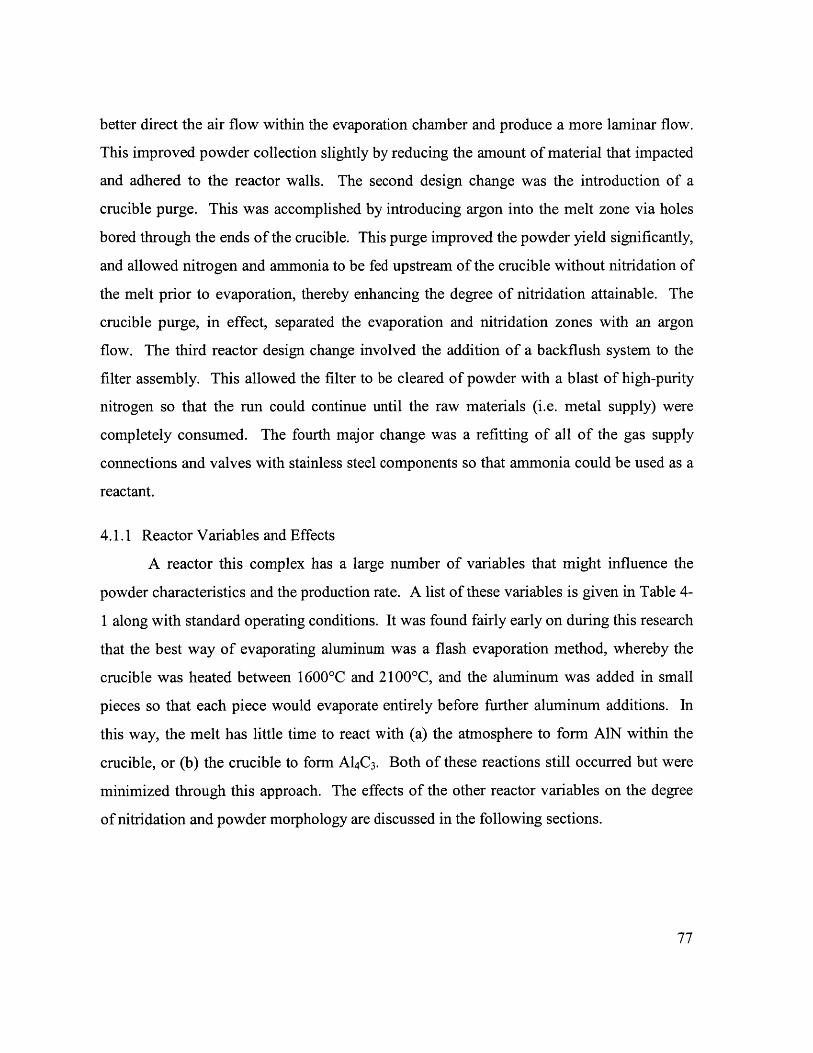
better direct the air flow within the evaporation chamber and produce a more laminar flow.
This improved powder collection slightly by reducing the amount of material that impacted
and adhered to the reactor walls. The second design change was the introduction of a
crucible purge. This was accomplished by introducing argon into the melt zone via holes
bored through the ends of the crucible. This purge improved the powder yield significantly,
and allowed nitrogen and ammonia to be fed upstream of the crucible without nitridation of
the melt prior to evaporation, thereby enhancing the degree of nitridation attainable. The
crucible purge, in effect, separated the evaporation and nitridation zones with an argon
flow. The third reactor design change involved the addition of a backflush system to the
filter assembly. This allowed the filter to be cleared of powder with a blast of high-purity
nitrogen so that the run could continue until the raw materials (i.e. metal supply) were
completely consumed. The fourth major change was a refitting of all of the gas supply
connections and valves with stainless steel components so that ammonia could be used as a
reactant.
4.1.1 Reactor Variables and Effects
A reactor this complex has a large number of variables that might influence the
powder characteristics and the production rate. A list of these variables is given in Table 4-
1 along with standard operating conditions. It was found fairly early on during this research
that the best way of evaporating aluminum was a flash evaporation method, whereby the
crucible was heated between 1600*C and 2100'C, and the aluminum was added in small
pieces so that each piece would evaporate entirely before further aluminum additions. In
this way, the melt has little time to react with (a) the atmosphere to form AIN within the
crucible, or (b) the crucible to form A14C3. Both of these reactions still occurred but were
minimized through this approach. The effects of the other reactor variables on the degree
of nitridation and powder morphology are discussed in the following sections.
77
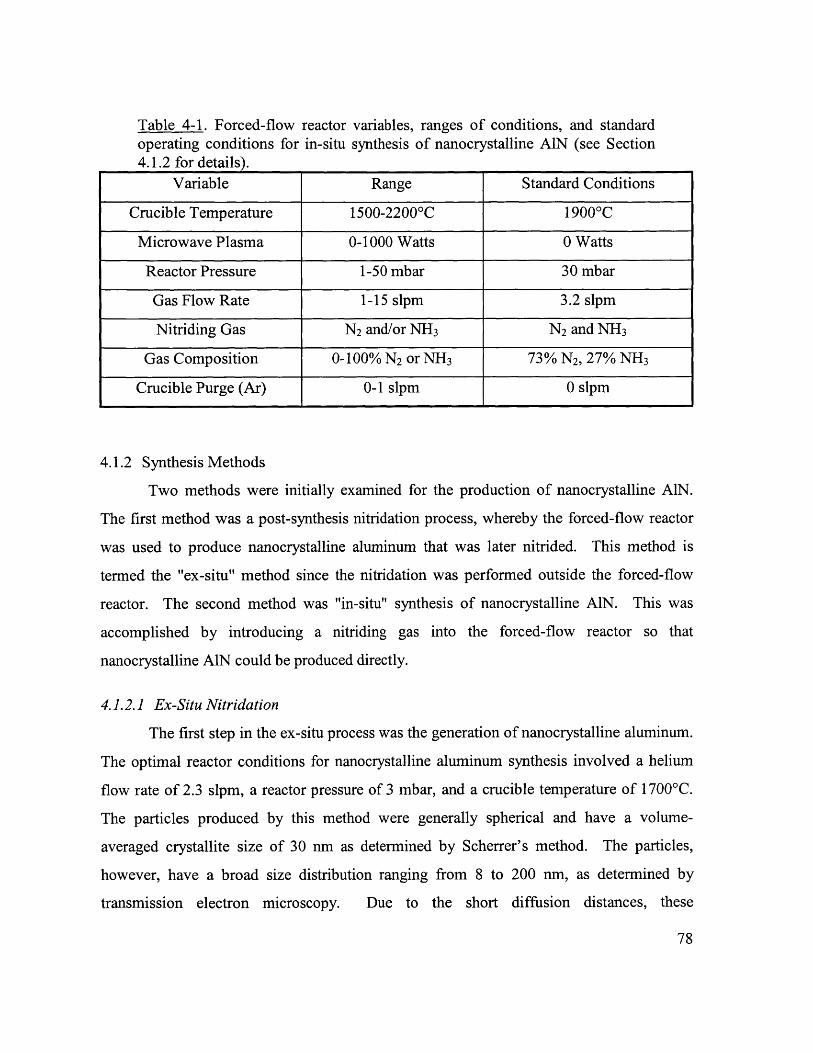
Table 4-1. Forced-flow reactor variables, ranges of conditions, and standardoperating conditions for in-situ synthesis of nanocrystalline AIN (see Section4.1.2 for details).
Variable Range Standard Conditions
Crucible Temperature 1500-2200 0C 1900 0C
Microwave Plasma 0-1000 Watts 0 Watts
Reactor Pressure 1-50 mbar 30 mbar
Gas Flow Rate 1-15 slpm 3.2 slpm
Nitriding Gas N2 and/or NH3 N2 and NH3
Gas Composition 0-100% N2 or NH3 73% N2, 27% NH 3
Crucible Purge (Ar) 0-1 slpm 0 slpm
4.1.2 Synthesis Methods
Two methods were initially examined for the production of nanocrystalline AlN.
The first method was a post-synthesis nitridation process, whereby the forced-flow reactor
was used to produce nanocrystalline aluminum that was later nitrided. This method is
termed the "ex-situ" method since the nitridation was performed outside the forced-flow
reactor. The second method was "in-situ" synthesis of nanocrystalline AlN. This was
accomplished by introducing a nitriding gas into the forced-flow reactor so that
nanocrystalline AlN could be produced directly.
4.1.2.1 Ex-Situ Nitridation
The first step in the ex-situ process was the generation of nanocrystalline aluminum.
The optimal reactor conditions for nanocrystalline aluminum synthesis involved a helium
flow rate of 2.3 slpm, a reactor pressure of 3 mbar, and a crucible temperature of 1700'C.
The particles produced by this method were generally spherical and have a volume-
averaged crystallite size of 30 nm as determined by Scherrer's method. The particles,
however, have a broad size distribution ranging from 8 to 200 nm, as determined by
transmission electron microscopy. Due to the short diffusion distances, these
78
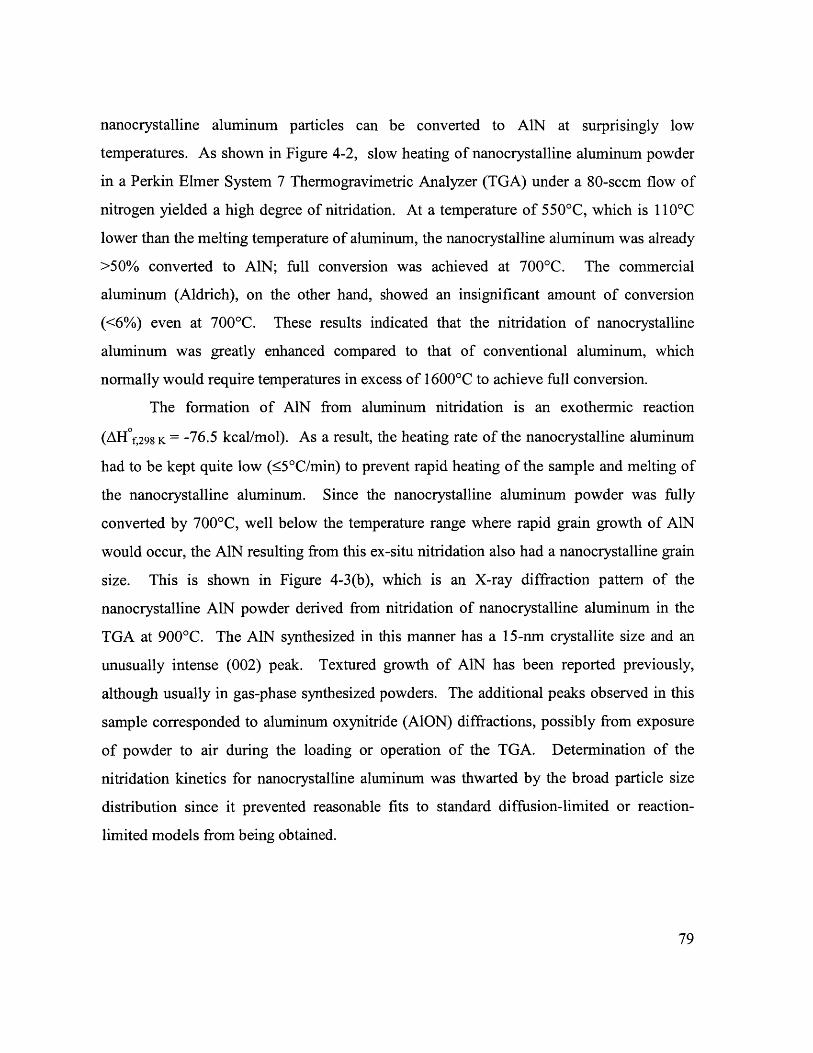
nanocrystalline aluminum particles can be converted to AIN at surprisingly low
temperatures. As shown in Figure 4-2, slow heating of nanocrystalline aluminum powder
in a Perkin Elmer System 7 Thermogravimetric Analyzer (TGA) under a 80-scem flow of
nitrogen yielded a high degree of nitridation. At a temperature of 550 C, which is 1 10 C
lower than the melting temperature of aluminum, the nanocrystalline aluminum was already
>50% converted to AlN; full conversion was achieved at 700'C. The commercial
aluminum (Aldrich), on the other hand, showed an insignificant amount of conversion
(<6%) even at 700'C. These results indicated that the nitridation of nanocrystalline
aluminum was greatly enhanced compared to that of conventional aluminum, which
normally would require temperatures in excess of 1600'C to achieve full conversion.
The formation of AlN from aluminum nitridation is an exothermic reaction
(AHof,298 K = -76.5 kcal/mol). As a result, the heating rate of the nanocrystalline aluminum
had to be kept quite low ( ;5 0C/min) to prevent rapid heating of the sample and melting of
the nanocrystalline aluminum. Since the nanocrystalline aluminum powder was fully
converted by 700'C, well below the temperature range where rapid grain growth of AlN
would occur, the AlN resulting from this ex-situ nitridation also had a nanocrystalline grain
size. This is shown in Figure 4-3(b), which is an X-ray diffraction pattern of the
nanocrystalline AlN powder derived from nitridation of nanocrystalline aluminum in the
TGA at 900'C. The AlN synthesized in this manner has a 15-nm crystallite size and an
unusually intense (002) peak. Textured growth of AlN has been reported previously,
although usually in gas-phase synthesized powders. The additional peaks observed in this
sample corresponded to aluminum oxynitride (AlON) diffractions, possibly from exposure
of powder to air during the loading or operation of the TGA. Determination of the
nitridation kinetics for nanocrystalline aluminum was thwarted by the broad particle size
distribution since it prevented reasonable fits to standard diffusion-limited or reaction-
limited models from being obtained.
79
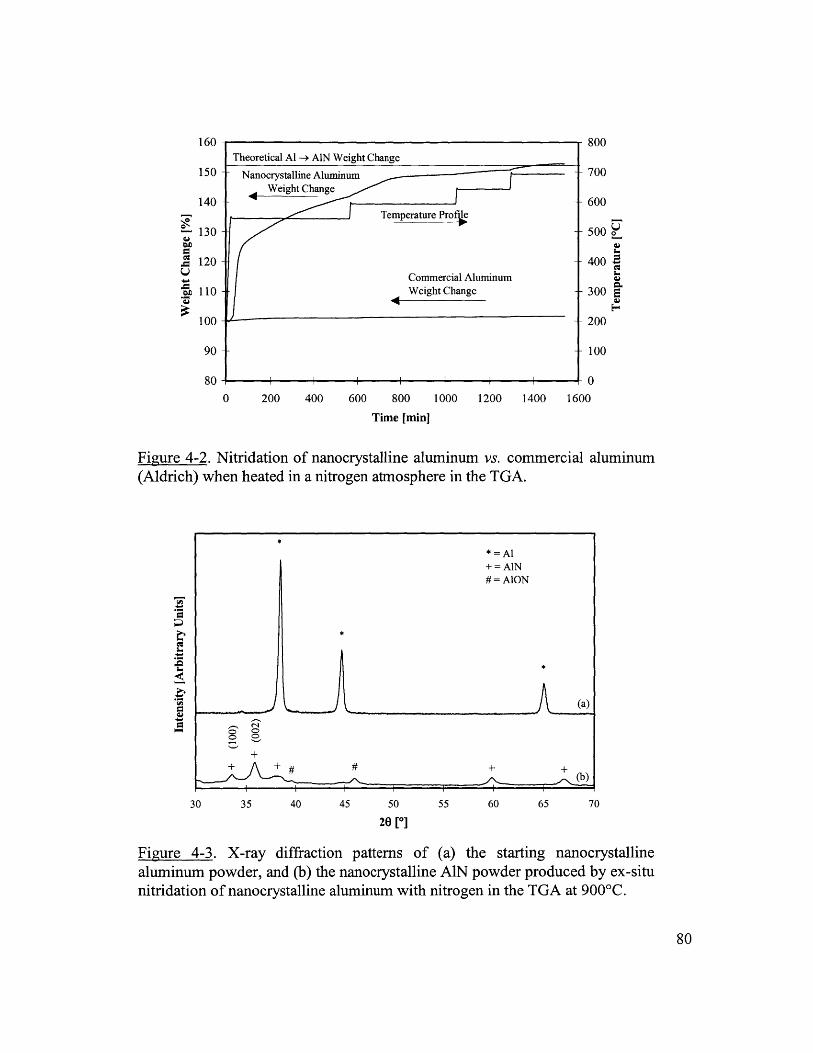
160 -
150 -
140
130 -
120 -
110 -
100-
90 +
80
0 200 400 600 800 1000 1200 1400
Time [min]
- 800
700
600
500 o
400
300
200
100
01600
Figure 4-2. Nitridation of nanocrystalline aluminum vs. commercial aluminum(Aldrich) when heated in a nitrogen atmosphere in the TGA.
I-
30 35 40 45 50
20 [0]
55 60 65 70
Figure 4-3. X-ray diffraction patterns of (a) the starting nanocrystallinealuminum powder, and (b) the nanocrystalline AlN powder produced by ex-situnitridation of nanocrystalline aluminum with nitrogen in the TGA at 900'C.
80
Theoretical Al -4 AIN Weight Change
Nanocrystalline AluminumC
Weight Change
Temperature Profe
Commercial AluminumWeight Change
*=Al+ = AIN#= AlON
*
(a)
+ +##+ +(b
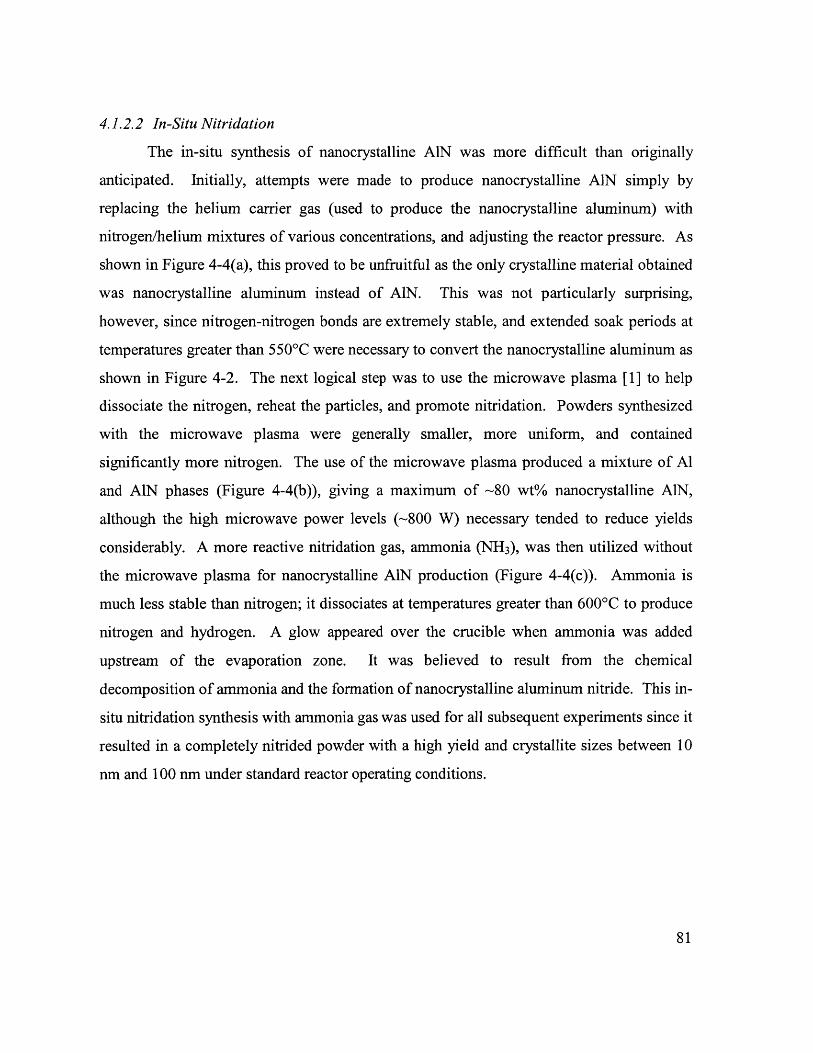
4.1.2.2 In-Situ Nitridation
The in-situ synthesis of nanocrystalline AIN was more difficult than originally
anticipated. Initially, attempts were made to produce nanocrystalline AIN simply by
replacing the helium carrier gas (used to produce the nanocrystalline aluminum) with
nitrogen/helium mixtures of various concentrations, and adjusting the reactor pressure. As
shown in Figure 4-4(a), this proved to be unfruitful as the only crystalline material obtained
was nanocrystalline aluminum instead of AlN. This was not particularly surprising,
however, since nitrogen-nitrogen bonds are extremely stable, and extended soak periods at
temperatures greater than 550'C were necessary to convert the nanocrystalline aluminum as
shown in Figure 4-2. The next logical step was to use the microwave plasma [1] to help
dissociate the nitrogen, reheat the particles, and promote nitridation. Powders synthesized
with the microwave plasma were generally smaller, more uniform, and contained
significantly more nitrogen. The use of the microwave plasma produced a mixture of Al
and AlN phases (Figure 4-4(b)), giving a maximum of -80 wt% nanocrystalline AlN,
although the high microwave power levels (~800 W) necessary tended to reduce yields
considerably. A more reactive nitridation gas, ammonia (NH3), was then utilized without
the microwave plasma for nanocrystalline AlN production (Figure 4-4(c)). Ammonia is
much less stable than nitrogen; it dissociates at temperatures greater than 600'C to produce
nitrogen and hydrogen. A glow appeared over the crucible when ammonia was added
upstream of the evaporation zone. It was believed to result from the chemical
decomposition of ammonia and the formation of nanocrystalline aluminum nitride. This in-
situ nitridation synthesis with ammonia gas was used for all subsequent experiments since it
resulted in a completely nitrided powder with a high yield and crystallite sizes between 10
nm and 100 nm under standard reactor operating conditions.
81
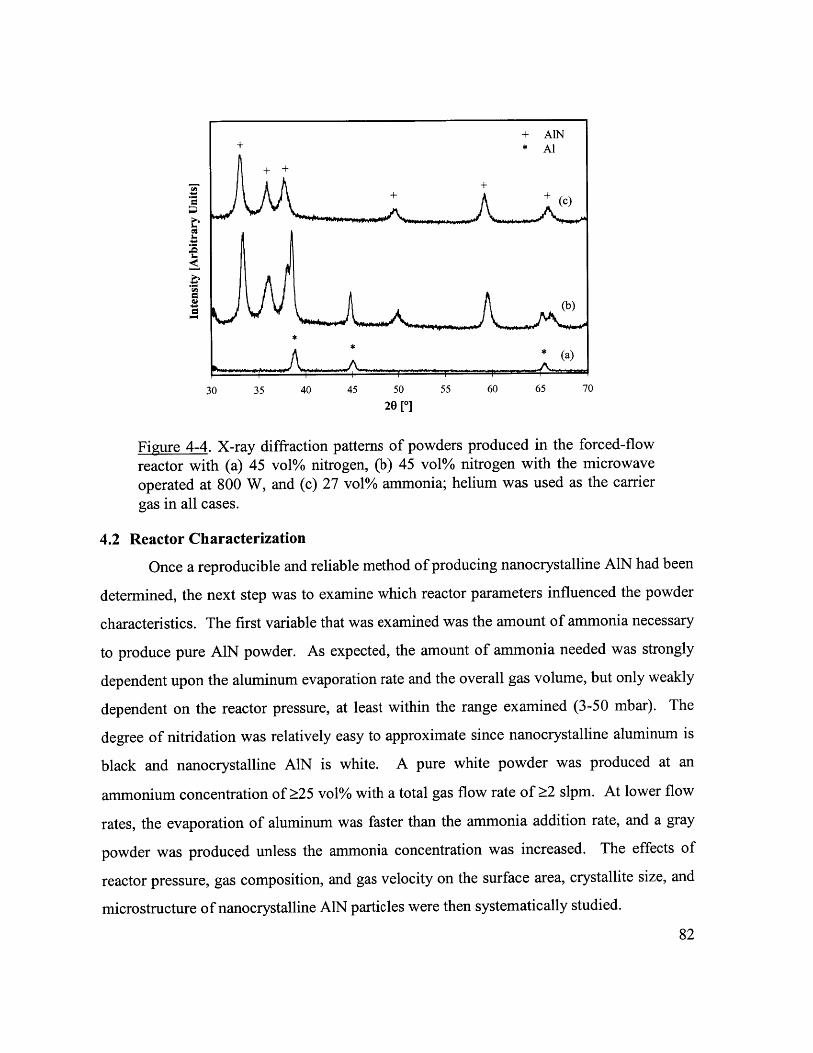
+ AlN* Al
++c
(b)
*
* (a)
30 35 40 45 50 55 60 65 70
20 [0]
Figure 4-4. X-ray diffraction patterns of powders produced in the forced-flowreactor with (a) 45 vol% nitrogen, (b) 45 vol% nitrogen with the microwaveoperated at 800 W, and (c) 27 vol% ammonia; helium was used as the carriergas in all cases.
4.2 Reactor Characterization
Once a reproducible and reliable method of producing nanocrystalline AlN had been
determined, the next step was to examine which reactor parameters influenced the powder
characteristics. The first variable that was examined was the amount of ammonia necessary
to produce pure AlN powder. As expected, the amount of ammonia needed was strongly
dependent upon the aluminum evaporation rate and the overall gas volume, but only weakly
dependent on the reactor pressure, at least within the range examined (3-50 mbar). The
degree of nitridation was relatively easy to approximate since nanocrystalline aluminum is
black and nanocrystalline AlN is white. A pure white powder was produced at an
ammonium concentration of 25 vol% with a total gas flow rate of 2 slpm. At lower flow
rates, the evaporation of aluminum was faster than the ammonia addition rate, and a gray
powder was produced unless the ammonia concentration was increased. The effects of
reactor pressure, gas composition, and gas velocity on the surface area, crystallite size, and
microstructure of nanocrystalline AlN particles were then systematically studied.
82
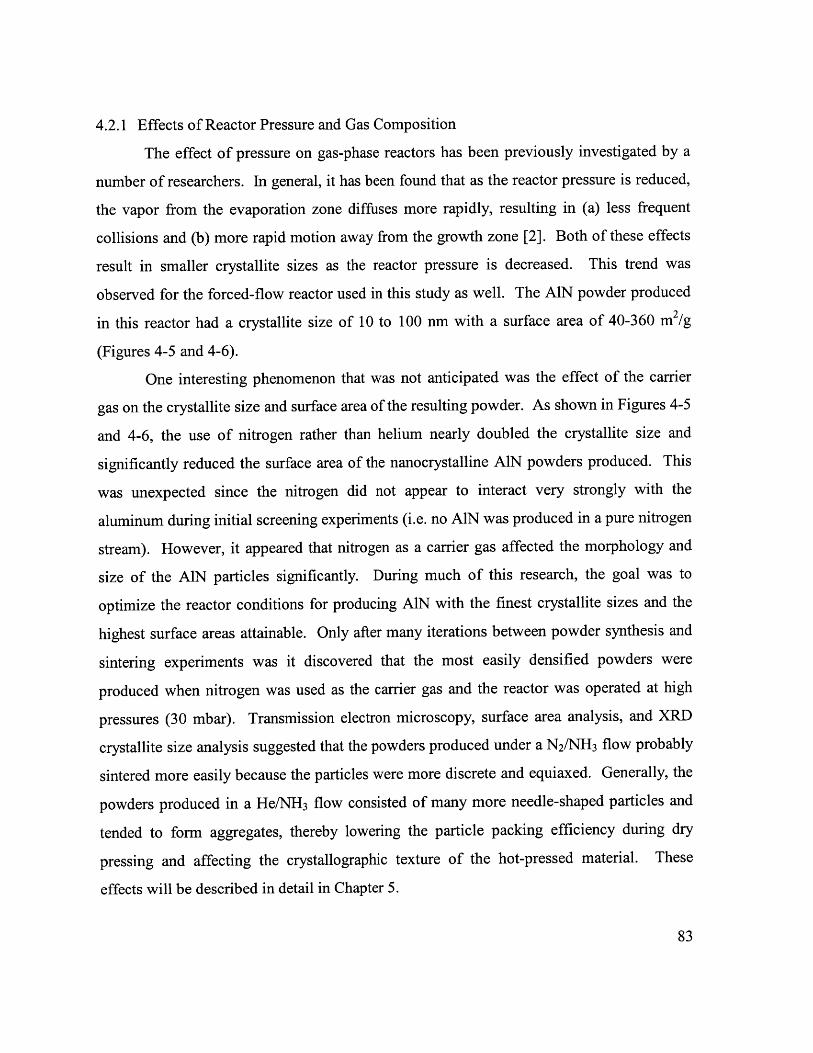
4.2.1 Effects of Reactor Pressure and Gas Composition
The effect of pressure on gas-phase reactors has been previously investigated by a
number of researchers. In general, it has been found that as the reactor pressure is reduced,
the vapor from the evaporation zone diffuses more rapidly, resulting in (a) less frequent
collisions and (b) more rapid motion away from the growth zone [2]. Both of these effects
result in smaller crystallite sizes as the reactor pressure is decreased. This trend was
observed for the forced-flow reactor used in this study as well. The AlN powder produced
in this reactor had a crystallite size of 10 to 100 nm with a surface area of 40-360 m2 /g
(Figures 4-5 and 4-6).
One interesting phenomenon that was not anticipated was the effect of the carrier
gas on the crystallite size and surface area of the resulting powder. As shown in Figures 4-5
and 4-6, the use of nitrogen rather than helium nearly doubled the crystallite size and
significantly reduced the surface area of the nanocrystalline AlN powders produced. This
was unexpected since the nitrogen did not appear to interact very strongly with the
aluminum during initial screening experiments (i.e. no AlN was produced in a pure nitrogen
stream). However, it appeared that nitrogen as a carrier gas affected the morphology and
size of the AlN particles significantly. During much of this research, the goal was to
optimize the reactor conditions for producing AlN with the finest crystallite sizes and the
highest surface areas attainable. Only after many iterations between powder synthesis and
sintering experiments was it discovered that the most easily densified powders were
produced when nitrogen was used as the carrier gas and the reactor was operated at high
pressures (30 mbar). Transmission electron microscopy, surface area analysis, and XRD
crystallite size analysis suggested that the powders produced under a N2/NH 3 flow probably
sintered more easily because the particles were more discrete and equiaxed. Generally, the
powders produced in a He/NH 3 flow consisted of many more needle-shaped particles and
tended to form aggregates, thereby lowering the particle packing efficiency during dry
pressing and affecting the crystallographic texture of the hot-pressed material. These
effects will be described in detail in Chapter 5.
83
CU
120 -
100-
80 --
60
40
20
00 5 10 15 20
Reactor Pressure [mbar]
25 30 35
Figure 4-5. Crystallite sizes of AIN produced at various reactor pressures with(a) helium and (b) nitrogen as the carrier gas. The variability in the data wasdue to differences in the gas velocity used (see Section 4.2.2), and the increasederror in Scherrer's analysis as the crystallite size approached 100 nm.
400
-a
350
300
250
200
150
100
50 +
0 i -
0 5 10 15 20 25 30 35
Reactor Pressure [mbar]
Figure 4-6. Surface areas of AlN produced at various reactor pressures with(a) helium and (b) nitrogen as the carrier gas. The variability in the data at agiven pressure was due to differences in the gas velocity used (see Section4.2.2).
84
(b)
(a)
.
(a)
(b)
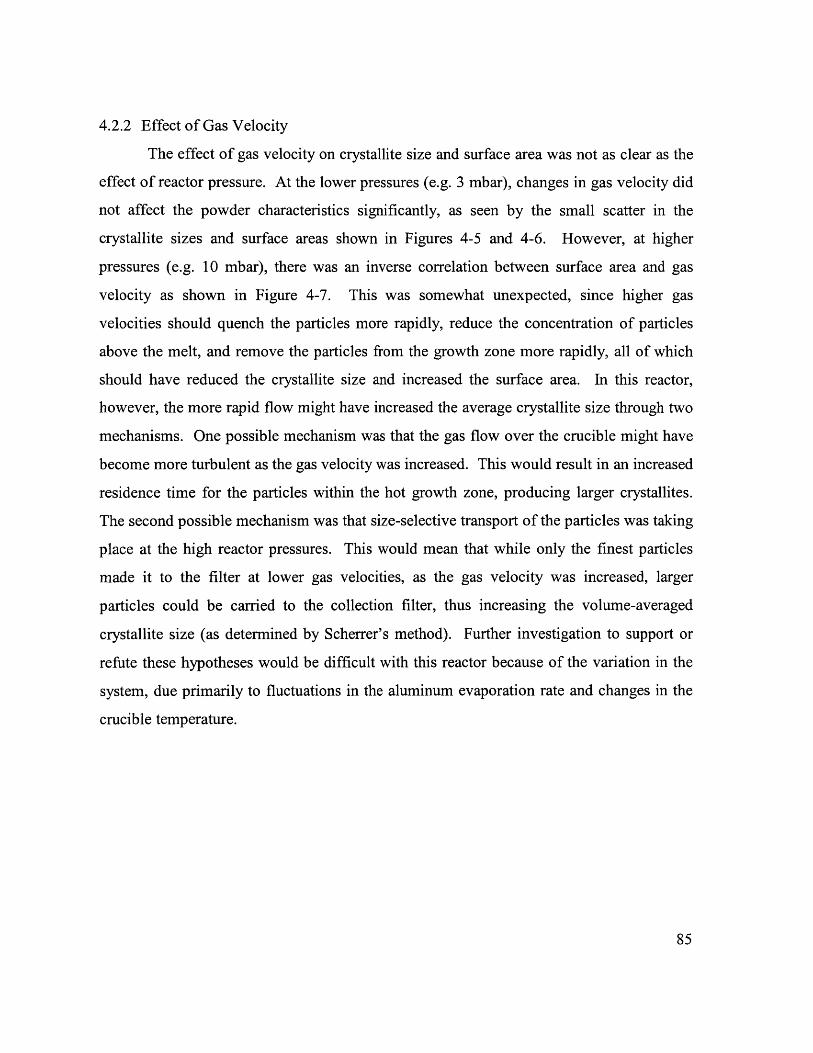
4.2.2 Effect of Gas Velocity
The effect of gas velocity on crystallite size and surface area was not as clear as the
effect of reactor pressure. At the lower pressures (e.g. 3 mbar), changes in gas velocity did
not affect the powder characteristics significantly, as seen by the small scatter in the
crystallite sizes and surface areas shown in Figures 4-5 and 4-6. However, at higher
pressures (e.g. 10 mbar), there was an inverse correlation between surface area and gas
velocity as shown in Figure 4-7. This was somewhat unexpected, since higher gas
velocities should quench the particles more rapidly, reduce the concentration of particles
above the melt, and remove the particles from the growth zone more rapidly, all of which
should have reduced the crystallite size and increased the surface area. In this reactor,
however, the more rapid flow might have increased the average crystallite size through two
mechanisms. One possible mechanism was that the gas flow over the crucible might have
become more turbulent as the gas velocity was increased. This would result in an increased
residence time for the particles within the hot growth zone, producing larger crystallites.
The second possible mechanism was that size-selective transport of the particles was taking
place at the high reactor pressures. This would mean that while only the finest particles
made it to the filter at lower gas velocities, as the gas velocity was increased, larger
particles could be carried to the collection filter, thus increasing the volume-averaged
crystallite size (as determined by Scherrer's method). Further investigation to support or
refute these hypotheses would be difficult with this reactor because of the variation in the
system, due primarily to fluctuations in the aluminum evaporation rate and changes in the
crucible temperature.
85
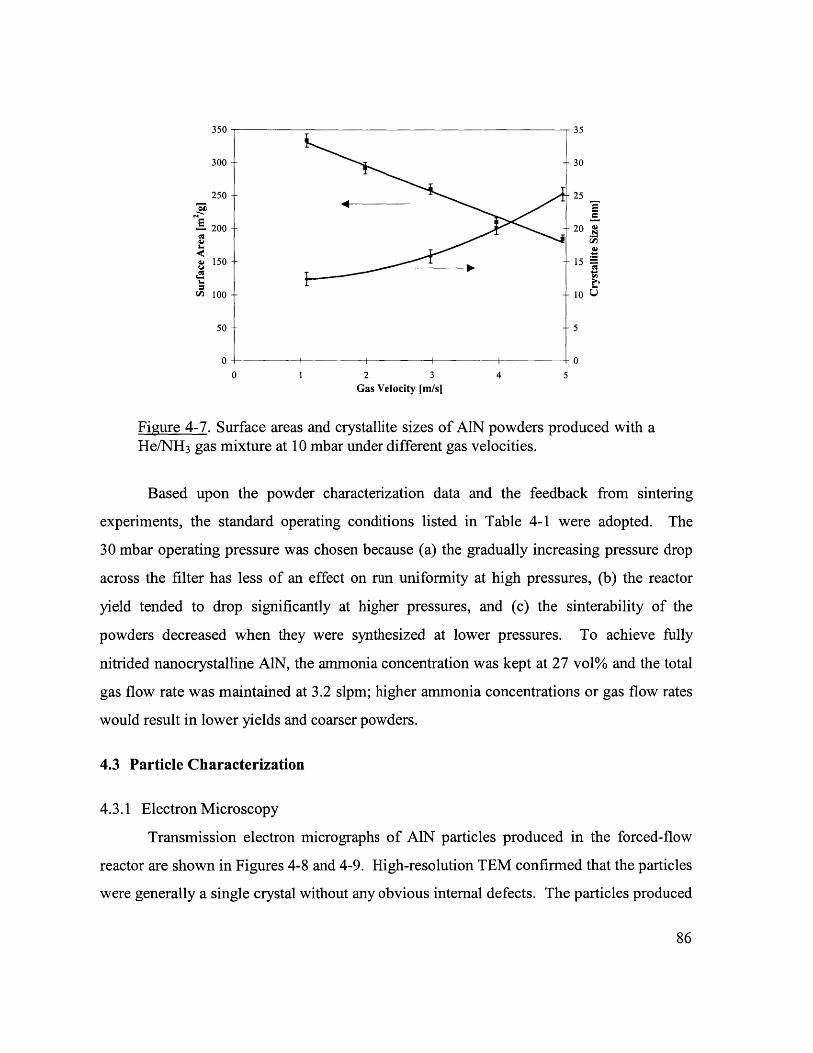
350 35
300 30
250 25
200 20 ~
150 15
100- 10 U
50 5
0 I I - 00 1 2 3 4 5
Gas Velocity [m/s]
Figure 4-7. Surface areas and crystallite sizes of AIN powders produced with aHe/NH 3 gas mixture at 10 mbar under different gas velocities.
Based upon the powder characterization data and the feedback from sintering
experiments, the standard operating conditions listed in Table 4-1 were adopted. The
30 mbar operating pressure was chosen because (a) the gradually increasing pressure drop
across the filter has less of an effect on run uniformity at high pressures, (b) the reactor
yield tended to drop significantly at higher pressures, and (c) the sinterability of the
powders decreased when they were synthesized at lower pressures. To achieve fully
nitrided nanocrystalline AIN, the ammonia concentration was kept at 27 vol% and the total
gas flow rate was maintained at 3.2 slpm; higher ammonia concentrations or gas flow rates
would result in lower yields and coarser powders.
4.3 Particle Characterization
4.3.1 Electron Microscopy
Transmission electron micrographs of AlN particles produced in the forced-flow
reactor are shown in Figures 4-8 and 4-9. High-resolution TEM confirmed that the particles
were generally a single crystal without any obvious internal defects. The particles produced
86
350 35
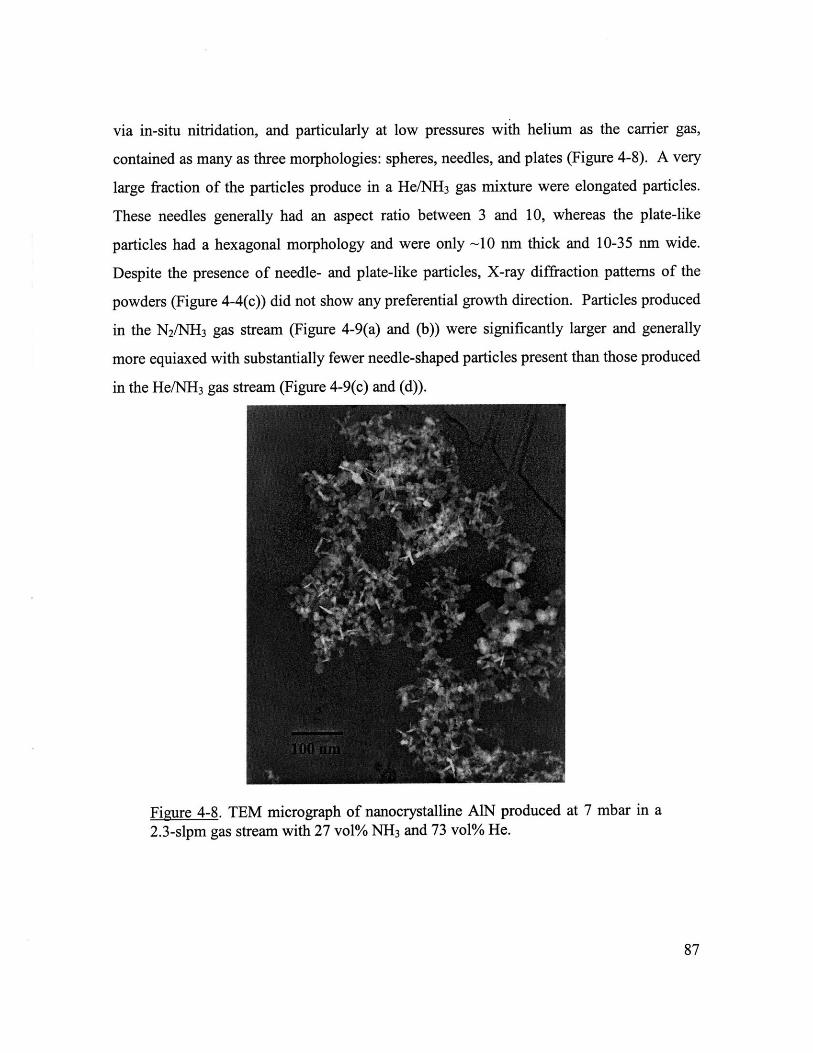
via in-situ nitridation, and particularly at low pressures with helium as the carrier gas,
contained as many as three morphologies: spheres, needles, and plates (Figure 4-8). A very
large fraction of the particles produce in a He/NH3 gas mixture were elongated particles.
These needles generally had an aspect ratio between 3 and 10, whereas the plate-like
particles had a hexagonal morphology and were only -10 nm thick and 10-35 nm wide.
Despite the presence of needle- and plate-like particles, X-ray diffraction patterns of the
powders (Figure 4-4(c)) did not show any preferential growth direction. Particles produced
in the N2/NH 3 gas stream (Figure 4-9(a) and (b)) were significantly larger and generally
more equiaxed with substantially fewer needle-shaped particles present than those produced
in the He/NH 3 gas stream (Figure 4-9(c) and (d)).
Figure 4-8. TEM micrograph of nanocrystalline AlN produced at 7 mbar in a
2.3-slpm gas stream with 27 vol% NH 3 and 73 vol% He.
87
Figure 4-9. Transmission electron micrographs of nanocrystalline AIN powders
synthesized in the forced-flow reactor via in-situ nitridation with NH 3. The
powders were produced with (a,b) nitrogen or (c,d) helium as the carrier gas.
The reactor pressure was 20 mbar for samples (a) and (c), and 30 mbar for
samples (b) and (d). The scale bar is 100 nm.
High-resolution TEM micrographs of nanocrystalline AlN powder (produced by in-
situ nitridation) and commercial AlN powder (Alfa Aesar) are shown in Figure 4-10. The
commercial AlN powder had a relatively thick amorphous surface layer (see arrows marked
in Figure 4-10(b)), which was probably AlOOH or A12 0 3 produced from exposure to the
atmosphere. The nanocrystalline AlN powder, however, did not have any visible surface
88
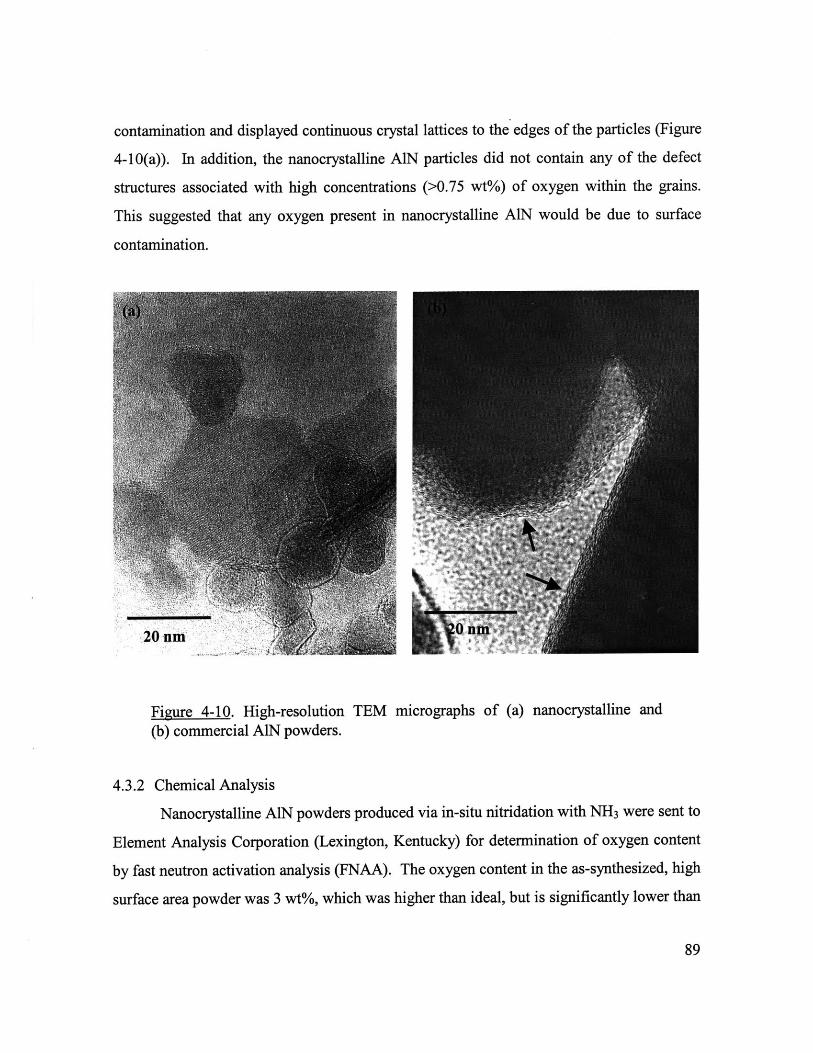
contamination and displayed continuous crystal lattices to the edges of the particles (Figure
4-10(a)). In addition, the nanocrystalline AIN particles did not contain any of the defect
structures associated with high concentrations (>0.75 wt%) of oxygen within the grains.
This suggested that any oxygen present in nanocrystalline AIN would be due to surface
contamination.
Figure 4-10. High-resolution TEM micrographs of (a) nanocrystalline and
(b) commercial AIN powders.
4.3.2 Chemical Analysis
Nanocrystalline AIN powders produced via in-situ nitridation with NH3 were sent to
Element Analysis Corporation (Lexington, Kentucky) for determination of oxygen content
by fast neutron activation analysis (FNAA). The oxygen content in the as-synthesized, high
surface area powder was 3 wt%, which was higher than ideal, but is significantly lower than
89
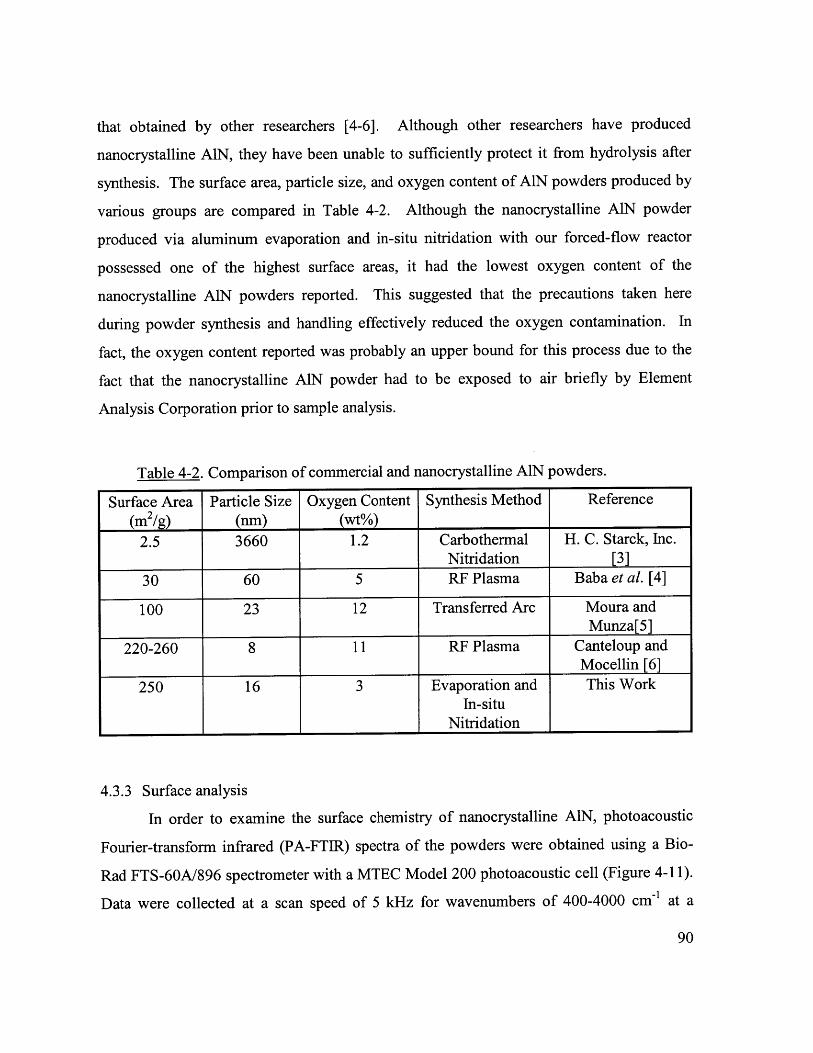
that obtained by other researchers [4-6]. Although other researchers have produced
nanocrystalline AIN, they have been unable to sufficiently protect it from hydrolysis after
synthesis. The surface area, particle size, and oxygen content of AlN powders produced by
various groups are compared in Table 4-2. Although the nanocrystalline AlN powder
produced via aluminum evaporation and in-situ nitridation with our forced-flow reactor
possessed one of the highest surface areas, it had the lowest oxygen content of the
nanocrystalline AlN powders reported. This suggested that the precautions taken here
during powder synthesis and handling effectively reduced the oxygen contamination. In
fact, the oxygen content reported was probably an upper bound for this process due to the
fact that the nanocrystalline AlN powder had to be exposed to air briefly by Element
Analysis Corporation prior to sample analysis.
Table 4-2. Comparison of commercial and nanocrystalline AlN powders.
Surface Area Particle Size Oxygen Content Synthesis Method Reference(m2@/g) (nm) (wt%)
2.5 3660 1.2 Carbothermal H. C. Starck, Inc.Nitridation [3]
30 60 5 RF Plasma Baba et al. [4]
100 23 12 Transferred Arc Moura andMunza[5]
220-260 8 11 RF Plasma Canteloup andMocellin [6]
250 16 3 Evaporation and This WorkIn-situ
Nitridation
4.3.3 Surface analysis
In order to examine the surface chemistry of nanocrystalline AlN, photoacoustic
Fourier-transform infrared (PA-FTIR) spectra of the powders were obtained using a Bio-
Rad FTS-60A/896 spectrometer with a MTEC Model 200 photoacoustic cell (Figure 4-11).
Data were collected at a scan speed of 5 kHz for wavenumbers of 400-4000 cm at a
90
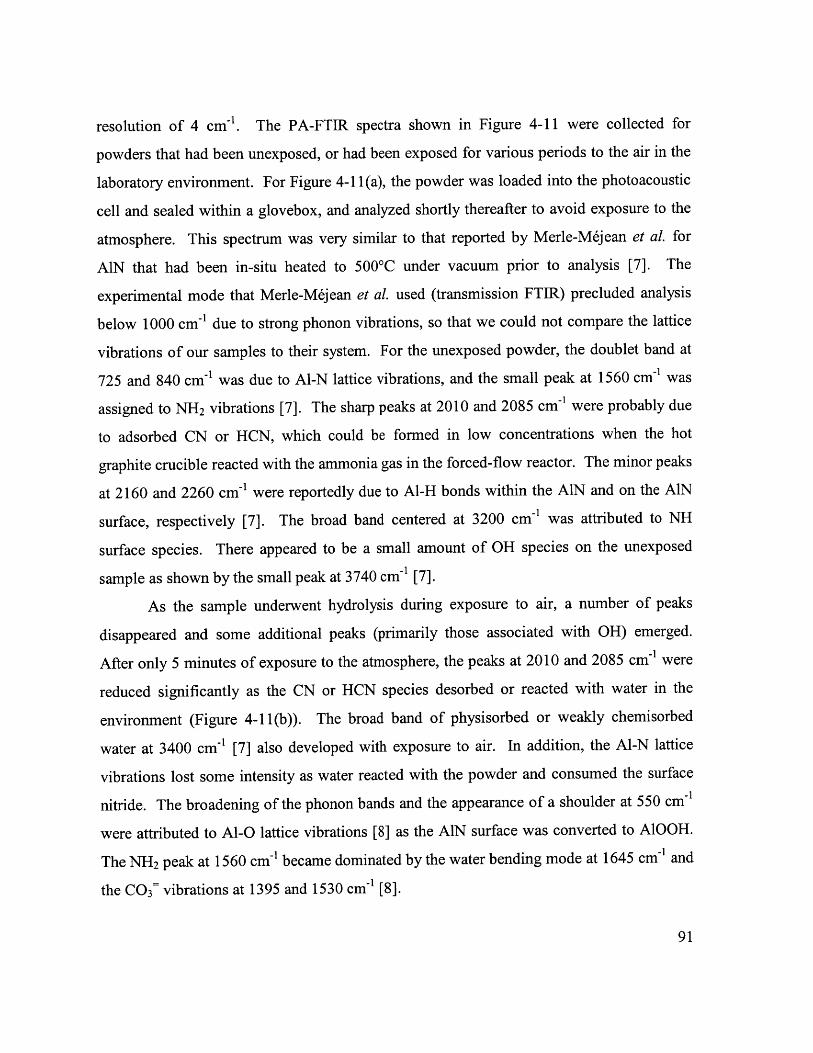
resolution of 4 cm'. The PA-FTIR spectra shown in Figure 4-11 were collected for
powders that had been unexposed, or had been exposed for various periods to the air in the
laboratory environment. For Figure 4-11(a), the powder was loaded into the photoacoustic
cell and sealed within a glovebox, and analyzed shortly thereafter to avoid exposure to the
atmosphere. This spectrum was very similar to that reported by Merle-Mejean et al. for
AIN that had been in-situ heated to 500'C under vacuum prior to analysis [7]. The
experimental mode that Merle-Mejean et al. used (transmission FTIR) precluded analysis
below 1000 cm-1 due to strong phonon vibrations, so that we could not compare the lattice
vibrations of our samples to their system. For the unexposed powder, the doublet band at
725 and 840 cm-1 was due to Al-N lattice vibrations, and the small peak at 1560 cm' was
assigned to NH2 vibrations [7]. The sharp peaks at 2010 and 2085 cm-1 were probably due
to adsorbed CN or HCN, which could be formed in low concentrations when the hot
graphite crucible reacted with the ammonia gas in the forced-flow reactor. The minor peaks
at 2160 and 2260 cm' were reportedly due to Al-H bonds within the AlN and on the AlN
surface, respectively [7]. The broad band centered at 3200 cm-1 was attributed to NH
surface species. There appeared to be a small amount of OH species on the unexposed
sample as shown by the small peak at 3740 cm-1 [7].
As the sample underwent hydrolysis during exposure to air, a number of peaks
disappeared and some additional peaks (primarily those associated with OH) emerged.
After only 5 minutes of exposure to the atmosphere, the peaks at 2010 and 2085 cm'1 were
reduced significantly as the CN or HCN species desorbed or reacted with water in the
environment (Figure 4-11(b)). The broad band of physisorbed or weakly chemisorbed
water at 3400 cm-1 [7] also developed with exposure to air. In addition, the Al-N lattice
vibrations lost some intensity as water reacted with the powder and consumed the surface
nitride. The broadening of the phonon bands and the appearance of a shoulder at 550 cm-1
were attributed to Al-O lattice vibrations [8] as the AlN surface was converted to AlOOH.
The NH2 peak at 1560 cm' became dominated by the water bending mode at 1645 cm41 and
the C0 3 vibrations at 1395 and 1530 cm 4I [8].
91
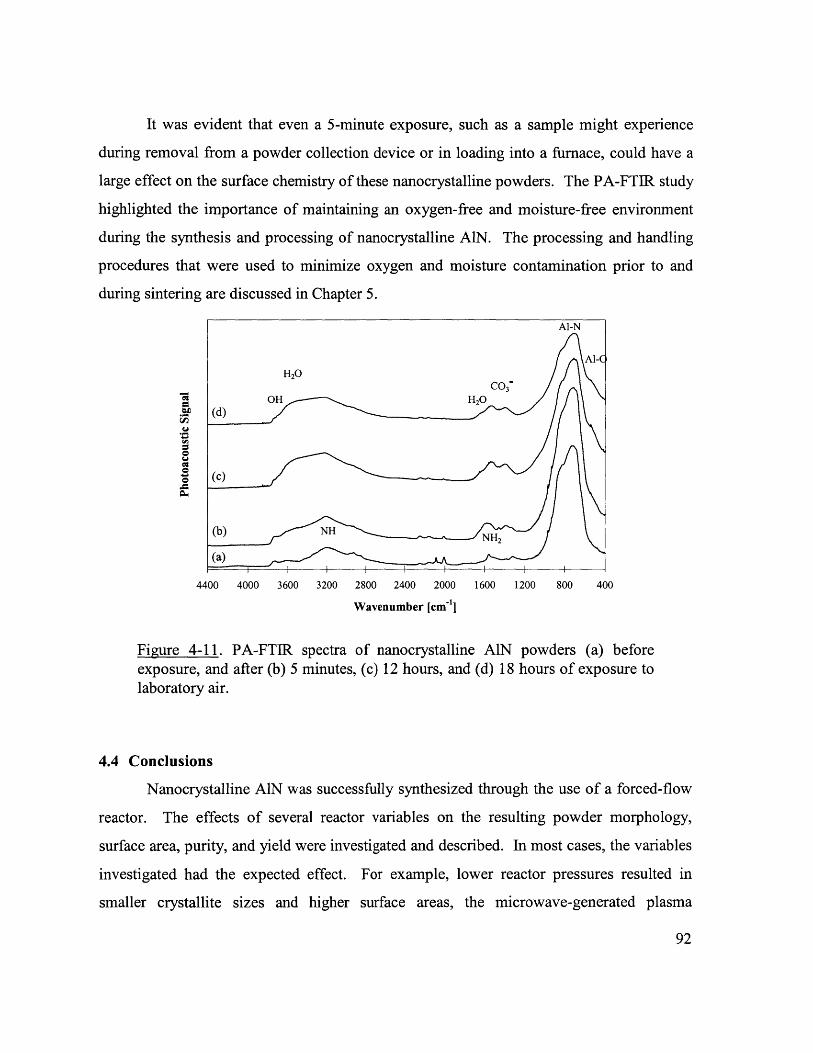
It was evident that even a 5-minute exposure, such as a sample might experience
during removal from a powder collection device or in loading into a furnace, could have a
large effect on the surface chemistry of these nanocrystalline powders. The PA-FTIR study
highlighted the importance of maintaining an oxygen-free and moisture-free environment
during the synthesis and processing of nanocrystalline AiN. The processing and handling
procedures that were used to minimize oxygen and moisture contamination prior to and
during sintering are discussed in Chapter 5.
CICI
CI0CIC0
.0
4400 4000 3600 3200 2800 2400 2000 1600 1200
Wavenumber [cm~1]
Figure 4-11. PA-FTIR spectra of nanocrystalline AIN powders (a) beforeexposure, and after (b) 5 minutes, (c) 12 hours, and (d) 18 hours of exposure tolaboratory air.
4.4 Conclusions
Nanocrystalline AIN was successfully synthesized through the use of a forced-flow
reactor. The effects of several reactor variables on the resulting powder morphology,
surface area, purity, and yield were investigated and described. In most cases, the variables
investigated had the expected effect. For example, lower reactor pressures resulted in
smaller crystallite sizes and higher surface areas, the microwave-generated plasma
92
Al-N
Al-C
H20
() OH H20 C3
(d)
(b ) N H .................. ' N H 2
(a)
800 400
increased the degree of nitridation attainable when nitrogen was used as the nitriding gas,
and NH3 readily reacted with the Al vapors allowing high-purity AIN powders to be
produced. However, in several instances the reactor variables had unexpected results. For
instance, the choice of carrier gas during in-situ nitridation synthesis had a profound effect
on the morphology of the particles produced. By understanding the effects of synthesis
conditions and developing air-free powder processing, nanocrystalline AlN materials with
high surface areas and low oxygen contents were achieved. The surface chemistry of these
powders was examined, and it was shown that even a brief exposure to ambient atmosphere
would lead to surface hydrolysis and oxidation of the AlN nanocrystals.
4.5 References
[1] D. T. Castro, Synthesis, Processing, and Properties of Nanocrystalline Nitrides,
Sc.D. Thesis. Massachusetts Institute of Technology, Cambridge, MA, 1997.
[2] R. Flagan, "Gas Phase Synthesis of Nanoparticles"; pp. 15-30 in Nanostructured
Materials. Edited by G.-M. Chow and N. Noskova. Kluwer Academic Publishers,
Dordrecht, The Netherlands, 1998.
[3] H. C. Starck, Inc., Grade B AIN data sheet.
[4] K. Baba, N. Shohata, and M. Yonezawa, "Synthesis and Properties of Ultrafine AlN
Powder by RF Plasma," Appl. Phys. Lett., 54 [23] 2309-11 (1989).
[5] F. J. Moura and R. J. Munz, "Vapor-Phase Synthesis of Nanosize Aluminum Nitride
Particles Using a Two-Stage Transferred Arc Reactor," J. Am. Ceram. Soc., 80 [9]
2425-28 (1997).
[6] J. Canteloup and A. Mocellin, "Synthesis of Ultrafine Nitrides and Oxynitrides in an
R.F. Plasma," Proceedings of the Sixth Symposium on Special Ceramics. Edited by
P. Popper. British Ceramic Society, Stoke-on-Trent, U.K., 1975.
[7] T. Merle-Mejean, M.-I. Baraton, P. Quintard, Y. Laurent, and V. Lorenzelli,
"Fourier-transform Infrared Characterization of an Aluminum Nitride Surface,"
J Chem. Soc. Faraday Trans., 89 [16] 3111-15 (1993).
93

[8] J. B. Benziger, S. J. McGovern, and B. S. H. Royce, "IR Photoacoustic
Spectroscopy of Silica and Aluminum Oxide"; pp. 448-63 in Catalyst
Characterization Science, ACS Symposium Series No. 288. Edited by M. L.
Deviney and J. L. Gland. American Chemical Society, Washington, D.C., 1985.
94
5. Densification and Characterization of Aluminum Nitride
The purpose of synthesizing nanocrystalline AIN was to produce a powder that
would allow pressureless and additive-free densification at relatively low temperatures; this
would produce a material with a potentially high thermal conductivity for electronic
packaging applications. Since nanocrystalline AlN powders were very hygroscopic, the
samples were removed from the filter assembly, stored, and processed within a glovebox
where the oxygen concentration was <5 ppm (generally <1 ppm) and the water
concentration was maintained at <1 ppm. A large number of synthesis-processing-sintering
experiments were conducted in order to determine which variables affected powder
sinterability. Several of the early challenges were associated with purity and engineering
issues. For example, a "high-purity" BN spray that had been used as a die lubricant was
found to contain several weight percent of clay as a binder. AIN and BN powders that had
been employed as packing powders to prevent AlN sublimation and carbon contamination
during sintering were found to contain several weight percent oxygen. There had also been
a problem with the molybdenum-sheathed thermocouples in the nitrogen-purged graphite
furnace failing regularly at sintering temperatures above 1700'C. Having addressed these
issues, interesting correlations between the synthesis conditions and the powder sinterability
were unraveled. High-purity AIN powders were reproducibly synthesized and successfully
sintered to give high thermal conductivities. Furthermore, some intriguing potential
applications of these nanocrystalline AlN powders were discovered as bulk textured
piezoelectric materials.
5.1 Pressureless Densification
Samples were prepared for pressureless densification by combining several batches
of powder, passing them through a 325-mesh sieve (to improve mixing), and pressing them
into a pellet within a glovebox using a BN-lubricated stainless steel die at -1000 psi. The
pellets were then placed in latex bags, evacuated, sealed, and removed from the glovebox to
be cold isostatically pressed at 410 MPa. While still sealed, the samples were returned to
95
the glovebox, removed from the latex bag, and placed inside a high-purity BN casket with
commercial AIN (H. C. Starck, Grade B) as a packing powder. The BN casket was then
placed in a covered molybdenum crucible and sealed with Parafilm®. This tightly sealed
casket was then rapidly transferred to the graphite furnace where it was immediately
evacuated to <2x10 2 mbar and refilled with 99.999% pure nitrogen three times prior to
heating. The vacuum was maintained during the heating ramp until approximately 1000'C,
when the furnace was filled to 4 psig and purged (0.4 slpm) with high-purity nitrogen. The
standard heating cycle included a ramp of 10'C/min to the sintering temperature, followed
by a 2-hour soak. The sample and furnace were then allowed to cool fairly rapidly
(~50'C/min) back to room temperature.
5.1.1 Effect of Synthesis Conditions
One unexpected result of this study was the effect of carrier gas on crystallite size
and surface area, as described in Section 4.2.1. Not surprisingly, however, the effect of
carrier gas was also manifested in the sinterability of the powders produced. Figure 5-1
shows the large effect that synthesis conditions had on the densification of the resulting
powders. The samples were made from powders produced with the two different carrier
gases (He or N2) and at various reactor pressures, under otherwise similar reactor
conditions. The samples with the higher densities were made from powders synthesized
with nitrogen as the carrier gas. This was not initially expected as these powders have a
larger crystallite size and a lower surface area, thus presumably, a lower driving force for
sintering. However, the aspect ratio of the particles, the particle size distribution, and the
strength of the agglomerates within a powder can dominate the sinterability. As described
in Section 4.3.1, the powders produced with He as the carrier gas consisted of smaller
crystallites but with many more needle-shaped particles that might be detrimental toward
packing and sintering. Another possible reason for the differences in densification behavior
could be incomplete nitridation of the nanocrystalline AlN when synthesized with helium as
the carrier gas. However, there were several arguments to refute this: (a) these powders
were white - any residual aluminum would have made the powders darker in color, (b) X-
96
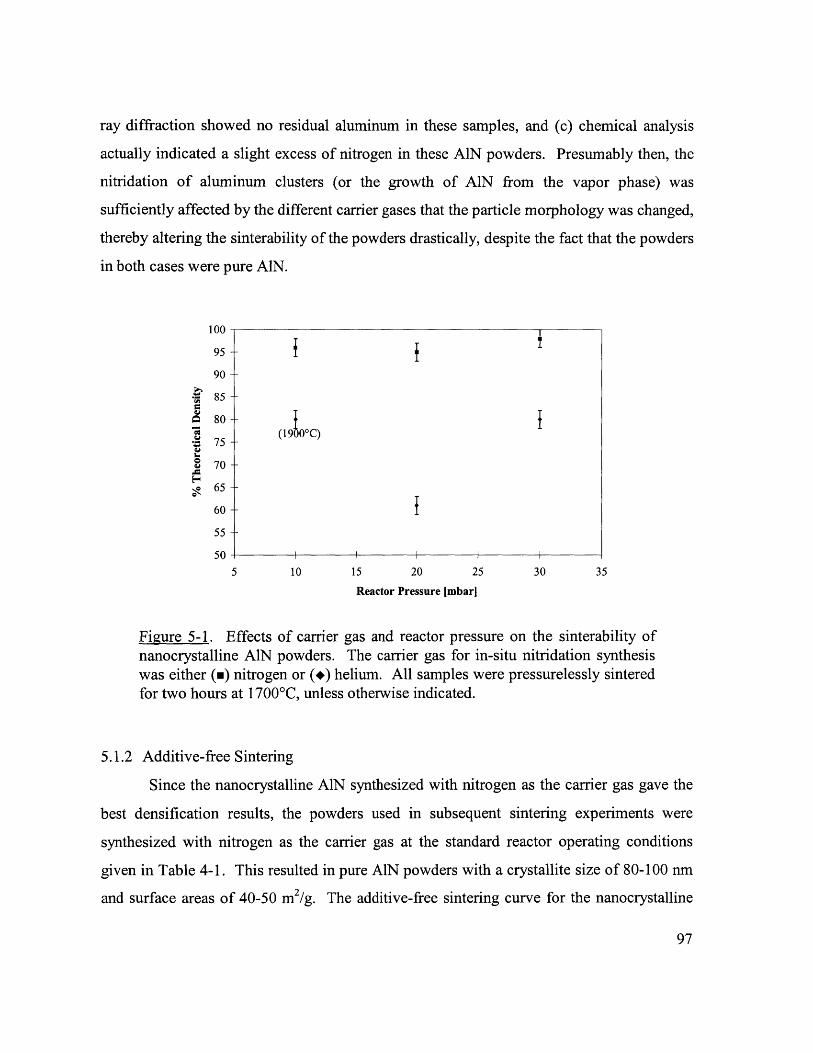
ray diffraction showed no residual aluminum in these samples, and (c) chemical analysis
actually indicated a slight excess of nitrogen in these AlN powders. Presumably then, the
nitridation of aluminum clusters (or the growth of AlN from the vapor phase) was
sufficiently affected by the different carrier gases that the particle morphology was changed,
thereby altering the sinterability of the powders drastically, despite the fact that the powders
in both cases were pure AIN.
41
0
100
95 -
90 -
85 -
80 -
75 -
70 -
65 -
60 -
55 -
50 -10 15 20 25
Reactor Pressure [mbar]
30 35
Figure 5-1. Effects of carrier gas and reactor pressure on the sinterability ofnanocrystalline AlN powders. The carrier gas for in-situ nitridation synthesiswas either (m) nitrogen or (+) helium. All samples were pressurelessly sinteredfor two hours at 1700'C, unless otherwise indicated.
5.1.2 Additive-free Sintering
Since the nanocrystalline AlN synthesized with nitrogen as the carrier gas gave the
best densification results, the powders used in subsequent sintering experiments were
synthesized with nitrogen as the carrier gas at the standard reactor operating conditions
given in Table 4-1. This resulted in pure AlN powders with a crystallite size of 80-100 nm
and surface areas of 40-50 m2/g. The additive-free sintering curve for the nanocrystalline
97
(19-0C)
5
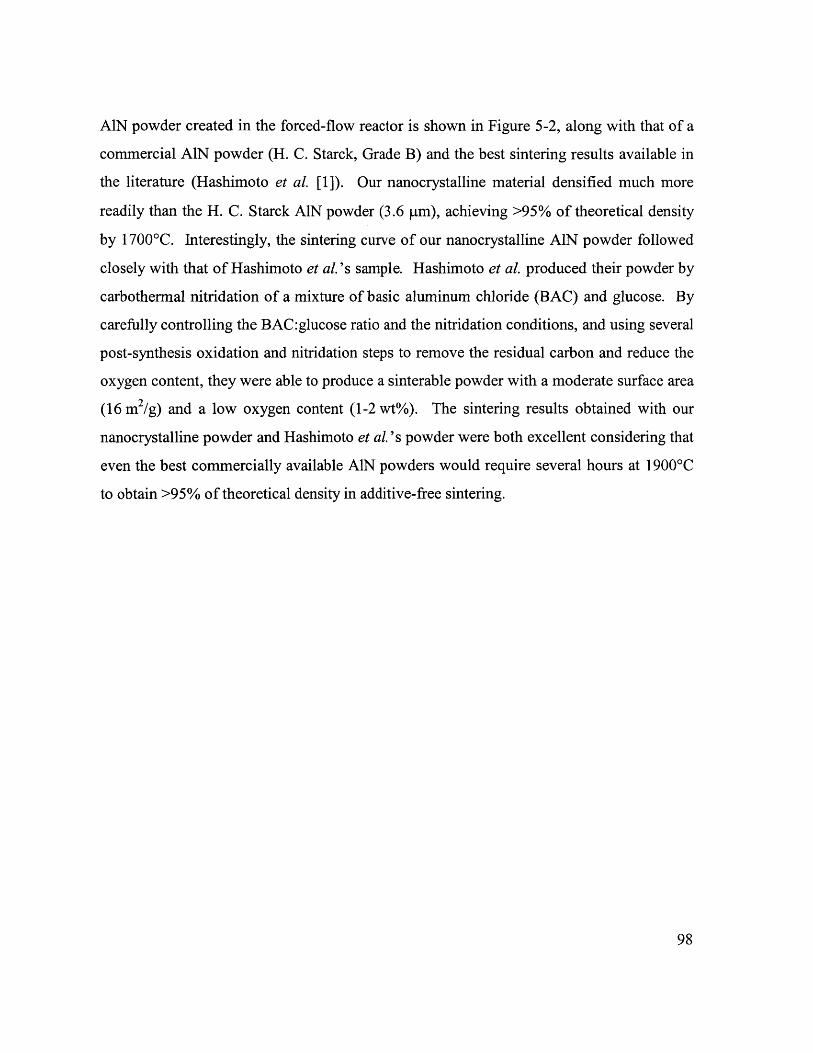
AiN powder created in the forced-flow reactor is shown in Figure 5-2, along with that of a
commercial AiN powder (H. C. Starck, Grade B) and the best sintering results available in
the literature (Hashimoto et al. [1]). Our nanocrystalline material densified much more
readily than the H. C. Starck AlN powder (3.6 pm), achieving >95% of theoretical density
by 1700'C. Interestingly, the sintering curve of our nanocrystalline AlN powder followed
closely with that of Hashimoto et al.'s sample. Hashimoto et al. produced their powder by
carbothermal nitridation of a mixture of basic aluminum chloride (BAC) and glucose. By
carefully controlling the BAC:glucose ratio and the nitridation conditions, and using several
post-synthesis oxidation and nitridation steps to remove the residual carbon and reduce the
oxygen content, they were able to produce a sinterable powder with a moderate surface area
(16 m2/g) and a low oxygen content (1-2 wt%). The sintering results obtained with our
nanocrystalline powder and Hashimoto et al.'s powder were both excellent considering that
even the best commercially available AlN powders would require several hours at 1900'C
to obtain >95% of theoretical density in additive-free sintering.
98
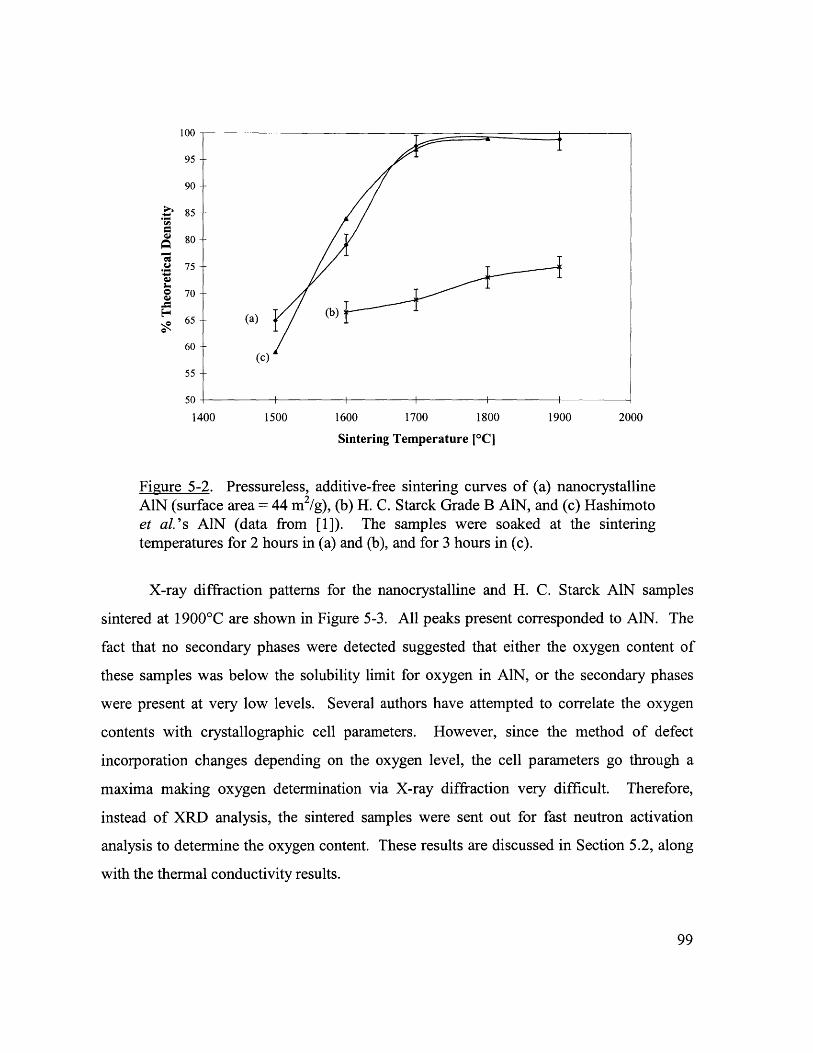
100
95
90-
85-
80-
. 75
o 70
65 (a) (b)
60(c)
55
50 - I I
1400 1500 1600 1700 1800 1900 2000
Sintering Temperature 1C]
Figure 5-2. Pressureless, additive-free sintering curves of (a) nanocrystallineALN (surface area = 44 m2/g), (b) H. C. Starck Grade B AIN, and (c) Hashimotoet al.'s AIN (data from [1]). The samples were soaked at the sinteringtemperatures for 2 hours in (a) and (b), and for 3 hours in (c).
X-ray diffraction patterns for the nanocrystalline and H. C. Starck AIN samples
sintered at 1900'C are shown in Figure 5-3. All peaks present corresponded to AIN. The
fact that no secondary phases were detected suggested that either the oxygen content of
these samples was below the solubility limit for oxygen in AIN, or the secondary phases
were present at very low levels. Several authors have attempted to correlate the oxygen
contents with crystallographic cell parameters. However, since the method of defect
incorporation changes depending on the oxygen level, the cell parameters go through a
maxima making oxygen determination via X-ray diffraction very difficult. Therefore,
instead of XRD analysis, the sintered samples were sent out for fast neutron activation
analysis to determine the oxygen content. These results are discussed in Section 5.2, along
with the thermal conductivity results.
99
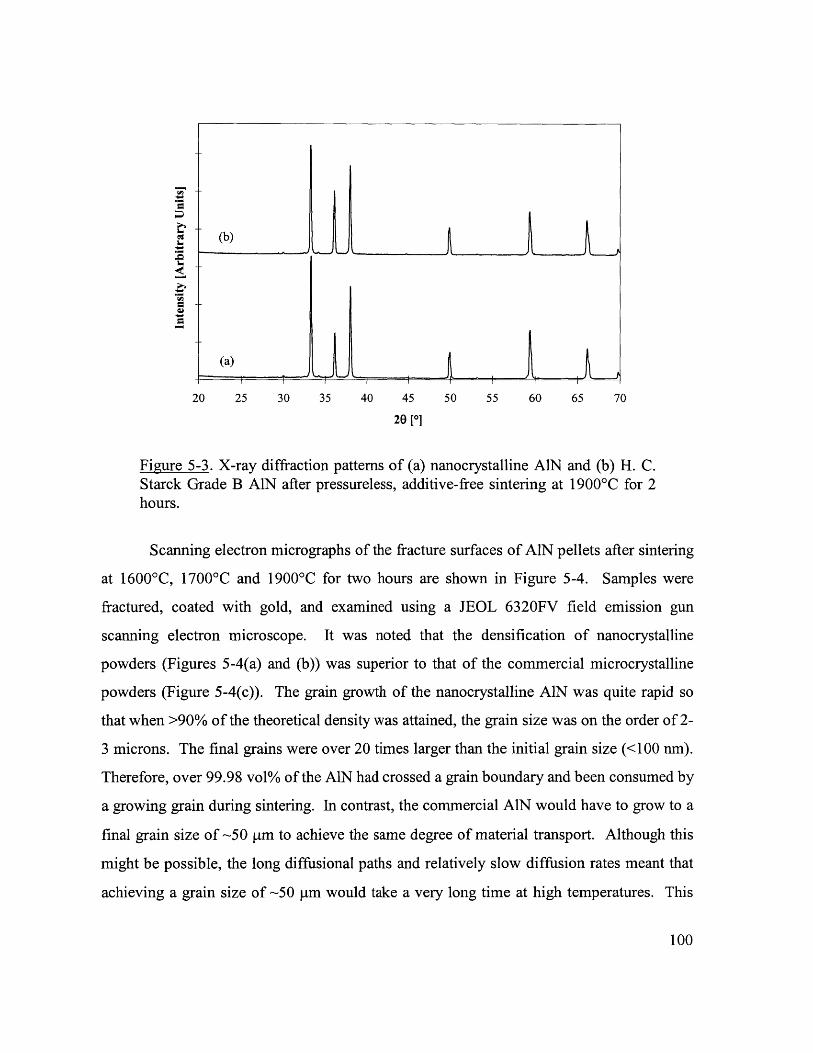
(b)
(a)
20 25 30 35 40 45 50 55 60 65 70
20 [0]
Figure 5-3. X-ray diffraction patterns of (a) nanocrystalline AIN and (b) H. C.Starck Grade B AIN after pressureless, additive-free sintering at 1900'C for 2hours.
Scanning electron micrographs of the fracture surfaces of AIN pellets after sintering
at 1600 0C, 1700'C and 1900*C for two hours are shown in Figure 5-4. Samples were
fractured, coated with gold, and examined using a JEOL 6320FV field emission gun
scanning electron microscope. It was noted that the densification of nanocrystalline
powders (Figures 5-4(a) and (b)) was superior to that of the commercial microcrystalline
powders (Figure 5-4(c)). The grain growth of the nanocrystalline AIN was quite rapid so
that when >90% of the theoretical density was attained, the grain size was on the order of 2-
3 microns. The final grains were over 20 times larger than the initial grain size (<100 nm).
Therefore, over 99.98 vol% of the AlN had crossed a grain boundary and been consumed by
a growing grain during sintering. In contrast, the commercial AlN would have to grow to a
final grain size of ~50 Vm to achieve the same degree of material transport. Although this
might be possible, the long diffusional paths and relatively slow diffusion rates meant that
achieving a grain size of ~50 [tm would take a very long time at high temperatures. This
100
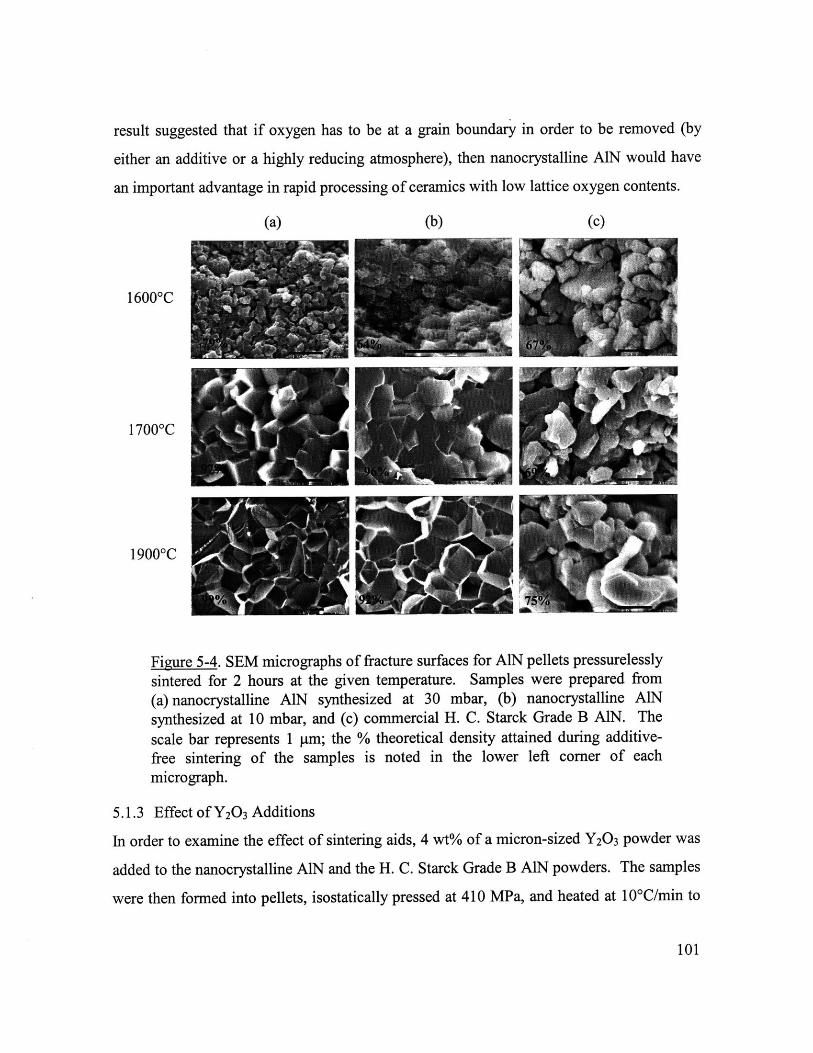
result suggested that if oxygen has to be at a grain boundary in order to be removed (by
either an additive or a highly reducing atmosphere), then nanocrystalline AIN would have
an important advantage in rapid processing of ceramics with low lattice oxygen contents.
(a)
16000C
17000C
1900 0C
(b) (c)
Figure 5-4. SEM micrographs of fracture surfaces for AlN pellets pressurelessly
sintered for 2 hours at the given temperature. Samples were prepared from
(a) nanocrystalline AIN synthesized at 30 mbar, (b) nanocrystalline AlN
synthesized at 10 mbar, and (c) commercial H. C. Starck Grade B AlN. The
scale bar represents 1 pm; the % theoretical density attained during additive-
free sintering of the samples is noted in the lower left corner of each
micrograph.
5.1.3 Effect of Y20 3 Additions
In order to examine the effect of sintering aids, 4 wt% of a micron-sized Y20 3 powder was
added to the nanocrystalline AlN and the H. C. Starck Grade B AlN powders. The samples
were then formed into pellets, isostatically pressed at 410 MPa, and heated at 10*C/min to
101
the sintering temperature where they were soaked for two hours. The densities of these
samples were determined by Archimedes' method and are shown in Figure 5-5. The
theoretical density for AlN samples with 4 wt% Y20 3 (incorporated as Y3A 5012) was
calculated to be 3.33 g/cm 3, although this value would change slightly depending on which
yttrium aluminate phases were present and their relative amounts. The sintering curves
shown in Figure 5-5 are for (a) the best sintering results reported in the literature
(Hashimoto et al. [1], AlN with 2 wt% Y20 3, 3-hour dwell), (b) nanocrystalline AlN with 4
wt% Y2 0 3, (c) H. C. Starck Grade B AlN with 4 wt% Y20 3, and (d) H. C. Starck Grade B
AlN without any additive. The Y20 3 additives have a large effect on the densification of
both the nanocrystalline and commercial AlN powders. Whereas the pure commercial
material did not exceed 75% of theoretical density even after sintering at 1900'C, it attained
>90% of theoretical density at 1800'C with 4 wt% Y20 3 additives. The large increase in
densification for the commercial AlN with the Y20 3 additions at temperatures between
17000 and 18000 was due to the well-known formation of a liquid phase in the Y20 3-A 20 3
system at temperatures around 1760'C. This liquid phase greatly increased material
transport and enhanced densification. However, there was also an increase in density for
the nanocrystalline sample at temperatures well below 1700'C. The addition of yttria to the
nanocrystalline AlN increased the density attained at 1600'C from 78% to 93%; Hashimoto
et al. [1] found that the temperature required to achieve >95% of theoretical density could
be reduced by 1 000 C (to 1600*C) with the addition of 2 wt% Y20 3. There were two likely
mechanisms for the increased low-temperature densification of ultrafine AlN systems with
Y2 0 3 additions: (a) an Al-Y-O-N liquid could form and promote material transport via
liquid-phase sintering, or (b) solid-state grain boundary diffusion could increase due to
Y20 3 doping of the grain boundaries. It is well accepted that a ternary liquid (A12 0 3-Y 20 3 -
AlN) can be present at temperatures >1700'C [2], but these results suggest that a liquid
phase may form at even lower temperatures (<1600'C) or that Y20 3 doping significantly
increases solid-state diffusion.
102
Although the pure AIN samples prepared in this work and by Hashimoto et al. [1]
have similar sintering behaviors (Figures 5-2(a) and (c)), the AlN sample prepared by
Hashimoto et al. benefited more from the Y20 3 sintering additive. There were two possible
reasons for the latter observation. The first was that Hashimoto et al. [1] used an ultrafine,
high surface area Y20 3 powder (57 m2/g) as the additive, whereas the Y20 3 used in
sintering nanocrystalline AlN (Figure 5-5(b)) was much coarser (- pm diameter, 8.7 m2/g).
This could lead to significant differences in the reactivity of the Y20 3 with the surface oxide
and nitride species of the AlN. The second explanation involves the different amounts of
Y20 3 that were added: 4 wt% Y20 3 was added to the nanocrystalline AlN sample while
Hashimoto et al. [1] used 2 wt% Y20 3. There might exist an optimal concentration of Y20 3
additive depending on the crystallite size and/or oxygen content of the AIN sample. Other
researchers have shown that there was an optimal additive content to maximize the thermal
conductivity of AlN [3,4], and the amount necessary could be affected by both the oxygen
content and the powder used. This concept might extend to the densification of AlN as
well.
103
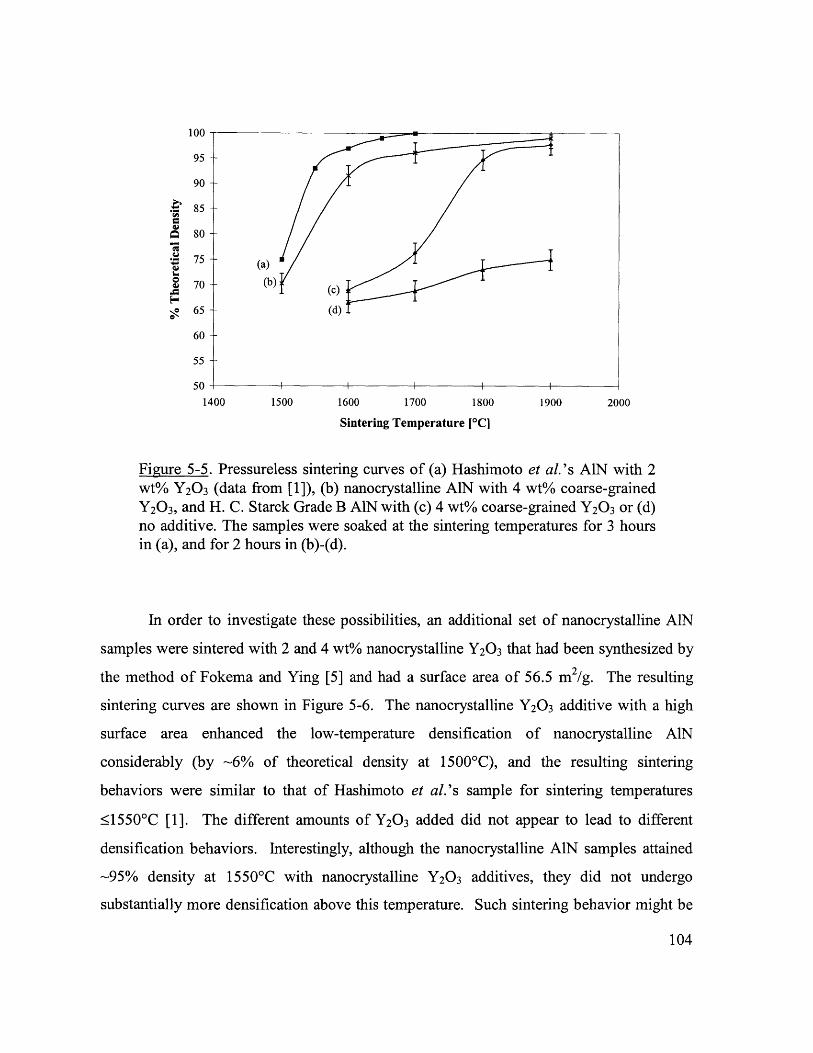
100
95
90
. 85
$ 80
- 75 -~ (a)
70 (b) (c)
65 (d)
60
55
501400 1500 1600 1700 1800 1900 2000
Sintering Temperature ['C]
Figure 5-5. Pressureless sintering curves of (a) Hashimoto et al.'s AIN with 2wt% Y20 3 (data from [1]), (b) nanocrystalline AIN with 4 wt% coarse-grainedY20 3, and H. C. Starck Grade B AIN with (c) 4 wt% coarse-grained Y20 3 or (d)no additive. The samples were soaked at the sintering temperatures for 3 hoursin (a), and for 2 hours in (b)-(d).
In order to investigate these possibilities, an additional set of nanocrystalline AlN
samples were sintered with 2 and 4 wt% nanocrystalline Y20 3 that had been synthesized by
the method of Fokema and Ying [5] and had a surface area of 56.5 m 2/g. The resulting
sintering curves are shown in Figure 5-6. The nanocrystalline Y20 3 additive with a high
surface area enhanced the low-temperature densification of nanocrystalline AlN
considerably (by ~6% of theoretical density at 1500'C), and the resulting sintering
behaviors were similar to that of Hashimoto et al.'s sample for sintering temperatures
1550'C [1]. The different amounts of Y20 3 added did not appear to lead to different
densification behaviors. Interestingly, although the nanocrystalline AlN samples attained
-95% density at 1550*C with nanocrystalline Y20 3 additives, they did not undergo
substantially more densification above this temperature. Such sintering behavior might be
104
attributed to the presence of large residual pores. Shown in Figure 5-7 are optical
micrographs of polished surfaces of nanocrystalline AlN samples densified (a) without
additives and (b) with 2 wt% nanocrystalline Y20 3. Both samples had approximately the
same density (95%) since the additive-free sample was sintered at 1700'C, while the
sample with Y20 3 was sintered at 1650'C. The pore size distribution, however, was
significantly different. While the sample without additives had uniform pores of only a few
microns in size, the sample with the nanocrystalline Y20 3 additions had some pores as large
as 40 pm. These pores were believed to be a result Y20 3 agglomerates that were not broken
down during the relatively gentle hand-mixing process. With a less agglomerated,
nanocrystalline Y20 3 powder, the densification would undoubtedly improve during the final
stages of sintering. In spite of the Y20 3 agglomerates limiting the final densification of
nanocrystalline AlN, the initial densification to 95% of theoretical density by 1550'C was
impressive, as was the effect of changing the Y20 3 source to one containing finer particles.
One striking observation in comparing our sintering results to those of Hashimoto et
al. [1] was the similarity in the densification behaviors of ultrafine, high-purity AlN
powders that were synthesized and processed via very different methods. This similarity
suggests that that (a) these two very different processes have produced high-quality powders
of very similar characteristics, or (b) a lower temperature limit for densification of AlN has
been approached. To investigate the latter possibility, we note that Sternitzke and MUller
[6] and Solmon et al. [7] measured the oxygen-nitrogen interdiffusion coefficient for Y20 3-
doped polycrystalline AlN at 1600*C to be ~3x10- 5 cm 2 /s and ~3x10-14 cm 2 /s, respectively.
Although the interdiffusion coefficients are not the most desired values to compare with
densification studies, nitrogen is expected to be the slowest diffusing species so that
oxygen-nitrogen interdiffusion values will give an order-of-magnitude estimate for the rate-
limiting step in AlN sintering. Since the activation energies reported for diffusion in AlN is
very large (240-430 kJ/mol), the diffusion coefficients will decrease rapidly with
temperature, making sintering even more difficult. For example, assuming an activation
energy of 300 kJ/mol, the interdiffusion coefficient will decrease by an order of magnitude
105
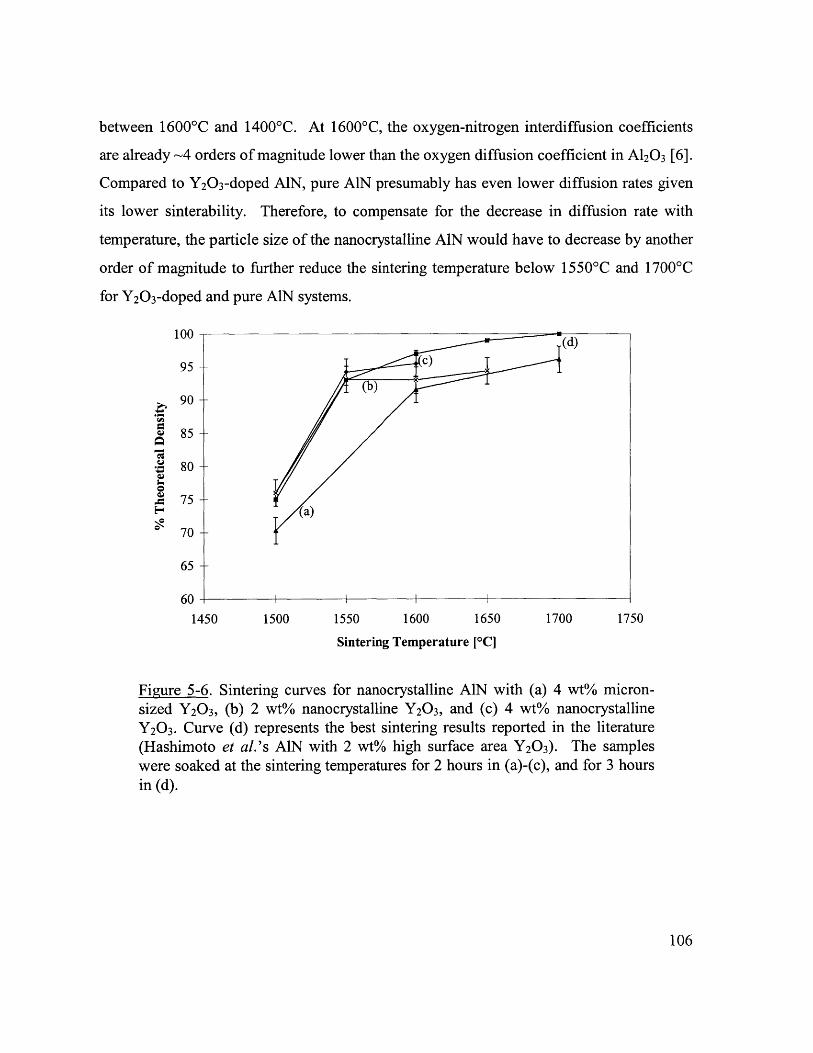
between 1600'C and 1400'C. At 1600'C, the oxygen-nitrogen interdiffusion coefficients
are already ~4 orders of magnitude lower than the oxygen diffusion coefficient in A12 0 3 [6].
Compared to Y20 3-doped AlN, pure AlN presumably has even lower diffusion rates given
its lower sinterability. Therefore, to compensate for the decrease in diffusion rate with
temperature, the particle size of the nanocrystalline AIN would have to decrease by another
order of magnitude to further reduce the sintering temperature below 15500 C and 1700'C
for Y20 3-doped and pure AlN systems.
100 - (d)
95 C)
(b)90
85
~80
. 75(a)
70
65
60 I
1450 1500 1550 1600 1650 1700 1750
Sintering Temperature [*C]
Figure 5-6. Sintering curves for nanocrystalline AlN with (a) 4 wt% micron-sized Y20 3, (b) 2 wt% nanocrystalline Y20 3, and (c) 4 wt% nanocrystalline
Y20 3. Curve (d) represents the best sintering results reported in the literature(Hashimoto et al.'s AlN with 2 wt% high surface area Y20 3). The sampleswere soaked at the sintering temperatures for 2 hours in (a)-(c), and for 3 hoursin (d).
106
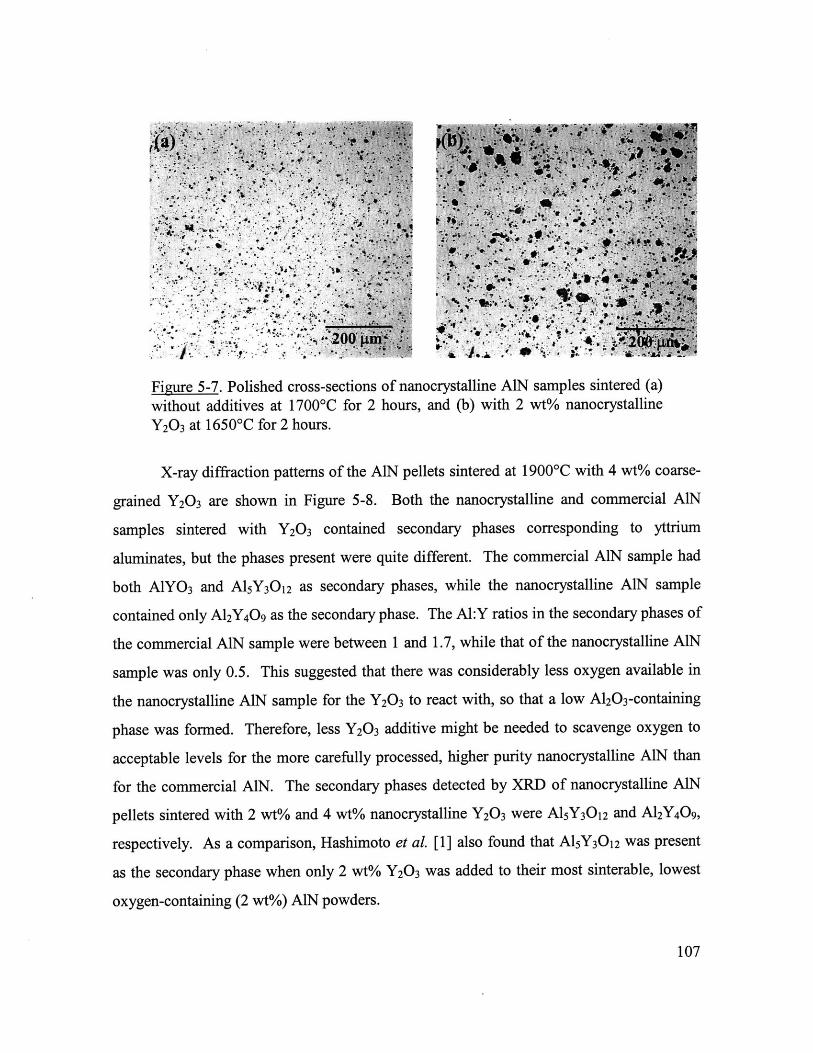
** a..
j 4 .1 9
Figure 5-7. Polished cross-sections of nanocrystalline AlN samples sintered (a)
without additives at 1700'C for 2 hours, and (b) with 2 wt% nanocrystalline
Y20 3 at 1650'C for 2 hours.
X-ray diffraction patterns of the AIN pellets sintered at 1900'C with 4 wt% coarse-
grained Y2 0 3 are shown in Figure 5-8. Both the nanocrystalline and commercial AlN
samples sintered with Y20 3 contained secondary phases corresponding to yttrium
aluminates, but the phases present were quite different. The commercial AlN sample had
both AlYO3 and A15Y30 12 as secondary phases, while the nanocrystalline AlN sample
contained only A12Y40 9 as the secondary phase. The Al:Y ratios in the secondary phases of
the commercial AIN sample were between 1 and 1.7, while that of the nanocrystalline AN
sample was only 0.5. This suggested that there was considerably less oxygen available in
the nanocrystalline AlN sample for the Y20 3 to react with, so that a low A12 0 3-containing
phase was formed. Therefore, less Y20 3 additive might be needed to scavenge oxygen to
acceptable levels for the more carefully processed, higher purity nanocrystalline AlN than
for the commercial AlN. The secondary phases detected by XRD of nanocrystalline AlN
pellets sintered with 2 wt% and 4 wt% nanocrystalline Y2 0 3 were Al5Y3012 and A 2Y4 0 9,
respectively. As a comparison, Hashimoto et al. [1] also found that A15Y30 12 was present
as the secondary phase when only 2 wt% Y20 3 was added to their most sinterable, lowest
oxygen-containing (2 wt%) AlN powders.
107
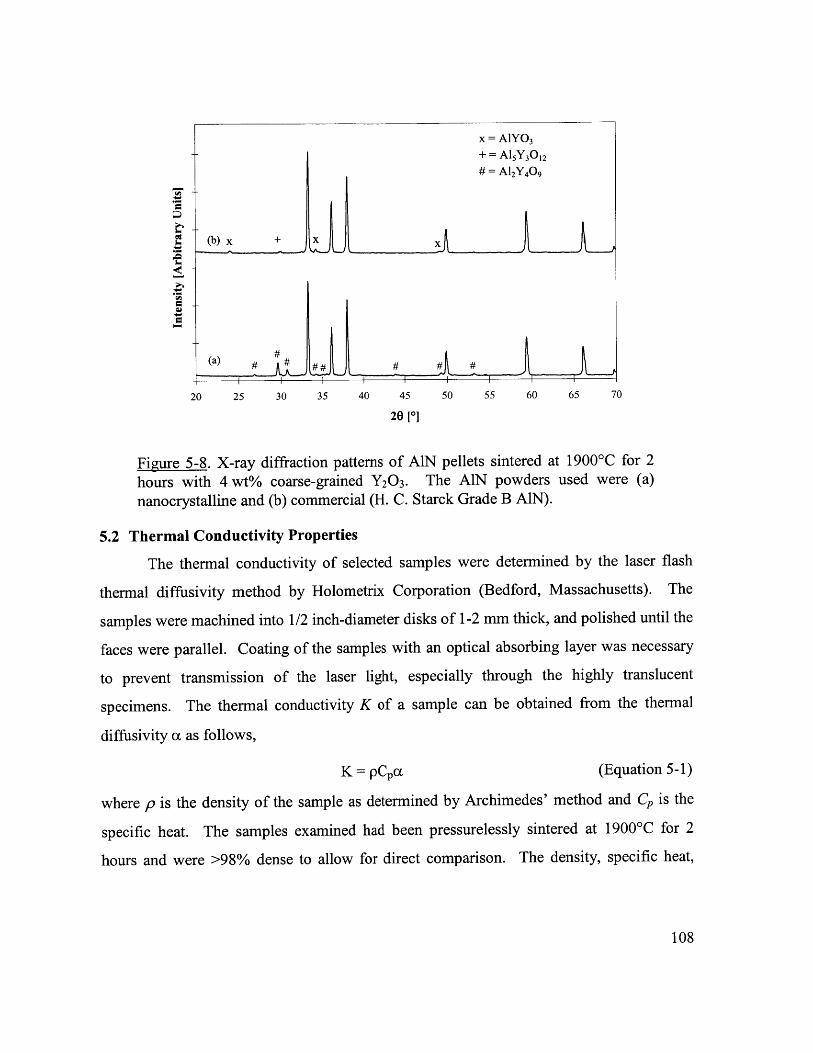
x = A1YO3
- = A15 Y 3012#= A12Y 40 9
(b) x + x
(a) # #
20 25 30 35 40 45 50 55 60 65 70
20 [1
Figure 5-8. X-ray diffraction patterns of AIN pellets sintered at 1900'C for 2hours with 4 wt% coarse-grained Y20 3. The AIN powders used were (a)nanocrystalline and (b) commercial (H. C. Starck Grade B AIN).
5.2 Thermal Conductivity Properties
The thermal conductivity of selected samples were determined by the laser flash
thermal diffusivity method by Holometrix Corporation (Bedford, Massachusetts). The
samples were machined into 1/2 inch-diameter disks of 1-2 mm thick, and polished until the
faces were parallel. Coating of the samples with an optical absorbing layer was necessary
to prevent transmission of the laser light, especially through the highly translucent
specimens. The thermal conductivity K of a sample can be obtained from the thermal
diffusivity ea as follows,
K = pCp1 C (Equation 5-1)
where p is the density of the sample as determined by Archimedes' method and C, is the
specific heat. The samples examined had been pressurelessly sintered at 1900'C for 2
hours and were >98% dense to allow for direct comparison. The density, specific heat,
108
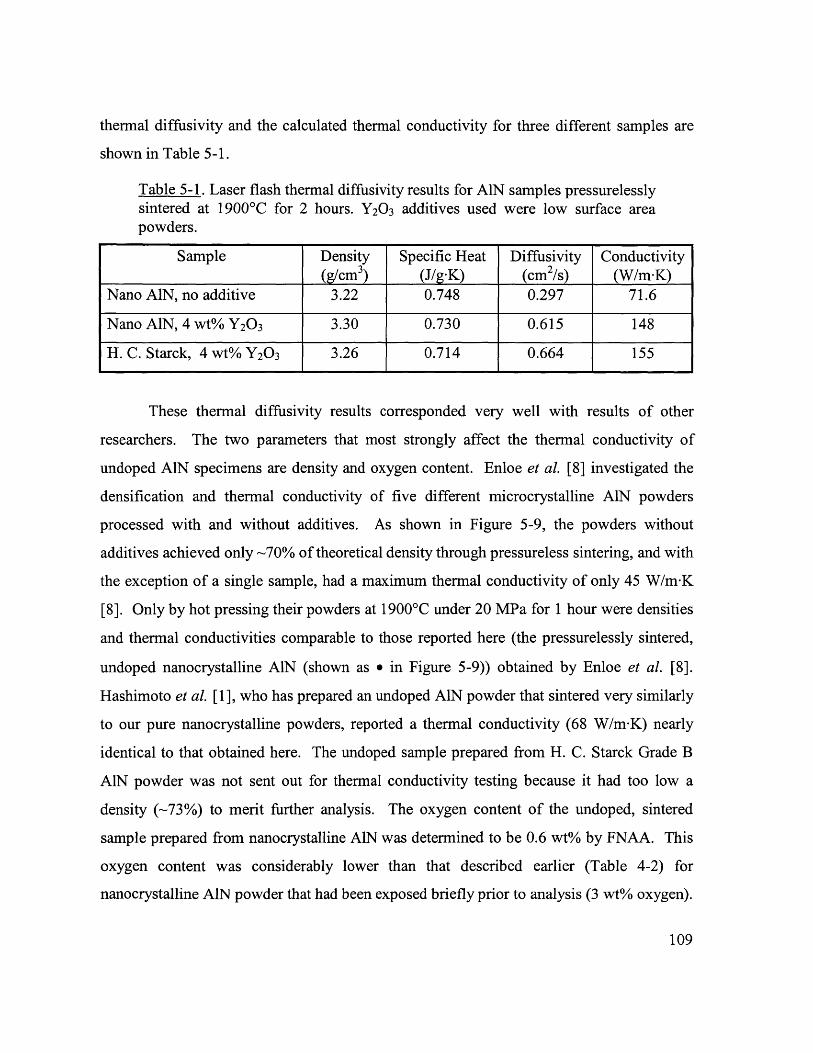
thermal diffusivity and the calculated thermal conductivity for three different samples are
shown in Table 5-1.
Table 5-1. Laser flash thermal diffusivity results for AlN samples pressurelesslysintered at 1900'C for 2 hours. Y2 0 3 additives used were low surface areapowders.
Sample Density Specific Heat Diffusivity Conductivity(g/cm 3) (J/g-K) (cm 2 /s) W/m-K)
Nano AlN, no additive 3.22 0.748 0.297 71.6
Nano AlN, 4wt% Y 20 3 3.30 0.730 0.615 148
H. C. Starck, 4 wt% Y 20 3 3.26 0.714 0.664 155
These thermal diffusivity results corresponded very well with results of other
researchers. The two parameters that most strongly affect the thermal conductivity of
undoped AlN specimens are density and oxygen content. Enloe et al. [8] investigated the
densification and thermal conductivity of five different microcrystalline AlN powders
processed with and without additives. As shown in Figure 5-9, the powders without
additives achieved only ~70% of theoretical density through pressureless sintering, and with
the exception of a single sample, had a maximum thermal conductivity of only 45 W/m-K
[8]. Only by hot pressing their powders at 1900*C under 20 MPa for 1 hour were densities
and thermal conductivities comparable to those reported here (the pressurelessly sintered,
undoped nanocrystalline AlN (shown as e in Figure 5-9)) obtained by Enloe et al. [8].
Hashimoto et al. [1], who has prepared an undoped AlN powder that sintered very similarly
to our pure nanocrystalline powders, reported a thermal conductivity (68 W/m-K) nearly
identical to that obtained here. The undoped sample prepared from H. C. Starck Grade B
AlN powder was not sent out for thermal conductivity testing because it had too low a
density (~73%) to merit further analysis. The oxygen content of the undoped, sintered
sample prepared from nanocrystalline AlN was determined to be 0.6 wt% by FNAA. This
oxygen content was considerably lower than that described earlier (Table 4-2) for
nanocrystalline AlN powder that had been exposed briefly prior to analysis (3 wt% oxygen).
109
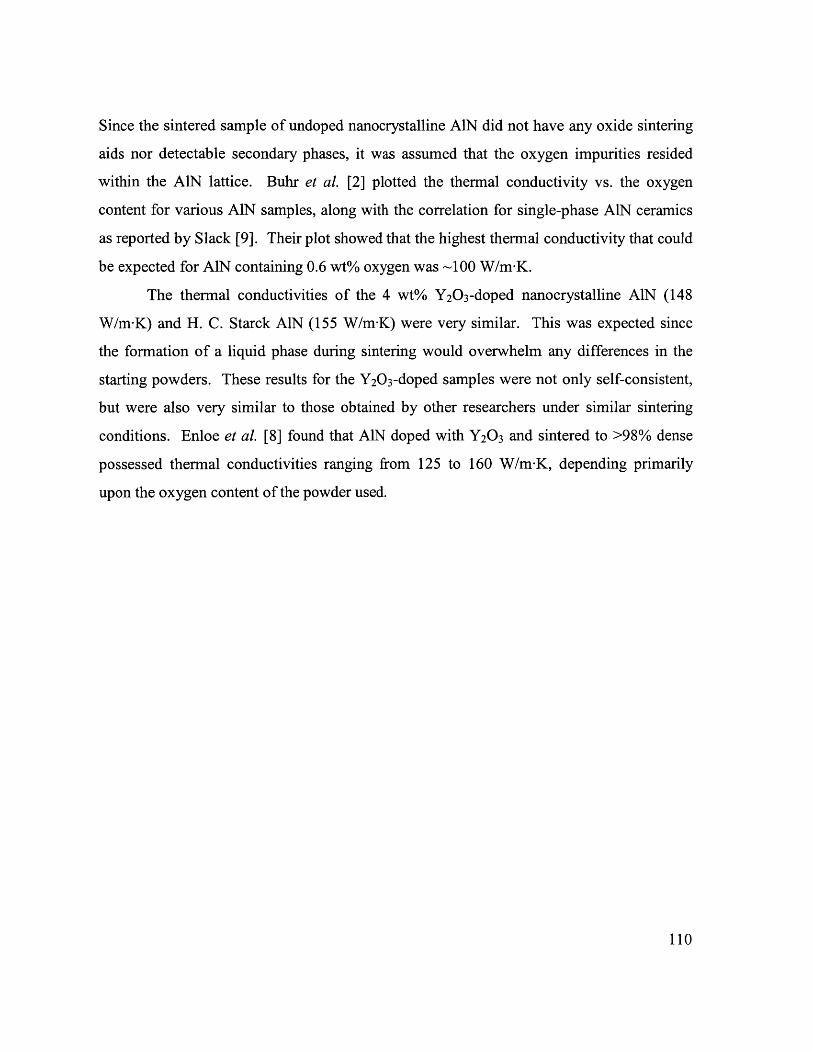
Since the sintered sample of undoped nanocrystalline AIN did not have any oxide sintering
aids nor detectable secondary phases, it was assumed that the oxygen impurities resided
within the AlN lattice. Buhr et al. [2] plotted the thermal conductivity vs. the oxygen
content for various AlN samples, along with the correlation for single-phase AlN ceramics
as reported by Slack [9]. Their plot showed that the highest thermal conductivity that could
be expected for AlN containing 0.6 wt% oxygen was -100 W/m-K.
The thermal conductivities of the 4 wt% Y20 3-doped nanocrystalline AlN (148
W/m-K) and H. C. Starck AlN (155 W/m-K) were very similar. This was expected since
the formation of a liquid phase during sintering would overwhelm any differences in the
starting powders. These results for the Y20 3-doped samples were not only self-consistent,
but were also very similar to those obtained by other researchers under similar sintering
conditions. Enloe et al. [8] found that AlN doped with Y20 3 and sintered to >98% dense
possessed thermal conductivities ranging from 125 to 160 W/m-K, depending primarily
upon the oxygen content of the powder used.
110
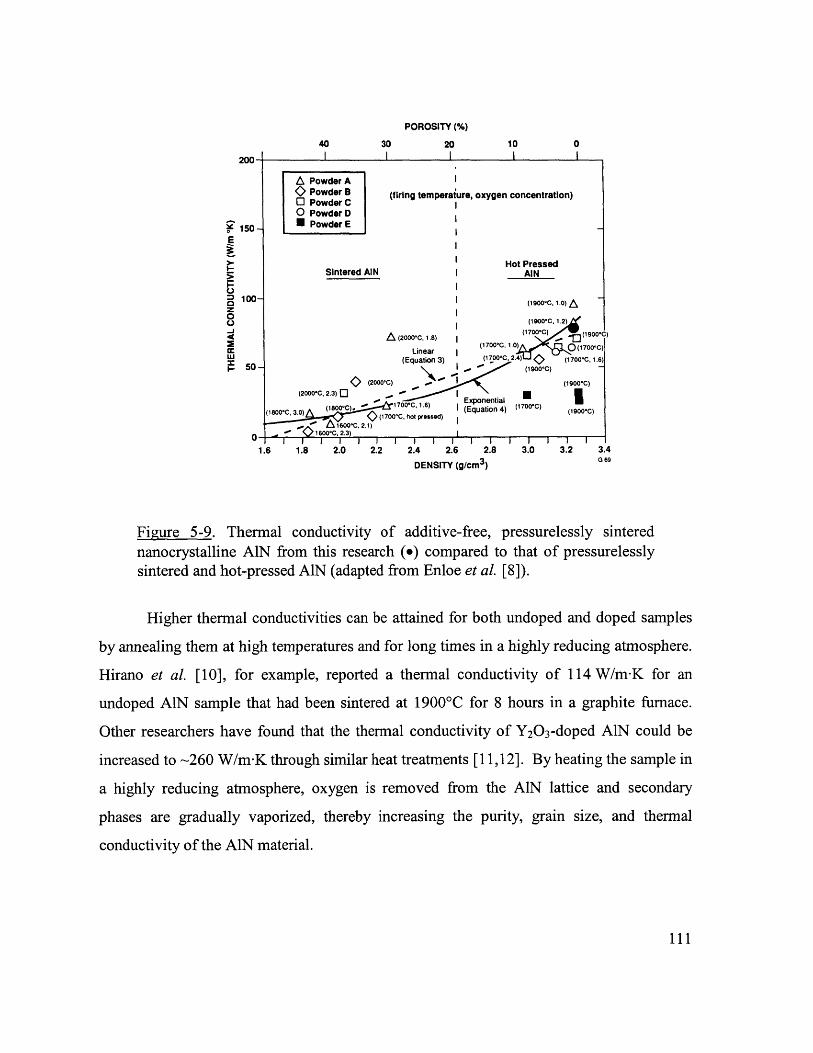
POROSITY (%)
40 30 20 10 0
200- 1 1 1
A Powder APowder B (firing temperaiure, oxygen concentration)
C Powder Co Powder D
150 - Powder EE
Hot PressedSintered AIN HAIN
M 100 (90C.100 (1900-C. 1.0)Z
(19Co'.-.)
4 A (200C 1.8).(1700'C) 1 .4 0900*C)(1700-C10 Q(700'c)
ccLinear I(Equation 3) (1700-C. 2.4 > 1700C, 1.6)
1. 50- (19O0-C)
2> (2000-C) - (1900-C)
(2000t, 2.3) ["-]- Exponential( 3.0 (1800C). (Equation 4) (1700*C) (1900-C)
A 0 o . 1 ( > 1 7 0 0 -C , h o t p r es oed )
0 1600-C, 2.3)
1.6 1.8 2.0 2.2 2.4 2.6 2.8 3.0 3.2 3.4
DENSITY (g/cm3) G 69
Figure 5-9. Thermal conductivity of additive-free, pressurelessly sinterednanocrystalline AIN from this research (o) compared to that of pressurelesslysintered and hot-pressed AIN (adapted from Enloe et al. [8]).
Higher thermal conductivities can be attained for both undoped and doped samples
by annealing them at high temperatures and for long times in a highly reducing atmosphere.
Hirano et al. [10], for example, reported a thermal conductivity of 114 W/m-K for an
undoped AlN sample that had been sintered at 1900'C for 8 hours in a graphite furnace.
Other researchers have found that the thermal conductivity of Y20 3-doped AlN could be
increased to -260 W/m-K through similar heat treatments [11,12]. By heating the sample in
a highly reducing atmosphere, oxygen is removed from the AIN lattice and secondary
phases are gradually vaporized, thereby increasing the purity, grain size, and thermal
conductivity of the AIN material.
111
5.3 Hot Pressing
During the initial stage of the sintering studies experiments were focused on
powders prepared in a He/NH 3 gas stream at low reactor pressures, which gave the highest
surface area and smallest crystallite size possible for AlN. However, as shown in Figure 5-
1, these powders did not densify well via pressureless sintering, so hot pressing was
investigated as an alternative method for densification. Hot pressing was performed with a
BN-coated 2 inch-diameter graphite die. The powders were loaded into the die and the
rams inserted while inside a glovebox. The assembly was then rapidly transferred from the
glovebox to a resistively heated graphite furnace (Materials Research Furnaces, Inc.), where
it was quickly evacuated and purged three times with 99.999% pure nitrogen. Samples
were then heated at 1 00C/min to 1900'C in 4 psig N2 (1 slpm purge) and soaked for 1 or 2
hours. As shown in Figure 5-10, densification of these nanocrystalline AIN powders was
difficult even with hot pressing. Pressures of 50 to 100 MPa and temperatures of 1900'C
were necessary to obtain densities >90%. This is in stark contrast to the powders generated
at higher reactor pressures in a N2/NH 3 atmosphere, which achieved >95% of theoretical
density at temperatures as low as 1700*C during pressureless sintering (Figure 5-2). As
discussed previously, the large difference in powder sinterability was believed to be due to
the higher number of needle-shaped particles that were produced when the reactor was
operated at lower pressures with a He/NH3 gas stream.
112
100
95 (2 hours)
90
85--
80--
75 --
70
65
60
55
500 10 20 30 40 50 60 70 80 90 100 110
Applied Pressure [MPa]
Figure 5-10. Densification of nanocrystalline AIN powder produced at 7 mbarin a He/NH 3 gas stream. The samples were hot pressed at 10'C/min with theapplied pressure specified and held at 1900'C for 1 hour (except otherwisenoted).
X-ray diffraction patterns of hot-pressed nanocrystalline AlN and commercial AIN
are shown in Figure 5-11. The samples were hot pressed at 1900*C for 1 hour under 50
MPa. The extraordinarily intense (002) and (004) peaks of the nanocrystalline AlN sample
in comparison to those of the commercial AlN sample (whose pattern matched the standard
diffraction pattern of randomly distributed, uniform AIN crystals) suggested that the
nanocrystalline sample was highly oriented.
AlN, besides having a high thermal conductivity, might also be useful as a high-
temperature piezoelectric. Although the value of its piezoelectric constant d33 (5 pC/N) is
not very high, it has been suggested that AIN can be used at higher temperatures (up to
1150'C) than many other piezoelectric materials [13]. The preferred orientation along the
(002) direction achieved in pellets prepared by hot pressing nanocrystalline AlN powders
containing large numbers of needle-shaped particles may be useful for piezoelectric
applications. Although the degree of orientation attained in this case was low compared to
that achieved with AlN thin film piezoelectrics prepared by CVD and RF sputtering
113
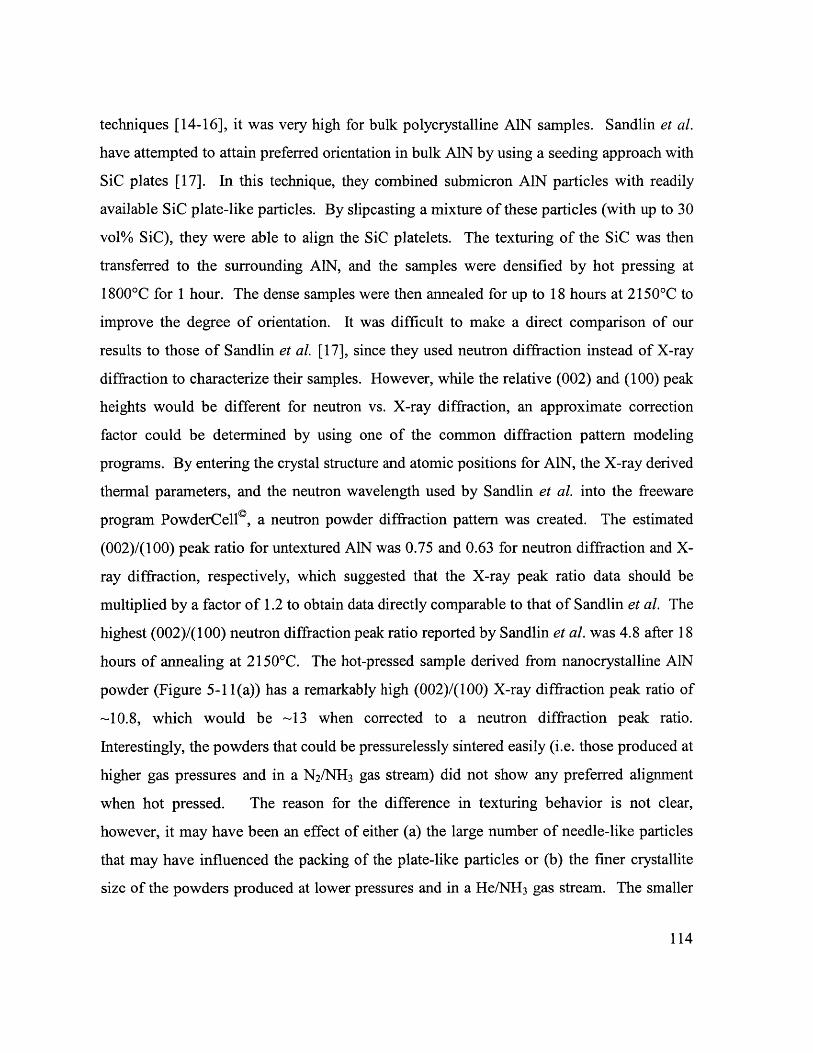
techniques [14-16], it was very high for bulk polycrystalline AIN samples. Sandlin et al.
have attempted to attain preferred orientation in bulk AlN by using a seeding approach with
SiC plates [17]. In this technique, they combined submicron AIN particles with readily
available SiC plate-like particles. By slipcasting a mixture of these particles (with up to 30
vol% SiC), they were able to align the SiC platelets. The texturing of the SiC was then
transferred to the surrounding AlN, and the samples were densified by hot pressing at
1800'C for 1 hour. The dense samples were then annealed for up to 18 hours at 2150'C to
improve the degree of orientation. It was difficult to make a direct comparison of our
results to those of Sandlin et al. [17], since they used neutron diffraction instead of X-ray
diffraction to characterize their samples. However, while the relative (002) and (100) peak
heights would be different for neutron vs. X-ray diffraction, an approximate correction
factor could be determined by using one of the common diffraction pattern modeling
programs. By entering the crystal structure and atomic positions for AlN, the X-ray derived
thermal parameters, and the neutron wavelength used by Sandlin et al. into the freeware
program PowderCell©, a neutron powder diffraction pattern was created. The estimated
(002)/(100) peak ratio for untextured AlN was 0.75 and 0.63 for neutron diffraction and X-
ray diffraction, respectively, which suggested that the X-ray peak ratio data should be
multiplied by a factor of 1.2 to obtain data directly comparable to that of Sandlin et al. The
highest (002)/(100) neutron diffraction peak ratio reported by Sandlin et al. was 4.8 after 18
hours of annealing at 2150'C. The hot-pressed sample derived from nanocrystalline AlN
powder (Figure 5-11(a)) has a remarkably high (002)/(100) X-ray diffraction peak ratio of
-10.8, which would be ~13 when corrected to a neutron diffraction peak ratio.
Interestingly, the powders that could be pressurelessly sintered easily (i.e. those produced at
higher gas pressures and in a N2/NH 3 gas stream) did not show any preferred alignment
when hot pressed. The reason for the difference in texturing behavior is not clear,
however, it may have been an effect of either (a) the large number of needle-like particles
that may have influenced the packing of the plate-like particles or (b) the finer crystallite
size of the powders produced at lower pressures and in a He/NH 3 gas stream. The smaller
114
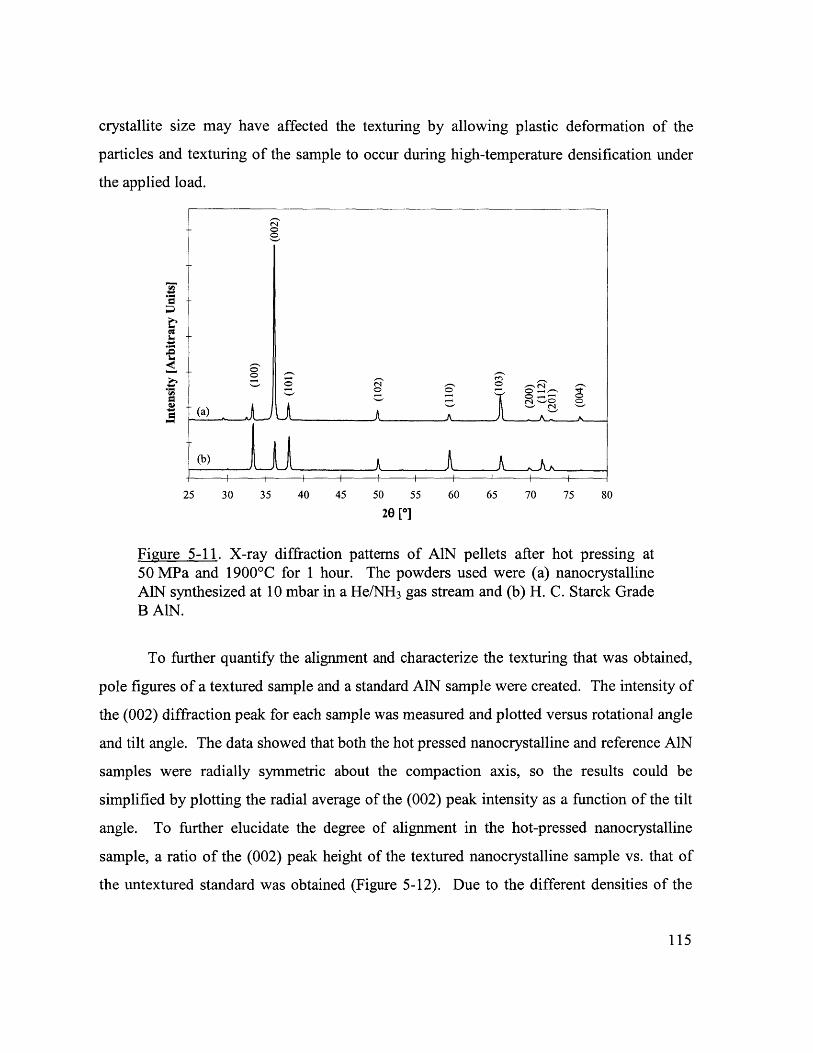
crystallite size may have affected the texturing by allowing plastic deformation of the
particles and texturing of the sample to occur during high-temperature densification under
the applied load.
(b))
25 30 35 40 45 50 55 60 65 70 75 80
20 [*0
Figure 5-11. X-ray diffraction patterns of AIN pellets after hot pressing at50 MPa and 1900'C for 1 hour. The powders used were (a) nanocrystallineAIN synthesized at 10 mbar in a He/NH3 gas stream and (b) H. C. Starck GradeB AIN.
To further quantify the alignment and characterize the texturing that was obtained,
pole figures of a textured sample and a standard AIN sample were created. The intensity of
the (002) diffraction peak for each sample was measured and plotted versus rotational angle
and tilt angle. The data showed that both the hot pressed nanocrystalline and reference AIN
samples were radially symmetric about the compaction axis, so the results could be
simplified by plotting the radial average of the (002) peak intensity as a function of the tilt
angle. To further elucidate the degree of alignment in the hot-pressed nanocrystalline
sample, a ratio of the (002) peak height of the textured nanocrystalline sample vs. that of
the untextured standard was obtained (Figure 5-12). Due to the different densities of the
115
textured and standard AIN samples, a different number of planes would diffract, making a
direct comparison of the X-ray counts incorrect. However, a ratio of their (002) peak
intensities should give an accurate representation of the relative degree of orientation of the
textured material. Figure 5-12 showed that a much larger fraction of the (002) diffraction
intensity was observed for the textured sample at higher tilt angles than for the standard.
These results confirmed that there was indeed a high degree of texturing along the (002)
direction, and that the texturing was symmetrically oriented about the compaction axis.
However, no electric response was detected from this sample when it was subjected to an
applied load. Since, the crystals in these samples were not perfectly textured, the
piezoelectric response was expected to be small. More samples would need to be examined
and additional research is necessary to determine whether extended heat treatments can
increase the degree of alignment as reported by Sandlin et al. for the SiC-seeded AlN
system [17], and whether sufficient alignment can be introduced to make the textured bulk
AlN attractive for piezoelectric devices.
7-
6
5-3
1--
0- I I I I I I I I
0 10 20 30 40 50 60 70 80 90
Tilt Angle 101
Figure 5-12. Ratio of the (002) XRD peak height in hot-pressed nanocrystallineAlN sample and that in an untextured AlN standard as a function of tilt angle.
116
5.4 Conclusions
The densification of the nanocrystalline AIN powders was evaluated as a function of
the synthesis conditions, sintering additives, and dopant levels. The nanocrystalline AIN
powders synthesized at low pressures in a He/NH 3 gas flow consisted of a large number of
needle-shaped particles, which were difficult to densify without using pressure-assisted
sintering. On the other hand, powders synthesized at 30 mbar in a N2/NH3 gas stream could
be pressurelessly sintered without additive to >95% of theoretical density by 1700'C.
Dopant effects were also examined, and it was found that for the nanocrystalline AlN
powders, nanocrystalline Y20 3 powders promoted low-temperature densification more than
microcrystalline Y20 3 dopants. Interestingly, nanocrystalline Y20 3 additives greatly
increased the densification of nanocrystalline AIN at temperatures significantly lower than
the expected onset of a bulk liquid phase. It was hypothesized that nanocrystalline Y20 3
acted as a grain boundary dopant and increased the diffusivity of the AlN, thereby
enhancing densification. Thermal conductivities of the densified samples were obtained by
laser flash thermal diffusivity measurements and, in the case of additive-free samples, were
found to be comparable to the best results reported in the literature for similarly processed
materials. The additive-free AlN samples attained a thermal conductivity of 72 W/m-K,
while the 4 wt% Y20 3-doped AlN sample achieved a thermal conductivity of 148 W/m-K.
An additional, very interesting result of this research was that the nanocrystalline powder
synthesized in a He/NH 3 gas stream, which consisted of many needle-shaped particles,
would produce a highly textured AlN material after hot pressing. This may be of interest
for high-temperature piezoelectric sensing applications.
5.5 References
[1] N. Hashimoto, H. Yoden, and S. Deki, "Sintering Behavior of Fine Aluminum
Nitride Powder Synthesized from Aluminum Polynuclear Complexes," J. Am.
Ceram. Soc., 75 [8] 2098-106 (1992).
117
[2] H. Buhr, G. Muller, H. Wiggers, F. Aldinger, P. Foley, and A. Roosen, "Phase
Composition, Oxygen Content, and Thermal Conductivity of AlN(Y20 3) Ceramics,"
J. Am. Ceram. Soc., 74 [4] 718-23 (1991).
[3] P. Sainz de Baranda, A. K. Knudsen, and E. Ruh, "Effect of Yttria on the Thermal
Conductivity of Aluminum Nitride," J. Am. Ceram. Soc., 77 [7] 1846-50 (1994).
[4] Y. Kurokawa, K. Utsumi, and H. Takamizawa, "Development and Microstructural
Characterization of High-Thermal-Conductivity Aluminum Nitride Ceramics," J.
Am. Ceram. Soc., 71 [7] 588-94 (1988).
[5] M. D. Fokema and J. Y. Ying, "The Selective Catalytic Reduction of Nitric Oxide
with Methane over Scandium Oxide, Yttrium Oxide and Lanthanum Oxide," Appl.
Catal. B: Environ., 18 [1-2] 71-77 (1998).
[6] M. Sternitzke and G. MUller, "EELS Study of Oxygen Diffusion in Aluminum
Nitride," J. Am. Ceram. Soc., 77 [3] 737-42 (1994).
[7] H. Solmon, D. Robinson, and R. Dieckmann, "Oxygen Transport in Aluminum
Nitride Substrates," J. Am. Ceram. Soc., 77 [11] 2841-48 (1994).
[8] J. H. Enloe, R. W. Rice, J. W. Lau, R. Kumar, and S. Y. Lee, "Microstructural
Effects on the Thermal Conductivity of Polycrystalline Aluminum Nitride," J Am.
Ceram. Soc., 74 [9] 2214-19 (1991).
[9] G. A. Slack, "Nonmetallic Crystals with High Thermal Conductivity," J. Phys.
Chem. Solids, 34, 321-35 (1973).
[10] M. Hirano, K. Kato, T. Isobe, and T. Hirano, "Sintering and Characterization of
Fully Dense Aluminum Nitride Ceramics," J. Mater. Sci., 28 [17] 4725-30 (1993).
[11] A. Virkar, T. B. Jackson, and R. A. Cutler, "Thermodynamic and Kinetic Effects of
Oxygen Removal on the Thermal Conductivity of Aluminum Nitride," J. Am.
Ceram. Soc., 72 [11] 2031-42 (1989).
[12] K. Watari, M. Kawamoto, and K. Ishizaki, "Sintering and Chemical Reactions to
Increase Thermal Conductivity of Aluminum Nitride," J. Mater. Sci., 26, 4727-32
(1991).
118
[13] R. C. Turner, P. A. Fuierer, R. E. Newnham, and T. R. Shrout, "Materials for High
Temperature Acoustic and Vibration Sensors: A Review," Appl. Acoustics, 41 [4]
299-324 (1994).
[14] L. Zheng, S. Ramalingam, T. Shi, and R. L. Peterson, "Aluminum Nitride Thin Film
Sensor for Force, Acceleration, and Acoustic Emission Sensing," J Vac. Sci.
Technol. A, 11 [5] 2437-46 (1993).
[15] M. Akiyama, K. Nonaka, K. Shobu, and T. Watanabe, "Crystal Orientation and
Piezoelectricity of AlN Thin Films Prepared on Polycrystalline Substrates," J.
Ceram. Soc. Jpn., Int. Ed., 103, 1084-86 (1995).
[16] C.-C. Cheng, Y.-C. Chen, H.-J. Wang, and W.-R. Chen, "Morphology and Structure
of Aluminum Nitride Thin Films on Glass Substrates," Jpn. J. AppL. Phys., 35,
1880-85 (1996).
[17] M. S. Sandlin, K. J. Bowman, and J. Root, "Texture Development in SiC-Seeded
AlN," Acta. Mater., 45 [1] 383-96 (1997).
119
6. Conclusions
This thesis focused on improving the densification of two very different materials
through the use of nanocrystalline processing. The first part of this thesis described how
high-energy ball milling affected the phase transformation kinetics, densification, and
microstructure of nanocrystalline alumina. Although nanocrystalline transitional aluminas
are readily synthesized, they are usually difficult to densify due to the effects of phase
transformation on grain size and porosity. Through high-energy ball milling, the nucleation
density was greatly increased and a much more sinterable powder was achieved. The high-
energy ball milling reduced the phase transformation temperature by >250'C, decreased the
time required for transformation, and lowered the apparent activation energy for the
transformation to 333 kJ/mol. The reliability of the Johnson-Mehl-Avrami-Kolmogorov
(JMAK) kinetic analysis was examined by creating a finite particle model and analyzing the
kinetics of the phase transformation as a function of particle size under both heterogeneous
and homogeneous nucleation conditions. The JMAK results were found to be reliable even
at small particle sizes (0.1 pm) when high seed densities (-1013 seeds/cm 3) were present in
the system. Hot-pressed pellets from high-energy ball milled powders had a microstructure
that was considerably different from that made from unmilled powders, and this difference
was attributed to the increased nucleation density from milling. After low-temperature
densification, pellets from milled powders consisted of dense and discrete grains with the
porosity at the grain boundaries, where it could be easily removed during the final stages of
densification.
The second part of this thesis focused on the synthesis and air-free processing of
nanocrystalline AlN. Through the use of a forced-flow reactor, nanocrystalline AlN with
crystallite sizes of 10-100 nm and surface areas of 45-370 m2/g could be produced.
Although the nanocrystalline AlN powders were highly moisture-sensitive (as shown by
PA-FTIR studies), they could be processed and handled without exposure to air, thereby
keeping the oxygen content as low as 0.6 wt% in fully dense samples. These powders
showed excellent sinterability, achieving >95% of theoretical density after pressureless
120
sintering at 1700'C for 2 hours. The use of a high surface area Y20 3 powder as a sintering
aid allowed comparable densities to be attained at a lower sintering temperature of
~15500C. These findings compared very well to the best sintering results on AlN reported
in the literature. The thermal conductivities of the densified pellets corresponded well to
the best results in the literature attained under similar sintering conditions. Further
improvements in thermal conductivity could be achieved by annealing at high temperatures
and for extended periods in a highly reducing atmosphere for removal of trace oxygen in the
AlN lattice. An additional noteworthy result was that powders produced at low reactor
pressures in a He/NH 3 gas stream tended to form highly textured (002) pellets after hot
pressing at 19000C. Texturing of bulk, polycrystalline AlN is usually very difficult to
achieve; hot pressing nanocrystalline AIN powders that contain needle-like particles may
provide a new method for manufacturing high-temperature piezoelectric sensors.
121