
Hydrometeorological Prediction Center 2007 Revie Prediction Center 2007 Review Michael J. Brennan...
37
Hydrometeorological Prediction Center Hydrometeorological Prediction Center 2007 Review 2007 Review Michael J. Brennan Science and Operations Officer 2007 NCEP Production Review Meeting 11 December 2007
Transcript of Hydrometeorological Prediction Center 2007 Revie Prediction Center 2007 Review Michael J. Brennan...

Hydrometeorological Prediction Center Hydrometeorological Prediction Center 2007 Review2007 Review
Michael J. BrennanScience and Operations Officer
2007 NCEP Production Review Meeting11 December 2007
OutlineOutline
• Model performance from HPC perspective• HPC observed model biases• Evaluation of recent NCEP model
upgrades• Other HPC notes

FY07 QPF FY07 QPF –– D1 Threat ScoreD1 Threat ScoreHPC vs. NAM/GFSHPC vs. NAM/GFS
FY07 Threat Score
0
0.05
0.1
0.15
0.2
0.25
0.3
0.35
0.4
0.45
0.5 1 2 3 4
Inches
NAMGFSHPC
HPC shows largest improvement in skill over the NAM for all threshold values

FY07 QPF FY07 QPF –– D1 BiasD1 BiasHPC vs. NAM/GFSHPC vs. NAM/GFS
FY07 Bias
0
0.2
0.4
0.6
0.8
1
1.2
1.4
0.5 1 2 3 4
Inches
NAMGFSHPC
NAM has large low bias for high precip amounts, while GFS has slight high bias
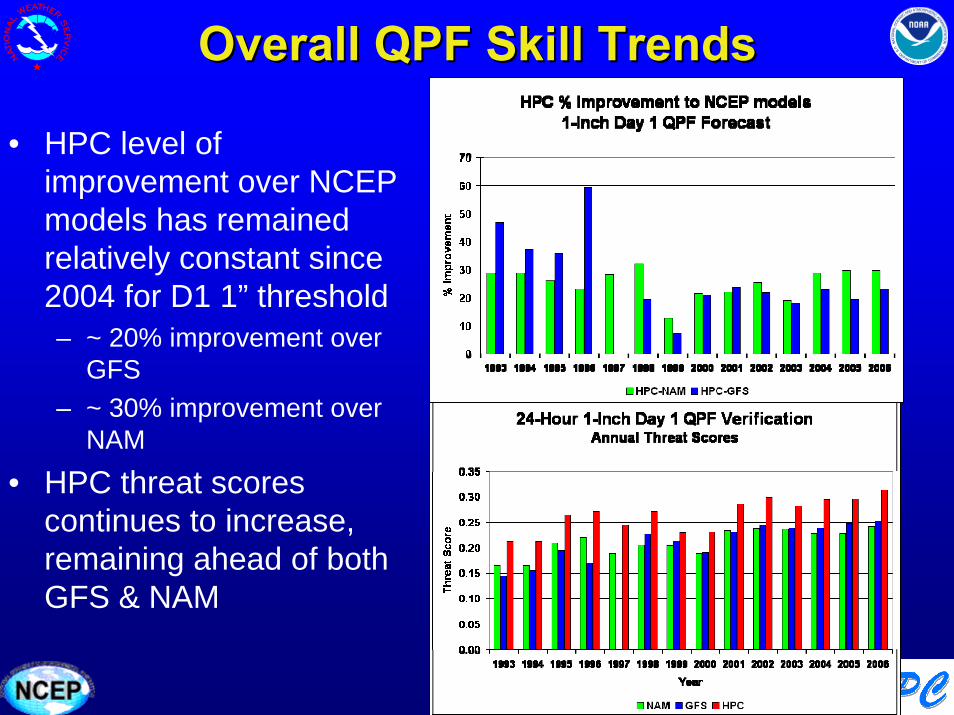
Overall QPF Skill TrendsOverall QPF Skill Trends
• HPC level of improvement over NCEP models has remained relatively constant since 2004 for D1 1” threshold– ~ 20% improvement over
GFS– ~ 30% improvement over
NAM
• HPC threat scores continues to increase, remaining ahead of both GFS & NAM
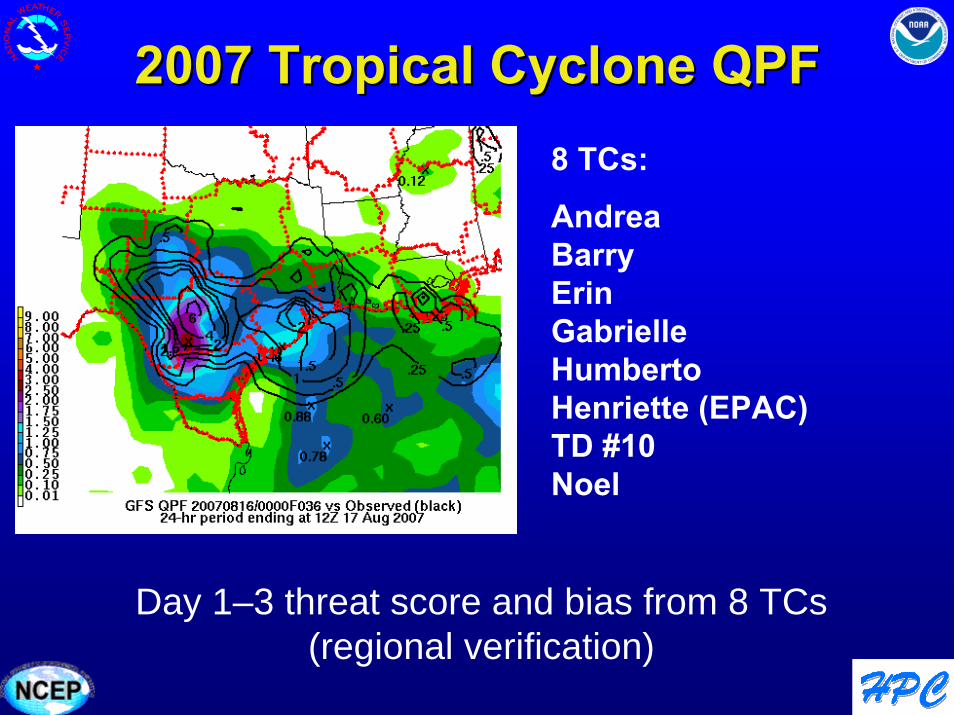
2007 Tropical Cyclone QPF2007 Tropical Cyclone QPF
Day 1–3 threat score and bias from 8 TCs (regional verification)
8 TCs:
AndreaBarryErinGabrielleHumbertoHenriette (EPAC)TD #10Noel
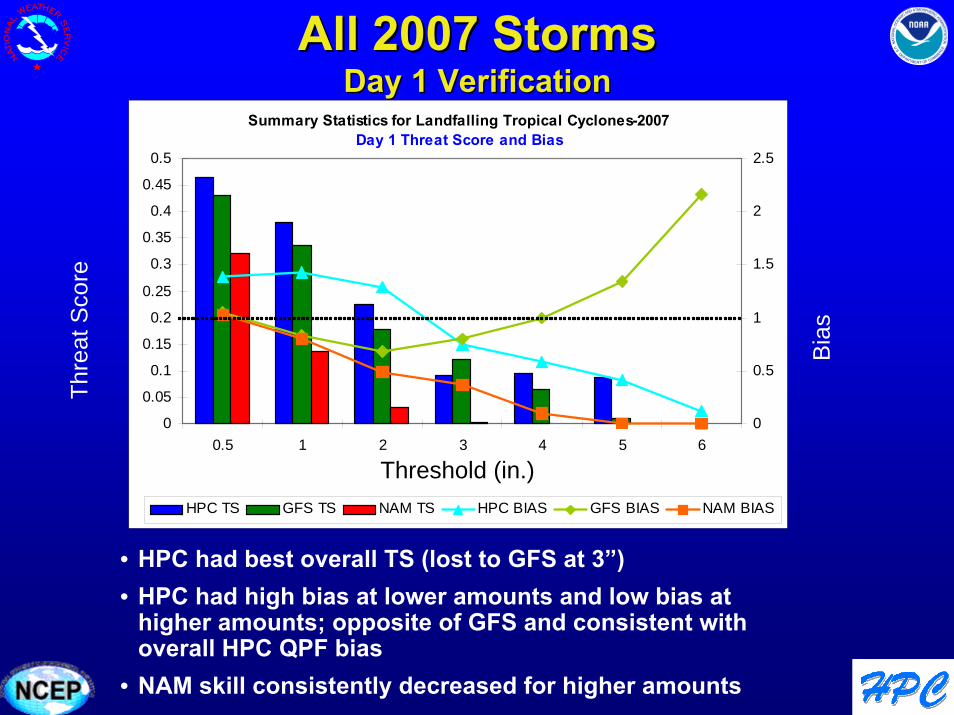
All 2007 StormsAll 2007 StormsDay 1 VerificationDay 1 Verification
• HPC had best overall TS (lost to GFS at 3”)• HPC had high bias at lower amounts and low bias at
higher amounts; opposite of GFS and consistent with overall HPC QPF bias
• NAM skill consistently decreased for higher amounts
Thre
at S
core
Bia
s
Summary Statistics for Landfalling Tropical Cyclones-2007Day 1 Threat Score and Bias
0
0.05
0.1
0.15
0.2
0.25
0.3
0.35
0.4
0.45
0.5
0.5 1 2 3 4 5 60
0.5
1
1.5
2
2.5
HPC TS GFS TS NAM TS HPC BIAS GFS BIAS NAM BIAS
Threshold (in.)
All 2007 StormsAll 2007 StormsDay 2 VerificationDay 2 Verification
Bia
s
Thre
at S
core
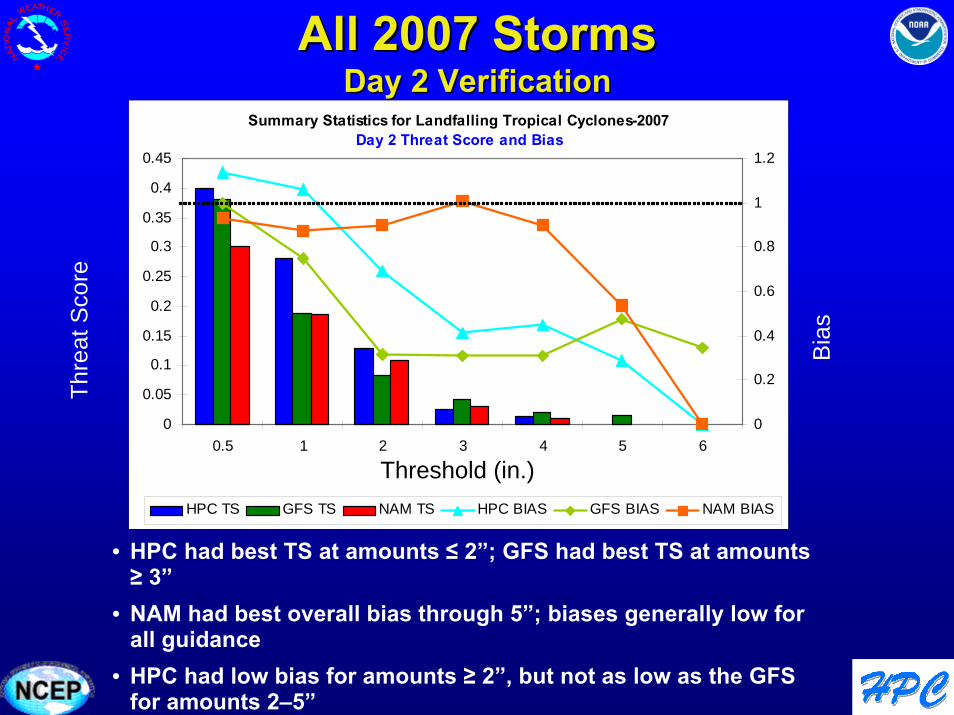
• HPC had best TS at amounts ≤ 2”; GFS had best TS at amounts ≥ 3”
• NAM had best overall bias through 5”; biases generally low for all guidance
• HPC had low bias for amounts ≥ 2”, but not as low as the GFS for amounts 2–5”
Summary Statistics for Landfalling Tropical Cyclones-2007Day 2 Threat Score and Bias
0
0.05
0.1
0.15
0.2
0.25
0.3
0.35
0.4
0.45
0.5 1 2 3 4 5 60
0.2
0.4
0.6
0.8
1
1.2
HPC TS GFS TS NAM TS HPC BIAS GFS BIAS NAM BIAS
Threshold (in.)
All 2007 StormsAll 2007 StormsDay 3 VerificationDay 3 Verification
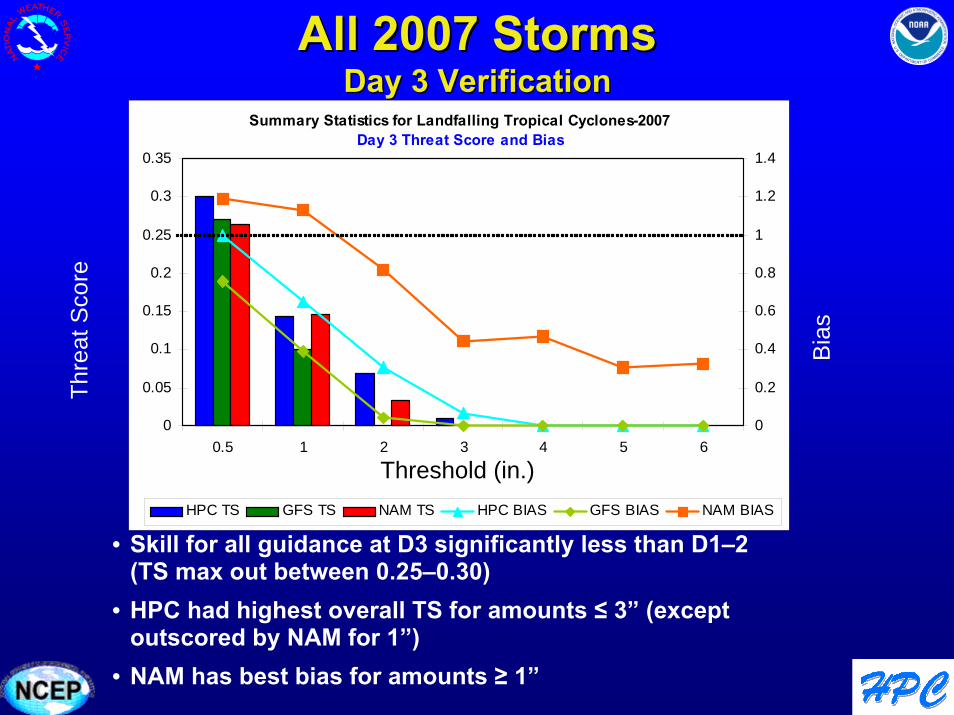
• Skill for all guidance at D3 significantly less than D1–2 (TS max out between 0.25–0.30)
• HPC had highest overall TS for amounts ≤ 3” (except outscored by NAM for 1”)
• NAM has best bias for amounts ≥ 1”
Thre
at S
core
Bia
s
Summary Statistics for Landfalling Tropical Cyclones-2007Day 3 Threat Score and Bias
0
0.05
0.1
0.15
0.2
0.25
0.3
0.35
0.5 1 2 3 4 5 60
0.2
0.4
0.6
0.8
1
1.2
1.4
HPC TS GFS TS NAM TS HPC BIAS GFS BIAS NAM BIAS
Threshold (in.)

TS ErinTS Erin2424--hrs ending 12Z 17 Aug.hrs ending 12Z 17 Aug.
HPCHPC
NAMNAM
GFSGFS
•D1 QPF (shaded)
•Observed rainfall (contours)
•GFS greatly under-forecast amounts along track of Erin, but does take max. rainfall inland along track
•NAM has amounts too high along the coast but completely misses inland max
QPF factor of 3 too low
Missing inland precip max
TC QPF OverviewTC QPF Overview• HPC QPF best for TCs that produced heaviest,
most widespread precipitation– HPC TS showed largest overall improvement over the
models for Erin – HPC showed most improvement over the guidance for
heavier amounts (4”–5”) on D1• GFS (NAM) performed best on D1 (D3)• All forecasts showed large drop in skill D3
compared to D1–2• GFS TS higher than ECMWF for all amounts D2
and for D1 amounts > 1”
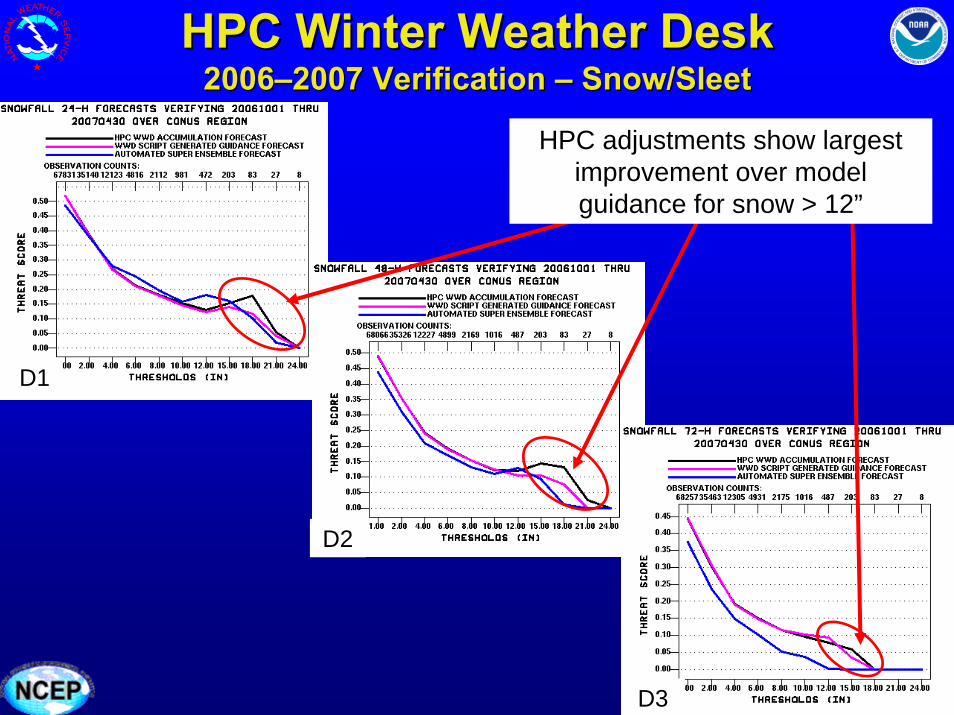
HPC Winter Weather DeskHPC Winter Weather Desk20062006––2007 Verification 2007 Verification –– Snow/SleetSnow/Sleet
D1
D2
D3
HPC adjustments show largest improvement over model guidance for snow > 12”
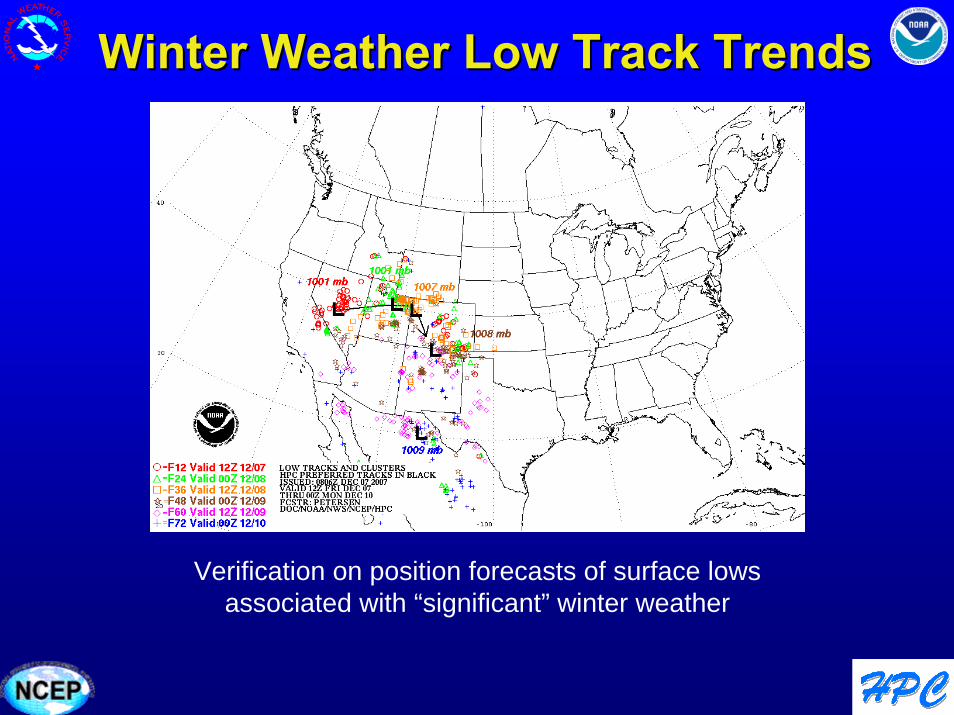
Winter Weather Low Track TrendsWinter Weather Low Track Trends
Verification on position forecasts of surface lows associated with “significant” winter weather

24-h Winter Weather Low Track RMSE Trend
0
20
40
60
80
100
120
140
160
180
200
2004-2005 2005-2006 2006-2007
Year
RM
SE (n
m)
HPCGFSNAMGFS+NAMGEFS MEANSREF MEAN
Winter Weather Low TracksWinter Weather Low Tracks2424--h RMSE Trendh RMSE Trend
GFS/NAM blend has smallest RMSE at F24
48-h Winter Weather Low Track RMSE Trend
0
20
40
60
80
100
120
140
160
180
200
2004-2005 2005-2006 2006-2007
Year
RM
SE (n
m)
HPCGFSNAMGFS+NAMGEFS MEANSREF MEAN
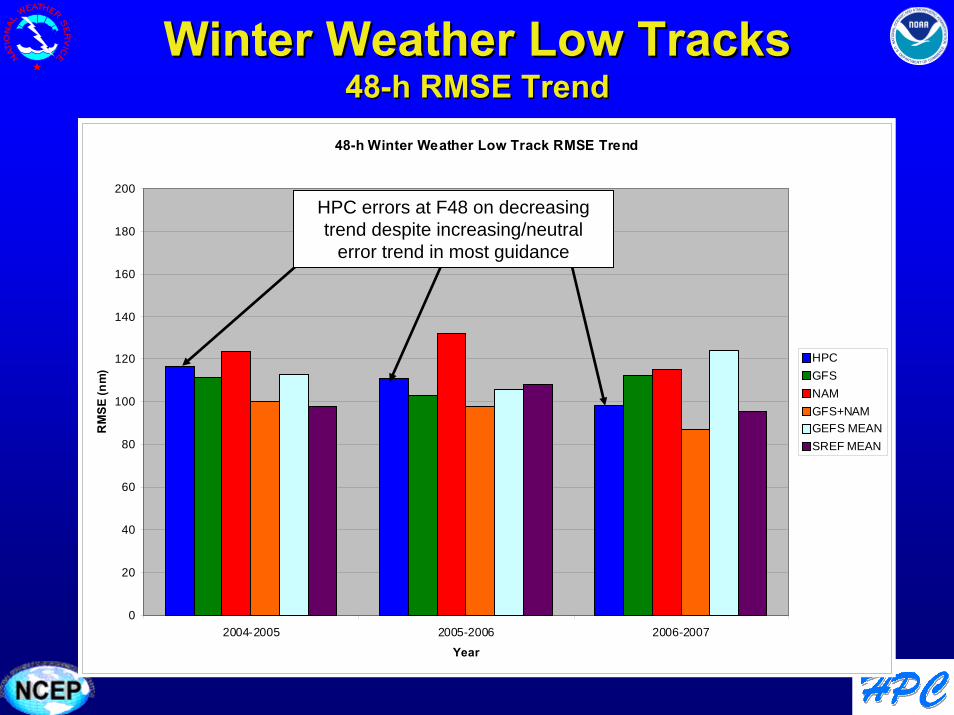
Winter Weather Low TracksWinter Weather Low Tracks4848--h RMSE Trendh RMSE Trend
HPC errors at F48 on decreasing trend despite increasing/neutral
error trend in most guidance
72-h Winter Weather Low Track RMSE Trend
0
20
40
60
80
100
120
140
160
180
200
2004-2005 2005-2006 2006-2007
Year
RM
SE (n
m)
HPCGFSNAMGFS+NAMGEFS MEANSREF MEAN
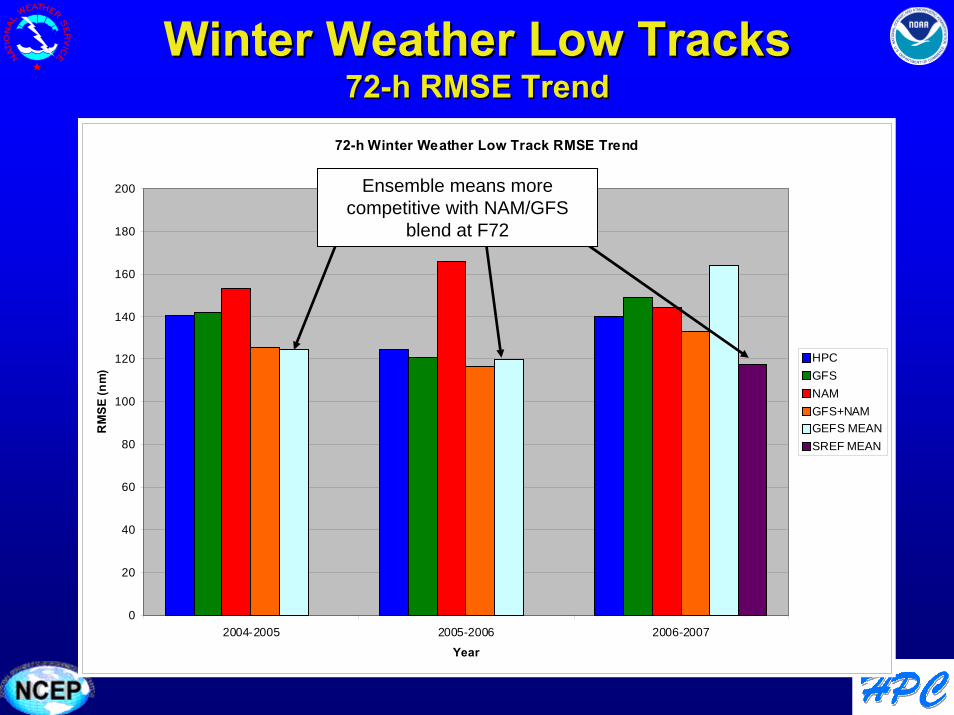
Winter Weather Low TracksWinter Weather Low Tracks7272--h RMSE Trendh RMSE Trend
Ensemble means more competitive with NAM/GFS
blend at F72
Winter Weather Low TrackWinter Weather Low Track
• Simple NAM/GFS blend continues to outperform ensemble means, particularly on D1-2
• SREF mean appears to have best skill at D3, however only available for one year of verification
• HPC has shown most improvement on D2 over the past 3 years

HPC Observed Model BiasesHPC Observed Model Biases
Observed Model BiasesObserved Model BiasesHPC Model Diagnostic DeskHPC Model Diagnostic Desk
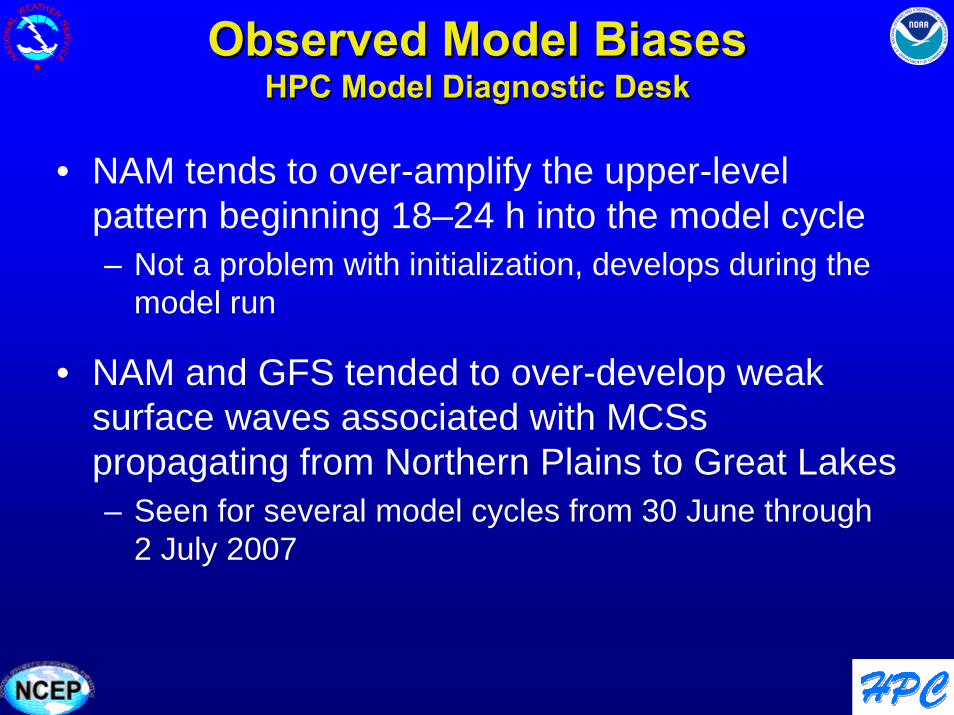
• NAM tends to over-amplify the upper-level pattern beginning 18–24 h into the model cycle– Not a problem with initialization, develops during the
model run
• NAM and GFS tended to over-develop weak surface waves associated with MCSspropagating from Northern Plains to Great Lakes– Seen for several model cycles from 30 June through
2 July 2007

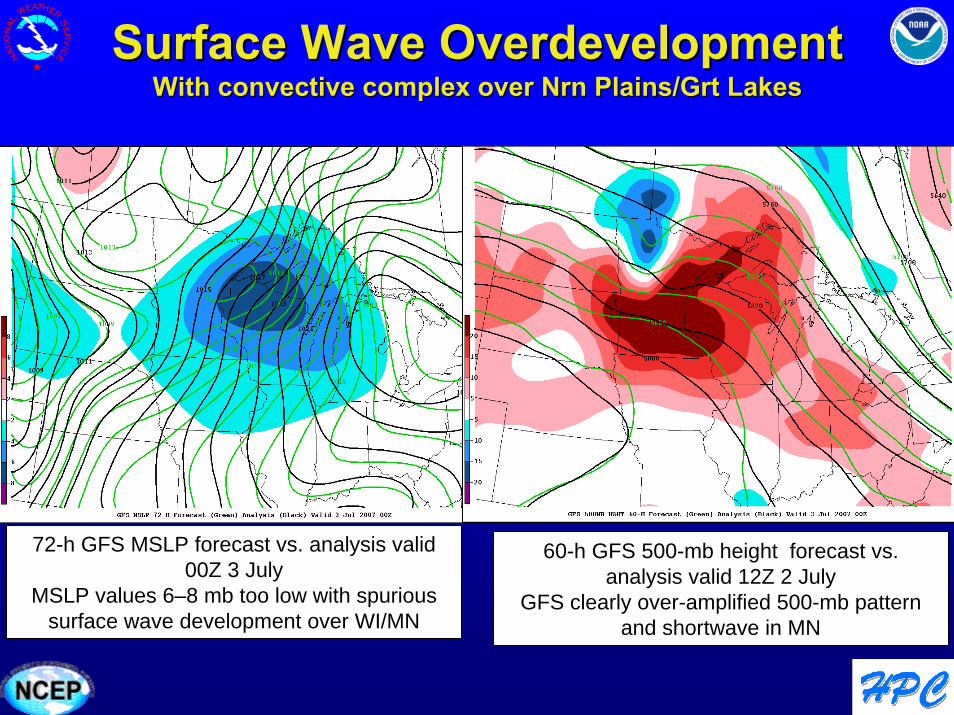
Surface Wave OverdevelopmentSurface Wave OverdevelopmentWith convective complex over With convective complex over NrnNrn Plains/Plains/GrtGrt LakesLakes
06Z 2 July 12Z 2 July
18Z 2 July 00Z 3 July
Surface Wave OverdevelopmentSurface Wave OverdevelopmentWith convective complex over With convective complex over NrnNrn Plains/Plains/GrtGrt LakesLakes
72-h GFS MSLP forecast vs. analysis valid 00Z 3 July
MSLP values 6–8 mb too low with spurious surface wave development over WI/MN
60-h GFS 500-mb height forecast vs. analysis valid 12Z 2 July
GFS clearly over-amplified 500-mb pattern and shortwave in MN

Surface Wave OverdevelopmentSurface Wave OverdevelopmentWith convective complex over With convective complex over NrnNrn Plains/Plains/GrtGrt LakesLakes
GFS forecast MSLP values 6–8 mb too low with spurious surface wave development over
WI/MN
Overdevelopment continued with next model cycleand also seen in NAM 48-h forecast vs. analysis valid 00Z 3 JulySREF mean was preferred solution, supported by ECMWF and
Canadian
NAM shows closed low and MSLP values > 8 mb too low over WI/MN
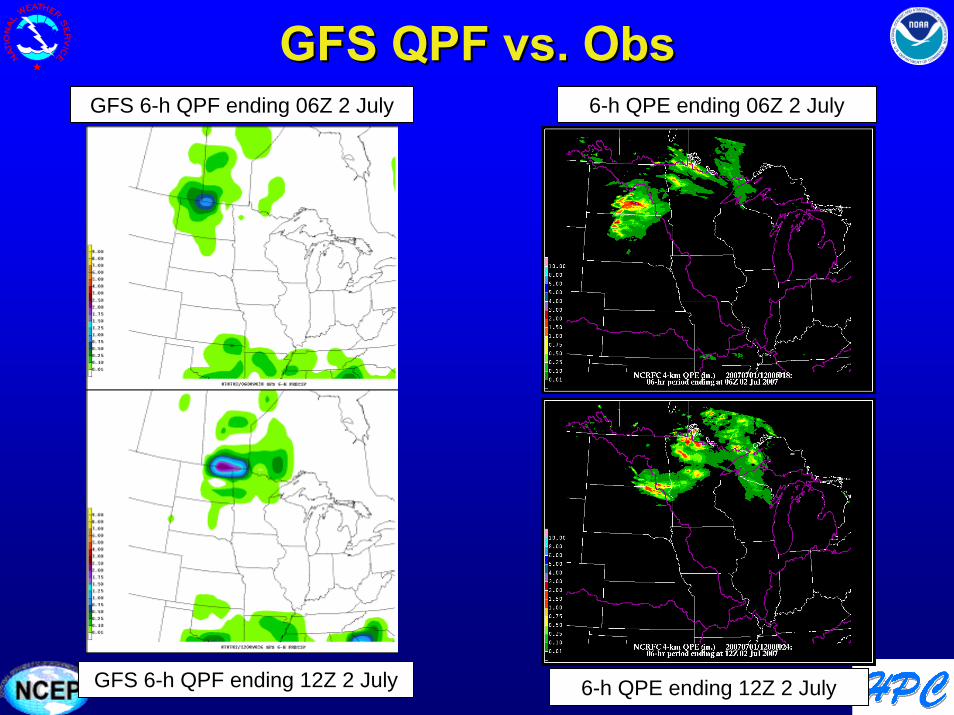
GFS QPF vs. GFS QPF vs. ObsObsGFS 6-h QPF ending 06Z 2 July 6-h QPE ending 06Z 2 July
GFS 6-h QPF ending 12Z 2 July 6-h QPE ending 12Z 2 July
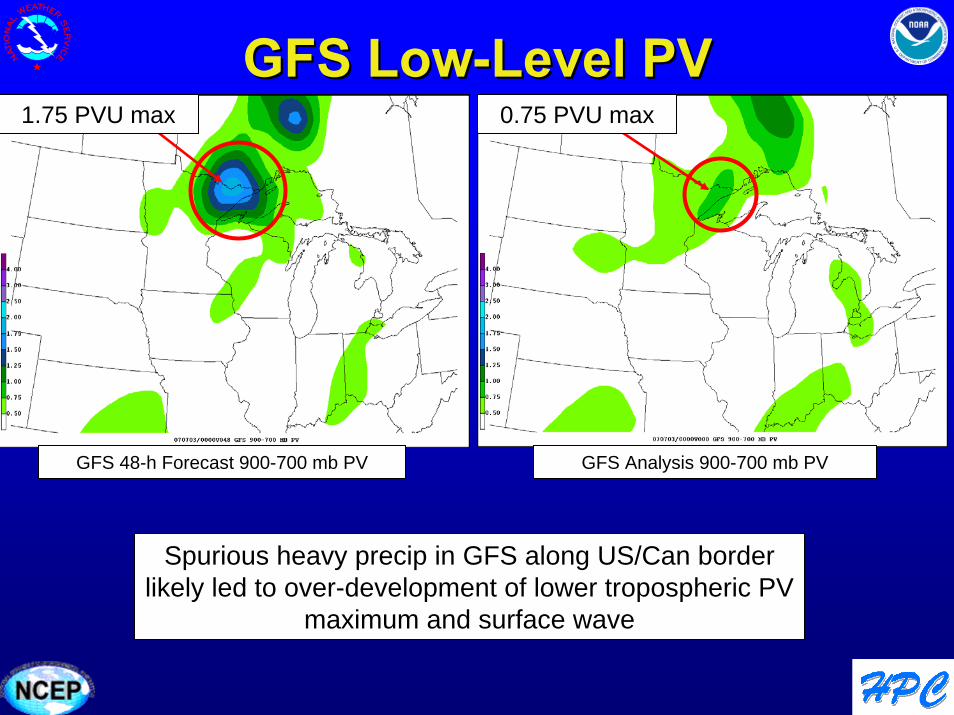
GFS LowGFS Low--Level PVLevel PV
GFS 48-h Forecast 900-700 mb PV GFS Analysis 900-700 mb PV
Spurious heavy precip in GFS along US/Can border likely led to over-development of lower tropospheric PV
maximum and surface wave
1.75 PVU max 0.75 PVU max
Observed Model BiasesObserved Model BiasesHPC QPF DeskHPC QPF Desk
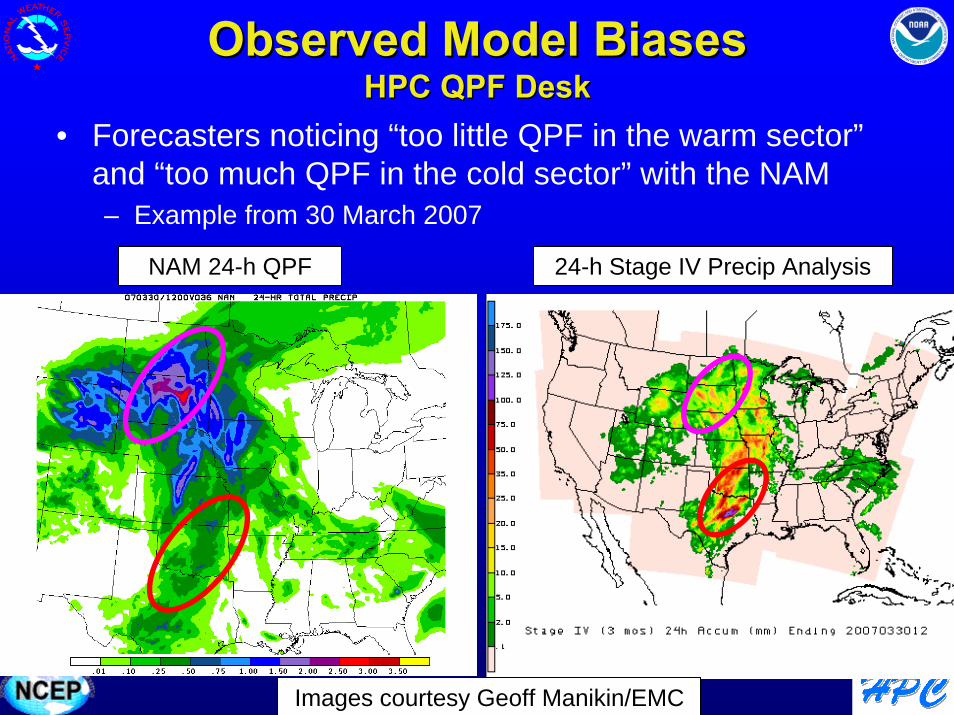
• Forecasters noticing “too little QPF in the warm sector”and “too much QPF in the cold sector” with the NAM– Example from 30 March 2007
NAM 24-h QPF 24-h Stage IV Precip Analysis
Images courtesy Geoff Manikin/EMC
Observed Model BiasesObserved Model BiasesHPC Winter Weather DeskHPC Winter Weather Desk
• Model Temperatures– GFS has persistent cold bias in 850–700-mb
layer• East of a cyclone with southerly flow component,
model too slow to warm inversion layer– NAM better at resolving inversions in the
850–700-mb layer
• NCEP dominant p-type algorithm output favors ZR in isothermal near freezing soundings– Tie breaking rules tend toward ZR
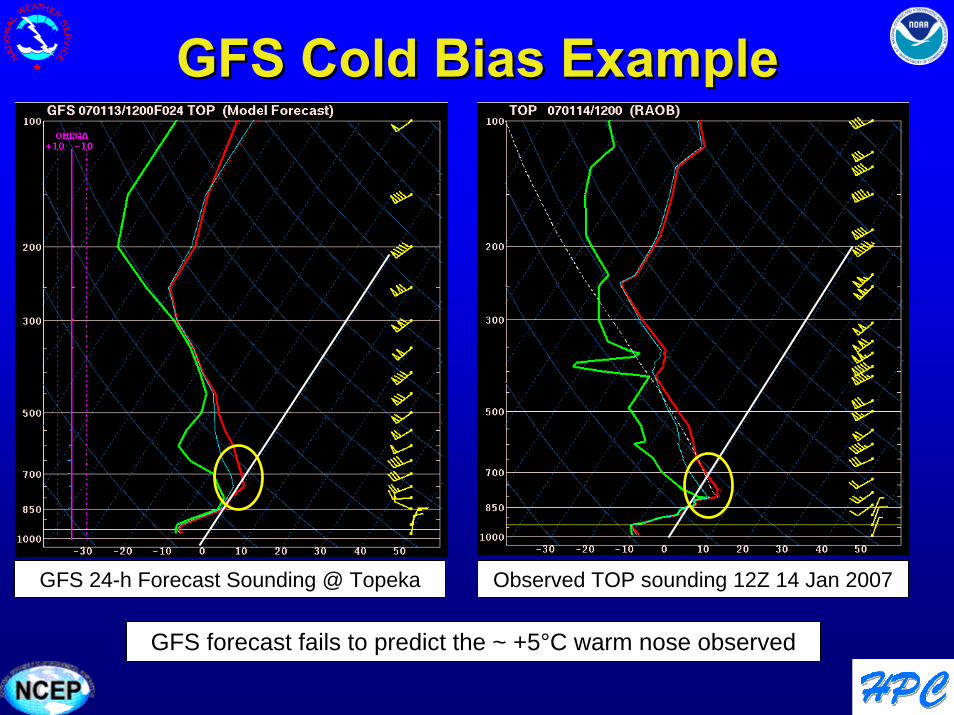
GFS Cold Bias ExampleGFS Cold Bias Example
GFS 24-h Forecast Sounding @ Topeka Observed TOP sounding 12Z 14 Jan 2007
GFS forecast fails to predict the ~ +5°C warm nose observed
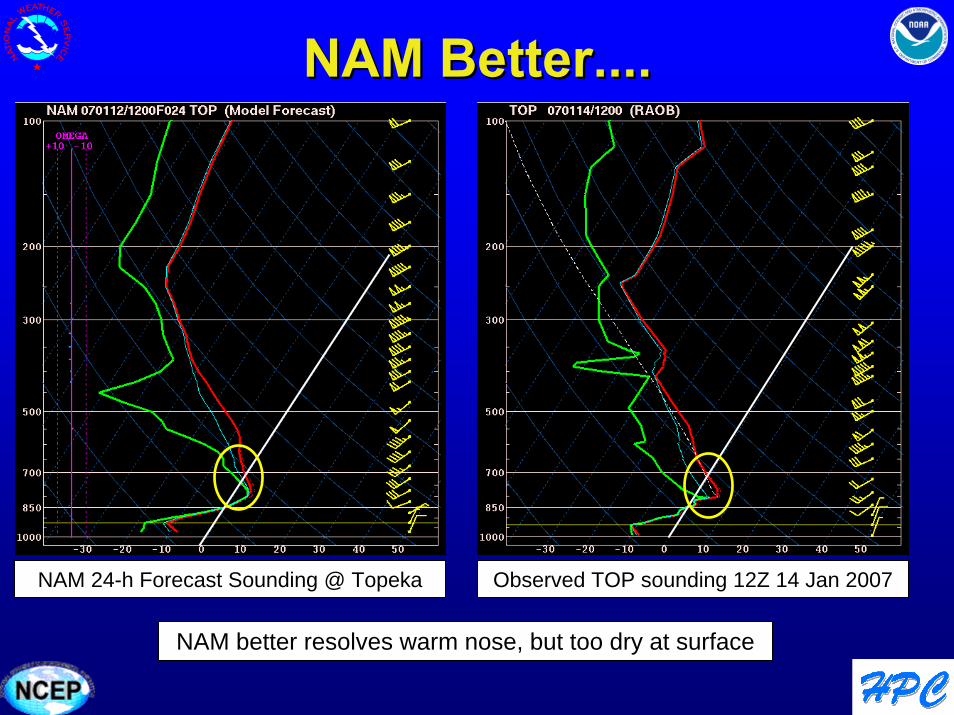
NAM Better....NAM Better....
Observed TOP sounding 12Z 14 Jan 2007NAM 24-h Forecast Sounding @ Topeka
NAM better resolves warm nose, but too dry at surface

HPC Evaluation of New HPC Evaluation of New ImplementationsImplementations

NAEFS ImplementationNAEFS Implementation• HPC evaluation addition of
Canadian members has somewhat alleviated issue of GEFS trending too close to GFS
• Additional uncertainty information (e.g., percentile probabilities, mode, etc.) and availability of downscaled temperature information could have large positive impact on medium range forecasting
• Still concerns about performance of bias correction in rapidly changing flow regimes
• Would like to see more verification of bias correction on NAEFS – how much is it helping (hurting)?
•NAEFS ensemble mean forecast from 00Z 31 October showed ET version of Noel tracking farther west than GEFS ensemble mean
•Closer to the eventual track as cyclone passed east of New England
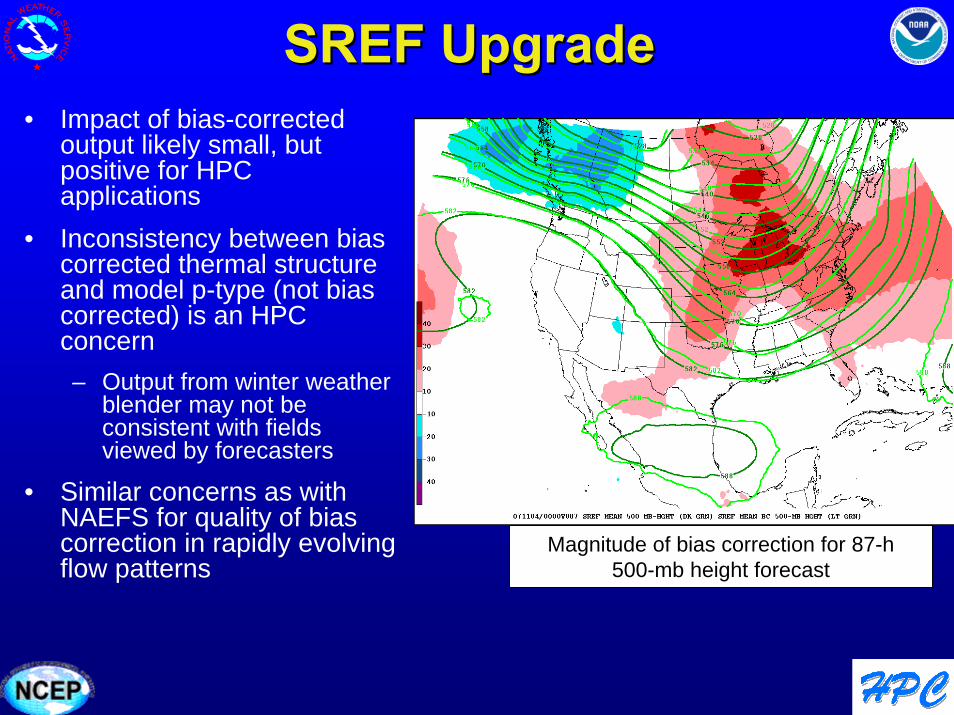
SREF UpgradeSREF Upgrade• Impact of bias-corrected
output likely small, but positive for HPC applications
• Inconsistency between bias corrected thermal structure and model p-type (not bias corrected) is an HPC concern– Output from winter weather
blender may not be consistent with fields viewed by forecasters
• Similar concerns as with NAEFS for quality of bias correction in rapidly evolving flow patterns
SREF Mean BC 500-mb hght (magenta)
SREF Mean 500-mb hght (red)
Magnitude of bias correction for 87-h 500-mb height forecast

Other HPC NotesOther HPC Notes
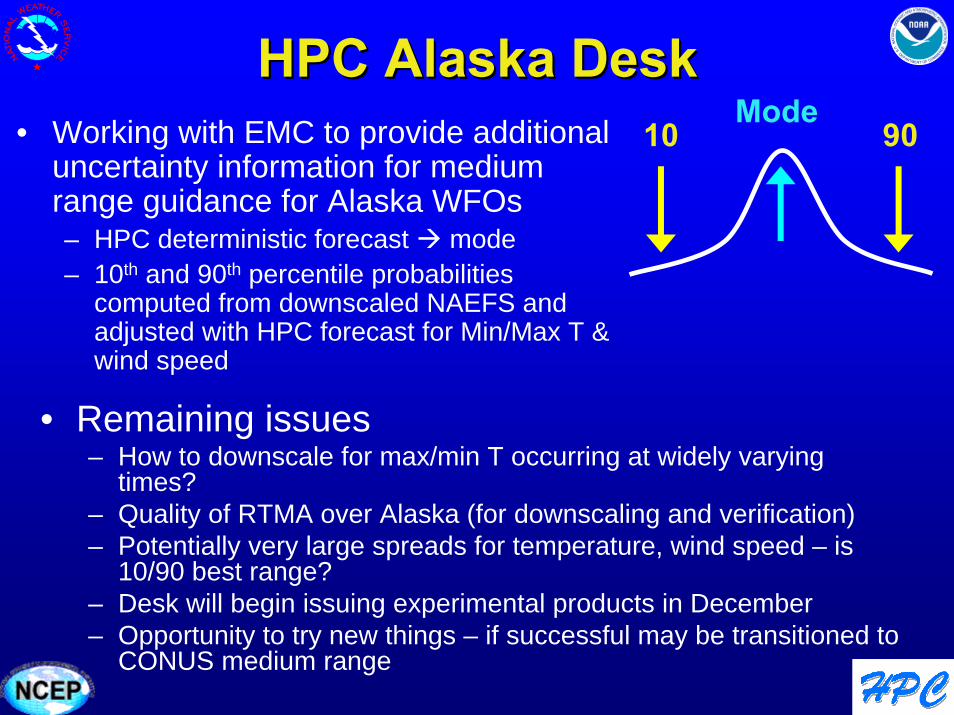
HPC Alaska DeskHPC Alaska Desk• Working with EMC to provide additional
uncertainty information for medium range guidance for Alaska WFOs– HPC deterministic forecast mode– 10th and 90th percentile probabilities
computed from downscaled NAEFS and adjusted with HPC forecast for Min/Max T & wind speed
9010Mode
• Remaining issues – How to downscale for max/min T occurring at widely varying
times?– Quality of RTMA over Alaska (for downscaling and verification)– Potentially very large spreads for temperature, wind speed – is
10/90 best range?– Desk will begin issuing experimental products in December– Opportunity to try new things – if successful may be transitioned to
CONUS medium range
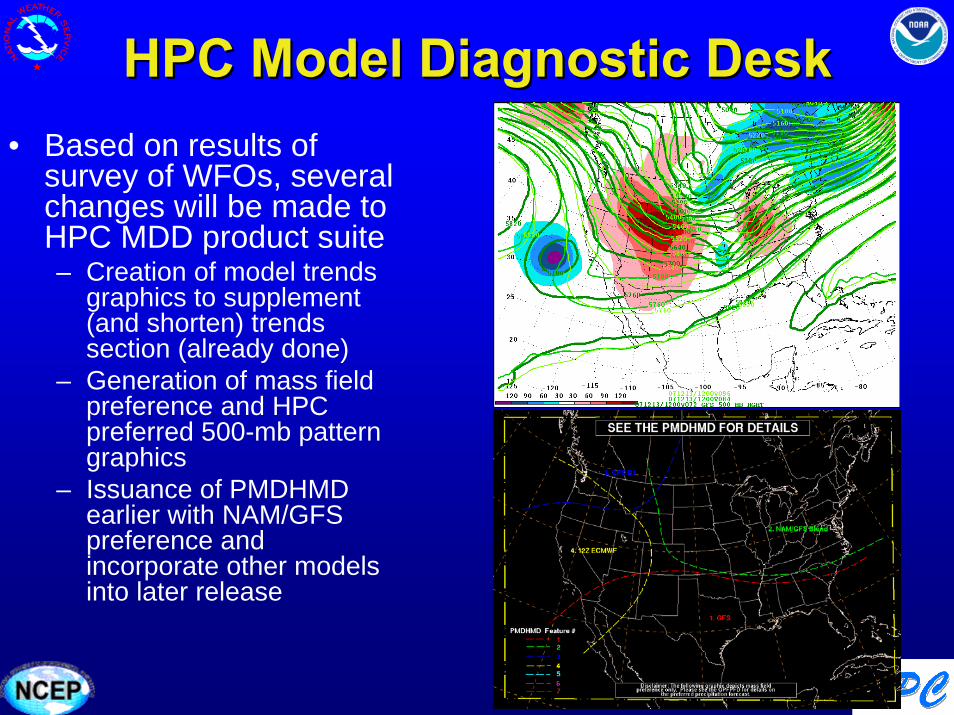
HPC Model Diagnostic DeskHPC Model Diagnostic Desk• Based on results of
survey of WFOs, several changes will be made to HPC MDD product suite– Creation of model trends
graphics to supplement (and shorten) trends section (already done)
– Generation of mass field preference and HPC preferred 500-mb pattern graphics
– Issuance of PMDHMD earlier with NAM/GFS preference and incorporate other models into later release
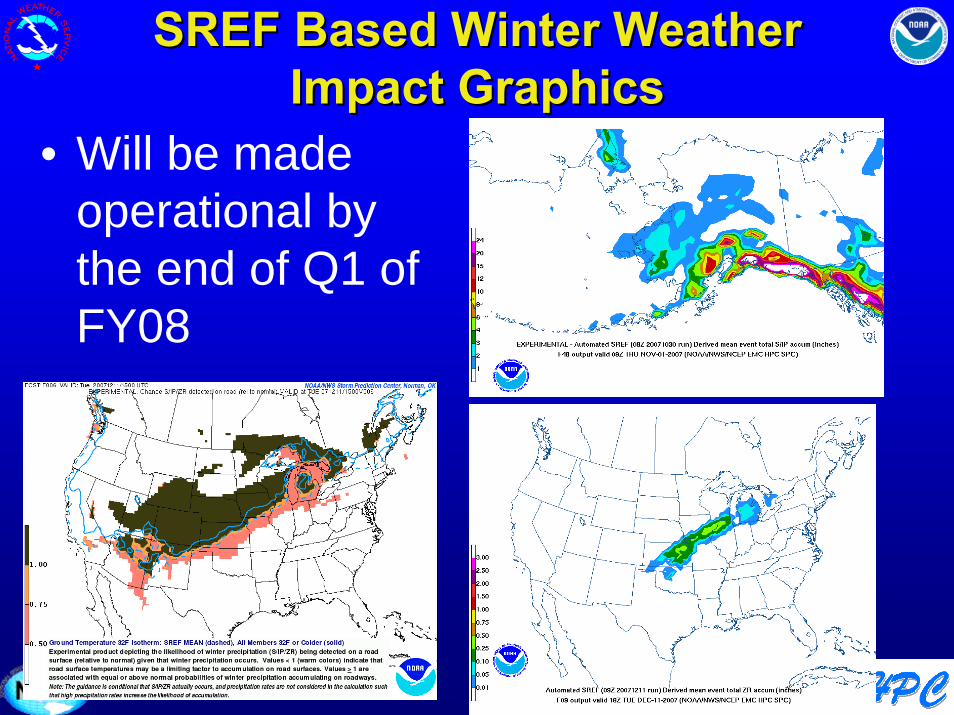
SREF Based Winter Weather SREF Based Winter Weather Impact GraphicsImpact Graphics
• Will be made operational by the end of Q1 of FY08
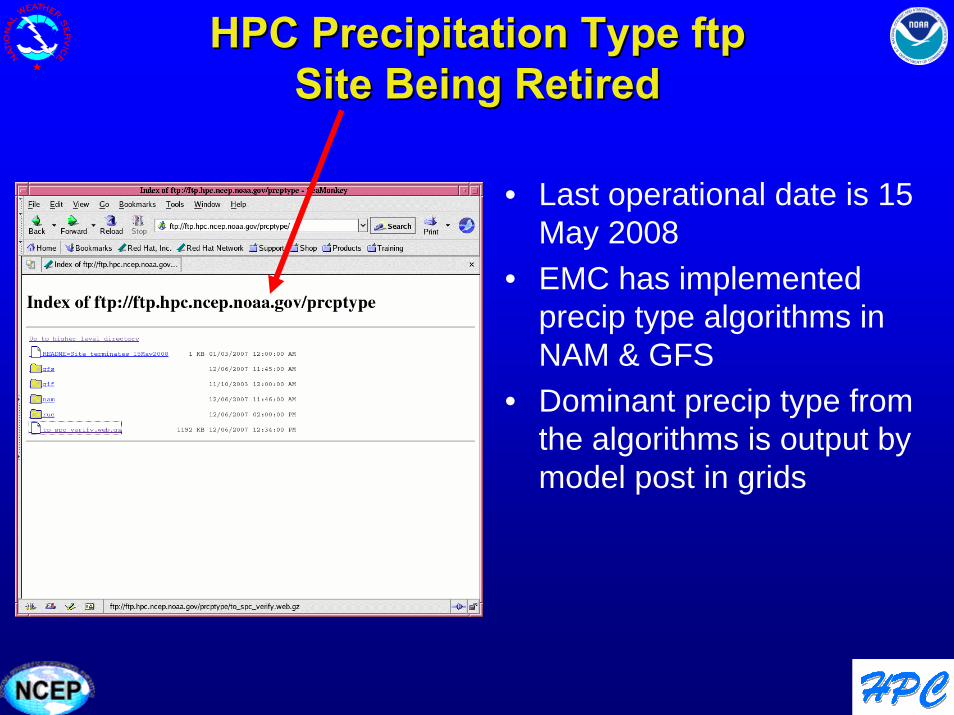
HPC Precipitation Type ftp HPC Precipitation Type ftp Site Being RetiredSite Being Retired
• Last operational date is 15 May 2008
• EMC has implemented precip type algorithms in NAM & GFS
• Dominant precip type from the algorithms is output by model post in grids
AcknowledgementsAcknowledgements
• Mark Klein• Jessica Clark• Mike Eckert• Joshua Scheck• Marty Rausch• Dan Petersen• Keith Brill


![[PPT]The Hydrometeorological Prediction Center: Activities, · Web viewEXPLORING THE USE OF CONVECTIVE ALLOWING GUIDANCE TO IMPROVE WARM SEASON QUANTITATIVE PRECIPITATION FORECASTS](https://static.fdocuments.net/doc/165x107/5aa2b4ac7f8b9a80378d5212/pptthe-hydrometeorological-prediction-center-activities-viewexploring-the.jpg)