
HYDROGEOLOGY OF THE PORT OF BALTIMORE CONFINED … · Anne Arundel County Dorsey Road well field to...
47
Maryland Department of Natural Resources Resource Assessment Service MARYLAND GEOLOGICAL SURVEY Richard A. Ortt, Jr., Director OPEN-FILE REPORT NO. 14-02-01 HYDROGEOLOGY OF THE PORT OF BALTIMORE CONFINED AQUATIC DISPOSAL PILOT PROJECT AREA, MASONVILLE, MARYLAND by David C. Andreasen, Lindsay Keeney, and David W. Bolton Prepared in cooperation with the Maryland Department of Transportation, Port Administration, and the Maryland Environmental Service DNR Publication No. 12-482014-707 2014
Transcript of HYDROGEOLOGY OF THE PORT OF BALTIMORE CONFINED … · Anne Arundel County Dorsey Road well field to...

Maryland Department of Natural Resources Resource Assessment Service
MARYLAND GEOLOGICAL SURVEY Richard A. Ortt, Jr., Director
OPEN-FILE REPORT NO. 14-02-01
HYDROGEOLOGY OF THE PORT OF BALTIMORE CONFINED AQUATIC DISPOSAL PILOT PROJECT
AREA, MASONVILLE, MARYLAND
by
David C. Andreasen, Lindsay Keeney,
and David W. Bolton
Prepared in cooperation with the Maryland Department of Transportation, Port Administration,
and the Maryland Environmental Service
DNR Publication No. 12-482014-707
2014

ii
CONTENTS
Page Key results ........................................................................................................................................ 1 Introduction ....................................................................................................................................... 2 Purpose and scope ............................................................................................................................. 2 Location of study area ....................................................................................................................... 2 Test-well construction ....................................................................................................................... 2 Acknowledgments ............................................................................................................................. 3 Hydrogeologic framework ................................................................................................................ 3 Aquifers and confining units ...................................................................................................... 3 Pre-Cretaceous basement rock ................................................................................................... 4 Transmissivity ............................................................................................................................ 4 Water-level fluctuations .............................................................................................................. 5 Aquifer hydraulics ............................................................................................................................ 6 Direction of groundwater-flow in the Lower Patapsco and Patuxent aquifer systems ............... 6 Effectiveness of the Arundel Clay confining unit ...................................................................... 7 Water quality ..................................................................................................................................... 7 Discussion of results ......................................................................................................................... 9 Summary ........................................................................................................................................... 9 References ......................................................................................................................................... 11 Appendixes
A. Lithologic logs of drill cuttings and split-spoon samples for Garrett Park, MES Entrance, Bay Brooks Park, and CAD test wells .............................................. 34 B. Geophysical logs run in test wells ....................................................................................... 39 C. Abbreviations used in this report ......................................................................................... 43

iii
ILLUSTRATIONS
Figure Page 1. Map showing location of the study area .............................................................................. 122. Map showing location of test well(s) at the:
a. CAD site ..................................................................................................................... 13b. MES Entrance site ...................................................................................................... 13c. Garrett Park site .......................................................................................................... 14d. Bay Brooks Park site .................................................................................................. 14
3. Test-well construction schematic for the:a. CAD site (Lower Patapsco aquifer system well) ....................................................... 15b. CAD site (Patuxent aquifer system well) ................................................................... 15c. Bay Brooks Park site .................................................................................................. 16d. Garrett Park site ......................................................................................................... 17e. MES Entrance site ...................................................................................................... 17
4.-5. Hydrogeologic cross section from: 4. Bay Brooks Park to the CAD site .............................................................................. 185. Anne Arundel County Dorsey Road well field to the CAD site ................................ 19
6.-7. Map showing the top of the: 6. Patuxent aquifer system ............................................................................................. 207. Pre-Cretaceous basement rock ................................................................................... 21
8.-9. Drawdown and recovery data and transmissivity calculations for CAD test well: 8. BC 4S2E-7 (Lower Patapsco aquifer system) ............................................................ 229. BC 4S2E-6 (Patuxent aquifer system) ....................................................................... 23
10. Hydrograph showing water levels in test wells from October 2013 to February 2014 ....... 2411. Hydrograph showing water-level fluctuations in the:
a. CAD Lower Patapsco aquifer system test well .......................................................... 25b. CAD Patuxent aquifer system test well ..................................................................... 25c. Garrett Park test well .................................................................................................. 26d. MES Entrance test well ............................................................................................... ` 27e. Bay Brooks Park test well .......................................................................................... 27
12.-13. Map showing the altitude of the: 12. Water table and potentiometric surface of the Lower Patapsco
aquifer system in the fall of 2013 ............................................................................... 28 13. Potentiometric surface of the Patuxent aquifer system
in the fall of 2013 ....................................................................................................... 29 14. Water-level observations (A) in the Lower Patapsco well when the Patuxent well
is pumped, and (B) in the Patuxent well when the Lower Patapsco well is pumped at the CAD site ............................................................................................. 30
15. Piper diagram showing milliequivalent percentages of major ions in water samplestaken from the CAD test wells in 2013 ...................................................................... 31
TABLES
Table Page 1. Construction data for the test wells ...................................................................................... 322. Water-quality data for the Lower Patapsco and Patuxent aquifer systems
at the CAD site ........................................................................................................... 33

1
HYDROGEOLOGY OF THE PORT OF BALTIMORE CONFINED AQUATIC DISPOSAL PILOT PROJECT AREA,
MASONVILLE, MARYLAND
by
David C. Andreasen, Lindsay Keeney,
and David W. Bolton
KEY RESULTS The Maryland Port Administration has proposed to install a Confined Aquatic Disposal (CAD) cell at the Masonville vessel berth for the containment of dredge materials from Baltimore Harbor. Construction of the CAD cell requires excavation of predominantly sandy sediment from the Patapsco Formation (Lower Patapsco aquifer) to a depth of approximately 75 feet below sea level. The CAD cell lies within the outcrop area of the Lower Patapsco aquifer system which overlies the Patuxent aquifer system. Both aquifers are important water sources in northern Anne Arundel County. Since the CAD cell may receive contaminated dredge material, a hydrogeologic investigation was undertaken to determine the possibility of migration of potential contaminants towards Anne Arundel County’s well fields. Results of the investigation indicate that groundwater in the Lower Patapsco aquifer system in the vicinity of the CAD cell flows from high to low topographic elevations and discharges to the Patapsco River. The direction of flow in the vicinity of the CAD cell is south to north, opposite the direction of Anne Arundel County’s well fields. Since the CAD cell is located within the Patapsco River, which is locally an area of groundwater discharge, potential contaminants contained in the fill could not migrate landward. Aquifer testing indicates that the Arundel Clay confining unit, which separates the Lower Patapsco aquifer system from the underlying Patuxent aquifer system, forms a hydraulic barrier which would preclude downward migration of potential contaminants contained in the fill.

2
INTRODUCTION
The Port of Baltimore shipping channels require periodic maintenance dredging to maintain adequate depths. To increase future storage capacity for dredge material, the Maryland Port Administration (MPA) initiated a pilot study of a confined aquatic disposal (CAD) system. In a CAD system, sand and gravel is excavated from the geologic formation(s) beneath the river or bay bottom and transferred to land storage for some later beneficial use. The remaining cavity (CAD cell) is filled with dredge material consisting mainly of silt and clay. To determine whether any potential contaminants present in the dredge material will affect the groundwater resources, the Maryland Geological Survey (MGS) investigated the hydrogeology (aquifer framework and hydraulics) of the surrounding aquifer system.
PURPOSE AND SCOPE
The purpose of this study is to investigate whether potential contaminants contained in dredge material to be placed in a proposed CAD cell will migrate horizontally in the Lower Patapsco aquifer system and/or vertically to the Patuxent aquifer system and adversely affect well fields operated by the Anne Arundel County Department of Public Works (AADPW). The report discusses the hydrogeologic framework of the Lower Patapsco and Patuxent aquifer systems underlying the CAD site including the geology, hydraulic properties, water table and potentiometric surfaces, effectiveness of the Arundel Clay confining unit, and water quality.
LOCATION OF STUDY AREA
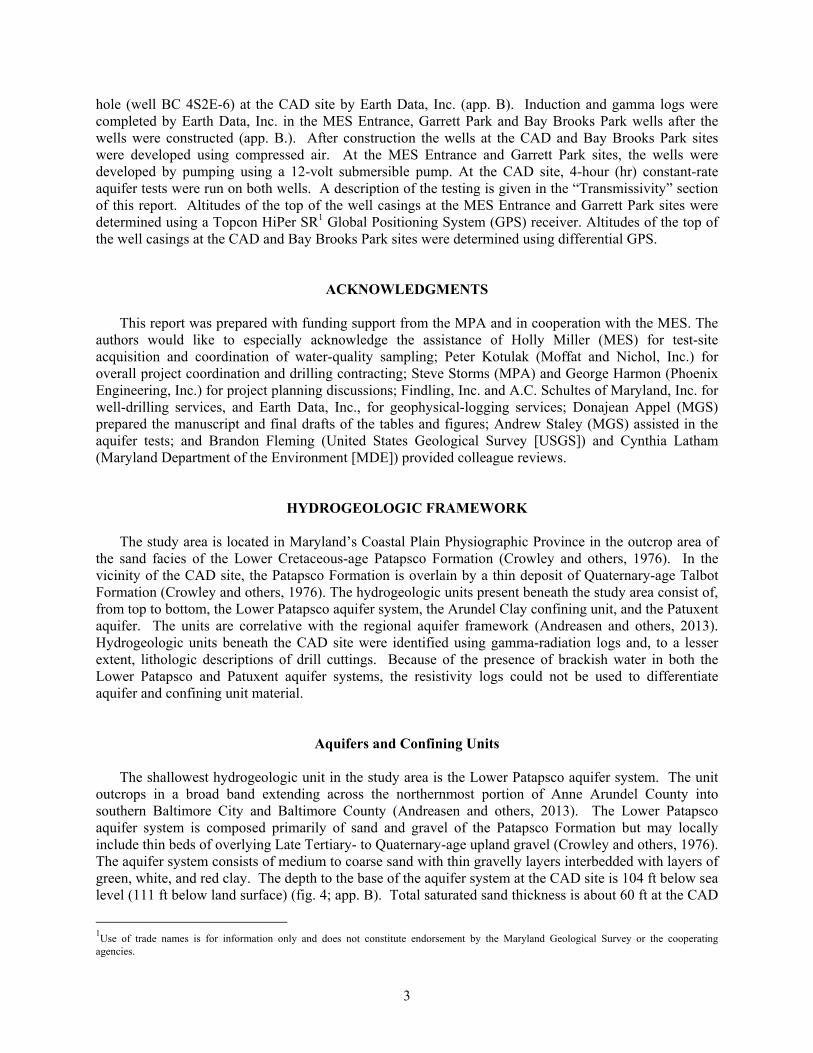
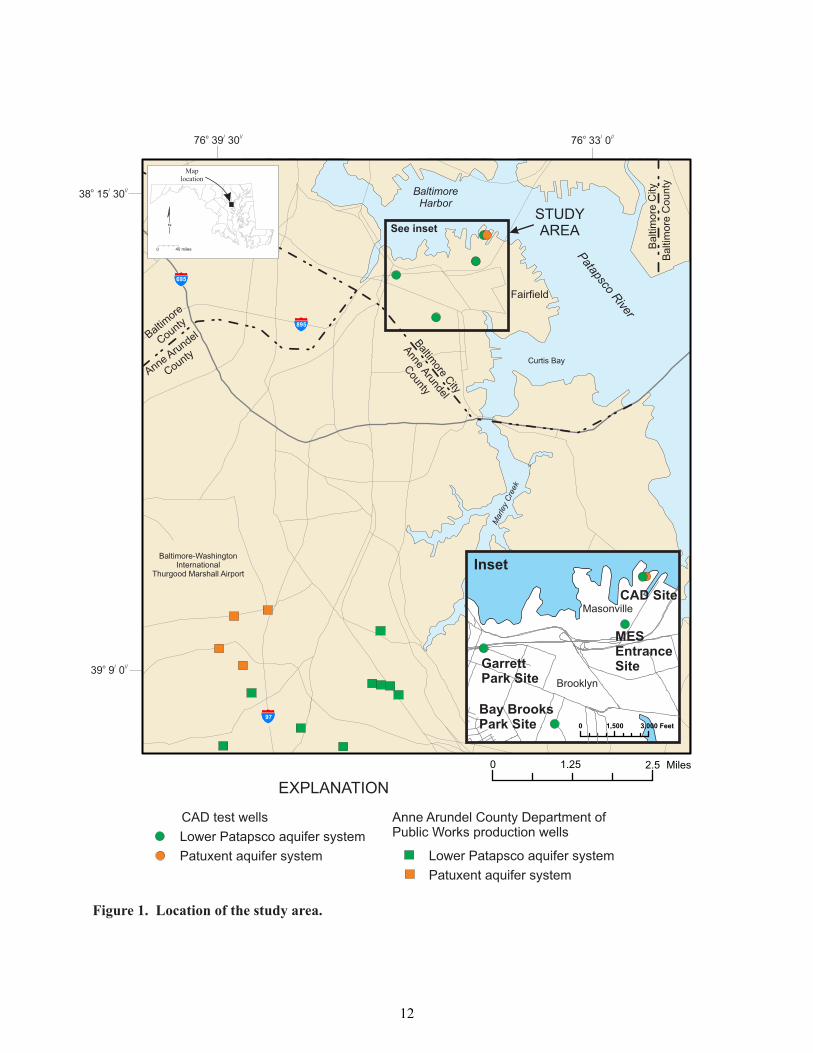
The study area is the Masonville area of southern Baltimore City, Maryland; however, to adequately characterize the hydrogeology a broader area, including most of southern Baltimore City and a portion of northern Anne Arundel County, was included in the study (fig. 1). Test wells constructed for the study are located at the CAD site adjacent to a MPA vessel berth, at the entrance to the Maryland Environmental Service (MES) Masonville facility (MES Entrance), and at Garrett Park and Bay Brooks Park in Brooklyn, Maryland.
TEST-WELL CONSTRUCTION
During this study, five monitoring wells were constructed—two 4-inch (in.) diameter wells at the CAD site, one 4-in. diameter well at Bay Brooks Park, and one 2-in. diameter well at both the MES Entrance and Garrett Park sites (figs. 1 and 2a-d). Construction information for the monitoring wells is presented in Table 1 and Figures 3a-e. The 4-in. wells were constructed under contract by A.C. Schultes of Maryland, Inc. using a mud rotary rig, and the 2-in. wells were constructed by Findling, Inc. using an auger rig. All wells were constructed using schedule-40 PVC well casing, slotted screen (0.02-in. slot size), and Morie No. 1 well gravel (figs. 3a-e). The CAD and Bay Brooks Park wells were finished with 6-in. steel protective casings, and the MES Entrance and Garrett Park wells were finished with below-grade vaults. For the wells drilled by the mud-rotary method, drill cuttings were collected in the deepest well at the CAD site (BC 4S2E-6) and in the well at Bay Brooks Park (BC 5S2E-26) at 10-foot intervals. The samples were washed, examined, and described using a hand lens (app. A.). In the auger holes, 1.5-in. diameter split-spoon samples were collected at the bottom of each 5-foot auger flight. Typical core recovery ranged from 1 to 1.5 feet (ft), or 50 to 75 percent of the 24-in. core barrel. The outside “rind” on the cores was scraped to expose fresh sediment before making lithologic descriptions (app. A.). Geophysical logs (8-, 16-, 32- and 64-in. normal resistivity, 6-ft lateral resistivity, single-point resistance, spontaneous potential, and gamma radiation) were completed prior to well construction in the deepest
3
hole (well BC 4S2E-6) at the CAD site by Earth Data, Inc. (app. B). Induction and gamma logs were completed by Earth Data, Inc. in the MES Entrance, Garrett Park and Bay Brooks Park wells after the wells were constructed (app. B.). After construction the wells at the CAD and Bay Brooks Park sites were developed using compressed air. At the MES Entrance and Garrett Park sites, the wells were developed by pumping using a 12-volt submersible pump. At the CAD site, 4-hour (hr) constant-rate aquifer tests were run on both wells. A description of the testing is given in the “Transmissivity” section of this report. Altitudes of the top of the well casings at the MES Entrance and Garrett Park sites were determined using a Topcon HiPer SR1 Global Positioning System (GPS) receiver. Altitudes of the top of the well casings at the CAD and Bay Brooks Park sites were determined using differential GPS.
ACKNOWLEDGMENTS This report was prepared with funding support from the MPA and in cooperation with the MES. The authors would like to especially acknowledge the assistance of Holly Miller (MES) for test-site acquisition and coordination of water-quality sampling; Peter Kotulak (Moffat and Nichol, Inc.) for overall project coordination and drilling contracting; Steve Storms (MPA) and George Harmon (Phoenix Engineering, Inc.) for project planning discussions; Findling, Inc. and A.C. Schultes of Maryland, Inc. for well-drilling services, and Earth Data, Inc., for geophysical-logging services; Donajean Appel (MGS) prepared the manuscript and final drafts of the tables and figures; Andrew Staley (MGS) assisted in the aquifer tests; and Brandon Fleming (United States Geological Survey [USGS]) and Cynthia Latham (Maryland Department of the Environment [MDE]) provided colleague reviews.
HYDROGEOLOGIC FRAMEWORK The study area is located in Maryland’s Coastal Plain Physiographic Province in the outcrop area of the sand facies of the Lower Cretaceous-age Patapsco Formation (Crowley and others, 1976). In the vicinity of the CAD site, the Patapsco Formation is overlain by a thin deposit of Quaternary-age Talbot Formation (Crowley and others, 1976). The hydrogeologic units present beneath the study area consist of, from top to bottom, the Lower Patapsco aquifer system, the Arundel Clay confining unit, and the Patuxent aquifer. The units are correlative with the regional aquifer framework (Andreasen and others, 2013). Hydrogeologic units beneath the CAD site were identified using gamma-radiation logs and, to a lesser extent, lithologic descriptions of drill cuttings. Because of the presence of brackish water in both the Lower Patapsco and Patuxent aquifer systems, the resistivity logs could not be used to differentiate aquifer and confining unit material.
Aquifers and Confining Units
The shallowest hydrogeologic unit in the study area is the Lower Patapsco aquifer system. The unit outcrops in a broad band extending across the northernmost portion of Anne Arundel County into southern Baltimore City and Baltimore County (Andreasen and others, 2013). The Lower Patapsco aquifer system is composed primarily of sand and gravel of the Patapsco Formation but may locally include thin beds of overlying Late Tertiary- to Quaternary-age upland gravel (Crowley and others, 1976). The aquifer system consists of medium to coarse sand with thin gravelly layers interbedded with layers of green, white, and red clay. The depth to the base of the aquifer system at the CAD site is 104 ft below sea level (111 ft below land surface) (fig. 4; app. B). Total saturated sand thickness is about 60 ft at the CAD
1Use of trade names is for information only and does not constitute endorsement by the Maryland Geological Survey or the cooperating
agencies.

4
site based on the net sand thickness on the gamma-radiation log. The Lower Patapsco aquifer system forms a continuous, hydraulically connected layer between the CAD site and Anne Arundel County’s Dorsey Road well field (fig. 5). Near the Dorsey Road well field, the Lower Patapsco aquifer system is confined by the overlying Patapsco confining unit which separates it from the shallower Upper Patapsco aquifer system (fig. 5) (Wilson and Achmad, 1995; Andreasen and others, 2013). Underlying the Lower Patapsco aquifer system is the Arundel Clay confining unit, which is composed primarily of the Arundel Clay Formation; however, the confining unit may include clay of the overlying Patapsco Formation and underlying Patuxent Formation if clay-on-clay contacts occur. Differentiating clays of the Patapsco, Arundel Clay, and Patuxent Formations based solely on lithology is difficult, given their similar appearance. The Arundel Clay confining unit consists of very dense, variegated clays with thin interbedded layers of sand and gravel. An indurated layer of iron-cemented sand occurs near the top of the unit. The depth to the top of the confining unit at the CAD site occurs at 106 ft below sea level (113 ft below land surface) (fig. 4; app. B.). At the CAD site, the unit is about 40 ft thick. The Arundel Clay confining unit forms a continuous layer between the CAD site and Anne Arundel County’s Dorsey Road well field (fig. 5). The unit thickens to about 120 ft at the Dorsey Road well field. Underlying the Arundel Clay confining unit is the Patuxent aquifer system, which is composed of sand and gravel of the Patuxent Formation. The unit consists of medium to coarse sand and gravel layers interbedded with tough mottled clay. The top of the Patuxent aquifer system at the CAD site occurs at 147 ft below sea level (154 ft below land surface) (figs. 4 and 6; app. B.). The depth to the base of the aquifer system is approximately 266 ft below sea level (273 ft below land surface) at the CAD site as indicated by the gamma-radiation log; however, sand and gravel was logged in the drill cuttings to a depth of 303 ft below sea level (310 ft below land surface). The relatively high gamma radiation between 273 and 303 ft below sea level suggests that the sands and gravels within that interval have a clayey matrix, possibly composed of saprolite developed on re-worked Pre-Cretaceous basement rock. That interval, therefore, is not likely to function as aquifer material. Total sand thickness of the Patuxent aquifer system is approximately 72 ft thick. The Patuxent aquifer system forms a continuous, hydraulically connected layer between the CAD site and Anne Arundel County’s Dorsey Road well field (fig. 5). The altitude of the top of the Patuxent aquifer system ranges from about sea level near its outcrop area to greater than 600 ft below sea level in east-central Anne Arundel County (fig. 6). The aquifer system dips to the southeast at approximately 80 feet per mile (ft/mi). The dip is greater near the outcrop area.
Pre-Cretaceous Basement Rock Underlying the Patuxent aquifer system is the Pre-Cretaceous basement rock. At the CAD site the basement rock underlies the Patuxent aquifer at 296 ft below sea level (303 ft below land surface) and consists of green, mica-rich saprolite. (figs. 4 and 7; apps. A and B). The altitude of the top of the Pre-Cretaceous basement rock ranges from about sea level just west of Baltimore Harbor to more than 800 ft below sea level in east-central Anne Arundel County (fig. 7). The top of the Pre-Cretaceous basement rock was defined primarily by geologist’s or driller’s lithologic descriptions that indicated hard rock; however, at one data point (altitude of top of rock of 350 ft below sea level), the contact was described as soft granite and mica (saprolite). The basement rock dips to the southeast at approximately 80 ft/mi.
Transmissivity
Constant-rate aquifer tests were performed on the Lower Patapsco aquifer system and Patuxent aquifer system test wells at the CAD site on October 28th and 25th, 2013, respectively. The tests consisted of a 4-hr pumping phase followed by a maximum of 4 hrs recovery. Discharge was measured periodically using a 55-gallon drum and stopwatch. Water-level measurements were made in both wells during each test using a hand-held electric tape. Water levels were also monitored and recorded in the

5
pumping well in each test using a pressure transducer with a built-in data logger. The pumping rate was 35 gallons per minute (gal/min) in the Lower Patapsco well and 78 gal/min in the Patuxent well. Transmissivity (T) was calculated using the Cooper-Jacob straight-line method, in which drawdown or residual drawdown data is plotted against elapsed time on semi-logarithmic graphs (figs. 8 and 9) (Cooper and Jacob, 1946). This method assumes that the following conditions are met: (1) the aquifer has infinite extent, and is homogeneous and isotropic; (2) well discharge is at a constant rate; (3) the well screen fully penetrates the confined aquifer, resulting in horizontal flow to the well, and the flow is laminar; (4) the aquifer is of uniform thickness and is horizontal; (5) the potentiometric surface is initially horizontal; and, (6) the aquifer is fully confined and discharge is derived exclusively from storage in the aquifer. Water levels in both the Lower Patapsco aquifer system and Patuxent aquifer system at the CAD site are affected by tidal fluctuations in the Patapsco River. The tidal effect in the Lower Patapsco aquifer system during the aquifer test was great enough to interfere with the drawdown and recovery responses caused by pumping. In order to use the water-level data to calculate transmissivity, the tidal effects were subtracted from the water-level record. This was accomplished by determining the ratio of tide-level change to groundwater-level change for a period of record unaffected by pumping. Tide levels at the National Oceanic and Atmospheric Administration (NOAA) tide gage (station 8574680) at Baltimore Harbor, plotted along with water levels from the Lower Patapsco test well, indicated a groundwater-level change of 0.83 ft for every 1 ft of tide-level change. This ratio was used to subtract out the tidal influence from the groundwater levels recorded during both drawdown and recovery phases of the aquifer test. Transmissivity of the Lower Patapsco aquifer system at the CAD site (well BC 4S2E-7) is 2,040 feet squared per day (ft2/d) calculated from the drawdown phase of the test for the 100-1,000 log cycle (fig. 8). A lower transmissivity value of 1,360 ft2/d was calculated from the recovery phase for the 1-10 log cycle (fig. 8). The latter part of both the drawdown and recovery phases were used to determine the slope of the drawdown and residual drawdown curves. Use of the latter test data tends to reduce the effects of well-casing storage and partial well penetration of the aquifer. The calculated transmissivity is not reflective of the total transmissivity of the Lower Patapsco aquifer system at the CAD site because only 10 ft of the total saturated aquifer thickness (approximately 60 ft) was screened. The nearest transmissivity data for the Lower Patapsco aquifer system are in the well fields of AADPW in northern Anne Arundel County. Transmissivity values in that area range from 350 to 5,080 ft2/d, with a median value of 1,695 ft2/d (Andreasen and others, 2013). Transmissivity of the Patuxent aquifer system at the CAD site (well BC 4S2E-6) is 808 ft2/d calculated from the drawdown phase, and 870 ft2/d calculated from the recovery phase (fig. 9). In both the drawdown and recovery phases, the slope of the drawdown and residual drawdown curves are the same for all log cycles. The calculated transmissivity is not reflective of the total transmissivity of the Patuxent aquifer system at the CAD site because only 20 ft of the total aquifer thickness (approximately 72 ft) was screened. If all of the sands were screened the transmissivity could be significantly greater. The nearest transmissivity values for the Patuxent aquifer system ranges from 238 to 2,160 ft2/d, with a median value of 1,060 ft2/d, in an AADPW well field in northern Anne Arundel County (Dorsey Road well field) to 21,950 ft2/d in an industrial well in southern Baltimore County (Andreasen and others, 2013).
Water-Level Fluctuations
Water levels measured in the CAD, MES Entrance, Garrett Park and Bay Brooks Park test wells from late October, 2013 to early February, 2014 changed less than 1 ft over the time period (fig. 10). Water levels in all of the wells show a flat trend over the period of record. Water levels in the Lower Patapsco aquifer system at the CAD, MES Entrance, Garrett Park, and Bay Brooks Park sites, and in the Patuxent aquifer system at the CAD site, respond to changes in barometric pressure (fig. 11). Changes in barometric pressure recorded at Baltimore-Washington International

6
Thurgood Marshall (BWI) Airport, located approximately 6 miles (mi) to the south of the test sites, show an inverse relation to changes in groundwater levels. Water levels in the test wells were recorded at 30-minute intervals using a pressure transducer. Water levels in unconfined aquifers generally show a negligible response to changes in barometric pressure, while water levels in confined aquifers typically fluctuate in response to barometric changes. The presence of a barometric response in the Lower Patapsco aquifer system screened in the test wells, therefore, indicates that the aquifer may be partially confined by overlying clay layers (app. A). The response to barometric effects at the CAD and MES Entrance sites may also be a result of the extensive impervious surfaces in the area surrounding the wells. Impermeable structures, such as parking lots and buildings, of sufficient areal extent may result in barometric efficiencies in unconfined aquifers at levels similar to confined aquifers (Hare and Morse, 1997). This may be the case at the CAD site given the extensive paved area (approximately 100 acres) where the sites are located. Water levels in the Lower Patapsco and Patuxent aquifer systems at the CAD site and in the Lower Patapsco aquifer system at the MES Entrance site are affected by tides in the nearby Patapsco River. The fluctuations range from about 0.5 to 1.6 ft and 0.1 to 0.5 ft in the Lower Patapsco and Patuxent aquifer systems at the CAD site, respectively, and from 0.03 to 0.12 ft in the Lower Patapsco aquifer system at the MES Entrance site. The CAD and MES Entrance sites are located approximately 20 and 1,600 ft from the Patapsco River, respectively. Water levels in the Lower Patapsco aquifer system test wells show no noticeable response to precipitation events. In shallow, unconfined aquifers, precipitation typically causes an abrupt rise in groundwater levels followed by a recession curve as the effects of the infiltrating precipitation diminish. The absence of a response suggests that clay layers partially confine the aquifer system, impeding vertical flow. In the MES Entrance and CAD test wells, the extensive area in the vicinity of the sites covered in pavement likely also restricts infiltrating precipitation.
AQUIFER HYDRAULICS
Direction of Groundwater-Flow in the Lower Patapsco and Patuxent Aquifer Systems
The Lower Patapsco aquifer system forms the water-table aquifer in the Masonville-Brooklyn area of Baltimore City. Measured water levels in the fall of 2013 ranged from a high value of approximately 23 ft above sea level at the Bay Brooks Park site to sea level at the CAD site (fig. 12). The direction of groundwater flow is from the higher topographic elevations, where water enters as recharge from precipitation, to lower elevations (fig. 12). Groundwater in the Lower Patapsco aquifer system discharges locally to streams and to the tidal Patapsco River. Since the Lower Patapsco aquifer system is exposed beneath the Patapsco River which allows for denser brackish water to intrude inland along the shoreline, discharge from the Lower Patapsco aquifer system to the Patapsco River likely only occurs at the immediate shoreline boundary. Given the absence of Lower Patapsco production wells in the Masonville-Brooklyn area (Cynthia Latham, Maryland Department of the Environment, personal commun., 2014), the flow regime is not affected by local pumping. South of the outcrop area near BWI Airport water levels are as high as 75 ft above sea level near BWI Airport and decrease eastward to 15 ft above sea level (fig. 12). South of the outcrop area the Lower Patapsco aquifer system is confined or semi-confined by the overlying Patapsco confining unit (Wilson and Achmad, 1995; Andreasen and others, 2013). Withdrawals from Anne Arundel County’s Lower Patapsco well field in northern Anne Arundel County do not form significant cones of depression. Approximately 1.3 million gallons per day (Mgal/d) were withdrawn from the Lower Patapsco aquifer system by AADPW in the northern part of the County in 2012 (Cynthia Latham, Maryland Department of the Environment, written commun., 2014). The direction of groundwater flow in the confined portion of the aquifer is from west to east. The Patuxent aquifer system is a confined aquifer in the Masonville-Brooklyn area. The water level in the aquifer measured in the fall of 2013 was about 2 ft above sea level at the CAD site (fig. 13). A

7
significant cone of depression surrounds Anne Arundel County’s Dorsey Road well field, with water levels as deep as 109 ft below sea level (fig. 13). Approximately 4 Mgal/d were withdrawn from the Patuxent aquifer system at the Dorsey Road well field in 2012 (Cynthia Latham, Maryland Department of the Environment, written commun., 2014). There are no production wells withdrawing water from the Patuxent aquifer system in the Masonville-Brooklyn area (Cynthia Latham, Maryland Department of the Environment, personal commun., 2014). The hydraulic gradient is relatively steep within about 2 mi from the deepest part of the cone, and then flattens at greater distances from the pumping center. The influence of the cone of depression surrounding the Dorsey Road well field on groundwater-flow paths appears to diminish northward. As a result, groundwater-flow paths that intersect the CAD site likely trend in a southeastern direction, bypassing the Dorsey Road well field. The vertical-head gradient between the Lower Patapsco and Patuxent aquifer systems is directed upward at the CAD site. The head in the Patuxent aquifer system is about 1.4 ft higher than in the Lower Patapsco aquifer system.
Effectiveness of the Arundel Clay Confining Unit
At the CAD site, the Arundel Clay confining unit effectively separates the Patuxent aquifer system from the overlying Lower Patapsco aquifer system hydraulically. Water levels observed while the aquifers were pumped indicates that short-term pumping effects do not propagate across the confining unit. Figure 14 shows (A) water levels measured in the Lower Patapsco well while the Patuxent well was pumped for 4 hrs at 78 gal/min; and, (B) water levels in the Patuxent well while the Lower Patapsco well was pumped for 4 hrs at 35 gal/min. Tidal record from the NOAA gage at Baltimore Harbor (station 8574680) is also plotted on the graphs. Water levels in the pumped wells display drawdown curves in response to pumping followed by recovery curves after pumping stopped. Water levels in the unpumped wells during both tests show no response to pumping. The slight decline in water levels in the Lower Patapsco well during the recovery period of the Patuxent well in the first test is likely attributed to the outgoing tide in the Patapsco River. The effectiveness of the Arundel Clay confining unit is also apparent in the significantly lower chloride concentrations in the Patuxent aquifer system (2,170 mg/L) compared to the Lower Patapsco aquifer system (4,580 mg/L). If a hydraulic connection existed across the confining unit, density-dependent flow would result in increasing chloride concentrations with depth.
WATER QUALITY
Water samples were collected from the Lower Patapsco and Patuxent wells at the CAD site near the end of the 4-hr aquifer tests conducted on October 28th and 25th, 2013, respectively. The samples were collected, filtered, treated, and bottled by MES personnel after pH, specific conductance, dissolved oxygen, turbidity, temperature, and oxidation-reduction potential measurements stabilized. Blank and duplicate samples were also taken. The samples were packed in ice and shipped to three laboratories for analysis. Dissolved aluminum, antimony, arsenic, boron, calcium, cadmium, chromium, cobalt, copper, iron, lead, lithium, mercury, molybdenum, manganese, nickel, selenium, thallium, vanadium, and zinc were analyzed by Brooks Rand Labs of Seattle, Washington1. Dissolved magnesium, potassium, sodium, barium, beryllium, silver, strontium, uranium, silica, fluoride, bromide, chloride, sulfate, nitrite, total nitrate plus nitrite, orthophosphorus, total dissolved solids, total organic carbon, phosphorous, and ammonia nitrogen were analyzed by QC Laboratories1 of Southampton, Pennsylvania. Gross alpha and gross beta particle activity and radon-222 were analyzed by Florida Radiochemistry, Inc.1 of Orlando, Florida. Results of the water-quality analyses are given in Table 2. The parameters measured in the field
1Use of trade names is for information only and does not constitute endorsement by the Maryland Geological Survey or the cooperating agencies.

8
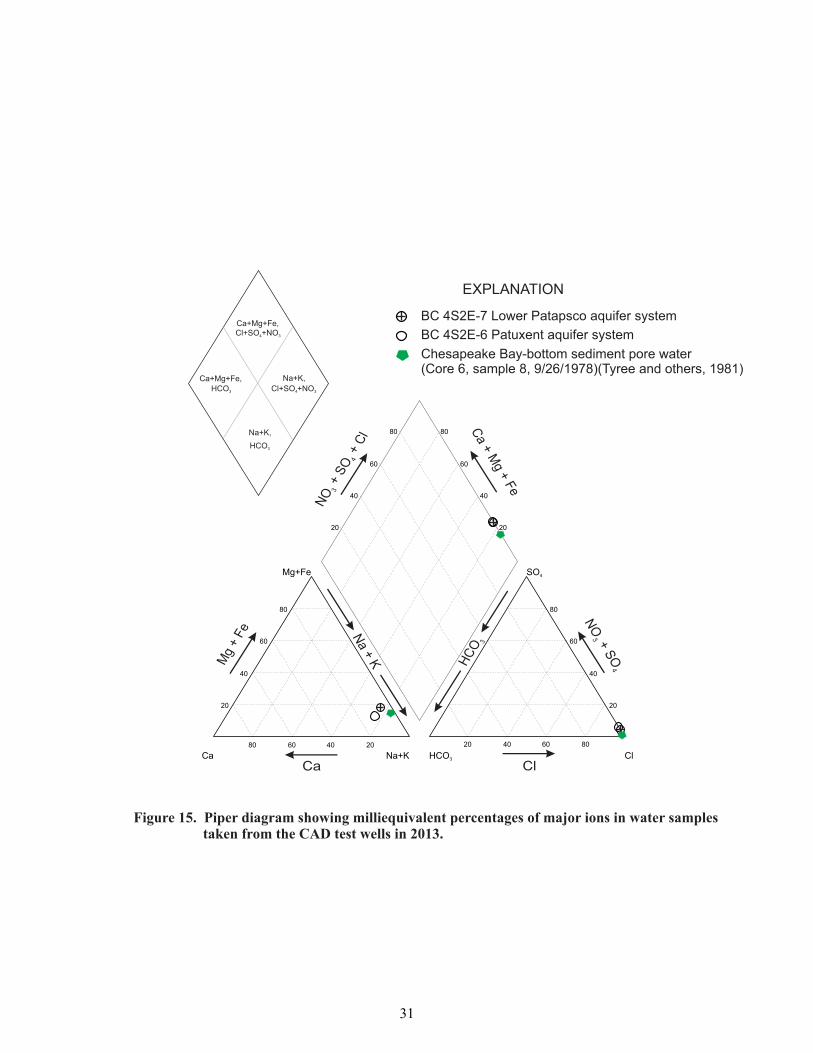
(pH, specific conductance, dissolved oxygen, turbidity, temperature, and oxidation-reduction potential) are also given in Table 2. Water from the Lower Patapsco aquifer system is slightly acidic (pH 6.7), low in dissolved oxygen (1.6 milligrams per liter [mg/L]), has high specific conductance (11,600 microsiemens per centimeter at 25 degrees Celsius [µS/cm]), and is a reducing chemical environment (-87 millivolts [mv] oxidation-reduction potential) (tab. 2). Water from the Patuxent aquifer system is acidic (pH 4.2), has no dissolved oxygen, has high specific conductance (6,460 µS/cm), and is an oxidizing chemical environment (281 mv oxidation-reduction potential) (tab. 2). The general chemical character of groundwater can be classified according to the dominant ions present in the water. Milliequivalent percentages of the major ions in water from the Lower Patapsco and Patuxent aquifers at the CAD site were plotted on a Piper trilinear diagram (Hem, 1985) to show the water type (fig. 15). On this diagram the milliequivalent percentages of cations and anions are plotted on the two triangles at the base. The intersection of these points on the diamond grid represents the water type defined by the dominant ions. The water type of both the Lower Patapsco and Patuxent aquifer systems at the CAD site is sodium chloride. On the graph, sodium and potassium are combined, but in the analyses the milliequivalent percentage of sodium is an order of magnitude greater than potassium in both aquifers. Also plotted on the diagram is pore water from a bottom-sediment core taken in the Chesapeake Bay at the mouth of the Patapsco River. The sample depth was 40 to 42.5 centimeters (cm) below the bottom surface (Tyree and others, 1981). The water type in the sediment core is also sodium chloride. Chloride concentration in the Lower Patapsco well at the CAD site (BC 4S2E-7) was 4,580 mg/L. The elevated chloride level is a result of a brackish-water wedge extending inland from the Patapsco River. Since the Lower Patapsco aquifer system is exposed beneath the Patapsco River in the vicinity of the CAD site, higher density brackish river water intrudes into the aquifer along the shoreline. The chloride level is likely near the annual average chloride concentration in Patapsco River water. Tyree and others (1981) analyzed chloride concentrations in a bottom-sediment core in the Chesapeake Bay at the mouth of the Patapsco River approximately 12 mi downstream of the CAD site during the fall of 1978. The average chloride concentration in the deeper part of that core (40 to 100 cm below bottom surface) was 4,370 mg/L and likely reflects an annual average concentration. Seasonal variation in chloride concentration dampens out below about 20 cm below the sediment-water interface (Hill, 1988). Chloride concentration in the Patuxent well at the CAD site (BC 4S2E-6) was 2,170 mg/L. Since the overlying Arundel Clay confining unit effectively confines the Patuxent aquifer system, the likely source of the elevated chloride levels is from the subcrop area of the aquifer system beneath the Patapsco River approximately 2 mi to the west (fig. 13). Brackish water from the Patapsco River may also have entered the Patuxent aquifer system though paleochannels incised through the Arundel Clay confining unit. Chapelle and Kean (1985) present evidence of paleochannels cut through the Arundel Clay confining unit in the Baltimore Harbor area. The presence of brackish water in the Patuxent aquifer system beneath the CAD site is likely a legacy of deep cones of depression formed during earlier water withdrawals for industrial use in the Fairfield area of Baltimore City (Chapelle and Kean, 1985). Figure 13 shows the approximate extent of brackish-water intrusion in the Patuxent aquifer system as last mapped in 1982 (Chapelle and Kean, 1985). Since the head in the aquifer system at the CAD site is now about 2 ft above sea level, the brackish water is likely slowly being flushed out. Gross alpha-particle activities in the Lower Patapsco and Patuxent wells were 22.3 and 120 picocuries per liter (pCi/L), respectively. Both values exceed the U.S. Environmental Protection Agency’s (USEPA’s) Primary Drinking Water Standard (Maximum Contaminant Level [MCL]) of 15 pCi/L. Gross beta-particle activities in the Lower Patapsco and Patuxent wells were 67.0 and 87.7 pCi/L, respectively. The USEPA MCL for gross beta-particle activity is 4 millirems per year (mrem/yr), which is a dosage rather than a concentration. A concentration of 50 pCi/L has been used as a screening level for further testing of public water supplies (U.S. Environmental Protection Agency, 2002). It is likely that these levels of radioactivity are due to the presence of naturally-occurring radium isotopes that have been identified in well-water samples in the Patapsco and Patuxent aquifers in Anne Arundel County

9
(Bolton and Hayes, 1999; Bolton, 2000). Elevated levels of radium in these aquifers are associated with low pH and high dissolved solids. No other MCLs were exceeded. Secondary Maximum Contaminant Levels (SMCLs) (non-enforceable standards established for taste, odor, or other aesthetic considerations) were exceeded in one or both wells for aluminum, chloride, color, iron, manganese, pH, sulfate, and total dissolved solids.
DISCUSSION OF RESULTS The proposed CAD cell, located in a vessel berth off the Patapsco River, is in a groundwater discharge area of the Lower Patapsco aquifer system, and as such does not pose a threat of contamination to the aquifer system. The Lower Patapsco aquifer system seaward of the freshwater-brackish water interface functions as a hydraulic stagnation zone. On the landward side of the interface, groundwater flows from higher topographic elevations where it is recharged from precipitation to lower elevations where it discharges to streams and to the Patapsco River at the shoreline margin. The flow system in the Lower Patapsco aquifer system in the vicinity of the CAD site is unaffected by well withdrawals. Unless significant withdrawals occur in the area, the overall flow pattern is likely to continue with only naturally-occurring variations in head gradient caused by climatic fluctuations in recharge. The Arundel Clay confining unit forms an effective hydraulic barrier separating the Lower Patapsco aquifer system from the deeper Patuxent aquifer system. Short-term pumping effects do not propagate across the confining unit at the CAD site. As a result, potential contaminants in dredge material placed in the CAD cell would not migrate vertically to the Patuxent aquifer system. Additionally, an upward vertical head gradient (heads higher in the Patuxent aquifer system compared to the Lower Patapsco aquifer system) at the CAD site would prevent downward migration of contaminants. Brackish water in the Patuxent aquifer system may pose a long-term threat to groundwater supplies in northern Anne Arundel County, especially if the head gradient steepens southward toward pumping centers. The extent of brackish-water intrusion in the Patuxent aquifer system in southern Baltimore City was last mapped in 1982 (Chapelle and Kean, 1985). To help prevent current and potential future well fields from becoming contaminated by brackish-water intrusion, an updated assessment of the chloride distribution in the Patuxent aquifer system, along with predictions of future groundwater-flow directions and travel times, would be prudent.
SUMMARY The report discusses the hydrogeologic framework of the Lower Patapsco and Patuxent aquifer systems underlying the CAD site, including the geology, hydraulic properties, water table and potentiometric surfaces, effectiveness of the Arundel Clay confining unit, and water quality. The purpose of this study is to investigate whether potential contaminants contained in dredge material to be placed in a proposed CAD cell will migrate horizontally in the Lower Patapsco aquifer system and/or vertically to the Patuxent aquifer system, and adversely affect well fields operated by AADPW. The study area is the Masonville area of southern Baltimore City. Test wells were constructed in the Lower Patapsco and Patuxent aquifers at the CAD site and in the Lower Patapsco aquifer at the entrance to the MES Masonville facility (MES Entrance), and at Garrett Park and Bay Brooks Park in Brooklyn, Maryland. Geophysical logs were run in the test wells. Aquifer tests were conducted and water samples collected and analyzed from test wells at the CAD site. The hydrogeologic units present beneath the study area consist of, from top to bottom, the Lower Patapsco aquifer system, the Arundel Clay confining unit, and the Patuxent aquifer. The depth to the base of the Lower Patapsco aquifer system at the CAD site is 104 ft below sea level (111 ft below land surface). Total sand thickness (saturated) is about 60 ft. The depth to the top of the Arundel Clay confining unit at the CAD site occurs at 106 ft below sea level (113 ft below land surface). The unit is

10
about 40 ft thick. The top of the Patuxent aquifer system at the CAD site occurs at 147 ft below sea level (154 ft below land surface). The depth to the base of the aquifer system is approximately 266 ft below sea level (273 ft below land surface) at the CAD site as indicated by the gamma radiation log; however, sand and gravel were logged in the drill cuttings to a depth of 303 ft below sea level (310 ft below land surface). The Pre-Cretaceous basement rock underlies the Patuxent aquifer at the CAD site at 296 ft below sea level (303 ft below land surface) and consists of green, mica-rich saprolite. Transmissivity of the Lower Patapsco aquifer system at the CAD site (well BC 4S2E-7) is 2,040 ft2/d calculated from the drawdown phase of the aquifer test for the 100-1,000 log cycle. A lower transmissivity value of 1,360 ft2/d was calculated from the recovery phase for the 1-10 log cycle. The calculated transmissivity is not reflective of the total transmissivity of the Lower Patapsco aquifer system because only 10 ft of the total saturated aquifer thickness (approximately 60 ft) was screened. Transmissivity of the Patuxent aquifer system at the CAD site (well BC 4S2E-6) is 808 ft2/d calculated from the drawdown phase, and 870 ft2/d calculated from the recovery phase. In both the drawdown and recovery phases the slope of the drawdown and residual drawdown curves are the same for all log cycles. The calculated transmissivity is not reflective of the total transmissivity of the Patuxent aquifer system because only 20 ft of the total aquifer thickness (approximately 72 ft) was screened. Water levels in the Lower Patapsco aquifer system at the CAD, MES Entrance, Garrett Park, and Bay Brooks Park sites, and in the Patuxent aquifer system at the CAD site, respond to changes in barometric pressure. Water levels in the Lower Patapsco and Patuxent aquifer systems at the CAD site and in the Lower Patapsco aquifer system at the MES Entrance site are affected by tides in the nearby Patapsco River. Water levels in the Lower Patapsco aquifer system in the test show no noticeable response to precipitation events. The Lower Patapsco aquifer system forms the water-table aquifer in the Masonville-Brooklyn area. Measured water levels in the fall of 2013 ranged from a high value of approximately 23 ft above sea level at the Bay Brooks Park site to sea level at the CAD site. The direction of groundwater flow is from the higher topographic elevations, where water enters as recharge from precipitation, to lower elevations. Groundwater in the Lower Patapsco aquifer system discharges locally to streams and to the tidal Patapsco River. The Patuxent aquifer system is a confined aquifer in the Masonville-Brooklyn area. The water level in the aquifer measured in the fall of 2013 was about 2 ft above sea level at the CAD site. A significant cone of depression surrounds Anne Arundel County’s Dorsey Road well field, with water levels as deep as 109 ft below sea level. The hydraulic gradient is relatively steep within about 2 mi from the deepest part of the cone, and then flattens at greater distances from the pumping center. The influence of the cone of depression surrounding the Dorsey Road well field on groundwater-flow paths appears to diminish northward. As a result, groundwater-flow paths that intersect the CAD site likely trend in a southeastern direction, bypassing the Dorsey Road well field. At the CAD site, the Arundel Clay confining unit effectively separates the Patuxent aquifer system from the overlying Lower Patapsco aquifer system hydraulically. Water levels recorded while the aquifers were pumped indicates that short-term pumping effects do not propagate across the confining unit. Water from the Lower Patapsco aquifer system is slightly acidic (pH 6.7), low in dissolved oxygen (1.6 mg/L), has high specific conductance (11,600 µS/cm), and is a reducing chemical environment (-87 mv oxidation-reduction potential). Water from the Patuxent aquifer system is acidic (pH 4.2), has no dissolved oxygen, has high specific conductance (6,460 µS/cm), and is an oxidizing chemical environment (281 mv oxidation-reduction potential). The water type of both the Lower Patapsco and Patuxent aquifer systems at the CAD site is sodium chloride. Gross alpha-particle activities in the Lower Patapsco and Patuxent wells were 22.3 and 120 pCi/L, respectively. Both values exceed the USEPA MCL of 15 pCi/L. Gross beta-particle activities in the Lower Patapsco and Patuxent wells were 67.0 and 87.7 pCi/L, respectively. The USEPA MCL for gross beta-particle activity is 4 mrem/yr, which is a dosage rather than a concentration; a concentration of 50 pCi/L is used by several states when trying to evaluate risk associated with gross-beta activity levels. SMCLs (non-enforceable standards established

11
for taste, odor, or other aesthetic considerations) were exceeded in one or both wells for aluminum, chloride, color, iron, manganese, pH, sulfate, and total dissolved solids. Chloride concentration in the Lower Patapsco well at the CAD site (BC 4S2E-7) was 4,580 mg/L. The elevated chloride level is a result of a brackish-water wedge extending inland from the Patapsco River. Chloride concentration in the Patuxent well at the CAD site (BC 4S2E-6) was 2,170 mg/L. Since the overlying Arundel Clay confining unit effectively confines the Patuxent aquifer system at the CAD site, the likely source of the elevated chloride levels is from the subcrop area of the aquifer system beneath the Patapsco River approximately 2 mi to the west or through paleochannels cut through the Arundel Clay confining unit in the Baltimore Harbor area. The presence of brackish water in the Patuxent aquifer system beneath the CAD site is likely a legacy of deep cones of depression formed during earlier water withdrawals for industrial use in the Fairfield area of Baltimore City.
REFERENCES Andreasen, D.C., Staley, A.W., and Achmad, Grufron, 2013, Maryland Coastal Plain aquifer
information system: Hydrogeologic framework: Maryland Geological Survey Open-File Report 12-02-20, 121 p.
Bennett, R.R., and Meyer, R.R., 1952, Geology and ground-water resources of the Baltimore area: Maryland Geological Survey Bulletin 4, 573 p.
Bolton, D.W., 2000, Occurrence and distribution of radium, gross alpha-particle activity, and gross beta-particle activity in ground water in the Magothy Formation and Potomac Group aquifers, upper Chesapeake Bay area, Maryland: Maryland Geological Survey Report of Investigations No. 70, 97 p.
Bolton, D.W., and Hayes, M.A., 1999, Pilot study of carcinogens in well water in Anne Arundel County, Maryland: Maryland Geological Survey Open-File Report 99-02-10, 56 p.
Chapelle, F.H., and Kean, T.M., 1985, Hydrogeology, digital solute-transport simulation, and geochemistry of the Lower Cretaceous aquifer system near Baltimore, Maryland, with a section on well records, pumpage information, and other supplemental data: Maryland Geological Survey Report of Investigations No. 43, 120 p.
Cooper, H.H., and Jacob, C.E., 1946, A generalized graphical method for evaluating formation constants and summarizing well field history: American Geophysical Union Transactions, vol. 27, p. 526-534.
Crowley, W.P., Reinhardt, J., and Cleaves, E.T., 1976, Geologic map of Baltimore County and City: Maryland Geological Survey, County Geologic Map, one sheet, scale 1:62,500.
Hare, P.W., and Morse, R.E., 1997, Water-level fluctuations due to barometric pressure changes in an isolated portion of an unconfined aquifer: Groundwater, vol. 35, no. 3, 5 p.
Hem, J.D., 1985, Study and interpretation of the chemical characteristics of natural water: U.S. Geological Survey Water-Supply Paper 2254, 263 p.
Hill, J.M, 1988, Physiographic distribution of interstitial waters in Chesapeake Bay: Maryland Geological Survey Report of Investigations No. 49, 32 p.
Tyree, S.Y., Bynum, M.A.O., Stouffer, J., Pugh, S., and Martin, P., 1981, Chesapeake Bay Earth Sciences sediment and pore water chemistry: College of William and Mary (Chemistry Dept.), final report to U.S. Environmental Protection Agency, 166 p.
U.S. Environmental Protection Agency, 2002, Implementation guidance for radionuclides: U.S. Environmental Protection Agency Office of Ground Water and Drinking Water, EPA 816-F-00-002, 75 p.,
http://water.epa.gov/lawsregs/rulesregs/sdwa/radionuclides/upload/2009_04_16_radionuclides_guide_radionuclides_stateimplementation.pdf, accessed 4/3/2014.
Wilson, J.M., and Achmad, Grufron, 1995, Delineation of wellhead protection areas using particle tracking analysis and hydrogeologic mapping, northern Anne Arundel County, Maryland: Maryland Geological Survey Report of Investigations No. 61, 121 p.
0 1,500 3,000 Feet
Bay Brooks Park Site
Garrett Park Site Brooklyn
CAD SiteMasonville
MESEntrance Site
Inset
o / //76 33 0
o / //38 15 30
o / //39 9 0
o / //76 39 30
Patapsco R
iverBaltimore
Harbor
Baltimore-Washington International
Thurgood Marshall Airport
Curtis Bay
Mar
ley
Cre
ek
Baltimore
County
Ba
ltim
ore
Co
un
ty
Baltim
ore City
Ba
ltim
ore
City
Fairfield
STUDY AREA
Anne A
rundel
County
Anne Aru
ndel
County
Anne Arundel County Department ofPublic Works production wells
Lower Patapsco aquifer system
Patuxent aquifer system
CAD test wells
Lower Patapsco aquifer system
Patuxent aquifer system
Figure 1. Location of the study area.
EXPLANATION
0 2.51.25 Miles
See insetN
Maplocation
0 40 miles
695
895
97
12

Parking areaC
hild
s S
tree
t
Guardhouse
BC 4S2E-5Lower Patapsco aquifer
fence
railro
ad
fence
MESentrance
fence
gate
gate
Parking area
Marine terminal
Restroom
N
Riprap
BC 4S2E-6Patuxent aquifer system
fence
fence
Riprap
Acc
ess
Roa
d
BC 4S2E-7Lower Patapsco aquifer system
fence
gate
Guardhouse
Parking area
N
Figure 2a. Location of test wells at the CAD site.
Approximate southern boundary of CAD cell
Vessel berth(Patapsco River)
0 20 feet
0 50 feet
fence
Figure 2b. Location of test well at the MES Entrance site.
13

BC 5S2E-26Lower Patapsco aquifersystem
N
Chesapeake Avenue
Maude Avenue
Harbor Tunnel Throughway
Basketball courtGarrett Park
2nd S
treet
3rd
Str
eet
Figure 2c. Location of test well at the Garrett Park site.
0 100 feet
N
BC 4S1E-5Lower Patapsco aquifer system
wooded area
West B
ay Avenue
East Jeffrey Street
East
Jeffre
y S
treet
Tompkins Street
park
ing a
rea
0 50 feet
Figure 2d. Location of test well at the Bay Brooks Park site.
14

Not to scale
Depth, in feet below land surface
BC 4S2E-6BC-14-0045
0
180
142
310185
160
+2.35
4-inch PVC tail pipe
4-inch PVC well casing
Land surface
9.625-inch borehole
Cement
6-inch steel protective casing
Gravel pack4-inch diameter well screen,0.02-inch slot, PVC
Top of well casing
Top of 6-inch steel protective casing
Cement grout
Total depth of hole
Static water level5.03 feet belowland surface(11/8/2013)
Depth of well
Altitude of landsurface: 6.9 feetabove sea level
Figure 3b. Test-well construction schematic for the CAD site (Patuxent aquifer system well).
Altitude of landsurface: 7.0 feetabove sea level
BC 4S2E-7BC-14-0046
Not to scale
Depth, in feet below land surface
0
65
42
70
55
+2.55
4-inch PVC tail pipe
4-inch PVC well casing
Land surface
9.625-inch borehole
Cement
6-inch steel protective casing
Gravel pack4-inch diameter well screen,0.02-inch slot, PVC
Top of well casing
Top of 6-inch steel protective casing
Cement grout
Static water level7.30 feet belowland surface(11/8/2013)
Total depth drilled70 Depth of well
Figure 3a. Test-well construction schematic for the CAD site (Lower Patapsco aquifer system well).
15

BC 5S2E-26BC-14-0048
Not to scale
Depth, in feet below land surface
Altitude of landsurface: 68.7 feetabove sea level
0
110
92
120115
100
+3.07
4-inch PVC tail pipe
4-inch PVC well casing
Land surface
9.625-inch borehole
Cement
6-inch steel protective casing
Gravel (#1) pack4-inch diameter well screen,0.02-inch slot, PVC
Top of well casing
Top of 6-inch steel protective casing
Bentonite grout
Total depth of hole
Static water level45.63 feet belowland surface(11/8/2013)
Depth of well
Figure 3c. Test-well construction schematic for the Bay Brooks Park site.
16

BC 4S1E-5BC-14-0047
Not to scale
Depth, in feet below land surface
Altitude of landsurface: 37.4 feetabove sea level
Altitude of landsurface: 8.0 feetabove sea level
0
40
15
30
2-inch PVC well casing
Land surface
8.25-inch borehole
Cement
Gravel pack4-inch diameter well screen,0.02-inch slot, PVC
Vault
Cement groutStatic water level23.40 feet belowland surface(11/8/2013)
Depth of well and total depthdrilled
Top of well casing
BC 4S2E-5BC-14-0044
Not to scale
Depth, in feet below land surface
0
30
15
20
2-inch PVC well casing
Land surface
8.25-inch borehole
Cement
2-inch diameter well screen,0.02-inch slot, PVC
Vault
Bentonite
Bentonite plug
Static water level5.62 feet belowland surface(11/8/2013)
Depth of well and total depthdrilled
Top of well casing
Figure 3d. Test-well construction schematic for the Garrett Park site.
17 Gravel pack
17
Bentonite plug
Figure 3e. Test-well construction schematic for the MES Entrance site.
17

1,0000 2,000 Feet
0
20
40
00 50
20
40
60
80
100
120
140
160
180
200
220
240
260
SeaLevel
0
20
40
60
80
100
120
140
160
180
200
220
240
260
280
300
320
0
20
40
60
80
100
120
140
160
180
200
220
240
260
280
300
320
Resistivity, Ohm-mGamma radiation
Gamma radiation
100
120
140
160
180
40
60
80
200
220
240
260
280
300
320
20
SeaLevel
MES EntranceBC 4S2E-5Altitude = 8 feet
CAD siteBC 4S2E-6Altitude = 7 feet
Bay Brooks Park*BC 5S2E-26Altitude = 69 feet
De
pth
, in
fe
et,
re
late
d t
o s
ea
leve
l
De
pth
, in
fe
et,
re
late
d t
o s
ea
leve
l
Gamma radiation
Arundel Clay confining unit
Lower Patapsco aquifer system
Pre-Cretaceous basement rock
Patuxent aquifer system
I-895
Talbot Formation (silt-clay facies)
Well screen
Figure 4. Hydrogeologic cross section from Bay Brooks Park to the CAD site.
Land surface
N
BaltimoreHarbor Patapsco
River
A
/A
Approximate water-table
Qtc
Qtc
af
Qtc
af
Approximate brackish-water/freshwater interface
CAD cell
? ?
?
?
?
Artificial fill
*Geophysical log shown for the Bay Brooks test site is from an adjacent borehole (BC 5S2E-24).
A
/A
Vertical scale greatly exaggerated
EXPLANATION
Miles0 1 2
18

0
20
60
100
140
180
220
260
300
40
80
120
160
200
240
280
320
Gamma radiation
Figure 5. Hydrogeologic cross section from Anne Arundel County Dorsey Road well field to the CAD site.
CAD siteBC 4S2E-6Altitude = 7 feet
/BAnne Arundel CountyDorsey Road well field
AA Bd 98Altitude = 85 feet
SeaLevel
Depth
, in
feet, r
ela
ted t
o s
ea le
vel
Gamma radiation
Pre-Cretaceous basement rock
SeaLevel
Depth
, in
feet, r
ela
ted t
o s
ea le
vel
20
40
60
80
100
120
140
160
180
200
220
240
260
280
300
320
340
360
380
400
420
440
460
480
500
520
540
20
40
60
80
100
120
140
160
180
20
40
60
80
100
120
140
160
180
200
220
240
260
280
300
320
340
360
380
400
420
440
460
480
500
520
540
20
40
60
80
100
120
140
160
180
100
120
140
160
180
200
220
240
260
280
300
320
340
360
380
400
420
440
460
480
500
520
540
560
580
600
620
0
20
40
60
80
?
Patapsco confininig unit
Well screen
Vertical scale greatly exaggerated
Land Surface
0 1 20.5 Miles
/BBaltimoreHarbor
PatapscoRiver
B
N
Upper Patapsco
aquifer system
B
Arundel Clay confining unit
Lower Patapsco aquifer system
Patuxent aquifer system
0 0.5 1 Mile
19

895
695
97
o / //76 33 0
o / //38 15 30
o / //39 9 0
o / //76 39 30
Patapsco R
iver
Baltimore Harbor
Baltimore-Washington International
Thurgood Marshall Airport
Curtis Bay
Mar
ley
Cre
ek
Anne Aru
ndel
County
Baltimore
County
Ba
ltim
ore
Co
un
ty
Baltim
ore City
Ba
ltim
ore
City
Figure 6. Top of the Patuxent aquifer system.
EXPLANATION
Data point. Number is altitude of the top of the Patuxent aquifer system, in feet relative to sea level.
Approximate outcrop area of the Patuxent aquifer system.
0 2.51.25 Miles
0
-600
-200
-280
-118
-77
-400
-200 Contour showing the altitude of the top of the Patuxent aquifer system, in feet related to sea level. Contour interval is 100 feet.
-147
-280
-166
-82
CAD Site
20

695
895
97
o / //76 33 0
o / //38 15 30
o / //39 9 0
o / //76 39 30
Patapsco R
iver
Baltimore Harbor
Baltimore-Washington International
Thurgood Marshall Airport
Curtis Bay
Mar
ley
Cre
ek
Anne Aru
ndel
County
Baltimore
County
Ba
ltim
ore
Co
un
ty
Baltim
ore City
Ba
ltim
ore
City
Figure 7. Top of the Pre-Cretaceous basement rock.
EXPLANATION
Data point. Number is altitude of the top of the Pre-Cretaceousbasement rock, in feet relative to sea level. Numbers in italics are from Bennett and Meyer (1952).
0 2.51.25 Miles
0
-600
-800
-200
-540
-392
-257
-400
-800 Contour showing the altitude of the top of the Pre-Cretaceousbasement rock, in feet related to sea level. Contour interval is 200 feet.
-296
-339
-400
-343
-216
-494
-540
-405-405
-350
CAD Site
21

Figure 8. Drawdown and recovery data and transmissivity calculations for CAD test well BC 4S2E-7 (Lower Patapsco aquifer system).
Recovery Phase
Drawdown Phase0
10
20
30
40
50
1 10 100 1,000 10,000
Time since pumping started, in minutes
Dra
wd
ow
n, in
feet
Aquifer Test Date: 10/28/2013Aquifer: Lower Patapsco aquifer system
Pumping Rate (Q): 35 GPM
Transmissivity (T): 2,040 ft2/day
Slope of Line (s): 0.6 ft/log10
GPM = Gallons Per Minute
s
)Q)(35(T =
-5
0
5
10
15
1 10 100 1,000
Re
sid
ua
l d
raw
do
wn
, in
fe
et
Aquifer Test Date: 10/28/2013Aquifer: Lower Patapsco aquifer system
Pumping Rate (Q): 35 GPM
Transmissivity (T): 1,360 ft2/day
Slope of Line (s): 0.9 ft/log10
GPM = Gallons Per Minute
s
)Q)(35(T =
Time since pumping started/time since pumping stopped
22

0
5
10
1 10 100 1,000
Resid
ual d
raw
do
wn
, in
feet
Aquifer Test Date: 10/25/2013Aquifer: Patuxent aquifer
Pumping Rate (Q): 78 GPM
Transmissivity (T): 870 ft2/day
Slope of Line (s): 3.14 ft/log10
GPM = Gallons Per Minute
s
)Q)(35(T =
Time since pumping started/time since pumping stopped
Recovery Phase
0
10
20
30
40
50
0.1 1 10 100 1,000 10,000
Time since pumping started, in minutes
Dra
wd
ow
n, in
feet
Aquifer Test Date: 10/25/2013Aquifer: Patuxent aquifer
Pumping Rate (Q): 78 GPM
Transmissivity (T): 808 ft2/day
Slope of Line (s): 3.38 ft/log10
GPM = Gallons Per Minute
s
)Q)(35(T =
Drawdown Phase
Figure 9. Drawdown and recovery data and transmissivity calculations for CAD test well BC 4S2E-6 (Patuxent aquifer system).
23

-5
0
5
10
15
20
25
October November December January February
Wate
r le
vel, in feet re
late
d to s
ea level
Bay Brooks Park, Lower
Patapsco (BC 5S2E-26)
Garrett Park, Lower
Patapsco (BC 4S1E-5)
MES Entrance, Lower
Patapsco (BC 4S2E-5)
CAD site, Lower Patapsco(BC 4S2E-7)
CAD site, Patuxent (BC 4S2E-6)
2013 2014
Figure 10. Hydrograph showing water levels in test wells from October 2013 to February 2014.
24

2013
Wate
r le
vel,
in fe
et b
elo
w m
ea
surin
g p
oin
t
Ba
rom
etr
ic p
ress
ure
, in
fe
et o
f w
ate
r
Water level in well BC 4S2E-7
Barometric pressure
Figure 11a. Hydrograph showing water-level fluctuations in the CAD Lower Patapsco aquifer systemtest well.
0
1
2
3
4
5
6
7
8
9
10
1111/8 11/10 11/12 11/14 11/16 11/18 11/20 11/22 11/24 11/26 11/28 11/30 12/2 12/4 12/6 12/8 12/10 12/12 12/14 12/16 12/18 12/20
28
29
30
31
32
33
34
35
36
3
4
5
6
7
8
9
10
11
12
13
1411/8 11/10 11/12 11/14 11/16 11/18 11/20 11/22 11/24 11/26 11/28 11/30 12/2 12/4 12/6 12/8 12/10 12/12 12/14 12/16 12/18 12/20
28
29
30
31
32
33
34
35
36
2013
Wate
r le
vel,
in feet belo
w m
easu
ring p
oin
t
Baro
metr
ic p
ress
ure
, in
feet
of
wate
r
Water level in well BC 4S2E-6
Barometric pressure
Figure 11b. Hydrograph showing water-level fluctuations in the CAD Patuxent aquifer system test well.
25

21
22
23
2412/20 12/22 12/24 12/26 12/28 12/30 1/1 1/3 1/5 1/7 1/9
28
29
30
31
32
33
34
35
36
2013 2014
Wate
r le
vel,
in feet belo
w m
easu
ring p
oin
t
Baro
metr
ic p
ress
ure
, in
feet
of
wate
r
Water level in well BC 4S1E-5
Barometric pressure
Figure 11c. Hydrograph showing water-level fluctuations in the Garrett Park test well.
26

Barometric pressure
Water level in well BC 5S2E-26
Wate
r le
vel,
in feet belo
w m
easu
ring p
oin
t
Baro
metr
ic p
ress
ure
, in
feet
of
wate
r
2013 2014
47
48
49
5012/20 12/22 12/24 12/26 12/28 12/30 1/1 1/3 1/5 1/7 1/9 1/11 1/13 1/15 1/17 1/19 1/21 1/23 1/25 1/27 1/29 1/31 2/2 2/4 2/6 2/8
28
29
30
31
32
33
34
35
36
4
5
6
712/20 12/22 12/24 12/26 12/28 12/30 1/1 1/3 1/5 1/7 1/9 1/11 1/13 1/15 1/17 1/19 1/21 1/23 1/25 1/27 1/29 1/31 2/2 2/4 2/6 2/8
28
29
30
31
32
33
34
35
36
2013 2014
Wate
r le
vel,
in fe
et b
elo
w m
ea
surin
g p
oin
t
Baro
me
tric
pre
ssu
re, in
fe
et o
f w
ate
r
Water level in well BC 4S2E-5
Barometric pressure
Figure 11d. Hydrograph showing water-level fluctuations in the MES Entrance test well.
Figure 11e. Hydrograph showing water-level fluctuations in the Bay Brooks Park test well.
27

o / //76 33 0
o / //38 15 30
o / //39 9 0
o / //76 39 30
Patapsco R
iver
Baltimore Harbor
Baltimore-Washington International
Thurgood Marshall Airport
Curtis Bay
Mar
ley
Cre
ek
Anne Aru
ndel
County
Baltimore
County
Ba
ltim
ore
Co
un
ty
Baltimore City
Ba
ltim
ore
City
Figure 12. Altitude of the water table and potentiometric surface of the Lower Patapsco aquifer system in the fall of 2013.
EXPLANATION
Data point. Number is altitude of the water level in feet relatedto sea level
Approximate outcrop area of the Lower Patapsco aquifer system.
60
.
Contour showing the altitude of the water table or potentiometric surface, in feet related to sea level. Contour interval is 5 feet (0 - 10 feet) and10 feet (10 - 70 feet).
Generalized direction of groundwater flow.
Anne Arundel County Department of Public Works Lower Patapsco aquifer system production wells
52
0 2.51.25 Miles
6
3
13
75
3149
28
37
53
15
23
14
0
52
0
5
10
20
30
40
50
60
70
Bay Brooks Parktest site
CAD test site
28

Baltimore-Washington International
Thurgood Marshall Airport
695
895
97
o / //76 33 0
o / //38 15 30
o / //39 9 0
o / //76 39 30
Patapsco R
iver
Baltimore Harbor
Curtis Bay
Mar
ley
Cre
ek
Anne Aru
ndel
County
Baltimore
County
Ba
ltim
ore
Co
un
ty
Baltimore City
Ba
ltim
ore
City
Figure 13. Altitude of the potentiometric surface of the Patuxent aquifer system in the fall of 2013.
EXPLANATION
Data point. Number is altitude of the water level in feet relatedto sea level
Approximate outcrop area of the Patuxent aquifer system.
-20
.
Contour showing the altitude of the potentiometric surface, in feet related to sea level. Contour interval is 20 feet.
Generalized direction of groundwater flow.
Extent of brackish-water intrusion in 1982 (Chapelle and Kean, 1985)
Anne Arundel County Department of Public Works Patuxent aquifer system production wells (Dorsey Road well field)
0 2.51.25 Miles
-29
-40
2
-5
-59
-29
-109
-60
0
-80
-100
-60
-20
CAD test site
29

-25
-20
-15
-10
-5
0
5
7:00 AM 8:00 AM 9:00 AM 10:00 AM 11:00 AM 12:00 PM 1:00 PM 2:00 PM 3:00 PM
Patuxent well(BC 4S2E-6)
Lower Patapscowell (BC 4S2E-7)
Wate
r le
vel,
in f
eet,
rela
ted t
o s
ea le
vel
October 28, 2013
2
1
0
-1
Pumping period (35 gallons per minute)
-25
-20
-15
-10
-5
0
5
7:00 AM 8:00 AM 9:00 AM 10:00 AM 11:00 AM 12:00 PM 1:00 PM 2:00 PM 3:00 PM 4:00 PM
Lower Patapscowell (BC 4S2E-7)
Patuxent well(BC 4S2E-6)
Wa
ter
leve
l, in
fe
et, r
ela
ted
to
se
a le
vel
October 25, 2013
2
1
0
-1
Tidal record in Baltimore HarborNOAA National Ocean Service station 8574680
Pumping period (78 gallons per minute)
Figure 14. Water-level observations (A) in the Lower Patapsco well when the Patuxent well is pumped, and (B) in the Patuxent well when the Lower Patapsco well is pumped at the CAD site.
(B)
(A)
Lower Patapscoaquifer system
pumped
Patuxent aquifersystem pumped
Tidal record in Baltimore HarborNOAA National Ocean Service station 8574680
30
80 60 40 20 20 40 60 80
20
40
60
80 80
60
40
20
20
40
60
80
20
40
60
80
Ca Na+K HCO3 Cl
Mg+Fe SO4
Ca Cl
Mg
+ Fe N
a + K HC
O3
NO
+ SO
3
4
Ca + M
g + Fe
Ca+Mg+Fe,Cl+SO +NO4 3
Ca+Mg+Fe,Cl+SO +NO4 3
Na+K,
HCO3
Na+K,
HCO3
Figure 15. Piper diagram showing milliequivalent percentages of major ions in water samples taken from the CAD test wells in 2013.
EXPLANATION
BC 4S2E-7 Lower Patapsco aquifer system
Chesapeake Bay-bottom sediment pore water(Core 6, sample 8, 9/26/1978)(Tyree and others, 1981)
NO
+ S
O +
Cl
3
4
BC 4S2E-6 Patuxent aquifer system
31

Table 1. Construction data for the test wells.
[NAD, North American Datum; dd-mm-ss, degrees-minutes-seconds; ft, feet; in., inches;]
Well number
Well location/ aquifer
Permit number
Latitude, NAD 83
dd-mm-ss
Longitude, NAD 83
dd-mm-ss
Land surfacealtitude,
ft Drillingmethod
Depth drilled,
ft
Bottom of well,
ft
Screen,top,
ft
Screen,bottom,
ft
Casing and
screen diameter,
in.
Top of gravelpack,
ft Grout
material BC 4S1E-5 Garrett
Park, Lower
Patapsco
BC-14-0047 39-14-23.7 76-36-25.8 37.4 Auger 40 40 30 40 2 17 cement
BC 4S2E-5 MES Entrance,
Lower Patapsco
BC-14-0044 39-14-34.7 76-35-02.6 8.0 Auger 30 30 20 30 2 17 cement
BC 4S2E-6 CAD site, Patuxent
BC-14-0045 39-14-56.1 76-34-50.7 6.9 Mud rotary
310 185 160 180 4 142 cement
BC 4S2E-7 CAD site, Lower
Patapsco
BC-14-0046 39-14-56.2 76-34-50.5 7.0 Mud rotary
70 70 55 65 4 42 cement
BC 5S2E-26 Bay Brooks Park, Lower
Patapsco
BC-14-0048 39-13-49.3 76-35-44.6 68.7 Mud rotary
120 115 100 110 4 92 bentonite
32

Table 2. Water-quality data for the Lower Patapsco and Patuxent aquifer systems at the CAD site.
[µg/L, micrograms per liter; <, less than; mg/L, milligrams per liter; E, estimated; pCi/L, picocuries per liter; ng/L, nanograms per liter; N, nitrogen; P, phosphorus; mv, millivolts; µS/cm microsiemens per centimeter at 25 degrees Celsius; NTU, nephelometric turbidity units]
Parameter
BC 4S2E-7 Lower Patapsco aquifer system
BC 4S2E-6 Patuxent aquifer
system Aluminum, µg/L <75.8 4,6801 Ammonia nitrogen as N, mg/L 4.00 1.38 Antimony, µg/L <2.02 <2.02 Arsenic, µg/L 3.13 0.220 Barium, dissolved, mg/L 0.271 0.0892 Beryllium, dissolved, mg/L <0.00200 0.00940 Boron, µg/L 649 84.4E Bromide, mg/L 17.7 6.51 Calcium, mg/L 148 121 Cadmium, µg/L <1.01 1.3 Chloride, mg/L 4,5801 2,1701 Chromium, µg/L 0.110E 0.769 Cobalt, µg/L 30.5 242 Color, apparent, units 3501 <5 Copper, µg/L 126 75.1 Fluoride, mg/L <0.100 0.853 Gross Alpha particle activity, pCi/L 22.32 1202 Gross Beta particle activity, pCi/L 67.0 87.7 Iron, µg/L 123,0001 257 Lead, µg/L <1.26 2.61 Lithium, µg/L 19.2 79.8 Magnesium dissolved, mg/L 212 82.8 Manganese, µg/L 3,6301 6,6101 Mercury, ng/L 116 258 Molybdenum, µg/L 0.866E <1.52 Nickel, µg/L <10.1 203 Nitrite (as N), mg/L <0.0500 <0.0500 Orthophosphate as P, mg/L <0.0100 <0.0100 Oxygen, dissolved, mg/L, field 1.56 0 Oxidation-reduction potential, mv, field -87 281 pH, field 6.7 4.21 Phosphorus total, mg/L 0.0618 <0.0500 Potassium dissolved, mg/L 51.0 10.7 Radon-222, pCi/L 130 <39.2 Selenium, µg/L 0.294 6.91 Silica dissolved, mg/L 19.2 10.6 Silver dissolved, mg/L <0.0100 <0.0100 Sodium dissolved, mg/L 2,080 924 Specific conductance, µS/cm, field 11,600 6,460 Strontium dissolved, mg/L 1.71 0.833 Sulfate, mg/L 2881 191 Temperature, water, degrees Celsius, field 15.0 14.8 Thallium, µg/L 0.267E 0.481E Total dissolved solids, mg/L 6,0901 2,9501 Total nitrate/nitrite as N, mg/L <0.500 <0.500 Total organic carbon, mg/L 0.642 M0.500 Turbidity, NTU, field 11 0.1 Uranium dissolved, mg/L <0.00200 0.0119 Vanadium, µg/L 25.3 32.7 Zinc, µg/L 576 1,710
1 Exceeds U.S. Environmental Protection Agency’s Secondary Maximum Contaminant Level for drinking water 2 Exceeds U.S. Environmental Protection Agency’s Primary Maximum Contaminant Level for drinking water
33

Appendix A. Lithologic logs of drill cuttings and split-spoon samples for Garrett Park, MES Entrance, Bay Brooks Park, and CAD test wells.
Garrett Park test well (BC 4S1E-5)
1 Core recovery typically ranged from 1 to 1.5 feet.
Split-spoon core samples
Hydrologic unit
Core depth1 (feet below
land surface) Primary lithology Secondary description
0-1.5 Sand, with minor clay
Sand, mostly angular to sub-angular quartz; micaceous soil (fill?); color grades downward darker to lighter Top: Dark grey (7.5YR, 4/1) Bottom: Strong brown (7.5YR, 5/6)
5-6.5 Top: Sand Bottom: Sand, with minor clay
Top: Micaceous sandy soil (fill?); strong brown (7.5YR, 5/6); very fine to gravelly sand, mostly angular quartz Bottom: Sand, as above; reddish yellow (7.5YR, 7/6) clay
10-11.5 Clay Pale yellow (2.5Y, 8/4) and red (2.5YR, 5/6-5/8); clay concretions reddish brown to dark reddish brown (2.5YR, 4/3 – 3/3)
15-16.5 Clay Pale yellow (2.5Y, 8/4), red (2.5YR, 4/6 - 5/6), and white to pinkish white (2.5YR, 8/1 to 8/2)
20-21.5 Sand, with very minor clay globules
Very fine to medium sand, mostly quartz, sub-angular to sub-rounded; clay globules, pale yellow (2.5Y, 8/4) and reddish black (2.5YR, 2.5/1)
25-26.5 Top: Sand, with very minor clay Bottom: Clay
Top: Fine to coarse quartz, sub-rounded to rounded Bottom: White (5Y, 8/1)
30-31.5
Top: Sand, with minor clay Bottom: Clayey sand
Top: Fine to med sand, mostly quartz, sub-rounded; pinkish white to pink (2.5YR, 8/2 – 8/3) clay; approximately 1 inch at top is gravel with sand Middle: Black particles—possible concretion Bottom: Fine to medium granules, mostly quartz, sub-rounded; white (5Y, 8/1) and pinkish white to pink (2.5YR, 8/2 – 8/3) clay globules
35-36.5
Top: Clay Middle: Sand, with minor clay Bottom: Clay
Top: 1 to 4 inches of white (5Y, 8/1) and dark reddish brown (2.5YR, 2.5/3) clay Middle: 4 to 5 inches of fine to medium sub- rounded quartz sand in reddish brown clay matrix Bottom: White (5Y, 8/1) and dark reddish brown (2.5YR, 2.5/3) clay
Low
er P
atap
sco
aqui
fer
syst
em
40-41.5 Top: Clay Bottom: Sandy clay
Top: 1 to 4 inches of white (5Y, 8/1) clay Bottom: White (5Y, 8/1) clay; fine to medium, rounded, mostly quartz sand
34

Appendix A. Continued.
MES Entrance test well (BC 4S2E-5)
Split-spoon core samples
Hydrologic unit
Core depth1 (feet below
land surface) Primary lithology Secondary description
0-1.5 Sand with very minor silt
Very fine to very coarse, sub-rounded, mostly quartz, minor muscovite, lightly iron-stained, reddish yellow to strong brown (7.5YR, 6/6 - 5/6)
5-6.5 Sand with very minor clay
Very fine to coarse, sub-rounded to rounded, mostly quartz, minor muscovite, lightly iron-stained, strong brown (7.5YR, 5/6) light gray (7.5YR, 7/1) and red (2.5YR, 5/6)
10-11.5 Clay Light bluish gray to bluish gray (5PB, 7/1 – 6/1) with black to dark red mottling
15-16.5 Clay Bluish gray (10B, 5/1) 20-21.5 Clay Dark gray (4/N)
25-26.5
Top: Clay contact Remainder of core: Sand and gravel with minor clay
Top: Dark gray (4/N) Remainder of core: Medium to very coarse to cobbles, not well sorted, mostly quartz and very minor dark minerals, sub-rounded to rounded red (2.5YR, 4/8) and very light brown (10YR, 8/4) clay
Low
er P
atap
sco
aqui
fer
syst
em
30-31.5 Clay Greenish black (10Y, 2.5/1)
35

Appendix A. Continued.
Bay Brooks Park test well (BC 5S2E-26)
Mud-rotary ditch samples
Hydrologic unit
Depth (feet below
land surface) Primary lithology Secondary description
0-10 Sand Fine to medium grains, quartz, sub-rounded, organic fill and minor clay
10-20 Sand Medium to very fine granules, quartz, sub-rounded
20-30 Sand Medium to coarse grains, minor very fine granules, quartz, sub-angular to sub-rounded
30-40 Sand with very minor silt and clay
Fine to very coarse grains, quartz, sub-angular to sub-rounded
40-50 Sand with minor silt and clay
Medium to fine granules, mostly clear quartz, very minor rose quartz and rock fragments (meta-sandstone/conglomerate?), sub-angular to sub-rounded; white clay
50-60 Gravel with moderate amount of silty clay and very minor sand
Fine granules, quartz (some rose), sub-rounded to rounded white clay very minor fine to medium grains, quartz, sub-rounded
60-70 Gravel, as above As above
70-80
Gravel, as above except with significant amount of clay
As above
80-90 Clay with very minor gravel and sand
White clay, medium to fine granule grains, sub-angular, mostly quartz
90-100 Clay, as above (driller reported last 2 feet in sand)
As above
100-110
Clay, as above except with moderate amount of gravel and sand
As above, larger grains from above?
Low
er P
atap
sco
aqui
fer
syst
em
110-120 Sand with moderate amount of clay
Medium to fine granules, mostly quartz (some rose), rounded white clay
36

Appendix A. Continued.
CAD deep test well (BC 4S2E-6)
Mud-rotary samples
Hydrologic unit
Depth (feet below
land surface) Primary lithology Secondary description
0-10
Clay with moderate amount of sand, wood and shell fragments
Dark greenish gray (5GY, 4/1) clay, very micaceous fine to very coarse grains, mostly quartz, sub-rounded (very strong hydrocarbon smell, oily sheen2)
10-20 Clay, as above except no wood and shell fragments
As above, except for hydrocarbon smell
20-30 Sand with minor clay
Medium sand to fine pebbles, smaller grains mostly quartz, larger grains rock fragments, fill (?), angular to sub-angular, minor wood and shell fragments, minor greenish gray (5GY, 5/1) clay (organic mucky smell, cobble-sized coal chunk2)
30-40 Sand As above, except minor mica flakes (oily sheen2)
40-50 Clay with moderate amount of sand
Light and dark greenish gray (5GY, 8/1 and 4/1) clay fine to medium sand, mostly quartz, sub-angular (more sandy at interval base2)
50-60 Sand with very minor clay
Fine to very coarse sand, mostly medium, sub-angular quartz grains; medium dark gray clay
60-70 Sand Medium sand to medium pebbles, mostly quartz and rock fragments, angular to sub-angular
70-80 Sand with very minor clay and silt
Fine sand to fine pebbles, mostly quartz, minor rock fragments and mica, sub-angular (red and white clay washed out?2)
80-90 Gravel with very minor clay and silt
Very fine sand and fine to medium pebbles, mostly quartz, sub-angular to rounded (red clay washed out?2)
90-100 Gravel with minor clay
As above, except for more apparent red clay
100-110 Gravel with minor clay
As above
Low
er P
atap
sco
aqui
fer
syst
em
110-111 Very hard layer2 Very slow drilling2; likely iron-cemented sandstone
111-120 Gravel with clay and minor sand
Fine to medium pebbles, angular and very fine to medium sand, sub-rounded red, dark gray, and yellow clays; frequent lignite/peat fragments
120-130 Clay with very minor sand and gravel
Red and very dark greenish gray; very minor coarse sand to fine pebbles, angular to sub-angular, mostly quartz
130-140 Clay with minor sand and gravel
As above, except fine to medium sand grains
140-150 Clay with minor gravel
Red, brown and white clay; very coarse sand to fine pebbles, angular, mostly quartz, rare rock fragments and minor lignite/peat
Aru
ndel
Cla
y co
nfin
ing
unit
150-160 Clay with minor gravel
As above
2 Field notes
37

Appendix A. Continued.
CAD deep test well (BC 4S2E-6)—Continued
Mud-rotary samples—Continued
Hydrologic unit
Depth (feet below
land surface) Primary lithology Secondary description 160-170 Clay with minor
gravel As above
170-180 Clay with minor gravel As above
180-190 Sandy clay
Clay as above; fine to very coarse sand and fine pebbles, mostly quartz, rare mica, sub-rounded to rounded
190-200 Sandy clay As above 200-210 Clay with minor
gravel and sand Mottled clay, red, purple and white; coarse sand to fine pebbles, mostly quartz, sub-rounded
210-220 Clay with minor gravel and sand
Clay, as above, except greater amount of sand gravel
220-230 Clay with minor gravel and sand As above
230-240 Clay with minor gravel
Mostly white clay fine pebbles, mostly quartz, sub-rounded
240-250 Clay with minor gravel As above
250-260 Clay with minor gravel As above
260-270 Gravel with moderate amount of clay
Very fine to fine pebbles, fine to very coarse sand, mostly quartz, angular to sub-rounded white clay
270-280 Gravel with moderate amount of clay
Medium sand to fine pebbles, mostly quartz and rare mica, angular to sub-angular; white and red clay
280-290 Gravel with minor clay
Medium sand to fine pebbles, mostly quartz and rare mica, angular to sub-angular greasy green clay
Pat
uxen
t aqu
ifer
sys
tem
290-300 Gravel and sand with moderate amount of clay
Medium sand to medium pebbles, quartz, rock fragments (schist?) and mica, angular, dark red clay globules with medium to coarse sand, mostly quartz and yellow clay
300-310 Gravel and sand with moderate amount of clay and saprolite
As above, except with saprolite and no yellow clay
Pre
-C
reta
ceou
s ba
sem
ent r
ock
Drill bit sample at
309.8 Saprolite Green, mica rich clay
38

0
5
10
15
20
25
30
35
40
0 20 40 60
0
5
10
15
20
25
30
35
40
0 20 40 60 80 100 120
Garrett Park test siteBC 4S1E-5
Induction resistivity(Ohm-meters)
Gamma radiation(counts per second)
Appendix B. Geophysical logs run in test wells.
Depth
, in
feet
belo
w la
nd s
urf
ace
39

0
5
10
15
20
25
30
35
40
0 10 20 30
0
5
10
15
20
25
30
35
40
0 20 40 60 80 100 120
MES Entrance test siteBC 4S2E-5
Appendix B. Continued.
Depth
, in
feet
belo
w la
nd s
urf
ace
Induction resistivity(Ohm-meters)
Gamma radiation(counts per second)
40

0
10
20
30
40
50
60
70
80
90
100
110
120
130
140
150
160
170
180
190
200
210
220
230
240
250
260
270
280
290
300
310
320
0 50 100 150
0
10
20
30
40
50
60
70
80
90
100
110
120
130
140
150
160
170
180
190
200
210
220
230
240
250
260
270
280
290
300
310
320
600 700 800 900 1000
0
10
20
30
40
50
60
70
80
90
100
110
120
130
140
150
160
170
180
190
200
210
220
230
240
250
260
270
280
290
300
310
320
0 10000 20000 30000 40000
0
20
40
60
80
100
120
140
160
180
200
220
240
260
280
300
320
0 2000 4000 6000 8000 10000
8-inch
16-inch
32-inch
64-inch
CAD test siteBC 4S2E-6
Multi-point resistivity(ohm-meters)
Gamma radiation(counts per second)
Spontaneous potential(millivolts)
Single-point resistance(ohms)
Appendix B. Continued.D
epth
, in
feet
belo
w la
nd s
urf
ace
Top of Pre-Cretaceousbasement rock
Base of Patuxentaquifer system
Top of Patuxentaquifer system
Top of Arundel Clayconfining unit
41

0
20
40
60
80
100
120
0 50 100 150 200
Bay Brooks Park test siteBC 5S2E-26
0
20
40
60
80
100
120
0 20 40 60 80 100
Appendix B. Continued.
Depth
, in
feet
belo
w la
nd s
urf
ace
Induction resistivity(Ohm-meters)
Gamma radiation(counts per second)
42

Appendix C. Abbreviations used in this report
AADPW Anne Arundel County Department of Public Works af artificial fill BWI Baltimore-Washington International Thurgood Marshall Airport CAD confined aquatic disposal cm centimeter commun. communication E estimated ft feet ft2/d feet squared per day ft/mi feet per mile gal/min gallons per minute gpm gallons per minute (figs. 8 and 9) GPS global positioning system hr(s) hour(s) in. inch MCL Maximum Contaminant Level MES Maryland Environmental Service Mgal/d million gallons per day mg/L milligrams per liter MGS Maryland Geological Survey mi mile MPA Maryland Port Administration mrem/yr millirems per year mv millivolts N nitrogen NOAA National Oceanic and Atmospheric Administration ng/L nanograms per liter NTU nephelometric turbidity unit P phosphorus pCi/L picocuries per liter PVC polyvinyl chloride Q pumping rate Qtc Talbot Formation (silt-clay facies) s slope of line per log cycle SMCL Secondary Maximum Contaminant Level T transmissivity USEPA United States Environmental Protection Agency USGS United States Geological Survey µg/L micrograms per liter µS/cm microsiemens per centimeter at 25 degrees Celsius < less than
43

Martin O’Malley Joseph P. Gill Governor Secretary Anthony G. Brown Frank W. Dawson III Lt. Governor Deputy Secretary
A message to Maryland’s citizens The Maryland Department of Natural Resources (DNR) seeks to balance the preservation and enhancement of the living and physical resources of the state with prudent extraction and utilization policies that benefit the citizens of Maryland. This publication provides information that will increase your understanding of how DNR strives to reach that goal through the earth science assessments conducted by the Maryland Geological Survey.
Martin O’Malley Governor
MARYLAND DEPARTMENT OF NATURAL RESOURCES Resource Assessment Service Tawes State Office Building
580 Taylor Avenue Annapolis, Maryland 21401
Toll free in Maryland: 1-877-620-8DNR Out of State call: 1-410-260-8021
TTY users: Call via the Maryland Relay Internet Address: www.dnr.Maryland.gov
MARYLAND GEOLOGICAL SURVEY 2300 St. Paul Street
Baltimore, Maryland 21218 Telephone Contact Information: 410-554-5500
Internet Address: www.mgs.md.gov
DNR Publication Number 12-482014-707 April 2014
The facilities and services of the Maryland Department of Natural Resources are available to all without regard to race, color, religion, sex, sexual orientation, age, national origin or physical or mental disability.
This document is available in alternative format upon request from a qualified individual with a disability.


![Notes Hydrogeology[1]](https://static.fdocuments.net/doc/165x107/553cb15155034636568b4951/notes-hydrogeology1.jpg)


