Hydro risk curves and reserve energy dispatch guidelines
40
Hydro risk curves and reserve energy dispatch guidelines Explanatory Paper June 2009
Transcript of Hydro risk curves and reserve energy dispatch guidelines

Hydro risk curves and reserve energy dispatch guidelines
Explanatory Paper June 2009

Hydro risk curves and reserve energy dispatch guidelines
Glossary of abbreviations and terms
Ancillary service The system operator has contracts with generators, customers, retailers and distributors to provide ancillary services, which comprise black start, over frequency reserve, frequency keeping reserve (also known as frequency regulating reserve), instantaneous reserve and voltage support. The system operator obtains instantaneous reserve on a half-hourly basis through the market.
Automatic under-frequency load shedding (AUFLS)
Automatic shedding of electrical load to avoid cascade failure when frequency falls below a preset frequency
Base-load Generation
Electricity generation that is designed to operate continuously for most of the year (typically with high fixed costs and low operating costs)
Capacity The capability of generating plant to produce energy per unit of time (often expressed in megawatts)
Capacity adequacy Having enough capacity to meet high levels of demand while allowing for generation plant outages
Capacity shortfall A situation where available supply cannot meet demand plus losses, reserves, and frequency keeping requirements.
Combined cycle generation
Combined cycle is a term used when a power producing engine or plant employs more than one thermodynamic cycle. Heat engines are only able to use a portion of the energy their fuel generates (usually less than 50%). The remaining heat from combustion is generally wasted. Combining two or more "cycles" results in improved overall efficiency.
Constructive Dual Dynamic Programming (CDDP)
An analytical approach for determining optimal rules for hydro-thermal dispatch given uncertainty.
Demand for release (DFR) curve
A curve that represents the demand for hydro release as a function of price and is a component of the CDDP modelling.
Demand restraint Involuntary demand reductions
Dispatch policy A policy which determines the basis upon which reserve energy or reserve capacity will be offered into the wholesale electricity market
Electricity Act 1992 The Act, as amended by later Acts, that regulates the New Zealand electricity industry, and under which the Commission operates.
C 25 June 2009 3.47 p.m.

Hydro risk curves and reserve energy dispatch guidelines
Electricity Commission
The Electricity Commission established under subpart 1 of part 15 of the Electricity Act, also known as the Commission. The Commission is composed of six members appointed by the Minister of Energy to oversee the governance, operation and development of the New Zealand electricity industry.
Embedded generation
Generation that is connected to a local network rather than to the national grid.
Emergency storage guideline
The profile of New Zealand (or South Island) hydro storage over a calendar year which represents a 10% risk of future electricity shortages.
Emergency Response Plan
A plan developed and published by the Commission which sets out the particular emergency measures and the sequence they will be called upon, in the event that storage falls below the Emergency Storage Guideline
Expected Demand A mean estimate of electricity demand over a particular period of time (GWh or MW)
Forced outages Outages of generation or transmission equipment that are unexpected or un-scheduled
Forecast price Forecast prices are calculated from the pre dispatch schedule (PDS) up to 35 hours ahead of the start of any half-hour period and every two hours from then until the start of the specific trading period.
Frequency The frequency of the New Zealand grid is normally maintained at 50 Hertz frequency.
Frequency Keeping Reserve or Frequency Regulating Reserve (FRR)
An ancillary service used to keep the frequency of the grid within its normal band of 50±0.2Hz. Frequency keeping stations increase or decrease generation within a set band to ensure that supply equals demand on a second by second basis.
Generator A company that generates electricity connected to the grid or a local network.
Gigawatt hours (GWh)
One gigawatt hour is equal to one million kilowatt hours. New Zealand’s annual demand is approximately 40,000 GWh, excluding losses.
Grid The high-voltage electricity transmission network, which transmits electricity throughout New Zealand over more than 12,000km of transmission lines, from generators to distributors and major industrial users. It is also referred to as the national grid, and it is owned by state-owned enterprise Transpower.
D

Hydro risk curves and reserve energy dispatch guidelines
Grid Injection Point (GIP)
A point of connection where electricity flows into the national grid from generating stations.
Grid exit point (GXP)
A point of connection where electricity flows out of the national grid to local networks or direct consumers.
Hydro risk curve A profile of New Zealand (or South Island) hydro storage over a calendar year which represents a risk of future electricity shortages (curves for 1%, 2%, 4%, 6%, 8% risk are used)
HVDC High Voltage Direct Current transmission link which runs between Benmore in the central South Island, and Haywards near Wellington. A section of the link runs under Cook Strait via submarine cables.
Hydro spill Hydro spill refers to water flowing past a power station that is not being used to generate electricity.
Instantaneous reserves (IR)
Generation capacity that is made available to be used in the event of a sudden failure of a generating or transmission facility in order to maintain system frequency at above 48 Hz. Fast instantaneous reserve is available within six seconds and must be able to operate for one minute. Sustained instantaneous reserve is available within 60 seconds and must be available for 15 minutes.
Interruptible load (IL)
A type of instantaneous reserve that is provided by load that can be quickly disconnected, e.g. hot water heating.
Involuntary demand restraint
Involuntary restraint (or outages) can occur either from Automatic Under Frequency Load Shedding (AUFLS) during a system contingency (tripping of a large generation unit or transmission line), or from pre-contingent load shedding instructed by the System Operator.
Kilowatt-hour (kWh)
A kilowatt-hour is also known as a ‘unit’, and is the basis of retail sales of electricity.
Load Shedding The forced disconnection of load, in stages. This is either manual or automatic
Losses As electricity travels through the national grid, a proportion of energy is lost as heat due to the resistance in the lines. The greater the distance the electricity travels and the lower the voltage of the line, the higher the losses are.
Megawatt hour (MWh)
One megawatt hour is equal to 1,000 kilowatt hours. Megawatt hours are the metering standard unit for the wholesale market.
Node A point on the national grid where electricity either enters or exits the grid (a grid injection point or a grid exit point) or flows through (a transfer node).
E 25 June 2009 3.47 p.m.
Hydro risk curves and reserve energy dispatch guidelines
Offer An offer to sell a quantity of electricity at a specified price.
Reserve Energy that can be produced within seconds to maintain frequency in the event or generation or transmission line outage.
Scheduled outages Outages of generation or transmission equipment that are planned to occur (typically to allow for maintenance)
Spot market The buying and selling of wholesale electricity is done via a ‘pool’, where electricity generators offer electricity to the market and retailers and major users bid to buy the electricity. This market is called the spot or physical wholesale market.
Spot price The half-hour price of wholesale (‘spot’) market electricity published by the pricing manager.
System Operator (SO)
Service provider responsible for scheduling and dispatching electricity, in a manner that avoids fluctuations in frequency or disruption of supply. The system operator is currently Transpower.
Transpower The state-owned enterprise which owns the high-voltage transmission network (the national grid) and is the system operator.
Voluntary demand restraint
Demand reductions that occur in response to market participants forecasting a risk of high prices, or in response to System Operator warnings. It can also be contracted demand-side response
F

Hydro risk curves and reserve energy dispatch guidelines
Contents
Glossary of abbreviations and terms C
1. Introduction and purpose of this paper 1
2. Security of Supply Policy 3
2.1 Monitoring policy 3
2.2 Monitoring hydro storage 3
2.3 Dispatching reserve energy 4
3. Developing risk curves 6
Monitoring input assumptions 10 Monitoring storage 11
4. Developing dispatch guidelines 12
4.1 Overview 12
4.2 Approach 13 The Water Value Concept 13 Determining water value contours (approach and implementation) 14 Assumed SRMC and Demand Restraint Costs 16 Estimating the Whirinaki dispatch guideline 18 Mapping economic guidelines to risk curves 19 Monitoring input assumptions 21
5. Monitoring, response, and expectations 22
References 24
Appendix 1 Summary of assumptions 27
Tables
Table 1: Raw storage requirement data (2009) 7 Table 2: Monthly GXP demand assumptions 27 Table 3: Supply assumptions 28 Table 4: Assumed planned outages for 2009 (as at August 2008). 29 Table 5: River heating capacity limits on Huntly units 1-4 30
G 25 June 2009 3.47 p.m.
Hydro risk curves and reserve energy dispatch guidelines
Table 6: Key transmission constraint assumptions (MW sent) 31
Figures
Figure 1: Illustrative hydro risk curves 4 Figure 2: Simulated South Island storage requirements (June) 7 Figure 3: Highest 10 simulated South Island storage requirements (June 2009) 8 Figure 4: Deriving risk values for June 2009 9 Figure 5: 2009 hydro risk curves (as at November 2008) 10 Figure 6: Illustration of monitoring against risk curves 11 Figure 7: Illustrative water value contours 14 Figure 8: Cost of demand restraint curves 17 Figure 9: Summary of approach to developing risk curves and guidelines 18 Figure 11: Impact of SRMC on Whirinaki guideline 19 Figure 12: Comparison between dispatch guideline and risk curves 20 Figure 13: Risk Curve mapping versus Whirinaki SRMC 21 Figure 14: Commission response to storage 23
H
Hydro risk curves and reserve energy dispatch guidelines
1. Introduction and purpose of this paper 1.1.1 The Electricity Act 1992 (Act) and the Government Policy Statement on Electricity
Governance (GPS) establish a responsibility for the Electricity Commission (Commission) to manage the security of supply of electricity.
1.1.2 The Government published a revised GPS in May 2008. The revised GPS acknowledges the review of the reserve energy policy undertaken by the Commission during 2007 and implements some changes to the section on Security of Supply Policy. These changes follow the recommendations made by the Commission to the Minister in November 2007 following the review.
1.1.3 The Commission has subsequently reviewed its Security of Supply Policy to reflect the changes to the GPS and issued a revised policy in October 20081.
1.1.4 The revised policy indicates that the Commission will monitor hydro storage and publish assessments of short-term security of supply by comparing hydro storage against hydro risk curves, and develop a dispatch guideline (measured in GWh of storage) for each reserve energy option.
1.1.5 The purpose of this paper is to:
(a) Describe the approach used for deriving hydro risk curves; and
(b) Describe the approach to be used for deriving a hydro storage guideline for the dispatch of a reserve energy option (Whirinaki in the first instance).
1.1.6 Further information about the assumptions underpinning the figures and analysis in this report are available from the Electricity Commission on request.
1 See http://www.electricitycommission.govt.nz/opdev/secsupply/policy.
1 of 32 25 June 2009 3.47 p.m.


Hydro risk curves and reserve energy dispatch guidelines
2. Security of Supply Policy
2.1 Monitoring policy
2.1.1 The October 2008 Security of Supply Policy sets out that the Commission will monitor:
(a) New Zealand and South Island storage with respect to New Zealand and South Island hydro risk curves; and
(b) the dispatch of reserve energy options with respect to dispatch guidelines for respective options. This is currently limited to the dispatch of Whirinaki.
2.1.2 The policy relating to these two aspects is summarised below.
2.2 Monitoring hydro storage
2.2.1 The policy requires the Commission to develop, publish and regularly update, curves reflecting different levels of shortage risk. These are reflected in the Security of Supply Policy as follows:
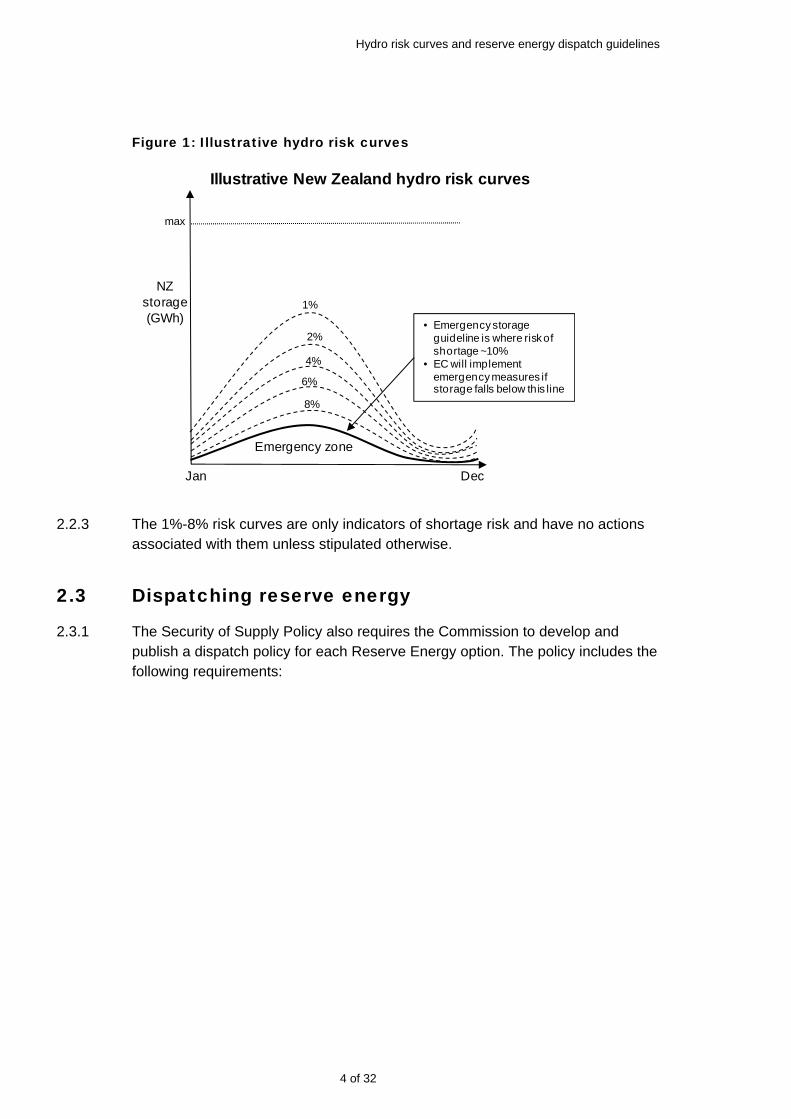
The Commission will monitor hydro storage and publish assessments of short-term security of supply at least monthly by comparing hydro storage against Hydro Risk Curves. Hydro Risk Curves will be determined for New Zealand as a whole and for the South Island and will take into account any transmission constraints that are likely to have a material effect on the curves. The Hydro Risk Curves will reflect the risk of future electricity shortages taking into account the range of likely inflows to hydro catchments. The Hydro Risk Curves will be updated whenever there is a change in supply, demand, or transmission that is likely to yield a material change to the curves. The Hydro Risk Curves will reflect estimates of 1%, 2%, 4%, 6%, 8%, and 10% risk of electricity shortages taking into account the range of likely inflows to hydro catchments. The Emergency Storage Guideline will correspond to a 10% risk of electricity shortages. The risk curves will take the form illustrated in the following chart.
2.2.2 The policy indicates that the guidelines will take the form illustrated in Figure 1.
3 of 32 25 June 2009 3.47 p.m.
Hydro risk curves and reserve energy dispatch guidelines
Figure 1: Illustrative hydro risk curves
NZstorage(GWh)
Jan Dec
max
Emergency zone
• Emergency storage guideline is where risk of shortage ~10%
• EC will implement emergency measures if storage falls below this line
Illustrative New Zealand hydro risk curves
2%
4%
6%
8%
1%
2.2.3 The 1%-8% risk curves are only indicators of shortage risk and have no actions associated with them unless stipulated otherwise.
2.3 Dispatching reserve energy
2.3.1 The Security of Supply Policy also requires the Commission to develop and publish a dispatch policy for each Reserve Energy option. The policy includes the following requirements:
4 of 32

Hydro risk curves and reserve energy dispatch guidelines
Consistent with the requirements of the Government Policy Statement, Reserve Energy or Capacity options will normally be offered for dispatch at the higher of $200 per MWh or the variable cost of the particular Reserve Energy or Capacity option. The Commission will develop and publish a specific Dispatch Policy for each Reserve Energy or Capacity option that takes into account the characteristics of the option (for example to account for the likely cost of running for very short periods). Individual dispatch policies could lead to complex offer structures involving several offer prices reflecting different circumstances. The Commission will also develop a Dispatch Guideline for each Reserve Energy option that reflects the level of storage at which it expects each particular Reserve Energy option to be dispatched. If storage falls below the Dispatch Guideline for a particular Reserve Energy option, and the market price is not sufficiently high for that Reserve Energy option to be operating, and the Commission is satisfied that the Reserve Energy option would contribute a material benefit to security of supply, it will adjust the offer for dispatch of that option to ensure that it does operate. Under these circumstances the Commission will investigate why market prices were not sufficiently high for Reserve Energy to operate and consider whether any changes to security of supply policy may be necessary.
2.3.2 In terms of developing a dispatch guideline, the key aspect of the policy above is the need to estimate the storage level at which a reserve energy option would be dispatched.
5 of 32 25 June 2009 3.47 p.m.

Hydro risk curves and reserve energy dispatch guidelines
3. Developing risk curves 3.1.1 The approach taken to deriving risk curves is a small extension of the approach
taken to deriving the emergency zone over recent years (under the previous Security of Supply Policy and as discussed in the explanatory paper to that policy2). The policy describes that the risk curves will reflect the risk of shortages. For the purposes of monitoring, shortage is defined as running out of water given a number of “core assumptions” about supply and demand, which include:
(a) Geothermal, cogeneration, wind, and small hydro plant operate to expected levels;
(b) Storable inflows are conserved where possible; and
(c) All thermal plant operates at maximum levels to meet demand, subject to adjustments to capacity for planned and forced outages, fuel constraints and transmission constraints;
(d) Forecast expected demand is reduced to reflect voluntary reductions in demand due to price3).
3.1.2 The reason for using these assumptions is that they provide a plausible and stable benchmark set of assumptions against which to assess “risk” when storage levels are low. These assumptions are summarised in Appendix 1. The Commission will publish the assumptions used in deriving the hydro risk curves that apply at any given time.
3.1.3 Given the core assumptions above, supply and demand can be simulated4 over the year, across all historic inflow sequences, to arrive at distributions of storage requirements for a range of starting points throughout a year (usually the 1st of each month). The storage requirement associated with a particular inflow sequence reflects the storage (in GWh) at the start of that sequence that would avoid any further demand restraint. Storage requirements for “dry” sequences will be higher than those of “wet” sequences, which will have a low or zero storage requirement.
3.1.4 A distribution of storage requirements can be produced for each month of the year from each simulated inflow sequence. To illustrate, consider the distribution of simulated South Island storage requirements for June 2009 as shown in Figure 2. (For reference, Table 1 contains the highest 15 simulated South Island storage requirements starting from each month in 2009).
2 See http://www.electricitycommission.govt.nz/consultation/sospolicy. 3 No adjustment is made for additional demand response such as that from savings campaigns or the impact of
additional supply/reduced demand from implementing emergency measures. 4 Model runs have been performing using Energylink’s Emarket3 simulation model.
6 of 32

Hydro risk curves and reserve energy dispatch guidelines
Figure 2: Simulated South Island storage requirements (June)
0
500
1000
1500
2000
1 11 21 31 41 51 61 71
South Island
storage
requ
irem
ent from June
1 (GWh)
Simulated inflow sequence
Table 1: Raw storage requirement data (2009)
Rank Jan Feb Mar Apr May Jun Jul Aug Sep Oct Nov Dec
1 242 671 1270 1418 1631 1527 1224 1005 654 258 146 102
2 227 670 1072 1084 1483 1348 1100 867 494 168 144 85
3 119 662 895 1072 1089 1321 1088 732 434 148 113 82
4 105 438 758 1018 1050 1014 1068 714 374 131 90 69
5 75 347 633 891 1049 981 994 670 321 99 78 69
6 39 274 629 854 1040 976 985 648 308 83 76 64
7 36 151 553 778 959 951 978 624 302 47 76 63
8 0 146 496 731 916 923 942 597 293 43 69 60
9 0 140 477 677 911 915 867 553 289 43 67 55
10 0 112 431 648 890 907 850 545 260 41 65 51
11 0 110 349 606 883 873 827 537 259 40 62 48
12 0 109 332 589 835 867 820 516 247 36 61 45
13 0 107 313 586 811 861 792 487 229 35 61 28
14 0 107 290 525 782 857 786 484 220 32 57 22
15 0 105 240 497 762 816 739 460 207 30 54 20
3.1.5 The “storage requirement” in the chart and table represent the minimum South Island storage required to meet demand without additional demand restraint given the core input assumptions.
7 of 32 25 June 2009 3.47 p.m.
Hydro risk curves and reserve energy dispatch guidelines
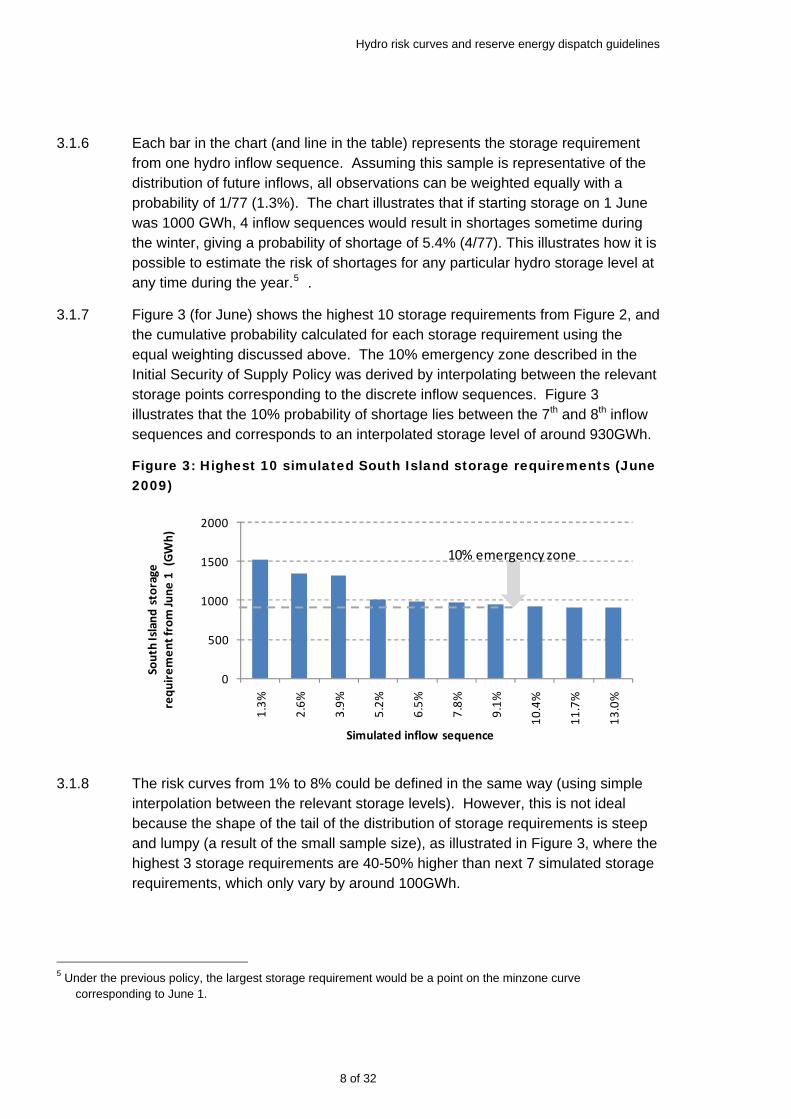
3.1.6 Each bar in the chart (and line in the table) represents the storage requirement from one hydro inflow sequence. Assuming this sample is representative of the distribution of future inflows, all observations can be weighted equally with a probability of 1/77 (1.3%). The chart illustrates that if starting storage on 1 June was 1000 GWh, 4 inflow sequences would result in shortages sometime during the winter, giving a probability of shortage of 5.4% (4/77). This illustrates how it is possible to estimate the risk of shortages for any particular hydro storage level at any time during the year.5 .
3.1.7 Figure 3 (for June) shows the highest 10 storage requirements from Figure 2, and the cumulative probability calculated for each storage requirement using the equal weighting discussed above. The 10% emergency zone described in the Initial Security of Supply Policy was derived by interpolating between the relevant storage points corresponding to the discrete inflow sequences. Figure 3 illustrates that the 10% probability of shortage lies between the 7th and 8th inflow sequences and corresponds to an interpolated storage level of around 930GWh.
Figure 3: Highest 10 simulated South Island storage requirements (June 2009)
0
500
1000
1500
2000
1.3%
2.6%
3.9%
5.2%
6.5%
7.8%
9.1%
10.4%
11.7%
13.0%
South Island
storage
requ
irem
ent from June
1 (GWh)
Simulated inflow sequence
10% emergency zone
3.1.8 The risk curves from 1% to 8% could be defined in the same way (using simple interpolation between the relevant storage levels). However, this is not ideal because the shape of the tail of the distribution of storage requirements is steep and lumpy (a result of the small sample size), as illustrated in Figure 3, where the highest 3 storage requirements are 40-50% higher than next 7 simulated storage requirements, which only vary by around 100GWh.
5 Under the previous policy, the largest storage requirement would be a point on the minzone curve
corresponding to June 1.
8 of 32

Hydro risk curves and reserve energy dispatch guidelines
3.1.9 To address this, functions6 have been fitted to the tail of the distributions of storage requirements for each month, resulting in smoother curves that would characterise a larger sample size. While more complex approaches could be considered, this approach is considered appropriate and robust given the purpose (and intended interpretation) of these curves, as well as the nature of the underlying core assumptions.
3.1.10 Figure 4 illustrates the function7 fitted to the June storage requirements and the storage levels corresponding to the 1% through 10% risk levels (with the 10% level being the point on the emergency storage guideline). Note that the function is only fitted to the highest 10-15 values of the distribution as this is the relevant data set.
Figure 4: Deriving risk values for June 2009
1%
2%4%
6%8% 10%
‐
500
1,000
1,500
2,000
0% 2% 4% 6% 8% 10% 12% 14%
South Island
storage
req
uiremen
t from
June
1 (GWh)
3.1.11 The process illustrated for June has been repeated for each month to arrive at a set of storage levels corresponding to each risk level. Together, these are used to produce the risk curves contemplated by the Security of Supply Policy. The policy also indicates that two sets of risk curves will be published; a set for New Zealand and a set for the South Island.8 Using an initial set of assumptions for
6 Log functions of the form y = a x log(z) + b were fitted where y is the storage level corresponding to risk level z
(expressed as a fraction). 7 For June 2009 the function is 358.1 - 602.5 x log(z). For example, the 4% risk storage for June is calculated as
358.1 - 602.5 x log(.04) = 358.1+602.5 x 1.398 = 1,200GWh. 8 The practice under the previous policy involved splicing the New Zealand and South Island minzones together.
When the South Island minzone exceeded the New Zealand minzone this reflected the case that North Island storage did not add to the security of meeting South Island demand over critical inflow sequence. South island demand was the demand at greater risk of not being supplied at the desired security standard for the worst inflow sequence.
9 of 32 25 June 2009 3.47 p.m.
Hydro risk curves and reserve energy dispatch guidelines
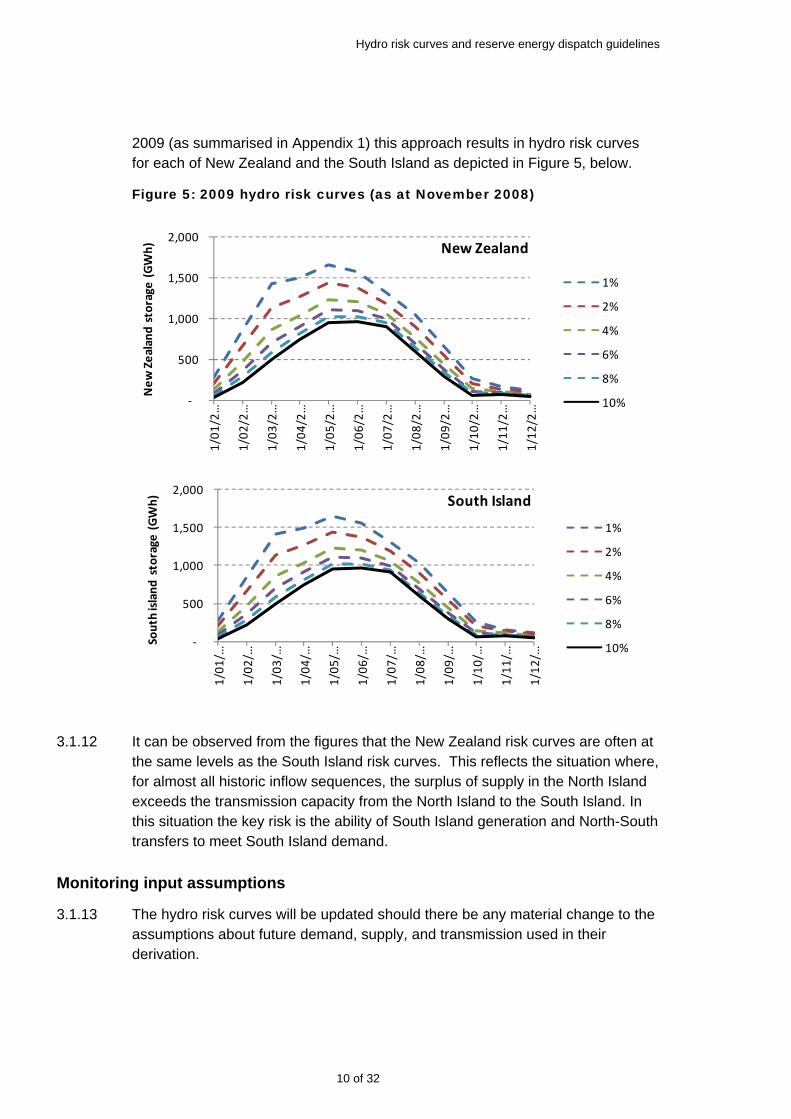
2009 (as summarised in Appendix 1) this approach results in hydro risk curves for each of New Zealand and the South Island as depicted in Figure 5, below.
Figure 5: 2009 hydro risk curves (as at November 2008)
‐
500
1,000
1,500
2,000
1/01
/…
1/02
/…
1/03
/…
1/04
/…
1/05
/…
1/06
/…
1/07
/…
1/08
/…
1/09
/…
1/10
/…
1/11
/…
1/12
/…
South island
storage
(GWh) South Island
1%
2%
4%
6%
8%
10%
‐
500
1,000
1,500
2,000
1/01
/2…
1/02
/2…
1/03
/2…
1/04
/2…
1/05
/2…
1/06
/2…
1/07
/2…
1/08
/2…
1/09
/2…
1/10
/2…
1/11
/2…
1/12
/2…
New
Zealand
storage
(GWh) New Zealand
1%
2%
4%
6%
8%
10%
3.1.12 It can be observed from the figures that the New Zealand risk curves are often at the same levels as the South Island risk curves. This reflects the situation where, for almost all historic inflow sequences, the surplus of supply in the North Island exceeds the transmission capacity from the North Island to the South Island. In this situation the key risk is the ability of South Island generation and North-South transfers to meet South Island demand.
Monitoring input assumptions
3.1.13 The hydro risk curves will be updated should there be any material change to the assumptions about future demand, supply, and transmission used in their derivation.
10 of 32
Hydro risk curves and reserve energy dispatch guidelines
3.1.14 The intention is to have a set of curves that are stable, relatively simple to explain, and are a potentially useful tool for discussions with stakeholders given the ability to repeat the analysis with different assumptions.
Monitoring storage
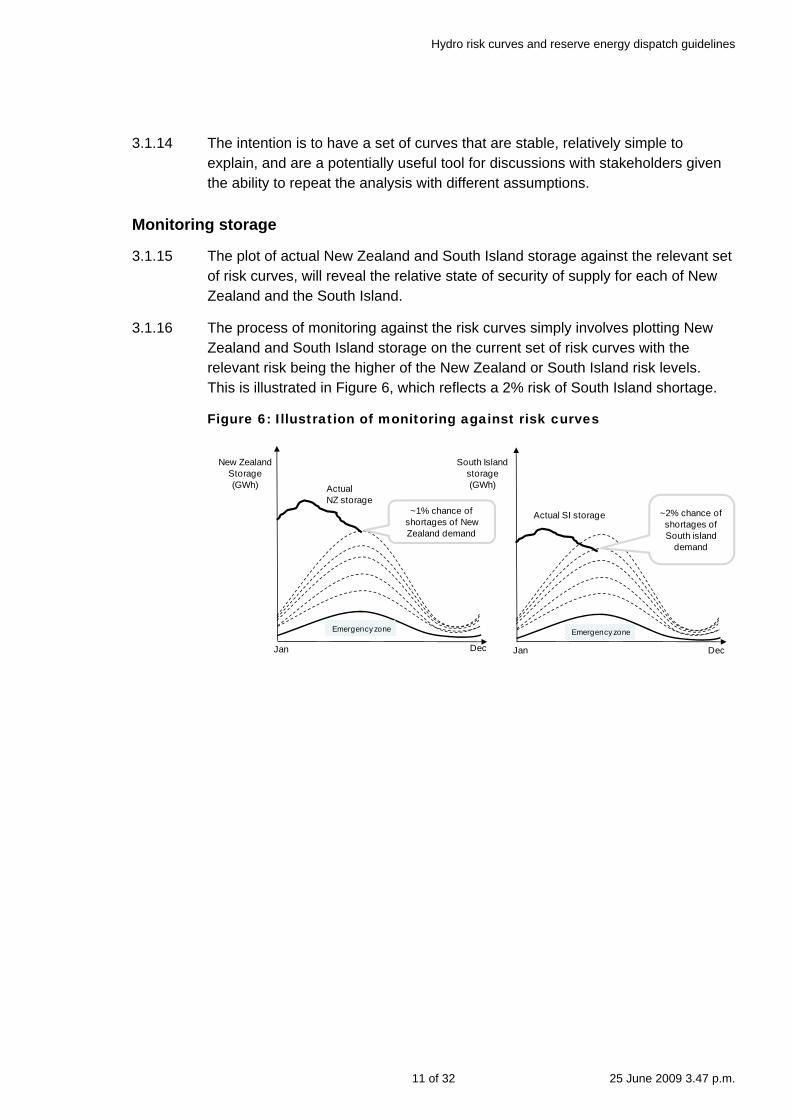
3.1.15 The plot of actual New Zealand and South Island storage against the relevant set of risk curves, will reveal the relative state of security of supply for each of New Zealand and the South Island.
3.1.16 The process of monitoring against the risk curves simply involves plotting New Zealand and South Island storage on the current set of risk curves with the relevant risk being the higher of the New Zealand or South Island risk levels. This is illustrated in Figure 6, which reflects a 2% risk of South Island shortage.
Figure 6: Illustration of monitoring against risk curves
New ZealandStorage (GWh)
Jan Dec
Emergency zone
South Islandstorage(GWh)
Jan Dec
Emergency zone
~1% chance of shortages of New Zealand demand
~2% chance of shortages of South island
demand
Actual NZ storage
Actual SI storage
11 of 32 25 June 2009 3.47 p.m.

Hydro risk curves and reserve energy dispatch guidelines
4. Developing dispatch guidelines
4.1 Overview
4.1.1 The Security of Supply Policy indicates that dispatch guidelines will be derived for reserve energy options. A dispatch guideline represents the level of storage at which the Commission “expects each particular Reserve Energy option to be dispatched”. Reserve energy will normally be offered for dispatch at the higher of $200/MWh or its short run marginal cost (SRMC)9.
4.1.2 The approach used to determine the energy and capacity margins outlined in the Security of Supply Policy involved trading the costs of additional supply against the costs of additional demand restraint so as to minimise total cost (and also minimising national costs). The same principle can be applied when considering the point at which reserve energy should be dispatched.
4.1.3 The hydro risk curves discussed in the previous section reflect a probability of hydro lakes running empty assuming: thermal generation is maximised, an adjustment for voluntary demand response, and that discretionary hydro generation is minimised when needed to avoid demand restraint for historic inflow sequences. The curves do not, however, directly capture or reflect the economic implications of low storage levels and progressive levels of demand response with different costs. Additional analysis of these issues is therefore needed in order to estimate the storage level at which reserve energy would be expected to be dispatched.
4.1.4 This section:
(a) Summarises the concepts and technical aspects of the methodology used to derive dispatch guidelines;
(b) Discusses the assumptions used to determine dispatch guidelines; and
(c) Derives a dispatch guideline for Whirinaki derived using the methodology.
4.1.5 This section assumes the reader has some familiarity with the principles underlying the optimisation of hydro/thermal scheduling.
9 This is also called the short run variable operating cost, or variable payment rate, of the reserve energy option.
This includes charges that depend on utilisation (to recover variable operating costs such as fuel, maintenance etc), but excludes the fixed payments (to recover fixed capital and operating costs) that do not depend on utilisation. In this context the SRMC relates to operating for extended periods. There may be elements of the short run marginal cost of a reserve contract (such as start costs, increasing efficiency curves etc) that are relevant for dispatch in a peaking mode. These will need to be incorporated into a general dispatch policy, but are not addressed in this paper.
12 of 32

Hydro risk curves and reserve energy dispatch guidelines
4.2 Approach
4.2.1 The Commission has considered two approaches to determining the dispatch guideline:
(a) Arbitrarily selecting a risk level (and associated hydro risk curve) at which the reserve energy option is expected to operate10; and
(b) Deriving a guideline that reflects an economic trade-off between the cost of operating reserve energy to conserve storage and the benefits of avoiding additional demand restraint in the future.
4.2.2 The advantage of the first approach is that it is relatively easy to calculate and monitor and it provides greater certainty. The Commission is already required to calculate and publish a set of hydro risk curves for information and monitoring and so no additional work would be required. The difficulty with this approach is that there is no objective basis for determining the risk level appropriate for a particular Reserve Energy option such as Whirinaki, nor is there a sound basis for adjusting the risk level to reflect changing operating costs (due to changes in oil prices for example) or for choosing the risk level that would be appropriate for other reserve energy options with different variable costs.
4.2.3 The Commission has chosen the second approach. It addresses the deficiencies of the first approach and is consistent with the approach used to determine the energy and capacity margins outlined in the Security of Supply Policy..
The Water Value Concept
4.2.4 Applying the economic trade-off approach, the economic guideline is the storage level at which the value of conserving water (the water value) equals the offer price of the reserve energy option.
4.2.5 The water value is the economic value of conserving a unit of storage now for release at a later date. It reflects the value of reducing the risk, cost, and possible extent of demand restraint at a later point in time. The water value associated with a particular level of storage at a given time of year can be derived by simulating the operation of the electricity system over a full range of future uncertainties (hydro inflows, demand and generation plant availability) and assessing the extent, duration and cost of different levels of demand restraint required in each case. In many cases inflows will be such that lake levels rise and no additional demand restraint will be required and that reserve generation options may be backed off. However, there is always a risk that inflows stay low and lake levels continue to fall and additional, costly, demand restraint is
10 Under the previous Security of Supply Policy, the minzone was used.
13 of 32 25 June 2009 3.47 p.m.

Hydro risk curves and reserve energy dispatch guidelines
required. A water value reflects the expected value of these outcomes and varies across the level of storage and time of year.
4.2.6 A water-value contour can be created by determining the storage levels over the year that have the same water value; the contour with a value corresponding to the SRMC of a reserve energy option corresponds to its dispatch guideline. A hypothetical set of water value contours is illustrated in Figure 7. In New Zealand water values tend to increase going into winter (when inflows are typically lower and demand is higher) and fall during the spring (when inflows are typically highest and demands are lower).
Figure 7: Illustrative water value contours
Storage(GWh)
Jan Dec
Illustrative water-value contour s which have a constant water value ($/MWh)
$20/MWh
$200/MWh
$2000/MWh
Determining water value contours (approach and implementation)
4.2.7 There are a number of different methods that can be used to derive water value contours. These have been used extensively in New Zealand over the 20 years and include variants of dynamic programming developed by Dr Grant Read and a number of his students.
4.2.8 The Commission chose to use a single reservoir version of constructive dual dynamic programming (CDDP) as described in T. J. Scott and E. G. Read (1996) and T J Scott (1997). This is a simple model to implement11, it can be solved very quickly and is well suited to incorporating continuous demand response curves. It can also utilize the same set of market simulations used to derive the risk curves described in Section 3.
4.2.9 The CDDP methodology is fully described in T. J. Scott (1997) and is not repeated here; however there are some important differences in implementation
11 It was not considered worth the effort of implementing or adapting more complex multi-reservoir models such
as RESOP (Read 1985, 1990) given that water value curves above the variable operating costs of reserve energy plant are most relevant (i.e. greater than $200/MWh) and given the inherent uncertainty in shortage and future oil costs.
14 of 32

Hydro risk curves and reserve energy dispatch guidelines
worth noting. These relate to choice of reservoir aggregation, demand for release curves and adjustments for serial correlation.
4.2.10 A single South Island reservoir was chosen for analysis rather than a single NZ reservoir model since most of the significant long term hydro storage is in the South Island, and there is currently limited capacity to transfer power from the North to the South Island12.
4.2.11 The CDDP model uses demand-for-release (DFR) curves. These represent the demand for releases from South Island storage as a function of the marginal value of releases each period. Scott (1997) derives the demand-for-release curves from a separate short run model of Cournot oligopoly or competitive market behaviour; however these have been derived from the market simulations used to derive the risk curves13 simulation model, then adjusted to reflect the assumed costs of demand restraint.
4.2.12 A base set of DFR curves is derived from the simulation model used to generate the risk curves for 2009 as discussed earlier. This base DFR corresponds to the hydro release required with all thermal plant (including Whirinaki) operating at capacity and 2% market demand response. The marginal value of this base level of release equals the cost of the most expensive thermal plant operating (i.e. the Whirinaki SRMC). 14
4.2.13 The base DFR curves are adjusted to account for situations with higher or lower marginal values (or prices) and the associated change to demand restraint:
(a) The release required at higher marginal values (i.e. greater than 2% demand reduction) is equal to the base level adjusted downwards to account for additional demand reductions in the South Island and to account for any increase in North South HVDC transfer made possible by demand reductions in the North Island. Note that additional North-South transfer is limited by the capacity of the HVDC and the capacity of the AC system through the lower North Island (mainly the Bunnythorpe-Haywards constraint).
(b) The demand-for-release at lower marginal values is equal to the base level adjusted upwards to account for backing off the 2% demand savings and
12 Once the transfer capacity between the islands is increased it may be better to use a single aggregate New
Zealand hydro reservoir approximation. 13 The Emarket3 model has been used to calculate the weekly release required from South Island reservoirs over
a set of historical inflows accounting for North and South Island demand with 2% savings, transmission constraints, full operation of thermal plant, within day scheduling constraints and expected scheduling of North Island reservoirs.
14 Note that it is assumed that the cost of a voluntary 2% market demand response is less than the Whirinaki SRMC but more than that of all other thermal plant.
15 of 32 25 June 2009 3.47 p.m.
Hydro risk curves and reserve energy dispatch guidelines
for reductions in North South Transfer from backing off peaking and other thermal generation in the North Island15.
4.2.14 An adjustment is also needed to account for inflow correlation. Previous work (see E. G. Read and M. Yang 1993) has identified problems with the simple CDDP methodology if hydro inflows are correlated from period to period. The weekly serial correlation in South Island inflows is approximately 0.7 to 0.8. This is significant and so a simple heuristic method16 was used to account for this effect. This heuristic was calibrated by comparing water values derived from the adjusted CDDP methodology with incremental water values derived by simulation17 over a grid of starting storages for each month in the year.
Assumed SRMC and Demand Restraint Costs
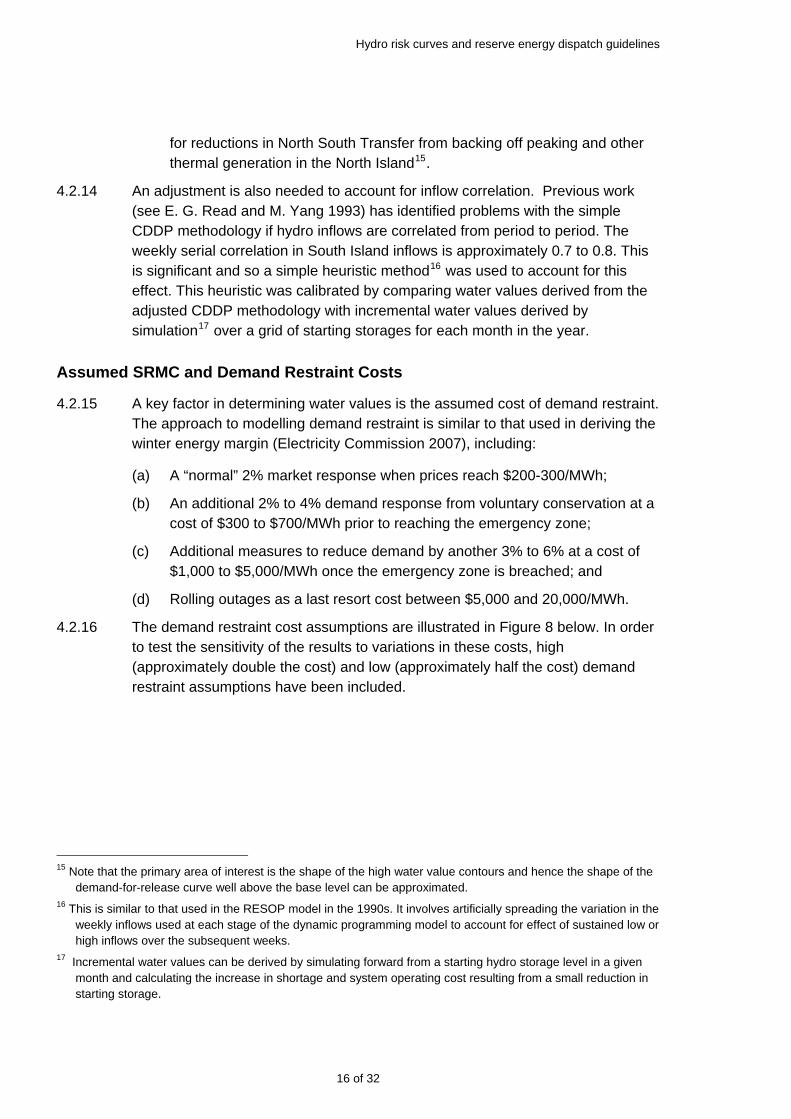
4.2.15 A key factor in determining water values is the assumed cost of demand restraint. The approach to modelling demand restraint is similar to that used in deriving the winter energy margin (Electricity Commission 2007), including:
(a) A “normal” 2% market response when prices reach $200-300/MWh;
(b) An additional 2% to 4% demand response from voluntary conservation at a cost of $300 to $700/MWh prior to reaching the emergency zone;
(c) Additional measures to reduce demand by another 3% to 6% at a cost of $1,000 to $5,000/MWh once the emergency zone is breached; and
(d) Rolling outages as a last resort cost between $5,000 and 20,000/MWh.
4.2.16 The demand restraint cost assumptions are illustrated in Figure 8 below. In order to test the sensitivity of the results to variations in these costs, high (approximately double the cost) and low (approximately half the cost) demand restraint assumptions have been included.
15 Note that the primary area of interest is the shape of the high water value contours and hence the shape of the
demand-for-release curve well above the base level can be approximated. 16 This is similar to that used in the RESOP model in the 1990s. It involves artificially spreading the variation in the
weekly inflows used at each stage of the dynamic programming model to account for effect of sustained low or high inflows over the subsequent weeks.
17 Incremental water values can be derived by simulating forward from a starting hydro storage level in a given month and calculating the increase in shortage and system operating cost resulting from a small reduction in starting storage.
16 of 32

Hydro risk curves and reserve energy dispatch guidelines
Figure 8: Cost of demand restraint curves
-
1,000
2,000
3,000
4,000
5,000
6,000
7,000
8,000
9,000
10,000
0% 5% 10% 15%
Mar
gina
l Cos
t $/M
Wh
Cumulative Demand reduction
High CNS Base Low CNS
4.2.17 The CDDP approach balances the expected cost of demand restraint against the costs of thermal dispatch. In particular:
(a) The marginal cost of thermal plant (Huntly, CCGTs, and OCGTs) is assumed to be in the range of $60 to $100/MWh.
(b) The SRMC assumed for Whirinaki is rounded to $400/MWh18.
4.2.18 Figure 9 presents the assumptions and models used to develop both the risk curves and dispatch guidelines in a schematic form.
4.2.19 As has been discussed, the demand restraint assumptions are an input to the CDDP model, while the demand for release curves are derived from the output of the market simulation model and reflect the week to week supply/demand balance across the inflow sequences. While the risk curves and dispatch guideline have a number of commonalities, they are derived using separate models.
18 Based on current fuel stocks, Whirinaki’s SRMC is $387/MWh, with rounding up reflecting a nominal adjustment
for losses incurred in transmission to the South Island.
17 of 32 25 June 2009 3.47 p.m.

Hydro risk curves and reserve energy dispatch guidelines
Figure 9: Summary of approach to developing risk curves and guidelines
Market simulation model• Simulates system f rom
1st of each month of year (daily and day/night resolution)
• Assumes hydro storage conserved where possible
Demand• EC demand forecasts • Allocate annual forecast to
months and adjust for voluntary response
Outages• Adjust capacity for planned
outages and derate by forced outage rates
Transmission• Summer/winter MW limits
and resistanceInflows• 77 years of inf low data
Jan Dec
max
Emergency zone
• Emergency storage guideline is where risk of shortage ~10%
• EC will implement emergency measures if storage falls below this line
2%
4%
6%
8%
1%
New Zealand and South Island storage requirements derived f rom simulated storage
Demand for release curves derived f rom distributions of simulated hydro generation
CDDP model• Determines water
value contours (for South Island)
Cost assumptions• Demand restraint• SRMC of reserve energy
other thermal plant
Risk curves
Dispatch guidelinesSupply• Existing, committed and
highly likely plantStorage(GWh)
Jan Dec
Illustrative water-value contour s which have a constant water value ($/MWh)
$20/MWh
$200/MWh
$2000/MWh
Estimating the Whirinaki dispatch guideline
4.2.20 South Island water value contours were calculated based on the supply, transmission and demand assumptions described in Appendix 1 and the base case demand restraint and Whirinaki SRMC cost assumptions discussed in the previous section. Figure 10 shows the dispatch guideline (or water value contour) for Whirinaki assuming a $400/MWh dispatch cost (solid blue line).
Figure 10: Impact of demand restraint cost on $400/MWh Whirinaki dispatch guideline
-
200
400
600
800
1,000
1,200
1,400
1,600
1,800
2,000
Jan Feb Mar Apr May Jun Jul Aug Sep Oct Nov Dec
SI S
tora
ge G
Wh
High Demand Restraint Cost
Base Case
Low Demand Restraint Cost
18 of 32

Hydro risk curves and reserve energy dispatch guidelines
4.2.21 Once South Island hydro storage falls into or below this zone it would be in the national interest to operate Whirinaki to conserve South Island hydro storage and to reduce the risk and cost of demand restrictions.
4.2.22 Also shown in Figure 10 are $400/MWh dispatch guidelines with different assumptions about the costs of demand restraint. These alternative assumptions produce a ±100 GWh shift in the dispatch guidelines in the autumn and winter periods (which are those most affected by long dry inflow sequences). From spring onwards, there is no material effect on the guidelines, which drop rapidly due to the high spring inflows and lower demand.
4.2.23 The SRMC of Whirinaki is the other key factor influencing the dispatch guideline. Figure 11 illustrates the impact of reducing the SRMC of Whirinaki by $100/MWh and $200/MWh.
Figure 11: Impact of SRMC on Whirinaki guideline
-200 400 600 800
1,000 1,200 1,400 1,600 1,800 2,000
Jan Feb Mar Apr May Jun Jul Aug Sep Oct Nov Dec
SI S
tora
ge G
Wh
SRMC = $200/MWh
SRMC = $300/MWh
Base Case - Whirinaki SRMC=$400/MWh
4.2.24 The dispatch guideline rises as the SRMC falls. This is rational because it becomes economic to run Whirinaki earlier to avoid demand restrictions if its operating costs are lower.
Mapping economic guidelines to risk curves
4.2.25 Figure 12 overlays the dispatch guideline for Whirinaki (with SRMC=$400/MWh) and the 1% to 10% risk curves for the South Island (as derived in Section 3).
19 of 32 25 June 2009 3.47 p.m.

Hydro risk curves and reserve energy dispatch guidelines
Figure 12: Comparison between dispatch guideline and risk curves
-
200
400
600
800
1,000
1,200
1,400
1,600
1,800
2,000
Jan Feb Mar Apr May Jun Jul Aug Sep Oct Nov Dec
GW
h (S
I sto
rage
)
1%
2%
4%
6%
10%
Risk
4.2.26 The $400/GWh dispatch guideline is very close to the 4% risk curve. 19 Rather than introduce a new and potentially confusing guideline, the Commission intends to use the 4% risk curve as the dispatch guideline for Whirinaki.20 This avoids introducing additional contours to the monitoring curves and is sufficiently accurate given the inherent uncertainty in demand restraint costs. 21
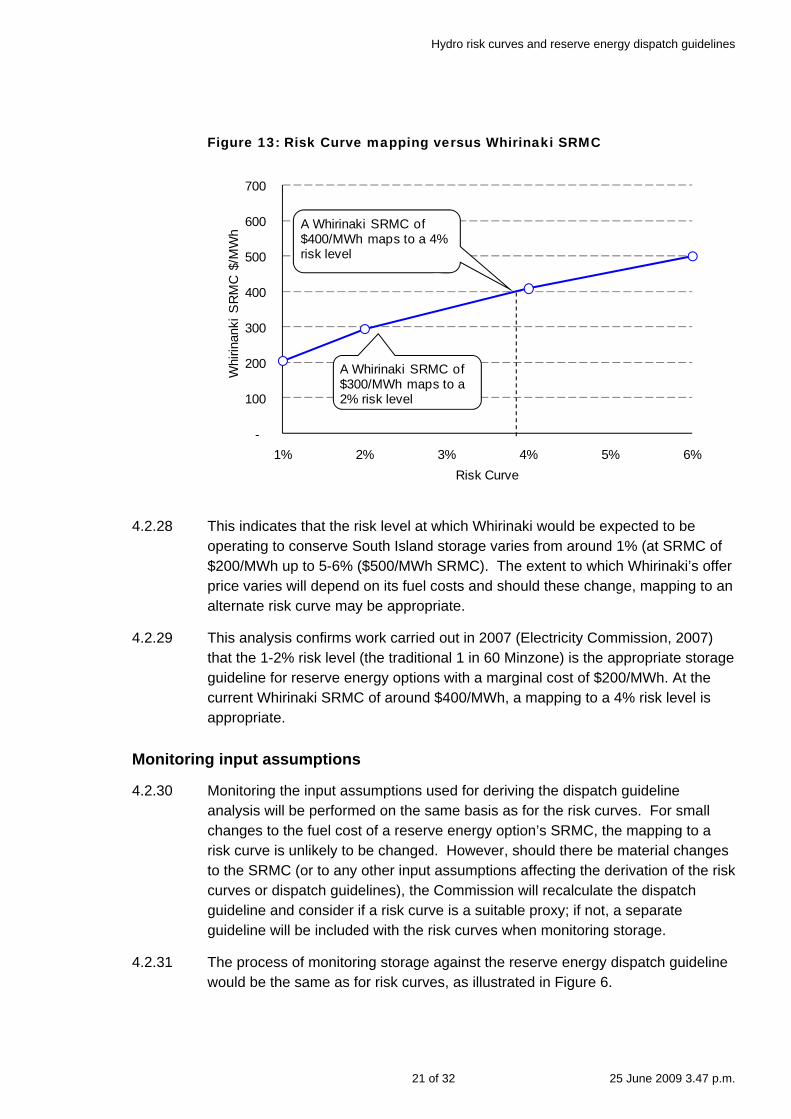
4.2.27 It is possible to derive the economic risk levels appropriate to use for different Whirinaki SRMCs, and this is illustrated in Figure 13.
19 Differences over October to February are not particularly important as hydro storage levels are normally well
above these risk levels following spring inflows. 20 This is based on the mapping to the South Island risk curves and applied to the appropriate New Zealand risk
curve. 21 Note that the simulations underlying the risk curves assume that Whirinaki is base loaded (to the extent
possible), and hence risk curves above 4-6% will slightly understate the real risk of shortage as Whirinaki would only be part loaded above the 4% risk guideline.
20 of 32
Hydro risk curves and reserve energy dispatch guidelines
Figure 13: Risk Curve mapping versus Whirinaki SRMC
-
100
200
300
400
500
600
700
1% 2% 3% 4% 5% 6%
Whi
rinan
ki S
RM
C $
/MW
h
Risk Curve
A Whirinaki SRMC of $400/MWh maps to a 4% risk level
A Whirinaki SRMC of $300/MWh maps to a 2% risk level
4.2.28 This indicates that the risk level at which Whirinaki would be expected to be operating to conserve South Island storage varies from around 1% (at SRMC of $200/MWh up to 5-6% ($500/MWh SRMC). The extent to which Whirinaki’s offer price varies will depend on its fuel costs and should these change, mapping to an alternate risk curve may be appropriate.
4.2.29 This analysis confirms work carried out in 2007 (Electricity Commission, 2007) that the 1-2% risk level (the traditional 1 in 60 Minzone) is the appropriate storage guideline for reserve energy options with a marginal cost of $200/MWh. At the current Whirinaki SRMC of around $400/MWh, a mapping to a 4% risk level is appropriate.
Monitoring input assumptions
4.2.30 Monitoring the input assumptions used for deriving the dispatch guideline analysis will be performed on the same basis as for the risk curves. For small changes to the fuel cost of a reserve energy option’s SRMC, the mapping to a risk curve is unlikely to be changed. However, should there be material changes to the SRMC (or to any other input assumptions affecting the derivation of the risk curves or dispatch guidelines), the Commission will recalculate the dispatch guideline and consider if a risk curve is a suitable proxy; if not, a separate guideline will be included with the risk curves when monitoring storage.
4.2.31 The process of monitoring storage against the reserve energy dispatch guideline would be the same as for risk curves, as illustrated in Figure 6.
21 of 32 25 June 2009 3.47 p.m.

Hydro risk curves and reserve energy dispatch guidelines
5. Monitoring, response, and expectations 5.1.1 This paper has outlined the derivation of risk curves for monitoring storage and a
dispatch guideline for Whirinaki (currently the only contracted reserve energy option).
5.1.2 The Commission’s response to storage falling below these curves is described in the Security of Supply Policy and broadly consists of three main elements:
(a) Closely monitoring supply and demand whenever storage falls below the 1% risk curve and assessing whether non-hydro plant is operating in a manner consistent with assumptions.
(b) Monitoring the dispatch of reserve energy options, particularly if storage falls below its dispatch guideline and the option is not operating.22
(c) Initiating a series of emergency measures if storage falls below the Emergency Storage Guideline.
5.1.3 The Commission’s expectations about the dispatch of thermal plant to assist with conservation of hydro storage are summarised below:
(a) If storage falls below the 1% risk curve, the Commission expects that most thermal plant (excluding Whirinaki) will be operating to the extent possible to conserve hydro storage. If this is not the case, the risk of shortage (without additional demand response) is greater than 1%23.
(b) If storage falls below the 2% risk curve, the Commission expects that all thermal plant (excluding Whirinaki) will be operating to the extent possible to conserve hydro storage. If this is not the case, the Commission will investigate further.
(c) If storage falls below the dispatch guideline of a reserve energy option, the Commission expects the option to operate (based on spot market prices); based on the analysis in this paper, Whirinaki is expected to operate if storage falls below the 4% risk curve. If storage falls to a reserve energy option’s dispatch guideline and spot market price is not sufficiently high to ensure its dispatch based on price alone, the Commission will consider
22 Regardless of the storage level, a reserve energy option is dispatched if the spot market price exceeds its
variable operating cost (subject to conditions of its dispatch policy). 23 As discussed in Section 3, the hydro risk curves have been derived on the same set of assumptions, one of
which is that all thermal plant (including Whirinaki) are operating to the extent possible to conserve hydro storage and the other is demand is adjusted for an estimate of voluntary demand response.
22 of 32

Hydro risk curves and reserve energy dispatch guidelines
adjusting the offer price to ensure it is dispatched if it is satisfied that there will be a material benefit to security of supply24.
5.1.4 The linkages between storage levels, the Commission’s response to those storage levels, and Commission’s expectations of the levels of thermal dispatch, are summarised in Figure 14.
Figure 14: Commission response to storage
Storage(GWh)
Jan Dec
Emergency zone
Emergency measures initiated if storage at/below this curve
Reserve energy option expected to be operating if storage at/below this curve
Close monitoring of supply and demand if storage at/below this curve
1% risk curveAll thermal plant expected to be operating to the extent possible
2% risk curve
Dispatch guideline
24 Under these circumstances, the Commission is required to investigate why market prices were not sufficient to
ensure the dispatch of reserve energy, and to consider whether changes to the Security of Supply Policy may be necessary
23 of 32 25 June 2009 3.47 p.m.
Hydro risk curves and reserve energy dispatch guidelines
References T. J. Scott, Hydro Reservoir Management for an Electricity Market with Long-term Contracts. Ph.D. Thesis, Department of Management, University of Canterbury, 1997. T. J. Scott and E. G. Read, Modeling Hydro Reservoir Operation in a Deregulated Electricity Sector. International Transactions in Operations Research, 3(3-4), 1996, p. 209 221. E. G. Read and M. Yang, A Dual Dynamic Programming Approach to Reservoir Scheduling. In Proceedings of the First ECNZ Optimal Generation Scheduling Workshop, Wellington, December 1993 (Reprinted from the Proceedings of the 26th ORSNZ Conference, 1990, p. 21-25). Read, E.G., A dual approach to stochastic dynamic programming for reservoir release scheduling, In Dynamic Programming For Optimal Water Resource Systems Analysis (Ed. A.O. Esogbue), Prentice-Hall Englewood Cliffs, N.J., pp 361-372, 1990. Read, E.G., A new variant of stochastic DP for multi-reservoir release scheduling, in Proceedings of the 21st Operational Research Society Of New Zealand Conference, pp 4-87, Wellington, New Zealand, September 1985. Electricity Commission, Review of Reserve Energy Policy Consultation Paper, September 2007.
24 of 32

Hydro risk curves and reserve energy dispatch guidelines
Appendices
Appendix 1 Summary of assumptions 27
25 of 32 25 June 2009 3.47 p.m.


Hydro risk curves and reserve energy dispatch guidelines
Appendix 1 Summary of assumptions
Demand assumptions
1.1.1 Simulations are performed from the start of each month. The demand assumed in each month is shown in Table 2.
(a) Annual GXP demand comes from the Commission’s medium-term P50 forecasts of annual demand for North Island and South Island25.
(b) Intra-year profile. Annual P50 forecast split into monthly amounts in proportion to average historical splits. Monthly quantities split into daily day/ night blocks using historical GXP data for relevant month between April 2006 and March 2007.
(c) Demand response. A conservative estimate of voluntary demand response to price of 2% has been assumed (and is subtracted from the annual GXP demand forecasts below, so is proportional to North Island and South Island demand).
Table 2: Monthly GXP demand assumptions
Month North Island (GWh) South Island (GWh) Jan-09 1,942 1,176 Feb-09 1,849 1,133 Mar-09 2,076 1,261 Apr 09 2,007 1,196
May 09 2,202 1,276 Jun 09 2,315 1,331 Jul 09 2,396 1,374
Aug 09 2,367 1,346 Sep 09 2,151 1,253 Oct 09 2,146 1,260 Nov 09 2,043 1,250 Dec 09 1,976 1,225
Total 25,471 15,082
Supply assumptions
1.1.2 Supply assumptions are listed in Table 3. The table includes existing and new plant expected to be commissioned in 2009.
25 See http://www.electricitycommission.govt.nz/opdev/modelling/demand/security.
27 of 32 25 June 2009 3.47 p.m.

Hydro risk curves and reserve energy dispatch guidelines
Table 3: Supply assumptions
Scheme Capacity (MW) Comment
Thermal plant (North Island)
Huntly (units 1-4) 972 Huntly U5 (e3p) 385 Huntly U6 (P40) 50 Otahuhu B 390 +25MW from previous assessments TCC 380 +20MW from previous assessments Whirinaki 156 NPL 0 Not expected to be available over winter 2009 Stratford peaker 200 Available from December 2009
Geothermal plant (North Island)
Mokai 110 Profiled output Ohaaki 65 Profiled output Poihipi 53 Profiled output Wairakei 177 Includes binary plant. Output profiled
Profiled output of 790GWh p.a. Operating since winter 2008. Kawerau 90Profiled output of 125 GWh p.a. Operating since winter 2008. Ngawha 2 15Profiled output from December 2009 (95% capacity factor, 158GWh p.a.). Tauhara binary 19
Cogeneration plant (North Island)
Southdown 175 Scheduled as a thermal plant Kaponga 20 Profiled output Kinleith 41 Profiled output Whareroa 54 Profiled output Te Awamutu 0 No output expected Te Rapa 49 Profiled output
Hydro plant/schemes (North Island)
Waikato 1,063 Rangipo 120 Output linked to Taupo inflows Tokaanu 240 Output linked to Taupo inflows Matahina 80 Output linked to Taupo inflows Waikaremoana 141 Profiled output Mangahao 42 Profiled output Patea 32 Profiled output Wheao 28 Profiled output Mangaio 2 Profiled output Waipa 8 Profiled output
28 of 32
Hydro risk curves and reserve energy dispatch guidelines
Capacity Scheme Comment (MW)
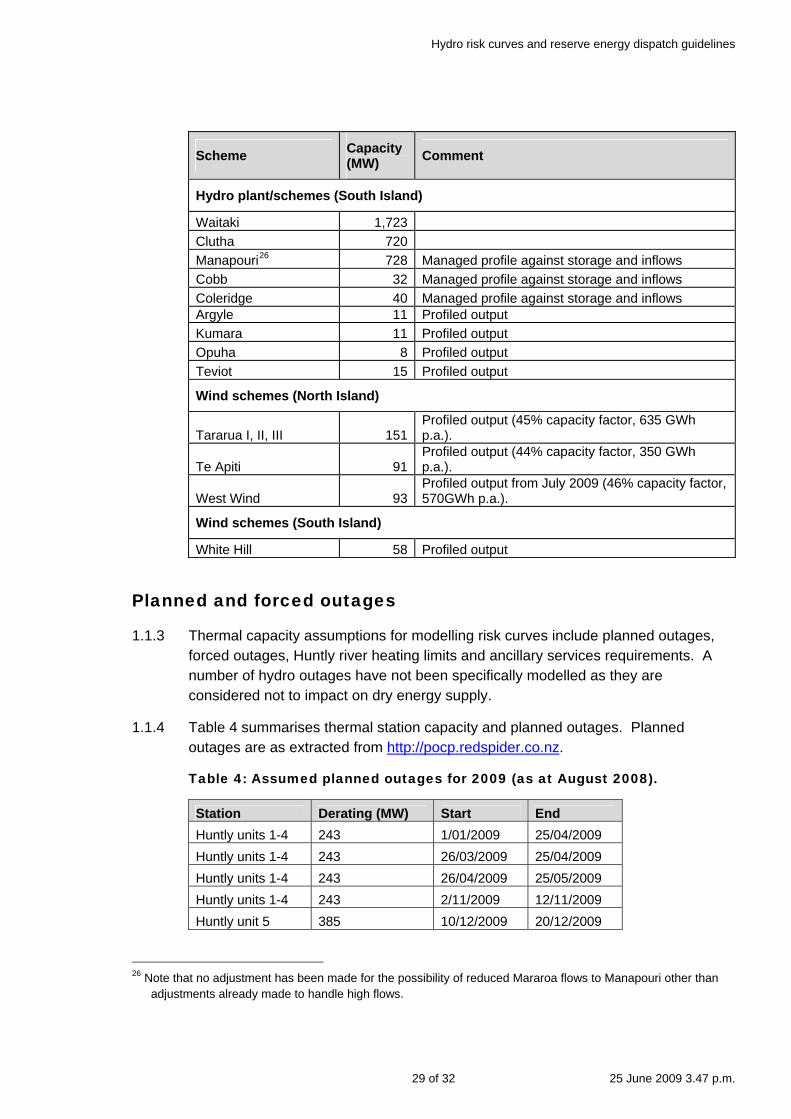
Hydro plant/schemes (South Island)
Waitaki 1,723 Clutha 720 Manapouri26 728 Managed profile against storage and inflows Cobb 32 Managed profile against storage and inflows Coleridge 40 Managed profile against storage and inflows Argyle 11 Profiled output Kumara 11 Profiled output Opuha 8 Profiled output Teviot 15 Profiled output
Wind schemes (North Island)
Profiled output (45% capacity factor, 635 GWh p.a.). Tararua I, II, III 151Profiled output (44% capacity factor, 350 GWh p.a.). Te Apiti 91Profiled output from July 2009 (46% capacity factor, 570GWh p.a.). West Wind 93
Wind schemes (South Island)
White Hill 58 Profiled output
Planned and forced outages
1.1.3 Thermal capacity assumptions for modelling risk curves include planned outages, forced outages, Huntly river heating limits and ancillary services requirements. A number of hydro outages have not been specifically modelled as they are considered not to impact on dry energy supply.
1.1.4 Table 4 summarises thermal station capacity and planned outages. Planned outages are as extracted from http://pocp.redspider.co.nz.
Table 4: Assumed planned outages for 2009 (as at August 2008).
Station Derating (MW) Start End Huntly units 1-4 243 1/01/2009 25/04/2009 Huntly units 1-4 243 26/03/2009 25/04/2009 Huntly units 1-4 243 26/04/2009 25/05/2009 Huntly units 1-4 243 2/11/2009 12/11/2009 Huntly unit 5 385 10/12/2009 20/12/2009
26 Note that no adjustment has been made for the possibility of reduced Mararoa flows to Manapouri other than
adjustments already made to handle high flows.
29 of 32 25 June 2009 3.47 p.m.
Hydro risk curves and reserve energy dispatch guidelines
Huntly unit 5 50 20/06/2009 20/06/2009
1.1.5 Rangipo capability was reduced over July and August to reflect the planned outage of a single 60MW unit over that period.
1.1.6 All thermal units are de-rated to allow by a forced outage factor of 3%.27
1.1.7 The following additional de-ratings have been applied to Huntly units 1-4:
(a) Maintenance outages28: one Huntly unit is assumed to be out of service for maintenance three weekends in four.
(b) Ancillary services requirements: Huntly has been de-rated by 130MW overnight to reflect spinning reserve (80MW) and frequency keeping (50MW) requirements. These de-ratings have been applied to Huntly based on previous analysis29.
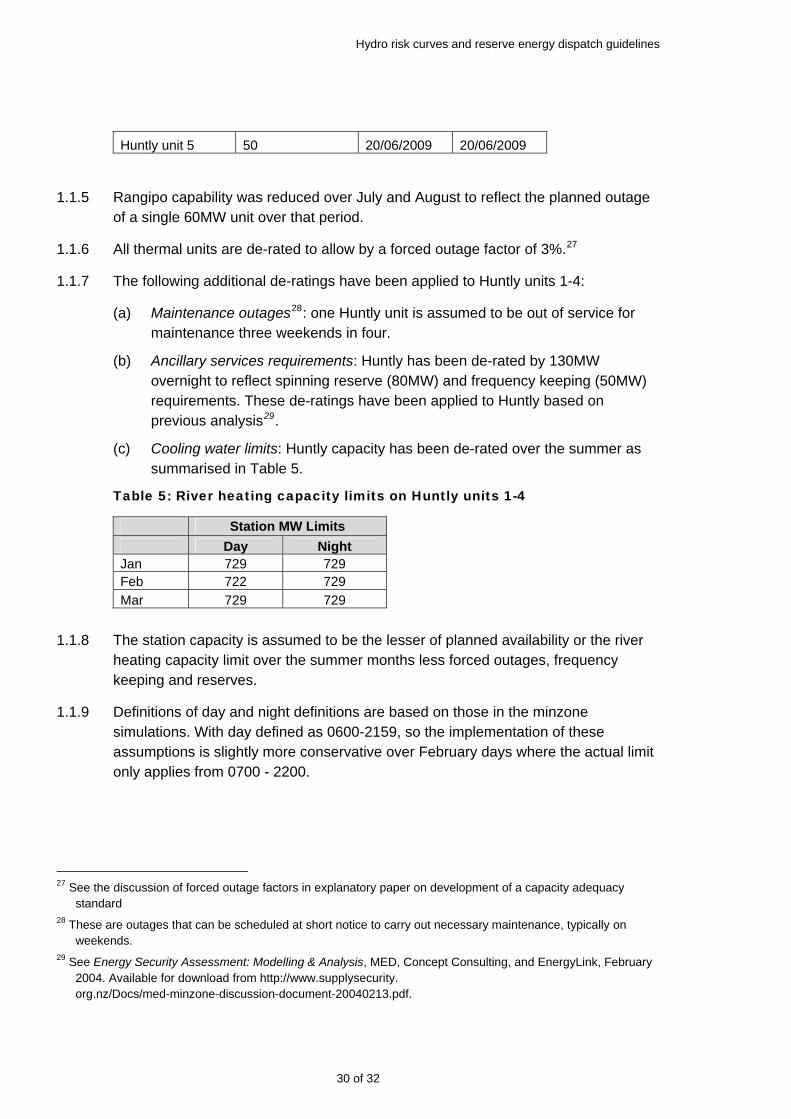
(c) Cooling water limits: Huntly capacity has been de-rated over the summer as summarised in Table 5.
Table 5: River heating capacity limits on Huntly units 1-4
Station MW Limits Day Night Jan 729 729 Feb 722 729 Mar 729 729
1.1.8 The station capacity is assumed to be the lesser of planned availability or the river
heating capacity limit over the summer months less forced outages, frequency keeping and reserves.
1.1.9 Definitions of day and night definitions are based on those in the minzone simulations. With day defined as 0600-2159, so the implementation of these assumptions is slightly more conservative over February days where the actual limit only applies from 0700 - 2200.
27 See the discussion of forced outage factors in explanatory paper on development of a capacity adequacy
standard 28 These are outages that can be scheduled at short notice to carry out necessary maintenance, typically on
weekends. 29 See Energy Security Assessment: Modelling & Analysis, MED, Concept Consulting, and EnergyLink, February
2004. Available for download from http://www.supplysecurity. org.nz/Docs/med-minzone-discussion-document-20040213.pdf.
30 of 32
Hydro risk curves and reserve energy dispatch guidelines
Transmission assumptions
1.1.10 Transmission limits are represented in the Energy Link model by setting combinations of lines to preset limits. Although this is potentially not as accurate as the full nodal representation used in the market scheduling and dispatch model (SPD), which is itself an approximation to the detailed physical characteristics of the grid, it is considered to be appropriate for minzone analysis. Half hourly analysis using the detailed version of the Emarket model has been previously undertaken to confirm this.
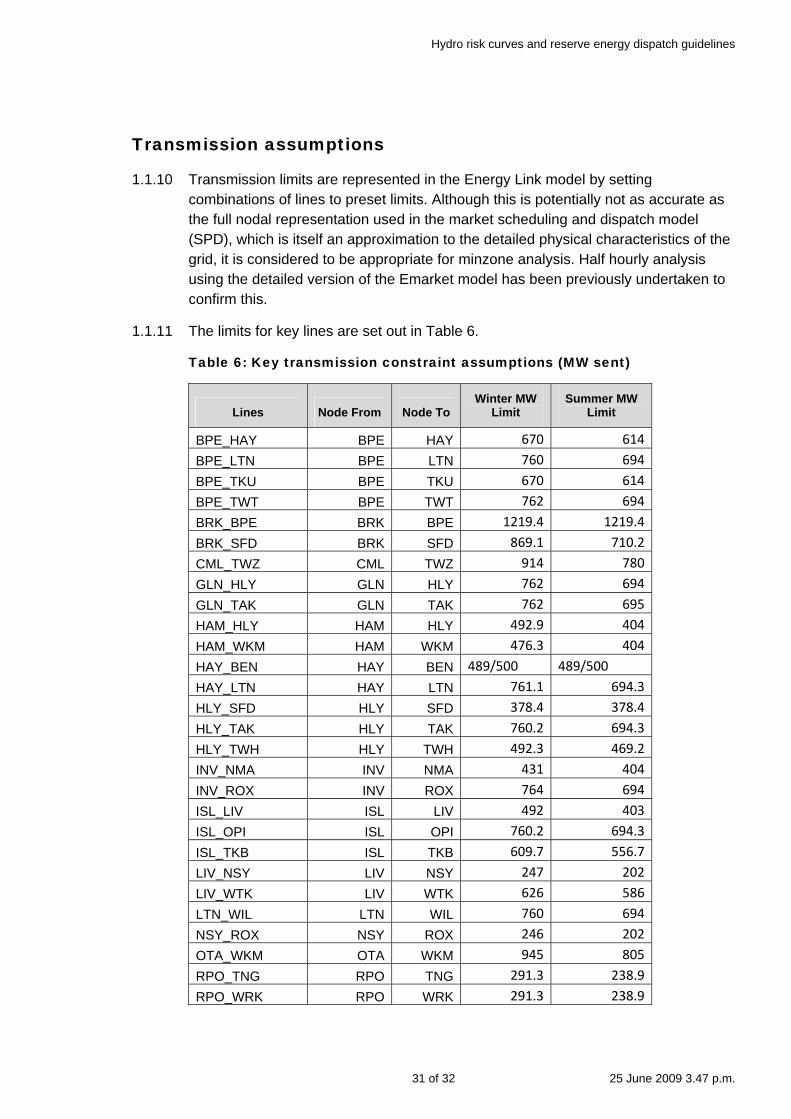
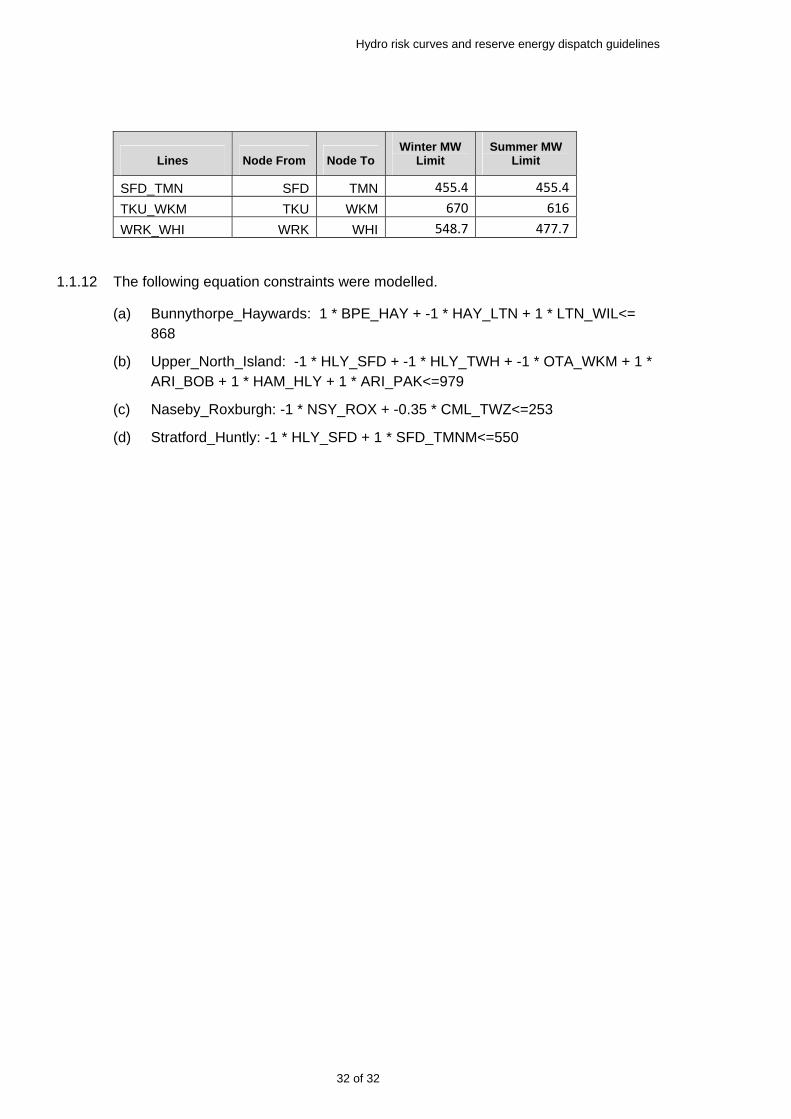
1.1.11 The limits for key lines are set out in Table 6.
Table 6: Key transmission constraint assumptions (MW sent)
Lines Node From Node To Winter MW
Limit Summer MW
Limit
BPE_HAY BPE HAY 670 614
BPE_LTN BPE LTN 760 694
BPE_TKU BPE TKU 670 614
BPE_TWT BPE TWT 762 694
BRK_BPE BRK BPE 1219.4 1219.4
BRK_SFD BRK SFD 869.1 710.2
CML_TWZ CML TWZ 914 780
GLN_HLY GLN HLY 762 694
GLN_TAK GLN TAK 762 695
HAM_HLY HAM HLY 492.9 404
HAM_WKM HAM WKM 476.3 404
HAY_BEN HAY BEN 489/500 489/500
HAY_LTN HAY LTN 761.1 694.3
HLY_SFD HLY SFD 378.4 378.4
HLY_TAK HLY TAK 760.2 694.3
HLY_TWH HLY TWH 492.3 469.2
INV_NMA INV NMA 431 404
INV_ROX INV ROX 764 694
ISL_LIV ISL LIV 492 403
ISL_OPI ISL OPI 760.2 694.3
ISL_TKB ISL TKB 609.7 556.7
LIV_NSY LIV NSY 247 202
LIV_WTK LIV WTK 626 586
LTN_WIL LTN WIL 760 694
NSY_ROX NSY ROX 246 202
OTA_WKM OTA WKM 945 805
RPO_TNG RPO TNG 291.3 238.9
RPO_WRK RPO WRK 291.3 238.9
31 of 32 25 June 2009 3.47 p.m.
Hydro risk curves and reserve energy dispatch guidelines
Lines Node From Winter MW Summer MW
Limit Node To Limit
SFD_TMN SFD TMN 455.4 455.4
TKU_WKM TKU WKM 670 616
WRK_WHI WRK WHI 548.7 477.7
1.1.12 The following equation constraints were modelled.
(a) Bunnythorpe_Haywards: 1 * BPE_HAY + -1 * HAY_LTN + 1 * LTN_WIL<= 868
(b) Upper_North_Island: -1 * HLY_SFD + -1 * HLY_TWH + -1 * OTA_WKM + 1 * ARI_BOB + 1 * HAM_HLY + 1 * ARI_PAK<=979
(c) Naseby_Roxburgh: -1 * NSY_ROX + -0.35 * CML_TWZ<=253
(d) Stratford_Huntly: -1 * HLY_SFD + 1 * SFD_TMNM<=550
32 of 32