Human Resources and Workforce Performance Report … papers/04.61... · Human Resources and...
28
Human Resources and Workforce Performance Report 2015/16 Quarter 1 April to June 2015 1
Transcript of Human Resources and Workforce Performance Report … papers/04.61... · Human Resources and...

Human Resources and Workforce Performance Report
2015/16 Quarter 1
April to June 2015
1

Contents
2
1. Introduction 3
2. Trust Dashboard and benchmarking 4
3. Divisional Overview 7
4. Bank and Agency Analysis 9
5. Recruitment and Retention 10
Starter Analysis 10
Recruitment Activity 11
Vacancy Projections 13
Leaver Analysis 14
Retention Strategies - Developments from Q4 15
6. Learning and Development 17
7. Employee Relations 19
8. Equality and Diversity Monitoring 21
9. Safe Staffing 24
10. Conclusion/Future Plans 25
11. Appendices 27
I. HR Action Plan 26
II. Exit Interview Questionnaire Results 27
III. Report Notes/Definitions 28

1. Introduction
This report covers Quarter 1 of 2015/16 (April to June 2015). The report highlights changes and progress from Q4 of the last financial year and takes into account feedback and actions requested by the Board. It also highlights new initiatives and progress made against key areas in our HR action plan and our response to the wider CQC actions.
KEY POINTS for Q1:
1553 staff directly employed at the end of Q1 ( excluding doctors in training and seconded staff).
Rolling 12 month turnover rate at 16.8% up from 16.2% in the last quarter.
Sickness absence rate of 2.7% down from 3.3% in the last quarter (see note on Pg. 4).
81 starters and 59 leavers.
Bank and Agency usage 12% as a proportion of the establishment.
202 open employee relations cases up by 2 from the last quarter.
89.1 % Mandatory training compliance, down from 89.7% in Q4.
Continued recruitment activity.
New analysis on exit questionnaires.
Enhanced Ethnicity monitoring.
3
2. Trust Dashboard
Comment
4
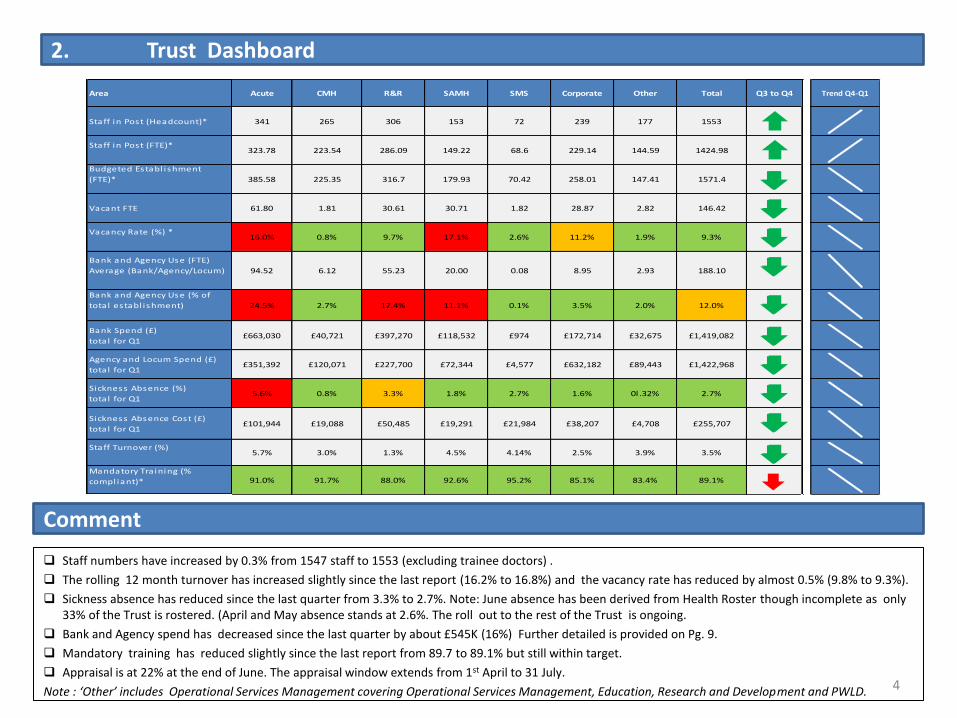
Staff numbers have increased by 0.3% from 1547 staff to 1553 (excluding trainee doctors) .
The rolling 12 month turnover has increased slightly since the last report (16.2% to 16.8%) and the vacancy rate has reduced by almost 0.5% (9.8% to 9.3%).
Sickness absence has reduced since the last quarter from 3.3% to 2.7%. Note: June absence has been derived from Health Roster though incomplete as only 33% of the Trust is rostered. (April and May absence stands at 2.6%. The roll out to the rest of the Trust is ongoing.
Bank and Agency spend has decreased since the last quarter by about £545K (16%) Further detailed is provided on Pg. 9.
Mandatory training has reduced slightly since the last report from 89.7 to 89.1% but still within target.
Appraisal is at 22% at the end of June. The appraisal window extends from 1st April to 31 July.
Note : ‘Other’ includes Operational Services Management covering Operational Services Management, Education, Research and Development and PWLD.
Area Acute CMH R&R SAMH SMS Corporate Other Total Q3 to Q4
Staff in Post (Headcount)* 341 265 306 153 72 239 177 1553
Staff in Post (FTE)*323.78 223.54 286.09 149.22 68.6 229.14 144.59 1424.98
Budgeted Establ ishment
(FTE)* 385.58 225.35 316.7 179.93 70.42 258.01 147.41 1571.4
Vacant FTE 61.80 1.81 30.61 30.71 1.82 28.87 2.82 146.42
Vacancy Rate (%) *16.0% 0.8% 9.7% 17.1% 2.6% 11.2% 1.9% 9.3%
Bank and Agency Use (FTE)
Average (Bank/Agency/Locum) 94.52 6.12 55.23 20.00 0.08 8.95 2.93 188.10
Bank and Agency Use (% of
tota l establ ishment) 24.5% 2.7% 17.4% 11.1% 0.1% 3.5% 2.0% 12.0%
Bank Spend (£)
total for Q1£663,030 £40,721 £397,270 £118,532 £974 £172,714 £32,675 £1,419,082
Agency and Locum Spend (£)
total for Q1£351,392 £120,071 £227,700 £72,344 £4,577 £632,182 £89,443 £1,422,968
Sickness Absence (%)
total for Q15.6% 0.8% 3.3% 1.8% 2.7% 1.6% 0l .32% 2.7%
Sickness Absence Cost (£)
total for Q1£101,944 £19,088 £50,485 £19,291 £21,984 £38,207 £4,708 £255,707
Staff Turnover (%)5.7% 3.0% 1.3% 4.5% 4.14% 2.5% 3.9% 3.5%
Mandatory Tra ining (%
compl iant)* 91.0% 91.7% 88.0% 92.6% 95.2% 85.1% 83.4% 89.1%
Trend Q4-Q1
2. Trust Dashboard - Detail
Establishment vrs FTE Bank and Agency Use - % of Establishment
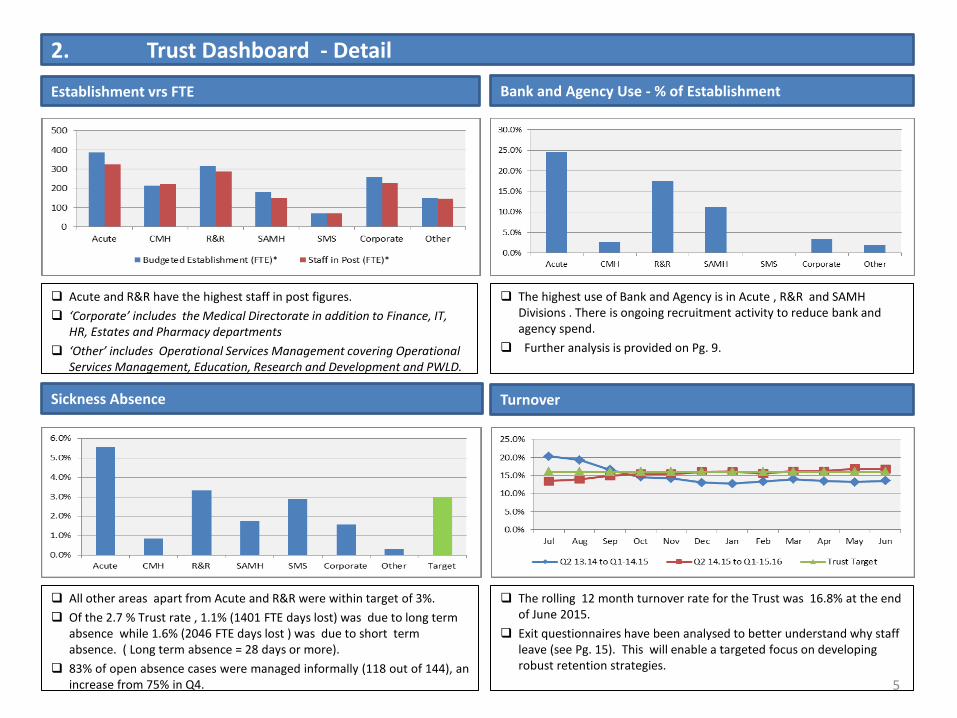
Acute and R&R have the highest staff in post figures.
‘Corporate’ includes the Medical Directorate in addition to Finance, IT, HR, Estates and Pharmacy departments
‘Other’ includes Operational Services Management covering Operational Services Management, Education, Research and Development and PWLD.
The highest use of Bank and Agency is in Acute , R&R and SAMH Divisions . There is ongoing recruitment activity to reduce bank and agency spend.
Further analysis is provided on Pg. 9.
Sickness Absence Turnover
All other areas apart from Acute and R&R were within target of 3%.
Of the 2.7 % Trust rate , 1.1% (1401 FTE days lost) was due to long term absence while 1.6% (2046 FTE days lost ) was due to short term absence. ( Long term absence = 28 days or more).
83% of open absence cases were managed informally (118 out of 144), an increase from 75% in Q4.
The rolling 12 month turnover rate for the Trust was 16.8% at the end of June 2015.
Exit questionnaires have been analysed to better understand why staff leave (see Pg. 15). This will enable a targeted focus on developing robust retention strategies.
5
2. London Benchmarking (data at April 2015)
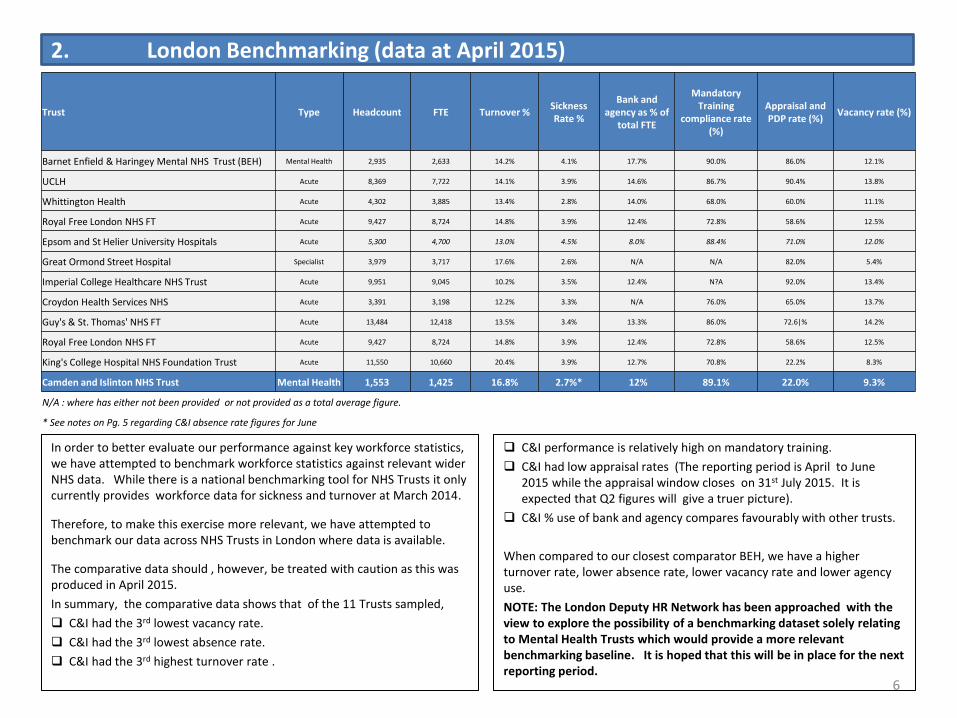
In order to better evaluate our performance against key workforce statistics, we have attempted to benchmark workforce statistics against relevant wider NHS data. While there is a national benchmarking tool for NHS Trusts it only currently provides workforce data for sickness and turnover at March 2014.
Therefore, to make this exercise more relevant, we have attempted to benchmark our data across NHS Trusts in London where data is available.
The comparative data should , however, be treated with caution as this was produced in April 2015.
In summary, the comparative data shows that of the 11 Trusts sampled,
C&I had the 3rd lowest vacancy rate.
C&I had the 3rd lowest absence rate.
C&I had the 3rd highest turnover rate .
6
C&I performance is relatively high on mandatory training.
C&I had low appraisal rates (The reporting period is April to June 2015 while the appraisal window closes on 31st July 2015. It is expected that Q2 figures will give a truer picture).
C&I % use of bank and agency compares favourably with other trusts.
When compared to our closest comparator BEH, we have a higher turnover rate, lower absence rate, lower vacancy rate and lower agency use.
NOTE: The London Deputy HR Network has been approached with the view to explore the possibility of a benchmarking dataset solely relating to Mental Health Trusts which would provide a more relevant benchmarking baseline. It is hoped that this will be in place for the next reporting period.
Trust Type Headcount FTE Turnover % Sickness Rate %
Bank and agency as % of
total FTE
Mandatory Training
compliance rate (%)
Appraisal and PDP rate (%)
Vacancy rate (%)
Barnet Enfield & Haringey Mental NHS Trust (BEH) Mental Health 2,935 2,633 14.2% 4.1% 17.7% 90.0% 86.0% 12.1%
UCLH Acute 8,369 7,722 14.1% 3.9% 14.6% 86.7% 90.4% 13.8%
Whittington Health Acute 4,302 3,885 13.4% 2.8% 14.0% 68.0% 60.0% 11.1%
Royal Free London NHS FT Acute 9,427 8,724 14.8% 3.9% 12.4% 72.8% 58.6% 12.5%
Epsom and St Helier University Hospitals Acute 5,300 4,700 13.0% 4.5% 8.0% 88.4% 71.0% 12.0%
Great Ormond Street Hospital Specialist 3,979 3,717 17.6% 2.6% N/A N/A 82.0% 5.4%
Imperial College Healthcare NHS Trust Acute 9,951 9,045 10.2% 3.5% 12.4% N?A 92.0% 13.4%
Croydon Health Services NHS Acute 3,391 3,198 12.2% 3.3% N/A 76.0% 65.0% 13.7%
Guy's & St. Thomas' NHS FT Acute 13,484 12,418 13.5% 3.4% 13.3% 86.0% 72.6|% 14.2%
Royal Free London NHS FT Acute 9,427 8,724 14.8% 3.9% 12.4% 72.8% 58.6% 12.5%
King's College Hospital NHS Foundation Trust Acute 11,550 10,660 20.4% 3.9% 12.7% 70.8% 22.2% 8.3%
Camden and Islinton NHS Trust Mental Health 1,553 1,425 16.8% 2.7%* 12% 89.1% 22.0% 9.3%
N/A : where has either not been provided or not provided as a total average figure.
* See notes on Pg. 5 regarding C&I absence rate figures for June

3. Divisional Overview
The Division’s recruitment campaigns are progressing positively and the vacancy projections show that the Division will be below the Trust target by September as recruitment results in actual new starters in post.
Rigorous plans have been put forward and proposals are being submitted for the delivery of Integrated Liaison Assessment Team (ILAT) services for the Whittington, Royal Free and UCLH. The service models are still being developed but it is estimated that the increase may be between 25 – 30 staff .
Sickness absence rates within the Division have continued to be above the Trust target in Q1 at 5.6%. Overall, the division has a high mandatory compliance rate at 91% for the quarter.
QIPP savings for 2015 has meant a review of CMH services with 5 WTE being removed from the structure from the Assessment and Advice Team (A&AT) and Trauma and Stress Clinic (TSC).
The Whittington have also requested for the Child Health Psychology service to be redesigned around a revised 2015/16 budget. If the proposed model is accepted this will reduce the team size from 7.26 FTE to 4.3FTE. If not accepted, the service will be terminated in its entirety.
Sickness absence is below the Trust target for the quarter at 0.8% with absence being managed rigorously across the Division. Mandatory training compliance is good across the Division with 89.7% compliance for the quarter.
Recovery and Rehabilitation (R&R) Services for Ageing Mental Health (SAMH)
Targeted recruitment campaigns continue to result in a number of job offers made with autumn commencement dates.
The management restructure expected to commence in June has been deferred to the autumn as a result of ongoing discussions with Camden and Islington local authorities. The restructure will impact upon existing staff however, it is anticipated that majority will be absorbed within the Division and will therefore not impact upon vacancy rates.
Sickness absence rates have reduced since the last quarter from 4.8% to 3.3%.
The Division continues to comply with statutory and mandatory training requirements achieving 88% compliance overall.
Targeted recruitment is well underway in order to reduce vacancy rates. A number of job offers have been made with autumn commencement dates.
Recruitment activity is ongoing to fill vacancies with a number of job offers made with autumn commencement dates.
The monthly turnover rate for Q1 is 4.5% down from 4.7% last quarter.
Sickness absence for Q1 is low at 1.8% also down from 3.1%.
The Division has improved on its statutory and mandatory compliance rate and is currently at 92.6%
Acute Community Mental Health (CMH)
7
3. Divisional Overview
SMS Corporate (continued)
During Q1, the Division is progressing in its tender application for its existing drug and alcohol services in Camden & Islington. There has also been the need to make substantial efficiency savings in year, hence our slowing off in recruitment of new staff.
The Division will also be preparing for an internal change programme to get the service fit for tendering in a competitive market.
Sickness absence has reduced from 3.1% to 2.7% since the last quarter while turnover has decreased to 4.14% from 5.26%.
The Division continues to comply with statutory and mandatory training requirements achieving 97.5% compliance overall.
ICT
ICT continues to have a high percentage of temporary staff to enable the successful delivery of the Electronic Patient Records (EPA) system. Consideration will be given to the sustainability of this arrangement post implementation in light of the risk to the Trust of not successfully implementing this programme and the transitional period leading up to the return to business as usual and the principles of the Jeremy Hunt directive on reducing bank and agency usage.
In addition, turnover remains high (7.4%) due to the challenges in relation to retention of staff as a result of market variations in remuneration packages for roles of this nature. Discussions are underway in relation to reviewing the current structure of the ICT department with a view to making it fit for purpose.
Sickness absence is low this quarter at 1.5%. The department achieved 97.4% compliance for statutory and mandatory training.
HR
There is currently double running costs for specific posts as a result of family friendly leave. Turnover is at 3.1% for the quarter. Sickness absence for the department has been high at 4.2% and is as a result of long term absence. The department’s mandatory training compliance is good overall at 88.3%
Pharmacy
The vacancy rates for Pharmacy are at 6% with active recruitment within this area.
Sickness absence is high at 4.1%. Mandatory training compliance stands at 76.5% and requires improvement.
Corporate
Finance
Sickness absence has remained low (0.7%) though showing an increase from the last quarter (0.04%). The department’s turnover is low for the Division at 4.4%. The department had achieved a 94.2% compliance rate for statutory and mandatory training.
Estates & Facilities (E & F)
The process of extending the Facilities Management contract delivered through Cofely is due to be implemented in the autumn. The proposed extension will facilitate the transfer of the staff restaurant and hard facilities management services to Cofely and will include the transfer (TUPE) of six staff assigned to these services. It is anticipated that the proposed extension will make a saving of about £1m.
Sickness remains low at 1.6%. The department achieved 81.8% compliance for statutory and mandatory training.
8
4. Bank and Agency Analysis
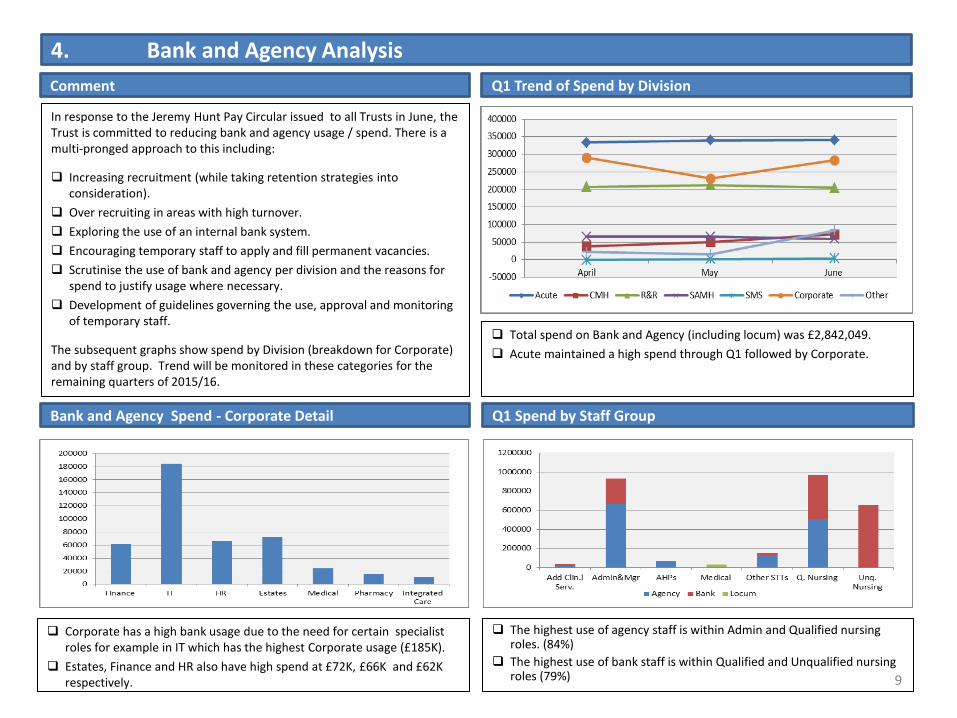
Corporate has a high bank usage due to the need for certain specialist roles for example in IT which has the highest Corporate usage (£185K).
Estates, Finance and HR also have high spend at £72K, £66K and £62K respectively.
The highest use of agency staff is within Admin and Qualified nursing roles. (84%)
The highest use of bank staff is within Qualified and Unqualified nursing roles (79%)
Bank and Agency Spend - Corporate Detail
9
Total spend on Bank and Agency (including locum) was £2,842,049.
Acute maintained a high spend through Q1 followed by Corporate.
Comment
In response to the Jeremy Hunt Pay Circular issued to all Trusts in June, the Trust is committed to reducing bank and agency usage / spend. There is a multi-pronged approach to this including:
Increasing recruitment (while taking retention strategies into consideration).
Over recruiting in areas with high turnover.
Exploring the use of an internal bank system.
Encouraging temporary staff to apply and fill permanent vacancies.
Scrutinise the use of bank and agency per division and the reasons for spend to justify usage where necessary.
Development of guidelines governing the use, approval and monitoring of temporary staff.
The subsequent graphs show spend by Division (breakdown for Corporate) and by staff group. Trend will be monitored in these categories for the remaining quarters of 2015/16.
Q1 Trend of Spend by Division
Q1 Spend by Staff Group
5.0 Recruitment and Retention
5.1 Starter Analysis
Starters by Month
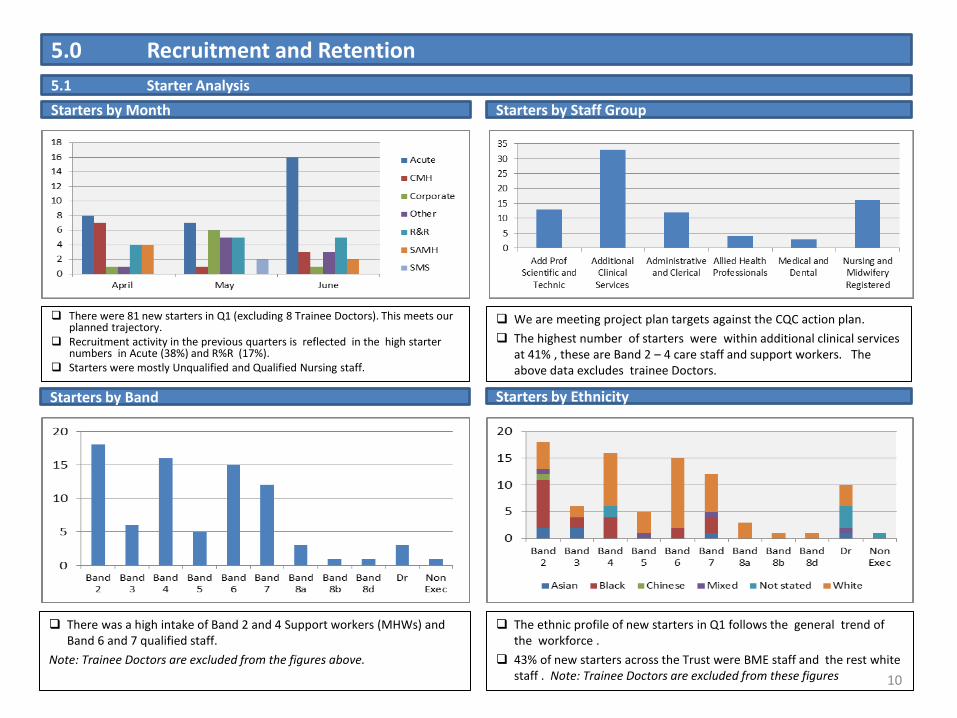
There were 81 new starters in Q1 (excluding 8 Trainee Doctors). This meets our planned trajectory.
Recruitment activity in the previous quarters is reflected in the high starter numbers in Acute (38%) and R%R (17%).
Starters were mostly Unqualified and Qualified Nursing staff.
There was a high intake of Band 2 and 4 Support workers (MHWs) and Band 6 and 7 qualified staff.
Note: Trainee Doctors are excluded from the figures above.
Starters by Band
Starters by Staff Group
10
We are meeting project plan targets against the CQC action plan.
The highest number of starters were within additional clinical services at 41% , these are Band 2 – 4 care staff and support workers. The above data excludes trainee Doctors.
Starters by Ethnicity
The ethnic profile of new starters in Q1 follows the general trend of the workforce .
43% of new starters across the Trust were BME staff and the rest white staff . Note: Trainee Doctors are excluded from these figures
5. Recruitment and Retention
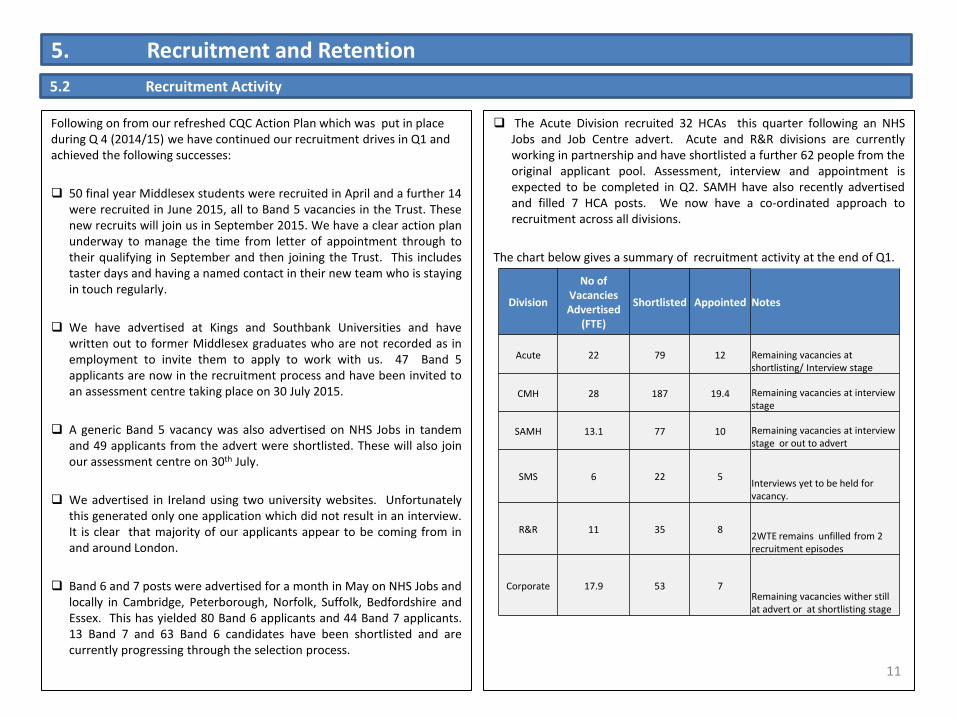
Following on from our refreshed CQC Action Plan which was put in place during Q 4 (2014/15) we have continued our recruitment drives in Q1 and achieved the following successes:
50 final year Middlesex students were recruited in April and a further 14 were recruited in June 2015, all to Band 5 vacancies in the Trust. These new recruits will join us in September 2015. We have a clear action plan underway to manage the time from letter of appointment through to their qualifying in September and then joining the Trust. This includes taster days and having a named contact in their new team who is staying in touch regularly.
We have advertised at Kings and Southbank Universities and have written out to former Middlesex graduates who are not recorded as in employment to invite them to apply to work with us. 47 Band 5 applicants are now in the recruitment process and have been invited to an assessment centre taking place on 30 July 2015.
A generic Band 5 vacancy was also advertised on NHS Jobs in tandem and 49 applicants from the advert were shortlisted. These will also join our assessment centre on 30th July.
We advertised in Ireland using two university websites. Unfortunately this generated only one application which did not result in an interview. It is clear that majority of our applicants appear to be coming from in and around London.
Band 6 and 7 posts were advertised for a month in May on NHS Jobs and locally in Cambridge, Peterborough, Norfolk, Suffolk, Bedfordshire and Essex. This has yielded 80 Band 6 applicants and 44 Band 7 applicants. 13 Band 7 and 63 Band 6 candidates have been shortlisted and are currently progressing through the selection process.
The Acute Division recruited 32 HCAs this quarter following an NHS Jobs and Job Centre advert. Acute and R&R divisions are currently working in partnership and have shortlisted a further 62 people from the original applicant pool. Assessment, interview and appointment is expected to be completed in Q2. SAMH have also recently advertised and filled 7 HCA posts. We now have a co-ordinated approach to recruitment across all divisions.
The chart below gives a summary of recruitment activity at the end of Q1.
11
5.2 Recruitment Activity
Division
No of Vacancies Advertised
(FTE)
Shortlisted Appointed Notes
Acute 22 79 12 Remaining vacancies at shortlisting/ Interview stage
CMH 28 187 19.4 Remaining vacancies at interview stage
SAMH 13.1 77 10 Remaining vacancies at interview stage or out to advert
SMS 6 22 5 Interviews yet to be held for vacancy.
R&R 11 35 8 2WTE remains unfilled from 2 recruitment episodes
Corporate 17.9 53 7 Remaining vacancies wither still at advert or at shortlisting stage
5. Recruitment and Retention
We have streamlined the recruitment process and went live with the new Trac software on 25th June 2015. The new system will reduce the time taken to recruit from about 60 days to about 45 days (with scope for further improvement once the system is fully embedded), including enabling electronic DBS checks and dashboard recruitment information to management teams and HR BPs.
We are also developing an annual recruitment activity plan and identifying the key recruitment fairs during the year, in order to focus our recruitment activities accordingly. We are also planning for when graduate mental health workers will become available in order to ensure they will be assimilated into roles as part of workforce planning. We have now aligned our recruitment mini teams to the same divisional areas covered by the HR BPs to ensure that activity is focussed and aligned with the workforce and business plans of each division and enable us to provide regular detailed recruitment updates to divisions to track progress on vacancies.
Taking all into account, the vacancy projections in Section 5.4 reflects the position at the end of June 2015. The estimates are based on previous month’s actual starters and leavers and appropriately factoring in the recent recruitment campaigns and further expected retention activity.
However, while some of the recruitment activity attracts internal candidates and, rightly so, as we want to give staff the most opportunities as possible, these internal moves do not impact on vacancy projections within the division.
We have therefore, started to track this in Divisional performance reports in order to better appreciate the numbers of staff obtaining promotional opportunities as a result of our recruitment drives.
5.3 Recruitment Activity
12
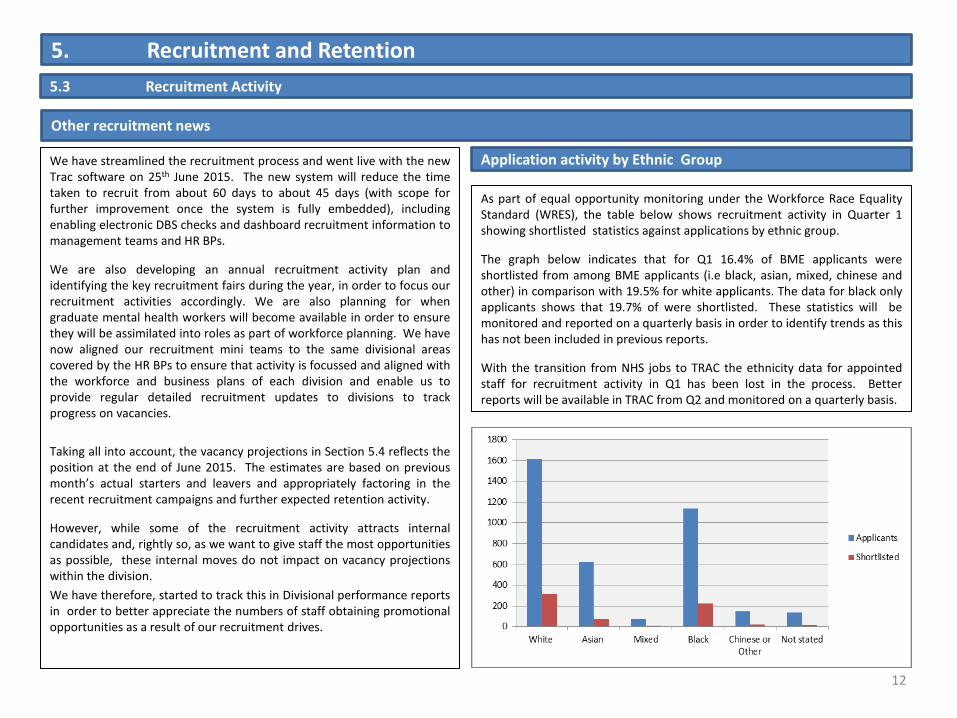
As part of equal opportunity monitoring under the Workforce Race Equality Standard (WRES), the table below shows recruitment activity in Quarter 1 showing shortlisted statistics against applications by ethnic group.
The graph below indicates that for Q1 16.4% of BME applicants were shortlisted from among BME applicants (i.e black, asian, mixed, chinese and other) in comparison with 19.5% for white applicants. The data for black only applicants shows that 19.7% of were shortlisted. These statistics will be monitored and reported on a quarterly basis in order to identify trends as this has not been included in previous reports.
With the transition from NHS jobs to TRAC the ethnicity data for appointed staff for recruitment activity in Q1 has been lost in the process. Better reports will be available in TRAC from Q2 and monitored on a quarterly basis.
Application activity by Ethnic Group
Other recruitment news
5. Recruitment and Retention
5.4 Vacancy Projections by monthly rate % (excluding internal movements)
R&R
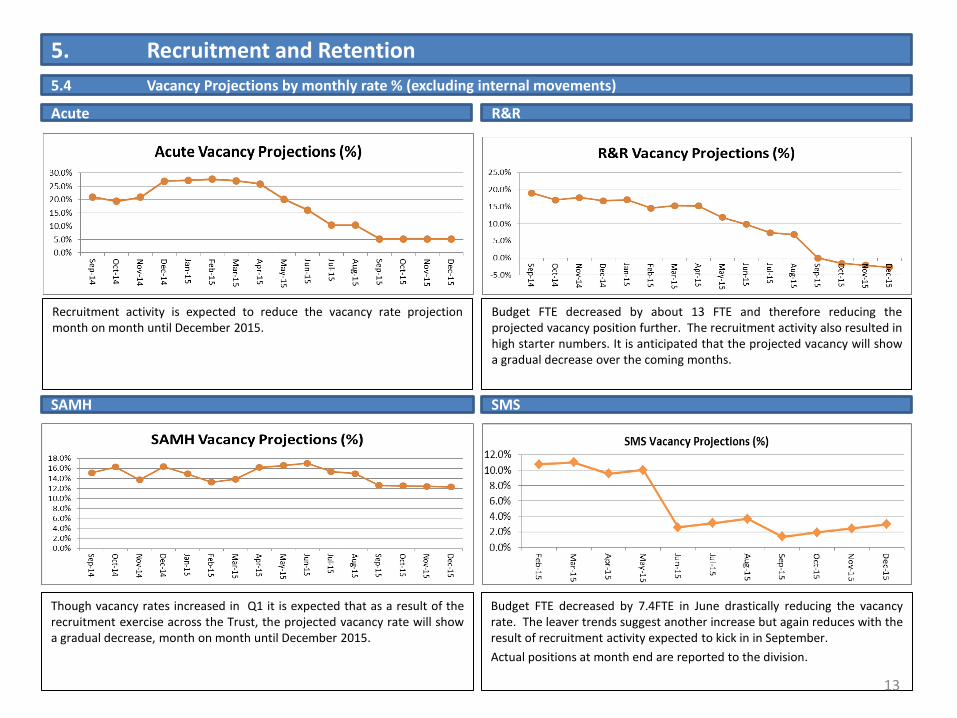
Budget FTE decreased by 7.4FTE in June drastically reducing the vacancy rate. The leaver trends suggest another increase but again reduces with the result of recruitment activity expected to kick in in September.
Actual positions at month end are reported to the division.
Budget FTE decreased by about 13 FTE and therefore reducing the projected vacancy position further. The recruitment activity also resulted in high starter numbers. It is anticipated that the projected vacancy will show a gradual decrease over the coming months.
SMS SAMH
Though vacancy rates increased in Q1 it is expected that as a result of the recruitment exercise across the Trust, the projected vacancy rate will show a gradual decrease, month on month until December 2015.
Acute
Recruitment activity is expected to reduce the vacancy rate projection month on month until December 2015.
13

5. Recruitment and Retention
5.6 Leaver Analysis
Leavers by Reason
There were 18 leavers in April, 20 in May and 21 in June. These exclude trainee doctors and rotational psychologists.
There were higher numbers of leavers recorded in the Acute division as compared to others. Of the 19 leavers 9 of them were Band 2 and 4 associate practitioners and Health Care workers.
Aside 32% of leavers who did not clarify their leaving destinations, the next largest group of leavers left for promotion (10%), relocation (9%)and end of fixed term contracts (9%).
Note : Trainee doctors and rotational staff are excluded from these numbers and consequent turnover figures.
The majority of leavers were within the Nursing (20) and Additional Clinical Services (18)staff groups .
The highest number of leavers were band 6 . This is proportionate to the Trust staff workforce profile .
Majority of leavers left after 2 years and under. (In Q4 of 2014/15 most leavers left within 3-4 years of service). This indicates that staff leave relatively early in their employment with the trust. This is being investigated as part of our exit interview analysis.
Note: Trainee Doctors are excluded from the figures above
Leavers Staff Group and Band Leavers by Staff Group and Length of Service
Leavers by Month
14
5. Recruitment and Retention
Role Re-design and Career Pathways
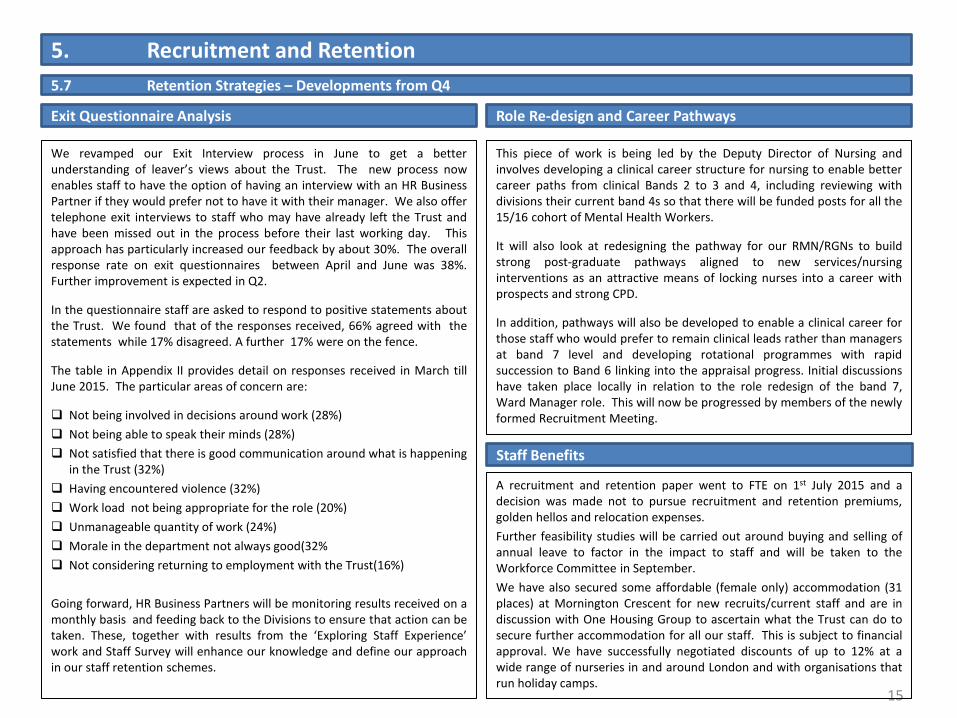
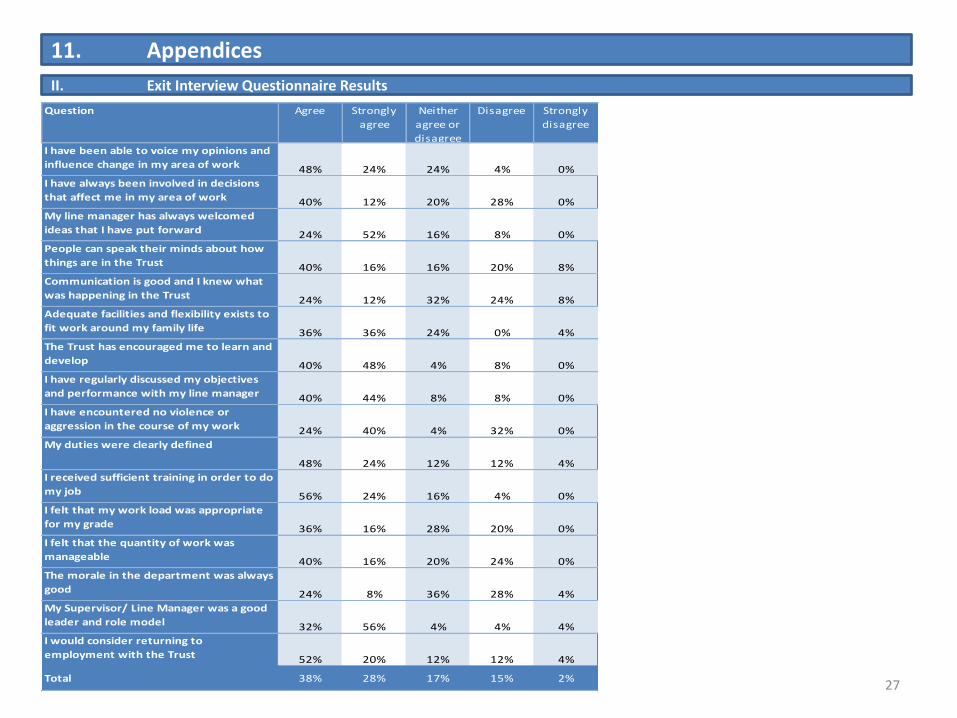
We revamped our Exit Interview process in June to get a better understanding of leaver’s views about the Trust. The new process now enables staff to have the option of having an interview with an HR Business Partner if they would prefer not to have it with their manager. We also offer telephone exit interviews to staff who may have already left the Trust and have been missed out in the process before their last working day. This approach has particularly increased our feedback by about 30%. The overall response rate on exit questionnaires between April and June was 38%. Further improvement is expected in Q2.
In the questionnaire staff are asked to respond to positive statements about the Trust. We found that of the responses received, 66% agreed with the statements while 17% disagreed. A further 17% were on the fence.
The table in Appendix II provides detail on responses received in March till June 2015. The particular areas of concern are:
Not being involved in decisions around work (28%)
Not being able to speak their minds (28%)
Not satisfied that there is good communication around what is happening in the Trust (32%)
Having encountered violence (32%)
Work load not being appropriate for the role (20%)
Unmanageable quantity of work (24%)
Morale in the department not always good(32%
Not considering returning to employment with the Trust(16%)
Going forward, HR Business Partners will be monitoring results received on a monthly basis and feeding back to the Divisions to ensure that action can be taken. These, together with results from the ‘Exploring Staff Experience’ work and Staff Survey will enhance our knowledge and define our approach in our staff retention schemes.
15
5.7 Retention Strategies – Developments from Q4
Exit Questionnaire Analysis
This piece of work is being led by the Deputy Director of Nursing and involves developing a clinical career structure for nursing to enable better career paths from clinical Bands 2 to 3 and 4, including reviewing with divisions their current band 4s so that there will be funded posts for all the 15/16 cohort of Mental Health Workers.
It will also look at redesigning the pathway for our RMN/RGNs to build strong post-graduate pathways aligned to new services/nursing interventions as an attractive means of locking nurses into a career with prospects and strong CPD.
In addition, pathways will also be developed to enable a clinical career for those staff who would prefer to remain clinical leads rather than managers at band 7 level and developing rotational programmes with rapid succession to Band 6 linking into the appraisal progress. Initial discussions have taken place locally in relation to the role redesign of the band 7, Ward Manager role. This will now be progressed by members of the newly formed Recruitment Meeting.
Staff Benefits
A recruitment and retention paper went to FTE on 1st July 2015 and a decision was made not to pursue recruitment and retention premiums, golden hellos and relocation expenses.
Further feasibility studies will be carried out around buying and selling of annual leave to factor in the impact to staff and will be taken to the Workforce Committee in September.
We have also secured some affordable (female only) accommodation (31 places) at Mornington Crescent for new recruits/current staff and are in discussion with One Housing Group to ascertain what the Trust can do to secure further accommodation for all our staff. This is subject to financial approval. We have successfully negotiated discounts of up to 12% at a wide range of nurseries in and around London and with organisations that run holiday camps.

5. Recruitment and Retention
5.7 Retention Strategies – Developments from Q4
16
Staff Survey Results
The HR Business Partners have worked with Associate Divisional Directors to analyse the staff survey results in their divisions, particularly where there are high vacancy and turnover rates.
This analysis, together with the data derived from the Trust’s “Exploring Staff Experience” work, is being used to develop plans to address any shortfalls to ensure that C&I maintains a good reputation as an employer of choice.
The detailed action plans in respect to the three key topics of Exploring Staff Experience – namely, safety at work, harassment and raising concerns – have also been provided to senior leaders across the trust via the Senior Leaders Meeting held on 24 June 2015.
They will review these and put actions in place to address the most pressing issues for their staff. At trust level, three pledges have been identified against the three topics (safety at work, and raising concerns and equality), along with agreed actions to be taken up across the trust by all staff, from ward to Board.
A detailed communications strategy to promote these Improving Staff Experience pledges is being drafted and will coincide with promotion of uptake of the staff survey in 2015.
Raising concerns at Work Policy
As part of actions around the 3 pledges mentioned above, the whistleblowing policy is therefore currently being reviewed and will be called ‘Raising Concerns at Work policy’. Key changes and procedures associated with the revised policy are as follows:
The Trust has signed up to the Speak Out Safely campaign and publicised this to our staff and on our internet site. The policy encourages staff, contractors, secondees and volunteers to raise concerns and provides a range of options for doing so.
The Trust is in the process of introducing a 24/7 confidential hotline in Q2. The hotline will be run securely by a third party called Safecall where staff will be able to raise concerns anonymously, or if so wish to divulge their name only to (Safecall), or they may choose to disclose their identity to both the operator and C&I. These factors can contribute to an impression that an organisation is not taking appropriate action. Our aim in introducing the new system is to increase confidence amongst our staff to raise concerns and ensuring that all staff who raise concerns can be given detailed feedback on the actions taken, regardless of whether they disclose their identity.
The Trust has also made a pledge that ‘whenever we see issues of concern that need to be raised- with colleagues, managers or senior staff at C&I, we will speak up and speak out for the sake of patient safety, improved service user and staff experience and enhanced quality of care’.
The Trust will also, as part of the pledge, embrace the notion of the ‘duty of candour’ which builds on advice in the Trust’s Being Open and Duty of Candour policy.
The Raising Concerns Annual Report will be tabled at the next Audit and Risk Committee and will contain a breakdown of cases received and investigated in the course of the year.
Staff Friends’ and Family Test
We have now launched a refreshed staff friends and family test, which is online and enables us to track response rates and feedback by division, further assisting in continual review of the retention work at divisional level.
Improving Staff Experience and Data

6. Learning and Development
Mandatory Training Appraisals
The Trust mandatory training figures remain high across the Trust at 89.1% , only a very slight decrease form the last quarter at 89. 7%
Investment in improved reporting and enhanced e-learning delivery will continue to improve these figures
Through liaison with Skills for Health, work is ongoing to prepare the trust’s learner management system and its data for the introduction of the WIRED reporting system, which has a go-live date of 1 October 2015.
17
Further to the retention strategies outlined in section 4.5, we are continuing to provide a comprehensive learning offer for every banding level in the Trust, including, for example, our vocational development programme and leadership development programmes. We are committed to introducing a meaningful approach to talent management and will be introducing care certificate and apprenticeship opportunities. Staff are encouraged to continue professional development.
In Q1, from centrally held figures, about 418 FTE days a month were spent on CPD activity across the Trust. This excludes all locally monitored training days(e.g conferences, university days). The Workforce Committee will scrutinise learning priorities, education commissioning and staff engagement with courses in order to assess the effectiveness of our CPD offer and its impact on safety and quality of service.
A revised appraisal and talent management approach will be launched in 2016. Specific statistics for learning activity in Q1 are detailed below with further improvements built into the HR Action Plan.
In 2015/16, the window system has been reintroduced to include appraisals undertaken from January 2015 and extending the timeline to July 2015.
As the appraisal periods is still running and will close on 31 July 2015, full appraisal figures will be provided in the Q2 report. In the meantime, liaison between L&D and service divisions and corporate departments is being enhanced to ensure all returns are made and a comprehensive compliance figure can be generated.
6. Learning and Development
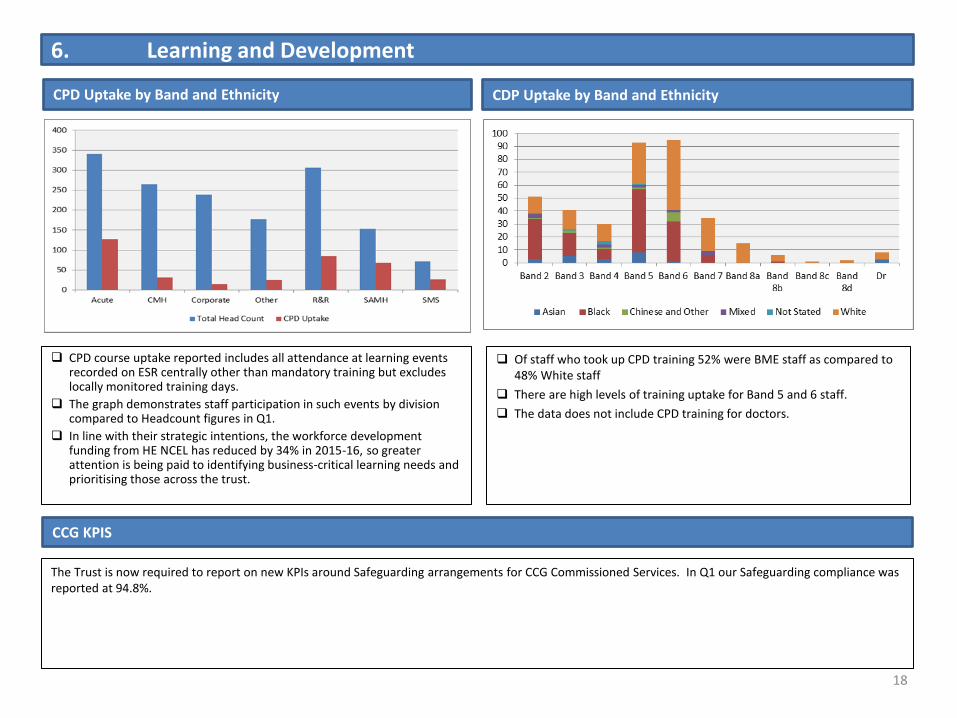
Of staff who took up CPD training 52% were BME staff as compared to 48% White staff
There are high levels of training uptake for Band 5 and 6 staff.
The data does not include CPD training for doctors.
CPD Uptake by Band and Ethnicity CDP Uptake by Band and Ethnicity
18
CPD course uptake reported includes all attendance at learning events recorded on ESR centrally other than mandatory training but excludes locally monitored training days.
The graph demonstrates staff participation in such events by division compared to Headcount figures in Q1.
In line with their strategic intentions, the workforce development funding from HE NCEL has reduced by 34% in 2015-16, so greater attention is being paid to identifying business-critical learning needs and prioritising those across the trust.
CCG KPIS
The Trust is now required to report on new KPIs around Safeguarding arrangements for CCG Commissioned Services. In Q1 our Safeguarding compliance was reported at 94.8%.
7. Employee Relations
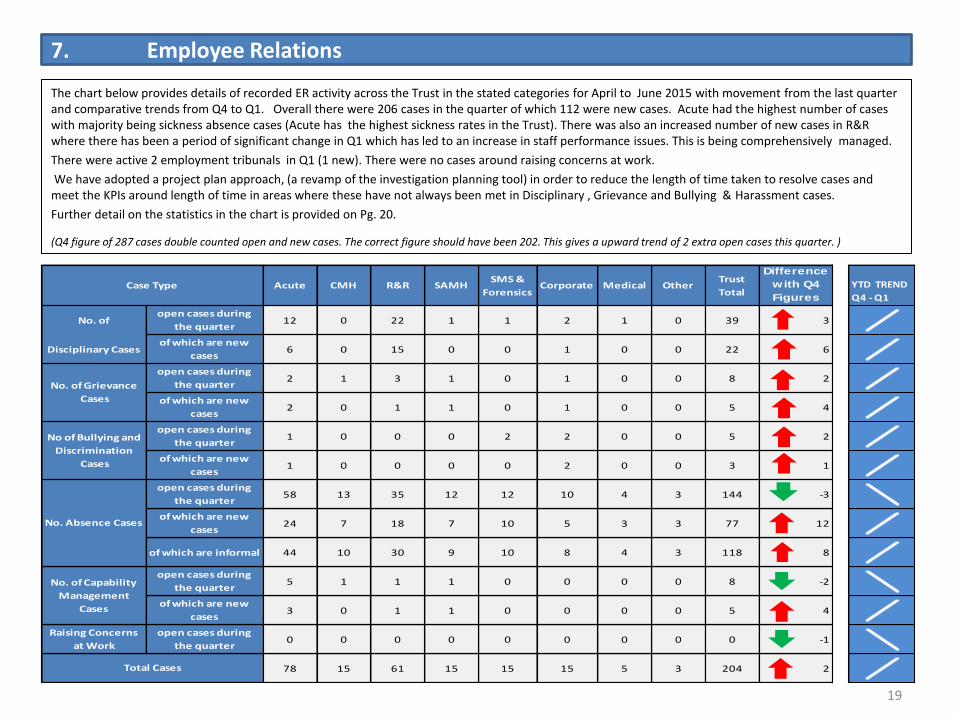
The chart below provides details of recorded ER activity across the Trust in the stated categories for April to June 2015 with movement from the last quarter and comparative trends from Q4 to Q1. Overall there were 206 cases in the quarter of which 112 were new cases. Acute had the highest number of cases with majority being sickness absence cases (Acute has the highest sickness rates in the Trust). There was also an increased number of new cases in R&R where there has been a period of significant change in Q1 which has led to an increase in staff performance issues. This is being comprehensively managed.
There were active 2 employment tribunals in Q1 (1 new). There were no cases around raising concerns at work.
We have adopted a project plan approach, (a revamp of the investigation planning tool) in order to reduce the length of time taken to resolve cases and meet the KPIs around length of time in areas where these have not always been met in Disciplinary , Grievance and Bullying & Harassment cases.
Further detail on the statistics in the chart is provided on Pg. 20.
(Q4 figure of 287 cases double counted open and new cases. The correct figure should have been 202. This gives a upward trend of 2 extra open cases this quarter. )
19
YTD TREND
Q4 - Q1
Acute CMH R&R SAMHSMS &
ForensicsCorporate Medical Other
Trust
Total
Difference
with Q4
Figures
No. ofopen cases during
the quarter12 0 22 1 1 2 1 0 39 3
Disciplinary Cases of which are new
cases6 0 15 0 0 1 0 0 22 6
open cases during
the quarter2 1 3 1 0 1 0 0 8 2
of which are new
cases2 0 1 1 0 1 0 0 5 4
open cases during
the quarter1 0 0 0 2 2 0 0 5 2
of which are new
cases1 0 0 0 0 2 0 0 3 1
open cases during
the quarter58 13 35 12 12 10 4 3 144 -3
of which are new
cases24 7 18 7 10 5 3 3 77 12
of which are informal 44 10 30 9 10 8 4 3 118 8
open cases during
the quarter5 1 1 1 0 0 0 0 8 -2
of which are new
cases3 0 1 1 0 0 0 0 5 4
Raising Concerns
at Work
open cases during
the quarter0 0 0 0 0 0 0 0 0 -1
78 15 61 15 15 15 5 3 204 2
No. of Grievance
Cases
Total Cases
No of Bullying and
Discrimination
Cases
Case Type
No. of Capability
Management
Cases
No. Absence Cases

7. Employee Relations
23% of cases were managed informally (9 out of 39),10% less than Q4.
40% of formal cases were referred to hearing (11 out of 29). Of those cases 6 hearing have taken place in the quarter. 67% (4 out of 6) resulted in dismissal. 33% resulted in written warnings.
20% of all cases resulted in suspension (8 out of 39) and 20% of all cases resulted in a restriction of duties (8 out of 39).
41% of cases related to clinical issues (16 out of 39) e.g. medication errors
47% of cases related to staff behavioural issues (17 out of 39) e.g. not following management instruction
41% of cases concluded under 28 days 34% below the KPI for investigation length. Reasons for cases going over 50 days include: annual leave of witnesses, new allegations arising during investigation requiring investigation, availability of the investigation manager.
20
Grievance
50% of all cases related to implementation of policy and procedures.
37% of all cases related to inappropriate conduct.
63% of cases were formal (5 out of 8).
63 % of cases were concluded under the KPI target of 28 days. Reasons cases exceeded 50 days to investigate include: union representative availability, availability of investigation manager.
Bullying and Harassment
No cases met the KPI length of time target. 60% of cases took over 50 days to resolve. Reasons cases exceeded 50 days to investigate include: attempts to resolve issues informally with complainant, unexpected absence of investigation manager, large number of witnesses to meet.
Absence
82% of cases were managed informally ( 118 out of 144).
3 formal cases proceeding to a final stage hearing.
Capability
50% of cases were managed informally without requiring formal action (4 out of 8). Out of the 4 formal cases, 1 case resulted in demotion, 1 case resulted in a resignation, and 1 case resulted in redeployment.
100% of cases were related to clinical staff (a total of 8 out of 8)
50% of the cases related to staff band 7 and above (a total of 4 out of 8 cases).
62% (256) of all ER cases were BME staff as compared to 35% (148) White staff. (8 did not have ethnicity stated).
77% of staff who have been involved in Disciplinary cases were BME staff, slightly higher than the average for last year (70%) and one of the indicators monitored under the WRES. There is further analysis being carried out to investigate this. Unconscious bias training is currently being scoped with external providers. A series of appeal reviews is being planned to ensure that decisions relating to investigations of an employee relations nature are appropriate and fair. An update on this will be reported in the Q2 Board Report. Work is being scoped to implement a series of conversations with members of our BME workforce about experience of working in Trust to be led by Director of Nursing and People and the Chief Operating Officer and facilitated by an external consultant. This is one of a series of actions arising from the seminar delivered by Roger Kline in April 2015.
Disciplinary Ethnicity Monitoring
Grievance and Bullying & Harassment Sickness Absence and Capability

8. Equality and Diversity Monitoring
Staff Profile by Band and Ethnicity
21
As part of our commitment to the Workforce Race Equality Standard we published our workforce profile for 2014/15 measured against particular indicators in June. The Trust is now required to report yearly improvements on the various indicators which include; % of BME staff in Bands 8-9 compared with % BME staff in the entire workforce. Relative likelihood of BME staff being appointed from shortlisted compared to White staff across all posts. Relative likelihood of BME staff entering formal disciplinary processes as compared to White staff. Relative likelihood of BME staff accessing CPD training compared to White staff. Board being representative of the population it serves. While some of these have been reported in relevant sections on Recruitment, Employee Relations and L&D, the statistics below present the wider workforce profile status at the end of Q1 in comparison to local population statistics in the areas of ethnicity, age, gender, disability, marital status religion and sexual orientation.
The data above shows that :
In our workforce, 36% are BME staff as compared to 62% White staff (2% not stated).
In our workforce, 17% of our staff in bands 8 and above are BME staff (including medical staff) as compared to 79% White (4% not stated).
Majority of staff in Band 1-5 are BME staff (56%) while majority of staff in Band 6-7 are White staff 73%
33% of the local population are of black and ethnic minorities while 68% are white.
It follows that the Trust overall has a higher representation of BME staff as compared to the local population but a lower representation of BME staff in higher bands, Executive and Board level.
8. Equality and Diversity Monitoring
Staff Profile by Disability Staff Profile by Sexual Orientation
22
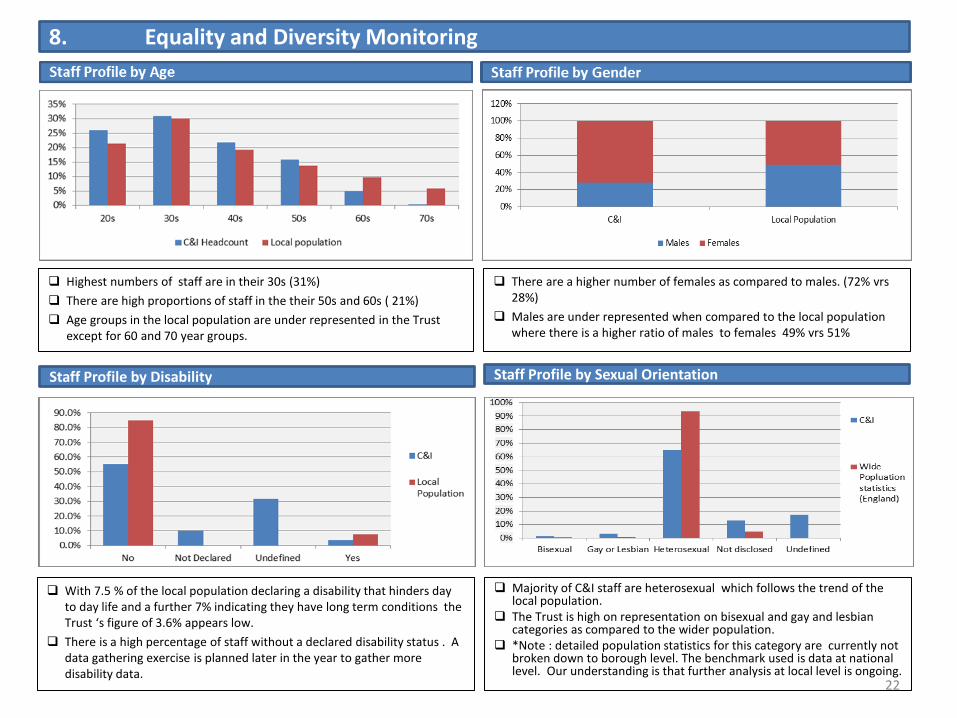
With 7.5 % of the local population declaring a disability that hinders day to day life and a further 7% indicating they have long term conditions the Trust ‘s figure of 3.6% appears low.
There is a high percentage of staff without a declared disability status . A data gathering exercise is planned later in the year to gather more disability data.
Highest numbers of staff are in their 30s (31%)
There are high proportions of staff in the their 50s and 60s ( 21%)
Age groups in the local population are under represented in the Trust except for 60 and 70 year groups.
There are a higher number of females as compared to males. (72% vrs 28%)
Males are under represented when compared to the local population where there is a higher ratio of males to females 49% vrs 51%
Majority of C&I staff are heterosexual which follows the trend of the local population.
The Trust is high on representation on bisexual and gay and lesbian categories as compared to the wider population.
*Note : detailed population statistics for this category are currently not broken down to borough level. The benchmark used is data at national level. Our understanding is that further analysis at local level is ongoing.

8. Equality and Diversity Monitoring
Religious Belief Marital Status
23
Majority of staff are Christian (32% vrs 37%) as compared to the local population.
Atheists are the second highest category (18% vrs 28% ) of the local population.
Islam is the 3rd highest religious belief.
About 17% of staff have not defined religious belief. Data gathering exercises are planned to resolve this.
Majority of staff are single staff, higher than represented in the local population ( 59% vrs 54%).
24% of staff are married compared to 25% of the local population.
11% of Trust staff have not disclosed their marital status.
9. Safer Staffing
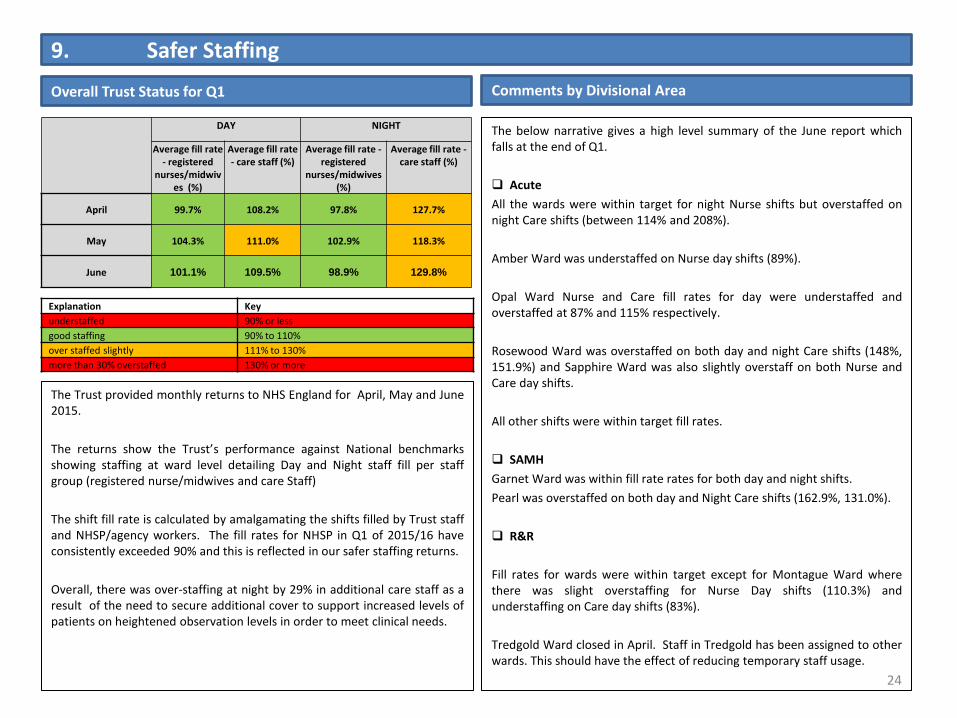
The Trust provided monthly returns to NHS England for April, May and June 2015.
The returns show the Trust’s performance against National benchmarks showing staffing at ward level detailing Day and Night staff fill per staff group (registered nurse/midwives and care Staff)
The shift fill rate is calculated by amalgamating the shifts filled by Trust staff and NHSP/agency workers. The fill rates for NHSP in Q1 of 2015/16 have consistently exceeded 90% and this is reflected in our safer staffing returns.
Overall, there was over-staffing at night by 29% in additional care staff as a result of the need to secure additional cover to support increased levels of patients on heightened observation levels in order to meet clinical needs.
The below narrative gives a high level summary of the June report which falls at the end of Q1.
Acute
All the wards were within target for night Nurse shifts but overstaffed on night Care shifts (between 114% and 208%).
Amber Ward was understaffed on Nurse day shifts (89%).
Opal Ward Nurse and Care fill rates for day were understaffed and overstaffed at 87% and 115% respectively.
Rosewood Ward was overstaffed on both day and night Care shifts (148%, 151.9%) and Sapphire Ward was also slightly overstaff on both Nurse and Care day shifts.
All other shifts were within target fill rates.
SAMH
Garnet Ward was within fill rate rates for both day and night shifts.
Pearl was overstaffed on both day and Night Care shifts (162.9%, 131.0%).
R&R
Fill rates for wards were within target except for Montague Ward where there was slight overstaffing for Nurse Day shifts (110.3%) and understaffing on Care day shifts (83%).
Tredgold Ward closed in April. Staff in Tredgold has been assigned to other wards. This should have the effect of reducing temporary staff usage.
Explanation Key
understaffed 90% or less
good staffing 90% to 110%
over staffed slightly 111% to 130%
more than 30% overstaffed 130% or more
Overall Trust Status for Q1 Comments by Divisional Area
24
DAY NIGHT
Average fill rate - registered
nurses/midwives (%)
Average fill rate - care staff (%)
Average fill rate - registered
nurses/midwives (%)
Average fill rate - care staff (%)
April 99.7% 108.2% 97.8% 127.7%
May 104.3% 111.0% 102.9% 118.3%
June 101.1% 109.5% 98.9% 129.8%

10. Conclusion
The Trust has made good progress in majority of its HR Key Performance Indicators since Q4 as a result of ongoing work around the implementation of the CQC Action Plan especially around recruitment.
The workforce data from Q1 has highlighted how improvements are being made and where there is further need to address issues.
It is expected that further improvement will be reported in Q2 and Q3 of 2015/16.
There is still ongoing work from actions identified in Q4 and new actions identified in Q1.
The HR Action Plan in Appendix 1 details progress made against key deliverables and timescales for completion of those still in progress.
Key actions for Q2 include:
Continued recruitment initiatives.
Embedding TRAC in recruitment processes to reduce time spent to recruit and improve reporting
ESR Data cleanse activity to provide a better baseline for workforce planning and gather equalities data where it is lacking.
Continued Learning and Development activity and reporting.
Developing protocols around bank and agency spend.
Future Plans
25
11. Appendices
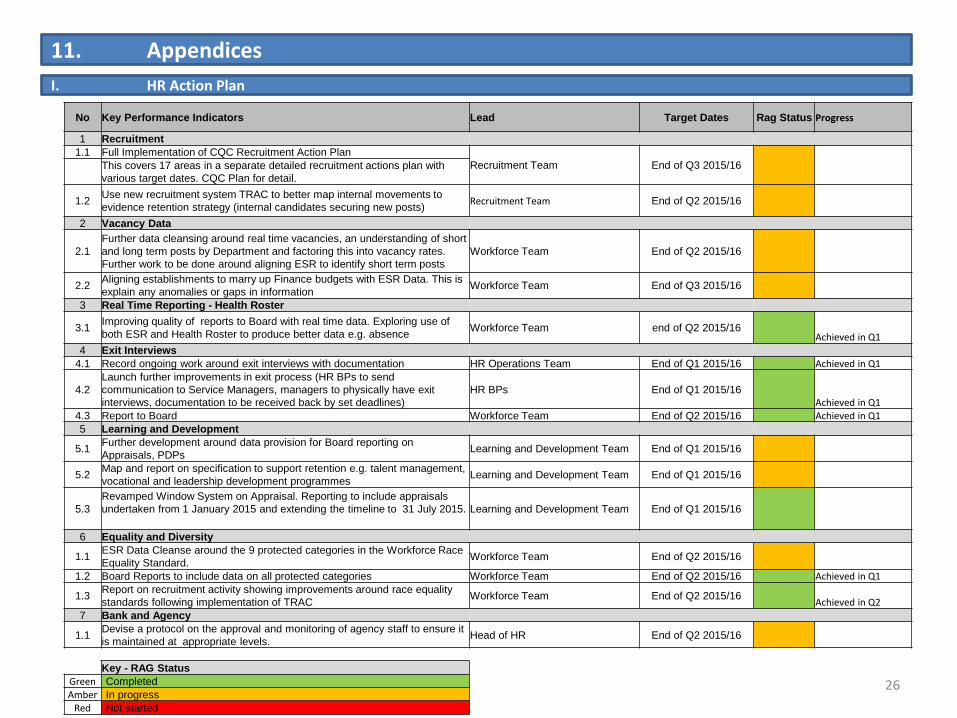
I. HR Action Plan
26
No Key Performance Indicators Lead Target Dates Rag Status Progress
1 Recruitment 1.1 Full Implementation of CQC Recruitment Action Plan
Recruitment Team End of Q3 2015/16
This covers 17 areas in a separate detailed recruitment actions plan with
various target dates. CQC Plan for detail.
1.2 Use new recruitment system TRAC to better map internal movements to
evidence retention strategy (internal candidates securing new posts) Recruitment Team End of Q2 2015/16
2 Vacancy Data
2.1
Further data cleansing around real time vacancies, an understanding of short
and long term posts by Department and factoring this into vacancy rates.
Further work to be done around aligning ESR to identify short term posts
Workforce Team End of Q2 2015/16
2.2 Aligning establishments to marry up Finance budgets with ESR Data. This is
explain any anomalies or gaps in information Workforce Team End of Q3 2015/16
3 Real Time Reporting - Health Roster
3.1 Improving quality of reports to Board with real time data. Exploring use of
both ESR and Health Roster to produce better data e.g. absence Workforce Team end of Q2 2015/16
Achieved in Q1
4 Exit Interviews 4.1 Record ongoing work around exit interviews with documentation HR Operations Team End of Q1 2015/16 Achieved in Q1
4.2
Launch further improvements in exit process (HR BPs to send
communication to Service Managers, managers to physically have exit
interviews, documentation to be received back by set deadlines)
HR BPs End of Q1 2015/16
Achieved in Q1
4.3 Report to Board Workforce Team End of Q2 2015/16 Achieved in Q1
5 Learning and Development
5.1 Further development around data provision for Board reporting on
Appraisals, PDPs Learning and Development Team End of Q1 2015/16
5.2 Map and report on specification to support retention e.g. talent management,
vocational and leadership development programmes Learning and Development Team End of Q1 2015/16
5.3
Revamped Window System on Appraisal. Reporting to include appraisals
undertaken from 1 January 2015 and extending the timeline to 31 July 2015.
Learning and Development Team End of Q1 2015/16
6 Equality and Diversity
1.1 ESR Data Cleanse around the 9 protected categories in the Workforce Race
Equality Standard. Workforce Team End of Q2 2015/16
1.2 Board Reports to include data on all protected categories Workforce Team End of Q2 2015/16 Achieved in Q1
1.3 Report on recruitment activity showing improvements around race equality
standards following implementation of TRAC Workforce Team End of Q2 2015/16
Achieved in Q2
7 Bank and Agency
1.1 Devise a protocol on the approval and monitoring of agency staff to ensure it
is maintained at appropriate levels. Head of HR End of Q2 2015/16
Key - RAG Status
Green Completed
Amber In progress
Red Not started
11. Appendices
II. Exit Interview Questionnaire Results
27
Question Agree Strongly
agree
Neither
agree or
disagree
Disagree Strongly
disagree
I have been able to voice my opinions and
influence change in my area of work 48% 24% 24% 4% 0%
I have always been involved in decisions
that affect me in my area of work 40% 12% 20% 28% 0%
My line manager has always welcomed
ideas that I have put forward 24% 52% 16% 8% 0%
People can speak their minds about how
things are in the Trust 40% 16% 16% 20% 8%
Communication is good and I knew what
was happening in the Trust 24% 12% 32% 24% 8%
Adequate facilities and flexibility exists to
fit work around my family life 36% 36% 24% 0% 4%
The Trust has encouraged me to learn and
develop 40% 48% 4% 8% 0%
I have regularly discussed my objectives
and performance with my line manager 40% 44% 8% 8% 0%
I have encountered no violence or
aggression in the course of my work 24% 40% 4% 32% 0%
My duties were clearly defined
48% 24% 12% 12% 4%
I received sufficient training in order to do
my job 56% 24% 16% 4% 0%
I felt that my work load was appropriate
for my grade 36% 16% 28% 20% 0%
I felt that the quantity of work was
manageable 40% 16% 20% 24% 0%
The morale in the department was always
good 24% 8% 36% 28% 4%
My Supervisor/ Line Manager was a good
leader and role model 32% 56% 4% 4% 4%
I would consider returning to
employment with the Trust 52% 20% 12% 12% 4%
Total 38% 28% 17% 15% 2%

11. Appendices
III. Report Notes and Definitions
FTE – (Full-Time Equivalent) : Number of full time positions. A member of staff working full time will have a FTE of 1.00.
Establishment (FTE) : Budgeted full time equivalent of established posts.
Staff In Post (FTE and headcount) : Number of staff employed at the end of the quarter (full-time equivalent and headcount).
Vacancy Rate : The vacancy rate is a measure of the difference between established posts and actual staff in post.
i.e. (Established FTE – Actual FTE) / Established FTE x 100.
Staff Turnover: The percentage (rate) of people leaving the Trust over the 3 monthly period.
i.e. Number of leavers over the 3 month period (headcount) /
average staff in post over period (headcount) x 100
Note : excludes rotational staff (Junior Doctors) and staff that have transferred to another organisation as part of TUPE or internal movements.
Sickness Absence Rate: The percentage rate of sickness absence calculated in days lost.
i.e. (FTE days lost through absence/FTE days contracted in period) x 100.
Salary Based Sickness Absence Cost (£) - The basic salary amount paid to staff whilst absent due to sickness (excludes London weighting and any allowances).
Bank Use (% of funded establishment) - Bank use expressed as a percentage of funded establishment.
i.e. (Bank use (FTE) / Establishment (FTE)) x 100
Mandatory Training (%) - Number of staff attended courses/ Number of that should have attended x 100.
KPI RAG rating
The RAG rating for mandatory training has been altered following discussions with the Executive to bring them in line with other organisations. Trust targets to reduce both sickness absence and bank use are reflected in the scoring parameters set for both these areas. Vacancy rate RAG ratings have been set at a level that takes account of the need to keep some vacancies open for potential redeployments from organisational change, whilst safely running services.
Measure Green Amber Red
Vacancy Rate <10% 10%-15% >15% or <0%
Bank Use (% of funded establishment) <10% 10%-14% >14%
Sickness Absence Rate <3% 3%-3.5% >3.6%
Staff Turnover (annual) <16% 16%-20% >20%
Mandatory Training >80% 68%-79% <68%
Appraisals >80% 68%-79% <68%
Item Data Source
Establishment (FTE) Finance Ledger
Staff in Post (Headcount & FTE) ESR
Bank Use (FTE) Finance Ledger
Bank & Agency Spend (£) Finance Ledger
Sickness Absence (% and £) ESR
Turnover % (Leavers and Headcount) ESR
Mandatory Training ESR/ OLM
Data Sources
28