HUMAN-MOUSE CONSERVED COEXPRESSION NETWORKS PREDICT CANDIDATE DISEASE GENES Ala U., Piro R., Grassi...
20
HUMAN-MOUSE CONSERVED HUMAN-MOUSE CONSERVED COEXPRESSION NETWORKS PREDICT COEXPRESSION NETWORKS PREDICT CANDIDATE DISEASE GENES CANDIDATE DISEASE GENES Ala U. Ala U. , , Piro R., Grassi E., Damasco Piro R., Grassi E., Damasco C., Silengo L., Brunner H., Provero C., Silengo L., Brunner H., Provero P. and Di Cunto F. P. and Di Cunto F. [email protected] [email protected] Molecular Biotechnology Center, Molecular Biotechnology Center, University of Torino University of Torino
-
Upload
della-charles -
Category
Documents
-
view
213 -
download
0
Transcript of HUMAN-MOUSE CONSERVED COEXPRESSION NETWORKS PREDICT CANDIDATE DISEASE GENES Ala U., Piro R., Grassi...
HUMAN-MOUSE CONSERVED HUMAN-MOUSE CONSERVED COEXPRESSION NETWORKS PREDICT COEXPRESSION NETWORKS PREDICT
CANDIDATE DISEASE GENES CANDIDATE DISEASE GENES
Ala U.Ala U.,, Piro R., Grassi E., Damasco C., Silengo Piro R., Grassi E., Damasco C., Silengo L., Brunner H., Provero P. and Di Cunto F.L., Brunner H., Provero P. and Di Cunto F.
[email protected]@unito.it
Molecular Biotechnology Center, University of TorinoMolecular Biotechnology Center, University of Torino

IntroductionIntroduction
• Massive repositories of gene expression data obtained with microarray technology represent an extremely rich source of biological information;
• Since genes involved in the same functions tend to show very similar expression profiles, co-expression analysis performed on these datasets could be a very powerful approach for inferring functional relationships among genes and for predicting the involvement of specific sequences in human genetic diseases;
• However, so far gene co-expression has not proved to be a particularly useful criterion for disease genes identification.

ReasonsReasons
1. Microarray data are noisy
2. Many genes showing very similar expression profiles are not functionally related (Spellman et al, 2002)
Functional relationships inferred on the basis of co-expression in a single species contain a large majority of false positive predictions.
A powerful help: phylogenetic conservation
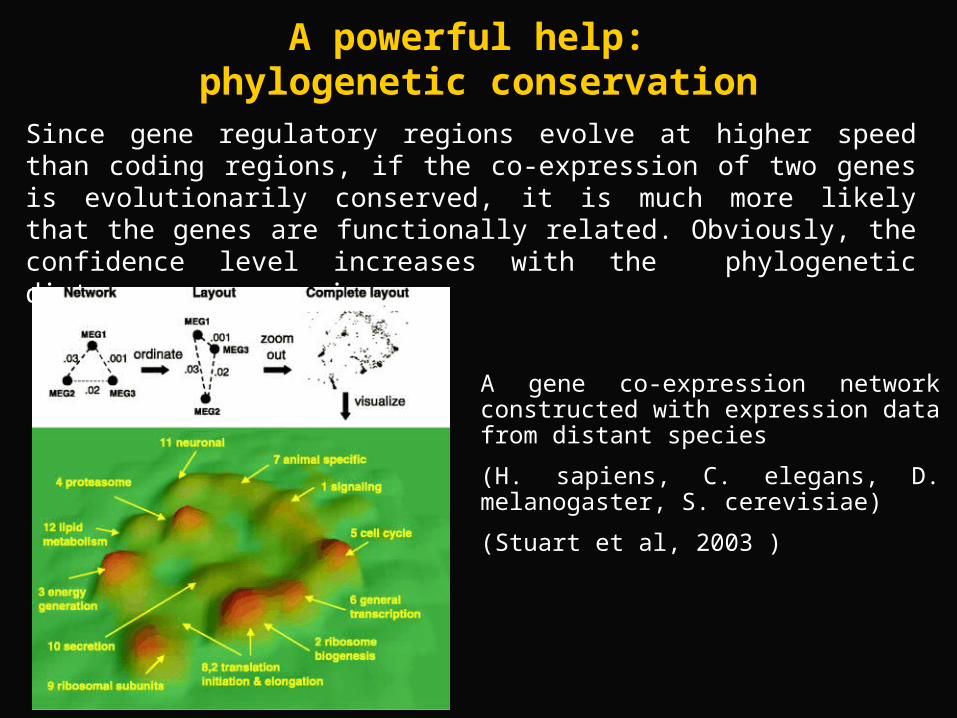
Since gene regulatory regions evolve at higher speed than coding regions, if the co-expression of two genes is evolutionarily conserved, it is much more likely that the genes are functionally related. Obviously, the confidence level increases with the phylogenetic distance among species.
A gene co-expression network constructed with expression data from distant species
(H. sapiens, C. elegans, D. melanogaster, S. cerevisiae)
(Stuart et al, 2003 )
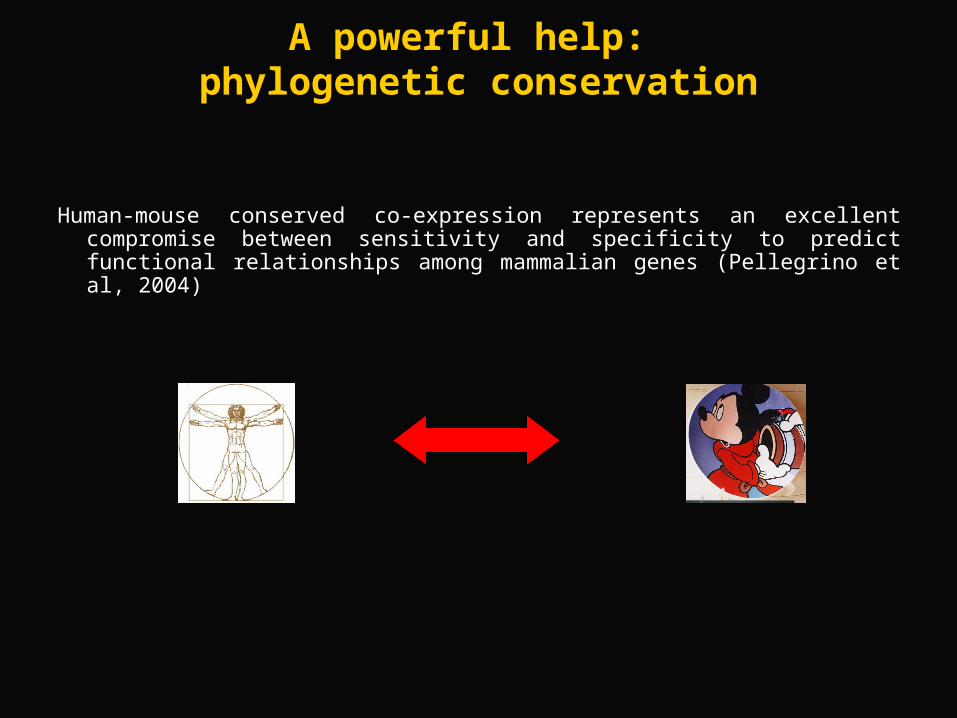
Human-mouse conserved co-expression represents an excellent compromise between sensitivity and specificity to predict functional relationships among mammalian genes (Pellegrino et al, 2004)
A powerful help: phylogenetic conservation

Evaluation of gene expression profile correlation among all the probes by Pearson’s coefficient
Single-species datasets of microarray experiments, based on probes which can be linked to EntrezGene
IDs
Link every probe with the probes which are in the first percentile of the respective ranked lists
Merge links between probes by Entrez Gene identifiers
Construction of human-mouse conserved Construction of human-mouse conserved coexpression networks for disease gene predictioncoexpression networks for disease gene prediction
Step one: single species networksStep one: single species networks
Homo sapiens Mus musculus
Human gene
co-expression networks
H-GCN
Mouse gene
co-expression networks
M-GCN

Select the links found in both the co-expression networks, according to Homologene
Construction of human-mouse conserved Construction of human-mouse conserved coexpression networks for disease gene predictioncoexpression networks for disease gene prediction
Step two: human-mouse networksStep two: human-mouse networks
Human gene
co-expression networks
H-GCN
Mouse gene
co-expression networks
M-GCN
Human-mouse co-expression networkHuman-mouse co-expression network
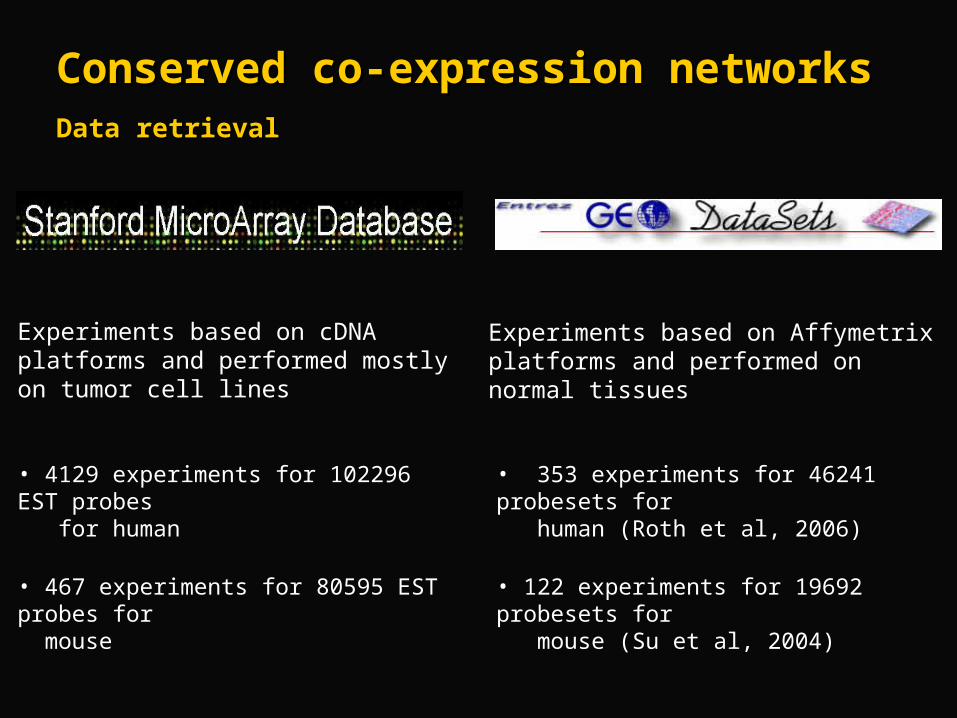
Conserved co-expression networksConserved co-expression networksData retrievalData retrieval
• 4129 experiments for 102296 EST probes for human
• 467 experiments for 80595 EST probes for mouse
• 353 experiments for 46241 probesets for human (Roth et al, 2006)
• 122 experiments for 19692 probesets for mouse (Su et al, 2004)
Experiments based on cDNA platforms and performed mostly on tumor cell lines
Experiments based on Affymetrix platforms and performed on normal tissues

• 8512 nodes (genes);• 56397 edges;
• 12766 nodes (genes);• 155403 edges;
We concentrate our network analysis on CC (Co-expression cluster) defined as the nearest neighbors of each node of networks, thus obtaining a CC for each gene
Conserved co-expression networksConserved co-expression networksResultsResults
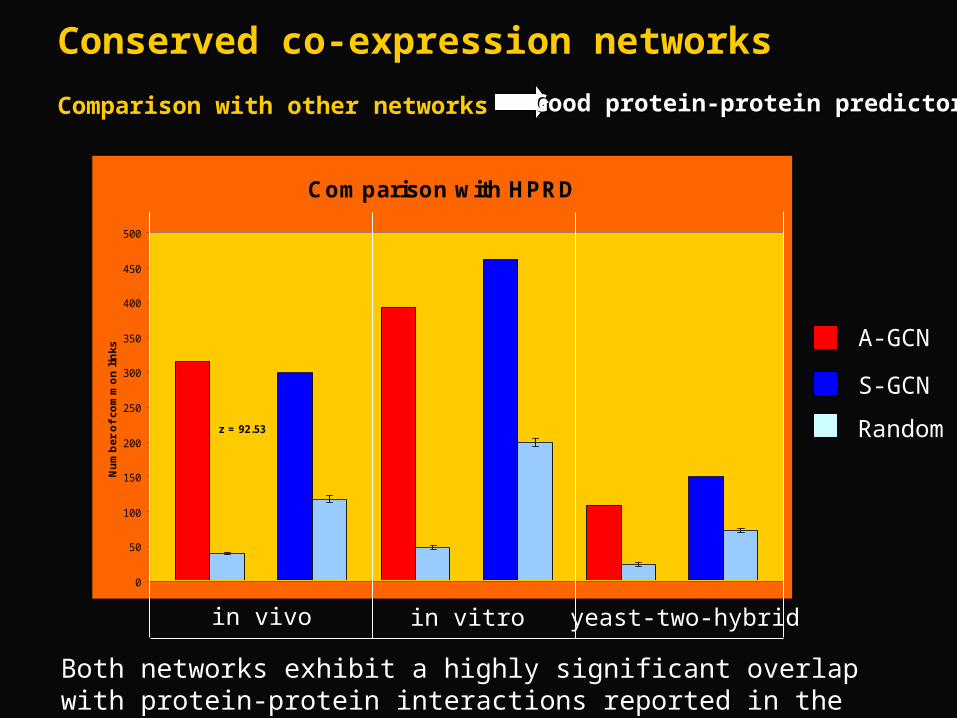
Comparison with HPRD
0
50
100
150
200
250
300
350
400
450
500
Nu
mb
er o
f co
mm
on
lin
ks
z = 92.53 z = 18.99 z = 54.16 z = 23.37 z = 15.57 z = 14.32
in vivo in vitro yeast-two-hybrid
A-GCN
S-GCN
Random
Both networks exhibit a highly significant overlap with protein-protein interactions reported in the Human Protein Reference Database
Conserved co-expression networksConserved co-expression networks
Comparison with other networksComparison with other networks Good protein-protein predictorsGood protein-protein predictors

GO Enrichment
0
500
1000
1500
2000
2500
3000
3500
4000
4500
5000
Nu
mb
er o
f G
O C
C E
nri
ched
z = 80.68 z = 63.23
A-CCN
S-CCN
Random
A-CCN and S-CCN show a strong enrichment for functional annotation, compared with random permutations.
Conserved co-expression networksConserved co-expression networks
GO AnalysisGO Analysis Good Good criterion to identify functionally related genescriterion to identify functionally related genes

Predicting human disease genesPredicting human disease genes
MimMiner (Van Driel et al, 2006), a text-mining phenotype similarity relationship database, represents a very useful way for the merging of co-expression data with disease information.
A-CCN
S-CCN
Random
OMIM Enrichment
0
50
100
150
200
250
300
350
400
Nu
mb
er o
f O
MIM
ch
arac
teri
sed
lin
ks
z = 75.42 z = 13.62
A-CCN and S-CCN show also a strong enrichment for what concern OMIM Ids characterizing disease phenotype.

OMIM locusOMIM locus(phenotype description)(phenotype description)
CCs Conserved Co-expression clustersCCs Conserved Co-expression clusters
How to of the algorithm (1)How to of the algorithm (1)

OMIM locusOMIM locus(phenotype description)(phenotype description)
CCs Conserved Co-expression clustersCCs Conserved Co-expression clusters
DRCCsDRCCsDisease Related Co-expression ClustersDisease Related Co-expression Clusters
How to of the algorithm (2)How to of the algorithm (2)

OMIM locusOMIM locus(phenotype description)(phenotype description)
DRCCsDRCCsDisease Related Co-expression ClustersDisease Related Co-expression Clusters
How to of the algorithm (3)How to of the algorithm (3)
These genes become our candidate These genes become our candidate disease genesdisease genes

Leave-one-outLeave-one-out
Leave-one-out cross validation tests over all known disease genes have shown good performance
We applied our procedure to 850 OMIM phenotype entries with unknown molecular basis (but mapped to one or more genetic loci).
The candidates are 321, covering a set of 81 loci (65 from A-CCN, 6 from S-CCN and 10 from both networks)
Predicting human disease genesPredicting human disease genes ResultsResults

Examples and discussion of some candidatesExamples and discussion of some candidates
Network Available information HUGO MIM ID Locus SYNDROME LOCUS SIZE DRCC SIZE P-Value
A 1 KCNIP4 607221 4p15 Epilepsy, partial, with pericentral spikes 86 143 1.65E-07A 1 LGI2 607221 4p15 Epilepsy, partial, with pericentral spikes 86 51 2.31E-07
A 1 SNCG 605285 10q23.2 Neuropathy, hereditary motor and sensory, russe type 26 32 5.27E-09
S 1 A2M 130080 12p13 Ehlers-danlos syndrome, type viii 277 50 4.79E-11A 1 VWF 130080 12p13 Ehlers-danlos syndrome, type viii 277 99 9.97E-10S 1 C1S 130080 12p13 Ehlers-danlos syndrome, type viii 277 87 1.25E-09A 1 MFAP5 130080 12p13 Ehlers-danlos syndrome, type viii 277 111 1.90E-09A 1 EMP1 130080 12p13 Ehlers-danlos syndrome, type viii 277 72 2.37E-09A 1 CD163 130080 12p13 Ehlers-danlos syndrome, type viii 277 44 3.34E-09A 1 TNFRSF1A 130080 12p13 Ehlers-danlos syndrome, type viii 277 61 4.34E-09S 1 TSPAN9 130080 12p13 Ehlers-danlos syndrome, type viii 277 112 5.28E-09A 1 CSDA 130080 12p13 Ehlers-danlos syndrome, type viii 277 55 9.95E-09A 1 LTBR 130080 12p13 Ehlers-danlos syndrome, type viii 277 73 1.70E-06S;A 1 CD9 130080 12p13 Ehlers-danlos syndrome, type viii 277 49 2.34E-06
A 1 FAM40B 608423 7q32.1-q32.2 Muscular dystrophy, limb-girdle, type 1f 71 113 4.50E-11S;A 2(PMID: 15929027) FLNC 608423 7q32.1-q32.2 Muscular dystrophy, limb-girdle, type 1f 71 112 3.44E-08A 1 LEP 608423 7q32.1-q32.2 Muscular dystrophy, limb-girdle, type 1f 71 24 1.45E-06
A 3 MYF6 181430 12q15-q23.1 Scapuloperoneal myopathy 215 104 8.24E-09A 1 PHLDA1 181430 12q15-q23.1 Scapuloperoneal myopathy 215 134 3.50E-08A 1 LUM 181430 12q15-q23.1 Scapuloperoneal myopathy 215 90 3.66E-07
ConclusionsConclusions
Our approach, based on conserved co-expression analysis, has been
demonstrated particularly successful to provide reliable predictions of
potential disease-causing genes because of two main factors:
1. the phylogenetic filter
2. the integration with quantitative phenotype correlation data
In conclusion, we propose that our method and our list of candidates will
provide a useful support for the identification of new disease-causing
genes.

Our real network …Our real network …
Ala U.
Piro R.
Silengo L.
Damasco C.
Grassi E.Provero P.
Di Cunto F.
Brunner H.