Human and Nature Dynamics (HANDY): Modeling Inequality … · Human and Nature Dynamics (HANDY):...
27
Human and Nature Dynamics (HANDY): Modeling Inequality and Use of Resources in the Collapse or Sustainability of Societies Safa Motesharrei School of Public Policy and Department of Mathematics University of Maryland and National Socio-Environmental Synthesis Center (SESYNC) Jorge Rivas Department of Political Science University of Minnesota and Institute of Global Environment and Society (IGES) Eugenia Kalnay Department of Atmospheric and Oceanic Sciences University of Maryland March 19, 2014 Abstract There are widespread concerns that current trends in resource-use are unsustainable, but possibilities of overshoot/collapse remain controversial. Collapses have occurred frequently in history, often followed by centuries of economic, intellectual, and population decline. Many di↵erent natural and social phenomena have been invoked to explain specific collapses, but a general explanation remains elusive. In this paper, we build a human population dynamics model by adding accumulated wealth and economic inequality to a predator-prey model of humans and nature. The model structure, and simulated scenarios that o↵er significant implications, are explained. Four equations describe the evolution of Elites, Commoners, Nature, and Wealth. The model shows Economic Stratification or Ecological Strain can independently lead to collapse, in agreement with the historical record. The measure “Carrying Capacity” is developed and its estimation is shown to be a practi- cal means for early detection of a collapse. Mechanisms leading to two types of collapses are discussed. The new dynamics of this model can also reproduce the irreversible collapses found in history. Collapse can be avoided, and population can reach a steady state at maximum carrying capacity if the rate of depletion of nature is reduced to a sustainable level and if resources are distributed equitably. Keywords: Human-Nature Dynamics; Societal Collapse; Carrying Capacity; Overshoot vs. Sustainability; Economic Inequality; Ecological Strain. 1
-
Upload
duongtuong -
Category
Documents
-
view
224 -
download
0
Transcript of Human and Nature Dynamics (HANDY): Modeling Inequality … · Human and Nature Dynamics (HANDY):...

Human and Nature Dynamics (HANDY):Modeling Inequality and Use of Resources in the
Collapse or Sustainability of Societies
Safa Motesharrei
School of Public Policy and Department of Mathematics
University of Maryland
and National Socio-Environmental Synthesis Center (SESYNC)
Jorge Rivas
Department of Political Science
University of Minnesota
and Institute of Global Environment and Society (IGES)
Eugenia Kalnay
Department of Atmospheric and Oceanic Sciences
University of Maryland
March 19, 2014
Abstract
There are widespread concerns that current trends in resource-use are unsustainable, butpossibilities of overshoot/collapse remain controversial. Collapses have occurred frequently inhistory, often followed by centuries of economic, intellectual, and population decline. Manydi↵erent natural and social phenomena have been invoked to explain specific collapses, but ageneral explanation remains elusive.
In this paper, we build a human population dynamics model by adding accumulatedwealth and economic inequality to a predator-prey model of humans and nature. The modelstructure, and simulated scenarios that o↵er significant implications, are explained. Fourequations describe the evolution of Elites, Commoners, Nature, and Wealth. The modelshows Economic Stratification or Ecological Strain can independently lead to collapse, inagreement with the historical record.
The measure “Carrying Capacity” is developed and its estimation is shown to be a practi-cal means for early detection of a collapse. Mechanisms leading to two types of collapses arediscussed. The new dynamics of this model can also reproduce the irreversible collapses foundin history. Collapse can be avoided, and population can reach a steady state at maximumcarrying capacity if the rate of depletion of nature is reduced to a sustainable level and ifresources are distributed equitably.Keywords: Human-Nature Dynamics; Societal Collapse; Carrying Capacity; Overshoot vs.Sustainability; Economic Inequality; Ecological Strain.
1

1 Introduction
There are widespread concerns that current trends in population and resource-use are unsustain-able, but the possibilities of an overshoot and collapse remain unclear and controversial. Howreal is the possibility of a societal collapse? Can complex, advanced civilizations really collapse?It is common to portray human history as a relentless and inevitable trend toward greater levelsof social complexity, political organization, and economic specialization, with the development ofmore complex and capable technologies supporting ever-growing population, all sustained by themobilization of ever-increasing quantities of material, energy, and information. Yet this is notinevitable. In fact, cases where this seemingly near-universal, long-term trend has been severelydisrupted by a precipitous collapse —often lasting centuries— have been quite common. A briefreview of some examples of collapses suggests that the process of rise-and-collapse is actually arecurrent cycle found throughout history, making it important to establish a general explanationof this process [Tainter, 1988; Yo↵ee and Cowgill, 1988; Turchin and Nefedov, 2009; Chase-Dunnand Hall, 1997; Goldstein, 1988; Modelski, 1987; Meadows et al., 1972].
The Roman Empire’s dramatic collapse (followed by many centuries of population decline,economic deterioration, intellectual regression, and the disappearance of literacy) is well known,but it was not the first rise-and-collapse cycle in Europe. Prior to the rise of Classical Greco-Roman civilization, both the Minoan and Mycenaean Civilizations had each risen, reached veryadvanced levels of civilization, and then collapsed virtually completely [Morris, 2006; Redman,1999]. The history of Mesopotamia —the very cradle of civilization, agriculture, complex society,and urban life— presents a series of rise-and-declines including the Sumerians, the Akkadian,Assyrian, Babylonian, Achaemenid, Seleucid, Parthian, Sassanid, Umayyad, and Abbasid Empires[Yo↵ee, 1979; Redman et al., 2004]. In neighboring Egypt, this cycle also appeared repeatedly.In both Anatolia and in the Indus Valley, the very large and long-lasting Hittite and Harrapancivilizations both collapsed so completely that their very existence was unknown until modernarcheology rediscovered them. Similar cycles of rise and collapse occurred repeatedly in India, mostnotably with the Mauryan and the Gupta Empires [Thapar, 2004; Jansen et al., 1991; Kenoyer,1998; Edwards et al., 1971, 1973]. Southeast Asia similarly experienced “multiple and overlappinghistories of collapse and regeneration” over 15 centuries, culminating in the Khmer Empire based inAngkor, which itself was depopulated and swallowed by the forest during the 15th Century [Stark,2006]. Chinese history is, very much like Egypt’s, full of repeated cycles of rises and collapses, witheach of the Zhou, Han, Tang, and Song Empires followed by a very serious collapse of politicalauthority and socioeconomic progress [Chu and Lee, 1994; Needham and Wang, 1956; Lee, 1931].
Collapses are not restricted to the “Old World”. The collapse of Maya Civilization is well-known and evokes widespread fascination, both because of the advanced nature of Mayan societyand because of the depth of the collapse [Webster, 2002; Demerest et al., 2004]. As Diamond[2005] puts it, it is di�cult to ignore “the disappearance of between 90 and 99% of the Mayapopulation after A.D. 800 . . . and the disappearance of kings, Long Count calendars, and othercomplex political and cultural institutions.” In the nearby central highlands of Mexico, a numberof powerful states also rose to high levels of power and prosperity and then rapidly collapsed,Teotihuacan (the sixth largest city in the world in the 7th C) and Monte Alban being just thelargest of these to experience dramatic collapse, with their populations declining to about 20-25%of their peak within just a few generations [Tainter, 1988].
We know of many other collapses including Mississippian Cultures such as Cahokia, South WestUS cultures such as the Pueblo and Hohokam, Andean civilizations such as Tiwanaku, Sub-Saharancivilizations such as Great Zimbabwe, and many collapses across the Pacific Islands, such as Easter
2

Island. It is also likely other collapses have also occurred in societies that were not at a su�cientlevel of complexity to produce written records or archeological evidence. Indeed, a recent study[Shennan et al., 2013] of the Neolithic period in Europe has shown that “in contrast to the steadypopulation growth usually assumed, the introduction of agriculture into Europe was followed by aboom-and-bust pattern in the density of regional populations”. Furthermore “most regions showmore than one boom-bust pattern”, and in most regions, population declines “of the order of the30–60%” can be found. The authors also argue that, rather than climate change or diseases, thetiming and evidence point to endogenous causes for these collapses in 19 out of 23 cases studied,suggesting the possibility of “rapid population growth driven by farming to unsustainable levels”.Moreover, through wavelet analysis of the archeological data, S. Downey [personal communication]has shown that the average length of such boom-and-bust cycles is about 300–500 years.
In summary, despite the common impression that societal collapse is rare, or even largely fic-tional, the “picture that emerges is of a process recurrent in history, and global in its distribution”[Tainter, 1988]. See also Yo↵ee and Cowgill [1988]; Goldstein [1988]; Ibn Khaldun [1958]; Kon-dratie↵ [1984]; Parsons [1991]. As Turchin and Nefedov [2009] contend, there is a great deal ofsupport for “the hypothesis that secular cycles — demographic-social-political oscillations of avery long period (centuries long) are the rule, rather than an exception in the large agrarian statesand empires.”
This brings up the question of whether modern civilization is similarly susceptible. It mayseem reasonable to believe that modern civilization, armed with its greater technological capacity,scientific knowledge, and energy resources, will be able to survive and endure whatever criseshistorical societies succumbed to. But the brief overview of collapses demonstrates not only theubiquity of the phenomenon, but also the extent to which advanced, complex, and powerful societiesare susceptible to collapse. The fall of the Roman Empire, and the equally (if not more) advancedHan, Mauryan, and Gupta Empires, as well as so many advanced Mesopotamian Empires, are alltestimony to the fact that advanced, sophisticated, complex, and creative civilizations can be bothfragile and impermanent.
A large number of explanations have been proposed for each specific case of collapse, includingone or more of the following: volcanoes, earthquakes, droughts, floods, changes in the courses ofrivers, soil degradation (erosion, exhaustion, salinization, etc), deforestation, climate change, tribalmigrations, foreign invasions, changes in technology (such as the introduction of ironworking),changes in the methods or weapons of warfare (such as the introduction of horse cavalry, armoredinfantry, or long swords), changes in trade patterns, depletion of particular mineral resources (e.g.,silver mines), cultural decline and social decadence, popular uprisings, and civil wars. However,these explanations are specific to each particular case of collapse rather than general. Moreover,even for the specific case where the explanation applies, the society in question usually had alreadyexperienced the phenomenon identified as the cause without collapsing. For example, the Minoansociety had repeatedly experienced earthquakes that destroyed palaces, and they simply rebuiltthem more splendidly than before. Indeed, many societies experience droughts, floods, volcanoes,soil erosion, and deforestation with no major social disruption [Tainter, 1988].
The same applies to migrations, invasions, and civil wars. The Roman, Han, Assyrian, andMauryan Empires were, for centuries, completely militarily hegemonic, successfully defeating theneighboring “barbarian” peoples who eventually did overrun them. So external military pressurealone hardly constitutes an explanation for their collapses. With both natural disasters and ex-ternal threats, identifying a specific cause compels one to ask, “yes, but why did this particularinstance of this factor produce the collapse?” Other processes must be involved, and, in fact,the political, economic, ecological, and technological conditions under which civilizations have col-
3

lapsed have varied widely. Individual collapses may have involved an array of specific factors,with particular triggers, but a general explanation remains elusive. Individual explanations mayseem appropriate in their particular case, but the very universal nature of the phenomenon impliesa mechanism that is not specific to a particular time period of human history, nor a particularculture, technology, or natural disaster [Tainter, 1988; Yo↵ee and Cowgill, 1988; Turchin, 2003].
In this paper we attempt to model collapse mathematically in a more general way. We proposea simple model, not intended to describe actual individual cases, but rather to provide a generalframework that allows carrying out “thought experiments” for the phenomenon of collapse and totest changes that would avoid it. This model (called HANDY, for Human and Nature DYnamics)advances beyond existing biological dynamic population models by simultaneously modeling twoseparate important features which seem to appear across societies that have collapsed: (1) thestretching of resources due to the strain placed on the ecological carrying capacity [Ponting, 1991;Redman, 1999; Redman et al., 2004; Kammen, 1994; Postan, 1966; Ladurie, 1987; Abel, 1980;Catton, 1980; Wood, 1998; Wright, 2004], and (2) the economic stratification of society into Elitesand Masses (or “Commoners”) [Brenner, 1985; Parsons, 1991; Turchin, 2005, 2006; Turchin andNefedov, 2009; Diamond, 2005; Goldstone, 1991; Ibn Khaldun, 1958]. In many of these historicalcases, we have direct evidence of Ecological Strain and Economic Stratification playing a centralrole in the character or in the process of the collapse [Diamond, 2005; Goldstone, 1991; Culbert,1973; Lentz, 2000; Mitchell, 1990]. For these empirical reasons, and the theoretical ones explainedin section 3, our model incorporates both of these two features. Although similar to the Branderand Taylor [1998] model (hereafter referred to as “BT”) in that HANDY is based on the classicalpredator-prey model, the inclusion of two societal classes introduces a much richer set of dynamicalsolutions, including cycles of societal and ecological collapse, as well as the possibility of smoothlyreaching equilibrium (the ecological carrying capacity). We use Carrying Capacity in its biologicaldefinition: the population level that the resources of a particular environment can sustain overthe long term [Catton, 1980; Daly and Farley, 2003; Cohen, 1995]. In this paper, we call theseenvironment resources “Nature”.
The paper is organized as follows: section 2 gives a brief review of the Predator-Prey model;section 3 includes the mathematical description of HANDY; section 4 covers a theoretical analysisof the model equilibrium and possible solutions; section 5 presents examples of scenarios withinthree distinct types of societies; section 6 gives an overall discussion of the scenarios from section5; and section 7 o↵ers a short summary of the paper and a discussion of future work.
2 Predator-Prey Model
The Predator-Prey model, the original inspiration behind HANDY, was derived independentlyby two mathematicians, Alfred Lotka and Vitto Volterra, in the early 20th century [Lotka, 1925;Volterra, 1926]. This model describes the dynamics of competition between two species, say, wolvesand rabbits. The governing system of equations is
8<
:x = (ay)x� bx
y = cy � (dx)y(1)
In the above system, x represents the predator (wolf) population; y represents the prey (rabbit)population; a determines the predator’s birth rate, i.e., the faster growth of wolf population due
4

Predator (wolves) and Prey (rabbits) Populations400 wolves2,000 rabbits
200 wolves1,000 rabbits
0 wolves0 rabbits
0 150 300 450 600 750 900Time (year)
Predator
Prey
Figure 1: A typical solution of the predator-prey system obtained by running the system withthe following parameter values and initial con-ditions: a = 3.0 ⇥ 10�5 (rabbits.years)�1
, b =2.0⇥10�2 years�1
, c = 3.0⇥10�2 years�1, d =
2.0 ⇥ 10�4 (wolves.years)�1, x(0) = 1.0 ⇥
10+2 wolves, and y(0) = 1.0 ⇥ 10+3 rabbits.Predator population is measured in units ofwolves, Prey population is measured in units ofrabbits, and Time is measured in units of years.
to availability of rabbits; b is the predator’s death rate; c is the prey’s birth rate; d determines thepredation rate, i.e., the rate at which rabbits are hunted by wolves.
Rather than reaching a stable equilibrium, the predator and prey populations show periodic,out-of-phase variations about the equilibrium values
8<
:xe = c/d
ye = b/a
(2)
Note consistency of the units on the left and right hand sides of (1) and (2). A typical solution ofthe predator-prey system can be seen in figure 1.
3 HANDY
As indicated above, Human And Nature DYnamics (HANDY) was originally built based on thepredator-prey model. We can think of the human population as the “predator”, while nature(the natural resources of the surrounding environment) can be taken as the “prey”, depleted byhumans. In animal models, carrying capacity is an upper ceiling on long-term population. Whenthe population surpasses the carrying capacity, mechanisms such as starvation or migration bringthe population back down. However, in the context of human societies, the population doesnot necessarily begin to decline upon passing the threshold of carrying capacity, because, unlikeanimals, humans can accumulate large surpluses (i.e., wealth) and then draw down those resourceswhen production can no longer meet the needs of consumption. This introduces a di↵erent kindof delay that allows for much more complex dynamics, fundamentally altering the behavior andoutput of the model. Thus, our model adds the element of accumulated surplus not required inanimal models, but which we feel is necessary for human models. We call this accumulated surplus“wealth”.
Empirically, however, this accumulated surplus is not evenly distributed throughout society,but rather has been controlled by an elite. The mass of the population, while producing the wealth,is only allocated a small portion of it by elites, usually at or just above subsistence levels. Basedon this, and on the historical cases discussed in the introduction, we separated the population into“Elites” and “Commoners”, and introduced a variable for accumulated wealth. For an analysisof this two-class structure of modern society, see Dragulescu and Yakovenko [2001]; Banerjee andYakovenko [2010]. This adds a a di↵erent dimension of predation whereby Elites “prey” on theproduction of wealth by Commoners. As a result, HANDY consists of four prediction equations:two for the two classes of population, Elites and Commoners, denoted by xE and xC , respectively;
5

one for the natural resources or Nature, y; and one for the accumulated Wealth, w, referred tohereafter as “Wealth”. This minimal set of four equations seems to capture essential features ofthe human-nature interaction and is capable of producing major potential scenarios of collapse ortransition to steady state.
A similar model of population and renewable resource dynamics based on the predator-preymodel was developed in the pioneering work of Brander and Taylor [1998] demonstrating thatreasonable parameter values can produce cyclical “feast and famine” patterns of population andresources. Their model showed that a system with a slow-growing resource base will exhibit over-shooting and collapse, whereas a more rapidly growing resource base will produce an adjustment ofpopulation and resources toward equilibrium values. They then applied this model to the historicalcase of Easter Island, finding that the model provides a plausible explanation of the populationdynamics known about Easter Island from the archeological and scientific record. They thus arguethat the Polynesian cases where population did collapse were due to smaller maximum resourcebases (which they call “carrying capacity”) that grew more slowly, whereas those cases which didnot experience such a collapse were due to having a larger resource base (i.e., a larger carryingcapacity). They then speculate that their model might be consistent with other historical cases ofcollapse, such as the ancient Mesopotamian and Maya civilizations or modern Rwanda.
However, the BT approach only models Population and Nature and does not include a centralcomponent of these historical cases: economic stratification and the accumulation of wealth. Thus,despite clear evidence for a stratified class structure in Easter Island’s history prior to the collapse(as well as for Mesopotamia, the ancient Maya, and modern Rwanda), the BT model does notinclude class stratification as a factor. In their model, society produces and consumes as a singlehomogeneous unit. We feel that a historically realistic modeling of the evolution of human-naturedynamics in these stratified complex societies cannot be achieved without including this classstratification in the model. Brander and Taylor recognize that their model is simple, and thatapplication to more complex scenarios may require further development of the structure of themodel. We have found that including economic stratification, in the form of the introduction ofElites and Commoners, as well as accumulated Wealth, results in a much richer variety of solutions,which may have a wider application across di↵erent types of societies. HANDY’s structure alsoallows for “irreversible” collapses, without the need to introduce an explicit critical depensationmechanism into the model as other models need to do. Thus while the Brander-Taylor modelhas only two equations, HANDY has four equations to predict the evolution of the rich andpoor populations (Elites and Commoners), Nature, and accumulated Wealth. (We examine otherdi↵erences in section 6.4 of the paper.) The HANDY equations are given by:
8>>>>>><
>>>>>>:
xC = �CxC � ↵CxC
xE = �ExE � ↵ExE
y = �y(�� y)� �xCy
w = �xCy � CC � CE
(3)
It is to be noted that ↵C , ↵E, CC , and CE are all functions of w, xC , and xE. See equations (4)and (6) and figures 2a and 2b.
6
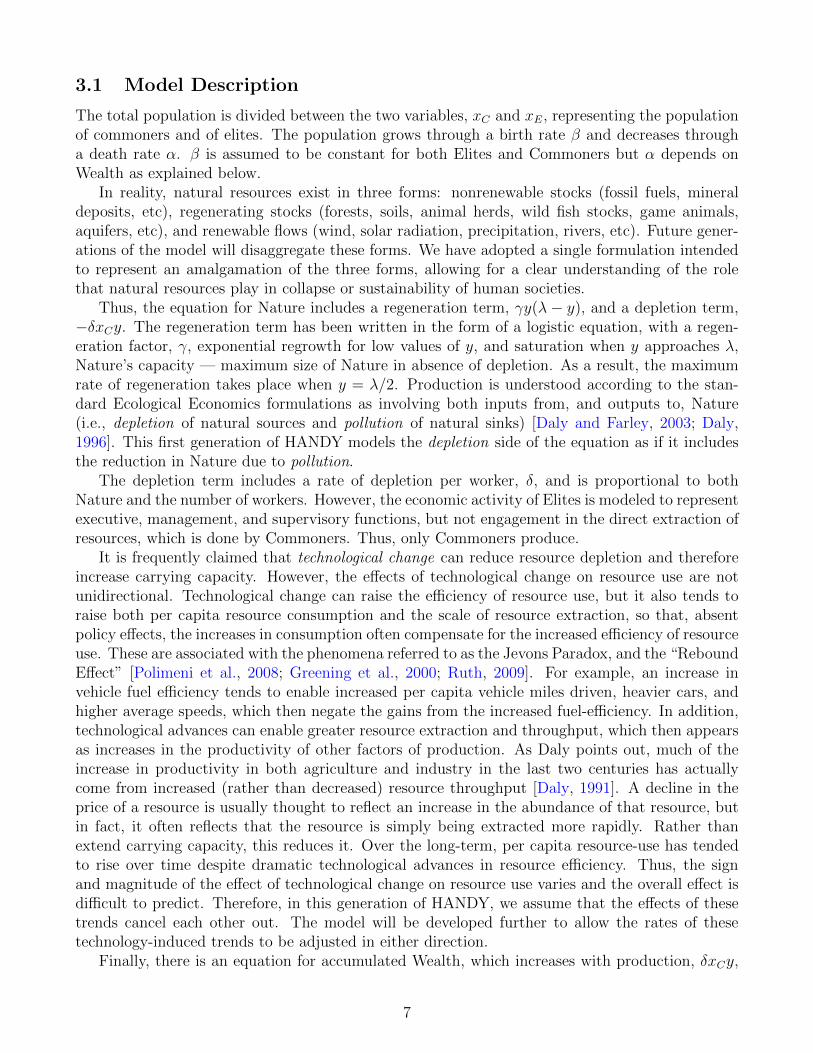
3.1 Model Description
The total population is divided between the two variables, xC and xE, representing the populationof commoners and of elites. The population grows through a birth rate � and decreases througha death rate ↵. � is assumed to be constant for both Elites and Commoners but ↵ depends onWealth as explained below.
In reality, natural resources exist in three forms: nonrenewable stocks (fossil fuels, mineraldeposits, etc), regenerating stocks (forests, soils, animal herds, wild fish stocks, game animals,aquifers, etc), and renewable flows (wind, solar radiation, precipitation, rivers, etc). Future gener-ations of the model will disaggregate these forms. We have adopted a single formulation intendedto represent an amalgamation of the three forms, allowing for a clear understanding of the rolethat natural resources play in collapse or sustainability of human societies.
Thus, the equation for Nature includes a regeneration term, �y(�� y), and a depletion term,��xCy. The regeneration term has been written in the form of a logistic equation, with a regen-eration factor, �, exponential regrowth for low values of y, and saturation when y approaches �,Nature’s capacity — maximum size of Nature in absence of depletion. As a result, the maximumrate of regeneration takes place when y = �/2. Production is understood according to the stan-dard Ecological Economics formulations as involving both inputs from, and outputs to, Nature(i.e., depletion of natural sources and pollution of natural sinks) [Daly and Farley, 2003; Daly,1996]. This first generation of HANDY models the depletion side of the equation as if it includesthe reduction in Nature due to pollution.
The depletion term includes a rate of depletion per worker, �, and is proportional to bothNature and the number of workers. However, the economic activity of Elites is modeled to representexecutive, management, and supervisory functions, but not engagement in the direct extraction ofresources, which is done by Commoners. Thus, only Commoners produce.
It is frequently claimed that technological change can reduce resource depletion and thereforeincrease carrying capacity. However, the e↵ects of technological change on resource use are notunidirectional. Technological change can raise the e�ciency of resource use, but it also tends toraise both per capita resource consumption and the scale of resource extraction, so that, absentpolicy e↵ects, the increases in consumption often compensate for the increased e�ciency of resourceuse. These are associated with the phenomena referred to as the Jevons Paradox, and the “ReboundE↵ect” [Polimeni et al., 2008; Greening et al., 2000; Ruth, 2009]. For example, an increase invehicle fuel e�ciency tends to enable increased per capita vehicle miles driven, heavier cars, andhigher average speeds, which then negate the gains from the increased fuel-e�ciency. In addition,technological advances can enable greater resource extraction and throughput, which then appearsas increases in the productivity of other factors of production. As Daly points out, much of theincrease in productivity in both agriculture and industry in the last two centuries has actuallycome from increased (rather than decreased) resource throughput [Daly, 1991]. A decline in theprice of a resource is usually thought to reflect an increase in the abundance of that resource, butin fact, it often reflects that the resource is simply being extracted more rapidly. Rather thanextend carrying capacity, this reduces it. Over the long-term, per capita resource-use has tendedto rise over time despite dramatic technological advances in resource e�ciency. Thus, the signand magnitude of the e↵ect of technological change on resource use varies and the overall e↵ect isdi�cult to predict. Therefore, in this generation of HANDY, we assume that the e↵ects of thesetrends cancel each other out. The model will be developed further to allow the rates of thesetechnology-induced trends to be adjusted in either direction.
Finally, there is an equation for accumulated Wealth, which increases with production, �xCy,
7

and decreases with the consumption of the Elites and the Commoners, CC and CE, respectively.The consumption of the Commoners (as long as there is enough wealth to pay them) is sxC , asubsistence salary per capita, s, multiplied by the working population. The Elites pay themselvesa salary times larger, so that the consumption of the Elites is sxE. However, when the wealthbecomes too small to pay for this consumption, i.e., when w < wth, the payment is reduced andeventually stopped, and famine takes place, with a much higher rate of death. is meant torepresent here the factors that determine the division of the output of the total production ofsociety between elites and masses, such as the balance of class power between elites and masses,and the capacity of each group to organize and pursue their economic interests. We recognize theinherent limitations, in this initial generation of our model, of holding that balance () constantin each scenario, but we expect to develop further in later generations of HANDY so that it canbe endogenously determined by other factors in the model.
CC and CE, the consumption rates for the Commoner and the Elite respectively, are given bythe following equations:
8>>><
>>>:
CC = min
✓1,
w
wth
◆sxC
CE = min
✓1,
w
wth
◆sxE
(4)
Wealth threshold, wth, is a threshold value for wealth below which famine starts. It dependson the “minimum required consumption per capita”, ⇢:
wth = ⇢xC + ⇢xE. (5)
Even when Commoners start experiencing famine, i.e., when w wth , the Elites continue con-suming unequally as indicated by the factor in the second term on the right hand side of (5). Agraphical representation of the consumption rates are given in figure 2a.
The death rates for the Commoner and the Elite, ↵C and ↵E, are functions of consumptionrates:
8>>><
>>>:
↵C = ↵m +max
✓0, 1� CC
sxC
◆(↵M � ↵m)
↵E = ↵m +max
✓0, 1� CE
sxE
◆(↵M � ↵m)
(6)
The death rates vary between a normal (healthy) value, ↵m, observed when there is enough foodfor subsistence, and a maximum (famine) value, ↵M that prevails when the accumulated wealthhas been used up and the population starves. There are a variety of mechanisms which can reducepopulation when it exceeds carrying capacity, including everything from emigration, increaseddisease susceptibility, and outright starvation to breakdowns in social order and increased socialviolence, such as banditry, riots, rebellions, revolutions, and wars. These mechanisms are describedin detail in Turchin [2003] but the net e↵ect of all of them is a reduction in population, and thatis what the dynamics of our model is meant to represent when we say “population decline” or“famine”. Note also that an increase in the death rates (↵) is equivalent to an equal decrease inthe birth rates (�). The death rates ↵C and ↵E can be expressed in terms of w
wth, a graphical
representation of which is given figure 2b.
8

1
1
𝜅
𝐶𝑠𝑥 𝐶𝐸
𝑠𝑥𝐸
𝐶𝐶𝑠𝑥𝐶
𝜔 = 𝑤𝑤𝑡ℎ 1 𝜅
(a) Consumption rates in HANDY
1 / 𝜅
𝛼𝑚
𝜔= 𝑤𝑤𝑡ℎ
𝛼𝑀
𝛼
𝛼𝐸
𝛼𝐶
1
(b) Death rates in HANDY
Figure 2: Per capita Consumption rates and Death rates for Elites and Commoners as a function
of Wealth. Famine starts whenC
sx
1. Therefore, Commoners start experiencing famine when
w
wth 1, while Elites do not experience famine until
w
wth 1
. This delay is due to Elites’ unequal
access to Wealth.
3.2 A Note on Units and Dimensions
There are three dimensions for quantities in HANDY:
1. Population (either Commoner or Elite), in units of people.
2. Nature/Wealth, in units of “eco-Dollars”.
3. Time, in units of years.
The structure of the model requires Nature and Wealth to be measured with the same units,therefore we created the unit eco-dollar. Other parameters and functions in the model carry unitsthat are compatible with the abovementioned dimensions following (3). For example, CarryingCapacity, �, and the Maximum Carrying Capacity, �M , defined in section 4.1, are both expressedin units of people.
4 Equilibrium Values and Carrying Capacity
We can use the model to find a sustainable equilibrium and maximum carrying capacity in di↵erenttypes of societies. In order for population to reach an equilibrium, we must have ↵m �E �C ↵M . We define a dimensionless parameter, ⌘:
⌘ =↵M � �C
↵M � ↵m(7)
Since we assume ↵m �C ↵M , ⌘ will always be bounded by 0 ⌘ 1.
4.1 Equilibrium when x
E
= 0 (No Elites): Egalitarian Society
Assuming xE ⌘ 0, we can find the equilibrium values of the system (subscript “e” denotes theequilibrium values):
9
8>>>>>><
>>>>>>:
xC,e =�
�
✓�� ⌘
s
�
◆
ye = ⌘
s
�
we = ⌘⇢xC,e
(8)
We define �, the Carrying Capacity for the population, to be equal to xC,e in (8), i.e., theequilibrium value of the population in the absence of Elites:
� =�
�
✓�� ⌘
s
�
◆(9)
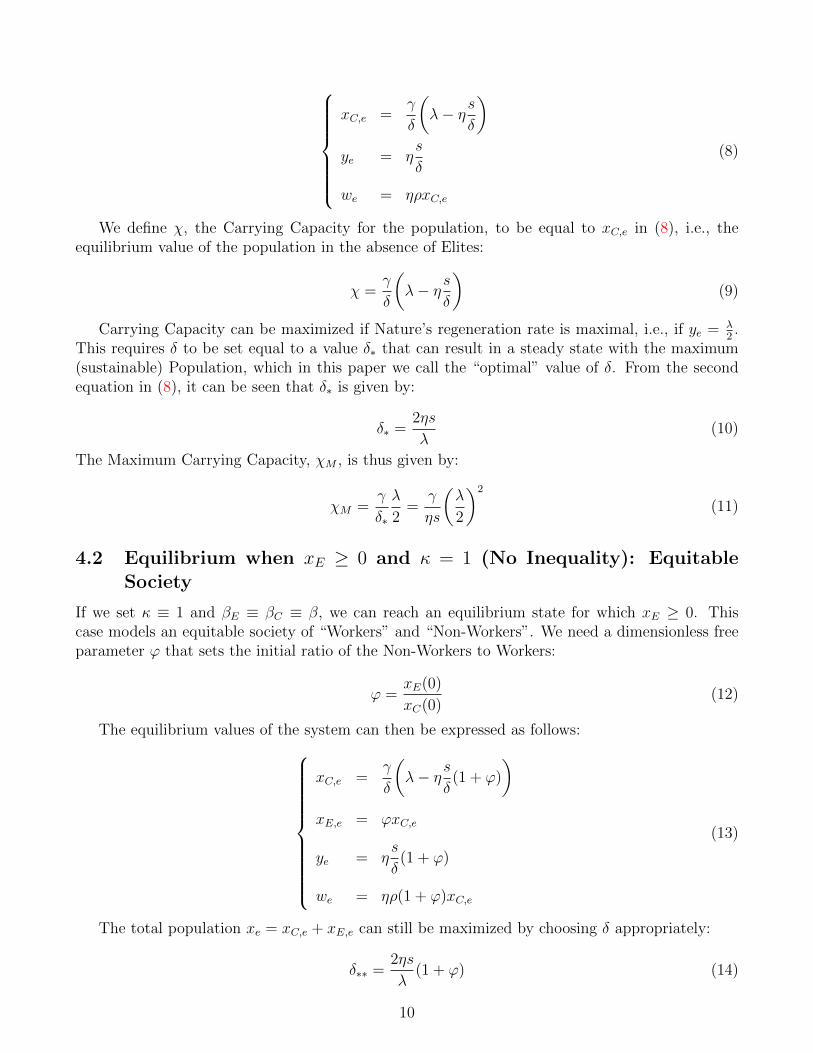
Carrying Capacity can be maximized if Nature’s regeneration rate is maximal, i.e., if ye =�2 .
This requires � to be set equal to a value �⇤ that can result in a steady state with the maximum(sustainable) Population, which in this paper we call the “optimal” value of �. From the secondequation in (8), it can be seen that �⇤ is given by:
�⇤ =2⌘s
�
(10)
The Maximum Carrying Capacity, �M , is thus given by:
�M =�
�⇤
�
2=
�
⌘s
✓�
2
◆2
(11)
4.2 Equilibrium when x
E
� 0 and = 1 (No Inequality): EquitableSociety
If we set ⌘ 1 and �E ⌘ �C ⌘ �, we can reach an equilibrium state for which xE � 0. Thiscase models an equitable society of “Workers” and “Non-Workers”. We need a dimensionless freeparameter ' that sets the initial ratio of the Non-Workers to Workers:
' =xE(0)
xC(0)(12)
The equilibrium values of the system can then be expressed as follows:
8>>>>>>>>>><
>>>>>>>>>>:
xC,e =�
�
✓�� ⌘
s
�
(1 + ')
◆
xE,e = 'xC,e
ye = ⌘
s
�
(1 + ')
we = ⌘⇢(1 + ')xC,e
(13)
The total population xe = xC,e + xE,e can still be maximized by choosing � appropriately:
�⇤⇤ =2⌘s
�
(1 + ') (14)
10

This �⇤⇤ is larger than the optimal depletion factor given by (10). The di↵erence arises becauseWorkers have to produce more than they need just for themselves in order to support Non-Workers.For this choice of �, total population is given by:
xe,M = (1 + ')�
�⇤⇤
�
2=
�
⌘s
✓�
2
◆2
(15)
As can be seen from (15), maximum total population in equilibrium is independent of ' andconforms to the maximum carrying capacity given above by (11).
4.3 Equilibrium when x
E
� 0 and > 1: Unequal Society
It is possible to attain equilibrium in an unequal society if we can satisfy the following condition:
↵M � �E
(↵M � ↵m)=↵M � �C
↵M � ↵m= ⌘. (16)
(The general condition ↵m �E �C ↵M must hold in all cases for an equilibrium to befeasible.)
The equilibrium values in this general case can be expressed as follows:
8>>>>>>>>>><
>>>>>>>>>>:
xC,e =�
�
✓�� ⌘
s
�
(1 + )
◆
xE,e = xC,e
ye = ⌘
s
�
(1 + )
we = ⌘⇢(1 + )xC,e
(17)
The free parameter, , is the equilibrium ratio xE,e/xC,e, apparent from the second equation in(17). As opposed to ', cannot be easily related to the initial conditions; rather, it can bedetermined from the result of a simulation.
Again, the total population xe = xC,e + xE,e can be maximized by choosing � appropriately:
�⇤⇤⇤ =2⌘s
�
(1 + ) (18)
This required depletion rate �⇤⇤⇤ can be even larger than the optimal � given by (14) dependingupon the values of and . In the presence of inequality, the maximum total population isno longer independent of and and is smaller than the maximum carrying capacity given byequations (11) and (15):
xe,M = (1 + )�
�⇤⇤⇤
�
2=
�
⌘s
✓�
2
◆2✓ 1 +
1 +
◆(19)
5 Scenarios
We discuss three sets of scenarios:
11

Parameter Symbol Parameter Name Typical Value(s)
↵m Normal (Minimum) Death rate 1.0⇥ 10�2
↵M Famine (Maximum) Death rate 7.0⇥ 10�2
�C Commoner Birth rate 3.0⇥ 10�2
�E Elite Birth rate 3.0⇥ 10�2
s Subsistence Salary per Capita 5.0⇥ 10�4
⇢ Threshold Wealth per Capita 5.0⇥ 10�3
� Regeneration rate of Nature 1.0⇥ 10�2
� Nature Carrying Capacity 1.0⇥ 10+2
Inequality factor 1, 10, 100� Depletion (Production) Factor None
(a) List of parameters in HANDY. and � take di↵erent values for di↵erent scenarios.
Variable Symbol Variable Name Typical Initial Value(s)
xC Commoner Population 1.0⇥ 10+2
xE Elite Population 0, 1, 25y Nature �
w Accumulated Wealth 0
(b) List of state variables in HANDY. xE(0) takes di↵erent values for di↵erent scenarios.
Table 1: Description of parameters and state variables used in HANDY. , �, and xE are varied tostudy various scenarios in three di↵erent types of societies. xE = 0 defines an Egalitarian societywith no Elites. = 1 defines an Equitable society with Workers and Non-Workers, represented byxC and xE in this case, respectively. xE � 0 and > 1 define an unequal society with Elites andCommoners (xE and xC). As a reference, all other variables and functions in HANDY are alsolisted above. Subscript e denotes equilibrium value everywhere in this paper.
1. Egalitarian society (No-Elites): Scenarios in which xE = 0.
2. Equitable society (with Workers and Non-Workers): Scenarios in which xE � 0 but ⌘ 1.
3. Unequal society (with Elites and Commoners): Scenarios in which xE � 0 and > 1.
For all of these scenarios, we start the model with the typical parameter values and initialconditions given in table 1, unless otherwise stated. As indicated above, the values of and xE(0)determine the type of the society. Within each type of society, we obtain di↵erent scenarios byvarying the depletion factor, �.
In this section, we will show that HANDY is capable of modeling three distinct types of societiesby changing and xE(0). A sustainable equilibrium can be found for each society by controlling �.An appropriate choice of � can make this equilibrium optimal, i.e., with maximum total population.Increasing � above its optimal value makes the approach toward equilibrium oscillatory. Such anequilibrium is suboptimal, and the Carrying Capacity is below its maximum value, �M . It is alsopossible to reach a suboptimal equilibrium (a less than maximum, but sustainable population)by making � lower than its optimal value. However, in the latter case, the approach towardequilibrium would be a soft landing rather than oscillatory. When � is increased even further, thesociety goes into cycles of prosperity and collapse. Increasing � beyond a certain point will result
12

Variable Symbol Variable Name Defining Equation
wth Threshold Wealth (5)! Normalized Wealth w/wth
CC Commoner Consumption (4) (figure 2a)CE Elite Consumption (4) (figure 2a)↵C Commoner Death Rate (6) (figure 2b)↵E Elite Death Rate (6) (figure 2b)⌘ ⌘ (7)� Carrying Capacity (CC) (9)�⇤ Egalitarian Optimal � (10)�M Maximum Carrying Capacity (Max CC) (11)' Ratio of Non-Workers to Workers (Equitable) (12)�⇤⇤ Equitable Optimal � (14) Elite to Commoner Equilibrium Ratio (Unequal) xE,e/xC,e
�⇤⇤⇤ Unequal Optimal � (18)
Table 2: As a reference, all other variables and functions in HANDY are listed in this table.Subscript e denotes equilibrium value everywhere in this paper.
in an irreversible Type-N (full) collapse, examples of which are presented in sections 5.1.4, 5.2.4,and 5.3.2. We give a full categorization of collapses in the next two paragraphs.
Running the model in di↵erent scenarios produces two kinds of collapses, either due to scarcityof labor (following an inequality-induced famine) or due to scarcity of Nature (depletion of naturalresources). We categorize the former case as a Type-L (Disappearance of Labor) Collapse andthe latter as a Type-N collapse (Exhaustion of Nature). In a Type-L collapse, growth of theElite Population strains availability of resources for the Commoners. This causes decline of theCommoner Population (which does the labor), and consequently, decline of Wealth. Finally, ElitePopulation plummets since its source of subsistence, i.e., Wealth, has vanished. See figure 6a foran example of a Type-L collapse. This could represent a historical case such as the disappearanceof the Mayan civilization in the Yucatan. Note that this type of collapse can only happen in anunequal society, because the major cause behind it is inequality.
A Type-N collapse, on the other hand, starts with an exhaustion of Nature, followed by adecline of Wealth that in turn, causes a fall of the Commoners and then the Elites. Dependingon the depletion rate, Type-N collapses can be “reversible” or “irreversible”. After a reversiblecollapse, regrowth of nature can trigger another cycle of prosperity, examples of which can be seenin figures 3c and 4c. This could represent historical cases such as the Greek and Roman collapses.
When depletion is pushed beyond a certain limit, Nature fully collapses and the whole systemcompletely collapses after that. This is why we call an irreversible Type-N collapse a “full” collapse.Examples of such collapses can be seen in figures 3d, 4d, and 6b. This could represent a historicalcase such as the exhaustion of Nature on Easter Island. Type-N collapses can arise because ofexcessive depletion only (figures 3d and 4d), or both excessive depletion and inequality (figure 6b).
It is important to understand the inter-relation of the depletion factor, �, and the CarryingCapacity, �. The further � is taken away from its optimal value, the further � moves down from itsmaximum value, �M . An equilibrium can be reached if and only if � is not too far away from �M ,which means � cannot be too far away from its optimal value, given by equations (10), (14), and(18) in the three types of societies under consideration. Note that in all of the scenario outputs
13

presented below (for the three types of societies under consideration), Carrying Capacity (�) andthe Maximum Carrying Capacity (�M) are calculated from their defining equations (9) and (11),respectively.
Important note about the units of the vertical axis of all the subsequent graphs:Populations, xC and xE, and the Carrying Capacity, �, are all normalized to the Maximum Car-rying Capacity, �M . Nature and Wealth are both shown in units of Nature’s capacity, �. Thetop scale of the vertical axis of the graph pertains to Population(s) and Carrying Capacity; themiddle scale pertains to Nature, which (normally) stays bounded by 1�; and the bottom scale isfor Wealth.
Note: All the simulations below use the Euler integration method with a time-step of 1 yearand single precision.
5.1 Egalitarian Society (No-Elites): x
E
= 0
In the four following scenarios, does not play any role since we set xE ⌘ 0. We start thedepletion rate from � = �⇤, the optimal equilibrium value that maximizes the Carrying Capacity,and increase it slowly to get additional scenarios. The horizontal red line in the graphs for thefour scenarios of this section represents the zero population of Elites.
5.1.1 Egalitarian Society: Soft Landing to Equilibrium
For the scenario in figure 3a, � = �⇤ = 6.67 ⇥ 10�6. Therefore, the carrying capacity, �, is at itsmaximum level, �M . Notice that Nature also settles to ye = �/2, which is the value that resultsin the maximum regeneration rate. This maximal regeneration can in turn support a maximumsustainable depletion and population.
If we set � < �⇤, we still see a soft landing to the carrying capacity, �. However, � would beat a lower level than �M because a lower-than-optimal � does not correspond to the maximumregeneration of nature, which is a necessity if we want to have the maximum sustainable population.The advantage of a lower-than-optimal � is a higher equilibrium level (compared to �/2) for Nature.
Choosing a depletion rate, �, that is too small to produce enough to feed the population wouldresult in a collapse, and thus make any equilibrium impossible even though Nature stays at itsmaximum capacity. Of course, this would not occur in the real world as the urge for survivalguarantees humans extract their basic needs from nature.
5.1.2 Egalitarian Society: Oscillatory Approach to Equilibrium
For the scenario in figure 3b, � is increased to � = 2.5�⇤ = 1.67⇥ 10�5. As can be seen from figure3b, the carrying capacity, �, is lower than its maximum value, �M . Population initially overshootsthe carrying capacity, then oscillates, and eventually converges to it since the amount of overshootis not too large, just about the order of �. Note that at the time the (total) population overshootsthe Carrying Capacity, the Wealth also reaches a maximum and starts to decline.
5.1.3 Egalitarian Society: Cycles of Prosperity, Overshoot, Collapse, and Revival
For the scenario in figure 3c, � is increased to � = 4�⇤ = 2.67⇥ 10�5. As can be seen, Population,Nature and Wealth all collapse to a very small value. However, after depletion becomes smalldue to very low number of workers, Nature gets a chance to grow back close to its capacity, �.The regrowth of Nature kicks o↵ another cycle of prosperity which ends with another collapse.
14

Egalitarian Society: Soft Landing to Optimal Equilibrium114
0.50.5
2
000
0 100 200 300 400 500 600 700 800 900 1000Time NYearW
χM λ λ
χM λ λ
χM λ λ
NatureWealth
CommonersCarryingCapacity
(a) Soft landing to the optimal equilibriumwhen Elite population (marked in red) equalszero. Final population reaches the carrying ca-pacity, which is at its maximum value, �M , inthis scenario.
Egalitarian Society: Oscillatory Approach to Equilibrium
0 100 200 300 400 500 600 700 800 900 1000Time NYearW
20
10
21
10.5
000
χM λ λ
χM λ λ
χM λ λ
Nature
Wealth
CommonersCarryingCapacity
(b) Oscillatory approach to equilibrium whenElite population (marked in red) equals zero.Final population converges to the carrying ca-pacity, which is lower than its maximum value,�M , in this scenario.
Egalitarian Society: Cycles of Prosperity and Reversibleu Type-N Collapses
20
10
0 100 200 300 400 500 600 700 800 900 1000Time (YearY
21
10h5
000
χM λ λ
χM λ λ
χM λ λ
Nature
WealthCommoners
CarryingCapacity
(c) Cycles of prosperity, overshoot, (reversibleType-N) collapse, and revival when Elite popu-lation (marked in red) equals zero.
Egalitarian Society: Irreversibleh Type-N mFullY Collapse
0 100 200 300 400 500 600 700 800 900 1000Time mYearY
20
10
21
10.5
000
χM λ λ
χM λ λ
χM λ λ
Nature Wealth
Commoners
Carrying Capacity
(d) Irreversible Type-N collapse (full collapse)when Elite population (marked in red) equalszero. All the state variables collapse to zero inthis scenario due to over-depletion.
Figure 3: Experiment results for the Egalitarian society.
Simulation results show that these cycles, ending in Type-N collapses (i.e., those that start due toscarcity of Nature), repeat themselves indefinitely. Therefore, such cycles represent “reversible”Type-N collapses. This reversibility is possible as long as � stays within a “safe” neighborhood of�⇤.
5.1.4 Egalitarian Society: Irreversible Type-N Collapse (Full Collapse)
For the scenario in figure 3d, � is increased further to � = 5.5�⇤ = 3.67E � 5. The overshoot isso large that it forces Population, Nature and Wealth into a full collapse, after which there is norecovery. This is a generic type of collapse that can happen for any type of society due to over-depletion. See sections 5.2.4 and 5.3.2 for examples of irreversible Type-N collapses in equitableand unequal societies, respectively. We include further discussion of these two types of collapsesin section 6.
We observe that the accumulated Wealth delays a decline of the population even after Naturehas declined well below its capacity, �. Therefore, population keeps growing and depleting Natureuntil Nature is fully exhausted. At that instance, i.e., when y = 0, Wealth cannot grow any further;indeed, it starts plummeting, causing a sharp fall of the population level, and eventually its full,
15

irreversible collapse.
5.2 Equitable Society (with Workers and Non-Workers): = 1
We take the parameter values and the initial conditions to be the same as in table 1, except thatthis time we set xE(0) = 25 (' = 0.25) and = 1. We start with the optimal depletion per capita� = �⇤⇤, which will sustain the maximum population (see (14)), and will gradually increase it inorder to get the additional scenarios in this subsection. Notice that in these cases, xC describesthe Working Population, while xE describes the Non-Working Population. Everybody consumesat the same level, since we set = 1, i.e., we assume there is no inequality in consumption levelfor Workers and Non-Workers.
0 100 200 300 400 500 600 700 800 900 1000Time WYeark
114
0C50C5
2
000
λ λ
χM λ λ
χM λ λ
χM Equitable Society: Soft Landing to Optimal Equilibrium
Workers
Non-Workers
NatureWealth
CarryingCapacity
(a) Equilibrium in the presence of both Work-ers and Non-Workers can be attained with slowgrowth and equitable salaries.
0 100 200 300 400 500 600 700 800 900 1000Time NYearn
20
10
11
0.50.5
000
χM λ λ
χM λ λ
χM λ λ
Equitable Society: Oscillatory Approach to EquilibriumWorkers
Non-Workers
Nature
Wealth
CarryingCapacity
(b) Oscillatory approach to equilibrium in thepresence of both Workers and Non-Workers ispossible when the overshoot is not too large.
g 1gg 2gg 3gg 4gg 5gg 6gg 7gg 8gg 9gg 1gggTime vYear,
Equitable Society: Cycles of Prosperity and Reversible. Type-N Collapses
2g
1g
11
gk5gk5
ggg
χM λ λ
χM λ λ
χM λ λ
Workers
Non-Workers
Nature
Wealth
CarryingCapacity
(c) Cycles of prosperity, overshoot, (reversibleType-N) collapse, and revival in the presence ofWorkers and Non-Workers.
0 100 200 300 400 500 600 700 800 900 1000Time CYear.
Equitable Society: Irreversiblen Type-N CFull. Collapse
20
10
11
0g50g5
000
χM λ λ
χM λ λ
χM λ λ
Workers
Non-Workers
Nature
WealthCarrying Capacity
(d) Irreversible Type-N collapse (full collapse)happens after a period of very fast growth.
Figure 4: Experiment results for the Equitable society.
5.2.1 Equitable Society: Soft Landing to Optimal Equilibrium
For the scenario in figure 4a, � = �⇤⇤ = 8.33⇥10�6. Notice that this is larger than the optimal valuein the absence of Non-Workers �⇤ = 6.67⇥ 10�6 even though all the other parameters are identicalto those in section 5.1.1. This di↵erence arises because xE 6= 0, which in turn forces the Workers toproduce extra in order to support the Non-Workers. Now, � < �M because � = �⇤⇤ 6= �⇤. However,by setting � = �⇤⇤, the optimal value of � in the presence of Non-Workers, the total population,
16

Equitable Society: Preventing a Full Collapse
0 100 200 300 400 500 600 700 800 900 1000Time .YearW
114
0.50.5
2
000
λ λ
χM λ λ
χM λ λ
χM
Workers
Non-Workers
Nature
Wealth
Carrying Capacity
Figure 5: The full collapse that happenedin the previous scenario, figure 4d of sec-tion 5.2.4, can be prevented by reducing theaverage depletion per capita. This can beachieved by either increasing the ratio of theNon-Working to Working population (high�, high ') or decreasing the average work-load per worker, i.e., decreasing total workhours per week (low �, low ').
xC+xE still reaches the maximum Carrying Capacity, �M , the same as in section 5.1. See equation(15) and section 4.2 for a mathematical description.
Similar comments as in section 5.1.1 apply here when we choose a lower-than-optimal �.
5.2.2 Equitable Society: Oscillatory Approach to Equilibrium
For the scenario in figure 4b, � = 2.64�⇤⇤ = 2.20 ⇥ 10�5. The final total population equals theCarrying Capacity (smaller than the maximum Carrying Capacity).
5.2.3 Equitable Society: Cycles of Prosperity, Overshoot, Collapse, and Revival
For the scenario in figure 4c, � = 3.46�⇤⇤ = 3.00⇥ 10�5. The result is analogous to figure 3c whichcorresponds to section 5.1.3. As before, the time at which the total population overshoots theactual Carrying Capacity is indicated by the fact that Wealth starts to decrease. After each cycleof prosperity, there is a partial, reversible Type-N collapse.
5.2.4 Equitable Society: Full Collapse
For the scenario in figure 4d, � = 5�⇤⇤ = 4.33⇥ 10�5. Once again, we can see how an irreversibleType-N (full) collapse of Population, Nature, and Wealth can occur due to over-depletion of naturalresources as a result of high depletion per capita.
5.2.5 Equitable Society: Preventing a Full Collapse by Decreasing Average Depletionper Capita
The case in figure 5 is similar to the previous case (see section 5.2.4 and figure 4d), except that weraised the ratio of Non-Workers to Workers, ', from 0.25 to 6. This corresponds to changing xE(0)from 25 to 600, while keeping xC(0) = 100. By increasing the ratio of non-workers to workers, asustainable equilibrium can be reached due to lower average depletion per capita —an equivalent� if everyone contributed equally to labor. This could also be interpreted as modeling a reductionin the average workload per worker.
5.3 Unequal Society (with Elites and Commoners): x
E
� 0 and > 1
In our examples of an unequal society, the Elites (per capita) consume ⇠ 10 to 100 times morethan the Commoners. Their population, plotted in red, is multiplied by to represent theirequivalent impact because of their higher consumption. That is why we use the label “EquivalentElites” on the graphs in this section, 5.3.
17

In the first two cases, we discuss two distinct, but generic types of collapse in an unequalsociety. In these two scenarios, = 100. Then we will show possibility of reaching an equilibriumby reducing to 10 and adjusting the birth rates �E and �C independently. These two = 10scenarios show that in order to reach a sustainable equilibrium in an unequal society, it is necessaryto have policies that limit inequality and ensure birth rates remain below critical levels.
Unequal Society: Type-L Collapse NScarcity of LaborW
0 100 200 300 400 500 600 700 800 900 1000Time NYearW
614
0.52
000
χM λ λ
χM λ λ
χM λ λ
3
Nature
Wealth NEquivalentWElites
Commoners
CarryingCapacity
(a) Population collapse following an apparentequilibrium due to a small initial Elite popula-tion when = 100. This scenario also showsa di↵erent route to a collapse, in which, al-though Nature eventually recovers, populationdoes not.
Unequal Society: Irreversible, Type-N hFullE Collapse
0 50 100 150 200 250 300 350 400 450 500Time hYearE
40
20
21
10.5
000
χM λ λ
χM λ λ
χM λ λ
Nature
Wealth
hEquivalentEElites
Commoners
CarryingCapacity
(b) A fast full collapse due to both over-depletion and inequality ( = 100).
Unequal Society: Soft Landing to Optimal Equilibrium
0 100 200 300 400 500 600 700 800 900 1000Time .YearN
114
0C50C5
2
000
λ λ
χM λ λ
χM λ λ
χM
NatureWealth
.EquivalentN Elites
CommonersCarrying Capacity
(c) With moderate inequality ( = 10), it is pos-sible to attain an optimal equilibrium by con-trolling the birth rates.
Unequal Society: Oscillatory Approach to Equilibrium
0 50 100 150 200 250 300 350 400 450 500Time (Year)
Nature
Wealth
(Equivalent)Elites
CommonersCarrying Capacity
(d) With � ? �⇤⇤⇤, it is still possible to oscillateand converge to an equilibrium ( = 10).
Figure 6: Experiment results for the Unequal society.
5.3.1 Unequal Society: Type-L Collapse (Labor Disappears, Nature Recovers)
This scenario, presented in figure 6a, is precisely the same as the equilibrium without Elites casepresented in section 5.1.1 (figure 3a) except that here we set xE(0) = 1.0 ⇥ 10�3. This is indeeda very small initial seed of Elites. The two scenarios look pretty much the same up until aboutt = 500 years after the starting time of the simulation. The Elite population starts growingsignificantly only after t = 500, hence depleting the Wealth and causing the system to collapse.Under this scenario, the system collapses due to worker scarcity even though natural resources arestill abundant, but because the depletion rate is optimal, it takes more than 400 years after theWealth reaches a maximum for the society to collapse. In this example, Commoners die out first
18

and Elites disappear later. This scenario shows that in a society that is otherwise sustainable, thehighly unequal consumption of elites will still cause a collapse.
This scenario is an example of a Type-L collapse in which both Population and Wealth collapsebut Nature recovers (to its maximum capacity, �, in the absence of depletion). Scarcity of workersis the initial cause of a Type-L collapse, as opposed to scarcity of Nature for a Type-N collapse.
5.3.2 Unequal Society: Irreversible Type-N Collapse (Full Collapse)
The typical scenario in figure 6b for a full collapse is the result of running the model with theparameter values and initial conditions given by table 1. Examples of irreversible Type-N (full)collapses in the egalitarian and equitable societies are presented in sections 5.1.4 (figure 3d) and5.2.4 (figure 4d).
We set a small initial seed of xE(0) = 0.20, = 100, and a large depletion � = 1.0 ⇥ 10�4,so that both the depletion � = 15�⇤ and the inequality coe�cient = 100 are very large. Thiscombination results in a full collapse of the system with no recovery. The Wealth starts decliningas soon as the Commoner’s population goes beyond its carrying capacity, and then the full collapsetakes only about 250 additional years. The declining Wealth causes the fall of the Commoner’spopulation (workers) with a time lag. The fast reduction in the number of workers combined withscarcity of natural resources causes the Wealth to decline even faster than before. As a result, theElites —who could initially survive the famine due to their unequal access to consumable goods( = 100)— eventually also die of hunger. Note that because both depletion and inequality arelarge, the collapse takes place faster and at a much lower level of population than in the previouscase (see section 5.3.1, figure 5.3.1) with a depletion rate of � = �⇤.
5.3.3 Unequal Society: Soft Landing to Optimal Equilibrium
The following parameter values and initial values can produce the current scenario (the rest areexactly the same as in table 1):
8>><
>>:
�C = 6.5⇥ 10�2�E = 2.0⇥ 10�2
xC(0) = 1.0⇥ 10+4xE(0) = 3.0⇥ 10+3
= 10 � = 6.35⇥ 10�6
(20)
The value for � used in this scenario is �⇤⇤⇤ given by equation (18). It must be remembered that = 0.65 is not a parameter that we can choose. However, it can be read from the result of thesimulation since it is the equilibrium ratio of the Elite to Commoner population. See the secondequation in (17). On the other hand, ⌘ = 1
12 is determined by the death and birth rates as wellas the inequality coe�cient. These parameters are chosen in order to satisfy (16), the necessarycondition for attaining an equilibrium in an unequal society.
The same comments as in section 5.1.1 hold here if we choose a lower-than-optimal �.
5.3.4 Unequal Society: Oscillatory Approach to Equilibrium
The parameter values and initial conditions in the scenario presented in figure 6d are exactly thesame as the previous scenario, presented in figure 6c, except for �. It is increased to 1.3 ⇥ 10�5,almost 2�⇤⇤⇤. This results in a much lower Carrying Capacity compared to 5.3.3, as can be seenfrom a comparison of figures 6c and 6d. Therefore, the total final population in the present scenariois much less than the total final population in the previous scenario, 5.3.3 (figure 6c).
19

6 Discussion of Results
We conducted a series of experiments with the HANDY model, considering first an egalitariansociety without Elites (xE = 0), next an equitable society ( = 1) where Non-Workers and Workersare equally paid, and finally an unequal society whose Elites consume times more than theCommoners. The model was also used to find a sustainable equilibrium value and the maximumcarrying capacity within each of these three types of societies.
6.1 Unequal Society
The scenarios most closely reflecting the reality of our world today are found in the third group ofexperiments (see the scenarios for an unequal society in section 5.3), where we introduced economicstratification. Under such conditions, we find that collapse is di�cult to avoid, which helps toexplain why economic stratification is one of the elements consistently found in past collapsedsocieties. Importantly, in the first of these unequal society scenarios, 5.3.1, the solution appearsto be on a sustainable path for quite a long time, but even using an optimal depletion rate (�⇤)and starting with a very small number of Elites, the Elites eventually consume too much, resultingin a famine among Commoners that eventually causes the collapse of society. It is important tonote that this Type-L collapse is due to an inequality-induced famine that causes a loss of workers,rather than a collapse of Nature. Despite appearing initially to be the same as the sustainableoptimal solution obtained in the absence of Elites, economic stratification changes the final result:Elites’ consumption keeps growing until the society collapses. The Mayan collapse —in whichpopulation never recovered even though nature did recover— is an example of a Type-L collapse,whereas the collapses in the Easter Island and the Fertile Crescent —where nature was depleted—are examples of a Type-N collapse.
In scenario 5.3.2, with a larger depletion rate, the decline of the Commoners occurs faster, whilethe Elites are still thriving, but eventually the Commoners collapse completely, followed by theElites. It is important to note that in both of these scenarios, the Elites —due to their wealth—do not su↵er the detrimental e↵ects of the environmental collapse until much later than the Com-moners. This bu↵er of wealth allows Elites to continue “business as usual” despite the impendingcatastrophe. It is likely that this is an important mechanism that would help explain how historicalcollapses were allowed to occur by elites who appear to be oblivious to the catastrophic trajectory(most clearly apparent in the Roman and Mayan cases). This bu↵er e↵ect is further reinforcedby the long, apparently sustainable trajectory prior to the beginning of the collapse. While somemembers of society might raise the alarm that the system is moving towards an impending col-lapse and therefore advocate structural changes to society in order to avoid it, Elites and theirsupporters, who opposed making these changes, could point to the long sustainable trajectory “sofar” in support of doing nothing.
The final two scenarios in this set of experiments, 5.3.3 and 5.3.4, are designed to indicatethe kinds of policies needed to avoid this catastrophic outcome. They show that, in the contextof economic stratification, inequality must be greatly reduced and population growth must bemaintained below critical levels in order to avoid a societal collapse [Daly, 2008].
6.2 Egalitarian Society
In order to further understand what conditions are needed to avoid collapse, our first set of ex-periments model a society without economic stratification and start with parameter values that
20

make it possible to reach a maximum carrying capacity (scenario 5.1.1). The results show that inthe absence of Elites, if the depletion per capita is kept at the optimal level of �⇤, the populationgrows smoothly and asymptotes the level of the maximum carrying capacity. This produces asoft-landing to equilibrium at the maximum sustainable population and production levels.
Increasing the depletion factor slightly (scenario 5.1.2) causes the system to oscillate, but stillreach a sustainable equilibrium, although, importantly, at a lower carrying capacity. Populationovershoots its carrying capacity, but since the overshoot is not by too much —of the order of thecarrying capacity— the population experiences smaller collapses that can cause it to oscillate andeventually converge to a sustainable equilibrium. Thus, while social disruption and deaths wouldoccur, a total collapse is avoided.
A further increase in the depletion factor (scenario 5.1.3) makes the system experience oscil-latory periods of growth, very large overshoots and devastating collapses that almost wipe outsociety, but the eventual recovery of Nature allows for the cycle to be repeated.
Increasing the depletion factor even further (scenario 5.1.4) results in a complete collapse ofthe system. This shows that depletion alone, if large enough, can result in a collapse — even inthe absence of economic stratification.
6.3 Equitable Society (with Workers and Non-Workers)
As the second set of experiments (presented in section 5.2) show, HANDY allows us to model adiverse range of societal arrangements. In this set of experiments, choosing xE � 0 and = 1 hasallowed us to model a situation that can be described as having Workers and Non-Workers withthe same level of consumption, i.e., with no economic stratification. The Non-Workers in thesescenarios could represent a range of societal roles from students, retirees, and disabled people,to intellectuals, managers, and other non-productive sectors. In this case, the Workers have todeplete enough of Nature to support both the Non-Workers and themselves.
The first scenario, 5.2.1, shows that even with a population of Non-Workers, the total popu-lation can still reach a sustainable equilibrium without a collapse. In scenario 5.2.2, we find thatincreasing the depletion factor induces a series of overshoots and small collapses where populationeventually converges to a lower sustainable equilibrium. Like in an egalitarian society, scenario5.2.3 shows us that increasing the depletion parameter further results in cycles of large overshoot-ing, major collapses, and then eventual recovery of Nature. Scenario 5.2.4 shows us that increasingdepletion per capita further can produce an irreversible Type-N collapse.
Finally, scenario 5.2.5, which is a replication of 5.2.4 with a much higher ratio of Non-Workersto Workers, shows that a collapse in an equitable society could be avoided by reducing the averagedepletion per capita. We note that this scenario could also represent a situation where, ratherthan having paid Non-Workers, the workload per capita is reduced, with the whole populationworking “fewer days a week”. Such a “work-sharing” policy has been successfully implementedin Germany over the past few years for reducing unemployment [Baker and Hasset, 2012; Hasset,2009]. Moreover, Knight et al. [2013] show, through a panel analysis of data for 29 high-incomeOECD countries from 1970 to 2010, that reducing work hours can contribute to sustainability byreducing ecological strain. This conclusion agrees with our comparison of the two scenarios, 5.2.5and 5.2.4, presented above.
21

6.4 HANDY and Brander-Taylor Model
As previously mentioned, a similar use of the predator-prey approach was applied in the pioneeringwork of Brander and Taylor [1998] (BT ) to study the historical rise and fall of the Easter Islandpopulation. In comparison to their model, with just two equations for Population and Nature,the introduction of Elites and Commoners, and accumulated Wealth, results in a greater varietyand broader spectrum of potential solutions. Moreover, the collapse scenario presented in BTis somewhat di↵erent from the ones presented above. As a matter of fact, the collapse scenariopresented in figure 3 of BT seems to be more of an oscillatory approach to equilibrium, similarto the one shown in our figure 3b, and not a collapse in the sense that we define in this paper.Furthermore, the carrying capacity, in the sense we define in this paper, is also di↵erent fromwhat Brander and Taylor [1998] call carrying capacity. Indeed, their carrying capacity (K) is ourNature’s capacity, �, which is the maximum size Nature can reach, whereas Carrying Capacityin HANDY is the population level that can be supported by a given level of natural resources.Furthermore, BT’s carrying capacity is a constant, whereas Carrying Capacity in HANDY adjustsaccording to the level of depletion of Nature.
While sharing certain similarities with the Brander and Taylor model, our more complex modelstructure and the use of di↵erent assumptions, allows our model to apply to multiple types of so-cieties with varying socioeconomic structures. Thus, unlike works that tend to study furtherimplications of the two-dimensional model of BT [Anderies, 2000], the model we have developedintroduces a more complex set of possible feedbacks and nonlinear dynamics, and a greater spec-trum of potential outcomes. This allows HANDY to model a di↵erent and wider set of thoughtexperiments.
An important feature of HANDY that distinguishes it from Predator-Prey, BT, and othersimilar models [Anderies, 1998; Dalton et al., 2005; Erickson and Gowdy, 2000; Reuveny andDecker, 2000] is its native capability for producing irreversible collapses due to the structure foraccumulation of wealth. Our approach also di↵ers from models like D’Alessandro [2007] thatcan produce irreversible collapses but only through explicit introduction of a critical depensationmechanism into the model. The dynamics produced by HANDY o↵er the possibility of irreversiblecollapses without having to introduce such an additional mechanism into the model. See section5.1.4 for an explanation of irreversible collapses in HANDY. 1
7 Summary
Collapses of even advanced civilizations have occurred many times in the past five thousand years,and they were frequently followed by centuries of population and cultural decline and economicregression. Although many di↵erent causes have been o↵ered to explain individual collapses, itis still necessary to develop a more general explanation. In this paper we attempt to build asimple mathematical model to explore the essential dynamics of interaction between populationand natural resources. It allows for the two features that seem to appear across societies that havecollapsed: the stretching of resources due to strain placed on the ecological carrying capacity, andthe division of society into Elites (rich) and Commoners (poor).
The Human And Nature DYnamical model (HANDY) was inspired by the Predator and Preymodel, with the human population acting as the predator and nature being the prey. When small,Nature grows exponentially with a regeneration coe�cient �, but it saturates at a maximum value
1We wish to acknowledge and thank reviewer No. 1 for highlighting these very important points to us.
22

�. As a result, the maximum regeneration of nature takes place at �/2, not at the saturationlevel �. The Commoners produce wealth at a per capita depletion rate �, and the depletion is alsoproportional to the amount of nature available. This production is saved as accumulated wealth,which is used by the Elites to pay the Commoners a subsistence salary, s, and pay themselves s,where is the inequality coe�cient. The populations of Elites and Commoners grow with a birthrate � and die with a death rate ↵ which remains at a healthy low level when there is enoughaccumulated food (wealth). However, when the population increases and the wealth declines, thedeath rate increases up to a famine level, leading to population decline.
We show how the carrying capacity —the population that can be indefinitely supported by agiven environment [Catton, 1980]— can be defined within HANDY, as the population whose totalconsumption is at a level that equals what nature can regenerate. Since the regrowth of Nature ismaximum when y = �/2, we can find the optimal level of depletion (production) per capita, �⇤ inan egalitarian society where xE ⌘ 0, �⇤⇤(� �⇤) in an equitable society where ⌘ 1, and �⇤⇤⇤ in anunequal society where xE � 0 and > 1.
In sum, the results of our experiments, discussed in section 6, indicate that either one of thetwo features apparent in historical societal collapses —over-exploitation of natural resources andstrong economic stratification— can independently result in a complete collapse. Given economicstratification, collapse is very di�cult to avoid and requires major policy changes, including majorreductions in inequality and population growth rates. Even in the absence of economic stratifica-tion, collapse can still occur if depletion per capita is too high. However, collapse can be avoidedand population can reach equilibrium if the per capita rate of depletion of nature is reduced to asustainable level, and if resources are distributed in a reasonably equitable fashion.
In the upcoming generations of HANDY, we plan to develop several extensions including: (1)disaggregation of Nature into nonrenewable stocks, regenerating stocks, and renewable flows, aswell as the introduction of an investment mechanism in accessibility of natural resources, in orderto study the e↵ects of investment in technology on resource choice and production e�ciency; (2)making inequality () endogenous to the model structure; (3) introduction of “policies” that canmodify parameters such as depletion, the coe�cient of inequality, and the birth rate; and, (4)introduction of multiple coupled regions to represent countries with di↵erent policies, trade ofcarrying capacity, and resource wars.
Those interested in obtaining the model code can contact the authors.
8 Acknowledgements
We are grateful to Profs. Matthias Ruth, Victor Yakovenko, Herman Daly, Takemasa Miyoshi, JimCarton, Fernando Miralles-Wilhelm, Ning Zeng, and Drs. Robert Cahalan and Steve Penny formany useful discussions. Study of the “Equitable Society” scenarios (i.e., with Workers and Non-Workers), the scenario presented in section 5.2.5, in particular, was suggested by V. Yakovenko.We would also like to thank anonymous reviewer No. 1 for having highlighted to us the importanceof the capability of HANDY to naturally produce irreversible collapses, which is not found in earliermodels. We would especially like to thank the editors of this journal for alerting us to the modeland work done by Brander and Taylor, of which we were unaware, and allowing us to revise ourarticle to account for this new information.
This work was partially funded through NASA/GSFC grant NNX12AD03A.
23

References
Wilhelm Abel. Agricultural Fluctuations in Europe: From the Thirteenth to the Twentieth Cen-turies. Methuen, 1980.
John M Anderies. Culture and human agro-ecosystem dynamics: the Tsembaga of New Guinea.Journal of Theoretical Biology, 192(4):515–530, 1998.
John M. Anderies. On modeling human behavior and institutions in simple ecological economicsystems. Ecological Economics, 35(3):393–412, December 2000.
Dean Baker and Kevin Hasset. The human disaster of unemployment, May 2012. URL http://
www.nytimes.com/2012/05/13/opinion/sunday/the-human-disaster-of-unemployment.
html?pagewanted=all.
Anand Banerjee and Victor M. Yakovenko. Universal patterns of inequality. New Journal ofPhysics, 12(7), July 2010.
James A. Brander and M. Scott Taylor. The simple economics of Easter Island: A Ricardo-Malthusmodel of renewable resource use. The American Economic Review, 88(1):119–138, 1998.
Robert Brenner. Agrarian class structure and economic development in pre-industrial Europe. InTrevor H. Aston and C. H. E. Philpin, editors, The Brenner Debate: Agrarian Class Structureand Economic Development in Pre-Industrial Europe, pages 10–63. Cambridge University Press,1985.
William R. Catton. Overshoot: The Ecological Basis of Revolutionary Change. University ofIllinois Press, 1980.
Christopher Chase-Dunn and Thomas Hall. Rise and Demise: Comparing World-Systems. West-view Press, 1997.
C. Y. Cyrus Chu and Ronald D. Lee. Famine, revolt, and the dynastic cycle: Population dynamicsin historic China. Journal of Population Economics, 7(4):351–378, November 1994.
Joel E. Cohen. How Many People Can the Earth Support? W. W. Norton & Company, 1995.
T. Patrick Culbert, editor. The Classic Maya collapse. University of New Mexico Press, 1973.
Simone D’Alessandro. Non-linear dynamics of population and natural resources: The emergenceof di↵erent patterns of development. Ecological Economics, 62(3):473–481, 2007.
Thomas R Dalton, R Morris Coats, and Badiollah R Asrabadi. Renewable resources, property-rights regimes and endogenous growth. Ecological Economics, 52(1):31–41, 2005.
Herman E Daly. Steady-state economics: with new essays. Island Press, 1991.
Herman E. Daly. Beyond growth: the economics of sustainable development. Beacon Press, 1996.
Herman E. Daly. A steady-state economy, April 2008. URL http://www.sd-commission.org.
uk/data/files/publications/Herman_Daly_thinkpiece.pdf.
24

Herman E. Daly and Joshua Farley. Ecological Economics: Principles And Applications. IslandPress, 2003.
Arthur Demerest, Prudence Rice, and Don Rice, editors. The Terminal Classic in the MayaLowlands. University Press of Colorado, 2004.
Jared M. Diamond. Collapse: How Societies Choose to Fail Or Succeed. Viking Press, 2005.
Adrian A. Dragulescu and Victor M. Yakovenko. Exponential and power-law probability distri-butions of wealth and income in the United Kingdom and the United States. Physica A, 299:213–221, 2001.
Iorwerth Eiddon Stephen Edwards, Cyril John Gadd, and Nicholas Geo↵rey Lempriere Hammond,editors. The Cambridge Ancient History, Vol. I, Part 2: Early History of the Middle East.Cambridge University Press, 1971.
Iorwerth Eiddon Stephen Edwards, Cyril John Gadd, Nicholas Geo↵rey Lempriere Hammond, andEdmond Sollberger, editors. The Cambridge Ancient History, Vol. II, Part 1: The Middle Eastand the Aegean Region. Cambridge University Press, 1973.
Jon D Erickson and John M Gowdy. Resource use, institutions, and sustainability: a tale of twoPacific Island cultures. Land Economics, pages 345–354, 2000.
Joshua Goldstein. Long Cycles: Prosperity and War in the Modern Age. Yale University Press,1988.
Jack A. Goldstone. Revolution and Rebellion in the Early Modern World. University of CaliforniaPress, 1991.
Lorna A. Greening, David L. Greene, and Carmen Difiglio. Energy e�ciency and consumption—the rebound e↵ect— a survey. Energy Policy, 28(67):389–401, 2000.
Kevin Hasset. U.S. should try Germany’s unemployment medicine, November 2009. URL http:
//www.bloomberg.com/apps/news?pid=newsarchive&sid=ax3kyE3bILDY.
Ibn Khaldun. The Muqaddimah: An Introduction to History. Pantheon Books, 1958. Translatedfrom the Arabic (ca 1390) by Franz Rosenthal.
Michael Jansen, Maire Mulloy, and Gunter Urban, editors. Forgotten cities on the Indus: earlycivilization in Pakistan from the 8th to the 2nd millennium BC. Verlag Philipp von Zabern,1991.
Daniel M. Kammen. Preindustrial human environmental impacts: Are there lessons for globalchange science and policy? Chemosphere, 29(5), September 1994.
Jonathan Kenoyer. Ancient Cities of the Indus Valley Civilization. Oxford University Press, 1998.
Kyle W. Knight, Eugene A. Rosa, and Juliet B. Schor. Could working less reduce pressureson the environment? a cross-national panel analysis of OECD countries, 1970–2007. GlobalEnvironmental Change, 2013.
Nikolai Dmitrievich Kondratie↵. The long wave cycle. Richardson & Snyder, 1984.
25
Emmanuel Le Roy Ladurie. The French Peasantry, 1450-1660. University of California Press,1987.
J. S. Lee. The periodic recurrence of internecine wars in China. The China Journal, 14(3):111–163,March-April 1931.
David Lentz, editor. Imperfect Balance: Landscape Transformation in the Precolumbian Americas.Columbia University Press, 2000.
Alfred J. Lotka. Elements of Physical Biology. Williams and Wilkins, 1925.
Donella H. Meadows, Dennis L. Meadows, Jørgen Randers, and William W. Behrens III. TheLimits to Growth. Universe Books, 1972.
Richard E. Mitchell. Patricians and plebeians: the origin of the Roman state. Cornell UniversityPress, 1990.
George Modelski. Exploring Long Cycles. L. Rienner Publishers, 1987.
Ian Morris. The collapse and regeneration of complex society in Greece, 1500–500 BC. In Glenn M.Schwartz and John J. Nichols, editors, After Collapse: The Regeneration of Complex Societies.University of Arizona Press, 2006.
Joseph Needham and Ling Wang. Science and Civilisation in China: Introductory Orientations.Cambridge University Press, 1956.
Jack Parsons. Population control and politics. Population and Environment, 12(4):355–377, June1991.
John M. Polimeni, Kozo Mayumi, Mario Giampietro, and Blake Alcott. The Jevons Paradox andthe Myth of Resource E�ciency Improvements. Earthscan, 2008.
Clive Ponting. A green history of the world: the environment and the collapse of great civilizations.Penguin Books, 1991.
Michael M. Postan. Medieval agrarian society in its prime: 7. England. In Michael M. Postan,editor, The Cambridge Economic History of Europe, Vol. 1: The Agrarian Life of the MiddleAges, pages 221–246. Cambridge University Press, 1966.
Charles L. Redman, editor. Human Impact on Ancient Environments. University of Arizona Press,1999.
Charles L. Redman, Steven James, Paul Fish, and J. Daniel Rogers, editors. The Archaeology ofGlobal Change: The Impact of Humans on Their Environment. Smithsonian Books, 2004.
Rafael Reuveny and Christopher S. Decker. Easter Island: historical anecdote or warning for thefuture? Ecological Economics, 35(2):271–287, 2000.
Matthias Ruth. The nature of the beast and the beast in nature: Broadening the perspective oftechnology. Bulletin of Science, Technology & Society, 29(5):374–382, 2009.
26
Stephen Shennan, Sean S. Downey, Adrian Timpson, Kevan Edinborough, Sue Colledge,Tim Kerig, Katie Manning, and Mark G. Thomas. Regional population collapse fol-lowed initial agriculture booms in mid-Holocene Europe. Nature Communications, 4, 2013.doi:10.1038/ncomms3486.
Miriam T. Stark. From Funan to Angkor: Collapse and regeneration in ancient Cambodia. InGlenn M. Schwartz and John J. Nichols, editors, After Collapse: The Regeneration of ComplexSocieties. University of Arizona Press, 2006.
Joseph A. Tainter. The Collapse of Complex Societies. Cambridge University Press, 1988.
Romila Thapar. Early India: From the Origins to Ad 1300. University of California Press, 2004.
Peter Turchin. Historical Dynamics: Why States Rise and Fall. Princeton University Press, 2003.
Peter Turchin. Dynamical feedbacks between population growth and sociopolitical instability inagrarian states. Structure and Dynamics, 1(1), 2005.
Peter Turchin. War and Peace and War: The Life Cycles of Imperial Nations. Pi Press, 2006.
Peter Turchin and Sergey A. Nefedov. Secular Cycles. Princeton University Press, 2009.
Vito Volterra. Variazioni e fluttuazioni del numero dindividui in specie animali conviventi. MemoriaAccademia dei Lincei Roma, 2:31–113, 1926.
David Webster. The Fall of the Ancient Maya. Thames and Hudson, 2002.
James W. Wood. A theory of preindustrial population dynamics demography, economy, and well-being in Malthusian systems. Current Anthropology, 39(1):99–135, February 1998.
Ronald Wright. A Short History of Progress. House of Anansi Press, 2004.
Norman Yo↵ee. The decline and rise of Mesopotamian civilization: An ethnoarchaeological per-spective on the evolution of social complexity. American Antiquity, 44(1):5–35, January 1979.
Norman Yo↵ee and George L. Cowgill. The Collapse of Ancient States and Civilizations. Universityof Arizona Press, 1988.
27