HSBC NDR 201205 - sinopac.com deposits 919,105 927,318 949,915 964,233 974,333 1.0% 6.0% Total loans...
56
SinoPac Holdings Non-deal Roadshow by HSBC 2012.05.03-04
Transcript of HSBC NDR 201205 - sinopac.com deposits 919,105 927,318 949,915 964,233 974,333 1.0% 6.0% Total loans...

SinoPac Holdings
Non-deal Roadshow by HSBC
2012.05.03-04

This presentation and the presentation materials distributed herewith may include forward-looking statements. 2011Q4 financial data are preliminary. All statements, other than statements of historical facts, that address activities, events or developments that SinoPac Financial Holding Company (“SinoPac”) expects or anticipates will or may occur in the future (including but not limited to projections, targets, estimates and business plans) are forward-looking statements. SinoPac’s actual results or developments may
Disclaimer
1
forward-looking statements. SinoPac’s actual results or developments may differ materially from those indicated by these forward-looking statements as a result of various factors and uncertainties, including but not limited to price fluctuations, actual demand, exchange rate fluctuations, market shares, competition, changes in legal, financial and regulatory frameworks, international economic and financial market conditions, political risks, cost estimates and other risks and factors beyond its control. In addition, SinoPac makes the forward-looking statements referred to herein as of today and undertakes no obligation to update these statements.
1

Agenda
2011/4Q Overall Performance (p.2 ~ p.3)
SinoPac Holdings (p.4 ~ p.9)
Bank SinoPac (p.10 ~ p.24)
2
Bank SinoPac (p.10 ~ p.24)
SinoPac Securities (p.25 ~p.29)
Future Prospects (p.30 ~ p.38)

SPH Operating Report 1/2
2011/4Q Overview2011/4Q Overview� Unfavorable external business environment
• European debt crisis continued to plague the global economy. As rating agencies downgraded European sovereign debts, Euro-zone entered negative economic growth. Taiwanese stock market has been impacted; TWSI fell to 7,072 in December from September’s 7,225 and 4Q’s average daily trading volume was NT$94.2Bn, lowest in 2011
• US unemployment rate remained high and housing market has yet to show signs of recovery. Downside risks still persist
• Overall economic outlook remains bleak, corporations appear risk adverse and investors confidence remains low
3
� Operational focus• Emphasize on balanced loan growth across all sectors and asset quality maintenance
• Provide customer-centric services through product integration
• Maintain conservative trading strategy to reduce earnings fluctuations
• Sustain brokerage market share and operating advantages through flexible pricing
� SPH overall operating outcome• SPH booked net loss after tax of NT$1,113Mn in 2011/4Q. (BSP reported net loss of
NT$1,231Mn while SPS reported net income of NT$17Mn.)
• SPH booked net income after tax of NT$3,009Mn in 2011. (BSP reported net income of NT$2,382Mn while SPS reported net income of NT$400Mn.)

SPH Operating Report 2/2
Bank SinoPac
• Re-launched upgraded MMA+ program to provide customers with a better one-stop shopping platform that integrates services such as deposit account, securities investments, gold account, credit cards and online banking
• Credit card issuance reach 2.18Mn cards, ranked sixth in the market
• Partnered with Hi-Life convenience stores to install ATMs with real-time video conference capabilities, allowing customers to communicate with bank representatives and have access to financial services all the time
Performance and achievements Performance and achievements
4
SinoPac Securities
• Ranked 1st and 3rd respectively in market share growth for brokerage and futures
• Ranked 1st in number of underwriting proposals submitted
• Ranked 1st in number of rights issued and profit made
Awards
• Bank SinoPac was awarded for its outstanding contribution to financial electronic data interchange (FEDI) systems
• SinoPac Securities was recognized by TWSE for its outstanding effort in promoting rights issuance

SPH Financial Highlights – 2011/4Q
NT$Mn;Mn Shares
2010/4Q 2011/1Q 2011/2Q 2011/3Q 2011/4Q QoQ YoY
Share capital 1 70,098 70,098 73,112 73,112 73,112 - 4.3%
Average sharesoutstanding 2 7,005 7,010 7,010 7,311 7,311 0.0% 4.4%
Total assets 1,230,884 1,239,210 1,259,903 1,283,175 1,3 00,423 1.3% 5.6%
Total equity 86,745 88,627 89,344 90,387 90,075 -0.3% 3.8%
5
1 2011/2Q NT$3,014Mn stock dividend was allocated in share capital2 2011/3Q Adjusted shares outstanding with stock dividend3 Average of month-end balance used in ROAE calculation
Total equity 86,745 88,627 89,344 90,387 90,075 -0.3% 3.8%
Net income 1,148 1,493 1,837 792 -1,113 -241% -197%
ROAE (Annualized) 5.29% 6.77% 8.19% 3.51% -4.90% -8.41% -1 0.2%
EPS (NT$) 0.16 0.21 0.26 0.09 -0.15 -0.24 -0.31
BVPS (NT$) 12.37 12.64 12.75 12.36 12.32 -0.04 -0.05

SPH Financial Highlights – 2011/1~12M
NT$Mn;Mn Shares
2010/1~12M 2011/1~12M +/- YoY
Share capital 70,098 73,112 3,014 4.3%
Average sharesoutstanding
7,005 7,311 306 4.4%
Total assets 1,230,884 1,300,423 69,539 5.6%
6
Total equity 86,745 90,075 3,330 3.8%
Net income 5,109 3,009 -2,100 -41.1%
ROAE (Annualized) 6.01% 3.35% -2.66% -2.66%
EPS (NT$) 0.73 0.41 -0.32 -0.32
BVPS (NT$) 12.37 12.32 -0.05 -0.05

100%
125%119%
115%115%117%
2010/4Q 2011/1Q 2011/2Q 2011/3Q 2011/4Q
Regulatory requirement
SPH – Leverage & Solvency Ratio
Sub-debt issuance of NT$3.2Bn
CAR (%)CAR (%)
7
125%
107% 106% 108% 108% 109%
2010/4Q 2011/1Q 2011/2Q 2011/3Q 2011/4Q
1 CAR = Holdings’ net eligible capital / Holdings’ statutory required capital2 DLR = Long-term investment / Equity
DLR (%)DLR (%)Regulatory requirement
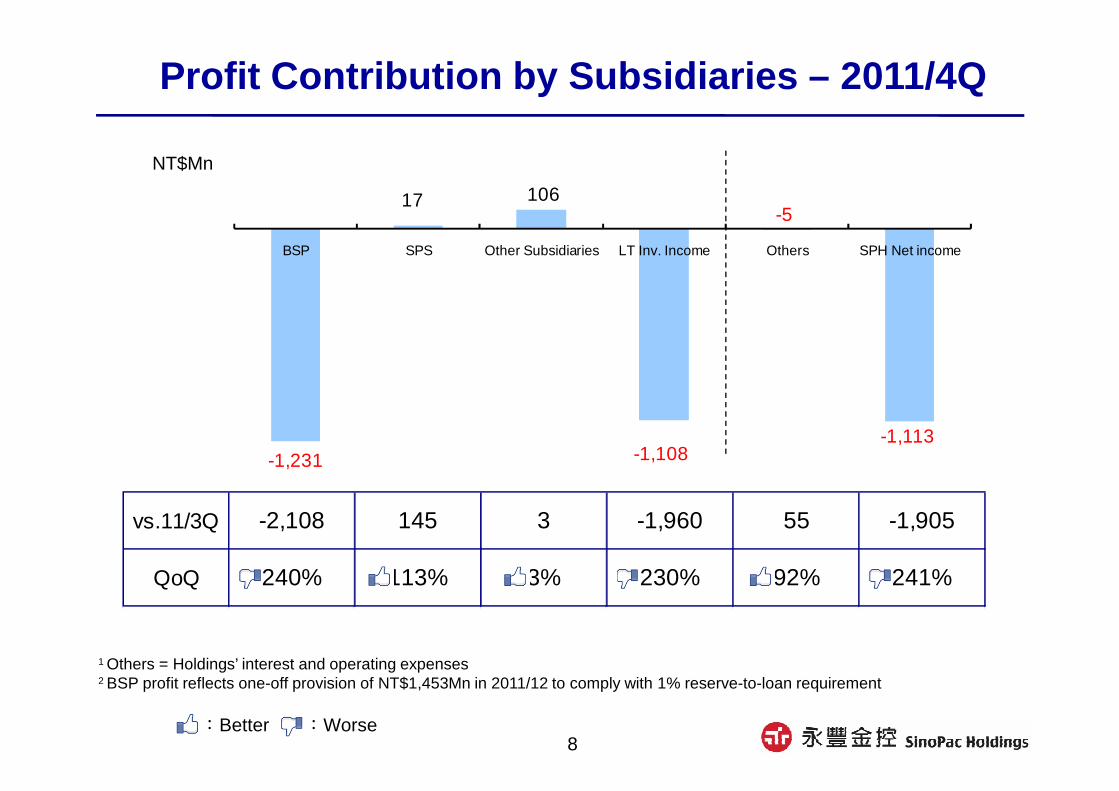
17 106 -5
BSP SPS Other Subsidiaries LT Inv. Income Others SPH Net income
Profit Contribution by Subsidiaries – 2011/4Q
NT$Mn
8
-1,231 -1,108 -1,113
vs.11/3Q -2,108 145 3 -1,960 55 -1,905
QoQ 240% 113% 3% 230% 92% 241%
1 Others = Holdings’ interest and operating expenses2 BSP profit reflects one-off provision of NT$1,453Mn in 2011/12 to comply with 1% reserve-to-loan requirement
:Better :Worse
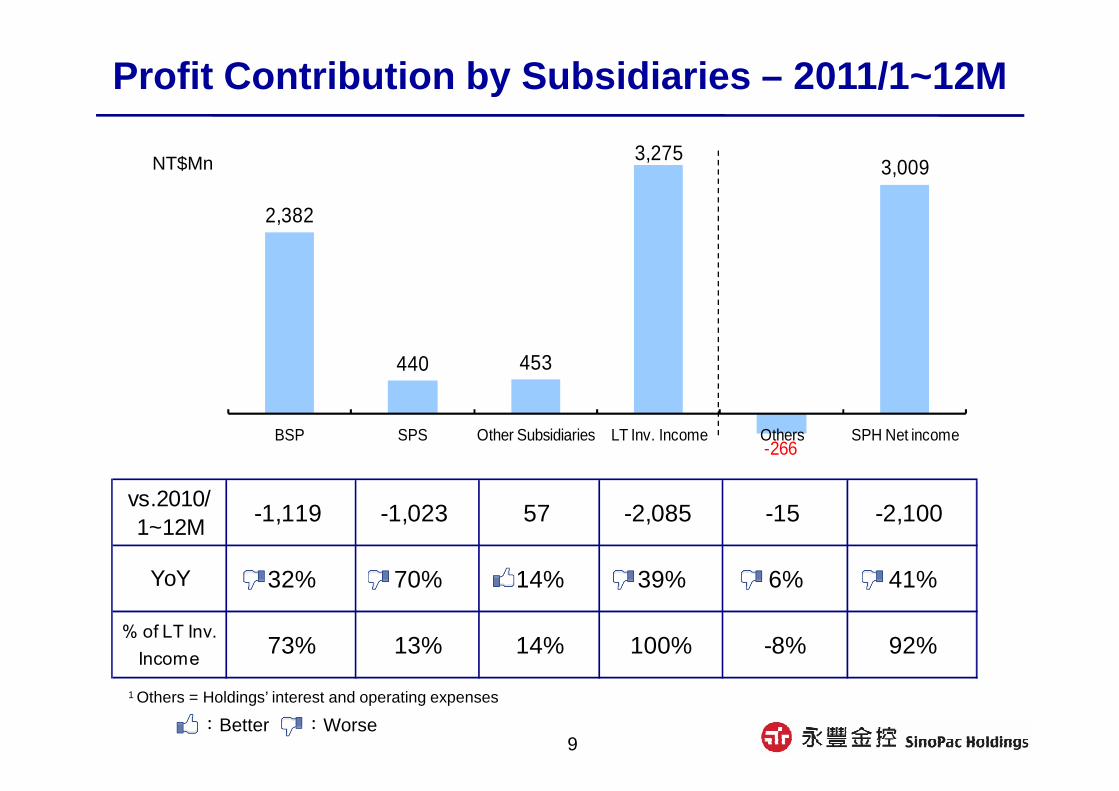
2,382
440 453
3,2753,009NT$Mn
Profit Contribution by Subsidiaries – 2011/1~12M
9
vs.2010/1~12M
-1,119 -1,023 57 -2,085 -15 -2,100
YoY 32% 70% 14% 39% 6% 41%
% of LT Inv.Income 73% 13% 14% 100% -8% 92%
-266BSP SPS Other Subsidiaries LT Inv. Income Others SPH Net income
1 Others = Holdings’ interest and operating expenses
:Better :Worse
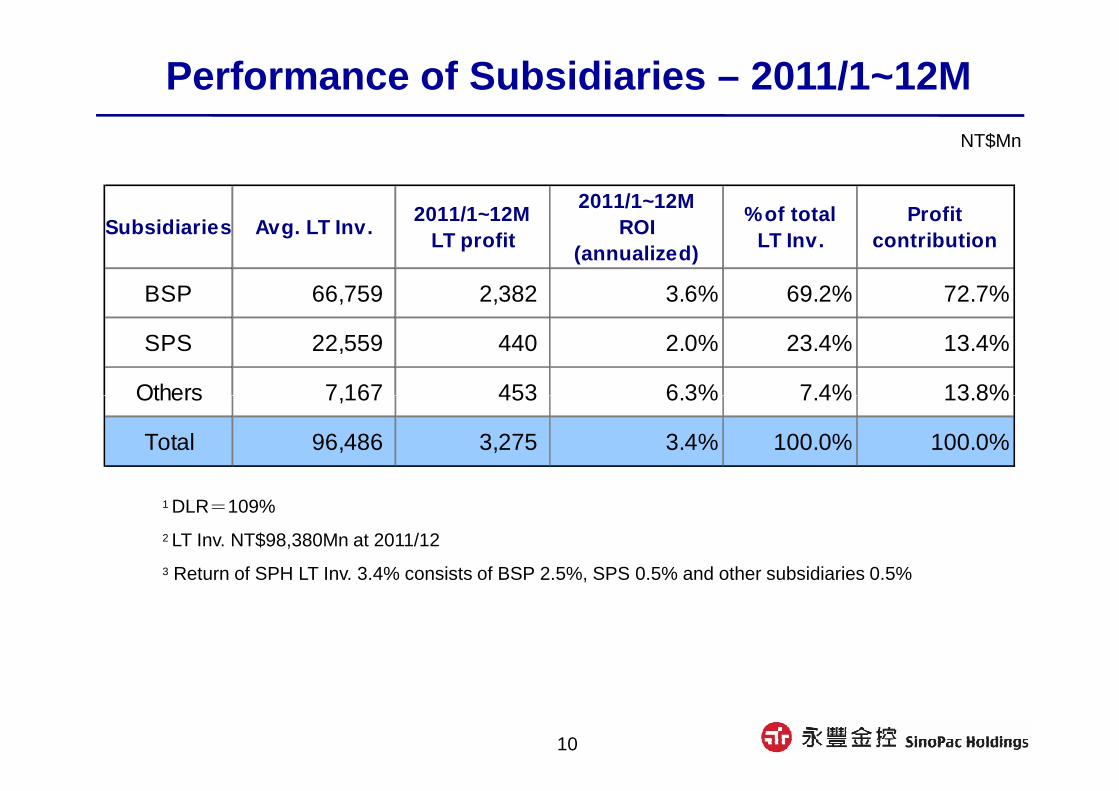
Performance of Subsidiaries – 2011/1~12MNT$Mn
Subsidiaries Avg. LT Inv.2011/1~12M
LT profit
2011/1~12MROI
(annualized)
% of totalLT Inv.
Profitcontribution
BSP 66,759 2,382 3.6% 69.2% 72.7%
SPS 22,559 440 2.0% 23.4% 13.4%
Others 7,167 453 6.3% 7.4% 13.8%
10
1 DLR=109%
2 LT Inv. NT$98,380Mn at 2011/12
3 Return of SPH LT Inv. 3.4% consists of BSP 2.5%, SPS 0.5% and other subsidiaries 0.5%
Others 7,167 453 6.3% 7.4% 13.8%
Total 96,486 3,275 3.4% 100.0% 100.0%

BSP Financial Highlights – 2011/4Q
NT$Mn 2010/4Q 2011/1Q 2011/2Q 2011/3Q 2011/4Q QoQ YoY
Total equity 65,955 67,296 70,055 70,986 70,516 -0.7% 6.9%
Total assets 1,106,894 1,116,865 1,138,414 1,161,125 1,182 ,173 1.8% 6.8%
Net income 660 1,290 1,446 877 -1,231 -240% -287%
EPS(NT$) 0.14 0.26 0.29 0.17 -0.23 -0.40 -0.37
Total deposits 919,105 927,318 949,915 964,233 974,333 1.0% 6.0%
Total loans 695,675 713,735 720,452 719,676 719,402 0.0% 3. 4%
L-to-D ratio 77.5% 77.9% 77.0% 75.4% 74.7% -0.7% -2.9%
11
1 Average of month-end balance used in calculation of ROAA, ROAE and Leverage
L-to-D ratio 77.5% 77.9% 77.0% 75.4% 74.7% -0.7% -2.9%
NPL ratio 0.52% 0.49% 0.38% 0.44% 0.47% 0.03% -0.05%
Coverage ratio 145.77% 150.56% 188.03% 171.79% 212.17% 40% 66%
Reserve-to-loan ratio 0.75% 0.73% 0.71% 0.76% 1.00% 0.24% 0.25%
BIS Ratio 11.90% 11.44% 11.58% 12.49% 13.17% 0.68% 1.27%
Tier 1 Ratio 8.89% 8.71% 9.14% 9.06% 8.86% -0.20% -0.03%
ROAA 0.24% 0.46% 0.51% 0.30% -0.42% -0.72% -0.66%
ROAE (Annualized) 3.99% 7.71% 8.40% 4.96% -6.91% -11.87% -10.90%
Leverage 16.63 16.76 16.47 16.53 16.45 -0.08 -0.17

BSP Financial Highlights – 2011/1~12M
NT$Mn 2010/1~12M 2011/1~12M +/- YoY
Total equity 65,955 70,516 4,561 6.9%
Total assets 1,106,894 1,182,173 75,279 6.8%
Net income 3,501 2,382 -1,119 -32%
EPS(NT$) 0.72 0.47 -0.25 -0.25
Total deposits 919,105 974,333 55,228 6.0%
Total loans 695,675 719,402 23,727 3.4%
L-to-D ratio 77.54% 74.67% -2.9% -2.9%
12
1 Average of month-end balance used in calculation of ROAA, ROAE and Leverage
L-to-D ratio 77.54% 74.67% -2.9% -2.9%
NPL ratio 0.52% 0.47% -0.05% -0.05%
Coverage ratio 145.77% 212.17% 66% 66%
Reserve-to-loan ratio 0.75% 1.00% 0.25% 0.25%
BIS Ratio 11.90% 13.17% 1.27% 1.27%
Tier 1 Ratio 8.89% 8.86% -0.03% -0.03%
ROAA 0.33% 0.21% -0.12% -0.12%
ROAE (Annualized) 5.44% 3.43% -2.01% -2.01%
Leverage 16.48 16.33 -0.15 -0.15
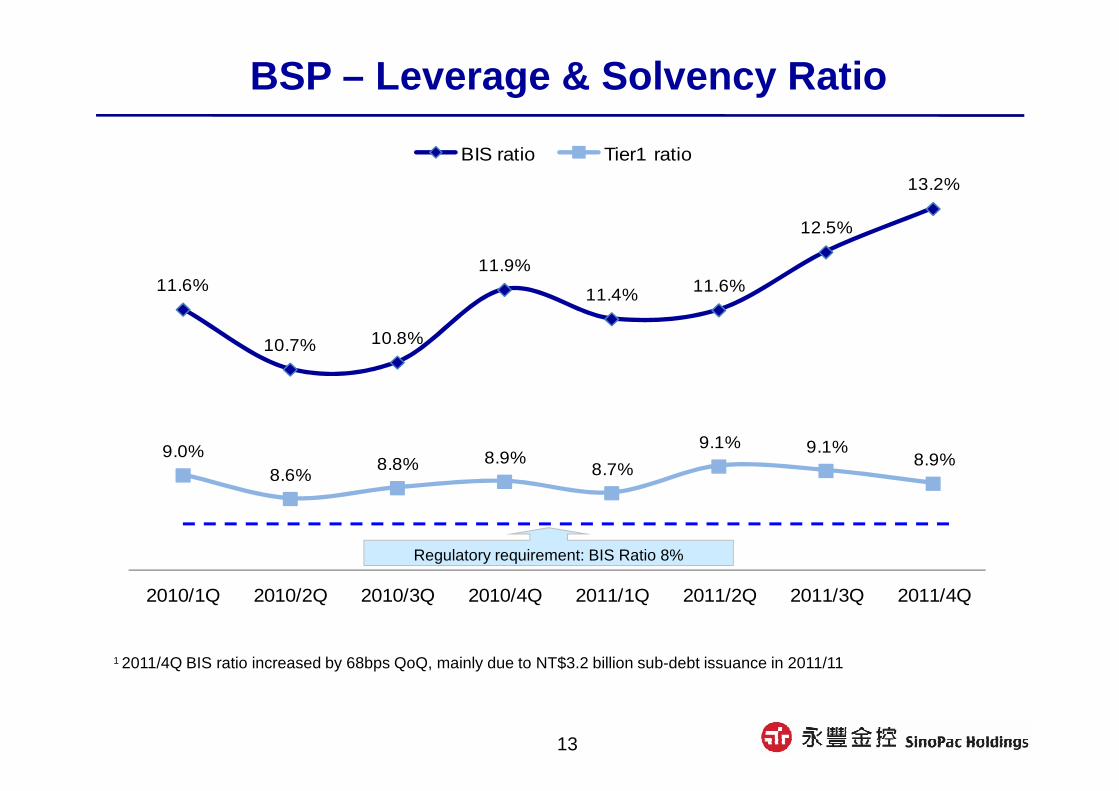
11.6%
10.7% 10.8%
11.9%
11.4% 11.6%
12.5%
13.2%
BIS ratio Tier1 ratio
BSP – Leverage & Solvency Ratio
13
9.0%8.6%
8.8% 8.9%8.7%
9.1% 9.1%8.9%
2010/1Q 2010/2Q 2010/3Q 2010/4Q 2011/1Q 2011/2Q 2011/3Q 2011/4Q
Regulatory requirement: BIS Ratio 8%
1 2011/4Q BIS ratio increased by 68bps QoQ, mainly due to NT$3.2 billion sub-debt issuance in 2011/11

BSP Balance Sheet Breakdown – 2011/4QNT$Mn
Amount % Amount %
Due from central bank and other banks 73,672 6% Due to central bank and other banks 54,360 5%Loans: Deposits:
Corporates 352,440 30% NTD* 809,936 69%Individuals 366,962 31% FCD 164,397 14%
719,402 61% 974,333 82%Marketable securities 287,551 24% Bonds payable 37,028 3%Others 51,075 4% Others 20,126 2%
1,131,700 96% 1,085,847 92%
2011/4Q 2011/4QInterest earning assets Interest bearing liabilities
Sub-total Sub-total
14
50,473 4% 25,810 2%
1,111,657 94%
70,516 6%
1,182,173 100% 1,182,173 100%
*NTD deposits include redeposit from the Dirctorate general of postal remittance.
Total assets Liabilities and Shareholders' equity
Non-Interest earning assets Non-Interest bearing liabilities
Total liabilities
Shareholders' equity

BSP – Credit Portfolio Breakdown
授信總額授信總額授信總額授信總額
QoQ
-0.8%
4.4%
YTD
3.3%
10.2%
0.2% 0.3%
NT$Mn
710,591 738,114 755,715 736,170 756,535 776,416 782,402 787,394 781,404
352,752 356,698 361,963 358,629
351,854 347,778 346,448 351,556 352,617
17,568 16,651 16,451
15,792 16,338
15,571 16,843 17,246 18,001
信用卡
個金-房貸
Credit card
Mortgage
Total
15
1 Corporate loan amount excludes marketable securities purchased
6.4%
-2.5%
-0.8%
38.6%
3.6%
5.3%
82,627 87,011 90,077 89,665 88,000 89,250 90,731 91,914 91,128
243,149 263,867 273,299 259,318 289,813 313,172 316,161 312,953 305,058
14,495 13,887 13,924 12,767
10,530 10,645 12,219 13,724 14,599
2009/Q4 2010/Q1 2010/Q2 2010/Q3 2010/Q4 2011/Q1 2011/Q2 2011/Q3 2011/Q4
個金-其他
企金-非中
小企業
企金-中小
企業
Retail-others
Non-SME
SME

“Go Life Card” launched in 2011/08, boosting total cards in force up to 2.18Mn by 2011/12.
BSP now ranks sixth largest credit card issuer in the market
BSP – Credit Card Business
17,061 17,130 18,859
20,968 23,220
3.7%
0.4%
10.1%11.2% 10.7%
Total consumption (NT$Mn) Total consumption QoQ
7,001 6,739 6,236 5,964 5,772
16,338 15,571
16,843 17,246 18,001
Revolving balance (NT$Mn) A/R (NT$Mn)
16
1 Average spending per card = Total consumption / Average number of active cards2 Average spending per card trended downwards since 2011/3Q due to launch of Go Life Card in 2011/08, which increased number of cards rapidly while consumption benefits will not be realized until later months
19,358 18,797 19,159 17,538 17,426
10/4Q 11/1Q 11/2Q 11/3Q 11/4Q
Avg. spending per Card (NT$)
10/4Q 11/1Q 11/2Q 11/3Q 11/4Q
886,540 921,495 1,019,041
1,302,970 1,344,938 1,433,176 1,649,935
1,816,754
2,132,497 2,178,989
10/4Q 11/1Q 11/2Q 11/3Q 11/4Q
Active cards Cards in force10/4Q 11/1Q 11/2Q 11/3Q 11/4Q

2011/4Q
2011/3Q
BSP P&L Breakdown – 2011/Q4NT$Mn
3,192
-1,231
-2,707
-2,068
351
Net profit Op exp Provision Tax Net loss
17
2011/3Q
QoQ 23.3% 5.9% 561.8% 240.4%
:Better :Worse
524.8%
-1,231 3514,160
877
-2,876
-331-76
Net profit Op exp Provision Tax Net income

15,999
2,382
-10,761
-2,625
-230
Net profit Op exp Provision Tax Net income
2011/1~12M NT$Mn
BSP P&L Breakdown – 2011/1~12M
18
16,570
3,501
-9,636
-2,572
-862
Net profit Op exp Provision Tax Net income
Net profit Op exp Provision Tax Net income
2010/1~12M
YoY 3.4% 11.7% 73.3% 32.0%2.1%
:Better :Worse

BSP – Net Profit BreakdownNT$Mn
2,979 3,111 3,152 3,307 3,328
4,289 4,259 4,387 4,160
3,192 3,000
4,000
5,000
Net interest income Net fee income* Marketable securities Derivatives Others Net prof it
19
1 Fee income includes life and property insurance
1,238 984 1,116 1,080
813
100
-23 -7 -125
145 291 215 308 112 321
-319 -28 -182 -214
-1,415 -2,000
-1,000
0
1,000
2,000
2010/4Q 2011/1Q 2011/2Q 2011/3Q 2011/4Q
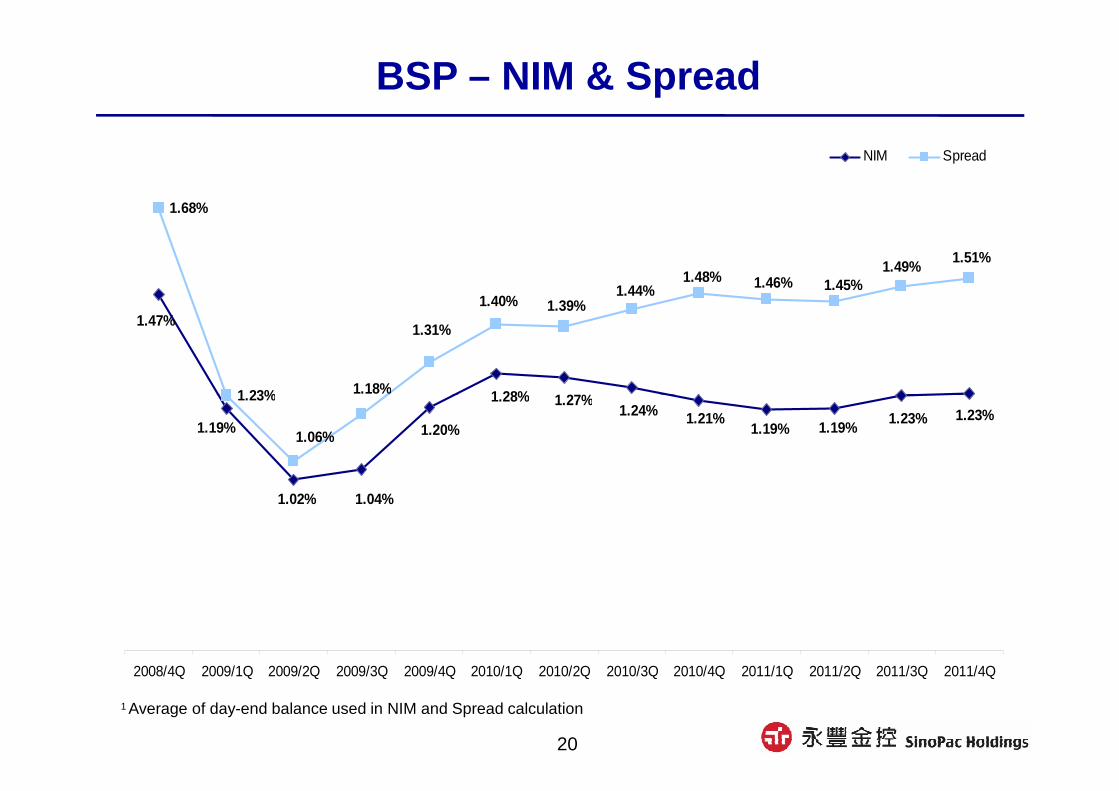
BSP – NIM & Spread
1.68%
1.23%
1.47%
1.28% 1.27%1.18%
1.31%
1.40% 1.39%1.44%
1.48% 1.46% 1.45%1.49%
1.51%
NIM Spread
20
1.23%
1.19%
1.02% 1.04%
1.20%
1.28% 1.27%1.24% 1.21%
1.19% 1.19%1.23% 1.23%
1.06%
1.18%
2008/4Q 2009/1Q 2009/2Q 2009/3Q 2009/4Q 2010/1Q 2010/2Q 2010/3Q 2010/4Q 2011/1Q 2011/2Q 2011/3Q 2011/4Q
1 Average of day-end balance used in NIM and Spread calculation

Source of NFI2011/4Q Net fee income
BSP – Fee Income BreakdownNT$Mn
WMInsurance214
159
71 38
81 38
17
21
WM26%
Loan8%
A/R5%
Import/Export10%Trust & custodian
bank4%
Gurantee & acceptances
2%
Credit card19%
Insurance26%
1 Operating expenses associated with fee income are excluded
217
214
835
WM Insurance Credit card Loan Trust & custodian
Export/Import A/R Guarantee & acceptances
Net fee income

BSP – Fee Income BreakdownNT$Mn
A/R
Loan
2010/4Q1,257 1,257
2011/1Q1,141 1,000
2011/2Q1,203 1,135
2011/3Q1,229 1,097
2011/4Q888 835
258132
47
464377
7984
41
35
4140
84
17
1817
18
17
Trust & custodian bank
QoQ YoY-27.7% -29.3%
Net fee income
Ex. Impact from SFAS 34
Import/Export
Guarantee & acceptances
22
Insurance
WM
Credit card
491
336 380314
217
178
217
295302
141
128
144149
141
13214848
38
214
159
71
8138
17
2010/4Q 2011/1Q 2011/2Q 2011/3Q 2011/4Q
1 Operating expenses associated with fee income are excluded

4,289 4,259 4,387 4,1603,192
16,570 15,999
9,63610,76157.18%
66.38%
Net profit Op exp CI Ratio
BSP – Operating Expense BreakdownNT$Mn
23
2,590 2,463 2,715 2,876 2,707
2010/4Q 2011/1Q 2011/2Q 2011/3Q 2011/4Q 2010 2011
Payroll Dep. & Amort. Non-payroll

BSP – Asset QualityNPL (NT$Mn) NPL ratio
24
Coverage ratioReserve (NT$Mn)

BSP (Credit Card) – Asset Quality
NPL (NT$Mn) NPL ratio
25
Reserve (NT$Mn) Coverage ratio
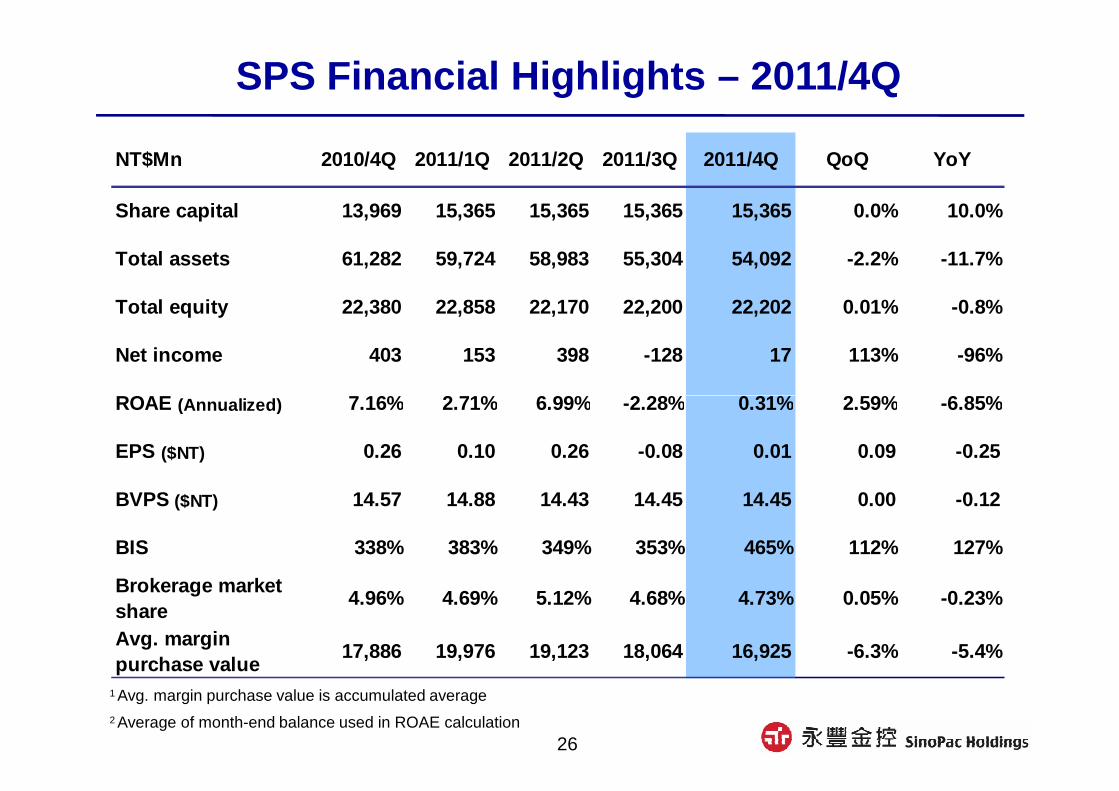
SPS Financial Highlights – 2011/4Q
NT$Mn 2010/4Q 2011/1Q 2011/2Q 2011/3Q 2011/4Q QoQ YoY
Share capital 13,969 15,365 15,365 15,365 15,365 0.0% 10.0 %
Total assets 61,282 59,724 58,983 55,304 54,092 -2.2% -11. 7%
Total equity 22,380 22,858 22,170 22,200 22,202 0.01% -0.8 %
Net income 403 153 398 -128 17 113% -96%
ROAE (Annualized) 7.16% 2.71% 6.99% -2.28% 0.31% 2.59% -6.85%
26
ROAE (Annualized) 7.16% 2.71% 6.99% -2.28% 0.31% 2.59% -6.85%
EPS ($NT) 0.26 0.10 0.26 -0.08 0.01 0.09 -0.25
BVPS ($NT) 14.57 14.88 14.43 14.45 14.45 0.00 -0.12
BIS 338% 383% 349% 353% 465% 112% 127%
Brokerage marketshare
4.96% 4.69% 5.12% 4.68% 4.73% 0.05% -0.23%
Avg. marginpurchase value
17,886 19,976 19,123 18,064 16,925 -6.3% -5.4%
1 Avg. margin purchase value is accumulated average2 Average of month-end balance used in ROAE calculation

SPS Financial Highlights – 2011/1~12M
NT$Mn 2010/1~12M 2011/1~12M +/- YoY
Share capital 13,969 15,365 1,396 10.0%
Total assets 61,282 54,092 -7,190 -11.7%
Total equity 22,380 22,202 -178 -0.8%
Net income 1,463 440 -1,023 -69.9%
ROAE 6.58% 1.95% -4.63% -4.63%
27
1 Avg. margin purchase value is accumulated average2 Average of month-end balance used in ROAE calculation
ROAE (Annualized) 6.58% 1.95% -4.63% -4.63%
EPS ($NT) 0.95 0.29 -0.67 -0.67
BVPS ($NT) 14.57 14.45 -0.12 -0.12
BIS 338% 465% 127% 127%
Brokerage marketshare
4.83% 4.80% -0.03% -0.03%
Avg. marginpurchase value
17,886 16,925 -961 -5.4%

748
17
-712
-19
淨收益 營業費用 所得稅 淨利
SPS P&L Breakdown – 2011/4Q
2011/4Q NT$Mn
Net profit Op exp Tax Net income
28
622
43
-793
-128
Net profit Op exp Tax Net loss
QoQ 20.3% 10.3% 143.6% 113.4%
2011/3Q
:Better :Worse

3,556
440
-2,996
-120
淨收益 營業費用 所得稅 淨利
2011/1~12M NT$Mn
SPS P&L Breakdown – 2011/1~12M
Net profit Op exp Tax Net income
29
4,776
1,463
-3,105
-208
淨收益 營業費用 所得稅 淨利
淨收益 營業費用 所得稅 淨利
2010/1~12M
YoY 25.5% 3.9% 42.3% 69.9%
Net profit Op exp Tax Net income
:Better :Worse

812
703 678
264 302 285 270 232
743
543
293
1,433
952
1,235
622
748
400
800
1,200
1,600
手續費收入 有價證券損益 衍生性商品損益 投資損益
其他淨收益 淨利息收入 淨收益
SPS Net Profit Breakdown – 2011/4QNT$MnFee income
Others Interest income
Marketable securities
Net profit
Derivatives Investment
30
-188
33 -6 35 18
128 103 72
-213
29 -248
-18
8
232
-197
-89
158
-93
36
-400
0
2010/4Q 2011/1Q 2011/2Q 2011/3Q 2011/4Q
2010/4Q 2011/1Q 2011/2Q 2011/3Q 2011/4Q
市場日均量(億) 1,421 1,534 1,289 1,350 942
大盤指數 8,973 8,683 8,653 7,225 7,102
Marketable securities income includes handling fee ; Derivatives income includes fee from clearing and settlement services
Avg. daily trading volume (NT$Bn)
TAIEX
142.1 153.4 128.9 135.0 94.2
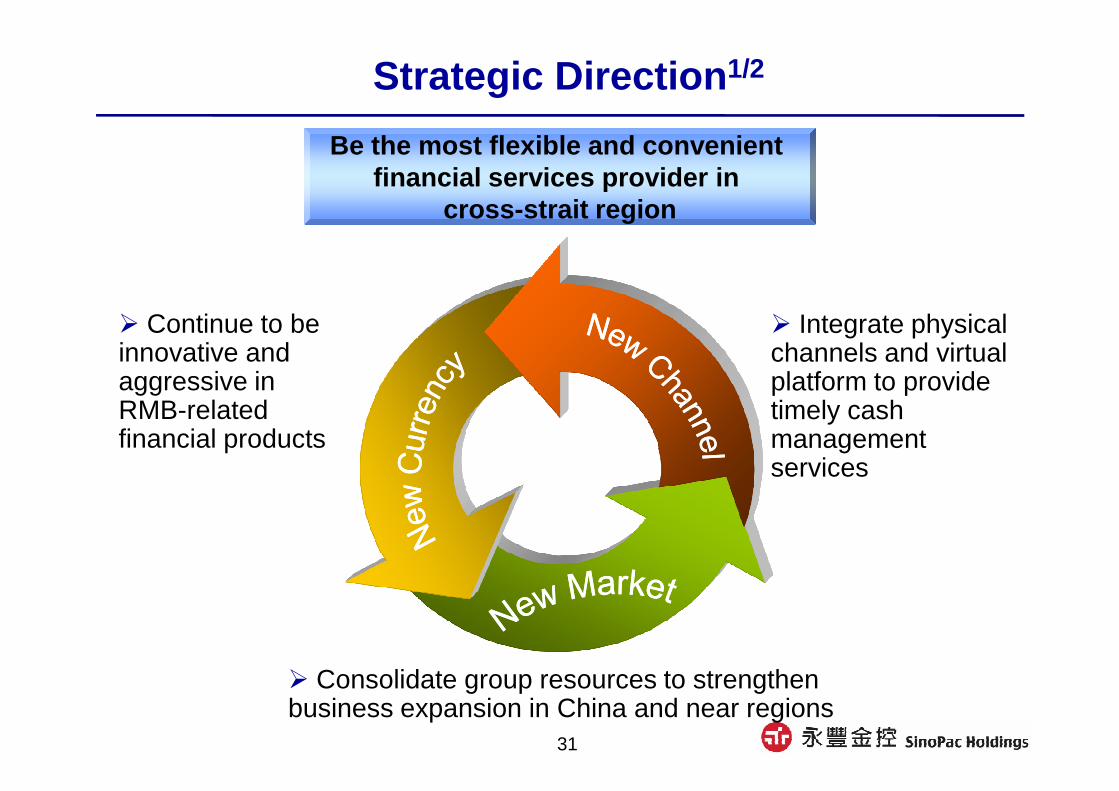
Strategic Direction 1/2
� Integrate physical channels and virtual platform to provide timely cash
Be the most flexible and convenient financial services provider in
cross-strait region
� Continue to be innovative and aggressive in RMB-related
31
platform to provide timely cash management services
� Consolidate group resources to strengthen business expansion in China and near regions
aggressive in RMB-related financial products
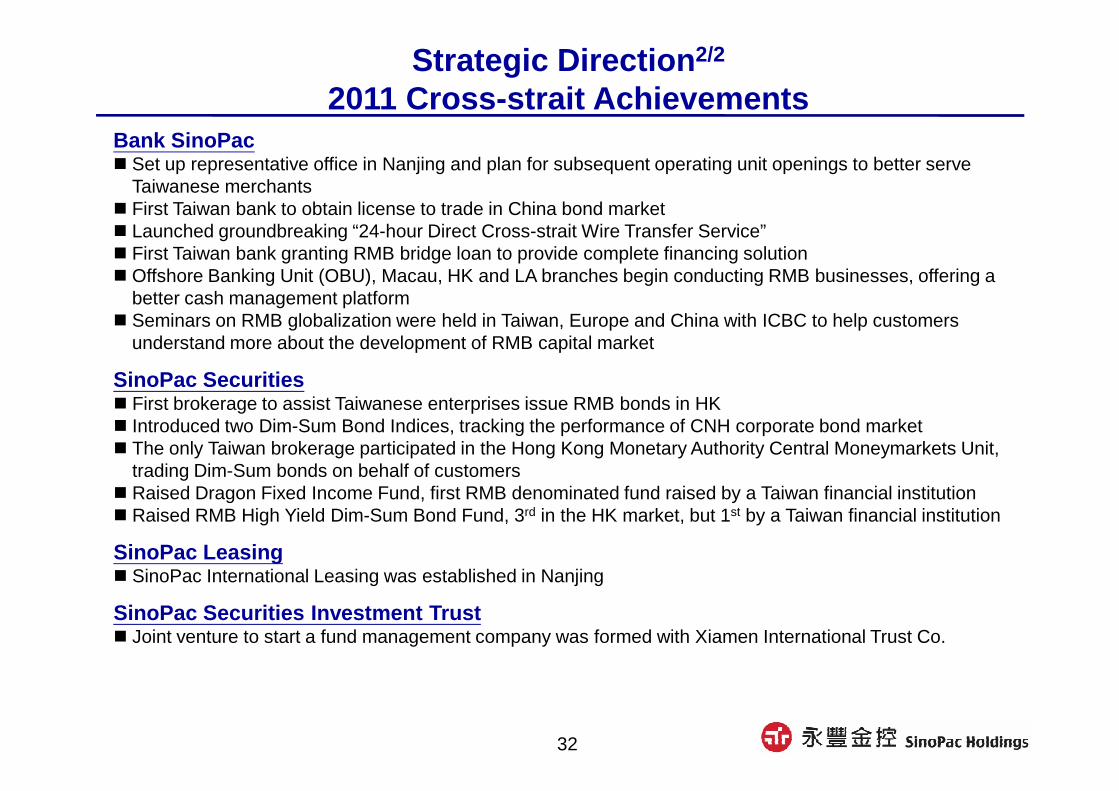
Bank SinoPac� Set up representative office in Nanjing and plan for subsequent operating unit openings to better serve
Taiwanese merchants � First Taiwan bank to obtain license to trade in China bond market � Launched groundbreaking “24-hour Direct Cross-strait Wire Transfer Service” � First Taiwan bank granting RMB bridge loan to provide complete financing solution� Offshore Banking Unit (OBU), Macau, HK and LA branches begin conducting RMB businesses, offering a
better cash management platform� Seminars on RMB globalization were held in Taiwan, Europe and China with ICBC to help customers
understand more about the development of RMB capital market
SinoPac Securities� First brokerage to assist Taiwanese enterprises issue RMB bonds in HK
Strategic Direction 2/2
2011 Cross-strait Achievements
32
� First brokerage to assist Taiwanese enterprises issue RMB bonds in HK� Introduced two Dim-Sum Bond Indices, tracking the performance of CNH corporate bond market � The only Taiwan brokerage participated in the Hong Kong Monetary Authority Central Moneymarkets Unit,
trading Dim-Sum bonds on behalf of customers� Raised Dragon Fixed Income Fund, first RMB denominated fund raised by a Taiwan financial institution� Raised RMB High Yield Dim-Sum Bond Fund, 3rd in the HK market, but 1st by a Taiwan financial institution
SinoPac Leasing � SinoPac International Leasing was established in Nanjing
SinoPac Securities Investment Trust � Joint venture to start a fund management company was formed with Xiamen International Trust Co.
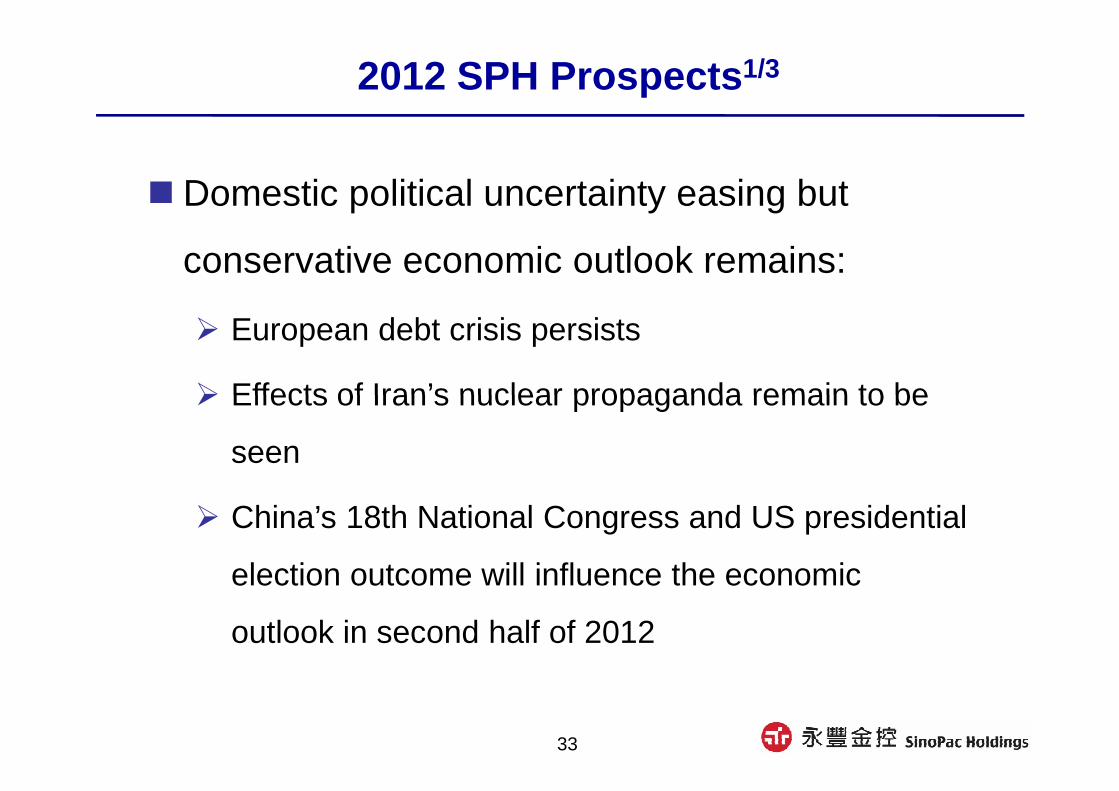
2012 SPH Prospects 1/3
� Domestic political uncertainty easing but
conservative economic outlook remains:
� European debt crisis persists
� Effects of Iran’s nuclear propaganda remain to be
33
� Effects of Iran’s nuclear propaganda remain to be
seen
� China’s 18th National Congress and US presidential
election outcome will influence the economic
outlook in second half of 2012

2012 SPH Prospects 2/3
2015Outstanding performance
• Continue “five year plan”• Implement localization and increase community penetration • Combine physical and virtual channels to provide customers with convenient financial services
• Most flexible and convenient financial services provider in cross-strait region
34
2011Focus, invest
2012Integration, innovation
• Initiate “five year plan”• Prepare for cross-strait operations and explore RMB business opportunities• Develop electronic banking platform
with convenient financial services • Integrated promotion to increase business cooperation between subsidiaries and optimize group resources• Enhance leasing operations in China to increase profit contribution• Continue product innovation and maintain leading position in RMB businesses• Optimize operating procedures and platforms, fulfill legal requirements and improve operation efficiency

2012 SPH Prospects 3/3
� Aggressive measures taken to improve asset quality in 2011
� NPL ratio: 7.40%
� Coverage ratio: 140.19%
� BIS ratio: 20.13%
FENB
35
� No longer a financial burden to the Holdings company
� 2012 focus:
� Strengthen human resources
� Cautiously re-launch commercial real estate loan business and cultivate new corporate clients

Steady business growth and improve profitability
2012 BSP Prospects 1/3
Integration Establish customer-centric sales service platform
1
2
36
Innovation Understand customer needs and grow through innovation
2
ConcentrationFocus on profitable products, implement localization and improve channel value
3
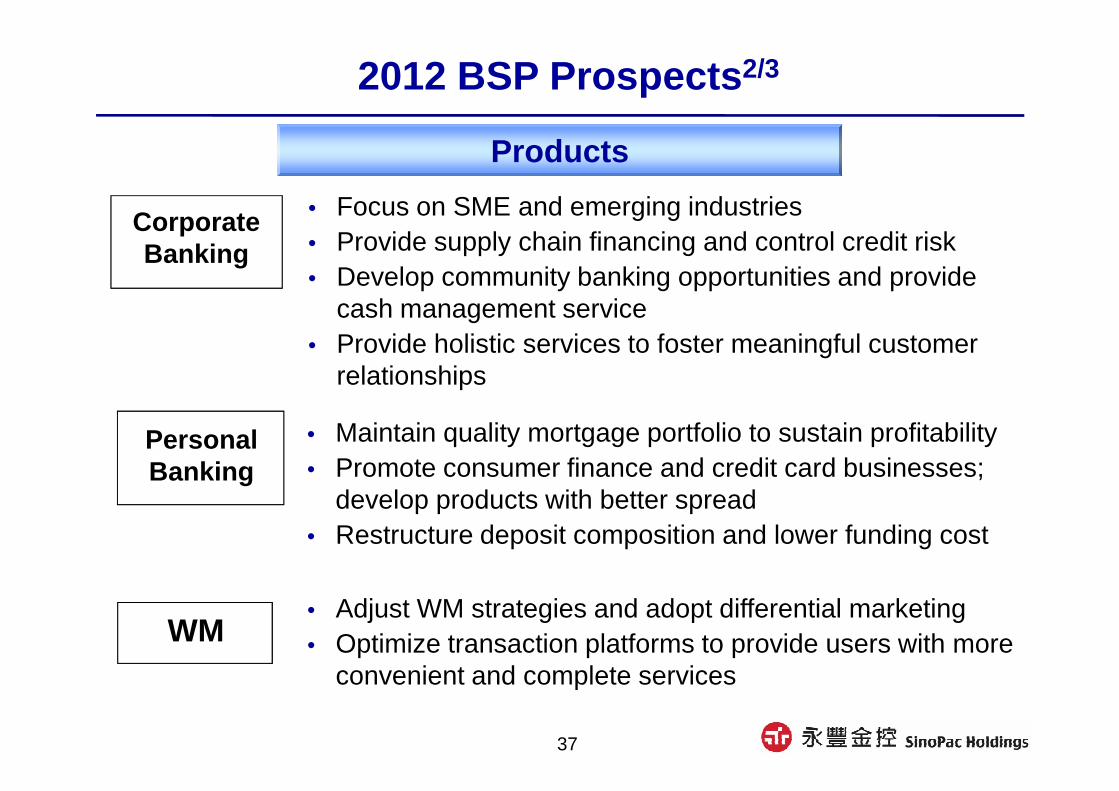
2012 BSP Prospects 2/3
Products
Corporate Banking
• Focus on SME and emerging industries• Provide supply chain financing and control credit risk• Develop community banking opportunities and provide
cash management service• Provide holistic services to foster meaningful customer
relationships
37
Personal Banking
WM
• Maintain quality mortgage portfolio to sustain profitability • Promote consumer finance and credit card businesses;
develop products with better spread • Restructure deposit composition and lower funding cost
• Adjust WM strategies and adopt differential marketing • Optimize transaction platforms to provide users with more
convenient and complete services

2012 BSP Prospects 3/3
Channels
• Implement localization, cultivate regional distinctions and promote integrated marketing to improve channel value
• Increase community banking penetration
Capture channel value
38
• Prepare for cross-strait and overseas potentials and capture RMB business opportunities
• Increase ATM coverage
• Combine physical and virtual platforms to provide customers with convenient financial services
• Integrate Holdings’ channels for comprehensive financial services
Integrated services

2012 SPS Prospects
Build upon current achievements, enhance profits
� Continue to gain market share by expanding institutional businesses
and strengthening cross-selling platform
� Provide integrated underwriting services to improve market share
39
� Focus on directional trading and seek absolute returns
� Maintain leading position with innovative strategy in RMB bond market
� Strengthen domestic and international channels and products to
provide integrated services

Appendix
Appendix
40
Appendix
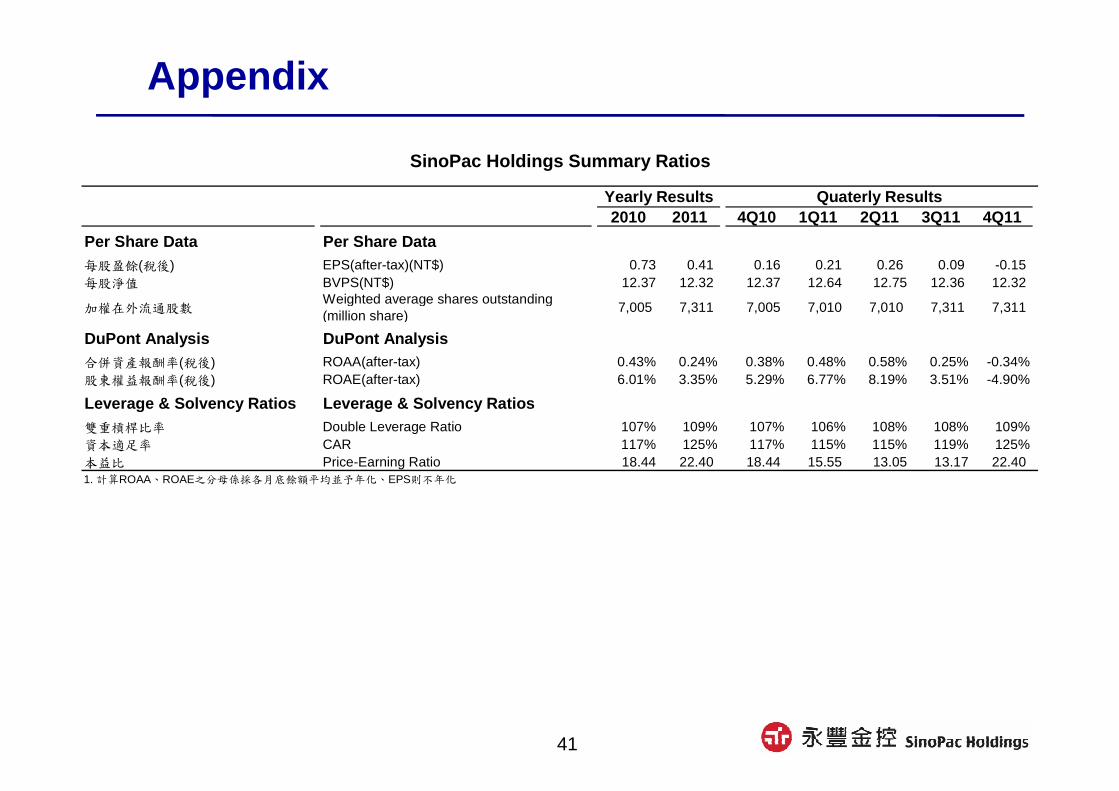
2010 2011 4Q10 1Q11 2Q11 3Q11 4Q11
Per Share Data Per Share Data每股盈餘(稅後) EPS(after-tax)(NT$) 0.73 0.41 0.16 0.21 0.26 0.09 -0.15每股淨值 BVPS(NT$) 12.37 12.32 12.37 12.64 12.75 12.36 12.32
加權在外流通股數Weighted average shares outstanding(million share)
7,005 7,311 7,005 7,010 7,010 7,311 7,311
DuPont Analysis DuPont Analysis
合併資產報酬率(稅後) ROAA(after-tax) 0.43% 0.24% 0.38% 0.48% 0.58% 0.25% -0.34%股東權益報酬率(稅後) ROAE(after-tax) 6.01% 3.35% 5.29% 6.77% 8.19% 3.51% -4.90%
Leverage & Solvency Ratios Leverage & Solvency Ratios
SinoPac Holdings Summary Ratios
Yearly Results Quaterly Results
41
Leverage & Solvency Ratios Leverage & Solvency Ratios雙重槓桿比率 Double Leverage Ratio 107% 109% 107% 106% 108% 108% 109%資本適足率 CAR 117% 125% 117% 115% 115% 119% 125%本益比 Price-Earning Ratio 18.44 22.40 18.44 15.55 13.05 13.17 22.401. 計算ROAA、ROAE之分母係採各月底餘額平均並予年化、EPS則不年化

Appendix
2010 2011 4Q10 1Q11 2Q11 3Q11 4Q11
Per Share Data Per Share Data
每股盈餘(稅後) EPS(after-tax)(NT$) 0.72 0.47 0.14 0.26 0.29 0.17 -0.23
DuPont Analysis DuPont Analysis
資產報酬率(稅後) ROAA(after-tax) 0.33% 0.21% 0.24% 0.46% 0.51% 0.30% -0.42%股東權益報酬率(稅後) ROAE(after-tax) 5.44% 3.43% 3.99% 7.71% 8.40% 4.96% -6.91%
Growth Ratios Growth Ratios
利息淨收益成長率 NII growth 22.05% 7.36% -4.52% 4.39% 1.33% 1.33% 0.63%手續費淨收益成長率 Fee growth 20.34% -12.60% 22.05% -27.61% 7.03% 7.03% -28.71%
Bank SinoPac Summary Ratios
Yearly Results Quarterly Results
42
手續費淨收益成長率 Fee growth 20.34% -12.60% 22.05% -27.61% 7.03% 7.03% -28.71%淨收益成長率 Net profit growth 11.48% -3.45% -3.32% -0.94% 3.00% 3.00% -23.25%總放款成長率 Loan growth 5.80% 3.41% 2.46% 2.60% 0.94% -0.11% -0.04%總存款成長率 Deposit growth 10.87% 6.01% 4.01% 0.89% 2.44% 1.51% 1.05%
Performance Ratios Performance Ratios
存放比 Loan-to-Deposit Ratio 77.46% 74.67% 77.46% 77.91% 76.98% 75.36% 74.67%利差 Spread 1.43% 1.48% 1.48% 1.46% 1.45% 1.49% 1.51%淨利差 NIM 1.25% 1.21% 1.21% 1.19% 1.19% 1.23% 1.23%費用比 Cost/Income Ratio (%) 57.18% 66.38% 59.31% 56.84% 60.97% 68.30% 84.24%
Asset Quality Ratios Asset Quality Ratios
逾放比 NPLs / Total loans 0.52% 0.47% 0.52% 0.49% 0.38% 0.44% 0.47%備抵呆帳覆蓋率 Coverage ratio 145.77% 212.17% 145.77% 150.56% 188.03% 171.79% 212.17%
Leverage & Solvency Ratios Leverage & Solvency Ratio s
資本適足率 BIS 11.90% 13.17% 11.90% 11.44% 11.58% 12.49% 13.17%第一類資本比率 Tier 1 Ratio 8.89% 8.86% 8.89% 8.71% 9.14% 9.06% 8.86%1. 計算ROAA、ROAE之分母係採各月底餘額平均並予年化、EPS則不年化
2. 計算Spread及NIM的分母,採當季每日餘額平均計算

Appendix
4q10 4q11
2010 2011 4Q10 1Q11 2Q11 3Q11 4Q11
Per Share Data Per Share Data
每股盈餘(稅後)(元) EPS(after-tax)(NT$) 0.95 0.29 0.26 0.10 0.26 -0.08 0.01
DuPont Analysis DuPont Analysis
資產報酬率(稅後)ROAA(after-tax)(%, annualize)
2.70% 0.75% 2.69% 1.02% 2.62% -0.88% 0.12%
股東權益報酬率(稅後)ROAE(after-tax)(%, annualize)
6.58% 1.95% 7.16% 2.71% 6.99% -2.28% 0.31%
Performance Ratios Performance Ratios
SinoPac Securities Summary Ratios
Yearly Results Quarterly Results
43
Performance Ratios Performance Ratios
日平均融資餘額(百萬元)Avg. margin purchasevalue(NT$m)
17,886 16,925 17,886 19,976 19,123 18,064 16,925
經紀業務市佔率 Brokerage market share (%) 4.83% 4.80% 4.96% 4.69% 5.12% 4.68% 4.73%
費用比 Cost/Income Ratio (%) 64.77% 69.93% 73.57% 58.03% 62.03% 92.20% 76.25%
Leverage & Solvency Ratios Leverage & Solvency Ratios
資本適足率 BIS 338% 465% 338% 383% 349% 353% 465%
1. 日平均融資餘額(百萬元)及資本適足率係為當年度累計至該月之資訊
2. 資產報酬率(稅後)和股東權益報酬率(稅後)之平均總資產及平均股東權益係採月加權平均計算。

Appendix
US$mn2010 2011 4Q10 1Q11 2Q11 3Q11 4Q11
稅後淨利 Net income after tax -41 -76 -4 -8 1 -14 -55總資產 Total assets 1,651 1,398 1,651 1,614 1,578 1,568 1398淨值 Total equity 315 292 315 336 358 344 292總存款 Total deposits 1,207 1,082 1,207 1,103 1,079 998 1082總放款 Total loans 918 665 918 867 808 711 665
Per Share Data Per Share Data
每股盈餘(稅後) EPS(after-tax)(US$) -178 -330 -17 -33 1 -61 -237
DuPont Analysis DuPont Analysis
FENB Summary Ratios
Yearly Results Quarterly Results
44
DuPont Analysis DuPont Analysis
資產報酬率(稅後)ROAA(after-tax)(%, annualize YTD earnings)
-2.27% -4.75% -0.23% -1.92% 0.03% -1.16% -3.66%
股東權益報酬率(稅後)ROAE(after-tax)(%, annualize YTD earnings)
-15.61% -22.65% -1.35% -10.00% 0.17% -5.24% -16.45%
存放比 Loan-to-Deposit Ratio (%) 76.11% 61.50% 76.11% 78.64% 74.93% 71.28% 61.50%
利差 Spread (%) 3.41% 3.88% 3.75% 3.86% 3.73% 3.64% 4.37%
淨利差 NIM (%) 2.61% 2.60% 2.80% 2.53% 2.35% 2.63% 3.30%費用比 Cost/Income Ratio (%) 97.03% 163.44% 106.02% 106.25% 134.10% 100.16% 487.34%
Asset Quality Ratios Asset Quality Ratios
逾放比 NPLs / Total loans (%) 11.16% 7.40% 11.16% 16.96% 16.06% 12.70% 7.40%備抵呆帳覆蓋率 Reserve / NPLs (%) 78.89% 140.19% 78.89% 55.09% 52.75% 64.85% 140.19%當期打銷呆帳 Write-off (US$) 61 66 12 8 7 25 26Leverage & Solvency Ratios Leverage & Solvency Ratios資本適足率 BIS (%) 20.99% 20.13% 20.99% 19.93% 21.26% 20.58% 20.13%第一類資本比率 Tier 1 Ratio (%) 19.66% 18.81% 19.66% 18.62% 19.95% 19.28% 18.81%

Appendix
NT$Mn 銀行合併銀行合併銀行合併銀行合併 證券合併證券合併證券合併證券合併 投信投信投信投信 租賃租賃租賃租賃 其他項目其他項目其他項目其他項目 合計合計合計合計 調整項目調整項目調整項目調整項目 金控合併金控合併金控合併金控合併BSP SPS Trust Leasing Others Sum Adj. Items SPH
資產資產資產資產 Assets:現金及約當現金 Cash and cash equivalents 18,013 6,106 1,491 669 1,123 27,401 -3,677 23,724存放央行及銀行同業 Due from the central bank and other banks 82,753 0 0 0 0 82,753 0 82,753公平價值變動列入損益之金融資產 Financial assets at fair value through profit or loss 33,437 25,672 0 0 56 59,166 -434 58,732附賣回票券及債券投資 Securities purchased under agreements to resell 3,080 6,065 0 0 0 9,145 -1,279 7,866應收款項-淨額 Receivables, net 51,966 14,061 40 3,775 1,956 71,797 -2,859 68,938貼現及放款-淨額 Discounts and loans, net 731,856 0 0 5,588 0 737,444 -4,616 732,828備供出售金融資產 Available-for-sale financial assets 37,085 0 63 0 289 37,437 0 37,437持有至到期日金融資產 Held-to-maturity investments 233,698 0 0 0 0 233,698 0 233,698採權益法之股權投資 Equity investment - equity method 0 0 0 0 97,414 97,414 -97,350 64其他金融資產-淨額 Other financial assets, net 5,311 18,488 144 4,837 2,733 31,515 -2,713 28,801固定資產-淨額 Properties, net 9,602 2,055 15 3,250 48 14,970 -2,693 12,277其他資產 Other assets 8,779 708 17 3,157 84 12,746 560 13,305
資產總計資產總計資產總計資產總計 Total assets 1,215,581 73,156 1,770 21,275 103,703 1,415,486 -115,064 1,300,423
Balance sheet of SPH and its subsidiaries for the 12 months ended Dec. 31, 2011
45
負債及股東權益負債及股東權益負債及股東權益負債及股東權益 Liabilities and stockholders' equity負債負債負債負債 Liabilities央行及金融同業存款 Call loans and due to banks 66,375 0 0 0 0 66,375 0 66,375應付商業本票 - 淨額 Commercial paper payable, net 0 3,469 0 1,298 4,449 9,216 0 9,216公平價值變動列入損益之金融負債 Financial liabilities at fair value through profit or loss 7,309 1,681 0 0 0 8,990 -434 8,556附買回票券及債券負債 Securities sold under agreement to repurchase 7,072 24,056 0 0 0 31,128 -1,279 29,849應付款項 Payable 19,688 6,294 81 124 1,316 27,502 -2,728 24,774存款及匯款 Deposit and remittance 994,602 0 0 0 0 994,602 -5,304 989,298應付公司及金融債券 Bonds payable 37,028 0 0 0 0 37,028 0 37,028短期借款 Short- term borrowings 899 1,844 0 3,487 1,500 7,731 -362 7,369長期借款 Long-term borrowings 0 0 0 12,044 2,997 15,040 -4,255 10,786其它金融負債 Other financial liabilities 7,847 13,294 0 1,142 0 22,283 -86 22,197其他負債 Other liabilities 4,245 315 0 151 170 4,882 19 4,901負債合計負債合計負債合計負債合計 Total liabilities 1,145,065 50,954 81 18,245 10,431 1,224,776 -14,429 1,210,348股本 Capital stock 52,574 15,365 1,534 2,771 76,192 148,437 -75,325 73,112資本公積 Capital surplus 9,963 446 0 0 2,015 12,424 -10,409 2,015保留盈餘 Retained earnings 7,160 6,708 161 252 14,666 28,947 -14,450 14,497其他權益調整 Other item on stockholders' equity 818 -317 -6 8 400 902 -451 451股東權益合計股東權益合計股東權益合計股東權益合計 Total stockholders' equity of parent company 70,516 22,202 1,689 3,030 93,272 190,710 -100,635 90,075少數股權 Minority Interests 0 0 0 0 0 0 0 0負債及股東權益總計負債及股東權益總計負債及股東權益總計負債及股東權益總計 TOTAL 1,215,581 73,156 1,770 21,275 103,703 1,415,486 -115,064 1,300,423

Appendix
NT$Mn 銀行合併銀行合併銀行合併銀行合併 證券合併證券合併證券合併證券合併 投信投信投信投信 租賃租賃租賃租賃 其他項目其他項目其他項目其他項目 合計合計合計合計 調整項目調整項目調整項目調整項目 金控合併金控合併金控合併金控合併
BSP SPS Trust Leasing Others Sum Adj. Items SPH利息收入 Interest revenue 23,818 1,446 5 658 39 25,966 -205 25,761利息費用 Interest expense 9,749 287 0 296 89 10,421 -170 10,251
利息淨收益利息淨收益利息淨收益利息淨收益 Net interest income 14,069 1,159 5 362 -50 15,545 -35 15, 510利息以外淨收益利息以外淨收益利息以外淨收益利息以外淨收益 Net revenues other than interest 手續費淨收益 Commissions and fee revenues, net 4,095 3,298 502 0 -0 7,895 -50 7,845
公平價值變動列入損益 Gains from financial assets and liabilities at fair value through P/L
-30 -1,594 0 5 -3 -1,623 0 -1,623
兌換損益-淨額 Foreign exchange gains, net 760 -26 0 -13 0 720 0 720
備供出售損益 Realized gains from available-for-sale financial assets
13 0 0 0 32 44 0 44
以成本衡量利益 Realized gains from unquoted equity instrument
80 159 0 0 191 430 0 430
資產減損損失 Provision for impairment losses on assets 63 0 0 0 -91 -29 0 -29
P&L of SPH and its subsidiaries for the 12 months e nded Dec. 31, 2011
46
資產減損損失 Provision for impairment losses on assets 63 0 0 0 -91 -29 0 -29
按權益法之投資損益-淨額 (Losses) income from equity investments - equity method, net
0 0 0 0 3,259 3,259 -3,254 5
認購(售)權證發行利益 Gain on warrants issued, net 0 1,286 0 0 0 1,286 0 1,286 租金收入 Rental revenue 116 25 0 244 0 386 -208 178 收回呆帳 Recovery of bad debts 627 0 0 0 0 627 0 627 其他非利息淨(損)益 Other revenues, net -625 82 0 -16 242 -318 -244 -561
淨收益淨收益淨收益淨收益 Total net revenues 19,167 4,389 507 582 3,579 28,224 -3,79 1 24,433
呆帳費用 Provision for bad debts 3,865 0 0 22 0 3,886 0 3,886營業費用 Operating expenses 12,043 3,782 409 252 447 16,932 -512 16,421
呆帳費用呆帳費用呆帳費用呆帳費用++++營業費用營業費用營業費用營業費用 Bad debts & operating expenses 15,907 3,782 409 274 447 2 0,818 -512 20,307
稅前利益(損失) Income (loss) before income tax 3,259 607 99 308 3,132 7,405 -3,279 4,126所得稅費用(利益) Income tax benefit (expense) 878 167 17 64 -9 1,117 0 1,117
合併總純合併總純合併總純合併總純(損損損損)益益益益 Consolidated Income (Loss) 2,382 440 82 244 3,141 6,288 -3 ,279 3,009歸屬予; Attributable to 母公司股東 Stockholders of parent company 2,382 440 82 244 3,141 6,288 -3,279 3,009 少數股權 Minority interests 0 0 0 0 0 0 0 0

Appendix
NT$Mn2010 2011 Dec10 Mar11 Jun11 Sep11 Dec11 QoQ(%) YoY(%)
資產資產資產資產 Assets:現金及約當現金 Cash and cash equivalents 14,713 23,724 14,713 14,551 16,851 17,981 23,724 31.94 61.24存放央行及銀行同業 Due from the central bank and other banks 84,493 82,753 84,493 72,535 70,365 78,972 82,753 4.79 -2.06公平價值變動列入損益之金融資產 Financial assets at fair value through profit or loss 49,768 58,732 49,768 104,309 66,099 60,730 58,732 -3.29 18.01附賣回票券及債券投資 Securities purchased under agreements to resell 8,517 7,866 8,517 7,266 7,314 5,819 7,866 35.18 -7.64應收款項-淨額 Receivables, net 65,145 68,938 65,145 62,677 66,288 65,795 68,938 4.78 5.82貼現及放款-淨額 Discounts and loans, net 717,566 732,828 717,566 735,062 738,969 736,345 732,828 -0.48 2.13備供出售金融資產 Available-for-sale financial assets 38,518 37,437 38,518 36,568 35,674 34,461 37,437 8.64 -2.80持有至到期日金融資產 Held-to-maturity investments 200,565 233,698 200,565 153,759 204,195 226,246 233,698 3.29 16.52採權益法之股權投資 Equity investment - equity method 60 64 60 63 62 64 64 -0.19 6.42其他金融資產-淨額 Other financial assets, net 24,966 28,801 24,966 26,155 28,785 32,188 28,801 -10.52 15.36固定資產-淨額 Properties, net 11,680 12,277 11,680 11,599 11,584 11,578 12,277 6.03 5.11其他資產 Other assets 14,893 13,305 14,893 14,665 13,717 12,996 13,305 2.38 -10.66資產總計資產總計資產總計資產總計 Total Assets 1,230,884 1,300,423 1,230,884 1,239,210 1,259,903 1,283,175 1,300,423 1.34 5.65
Yearly Results
SPH's Balance Sheet (consolidated)
Quarterly Results
47
負債及股東權益負債及股東權益負債及股東權益負債及股東權益 Liabilities and stockholders' equity負債負債負債負債 Liabilities央行及金融同業存款 Call loans and due to banks 64,798 66,375 64,798 60,225 62,425 54,181 66,375 22.51 2.43應付商業本票 - 淨額 Commercial paper payable, net 18,562 9,216 18,562 17,282 19,332 12,124 9,216 -23.99 -50.35公平價值變動列入損益之金融負債 Financial liabil ities at fair value through profit or loss 12,236 8,556 12,236 12,336 10,260 12,180 8,556 -29.75 -30.08附買回票券及債券負債 Securities sold under agreement to repurchase 19,621 29,849 19,621 21,792 19,899 28,833 29,849 3.52 52.13應付款項 Payable 21,243 24,774 21,243 17,875 18,969 22,869 24,774 8.33 16.62存款及匯款 Deposit and remittance 943,358 989,298 943,358 933,125 955,856 972,805 989,298 1.70 4.87應付公司及金融債券 Bonds payable 30,121 37,028 30,121 31,110 27,584 33,861 37,028 9.35 22.93短期借款 Short- term borrowings 8,714 7,369 8,714 8,791 9,474 6,229 7,369 18.31 -15.43長期借款 Long-term borrowings 7,263 10,786 7,263 9,296 8,584 12,046 10,786 -10.47 48.50其它金融負債 Other financial liabilities 14,656 22,197 14,656 34,604 33,837 33,240 22,197 -33.22 51.46其他負債 Other liabilities 3,567 4,901 3,567 4,148 4,339 4,419 4,901 10.91 37.40
負債合計負債合計負債合計負債合計 Total l iabilities 1,144,139 1,210,348 1,144,139 1,150,583 1,170,559 1,192,787 1,210,348 1.47 5.79股本 Capital stock 70,098 73,112 70,098 70,098 73,112 73,112 73,112 0.00 4.30資本公積 Capital surplus 2,015 2,015 2,015 2,015 2,015 2,015 2,015 0.00 0.00保留盈餘 Retain earnings 15,171 14,497 15,171 17,049 14,818 15,610 14,497 -7.13 -4.44其他權益調整 Other item on stockholders' equity -539 451 -539 -534 -601 -349 451 NA -183.73股東權益合計股東權益合計股東權益合計股東權益合計 Total stockholders' equity of parent company 86,745 9 0,075 86,745 88,627 89,344 90,387 90,075 -0.35 3.84少數股權 Minorty interests 0 0 0 0 0 0 0 - -負債及股東權益總計負債及股東權益總計負債及股東權益總計負債及股東權益總計 TOTAL 1,230,884 1,300,423 1,230,884 1,239,210 1,259,903 1,283,175 1,300,423 1.34 5.65

Appendix
NT$Mn2010 2011 4Q10 1Q11 2Q11 3Q11 4Q11 QoQ(%) YoY(%)
利息收入 Interest revenue 21,933 25,761 5,741 5,970 6,163 6,534 7,095 8.58 23.58利息費用 Interest expense 7,278 10,251 2,092 2,196 2,387 2,574 3,094 20.22 47.95利息淨收益利息淨收益利息淨收益利息淨收益 Net interest income 14,655 15,510 3,649 3,774 3,775 3,960 4,000 1.02 9.62
手續費淨收益 Net fee income 8,766 7,845 2,375 1,980 2,069 2,112 1,684 -20.28 -29.10 公平價值變動列入損益之
金融資產及負債損益
Losses from financial assets and liabilities at fair value through profit or loss
408 -1,623 274 -352 -94 -1,028 -148 NA -154.00
兌換損益-淨額 Foreign exchange gains, net 652 720 317 259 238 81 142 75.03 -55.11
備供出售損益 Realized gains from available-for-sale financial assets
116 44 3 7 -13 18 32 79.03 866.42
以成本衡量之金融資產損益 Gains from unquoted equity instrument 357 430 70 37 170 168 55 -67.07 -21.49 資產減損損失 Impairment losses on assets -505 -29 -369 -27 -98 -32 129 NA NA
按權益法之投資損益-淨額 (Losses) income from equity investments - equity method, net
7 5 2 3 1 1 0 -87.94 -95.61
認購(售)權證發行利益 Gain on warrants issued 609 1,286 90 312 379 416 178 -57.11 98.95 租金收入 Rental revenue 324 178 73 52 43 44 39 -9.36 -45.61 收回呆帳 Recovery of bad debts 721 627 85 177 154 158 137 -13.13 61.70
SPH's P&L (Consolidated)
Yearly Results Quarterly Results
48
收回呆帳 Recovery of bad debts 721 627 85 177 154 158 137 -13.13 61.70 其他非利息淨(損)益 Other income -93 -561 79 -23 -342 92 -288 -414.50 -466.17淨收益淨收益淨收益淨收益 Total net revenues 26,017 24,433 6,647 6,199 6,283 5,989 5 ,962 -0.44 -10.31
呆帳費用 Provision for bad debts 5,056 3,886 1,220 460 -89 732 2,784 280.26 128.18營業費用 Operating expenses 15,582 16,421 4,261 3,869 4,119 4,380 4,053 -7.46 -4.87 用人費用 Personnel expenses 9,895 9,947 2,696 2,477 2,627 2,643 2,200 -16.78 -18.41 折舊及攤銷費用 Depreciation and amortization 868 785 213 198 195 195 197 0.95 -7.48 其他業務及管理費用 Others 4,820 5,688 1,352 1,194 1,296 1,542 1,657 7.45 22.53呆帳費用呆帳費用呆帳費用呆帳費用++++營業費用營業費用營業費用營業費用 Bad debts & operating expenses 20,638 20,307 5,481 4,32 8 4,030 5,112 6,837 33.74 24.74稅前利益(損失) Income (loss) before income tax 5,379 4,126 1,167 1,870 2,253 877 -875 -199.77 -174.97所得稅費用(利益) Income tax benefit (expense) 269 1,117 18 377 417 85 238 180.36 1,210.94合併總純合併總純合併總純合併總純((((損損損損))))益益益益 Net income (Loss) 5,109 3,009 1,148 1,493 1,837 792 -1,113 -240.59 -196.91歸屬予; Attributable to 0 母公司股東 Stockholders of parent company 5,109 3,009 1,148 1,493 1,837 792 -1,113 -240.57 -196.90 少數股權 Minority interests 0 0 0 0 0 0 0 NA NA
Appendix
NT$Mn Yearly Results2010 2011 Dec10 Mar11 Jun11 Sep11 Dec11 QoQ(%) YoY(%)
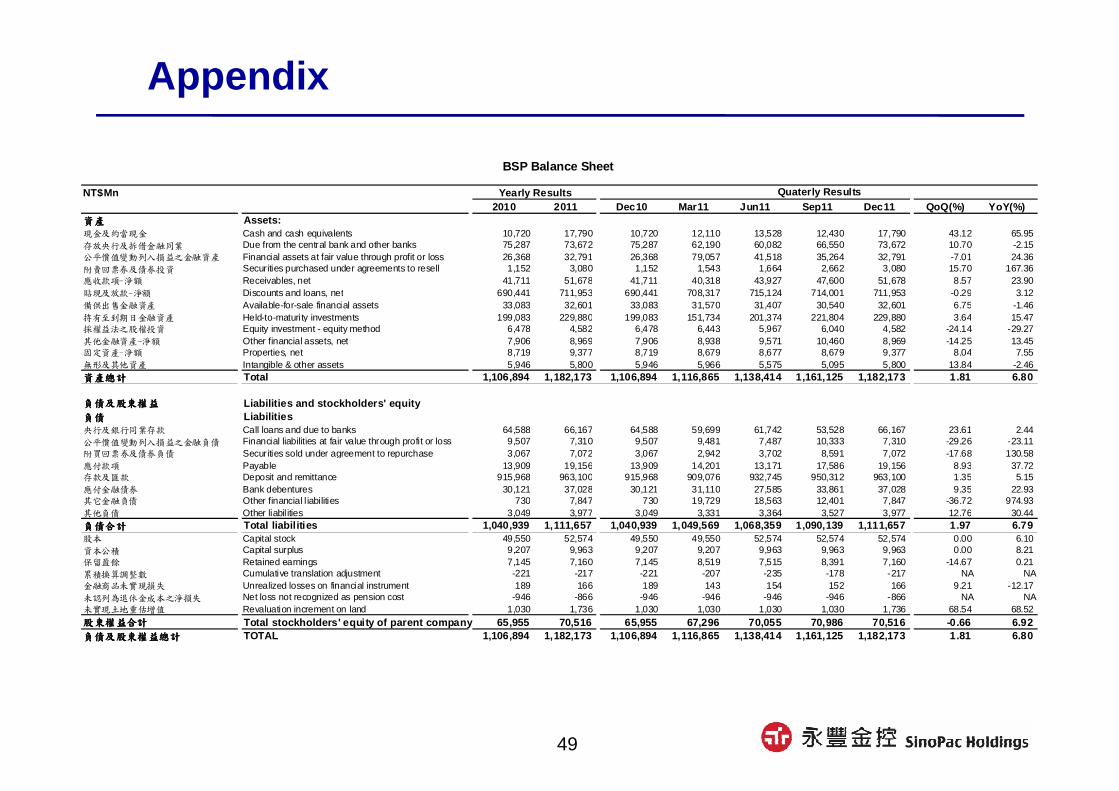
資產資產資產資產 Assets:現金及約當現金 Cash and cash equivalents 10,720 17,790 10,720 12,110 13,528 12,430 17,790 43.12 65.95存放央行及拆借金融同業 Due from the central bank and other banks 75,287 73,672 75,287 62,190 60,082 66,550 73,672 10.70 -2.15公平價值變動列入損益之金融資產 Financial assets at fair value through profit or loss 26,368 32,791 26,368 79,057 41,518 35,264 32,791 -7.01 24.36附賣回票券及債券投資 Securities purchased under agreements to resell 1,152 3,080 1,152 1,543 1,664 2,662 3,080 15.70 167.36應收款項-淨額 Receivables, net 41,711 51,678 41,711 40,318 43,927 47,600 51,678 8.57 23.90貼現及放款-淨額 Discounts and loans, net 690,441 711,953 690,441 708,317 715,124 714,001 711,953 -0.29 3.12備供出售金融資產 Available-for-sale financial assets 33,083 32,601 33,083 31,570 31,407 30,540 32,601 6.75 -1.46持有至到期日金融資產 Held-to-maturity investments 199,083 229,880 199,083 151,734 201,374 221,804 229,880 3.64 15.47採權益法之股權投資 Equity investment - equity method 6,478 4,582 6,478 6,443 5,967 6,040 4,582 -24.14 -29.27其他金融資產-淨額 Other financial assets, net 7,906 8,969 7,906 8,938 9,571 10,460 8,969 -14.25 13.45固定資產-淨額 Properties, net 8,719 9,377 8,719 8,679 8,677 8,679 9,377 8.04 7.55無形及其他資產 Intangible & other assets 5,946 5,800 5,946 5,966 5,575 5,095 5,800 13.84 -2.46資產總計資產總計資產總計資產總計 Total 1,106,894 1,182,173 1,106,894 1,116,865 1,138,414 1,161,125 1,182,173 1.81 6.80
Quaterly Results
BSP Balance Sheet
49
負債及股東權益負債及股東權益負債及股東權益負債及股東權益 Liabilities and stockholders' equity負債負債負債負債 Liabilities央行及銀行同業存款 Call loans and due to banks 64,588 66,167 64,588 59,699 61,742 53,528 66,167 23.61 2.44公平價值變動列入損益之金融負債 Financial liabilities at fair value through profit or loss 9,507 7,310 9,507 9,481 7,487 10,333 7,310 -29.26 -23.11附買回票券及債券負債 Securities sold under agreement to repurchase 3,067 7,072 3,067 2,942 3,702 8,591 7,072 -17.68 130.58應付款項 Payable 13,909 19,156 13,909 14,201 13,171 17,586 19,156 8.93 37.72存款及匯款 Deposit and remittance 915,968 963,100 915,968 909,076 932,745 950,312 963,100 1.35 5.15應付金融債券 Bank debentures 30,121 37,028 30,121 31,110 27,585 33,861 37,028 9.35 22.93其它金融負債 Other financial l iabilities 730 7,847 730 19,729 18,563 12,401 7,847 -36.72 974.93其他負債 Other liabil ities 3,049 3,977 3,049 3,331 3,364 3,527 3,977 12.76 30.44負債合計負債合計負債合計負債合計 Total liabilities 1,040,939 1,111,657 1,040,939 1,049,569 1,068,359 1,090,139 1,111,657 1.97 6.79股本 Capital stock 49,550 52,574 49,550 49,550 52,574 52,574 52,574 0.00 6.10資本公積 Capital surplus 9,207 9,963 9,207 9,207 9,963 9,963 9,963 0.00 8.21保留盈餘 Retained earnings 7,145 7,160 7,145 8,519 7,515 8,391 7,160 -14.67 0.21累積換算調整數 Cumulative translation adjustment -221 -217 -221 -207 -235 -178 -217 NA NA金融商品未實現損失 Unrealized losses on financial instrument 189 166 189 143 154 152 166 9.21 -12.17未認列為退休金成本之淨損失 Net loss not recognized as pension cost -946 -866 -946 -946 -946 -946 -866 NA NA未實現土地重估增值 Revaluation increment on land 1,030 1,736 1,030 1,030 1,030 1,030 1,736 68.54 68.52股東權益合計股東權益合計股東權益合計股東權益合計 Total stockholders' equity of parent company 65,955 7 0,516 65,955 67,296 70,055 70,986 70,516 -0.66 6.92負債及股東權益總計負債及股東權益總計負債及股東權益總計負債及股東權益總計 TOTAL 1,106,894 1,182,173 1,106,894 1,116,865 1,138,414 1,161,125 1,182,173 1.81 6.80
Appendix
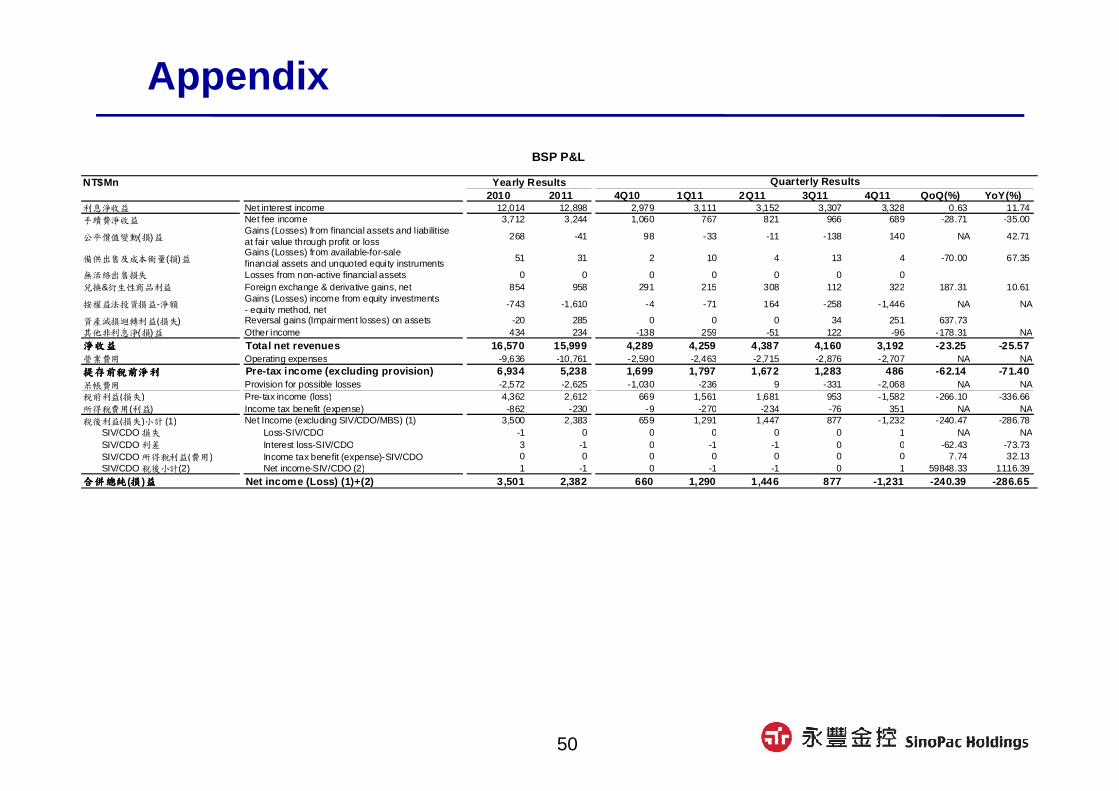
NT$Mn Yearly Results2010 2011 4Q10 1Q11 2Q11 3Q11 4Q11 QoQ(%) YoY(%)
利息淨收益 Net interest income 12,014 12,898 2,979 3,111 3,152 3,307 3,328 0.63 11.74手續費淨收益 Net fee income 3,712 3,244 1,060 767 821 966 689 -28.71 -35.00
公平價值變動(損)益Gains (Losses) from financial assets and l iabilitiseat fair value through profit or loss
268 -41 98 -33 -11 -138 140 NA 42.71
備供出售及成本衡量(損)益Gains (Losses) from available-for-salefinancial assets and unquoted equity instruments
51 31 2 10 4 13 4 -70.00 67.35
無活絡出售損失 Losses from non-active financial assets 0 0 0 0 0 0 0兌換&衍生性商品利益 Foreign exchange & derivative gains, net 854 958 291 215 308 112 322 187.31 10.61
按權益法投資損益-淨額Gains (Losses) income from equity investments- equity method, net
-743 -1,610 -4 -71 164 -258 -1,446 NA NA
資產減損迴轉利益(損失) Reversal gains (Impairment losses) on assets -20 285 0 0 0 34 251 637.73其他非利息淨(損)益 Other income 434 234 -138 259 -51 122 -96 -178.31 NA淨收益淨收益淨收益淨收益 Total net revenues 16,570 15,999 4,289 4,259 4,387 4,160 3 ,192 -23.25 -25.57營業費用 Operating expenses -9,636 -10,761 -2,590 -2,463 -2,715 -2,876 -2,707 NA NA提存前稅前淨利提存前稅前淨利提存前稅前淨利提存前稅前淨利 Pre-tax income (excluding provision) 6,934 5,238 1,699 1,797 1,672 1,283 486 -62.14 -71.40呆帳費用 Provision for possible losses -2,572 -2,625 -1,030 -236 9 -331 -2,068 NA NA稅前利益(損失) Pre-tax income (loss) 4,362 2,612 669 1,561 1,681 953 -1,582 -266.10 -336.66
Quarterly Results
BSP P&L
50
稅前利益(損失) Pre-tax income (loss) 4,362 2,612 669 1,561 1,681 953 -1,582 -266.10 -336.66所得稅費用(利益) Income tax benefit (expense) -862 -230 -9 -270 -234 -76 351 NA NA稅後利益(損失)小計 (1) Net Income (excluding SIV/CDO/MBS) (1) 3,500 2,383 659 1,291 1,447 877 -1,232 -240.47 -286.78 SIV/CDO 損失 Loss-SIV/CDO -1 0 0 0 0 0 1 NA NA SIV/CDO 利差 Interest loss-SIV/CDO 3 -1 0 -1 -1 0 0 -62.43 -73.73 SIV/CDO 所得稅利益(費用) Income tax benefit (expense)-SIV/CDO 0 0 0 0 0 0 0 7.74 32.13 SIV/CDO 稅後小計(2) Net income-SIV/CDO (2) 1 -1 0 -1 -1 0 1 59848.33 1116.39合併總純合併總純合併總純合併總純(損損損損)益益益益 Net income (Loss) (1)+(2) 3,501 2,382 660 1,290 1,446 877 -1,231 -240.39 -286.65
Appendix
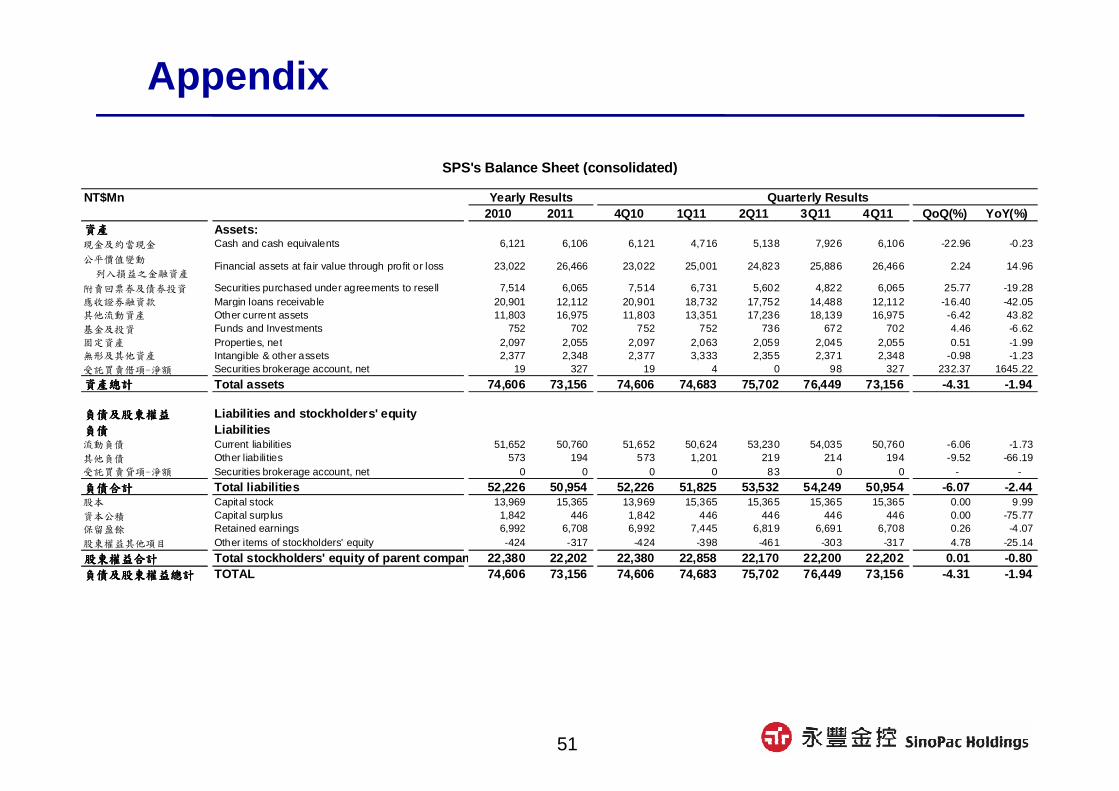
4Q10 4Q11NT$Mn
2010 2011 4Q10 1Q11 2Q11 3Q11 4Q11 QoQ(%) YoY(%)資產資產資產資產 Assets:現金及約當現金 Cash and cash equivalents 6,121 6,106 6,121 4,716 5,138 7,926 6,106 -22.96 -0.23
公平價值變動
列入損益之金融資產Financial assets at fair value through profit or loss 23,022 26,466 23,022 25,001 24,823 25,886 26,466 2.24 14.96
附賣回票券及債券投資 Securities purchased under agreements to resell 7,514 6,065 7,514 6,731 5,602 4,822 6,065 25.77 -19.28應收證券融資款 Margin loans receivable 20,901 12,112 20,901 18,732 17,752 14,488 12,112 -16.40 -42.05其他流動資產 Other current assets 11,803 16,975 11,803 13,351 17,236 18,139 16,975 -6.42 43.82基金及投資 Funds and Investments 752 702 752 752 736 672 702 4.46 -6.62固定資產 Properties, net 2,097 2,055 2,097 2,063 2,059 2,045 2,055 0.51 -1.99無形及其他資產 Intangible & other assets 2,377 2,348 2,377 3,333 2,355 2,371 2,348 -0.98 -1.23受託買賣借項-淨額 Securities brokerage account, net 19 327 19 4 0 98 327 232.37 1645.22
資產總計資產總計資產總計資產總計 Total assets 74,606 73,156 74,606 74,683 75,702 76,449 73,156 -4.31 -1.94
SPS's Balance Sheet (consolidated)
Yearly Results Quarterly Results
51
負債及股東權益負債及股東權益負債及股東權益負債及股東權益 Liabilities and stockholders' equity負債負債負債負債 Liabilities流動負債 Current liabilities 51,652 50,760 51,652 50,624 53,230 54,035 50,760 -6.06 -1.73其他負債 Other liabilities 573 194 573 1,201 219 214 194 -9.52 -66.19受託買賣貸項-淨額 Securities brokerage account, net 0 0 0 0 83 0 0 - -
負債合計負債合計負債合計負債合計 Total liabilities 52,226 50,954 52,226 51,825 53,532 54,2 49 50,954 -6.07 -2.44股本 Capital stock 13,969 15,365 13,969 15,365 15,365 15,365 15,365 0.00 9.99資本公積 Capital surplus 1,842 446 1,842 446 446 446 446 0.00 -75.77保留盈餘 Retained earnings 6,992 6,708 6,992 7,445 6,819 6,691 6,708 0.26 -4.07
股東權益其他項目 Other items of stockholders' equity -424 -317 -424 -398 -461 -303 -317 4.78 -25.14
股東權益合計股東權益合計股東權益合計股東權益合計 Total stockholders' equity of parent company 22,380 22,202 22,380 22,858 22,170 22,200 22,202 0.01 -0.80負債及股東權益總計負債及股東權益總計負債及股東權益總計負債及股東權益總計 TOTAL 74,606 73,156 74,606 74,683 75,702 76,449 73,156 -4.31 -1.94

Appendix
NT$Mn2010 2011 4Q10 1Q11 2Q11 3Q11 4Q11 QoQ(%) YoY(%)
利息淨收益 Net interest income 1,079 1,168 269 314 300 295 259 -12.43 -3.83
手續費淨收益 Net fee income 3,505 3,171 961 829 800 896 647 -27.76 -32.65
出售證券利益(損失)Gains (Losses) on sales of securities,net
477 -1,281 369 -109 -251 -751 -170 NA -146.09
股務代理收入 Stock affairs agent fees 78 82 19 20 21 22 20 -9.01 2.65
股利收入 Dividend income 136 137 2 0 15 117 5 -95.38 212.91
權證發行利益 Gains (Losses) on warrant issued, net 609 1,286 90 312 379 416 178 -57.11 98.95
期貨契約利益(損失)Gains (Losses) from futurestransactions
-66 -4 -26 -4 -10 26 -16 -162.68 NA
選擇權交易利益(損失)Gains (Losses) from optionstransactions
16 130 -10 18 14 21 77 270.40 NA
衍生性金融商品利益(損失)Gains (Losses) from derivativeinstruments transactions
-114 212 -173 75 22 119 -5 -103.86 NA
Gains (Losses) from valuation of
SPS's P&L (Consolidated)
Yearly Results Quarterly Results
52
營業證券評價利益(損失)Gains (Losses) from valuation ofoperating securit ies
-307 -750 81 -343 31 -362 -76 NA -193.85
發行認購權證費用 Expenses for the issuance of warrants -84 -85 -26 -26 -20 -24 -15 NA NA
其他營業收支 Other operating income 116 285 29 39 74 140 32 -77.23 9.45
營業外收支 Non-operating income-net 108 39 68 17 48 -62 36 NA -47.05
淨收益淨收益淨收益淨收益 Total net revenues 5,554 4,389 1,652 1,143 1,423 852 971 13 .90 -41.23 營業費用 Operating expenses 3,874 3,782 1,181 928 916 1,019 919 -9.76 -22.17
稅前利益(損失) Pre-tax income (loss) 1,680 607 471 215 507 -166 52 NA -89.03
所得稅費用(利益) Income tax benefit (expense) 217 167 68 62 109 -38 35 NA -49.40
合併總純合併總純合併總純合併總純(損損損損)益益益益 Net income (Loss) 1,463 440 403 153 398 -128 17 NA -95.75
NT$Mn2010 2011 4Q10 1Q11 2Q11 3Q11 4Q11 QoQ(%) YoY(%)
經紀事業處 Brokerage business group 1,607 1,291 395 412 315 309 255 -19.15 -34.87 資本市場事業處 Capital market business group 59 68 69 -106 179 5 -10 -105.47 -103.51
投資事業處Principal investment & derivativesbusiness group
616 -451 174 -9 33 -418 -58 -272.26 -121.96
其他 Others -612 -347 -173 -99 -29 -68 -151 NA NA
稅前利益稅前利益稅前利益稅前利益(損失損失損失損失) Pre-tax income (loss) 1,671 560 465 197 498 -171 36 -92.78 -95.42
SPS's Pre-tax breakdown
Yearly Results Quarterly Results

Appendix
NT$Mn授信類別授信類別授信類別授信類別 Items 2010 2011 Dec10 Mar11 Jun11 Sep11 Dec11 QoQ(%) YoY(%)
企金放款企金放款企金放款企金放款 Corporate Loans 製造業製造業製造業製造業 Manufacturing 138,000 153,520 138,000 148,722 153,335 151,863 153,520 1.09 11.25 電子工業 Electronics Indusrty 63,304 71,735 63,304 68,947 69,559 67,819 71,735 5.77 13.32 原物料業 Chemical Products 42,570 44,532 42,570 45,798 48,811 46,885 44,532 -5.02 4.61 傳產製造業 Conventional Industry 31,158 36,326 31,158 32,969 34,024 36,165 36,326 0.44 16.59 新興製造業 Electric Fixture 968 927 968 1,008 940 993 927 -6.68 -4.25 金融機構 金融機構 金融機構 金融機構、、、、證券及保險業證券及保險業證券及保險業證券及保險業 FI & Security House & Insurance 16,806 11,878 16,806 22,878 21,635 14,100 11,878 -15.76 -29.33 租賃 租賃 租賃 租賃////分期付款業分期付款業分期付款業分期付款業 Installment & Leasing 5,451 4,984 5,451 5,008 4,325 4,568 4,984 9.10 -8.57 營建業及不動產業 營建業及不動產業 營建業及不動產業 營建業及不動產業 Construction & Real Estate 38,949 38,070 38,949 40,722 39,492 39,358 38,070 -3.27 -2.26 批發及零售業 批發及零售業 批發及零售業 批發及零售業 Wholesales/Retail 44,861 56,459 44,861 48,740 50,299 57,551 56,459 -1.90 25.85 傳產服務業傳產服務業傳產服務業傳產服務業 Traditional Service Industry 16,524 17,419 16,524 16,595 16,815 16,869 17,419 3.26 5.42 綜合服務業綜合服務業綜合服務業綜合服務業 Comprehensive Services 462 1,036 462 485 531 604 1,036 71.48 124.23 其他服務業其他服務業其他服務業其他服務業 Other Services 12,355 10,614 12,355 13,493 13,029 12,381 10,614 -14.27 -14.09
Quarterly ResultsYearly Results
BSP's Credit Breakdown
53
其他服務業其他服務業其他服務業其他服務業 Other Services 12,355 10,614 12,355 13,493 13,029 12,381 10,614 -14.27 -14.09 公營事業 公營事業 公營事業 公營事業////公同事業公同事業公同事業公同事業 State-owned Company 40,237 40,811 40,237 40,100 43,927 39,574 40,811 3.13 1.43 企業相關個人 企業相關個人 企業相關個人 企業相關個人 Business Owner 17,549 15,089 17,549 16,353 16,282 15,614 15,089 -3.36 -14.01 非營利團體 非營利團體 非營利團體 非營利團體 Non-profit Organization 1,043 1,048 1,043 1,102 1,131 1,023 1,048 2.46 0.44 其他 其他 其他 其他 Others 1,398 1,512 1,398 1,435 1,285 1,165 1,512 29.82 8.17
企金放款小計企金放款小計企金放款小計企金放款小計 Sub-total 333,634 352,440 333,634 355,633 362,085 354,669 352,440 -0.63 5.64 保證 保證 保證 保證////承兌承兌承兌承兌////信用狀信用狀信用狀信用狀 Guarantee, Acceptance 20,944 20,814 20,944 22,880 19,503 2 2,949 20,814 -9.30 -0.62 承購業務 承購業務 承購業務 承購業務 Factoring 18,458 16,630 18,458 17,625 17,707 17,076 16,630 -2.61 -9.91 外匯 外匯 外匯 外匯////衍生性交易及其他衍生性交易及其他衍生性交易及其他衍生性交易及其他 Derivatives and Others 4,777 6,302 4,777 6,283 7,597 10,17 3 6,302 -38.06 31.92
企金授信合計企金授信合計企金授信合計企金授信合計 Corporate Total 377,813 396,186 377,813 402,422 406,892 4 04,867 396,186 -2.14 4.86個金放款個金放款個金放款個金放款 Individual Loans 362,041 366,963 362,041 358,102 358,367 365,007 366,963 0.54 1.36 房貸 房貸 房貸 房貸 Mortagage Loans 351,854 352,618 351,854 347,778 346,448 351,556 352,617 0.30 0.22 信用貸款 信用貸款 信用貸款 信用貸款 Unsecured Loans 6,062 9,699 6,062 6,151 7,664 9,071 9,699 6.93 60.00 車貸 車貸 車貸 車貸 Car Loans 3,416 4,064 3,416 3,559 3,669 3,860 4,064 5.27 18.96 其他 其他 其他 其他 Others 709 582 709 615 586 520 582 11.91 -17.89保證保證保證保證 Guarantee 343 254 343 321 300 273 254 -6.91 -25.94信用卡信用卡信用卡信用卡 Credit Card 16,338 18,001 16,338 15,571 16,843 17,246 18,001 4.38 10.18
個金授信合計個金授信合計個金授信合計個金授信合計 Individual Total 378,722 385,218 378,722 373,994 375,510 382,527 385,218 0.70 1.72全行授信總計全行授信總計全行授信總計全行授信總計 Total 756,535 781,404 756,535 776,416 782,402 787,394 781,404 -0.76 3.29

Appendix
NT$Mn Yearly Results存款類別存款類別存款類別存款類別 Items 2010 2011 Dec10 Mar11 Jun11 Sep11 Dec11 QoQ(%) YoY(%)台幣存款台幣存款台幣存款台幣存款 NTD Deposits 台幣支存 Checking 8,405 9,537 8,405 7,807 8,409 8,336 9,537 14.41 13.47 台幣活期性 Demand 303,832 302,148 303,832 305,413 304,477 308,164 302,148 -1.95 -0.55 台幣定期性 Time 441,563 486,445 441,563 452,294 475,893 473,976 486,445 2.63 10.16
郵匯局轉存款 Redeposit from the directorate general of postal remittance
18,877 11,806 18,877 18,804 17,804 14,804 11,806 -20.25 -37.46
小計 小計 小計 小計 Sub total 772,677 809,936 772,677 784,318 806,583 80 5,280 809,936 0.58 4.82外幣存款外幣存款外幣存款外幣存款 Foreign Currency Deposits 外幣支存 Checking 3,997 3,153 3,997 4,111 3,509 3,500 3,153 -9.91 -21.12 外幣活期性 Demand 84,247 91,201 84,247 84,059 83,402 92,295 91,201 -1.19 8.25 外幣定期性 Time 58,184 70,043 58,184 54,830 56,421 63,157 70,043 10.90 20.38
小計 小計 小計 小計 Sub total 146,428 164,397 146,428 143,000 143,332 15 8,953 164,397 3.42 12.27合計合計合計合計 Total 919,105 974,333 919,105 927,318 949,915 964,233 974,333 1.05 6.01
BSP's Deposit Breakdown
Quaterly Results
54
合計合計合計合計 Total 919,105 974,333 919,105 927,318 949,915 964,233 974,333 1.05 6.01
NT$Mn Yearly Results
2010 2011 4Q10 1Q11 2Q11 3Q11 4Q11 QoQ(%) YoY(%)財富管理 Wealth management 1,630 1,248 491 336 380 314 217 -31.05 -55.85放款 Loan fees 782 493 258 141 132 148 71 -51.60 -72.34應收帳款 Factoring and A/R financing 166 154 41 35 41 40 38 -3.89 -6.94進出口 Import and export service 337 322 84 77 79 84 81 -4.01 -3.91信託及保管 Trust & custodian bank 211 175 47 48 46 43 38 -11.74 -19.32保證及承兌 Guarantees & acceptances 74 70 17 18 18 17 17 -2.57 0.68信用卡 Credit card 561 579 141 128 144 149 159 6.48 12.90其他 Others -49 -74 -19 -16 -19 -17 -22*壽險 Life insurance 265 0 179 86 -51.57*產險 Property insurance 13 9 3 -63.80小計小計小計小計 Sub total 3,712 3,244 1,060 767 821 966 689 -28.71 -35.00 壽險 Life insurance 780 963 167 205 275 287 196 -31.79 17.15 產險 Property insurance 48 65 11 12 20 15 18 25.47 70.34扣除銀行已認列之收入 -278 -188 -90合計合計合計合計 Total fee income 4,540 3,994 1,238 984 1,116 1,080 813 -24. 71 -34.31
*1~9月認列之保代合作推廣佣金收入共計188百萬,由其他非利息淨收益重新分類至手續費收入,此收入包含於下2列保代傭收中。
BSP's Fee Breakdown
Quaterly Results

Appendix
NT$Mn 2010 2011 4Q10 1Q11 2Q11 3Q11 4Q11 QoQ(%) YoY(%)
前期逾期放款餘額 90-days NPLs - beginning 5,867 3,596 4,077 3,596 3,480 2,738 3,170 15.77 -22.25當期新增逾放 New NPL influx 2,937 2,986 350 814 375 995 803 -19.31 129.07當期打銷呆帳 Write-offs 1,678 1,014 219 279 246 201 288 42.96 31.55當期回收金額 Recovery 3,530 2,171 613 652 870 362 288 -20.54 -53.06
本期逾期放款餘額本期逾期放款餘額本期逾期放款餘額本期逾期放款餘額 90-days NPLs - ending 3,596 3,398 3,596 3,480 2,738 3,170 3,398 7.18 -5.52
Provisions for credit loss呆帳費用提列-放款 Provision for loan loss, net 2,266 2,892 795 282 171 406 2,033 400.59 155.75呆帳費用提列-應收及保證 Provision for credit loss, net 0 139 0 59 4 -0 76 -21,083.01 NA呆帳費用提列-信用卡 Provision for credit card, net 306 -406 235 -106 -184 -75 -41 -45.52 -117.39
當期呆帳費用當期呆帳費用當期呆帳費用當期呆帳費用 Total provisions 2,572 2,625 1,030 236 -9 331 2,068 525.42 1 00.73備抵呆帳餘額備抵呆帳餘額備抵呆帳餘額備抵呆帳餘額 Total reserves 5,984 7,786 5,984 5,994 5,735 5,986 7,786 30 .08 30.12
2010 2011 4Q10 1Q11 2Q11 3Q11 4Q11 QoQ(+/-) YoY(+/-)
逾放比逾放比逾放比逾放比 NPL ratio
BSP's Asset Quality
Quarterly Results
Quarterly ResultsYearly Results
Yearly Results
55
逾放比逾放比逾放比逾放比 NPL ratio逾放比-信用卡 Credit card NPL ratio 0.65% 0.39% 0.65% 0.60% 0.47% 0.44% 0.39% -0.05% -0.26%逾放比-個金 Individual NPL ratio 0.24% 0.13% 0.24% 0.21% 0.18% 0.15% 0.13% -0.02% -0.11%逾放比-企金 Corporate NPL ratio 0.82% 0.83% 0.82% 0.77% 0.58% 0.74% 0.83% 0.09% 0.01%逾放比-全行 Total NPL ratio 0.52% 0.47% 0.52% 0.49% 0.38% 0.44% 0.47% 0.03% -0.05%
覆蓋率覆蓋率覆蓋率覆蓋率 Coverage ratio覆蓋率-信用卡 Credit card coverage ratio 587.55% 473.65% 587.55% 596.98% 489.80% 454.12% 473.65% 19.53% -113.90%覆蓋率-個金 Individual coverage ratio 246.65% 695.80% 246.65% 147.99% 240.28% 347.38% 695.80% 348.42% 449.15%覆蓋率-企金 Corporate coverage ratio 113.25% 133.11% 113.25% 152.08% 173.54% 135.46% 133.11% -2.35% 19.86%覆蓋率-全行 Total coverage ratio 145.77% 212.17% 145.77% 150.56% 188.03% 171.79% 212.17% 40.38% 66.40%
NT$ Mn 2010 2011 4Q10 1Q11 2Q11 3Q11 4Q11 QoQ(%) YoY(%)
流通卡數(張) Cards in force (accumulative) 1,433,176 2,178,989 1,433,176 1,649,935 1,816,754 2,132,497 2,178,989 2.18 52.04有效卡數(張) Active cards (accumulative) 886,540 1,344,938 886,540 921,495 1,019,041 1,302,970 1,344,938 3.22 51.71總消費金額 Total consumption 66,284 80,177 17,061 17,130 18,859 20,968 23,220 10.74 36.10總管理應收帳款餘額 Total managed assets 16,338 18,001 16,338 15,571 16,843 17,246 18,001 4.38 10.18循環應收帳款餘額 Revolving balance 7,001 5,772 7,001 6,739 6,236 5,964 5,772 -3.23 -17.56
2010 2011 4Q10 1Q11 2Q11 3Q11 4Q11 QoQ(+/-) YoY(+/-)
逾放比NPL ratio(90-day past due)
0.65% 0.39% 0.65% 0.60% 0.47% 0.44% 0.39% -0.05% -0.26%
覆蓋率 Coverage ratio 587.55% 473.65% 587.55% 596.98% 489.80% 454.12% 473.65% 19.53% -113.90%當期打銷呆帳 Write-off 351.29 213.93 65.12 65.27 56.64 45.88 46.13 25.23% -1898.33%淨轉催率 0.17% -0.76% 0.17% -0.49% -0.58% -0.70% -0.76% -0.06% -0.93%
Credit Card Business
Yearly Results Quarterly Results