100 LS 200 ESC 300 ESC 400 ESC 500 ESC - Amazon Web Services
www.HQOntario.ca
HQO QI Framework, ESC June 11, 12Sharon WhiteLinda HebelSue Jones
1www.HQOntario.ca
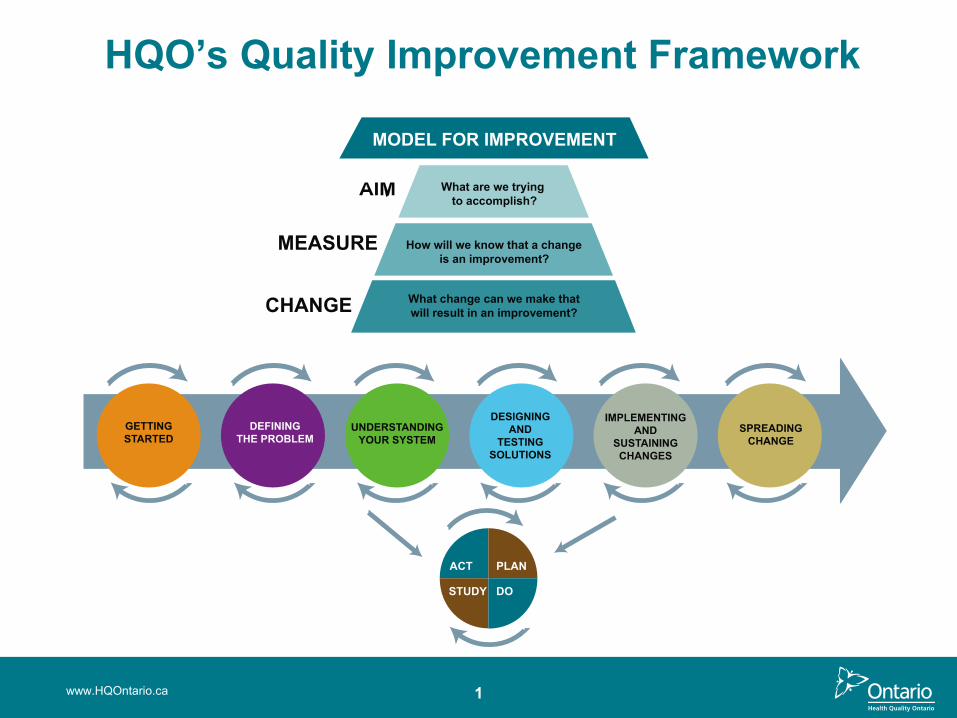
HQO’s Quality Improvement Framework
PLANACT
STUDY DO
What are we trying
to accomplish?
How will we know that a change
is an improvement?
What change can we make that
will result in an improvement?
MODEL FOR IMPROVEMENT
2www.HQOntario.ca
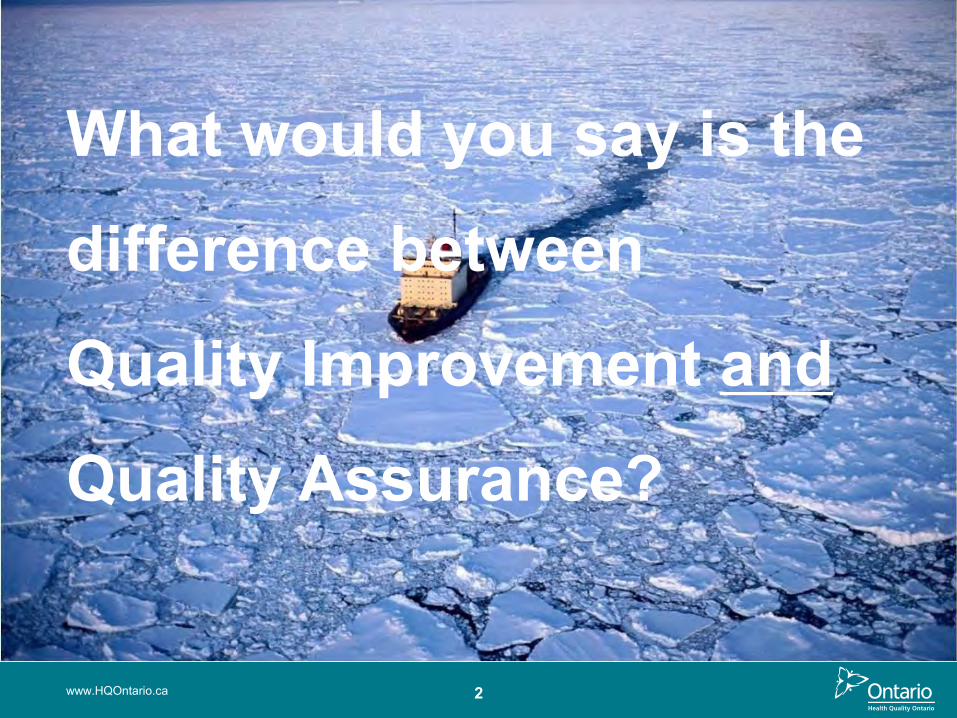
What would you say is the
difference between
Quality Improvement and
Quality Assurance?

Overview
3
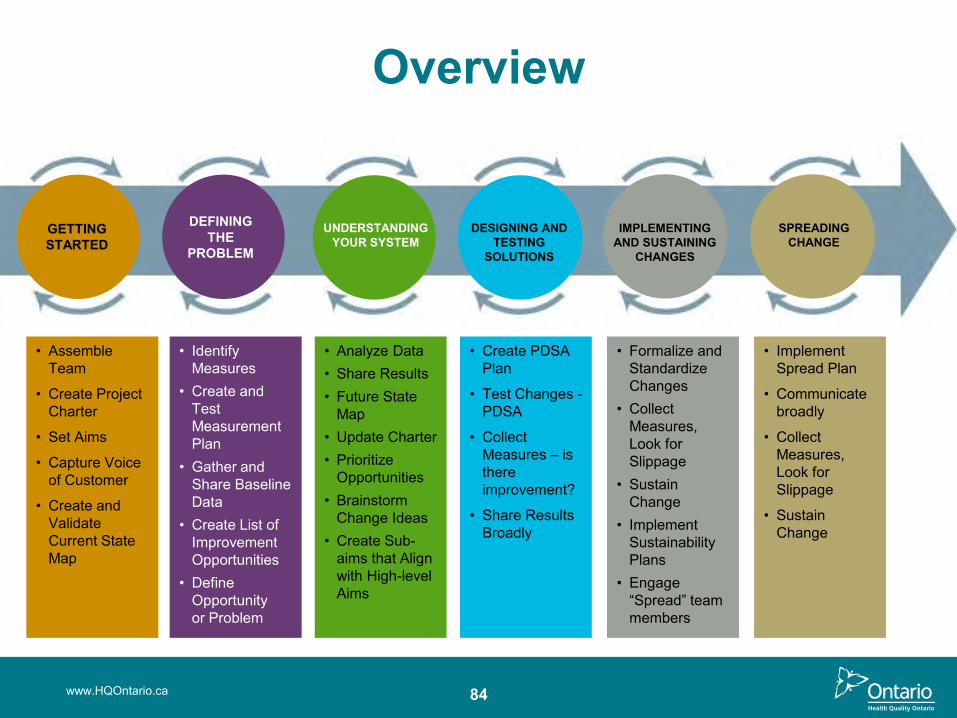
• Implement Spread Plan
• Communicate broadly
• Collect Measures, Look for Slippage
• Sustain Change
• Assemble Team
• Create Project Charter
• Set Aims
• Capture Voice of Customer
• Create and Validate Current State Map
• Identify Measures
• Create and Test Measurement Plan
• Gather and Share Baseline Data
• Create List of Improvement Opportunities
• Define Opportunity or Problem
• Analyze Data• Share Results• Future State
Map• Update Charter• Prioritize
Opportunities• Brainstorm
Change Ideas• Create Sub-
aims that Align with High-level Aims
• Create PDSA Plan
• Test Changes -PDSA
• Collect Measures – is there improvement?
• Share Results Broadly
• Formalize and Standardize Changes
• Collect Measures, Look for Slippage
• Sustain Change
• Implement Sustainability Plans
• Engage “Spread” team members
www.HQOntario.ca
GETTING STARTED
DEFININGTHE
PROBLEM
UNDERSTANDING YOUR SYSTEM
DESIGNING AND TESTING
SOLUTIONS
IMPLEMENTING AND SUSTAINING
CHANGES
SPREADING CHANGE
www.HQOntario.ca
Getting Started Phase
5
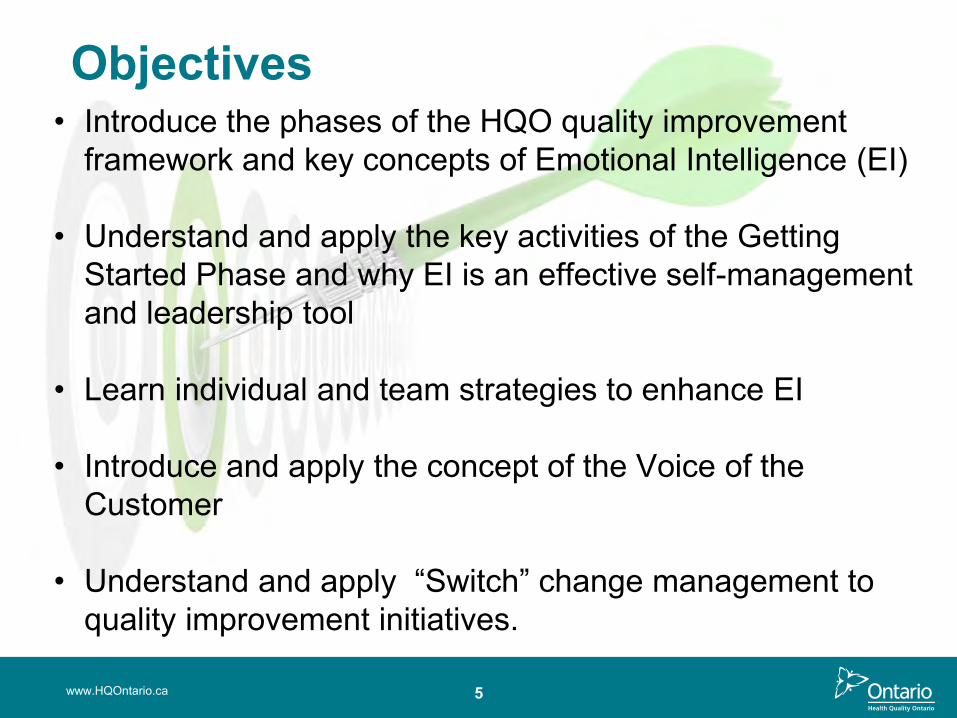
Objectives• Introduce the phases of the HQO quality improvement
framework and key concepts of Emotional Intelligence (EI)
• Understand and apply the key activities of the Getting Started Phase and why EI is an effective self-management and leadership tool
• Learn individual and team strategies to enhance EI
• Introduce and apply the concept of the Voice of the Customer
• Understand and apply “Switch” change management to quality improvement initiatives.
www.HQOntario.ca
6www.HQOntario.ca
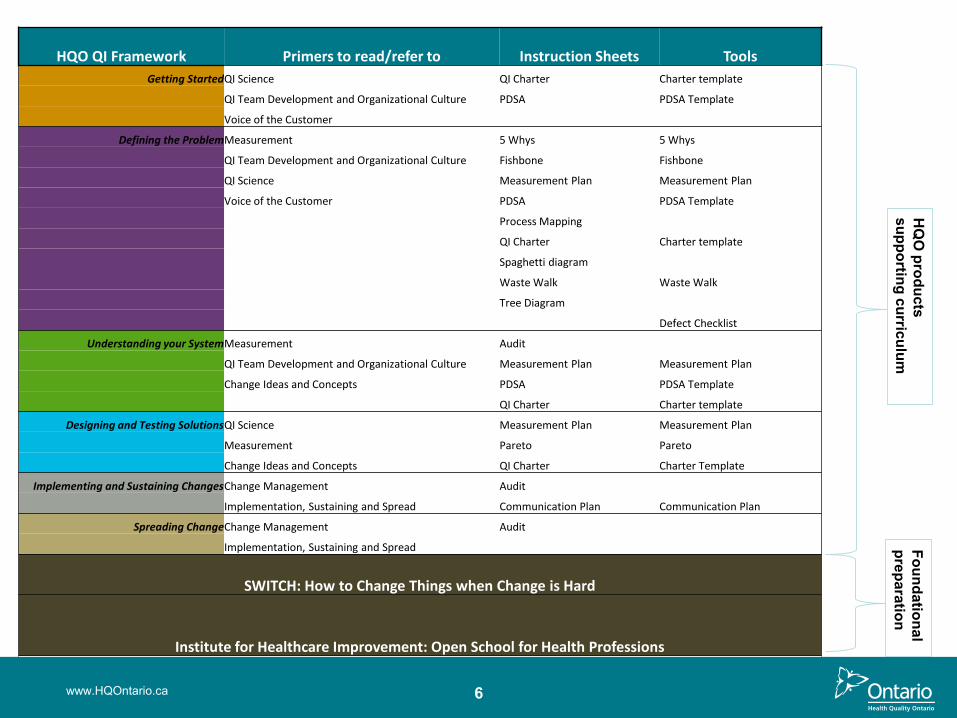
HQO QI Framework Primers to read/refer to Instruction Sheets Tools
Getting StartedQI Science QI Charter Charter template
QI Team Development and Organizational Culture PDSA PDSA Template
Voice of the Customer
Defining the ProblemMeasurement 5 Whys 5 Whys
QI Team Development and Organizational Culture Fishbone Fishbone
QI Science Measurement Plan Measurement Plan
Voice of the Customer PDSA PDSA Template
Process Mapping
QI Charter Charter template
Spaghetti diagram
Waste Walk Waste Walk
Tree Diagram
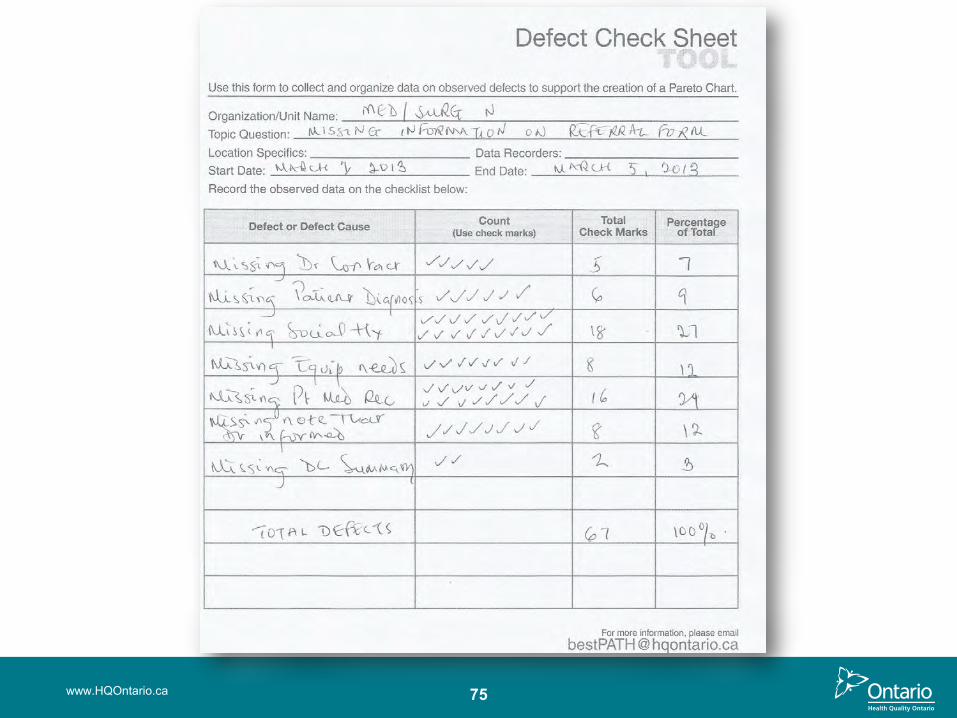
Defect Checklist
Understanding your SystemMeasurement Audit
QI Team Development and Organizational Culture Measurement Plan Measurement Plan
Change Ideas and Concepts PDSA PDSA Template
QI Charter Charter template
Designing and Testing SolutionsQI Science Measurement Plan Measurement Plan
Measurement Pareto Pareto
Change Ideas and Concepts QI Charter Charter Template
Implementing and Sustaining ChangesChange Management Audit
Implementation, Sustaining and Spread Communication Plan Communication Plan
Spreading ChangeChange Management Audit
Implementation, Sustaining and Spread
SWITCH: How to Change Things when Change is Hard
Institute for Healthcare Improvement: Open School for Health Professions
HQ
O products
supporting curriculumFoundational preparation
7
QI
www.HQOntario.ca
ME&
Needs picture
www.HQOntario.ca 8
What is a

9
Lessons from the Geese
www.HQOntario.ca
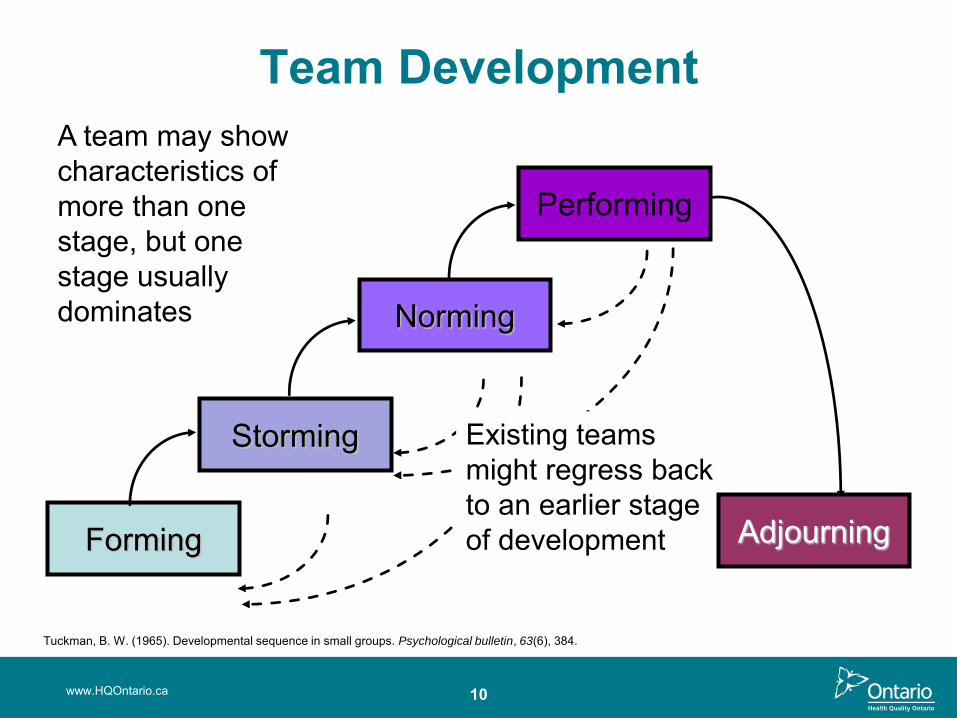
Existing teams might regress back to an earlier stage of developmentForming
Storming
Norming
Performing
Adjourning
Team DevelopmentA team may show characteristics of more than one stage, but one stage usually dominates
www.HQOntario.ca 10
Tuckman, B. W. (1965). Developmental sequence in small groups. Psychological bulletin, 63(6), 384.
11
Emotional Intelligence (EI)
• HQO Framework – What
• EI - How
www.HQOntario.ca
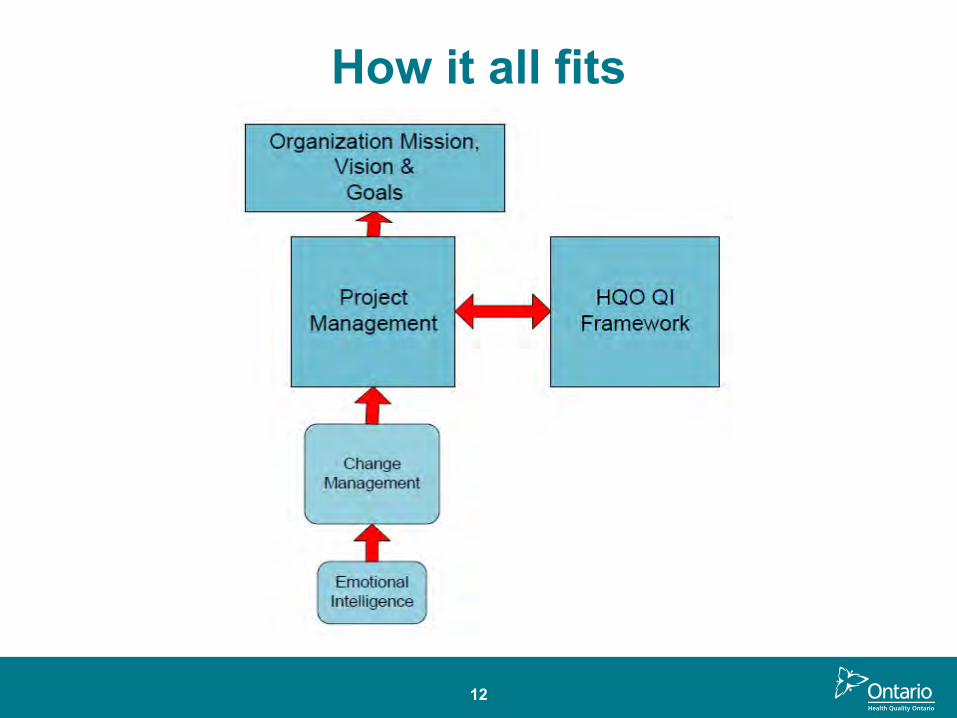
How it all fits
12
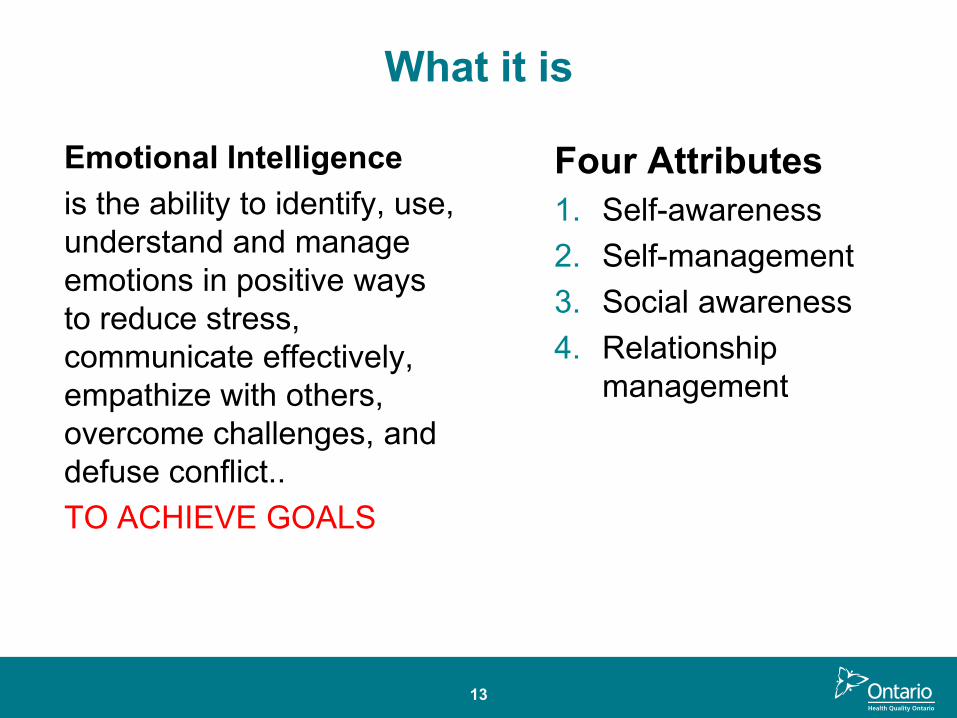
What it is
Emotional Intelligence is the ability to identify, use, understand and manage emotions in positive ways to reduce stress, communicate effectively, empathize with others, overcome challenges, and defuse conflict..TO ACHIEVE GOALS
Four Attributes1. Self-awareness2. Self-management3. Social awareness4. Relationship
management
13
14
The Importance of EQ• Start with self
• IQ and EQ
• Strong EQ
– Better physical and mental functioning– Better communication and relationships– Improves productivity, self and team
15
EQ Can be Learned
HOW?
• Recognize and reduce stress • Identify emotions• Improve non verbal communication• Use humour to deal with challenges• Resolve conflict positively
15
16
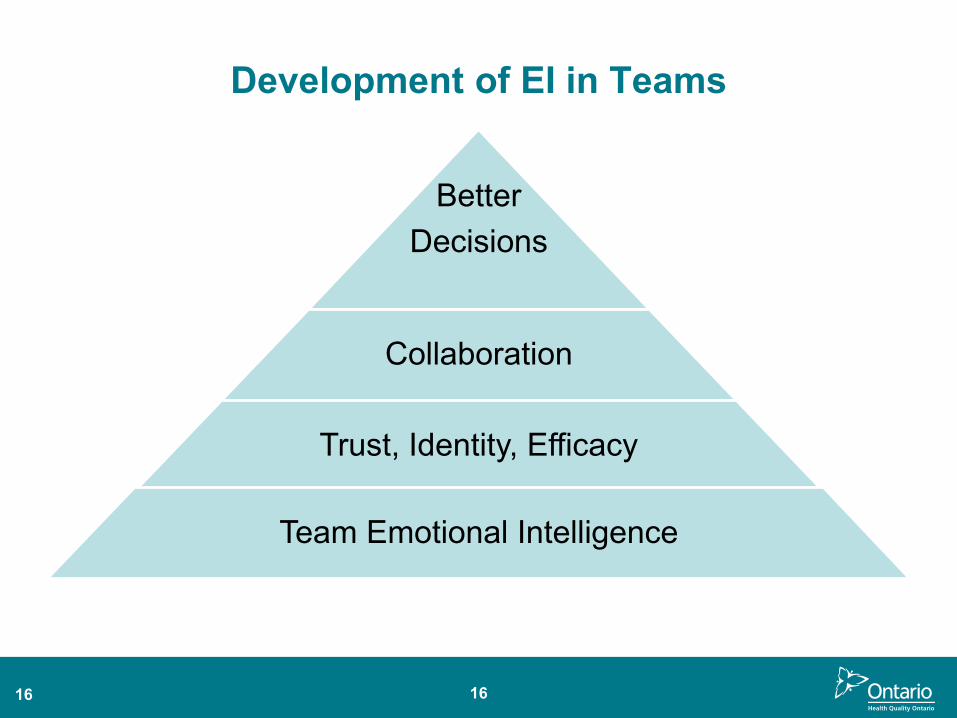
Development of EI in Teams
BetterDecisions
Collaboration
Trust, Identity, Efficacy
Team Emotional Intelligence
16

www.HQOntario.ca 17

Capturing the Voice of the Customer (VOC)
www.HQOntario.ca 18
19
Capturing the Voice of the Customer
GROUP EXERCISE - Video
• How was Voice of Customer (VOC)captured?
• What are the benefits?• What will you do differently?• Why is capturing VOC such
an important part of this phase?
www.HQOntario.ca
http://www.institute.nhs.uk/quality_and_value/experienced_based_design/ebd_approach_videos.html
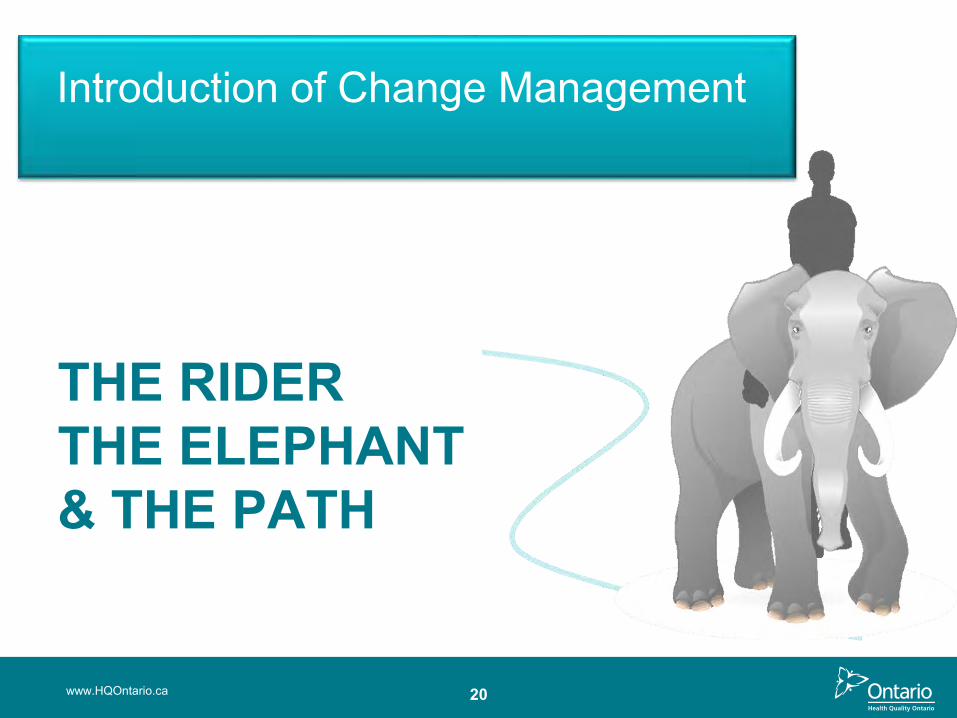
THE RIDER THE ELEPHANT & THE PATH
Introduction of Change Management
www.HQOntario.ca 20
Group ExerciseForm 2 groups : Group A: perspective of organization
Group B: perspective of individual
Apply the change framework to the Getting Started phase and answer the following questions:
• What might “spook” the elephant about this phase and what might be proactive actions?
• What might “spin” the rider and what might be proactive actions?
• What could you do to shape the path?
www.HQOntario.ca 21
22
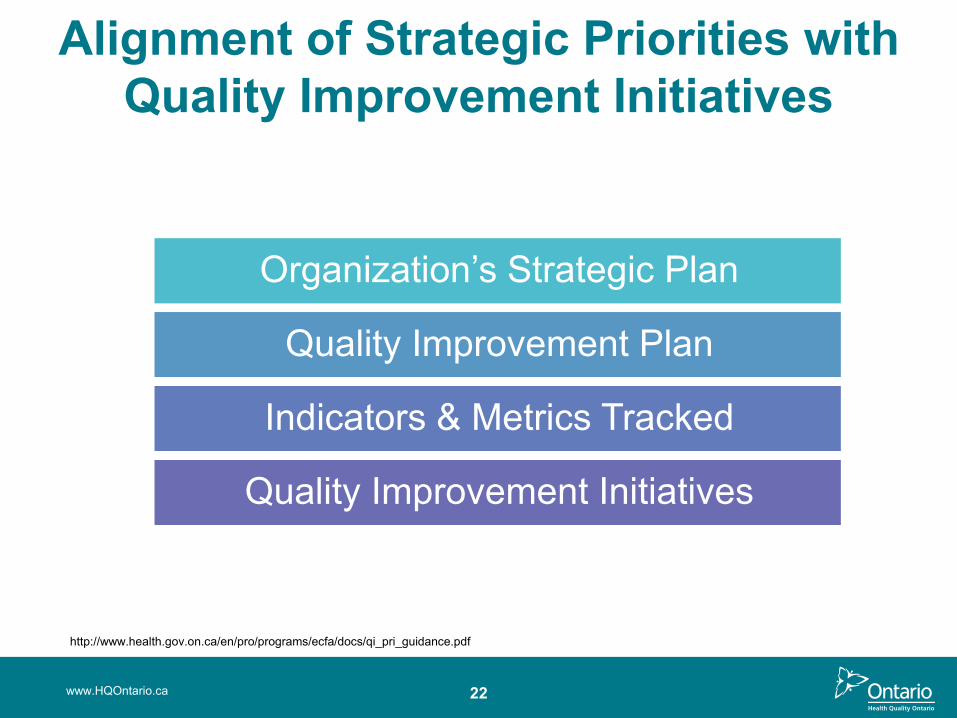
Alignment of Strategic Priorities with Quality Improvement Initiatives
Organization’s Strategic Plan
Quality Improvement Plan
Indicators & Metrics Tracked
Quality Improvement Initiatives
www.HQOntario.ca
http://www.health.gov.on.ca/en/pro/programs/ecfa/docs/qi_pri_guidance.pdf

Aims Drive Your QI Charter
• Safe • Effective• Patient-Centred• Timely• Efficient• Equitable• & Integrated
www.HQOntario.ca 23
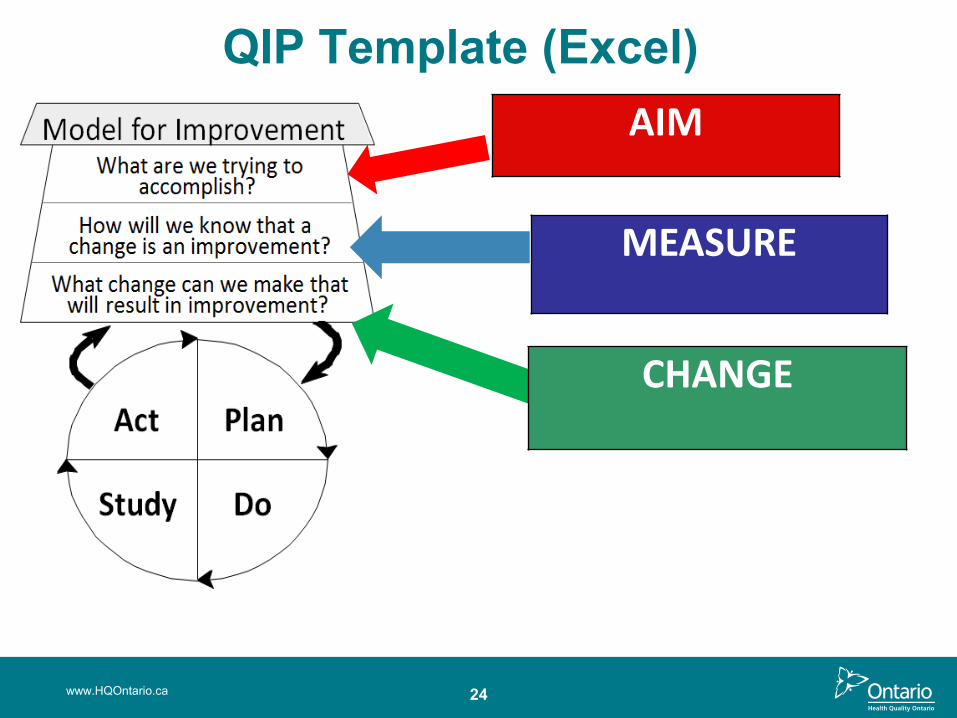
QIP Template (Excel)
www.HQOntario.ca
AIM
MEASURE
CHANGE
24

25
Stakeholder Mapping
www.HQOntario.ca
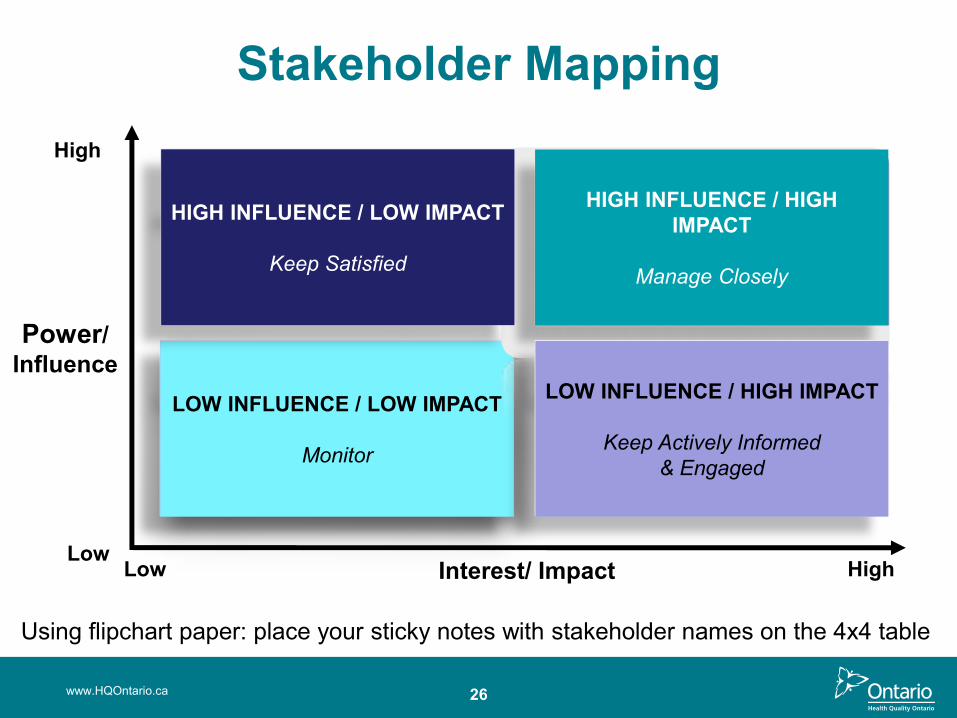
LOW INFLUENCE / LOW IMPACT
Monitor
HIGH INFLUENCE / HIGH IMPACT
Manage Closely
HIGH INFLUENCE / LOW IMPACT
Keep Satisfied
LOW INFLUENCE / HIGH IMPACT
Keep Actively Informed& Engaged
High
Power/Influence
LowLow Interest/ Impact High
Stakeholder Mapping
26www.HQOntario.ca
Using flipchart paper: place your sticky notes with stakeholder names on the 4x4 table
27
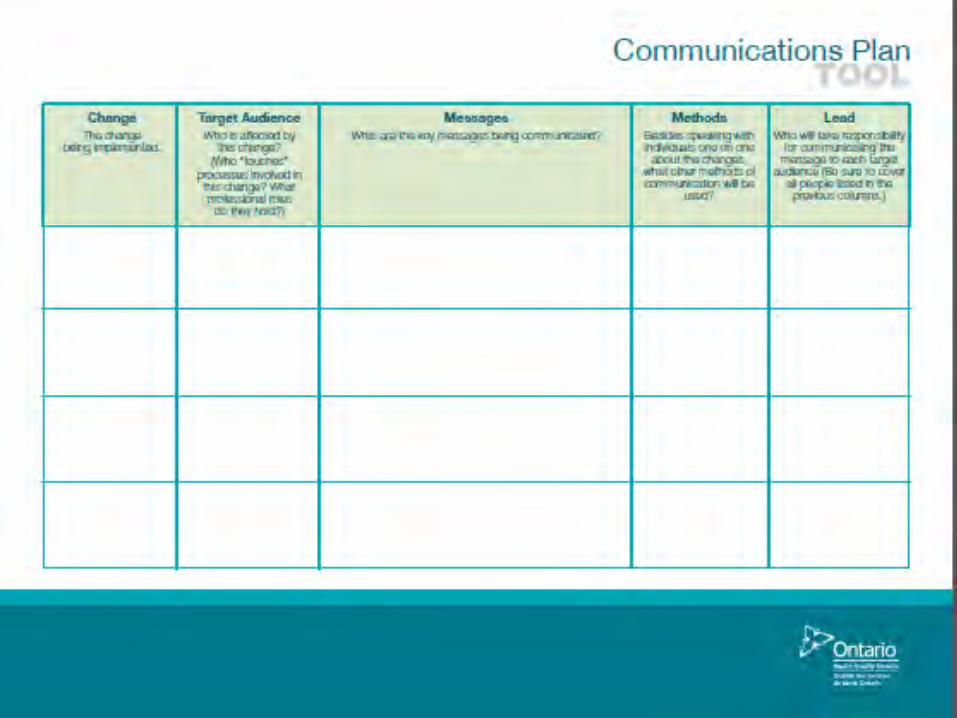
Communications plan
www.HQOntario.ca

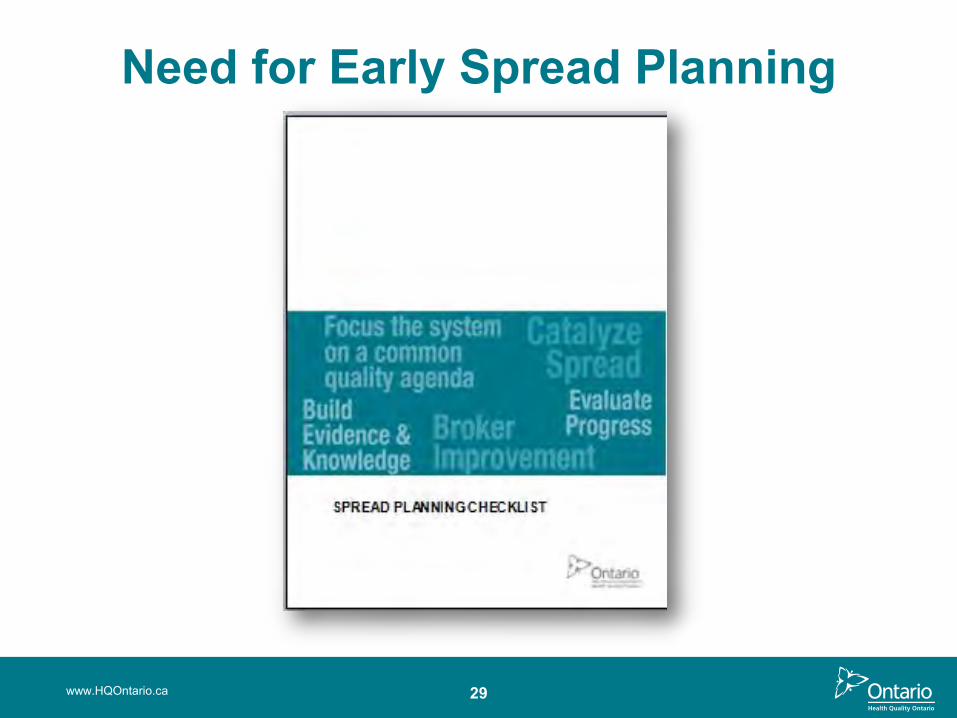
Sustainability…ongoing attentionand continuous improvement
“Sustainability is not a ‘project’ with an end-point. It is rather a constant effort to
embed a change into the fabric of daily work.”
“We do not actually want completely sustainable change because today’s sustained change becomes tomorrow’s resistance to change. Instead we want change that sustains itself until a better idea or a context-shift occurs – but not longer than that.”
Source: Improvement leaders’ guide to sustainability and spread. NHS Modernization Agency
28
29
Need for Early Spread Planning
www.HQOntario.ca
30
Summary
www.HQOntario.ca
• Introduce the phases of the HQO quality improvement framework and key concepts of Emotional Intelligence (EI)
• Understand and apply the key activities of the Getting Started Phase and why EI is an effective self-management and leadership tool
• Learn individual and team strategies to enhance EI
• Introduce and apply the concept of the Voice of the Customer
• Understand and apply the “Switch” change management strategy.

Summary and Reflection
www.HQOntario.ca 31

www.HQOntario.ca 32

www.HQOntario.ca
Defining The Problem
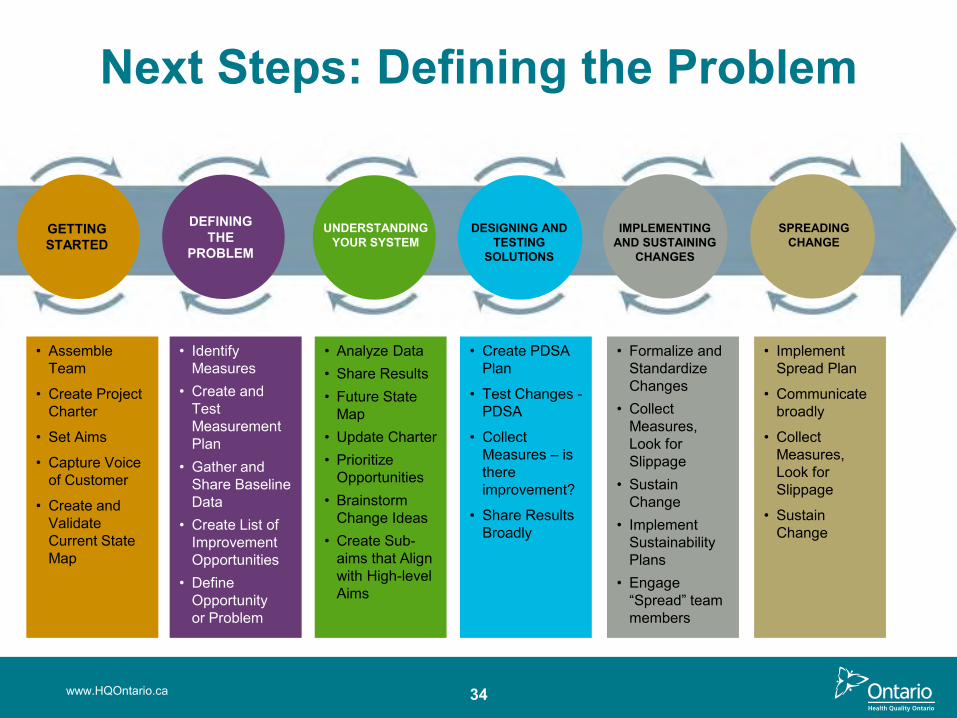
Next Steps: Defining the Problem
34
• Implement Spread Plan
• Communicate broadly
• Collect Measures, Look for Slippage
• Sustain Change
• Assemble Team
• Create Project Charter
• Set Aims
• Capture Voice of Customer
• Create and Validate Current State Map
• Identify Measures
• Create and Test Measurement Plan
• Gather and Share Baseline Data
• Create List of Improvement Opportunities
• Define Opportunity or Problem
• Analyze Data• Share Results• Future State
Map• Update Charter• Prioritize
Opportunities• Brainstorm
Change Ideas• Create Sub-
aims that Align with High-level Aims
• Create PDSA Plan
• Test Changes -PDSA
• Collect Measures – is there improvement?
• Share Results Broadly
• Formalize and Standardize Changes
• Collect Measures, Look for Slippage
• Sustain Change
• Implement Sustainability Plans
• Engage “Spread” team members
www.HQOntario.ca
GETTING STARTED
DEFININGTHE
PROBLEM
UNDERSTANDING YOUR SYSTEM
DESIGNING AND TESTING
SOLUTIONS
IMPLEMENTING AND SUSTAINING
CHANGES
SPREADING CHANGE
www.HQOntario.ca
Objectives
• Identify and understand the core concepts of pausing and probing in quality improvement
• Have an awareness of the various tools (process mapping, fishbone and 5 whys) for this Defining the Problem Phase
• Application of the various tools to define the problem
• Have an understanding of the types of measures used to probe a problem (Day 2)

www.HQOntario.ca 36
Defining the Problem
www.HQOntario.ca
“If I were given onehour to save the planet, Iwould spend 59 minutes defining the problem andone minute resolving it.”
- Albert Einstein
37

38
“Our challenge is not to develop more sensitive ways to detect our risks, our errors, our flaws, our variation, our indignities, our fragmentation, our delays, our waste, our insults to the people we say we exist to serve.
Our challenge is to have the courage to name clearly and boldly the problems we have."
Donald Berwick, President and CEO of the Institute for Healthcare Improvement
www.HQOntario.ca
39
Pause & Probe
www.HQOntario.ca
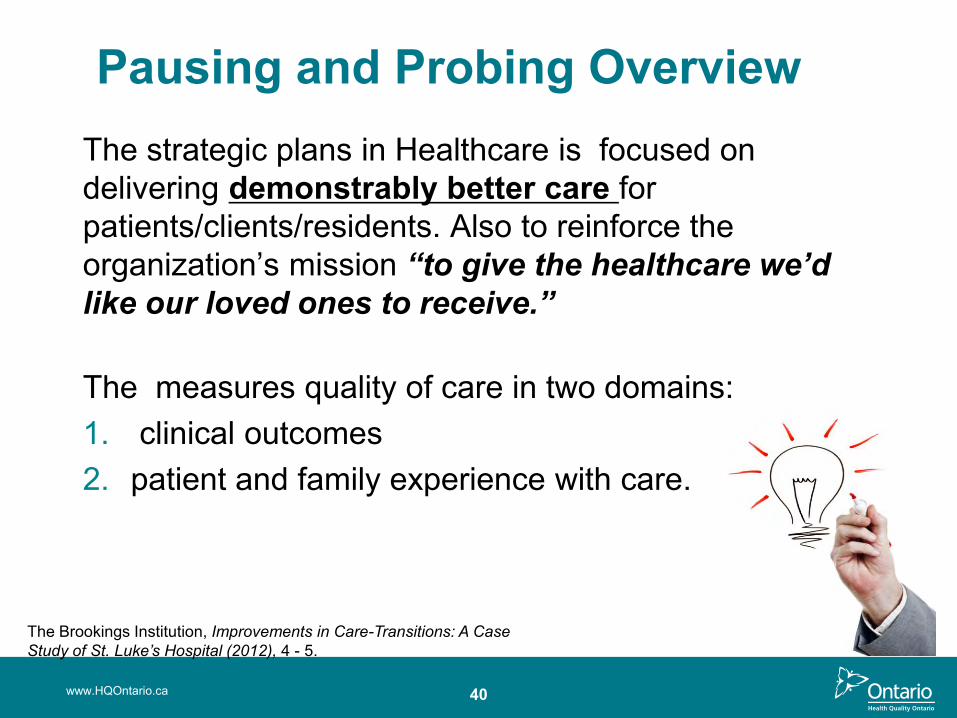
Pausing and Probing Overview The strategic plans in Healthcare is focused on delivering demonstrably better care for patients/clients/residents. Also to reinforce the organization’s mission “to give the healthcare we’d like our loved ones to receive.”
The measures quality of care in two domains:1. clinical outcomes 2. patient and family experience with care.
The Brookings Institution, Improvements in Care-Transitions: A Case Study of St. Luke’s Hospital (2012), 4 - 5.
40www.HQOntario.ca
41
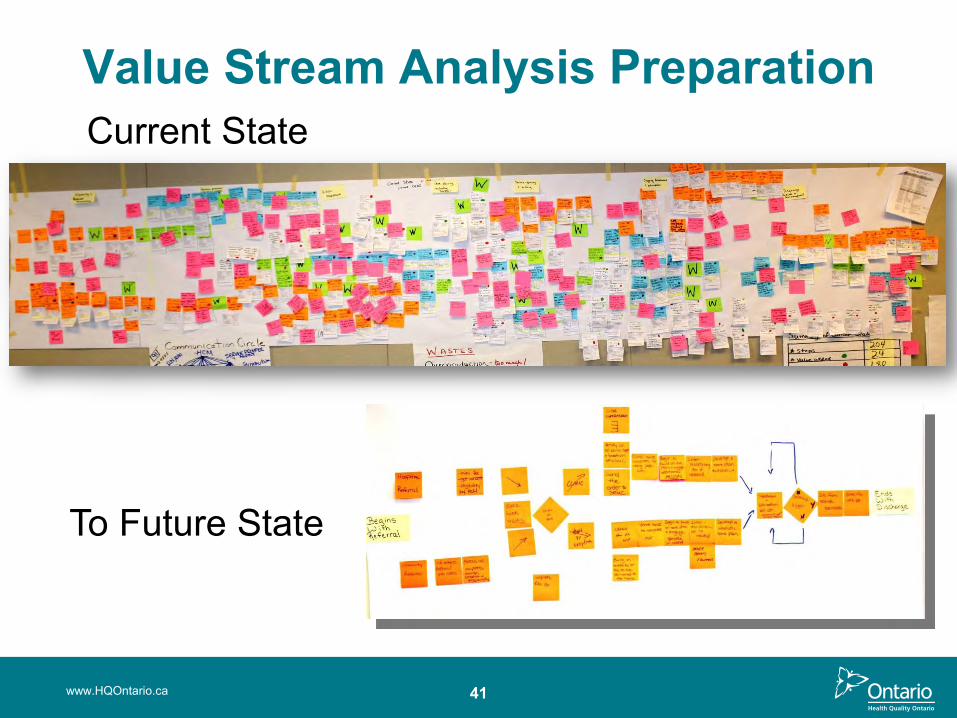
Value Stream Analysis Preparation
www.HQOntario.ca
Current State
To Future State
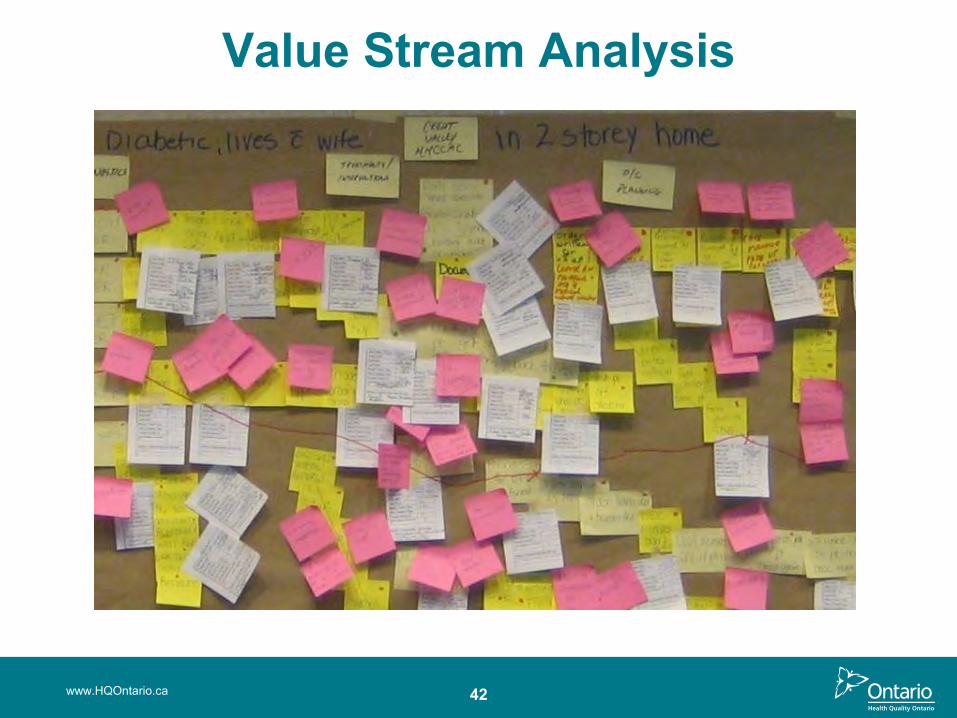
Value Stream Analysis
www.HQOntario.ca 42
www.HQOntario.ca 43
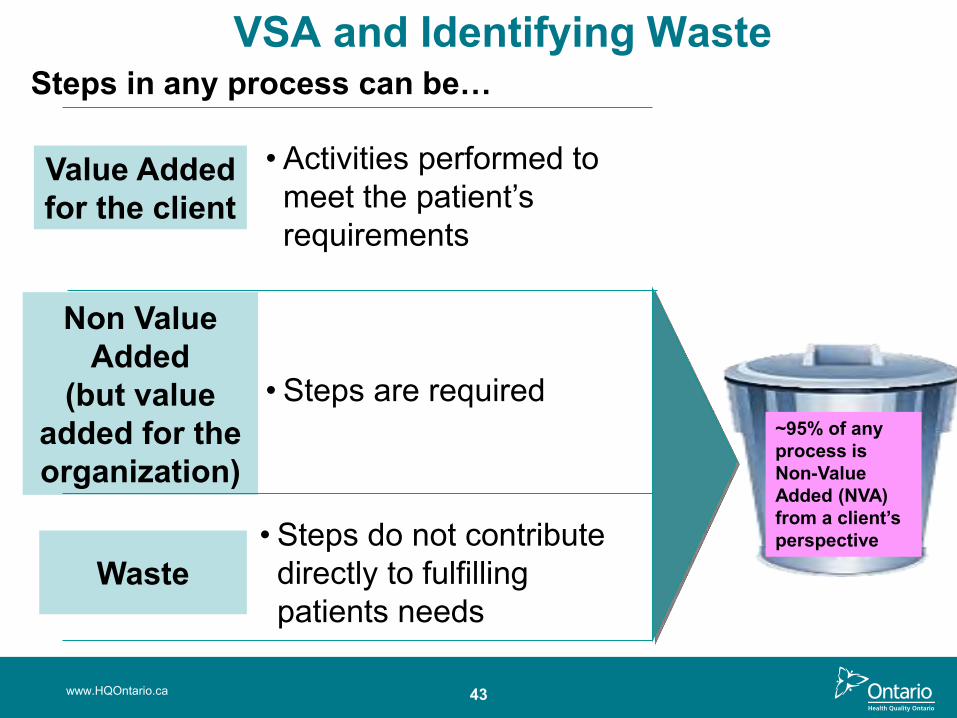
VSA and Identifying Waste
Value Addedfor the client
• Activities performed to meet the patient’s requirements
Non Value Added
(but value added for the organization)
Waste
• Steps are required
• Steps do not contribute directly to fulfilling patients needs
Steps in any process can be…
~95% of any process is Non-Value Added (NVA) from a client’s perspective
www.HQOntario.ca 44
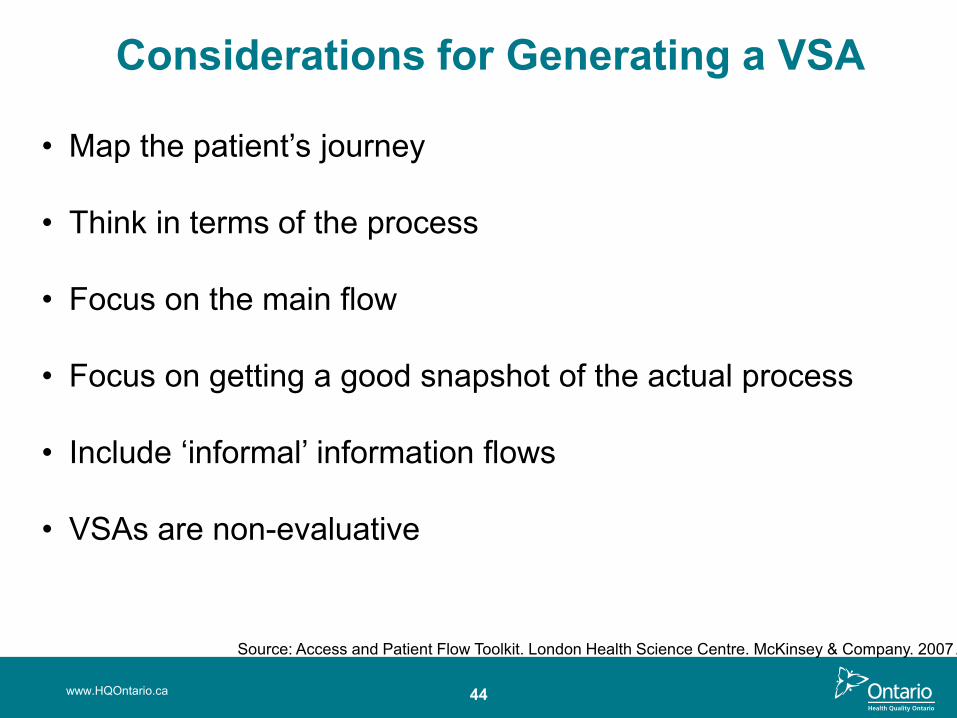
Considerations for Generating a VSA
Source: Access and Patient Flow Toolkit. London Health Science Centre. McKinsey & Company. 2007.
• Map the patient’s journey
• Think in terms of the process
• Focus on the main flow
• Focus on getting a good snapshot of the actual process
• Include ‘informal’ information flows
• VSAs are non-evaluative
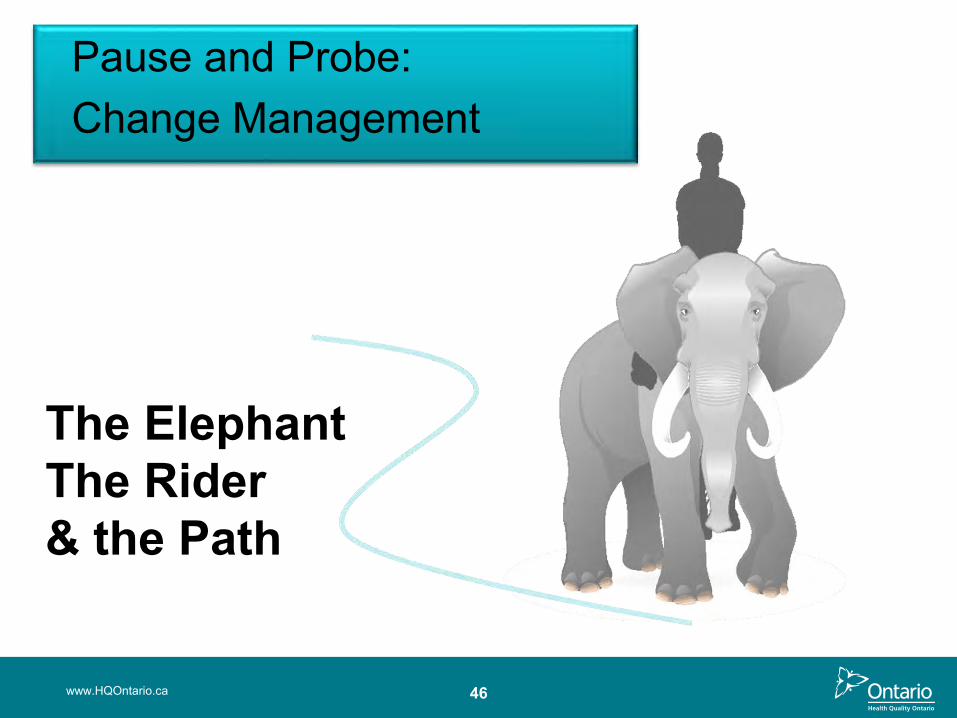
46www.HQOntario.ca
The Elephant The Rider & the Path
Pause and Probe: Change Management
47
Probing ToolsWhy Create a Process Map?
• Ensure that everyone has the same understanding of the process and guide quality improvement efforts
• Clarify roles and relationships in the process
• Reduce variation
• Plan a test of change (PDSA)
www.HQOntario.ca
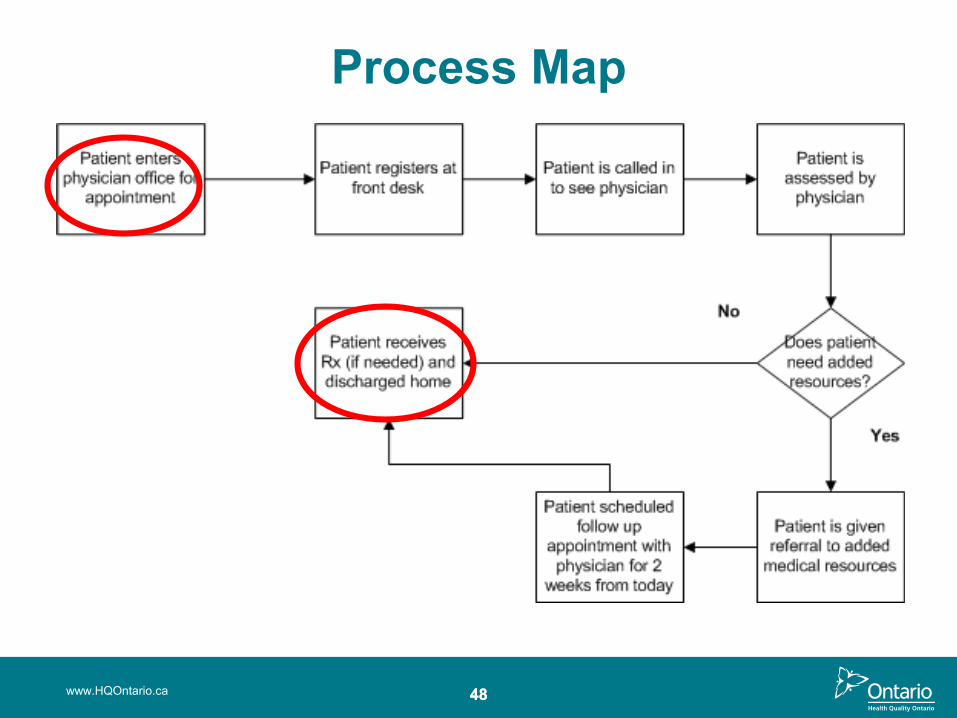
Process Map
www.HQOntario.ca 4848
49
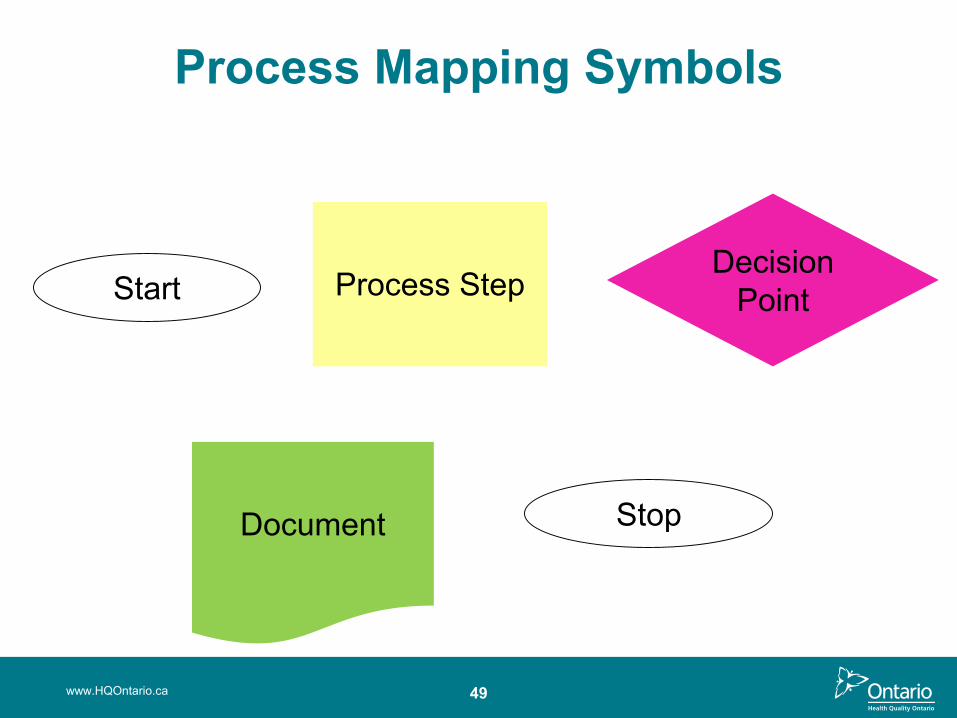
Process Mapping Symbols
www.HQOntario.ca
Process StepDecision
Point
Document
Start
Stop

50
Process Mapping Analysis With the patient and health care professional in mind, review your process map to see:
• How many steps are there?
• What are the gaps? Are there any of the 8 wastes?
• How many hand-offs are there?
• What opportunities are there for tests of change? PDSA’s generated?
www.HQOntario.ca
51
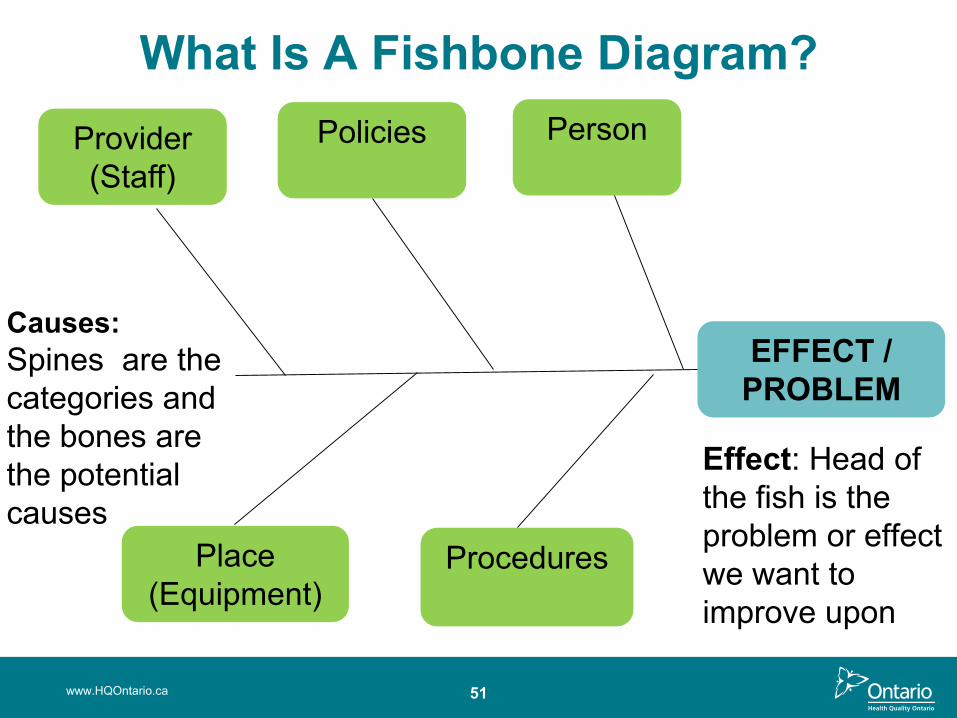
What Is A Fishbone Diagram?
www.HQOntario.ca
EFFECT / PROBLEM
Provider (Staff)
Policies Person
Place(Equipment)
Procedures
Effect: Head of the fish is the problem or effect we want to improve upon
Causes:Spines are the categories and the bones are the potential causes
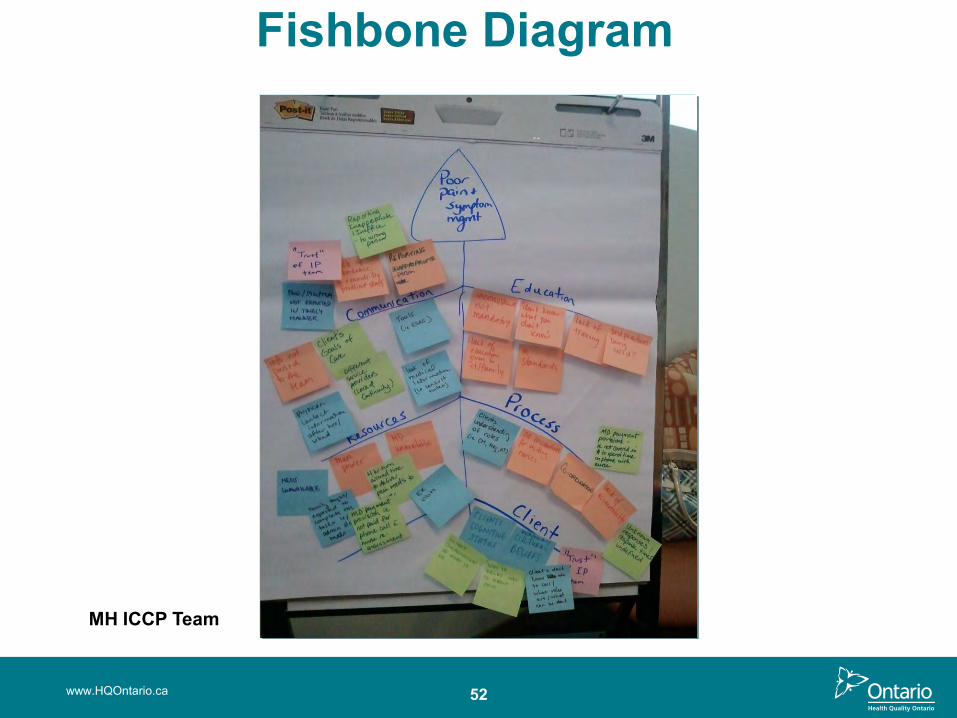
www.HQOntario.ca 52
MH ICCP Team
Fishbone Diagram
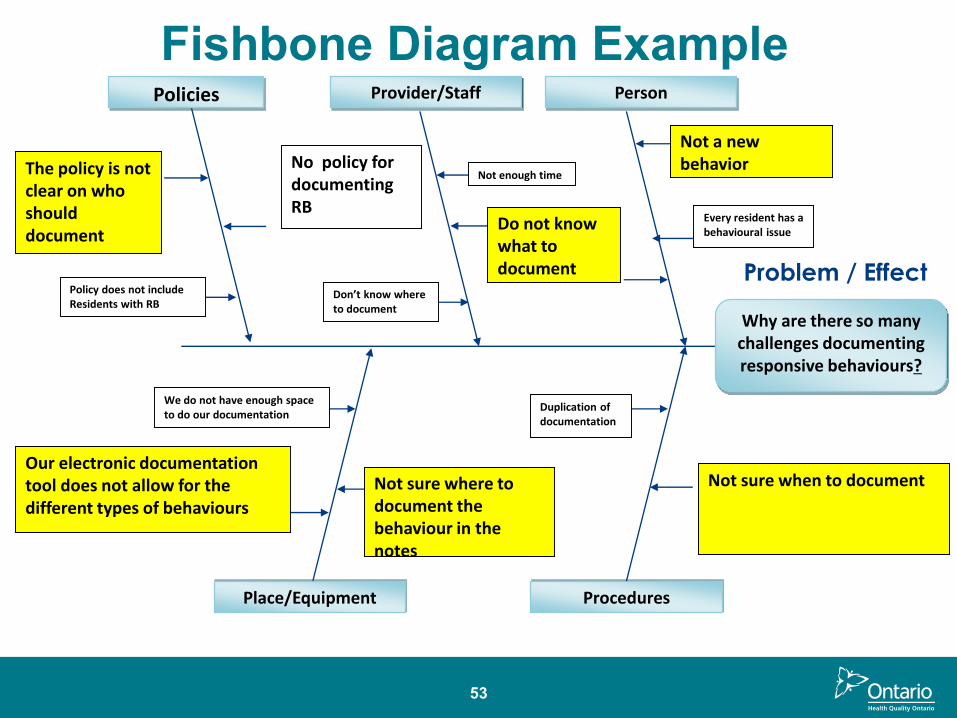
53
Problem / Effect
Why are there so many challenges documenting responsive behaviours?
Policies Provider/Staff Person
Place/Equipment Procedures
Not a new behavior No policy for
documenting RB
The policy is not clear on who should document
Not sure when to documentNot sure where to document the behaviour in the notes
We do not have enough space to do our documentation
Our electronic documentation tool does not allow for the different types of behaviours
Don’t know where to document
Not enough time
Policy does not include Residents with RB
Do not know what to document
Every resident has a behavioural issue
Duplication of documentation
Fishbone Diagram Example
5 Why Analysis
www.HQOntario.ca 54
What is 5 Why?
• Simple yet highly effective
• Any problem, any process, any system
• How to engage staff and use “why” to dig deep into the causes of an issue
• Identifying what the team has the power to change
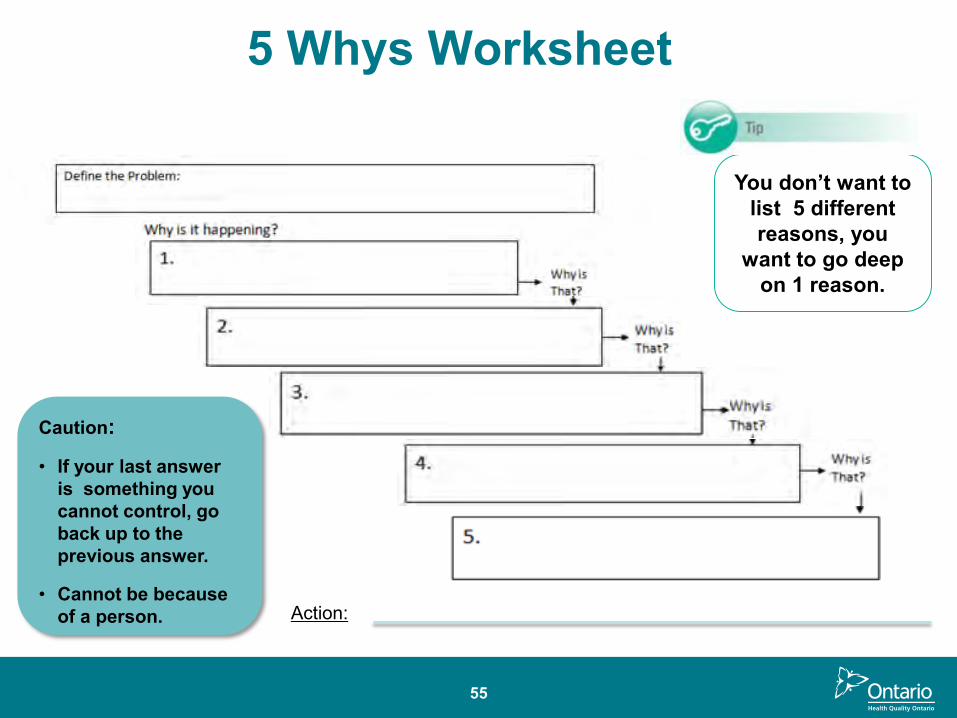
55
You don’t want to list 5 different reasons, you
want to go deep on 1 reason.
Caution:
• If your last answer is something you cannot control, go back up to the previous answer.
• Cannot be because of a person.
5 Whys Worksheet
Action:
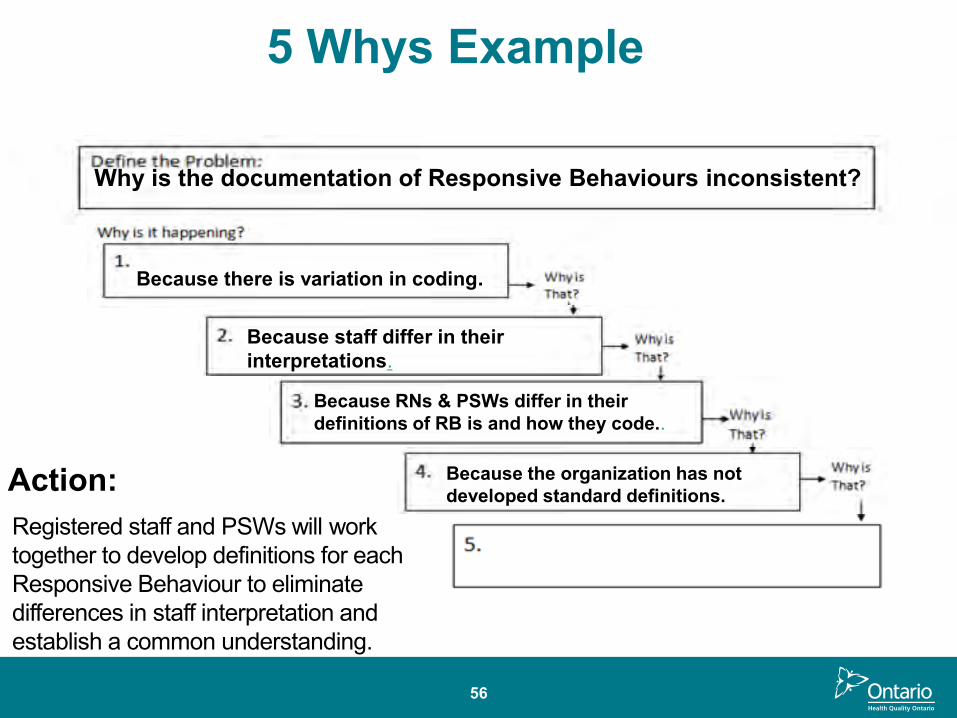
56
5 Whys Example
Why is the documentation of Responsive Behaviours inconsistent?
Because there is variation in coding.
Because staff differ in their interpretations.
Because RNs & PSWs differ in their definitions of RB is and how they code..
Because the organization has not developed standard definitions.Action:
Registered staff and PSWs will work together to develop definitions for each Responsive Behaviour to eliminate differences in staff interpretation and establish a common understanding.
WORLD CAFE
Instructions:
Participants are going to work in groups to practice using 3 different probing tools:
• Process Mapping
• Fishbone
• 5 whys
www.HQOntario.ca 57

58www.HQOntario.ca
Summary and Reflection

Overview
59
• Implement Spread Plan
• Communicate broadly
• Collect Measures, Look for Slippage
• Sustain Change
• Assemble Team
• Create Project Charter
• Set Aims
• Capture Voice of Customer
• Create and Validate Current State Map
• Identify Measures
• Create and Test Measurement Plan
• Gather and Share Baseline Data
• Create List of Improvement Opportunities
• Define Opportunity or Problem
• Analyze Data• Share Results• Future State
Map• Update Charter• Prioritize
Opportunities• Brainstorm
Change Ideas• Create Sub-
aims that Align with High-level Aims
• Create PDSA Plan
• Test Changes -PDSA
• Collect Measures – is there improvement?
• Share Results Broadly
• Formalize and Standardize Changes
• Collect Measures, Look for Slippage
• Sustain Change
• Implement Sustainability Plans
• Engage “Spread” team members
www.HQOntario.ca
GETTING STARTED
DEFININGTHE
PROBLEM
UNDERSTANDING YOUR SYSTEM
DESIGNING AND TESTING
SOLUTIONS
IMPLEMENTING AND SUSTAINING
CHANGES
SPREADING CHANGE
www.HQOntario.ca
Objectives
• Identify and understand the core concepts of pausing and probing in quality improvement
• Have an awareness of the various tools (process mapping, fishbone and 5 whys) for this Defining the Problem Phase
• Application of the various tools to define the problem
• Have an understanding of the types of measures used to probe a problem
?
61www.HQOntario.ca

www.HQOntario.ca 62
www.HQOntario.ca
MEASUREMENT OVERVIEW
63
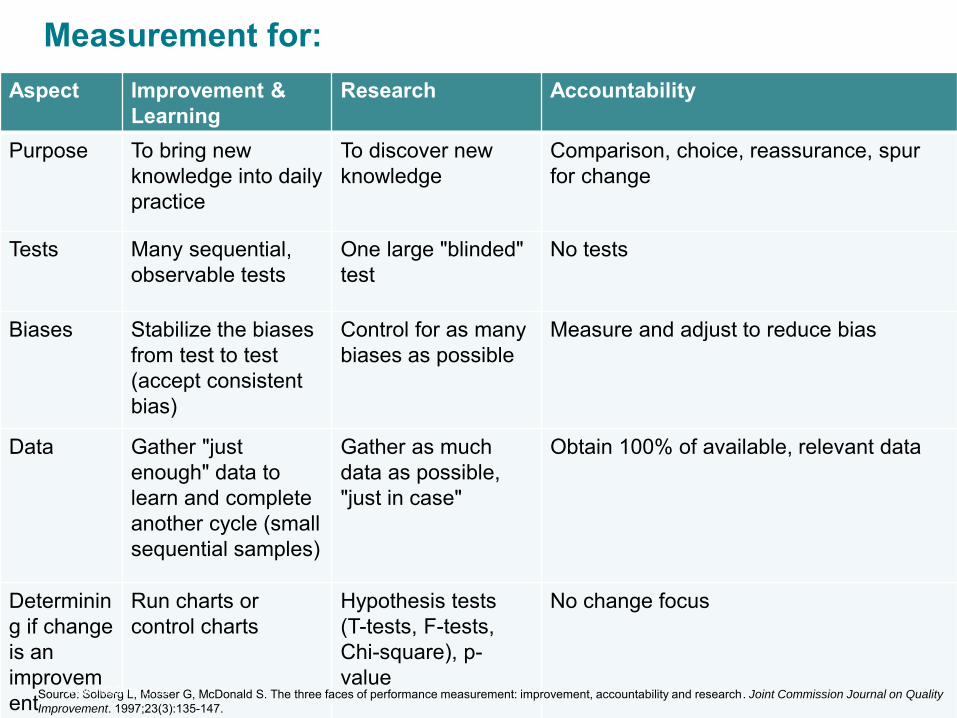
Measurement for:
64
Aspect Improvement & Learning
Research Accountability
Purpose To bring new knowledge into daily practice
To discover new knowledge
Comparison, choice, reassurance, spur for change
Tests Many sequential, observable tests
One large "blinded" test
No tests
Biases Stabilize the biases from test to test (accept consistent bias)
Control for as many biases as possible
Measure and adjust to reduce bias
Data Gather "just enough" data to learn and complete another cycle (small sequential samples)
Gather as much data as possible, "just in case"
Obtain 100% of available, relevant data
Determining if change is an improvement
Run charts or control charts
Hypothesis tests (T-tests, F-tests, Chi-square), p-value
No change focus
Source: Solberg L, Mosser G, McDonald S. The three faces of performance measurement: improvement, accountability and research. Joint Commission Journal on Quality
Improvement. 1997;23(3):135-147.www.HQOntario.ca
65
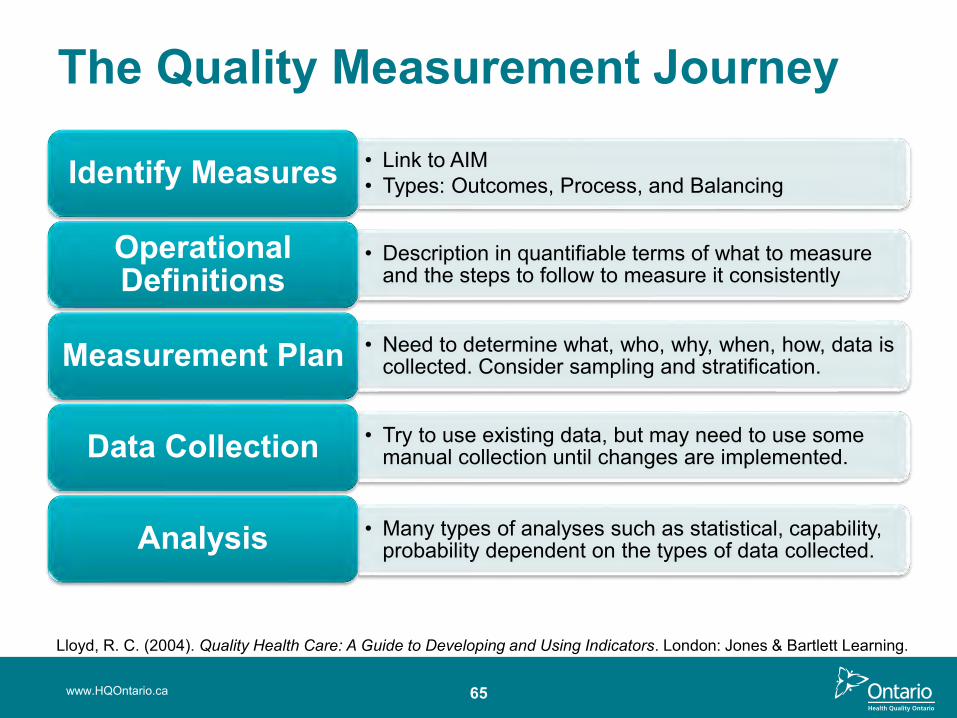
The Quality Measurement Journey
• Link to AIM• Types: Outcomes, Process, and BalancingIdentify Measures
• Description in quantifiable terms of what to measure and the steps to follow to measure it consistently
Operational Definitions
• Need to determine what, who, why, when, how, data is collected. Consider sampling and stratification. Measurement Plan
• Try to use existing data, but may need to use some manual collection until changes are implemented.Data Collection
• Many types of analyses such as statistical, capability, probability dependent on the types of data collected.Analysis
www.HQOntario.ca
Lloyd, R. C. (2004). Quality Health Care: A Guide to Developing and Using Indicators. London: Jones & Bartlett Learning.
66
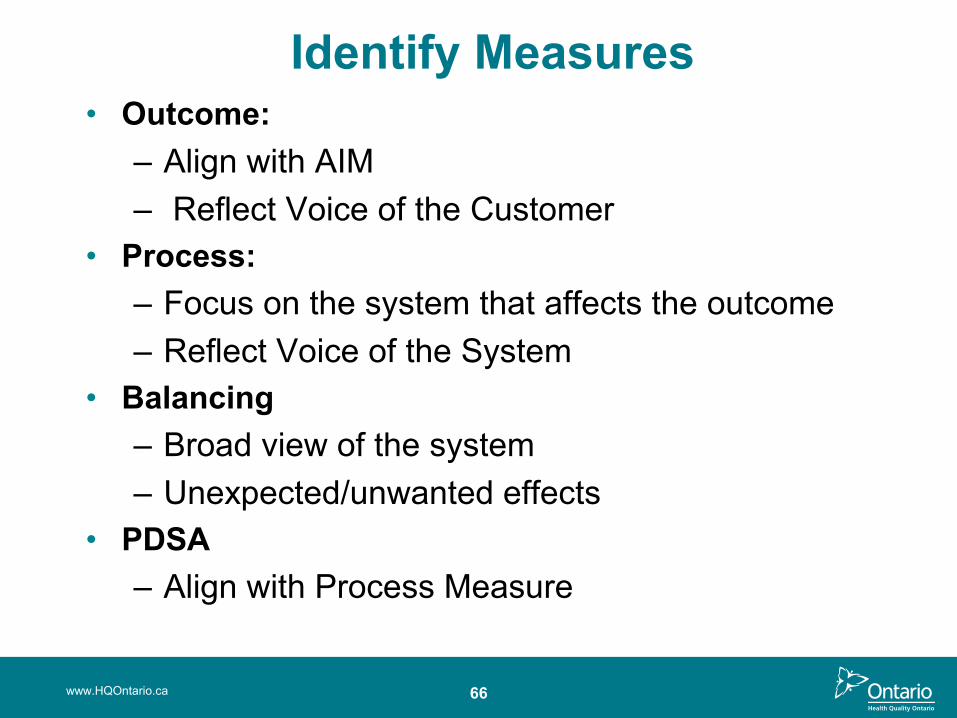
Identify Measures• Outcome:
– Align with AIM – Reflect Voice of the Customer
• Process: – Focus on the system that affects the outcome– Reflect Voice of the System
• Balancing– Broad view of the system– Unexpected/unwanted effects
• PDSA– Align with Process Measure
www.HQOntario.ca
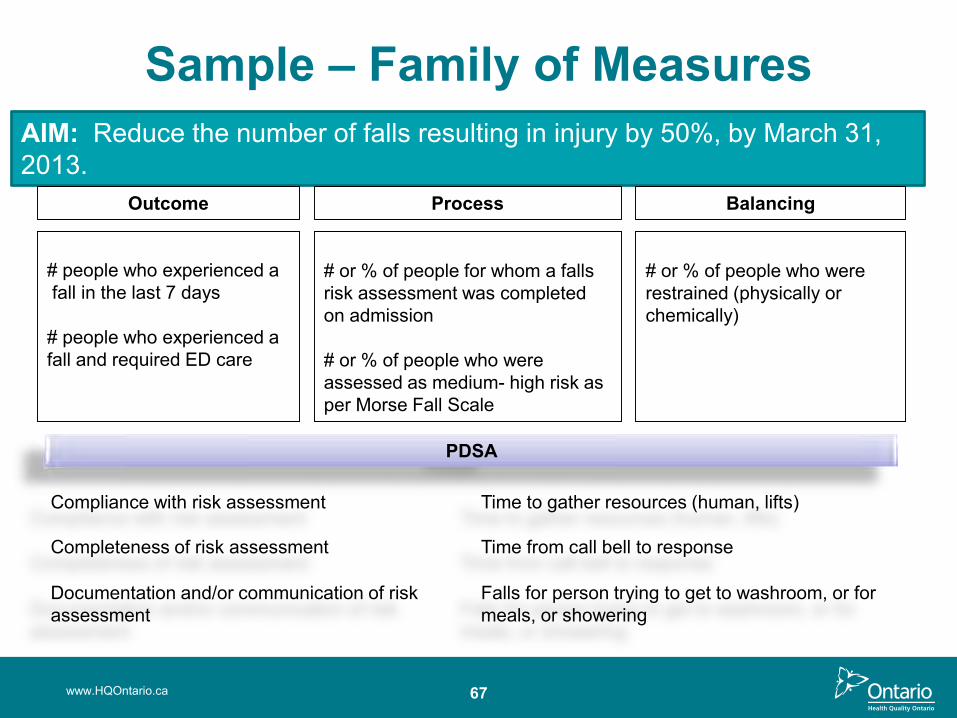
67
Sample – Family of MeasuresAIM: Reduce the number of falls resulting in injury by 50%, by March 31, 2013.
# people who experienced afall in the last 7 days
# people who experienced a fall and required ED care
# or % of people for whom a falls risk assessment was completed on admission
# or % of people who were assessed as medium- high risk as per Morse Fall Scale
# or % of people who were restrained (physically or chemically)
Outcome Process Balancing
Compliance with risk assessment
Completeness of risk assessment
Documentation and/or communication of risk assessment
Time from call bell to response
Time to gather resources (human, lifts)
Falls for person trying to get to washroom, or for meals, or showering
PDSA
www.HQOntario.ca

68
REVIEW HIGH-LEVEL AIM, OUTCOME AND PROCESS MEASURES
Aim:
Measure:
AIM OUTCOME MEASURES PROCESS MEASURES
Change concept and ideas
Measure:
Change concept and Ideas
Process Measure:
Process Measure:
Process Measure: ure:
Process Measure:
Measure:
www.HQOntario.ca
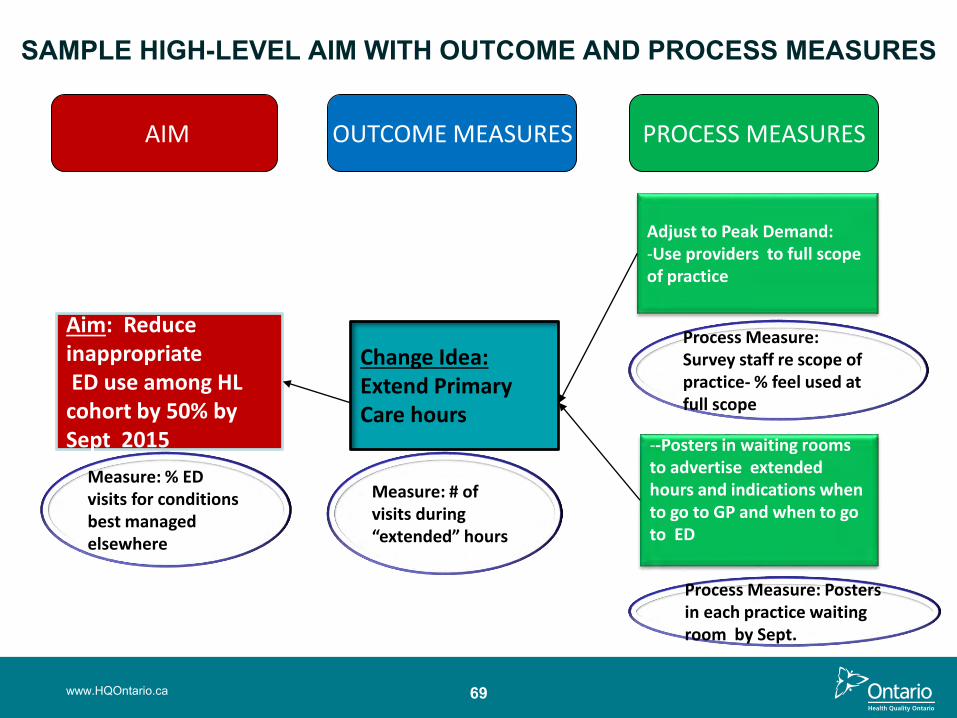
69
SAMPLE HIGH-LEVEL AIM WITH OUTCOME AND PROCESS MEASURES
Aim: Reduce inappropriate ED use among HL
cohort by 50% by Sept 2015
Measure: % ED visits for conditions best managed elsewhere
AIM OUTCOME MEASURES PROCESS MEASURES
Change Idea:Extend Primary Care hours
Adjust to Peak Demand:-Use providers to full scope of practice
Process Measure: Survey staff re scope of practice- % feel used at full scope
--Posters in waiting rooms to advertise extended hours and indications when to go to GP and when to go to ED
Process Measure: Posters in each practice waiting room by Sept.
Measure: # of visits during “extended” hours
www.HQOntario.ca
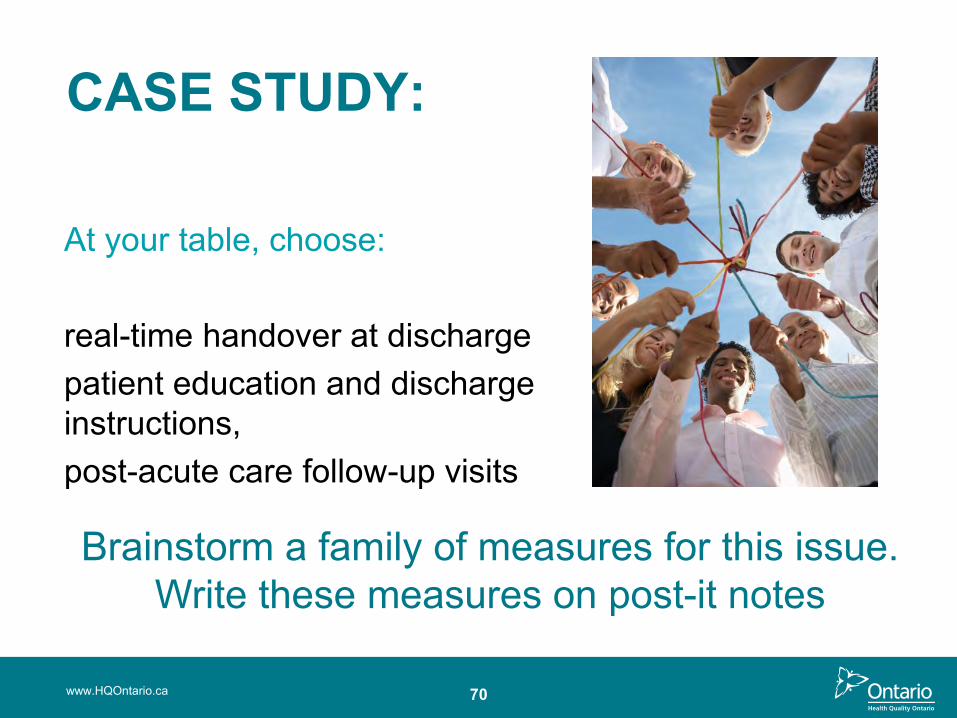
CASE STUDY:
www.HQOntario.ca 70
At your table, choose:
real-time handover at dischargepatient education and discharge instructions,post-acute care follow-up visits
Brainstorm a family of measures for this issue. Write these measures on post-it notes
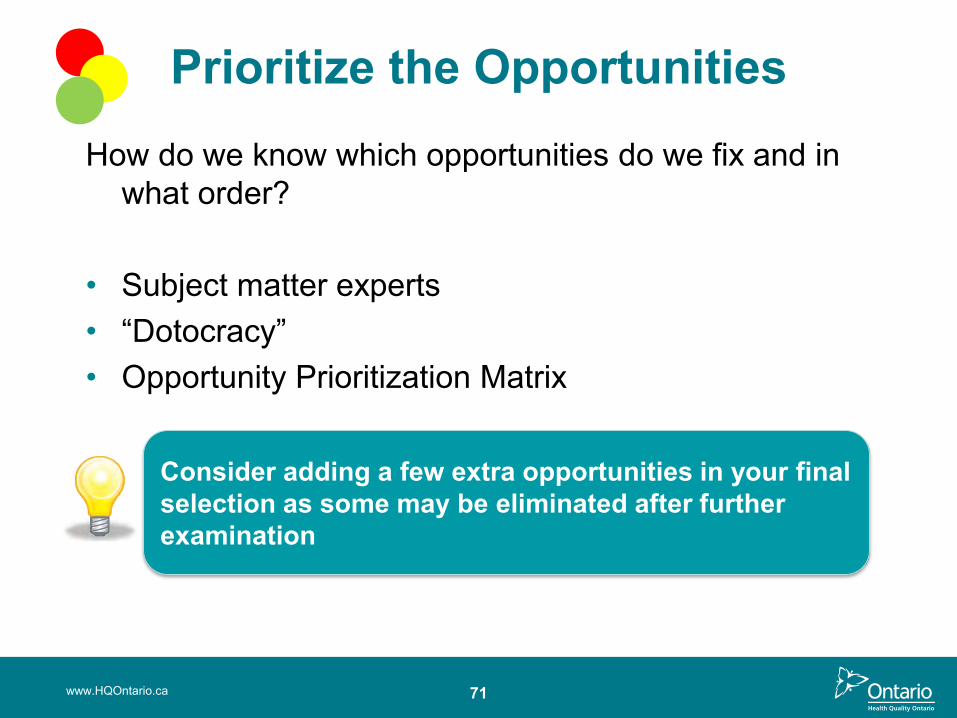
71
Prioritize the OpportunitiesHow do we know which opportunities do we fix and in
what order?
• Subject matter experts• “Dotocracy”• Opportunity Prioritization Matrix
Consider adding a few extra opportunities in your final selection as some may be eliminated after further examination
www.HQOntario.ca
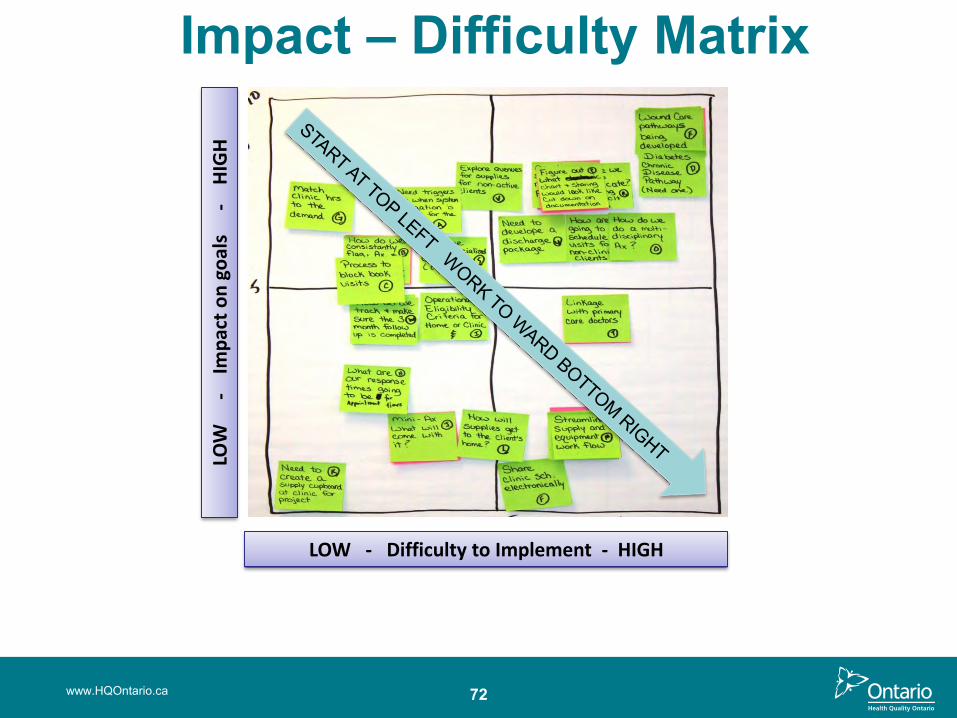
Impact – Difficulty Matrix
LOW
-
Imp
act
on
go
als
-
HIG
H
LOW - Difficulty to Implement - HIGH
72www.HQOntario.ca
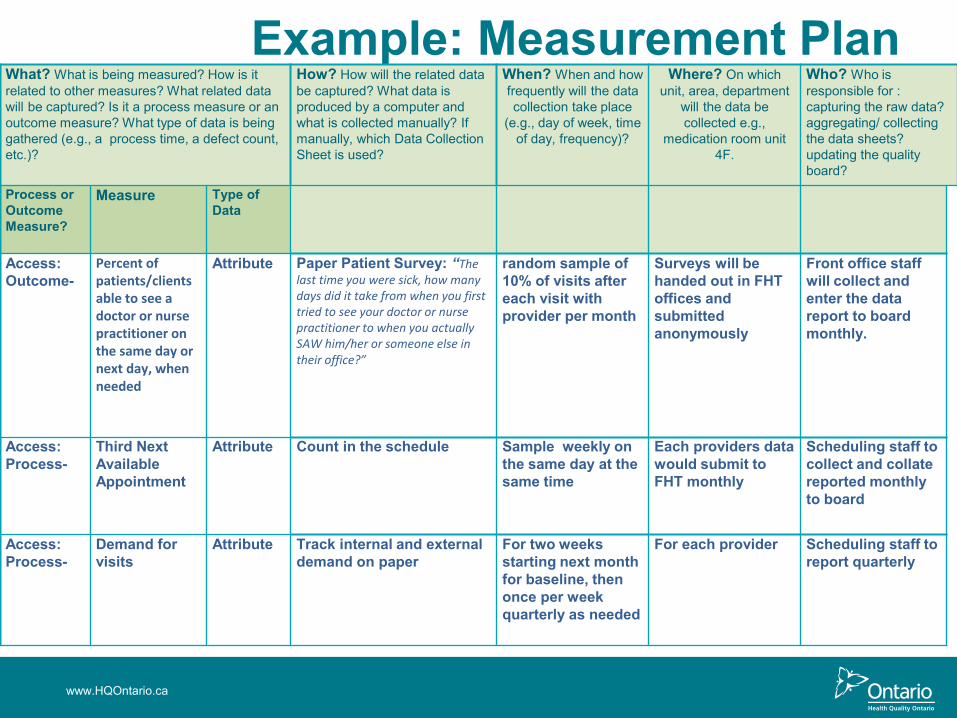
Example: Measurement Plan TOOL
www.HQOntario.ca
What? What is being measured? How is it related to other measures? What related data will be captured? Is it a process measure or an outcome measure? What type of data is being gathered (e.g., a process time, a defect count, etc.)?
How? How will the related data be captured? What data is produced by a computer and what is collected manually? If manually, which Data Collection Sheet is used?
When? When and how frequently will the data collection take place
(e.g., day of week, time of day, frequency)?
Where? On which unit, area, department
will the data be collected e.g.,
medication room unit 4F.
Who? Who is responsible for : capturing the raw data? aggregating/ collecting the data sheets? updating the quality board?
Process or Outcome Measure?
Measure Type of Data
Access: Outcome-
Percent of patients/clients able to see a doctor or nurse practitioner on the same day or next day, when needed
Attribute Paper Patient Survey: “The last time you were sick, how many days did it take from when you first tried to see your doctor or nurse practitioner to when you actually SAW him/her or someone else in their office?”
random sample of 10% of visits after each visit with provider per month
Surveys will be handed out in FHT offices and submitted anonymously
Front office staff will collect and enter the data report to board monthly.
Access: Process-
Third Next Available Appointment
Attribute Count in the schedule Sample weekly on the same day at the same time
Each providers data would submit to FHT monthly
Scheduling staff to collect and collate reported monthlyto board
Access: Process-
Demand for visits
Attribute Track internal and external demand on paper
For two weeks starting next month for baseline, then once per week quarterly as needed
For each provider Scheduling staff to report quarterly
74
Data Collection Tips
• Collect useful data, not perfect data• Use existing data if available• Manual collection if necessary• Use sampling to reduce collection burden• Use qualitative data to focus on best opportunities• Build data collection into regular day to day
processes
www.HQOntario.ca
MAKE DATA VISIBLE, ESPECIALLY TO THOSE INVOLVED
www.HQOntario.ca 75
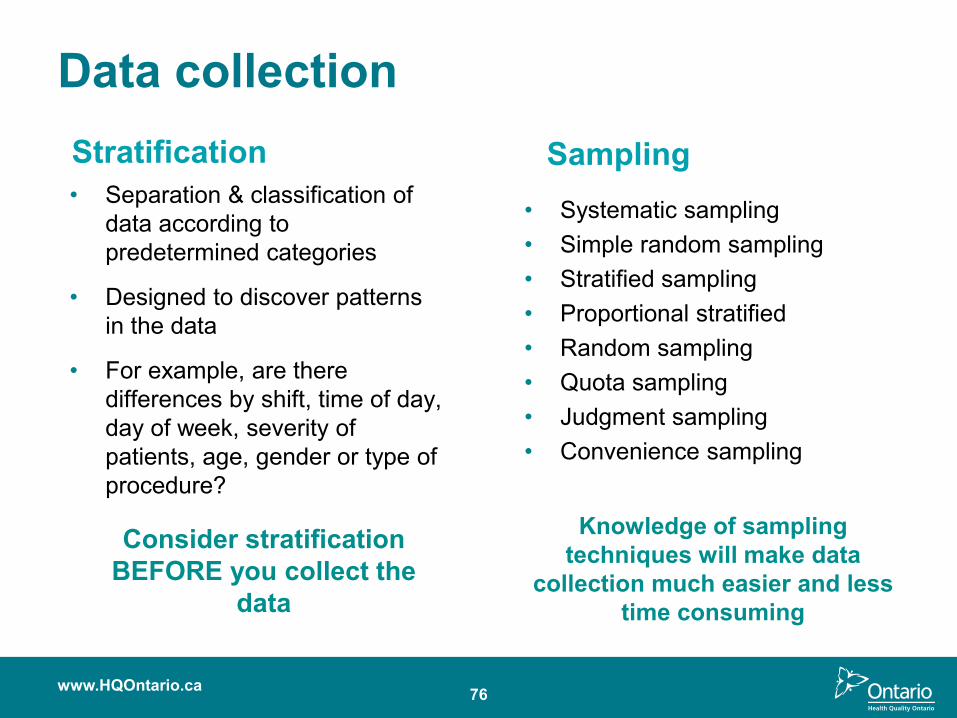
Data collectionStratification• Separation & classification of
data according to predetermined categories
• Designed to discover patterns in the data
• For example, are there differences by shift, time of day, day of week, severity of patients, age, gender or type of procedure?
Sampling• Systematic sampling• Simple random sampling• Stratified sampling• Proportional stratified• Random sampling• Quota sampling• Judgment sampling• Convenience sampling
www.HQOntario.ca 76
Consider stratification BEFORE you collect the
data
Knowledge of sampling techniques will make data
collection much easier and less time consuming
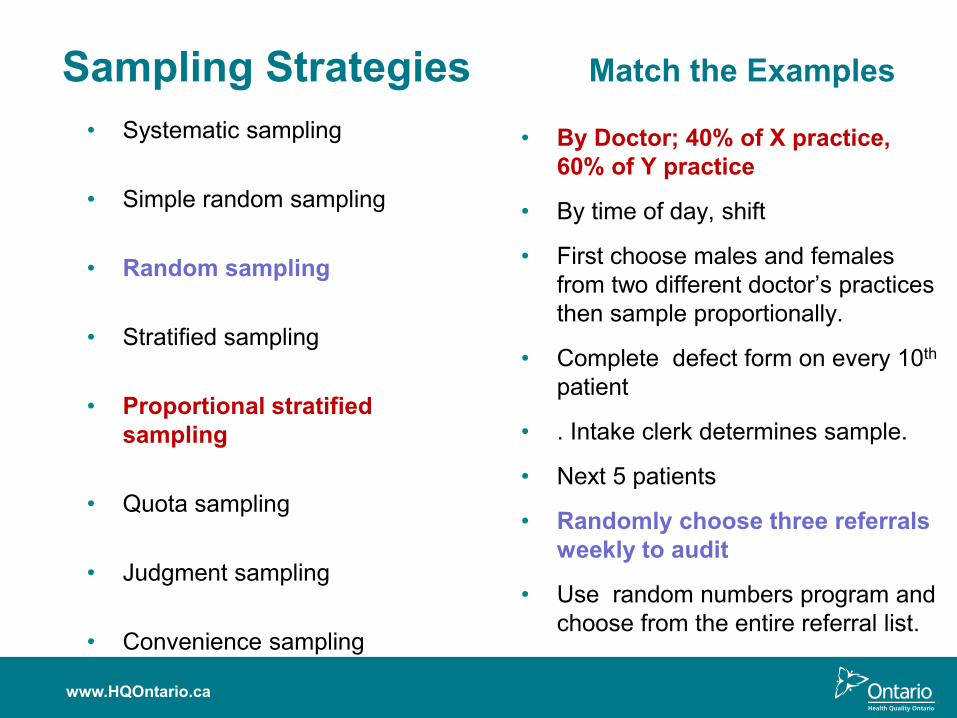
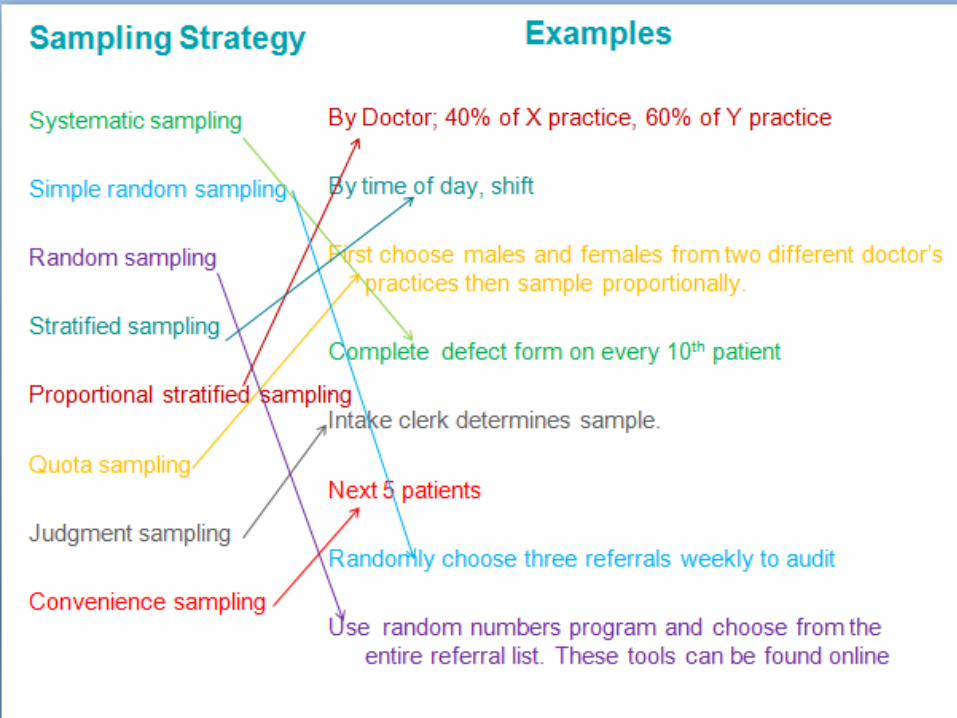
Sampling Strategies Match the Examples
• By Doctor; 40% of X practice, 60% of Y practice
• By time of day, shift
• First choose males and females from two different doctor’s practices then sample proportionally.
• Complete defect form on every 10th
patient
• . Intake clerk determines sample.
• Next 5 patients
• Randomly choose three referrals weekly to audit
• Use random numbers program and choose from the entire referral list.
• Systematic sampling
• Simple random sampling
• Random sampling
• Stratified sampling
• Proportional stratified sampling
• Quota sampling
• Judgment sampling
• Convenience sampling
www.HQOntario.ca
www.HQOntario.ca 78
THE RIDER ,THE ELEPHANT& THE PATH
Application: Change Management Framework
www.HQOntario.ca 79
80
Summary• Identify and understand the core concepts of
Pausing and Probing
• Have an understanding of the types of measures used to probe a problem
• Have an awareness of the tools/templates and resources available to support this phase
• Application of a change management framework to manage change
www.HQOntario.ca

Summary and Reflection
www.HQOntario.ca 81

www.HQOntario.ca 82

UNDERSTANDING YOUR SYSTEM
83www.HQOntario.ca
Overview
84
• Implement Spread Plan
• Communicate broadly
• Collect Measures, Look for Slippage
• Sustain Change
• Assemble Team
• Create Project Charter
• Set Aims
• Capture Voice of Customer
• Create and Validate Current State Map
• Identify Measures
• Create and Test Measurement Plan
• Gather and Share Baseline Data
• Create List of Improvement Opportunities
• Define Opportunity or Problem
• Analyze Data• Share Results• Future State
Map• Update Charter• Prioritize
Opportunities• Brainstorm
Change Ideas• Create Sub-
aims that Align with High-level Aims
• Create PDSA Plan
• Test Changes -PDSA
• Collect Measures – is there improvement?
• Share Results Broadly
• Formalize and Standardize Changes
• Collect Measures, Look for Slippage
• Sustain Change
• Implement Sustainability Plans
• Engage “Spread” team members
www.HQOntario.ca
GETTING STARTED
DEFININGTHE
PROBLEM
UNDERSTANDING YOUR SYSTEM
DESIGNING AND TESTING
SOLUTIONS
IMPLEMENTING AND SUSTAINING
CHANGES
SPREADING CHANGE
www.HQOntario.ca 85
To understand:
• Core concepts and key steps in Understanding your System Phase
• How run charts help understand how the system is currently functioning
• Concepts of common cause and special cause variation
• How to interpret data using run chart rules
• How to create a run chart using 5 steps
• How “Switch” change management strategies relate to measurement
Objectives
86
“Every system is perfectly designed to get the results it gets.
If we want better outcomes, we must change something in the system. To do this we need to understand our systems.”
Donald Berwick, President and CEO
The Institute for Healthcare Improvement
Understanding Your System
www.HQOntario.ca
THE HUMAN WEB
87www.HQOntario.ca
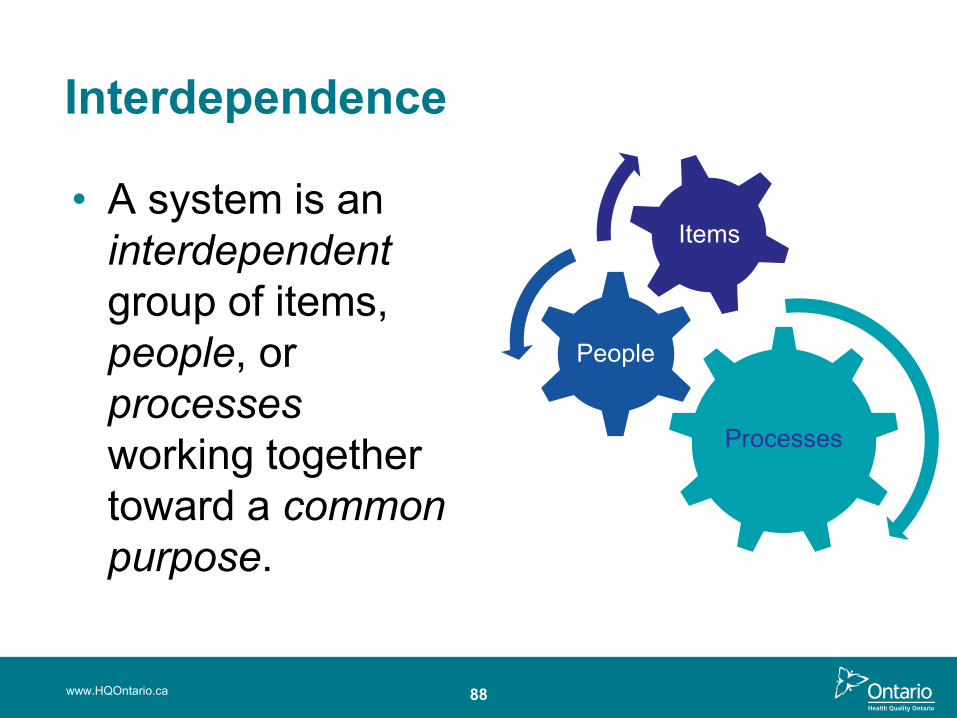
Interdependence
• A system is an interdependentgroup of items, people, or processesworking together toward a common purpose.
88www.HQOntario.ca
Processes
People
Items
89
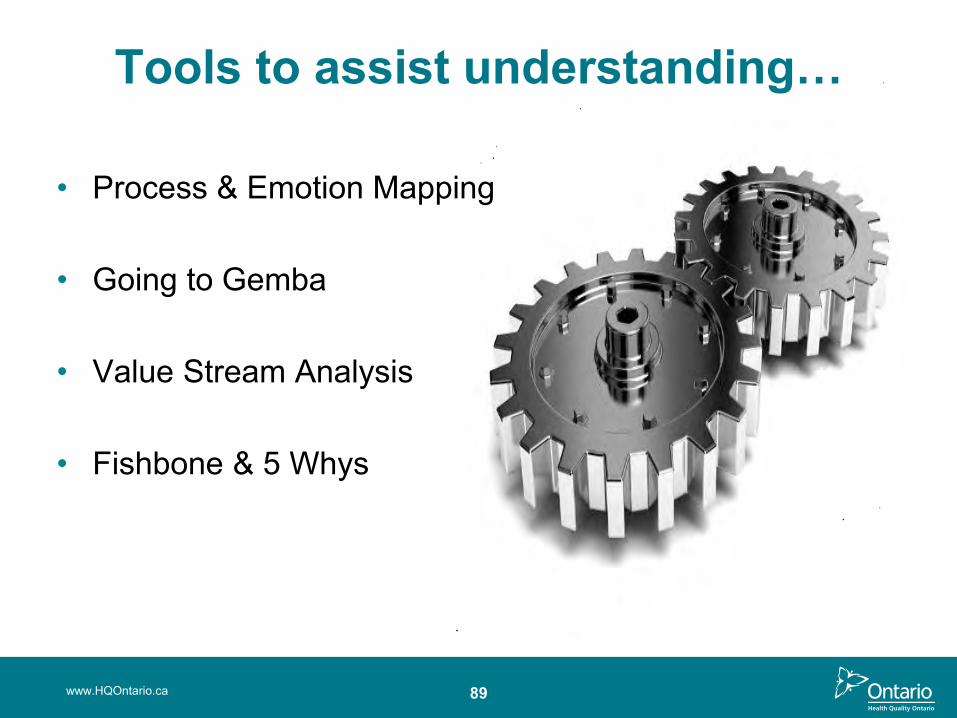
Tools to assist understanding…
• Process & Emotion Mapping
• Going to Gemba
• Value Stream Analysis
• Fishbone & 5 Whys
www.HQOntario.ca
Using data to understand your system
www.HQOntario.ca 90
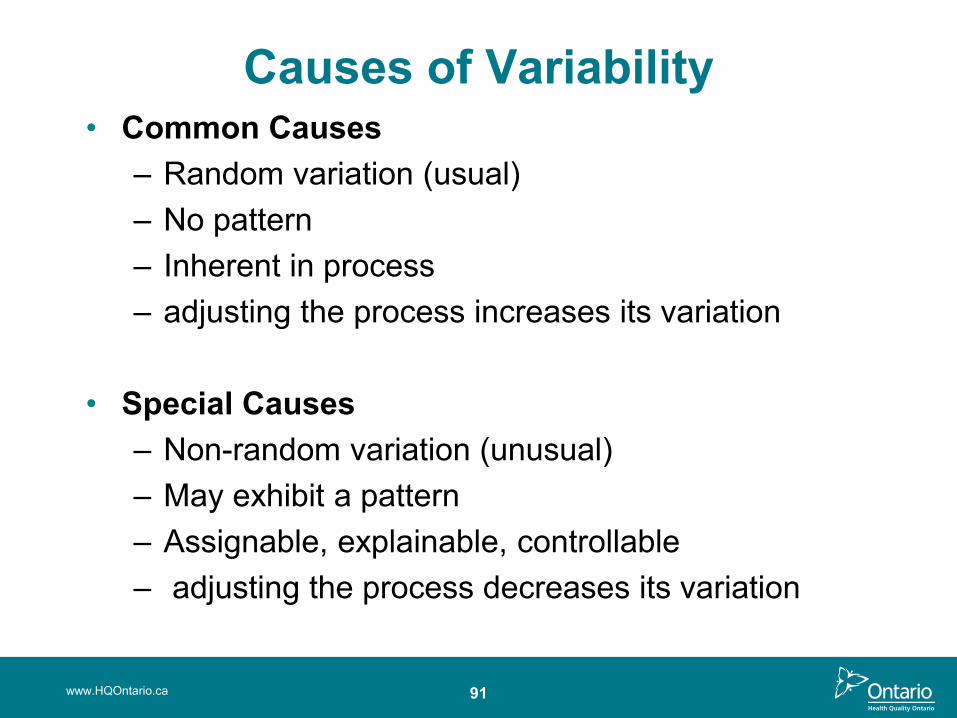
91
Causes of Variability• Common Causes
– Random variation (usual)– No pattern– Inherent in process– adjusting the process increases its variation
• Special Causes– Non-random variation (unusual)– May exhibit a pattern– Assignable, explainable, controllable– adjusting the process decreases its variation
www.HQOntario.ca
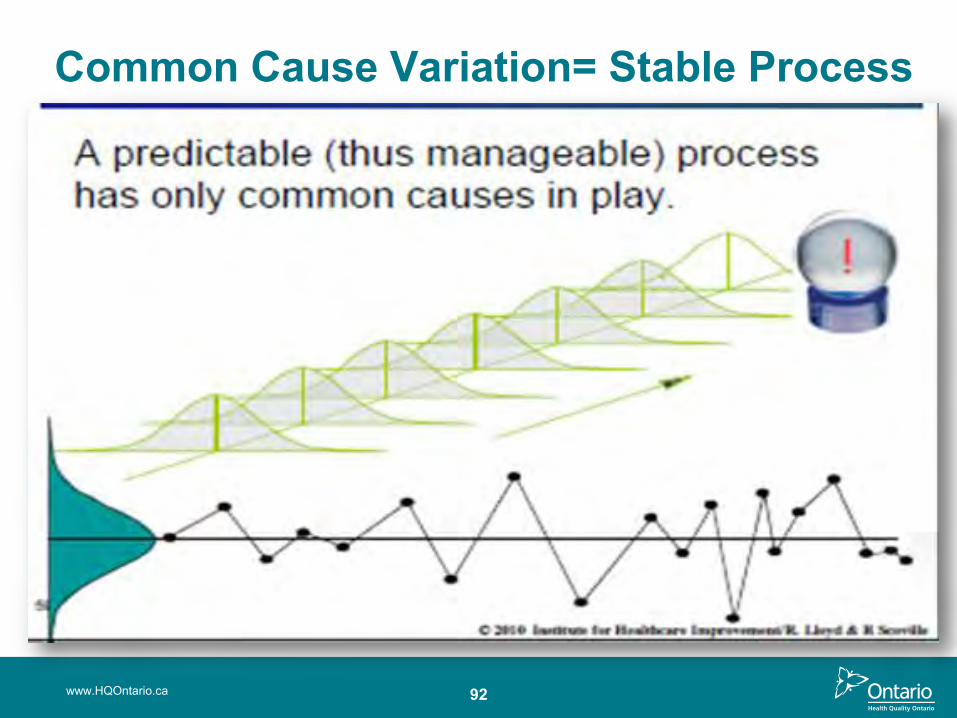
Common Cause Variation= Stable Process
www.HQOntario.ca 92
www.HQOntario.ca 93
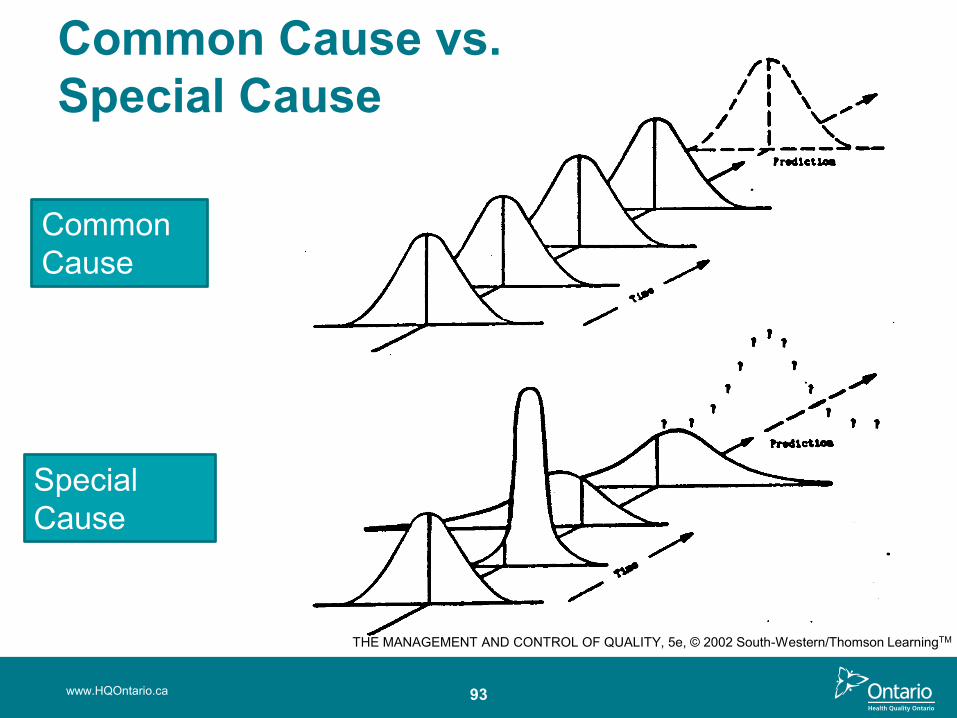
Common Cause
Special Cause
THE MANAGEMENT AND CONTROL OF QUALITY, 5e, © 2002 South-Western/Thomson LearningTM
Common Cause vs.Special Cause
94
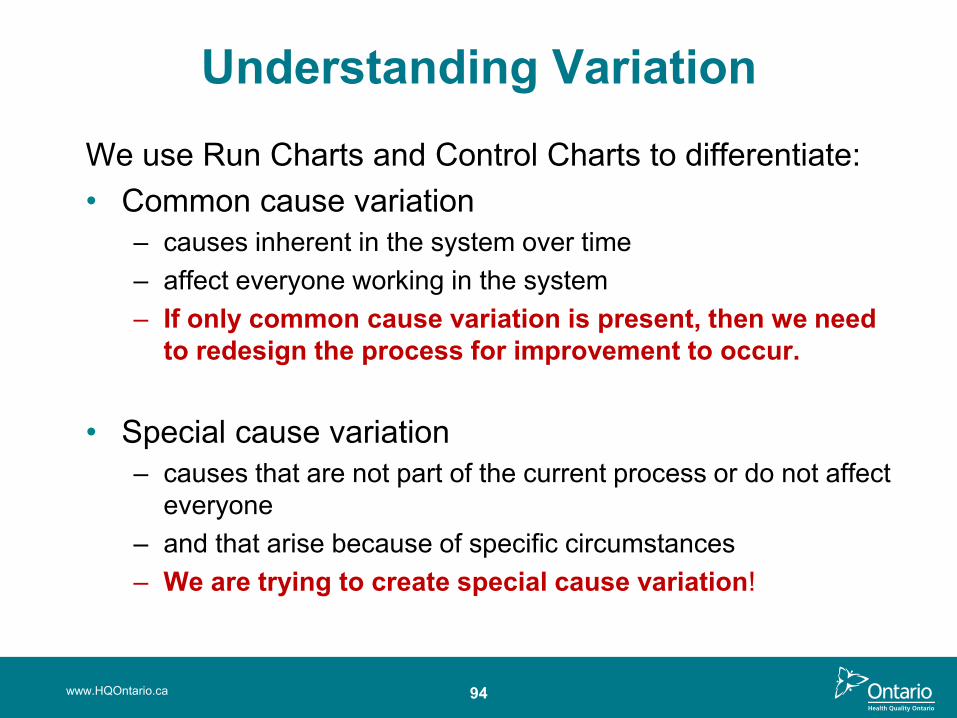
Understanding VariationWe use Run Charts and Control Charts to differentiate: • Common cause variation
– causes inherent in the system over time – affect everyone working in the system – If only common cause variation is present, then we need
to redesign the process for improvement to occur.
• Special cause variation – causes that are not part of the current process or do not affect
everyone – and that arise because of specific circumstances– We are trying to create special cause variation!
www.HQOntario.ca
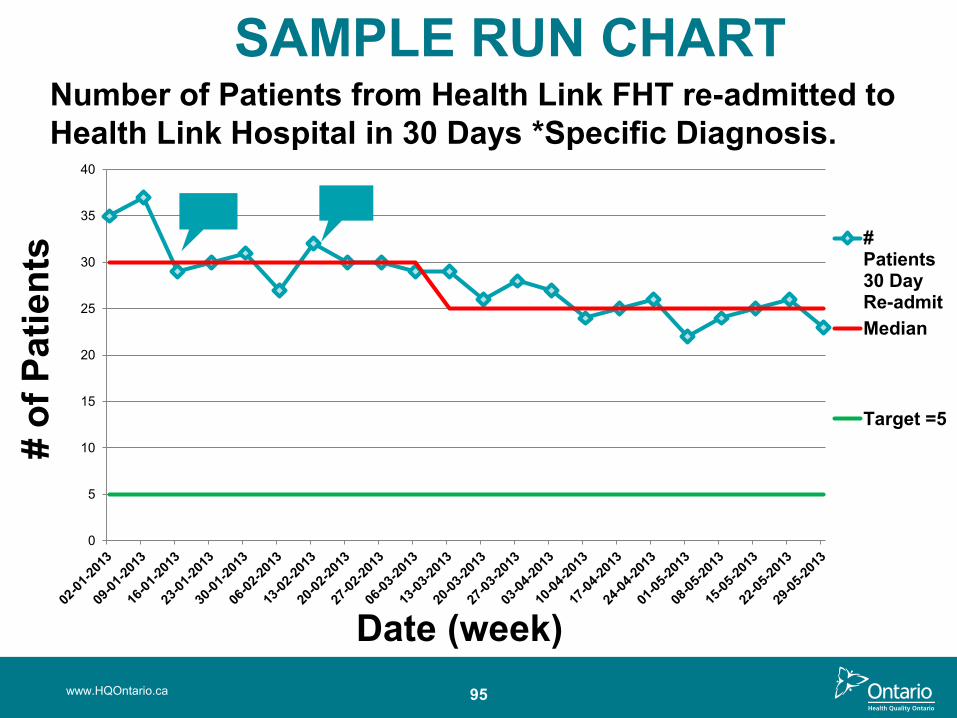
SAMPLE RUN CHART
www.HQOntario.ca 95
0
5
10
15
20
25
30
35
40
# of
Pat
ient
s
Date (week)
#Patients30 DayRe-admitMedian
Target =5
Number of Patients from Health Link FHT re-admitted to Health Link Hospital in 30 Days *Specific Diagnosis.
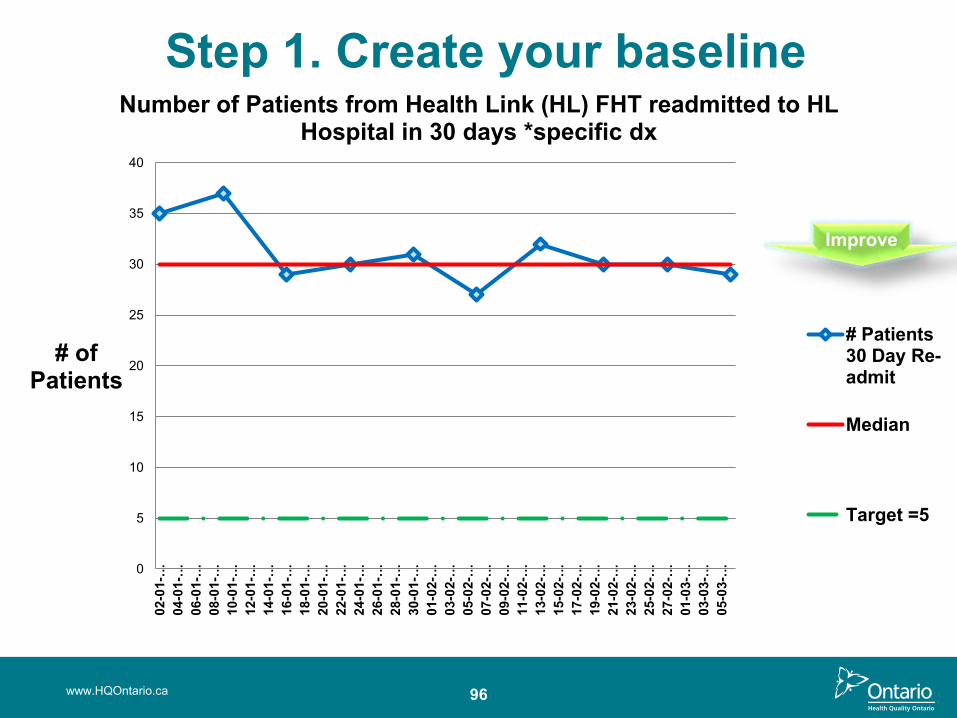
Step 1. Create your baseline
www.HQOntario.ca 96
0
5
10
15
20
25
30
35
4002
-01-
…04
-01-
…06
-01-
…08
-01-
…10
-01-
…12
-01-
…14
-01-
…16
-01-
…18
-01-
…20
-01-
…22
-01-
…24
-01-
…26
-01-
…28
-01-
…30
-01-
…01
-02-
…03
-02-
…05
-02-
…07
-02-
…09
-02-
…11
-02-
…13
-02-
…15
-02-
…17
-02-
…19
-02-
…21
-02-
…23
-02-
…25
-02-
…27
-02-
…01
-03-
…03
-03-
…05
-03-
…
# of Patients
Number of Patients from Health Link (HL) FHT readmitted to HL Hospital in 30 days *specific dx
# Patients30 Day Re-admit
Median
Target =5
Improve
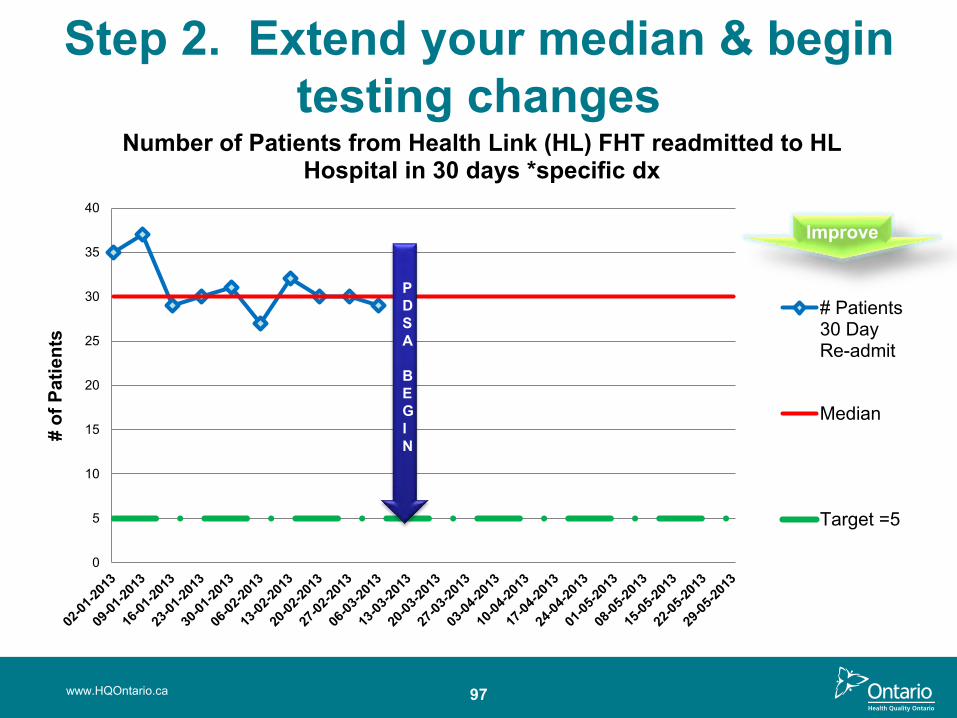
Step 2. Extend your median & begin testing changes
www.HQOntario.ca 97
0
5
10
15
20
25
30
35
40
# of
Pat
ient
s
Number of Patients from Health Link (HL) FHT readmitted to HL Hospital in 30 days *specific dx
# Patients30 DayRe-admit
Median
Target =5
PDSA
BEGIN
Improve
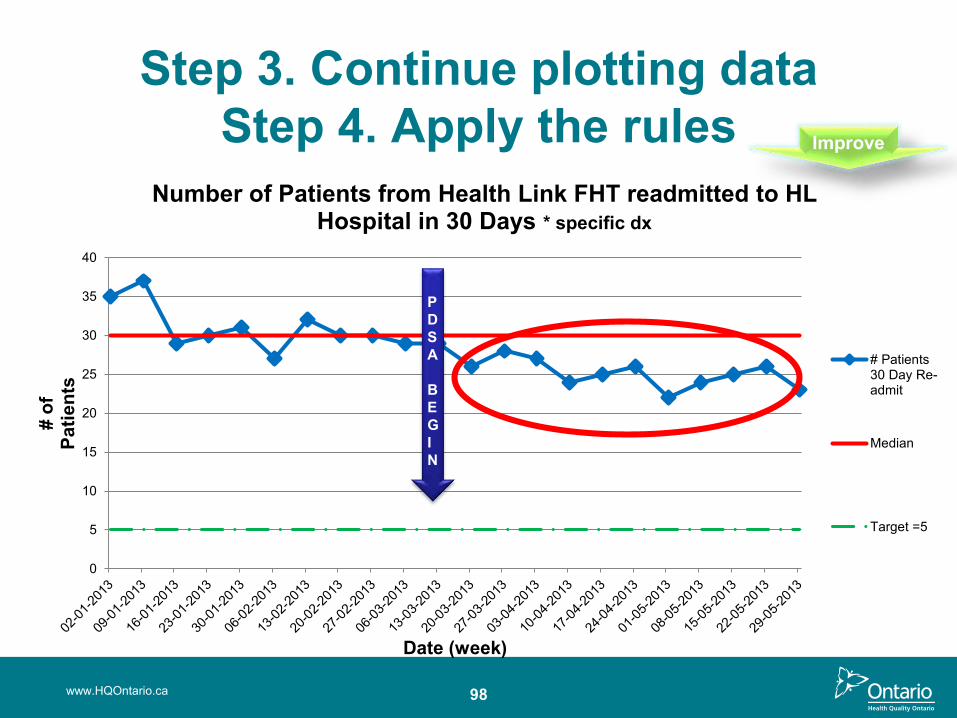
Step 3. Continue plotting data Step 4. Apply the rules
www.HQOntario.ca 98
0
5
10
15
20
25
30
35
40
# of
Pa
tient
s
Date (week)
Number of Patients from Health Link FHT readmitted to HL Hospital in 30 Days * specific dx
# Patients30 Day Re-admit
Median
Target =5
PDSA
BEGIN
Improve
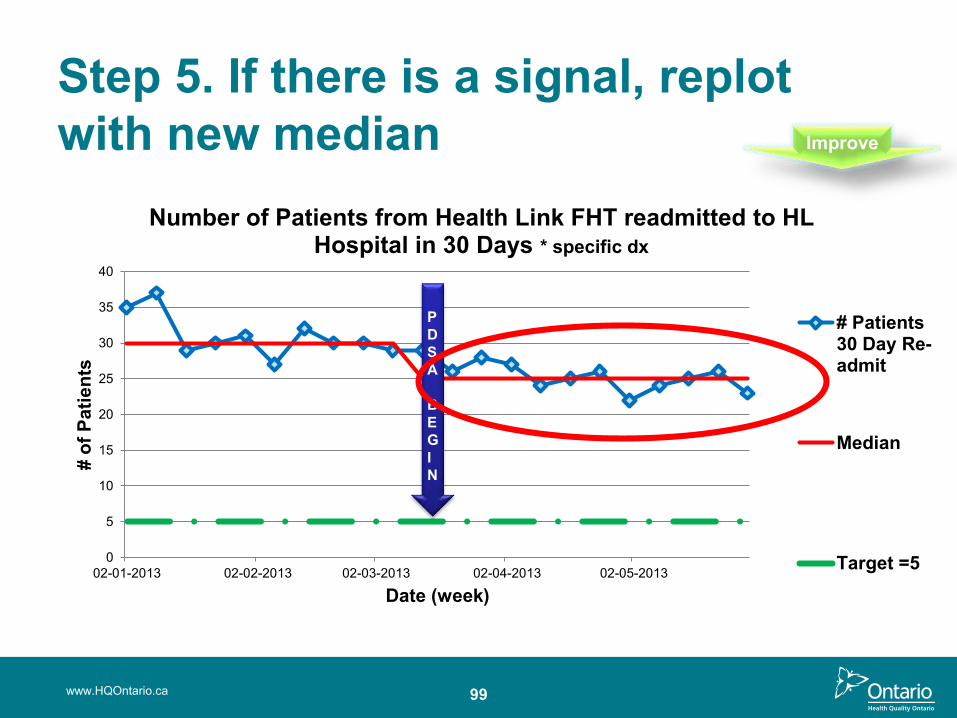
0
5
10
15
20
25
30
35
40
02-01-2013 02-02-2013 02-03-2013 02-04-2013 02-05-2013
# of
Pat
ient
s
Date (week)
Number of Patients from Health Link FHT readmitted to HL Hospital in 30 Days * specific dx
# Patients30 Day Re-admit
Median
Target =5
PDSA
BEGIN
Step 5. If there is a signal, replot with new median
www.HQOntario.ca 99
Improve
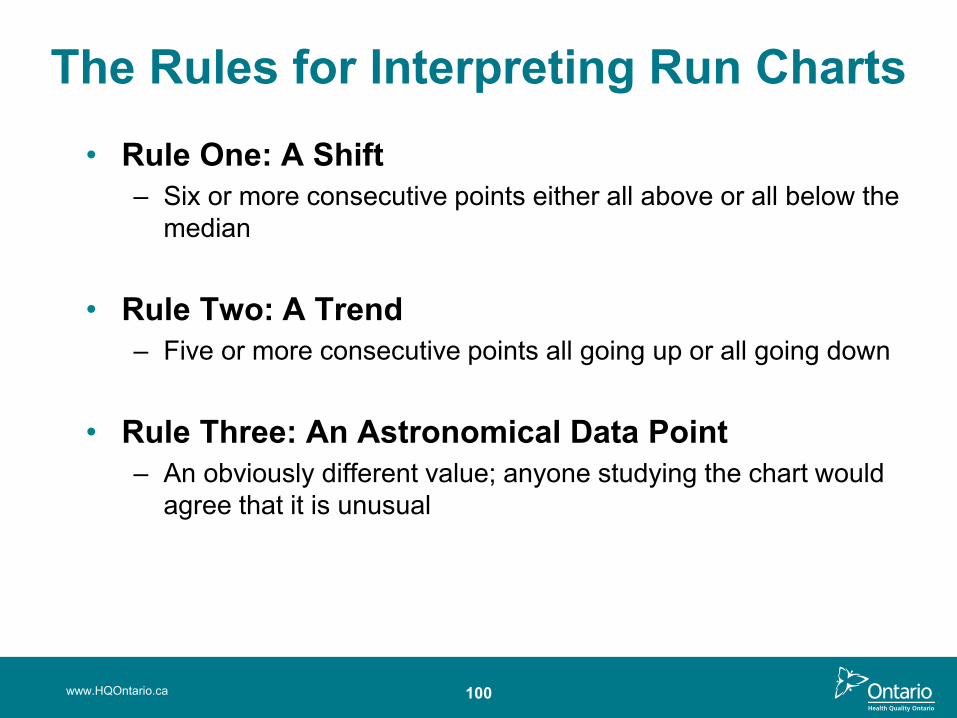
100
The Rules for Interpreting Run Charts• Rule One: A Shift
– Six or more consecutive points either all above or all below the median
• Rule Two: A Trend– Five or more consecutive points all going up or all going down
• Rule Three: An Astronomical Data Point– An obviously different value; anyone studying the chart would
agree that it is unusual
www.HQOntario.ca
101
Rule One: Shift• Six or more consecutive points either all above or all
below the median
• Values that fall on the median neither add to nor break a shift…skip them and continue counting
www.HQOntario.ca
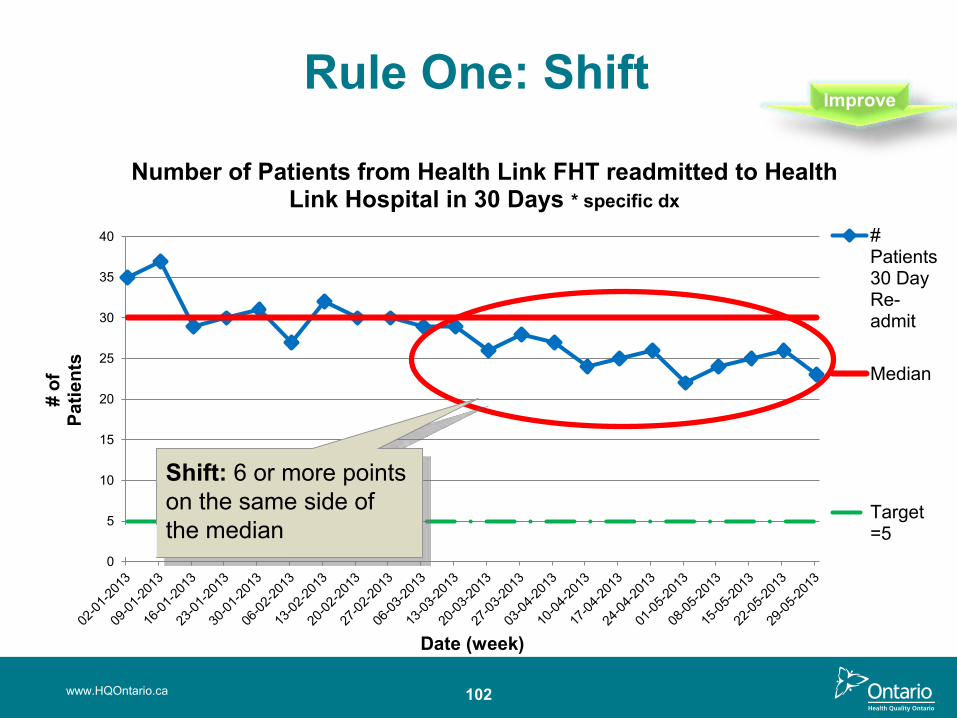
0
5
10
15
20
25
30
35
40
# of
Pa
tient
s
Date (week)
Number of Patients from Health Link FHT readmitted to Health Link Hospital in 30 Days * specific dx
#Patients30 DayRe-admit
Median
Target=5
Rule One: Shift
Shift: 6 or more points on the same side of the median
www.HQOntario.ca 102
Improve
103
• Five or more consecutive points all going up or all going down
• If the value of two or more consecutive points is the same, ignore one of the points and continue counting
- Note: the starting point doesn’t count
- Note: either there is a trend (5 points) or there is not –there is no such thing as “trending”
Rule Two: Trend
www.HQOntario.ca
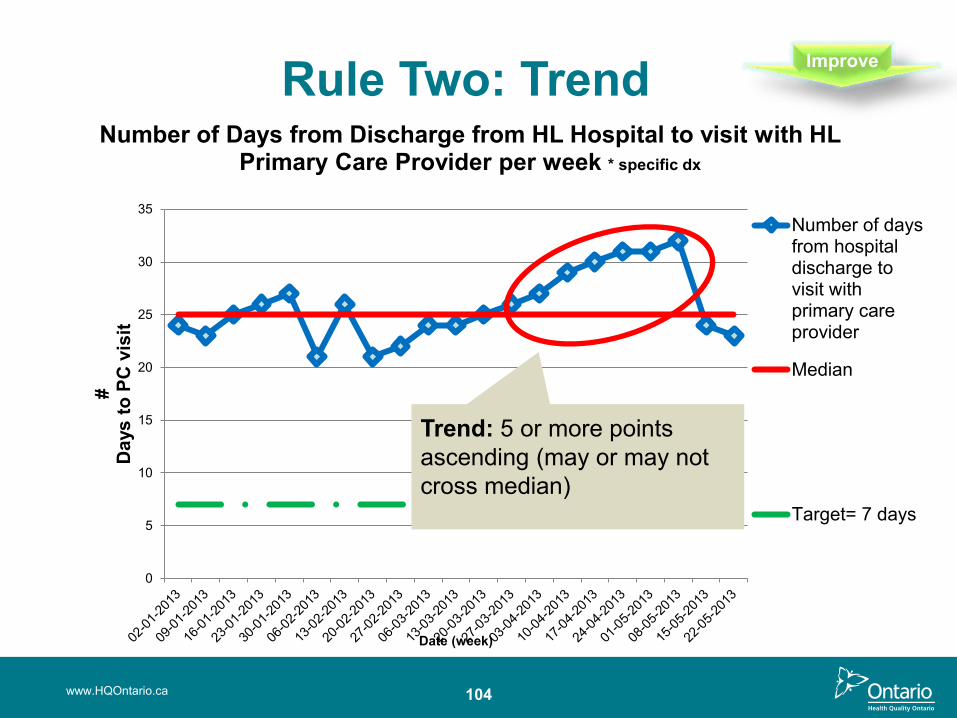
Rule Two: Trend
104www.HQOntario.ca
0
5
10
15
20
25
30
35
#D
ays
to P
C v
isit
Date (week)
Number of Days from Discharge from HL Hospital to visit with HL Primary Care Provider per week * specific dx
Number of daysfrom hospitaldischarge tovisit withprimary careprovider
Median
Target= 7 days
Improve
Trend: 5 or more points ascending (may or may not cross median)
107
Rule Three: Astronomical Point• An Astronomical data point is one that is:
– An obviously different value– Anyone studying the chart would agree that it is unusual– Every data set will have its high and low points, but not every
data set will have an astronomical point
www.HQOntario.ca
0
20
40
60
80
100
120
#D
ays
to P
C v
isit
Date (week)
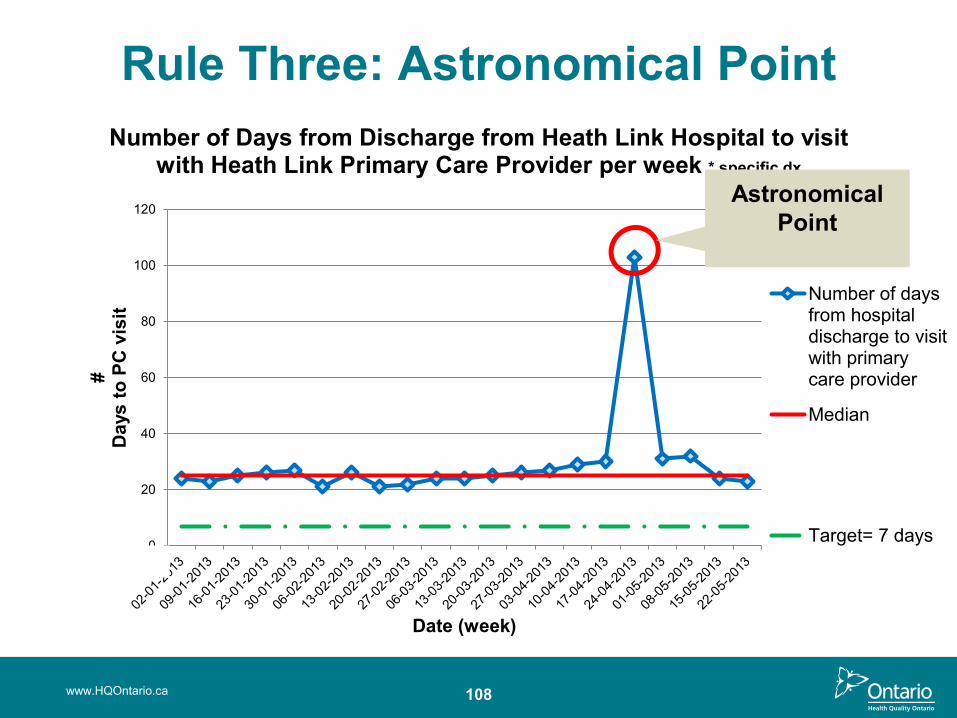
Number of Days from Discharge from Heath Link Hospital to visit with Heath Link Primary Care Provider per week * specific dx
Number of daysfrom hospitaldischarge to visitwith primarycare provider
Median
Target= 7 days
Rule Three: Astronomical Point
www.HQOntario.ca 108
Astronomical Point
109
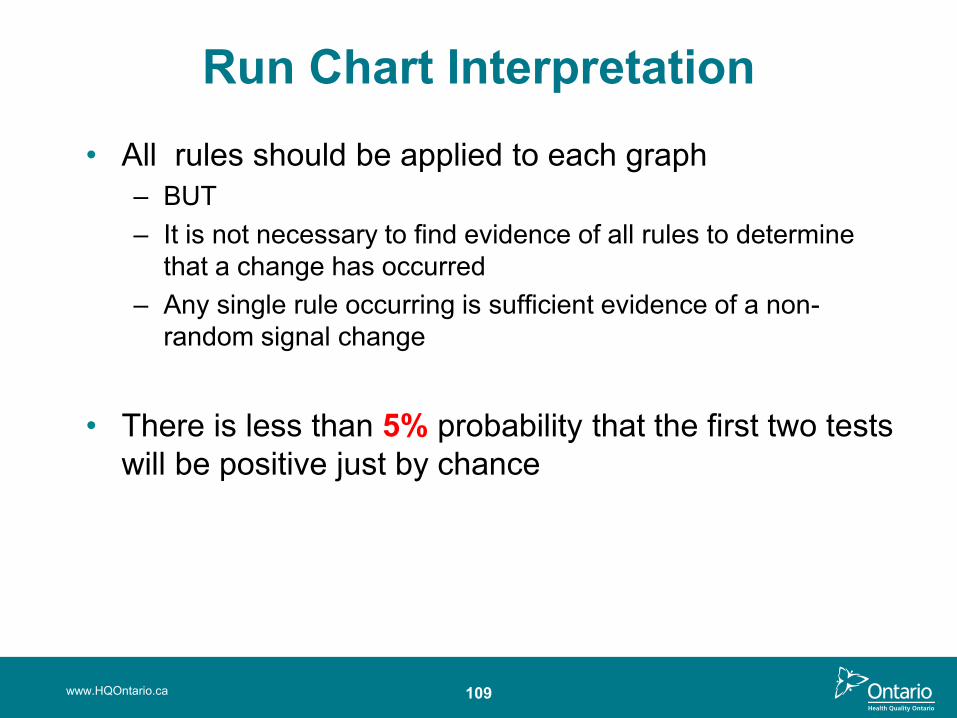
Run Chart Interpretation• All rules should be applied to each graph
– BUT– It is not necessary to find evidence of all rules to determine
that a change has occurred– Any single rule occurring is sufficient evidence of a non-
random signal change
• There is less than 5% probability that the first two tests will be positive just by chance
www.HQOntario.ca
110
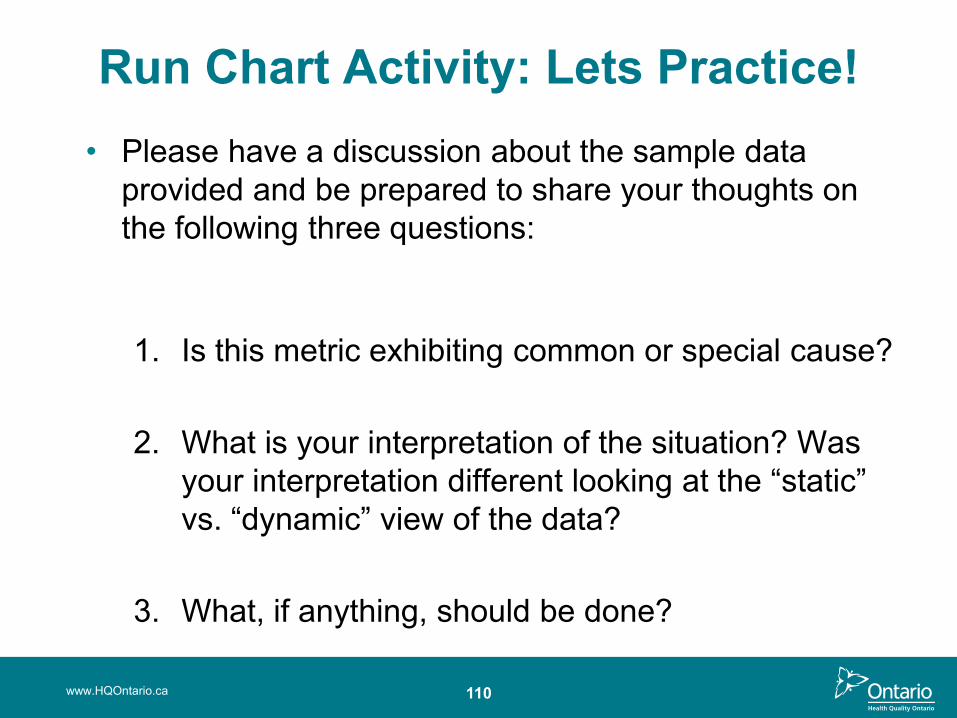
Run Chart Activity: Lets Practice!• Please have a discussion about the sample data
provided and be prepared to share your thoughts on the following three questions:
1. Is this metric exhibiting common or special cause?
2. What is your interpretation of the situation? Was your interpretation different looking at the “static” vs. “dynamic” view of the data?
3. What, if anything, should be done?
www.HQOntario.ca
www.HQOntario.ca 111
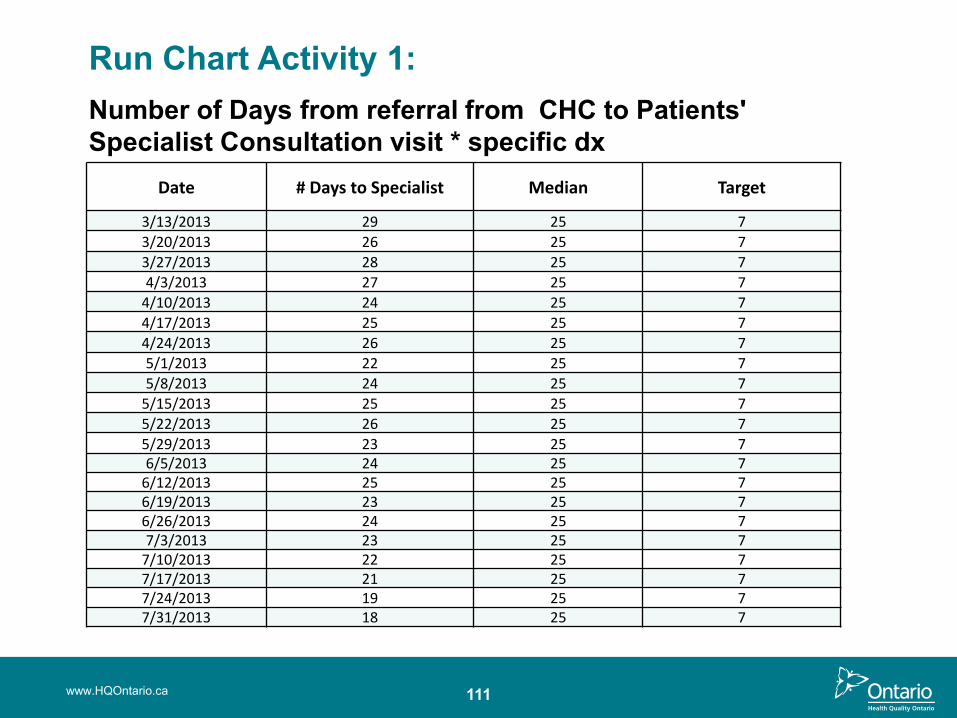
Date # Days to Specialist Median Target
3/13/2013 29 25 7
3/20/2013 26 25 7
3/27/2013 28 25 7
4/3/2013 27 25 7
4/10/2013 24 25 7
4/17/2013 25 25 7
4/24/2013 26 25 7
5/1/2013 22 25 7
5/8/2013 24 25 7
5/15/2013 25 25 7
5/22/2013 26 25 7
5/29/2013 23 25 76/5/2013 24 25 7
6/12/2013 25 25 76/19/2013 23 25 76/26/2013 24 25 77/3/2013 23 25 7
7/10/2013 22 25 77/17/2013 21 25 77/24/2013 19 25 77/31/2013 18 25 7
Run Chart Activity 1: Number of Days from referral from CHC to Patients' Specialist Consultation visit * specific dx
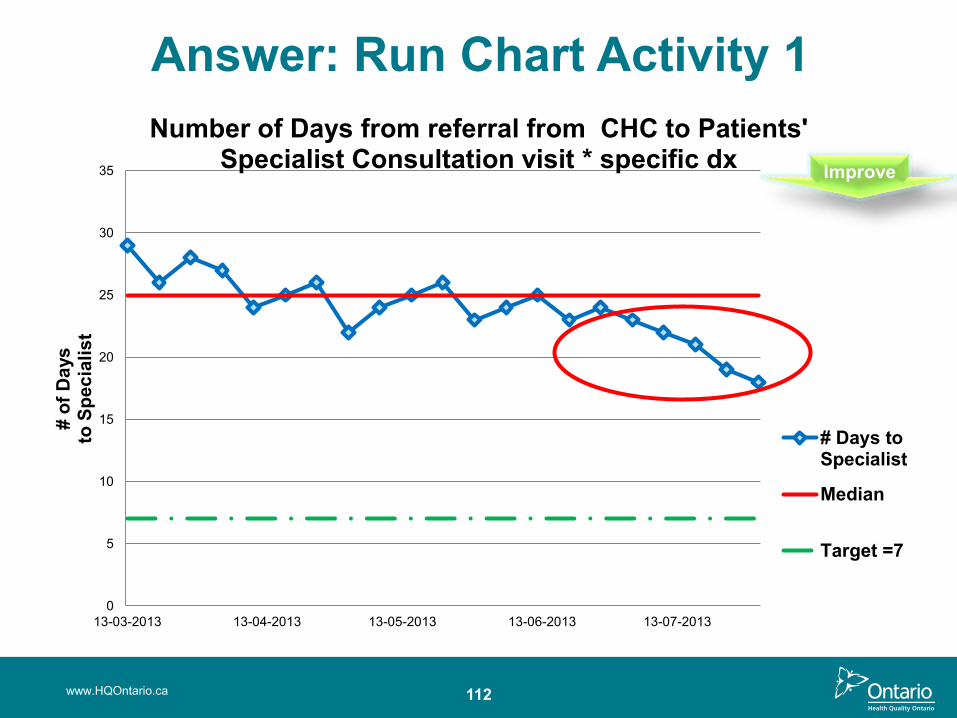
Answer: Run Chart Activity 1
112www.HQOntario.ca
0
5
10
15
20
25
30
35
13-03-2013 13-04-2013 13-05-2013 13-06-2013 13-07-2013
# of
Day
sto
Spe
cial
ist
Number of Days from referral from CHC to Patients' Specialist Consultation visit * specific dx
# Days toSpecialist
Median
Target =7
Improve
113
Run Chart Demo in Excel
www.HQOntario.ca

Once you have analyzed the data, how do you make the Switch?
114www.HQOntario.ca
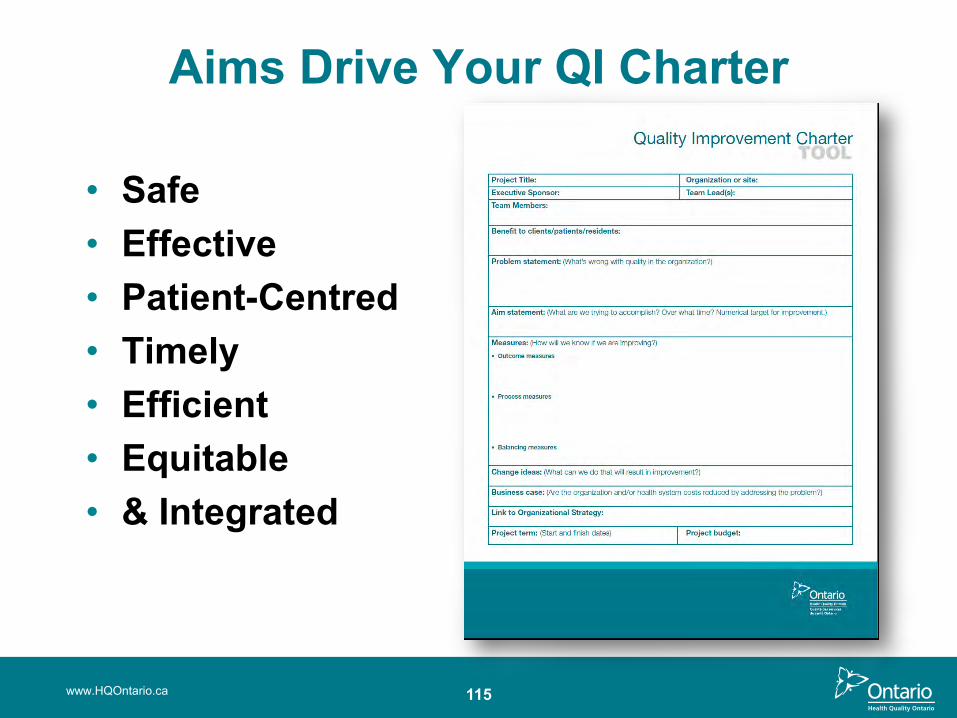
Aims Drive Your QI Charter
• Safe • Effective• Patient-Centred• Timely• Efficient• Equitable• & Integrated
www.HQOntario.ca 115
116
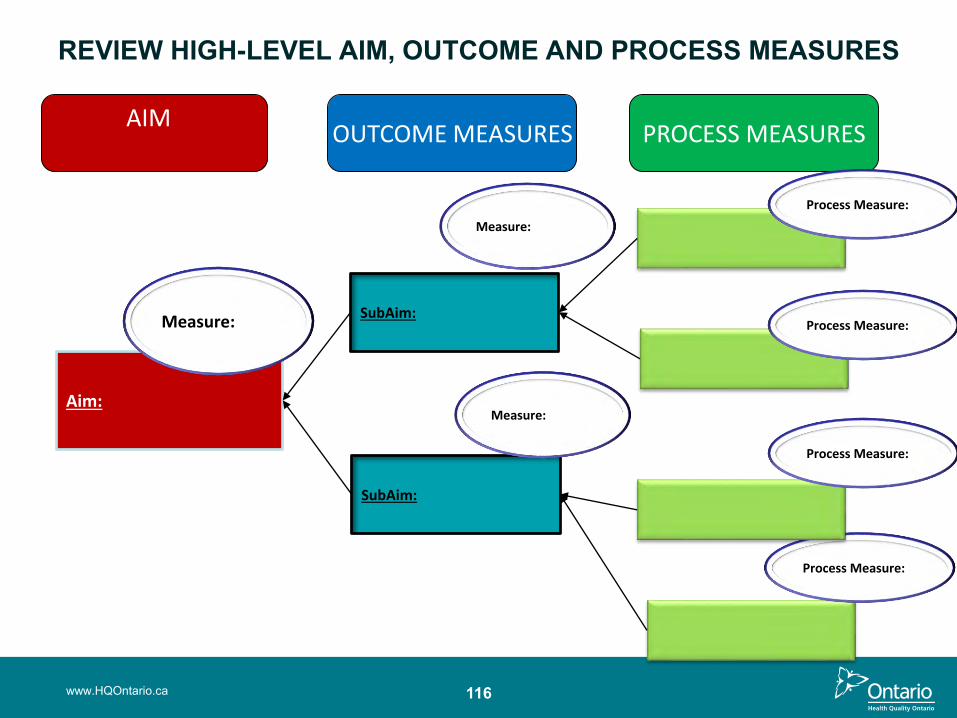
REVIEW HIGH-LEVEL AIM, OUTCOME AND PROCESS MEASURES
Aim:
Measure:
AIM OUTCOME MEASURES PROCESS MEASURES
SubAim:
SubAim:
Measure:
Process Measure:
Process Measure:
Process Measure: ure:
Process Measure:
Measure:
www.HQOntario.ca
117
Summary• Understand the core concepts and key
steps in Understanding your System Phase
• Understand how to analyze your data and prioritize your opportunities
• Apply the change management strategy to keep your QI charter updated and relevant
www.HQOntario.ca

Summary and Reflection
www.HQOntario.ca 118

Next Steps
119
• Implement Spread Plan
• Communicate broadly
• Collect Measures, Look for Slippage
• Sustain Change
• Assemble Team
• Create Project Charter
• Set Aims
• Capture Voice of Customer
• Create and Validate Current State Map
• Identify Measures
• Create and Test Measurement Plan
• Gather and Share Baseline Data
• Create List of Improvement Opportunities
• Define Opportunity or Problem
• Analyze Data• Share Results• Future State
Map• Update Charter• Prioritize
Opportunities• Brainstorm
Change Ideas• Create Sub-
aims that Align with High-level Aims
• Create PDSA Plan
• Test Changes -PDSA
• Collect Measures – is there improvement?
• Share Results Broadly
• Formalize and Standardize Changes
• Collect Measures, Look for Slippage
• Sustain Change
• Implement Sustainability Plans
• Engage “Spread” team members
www.HQOntario.ca
GETTING STARTED
DEFININGTHE
PROBLEM
UNDERSTANDING YOUR SYSTEM
DESIGNING AND TESTING
SOLUTIONS
IMPLEMENTING AND SUSTAINING
CHANGES
SPREADING CHANGE