How One Trade Could Change theWorld
61
How One Trade Could Change theWorld High Frequency Trading and the Flash Crash of 2010 The Honors Program Senior Capstone Project Student’s Name: Sarah Perlman Faculty Sponsor: Dr. AsliAscioglu April 2012
Transcript of How One Trade Could Change theWorld

How One Trade Could Change theWorld High Frequency Trading and the Flash Crash of 2010
The Honors Program Senior Capstone Project
Student’s Name: Sarah Perlman Faculty Sponsor: Dr. AsliAscioglu
April 2012

How One Trade Could Change the World: HFT and the Flash Crash of 2010 Senior Capstone Project for Sarah Perlman
2
Table of Contents Acknowledgements ................................................................................................................... 3 Abstract ..................................................................................................................................... 4 Introduction ............................................................................................................................... 5 Literature Review ...................................................................................................................... 8
What Does High Frequency Trading Mean? ........................................................................ 8 Influence of Technology in the Markets ............................................................................... 9 How to Suit Everyone In the Market .................................................................................. 12 The Introduction of Regulation ........................................................................................... 16
Hypotheses .............................................................................................................................. 21 Methodology ........................................................................................................................... 23 Results ..................................................................................................................................... 26 Conclusion .............................................................................................................................. 32 Moving Forward ..................................................................................................................... 33 Appendices .............................................................................................................................. 34
Appendix A –Average Return ............................................................................................ 34 Appendix B- Average Number of Trades ........................................................................... 36 Appendix C- Average Volatility ......................................................................................... 38 Appendix D- Average Trade Size ....................................................................................... 40 Appendix E- Average Volume ............................................................................................ 42 Appendix F: Procter and Gamble ....................................................................................... 44 Appendix G– Excerpt from Findings Regarding The Market Events of May 6, 2010 ....... 48 Appendix H- Components of the Dow Jones Industrial Average ....................................... 56
References ............................................................................................................................... 57
How One Trade Could Change the World: HFT and the Flash Crash of 2010 Senior Capstone Project for Sarah Perlman
3
ACKNOWLEDGEMENTS First, I would like to thank my Faculty Sponsor, Dr. AsliAscioglu for her time, effort and dedication to the successful completion to this project. I credit her with the success of this project and the learning opportunities that have come with it. Next, I would like to thank Professor Michael Roberto for being the Editorial Reviewer for this paper. The inputs and perspectives he brought to this project were instrumental crafting this manuscript. I would like to thank the Honors Program and the whole Bryant University community for the opportunity, support and guidance to complete this project. From beginning to end, the program and the university have created incredible opportunities for me to learn and grow as an individual. Finally, I would like to thank my friends and family for their endless support and encouragement. Without them, this project would not have been possible.

How One Trade Could Change the World: HFT and the Flash Crash of 2010 Senior Capstone Project for Sarah Perlman
4
ABSTRACT Financial markets are controlled directly by a small population of people, but have direct effects
on almost every aspect of the global community. Financial markets are now flooded with
computerized algorithms that have drastically changed the face of trading. As with any advances
in technology, there are always unforeseen events that create new challenges, and adjustments
that need to be made. In our increasingly global and technological world, one wrong click of the
mouse in New York could affect the stock markets in London, Tokyo, and Brazil. On May 6th,
2010, such a situation occurred and caused the Dow Jones Industrial Average to drop 9.8 percent
in a matter of minutes.
The “Flash Crash”,as it has become known,is a perfect example of how removing the human
element from trading can cause problems that ripple through the economy. This event brought to
light the major impact that High Frequency Trading (HFT) has on financial markets, when such a
large majority of trades occur without even a human click of the mouse. The value of the Dow
Jones Industrial Average multiplied by over 47 times and the volume grew about 2975 times
from 1928 to 2011. Therefore, the spike in volume and stock price in recent years is definitely a
correlation to note due to the introduction of technology. A widely cited statistic by the TABB
Group is that high frequency trading accounts for 65% of volume on the United States market
(Russolillo, 2011). The study that is conducted in this research will examine statistical
hypothesis tests of the data from May 6th, as well as five other days to demonstrate thenegative
effects that high frequency trading can have on the financial markets.

How One Trade Could Change the World: HFT and the Flash Crash of 2010 Senior Capstone Project for Sarah Perlman
5
INTRODUCTION
"A person watching the tide coming in, and who wishes to know the spot which marks the high tide, sets a stick in the sand … The average of [stock prices] is the peg which marks the height of the waves. The price-waves, like those of the sea, do not recede all at once from the top. The force which moves them checks the inflow gradually, and time elapses before it can be told with certainty whether high tide has been seen or not."
— Charles Dow, creator of the Dow Jones Industrial Average, in the January 31, 1901, edition of The Wall Street Journal (CME Group Index Services LLC, 2010).
Today’s financial market environment seems very far from Dow’s calm waves rolling on
the shore. However, Charles Dow’s metaphordemonstrates the simple, yet methodical, origins of
what has become one of the most referenced market indexes across the world. Starting with only
12 stocks, and expanding to 30 holdings, the Dow Jones Industrial Average (DJIA) is a price
weighted measure of the United States marketplace (Dow Jones, 2012). The DJIA representsthe
performance of large and well-known U.S. companies’ stocks. It covers all industries with the
exception of Transportation and Utilities. Commonly known as ‘the Dow’, the average still
represents the largest US companies’ performance, albeit in a much more complicated trading
environment. Throughout history, globalization, communication and technology have altered the
market landscape. We currently operate in an environment with more participants from across
the globe trading shares at lightning speeds, creating a completely different market space from as
little as 20 years ago.
Only a few weeks after increasing the number of companies inthe Dow to 30 back in
1928, it reached a milestone of 300 points. The all-time high of 14,164 points was on October
9th, 2007. Similarly, the volume of the Dow has ranged from 130,000 shares in 1940 to around
11.5 billion shares in 2010 (CME Group Index Services LLC, 2011). An interesting piece of
history that correlates with the sudden rise in price and volume of the Dow is the introduction of
the “human free network”, or computerized trading,in 1996 (Mehta, 2010). As can be seen in
Figure 1, both price and volume havebegun an upward surge in 1996 , and still has the same

How One Trade Could Change the World: HFT and the Flash Crash of 2010 Senior Capstone Project for Sarah Perlman
trend in 2011.Over time, this correlation seems to show an inflationary environment that has
pervaded all indices, especially the Dow Jones Industrial Average.
Figure 1 (Yahoo, 2011)
0.002,000.004,000.006,000.008,000.0010,000.0012,000.0014,000.0016,000.00
0.00
2,000,000,000.00
4,000,000,000.00
6,000,000,000.00
8,000,000,000.00
10,000,000,000.00
12,000,000,000.00
14,000,000,000.0010
/1/1
928
10/1
/193
210
/1/1
936
10/1
/194
010
/1/1
944
10/1
/194
810
/1/1
952
10/1
/195
610
/1/1
960
10/1
/196
410
/1/1
968
10/1
/197
210
/1/1
976
10/1
/198
010
/1/1
984
10/1
/198
810
/1/1
992
10/1
/199
610
/1/2
000
10/1
/200
410
/1/2
008
Adj
uste
d C
lose
Vol
ume
Adjusted Close and Volume of the Dow Jones Industrial Average1926-2011
Volume Adj Close
Automation of the marketplace has led to several different types of market participation.
Some of the most controversial market players today are High Frequency Traders (HFT). Market
Event Findings, published by the Securities and Exchange Commission (SEC) and the U.S.
Commodity Futures Trading Commission (CFTC),classify high frequency traders as “proprietary
trading firms that use high speed systems to monitor market data and submit large numbers of
orders to the markets...HFTs use quantitative and algorithmic methodologies to maximize the
speed of their market access and trading strategies” (U.S. Commodity Futures Trading
Commisision and U.S. Securities and Exchange Commission, 2010). By using advanced
technologies, HFTs trade on spreads as small as pennies to turn profits. A widely cited 2011
statistic by markets research firm TABB Group, says that high frequency trading accounts for an
average of 65% of trading volume in the United States (Strasburg, 2011). This has completely
changed the landscape of financial marketplaces. Where trades were once run across floors, they
can now be executed without any human intervention. Conflict arises when there is no human
intervention in the event of a malfunction; which is exactly what happened on May 6th, 2010.
However, this does not mean that high frequency trading can be touted as all bad, considering it
6

How One Trade Could Change the World: HFT and the Flash Crash of 2010 Senior Capstone Project for Sarah Perlman
7
has technically increased liquidity in the market and decreased many commission costs for the
average investor.
The following is an overview of the Securities and Exchange Commission’s highlights of
what is now known as “The Flash Crash”. A detailed description of the events of May 6th can be
found in an excerpt of the CFTC and SEC’s publication of May 6, 2010 Market Event Findings
in Appendix G. On May 6th, 2010 at 2:30 pm, the S&P 500 volatility index was up 22.5% and
the Dow was down 2.5%. Likewise, two of the most active index vehicles, E-Mini S&P 500
futures contracts and S&P 500 SPDR exchange traded fund, had posted a 55% and 20% decline
respectively by that point in the day. At 2:32, a large mutual fund complex realized the high
volatility and loss of liquidity in the marketplace and sold approximately $4.1 billion worth of E-
Mini contracts(U.S. Commodity Futures Trading Commisision and U.S. Securities and Exchange
Commission, 2010). E-minis are small futures contracts traded electronically on the Chicago
Mercantile Exchange, based on the S&P 500 index (What is E-mini, 2012). These contracts were
intended to be sold via an automated algorithm at a rate of 9% of the average trading volume.
Since the only parameter of this algorithm was trading volume, and the markets were not
operating efficiently, the program executed all 75,000 contracts in 20 minutes. Between 2:40 pm
and 3:00 pm, 2 billion shares had traded exceeding $56 billion. While 98% of shares were
executed within 10% of the value, over 20,000 shares across 300 securities had been executed
60% or more away from the price they had been at 2:40 pm (U.S. Commodity Futures Trading
Commisision and U.S. Securities and Exchange Commission, 2010).This research will examine
the events of May 6th to determine the severity and extent that high frequency trading had on the
Dow Jones Industrial Average on the day of the flash crash.
There is a definite need for clarification surrounding the practice of high frequency
trading. The arbitrary labels of ‘good’ and ‘bad’ fail to capture the complexity of high frequency
trading. At this point in the development of the trading world, stocks are changing hands, just in
a different means than they were years ago. At this stage, what is left to be examined are the
nuances around this relatively new trading practice to determine its effects on the broader
marketplace. The world has already seen the effects of a faulty algorithmic trade and the ripple

How One Trade Could Change the World: HFT and the Flash Crash of 2010 Senior Capstone Project for Sarah Perlman
8
through the economy, and therefore it is crucial that the research community provides a
quantitative background for this relatively new technology.
LITERATURE REVIEW
What Does High Frequency Trading Mean?
In recent years, the term“high frequency trading” (HFT) has been disputed on several
levels; starting with the definition and increasing in complexity through industry practices,
norms and regulations. The introduction of technology that allows trades to occur in
milliseconds, with no human interaction, has changed the landscape of the financial markets.
One of the complexities that has arisen from this technology is that while efficiency has never
been higher, there are hidden costs that have the potential to take a toll on the market.
Since high frequency trading a relatively new practice in the financial industry, there are
several arguments over how to define it. In order to come to a concise conclusion, many turn to
the Securities Exchange Commission (SEC) for a more concrete definition. For example,
Stephen Barnes, a Juris Doctor Candidate at J. Ruben Clark Law School cites the SEC in stating,
“[high frequency trading] typically is used to refer to professional traders acting in a proprietary
capacity that engage in a number of strategies that generate a large number of trades on a daily
basis” (Barnes, 2010). On the other hand, Mike O’Hara has taken another approach to defining
HFT by asking industry professionals the question,“What is HFT?”. In his article in Futures
Magazine, Steve Zwick summarizes O’Hara’s interviews with a linkage of commonalities rather
than a clear-cut definition. He defines HFT as “…computer driven; it generates a large number
of orders in a short space of time: it’s dependent on low-latency, fast access to execution venues;
its positions are held for short periods of time; it ends the day flat and its characterized by a high
order-to-trade ratio” (Zwick, 2011). Zwick’s definition of HFT exemplifies the many different
components of this process, from the medium of trade, to the speed of execution, and the
duration of the positions. As a summary from industry professionals, Zwick’s definition
provides insight into the most crucial characteristics of high frequency trading. Adding to this
definition, Thomas Watson quotes Martin Wheatley, the CEO of the Securities and Futures
Commission in Hong Kong, in his article “Rise of theMachines” which appeared in Canadian
Business, “ [Wheatley] defines [HFT] as the use of supersonic trading algorithms ‘to capture

How One Trade Could Change the World: HFT and the Flash Crash of 2010 Senior Capstone Project for Sarah Perlman
9
opportunities that may be small or exist for a very short period of time’”(Watson, 2011). This is
a crucial component to add to the definition because it provides an explanation for the prime
motivation of traders engaging in High Frequency Trading. Trading in the financial markets is
about uncovering value, and being the first to do so generates the highest revenues. High
frequency trading creates this opportunity by exposing small windows of opportunity that would
be impossible to recognize without the aid of lighting fast computers and networking systems.
In a speech given to the International Economic Association’s Sixteenth World
Congress, Andrew G. Haldane, an Executive Director of Financial Stabilityand a member of the
interim Financial Policy Committee at the Bank of England, goes yet a different route by
depicting the three key effects that high frequency trading has on markets: “First, [HFT] has
meant ever-larger volumes of trading have been compressed into ever-smaller chunks of time.
Second, it has meant strategic behavior among traders is occurring at ever-higher frequencies.
Third, it is not just that the speed of strategic interaction has changed but also its nature.
Yesterday interaction was human –to-human. Today it is machine-to-machine” (Haldane, 2011).
Haldane highlights the fact that the behavior in the financial markets has changed drastically, and
the three key changes he notes demonstrates key characteristics of high frequency trading as it
has evolved today. Therefore, these key market effects could be considered in the definition of
high frequency trading. When talking about the flash crash, Haldane says “…only one clear
explanation emerges: that there is no clear explanation” (Haldane, 2011). This is often the way
high frequency trading is regarded across the industry. Based off of these examples, the
following descriptionof high frequency trading can be deduced: High frequency trading has
created the opportunity for traders to intensify the opportunities available in the market through
computerized algorithms and proprietary strategies. It has created an environment in which
human-less interactions initiate large numbers of low-latency transactions trades in what has
become an incredibly high volume market.
Influence of Technology in the Markets The flash crash of May 6th, 2010 has caught the attention of many journalists, researchers
and industry professionals, in part because of how rare and abnormal an event it truly was. All of
the attention that May 6th has gotten has created many diverse views of how high frequency

How One Trade Could Change the World: HFT and the Flash Crash of 2010 Senior Capstone Project for Sarah Perlman
10
trading. In Thomas Watson’s article in Canadian Business “Journalists vs. High Frequency
Traders”, the author addresses the idea that high frequency trading has been vilified across the
industry due to the assumed turmoil that the computer generated trading has created. The
authorcalls attention to a response to a New York Times article issued by ManojNarang, CEO of
the HFT trading firm Tradeworks. Narang had said “markets react to news, and since 2007, there
has been an abundance of news which has caused investors to panic…Computers don’t panic,
humans do” (Cited in Watson, 2011). Narang is putting pressure on journalists for reporting
news that causes investor panic. Watson takes great offense to this comment due to the fact that
Narang classifies volatility as only being caused by panic, and not incorporating the “dramatic
changes in bid and ask market orders” (Watson, 2011), which tend to be present in today’s
market due to high frequency trades.
Many comparisons have been made between the flash crash and the stock market crash
that happened in 1987. In 1987, high frequency trading did not exist as we knew it in 2010. In
the article “How the ‘Flash Crash’ Echoes Black Monday” published in the Wall Street Journal,
author Scott Patterson highlights that in 1987,the crash continued on into the next day, the Dow
fell 20% and over 600 million shares were traded. Conversely, in 2010, the worst of the day
lasted only 10 minutes, the decline was 9.8% and trading reached 19 billion shares (Patterson,
2010). In October of 1987, over 600 million shares of NYSE stocks changed hands, compared
to May 6th, where over 10.3 billion shares were traded (Betancourt, 2011). While the numbers
the two events produced were drastically different, some of the market conditions that the two
events played out in were very similar.
The crash of 1987 was predicated by rising interest rates, a growing U.S. trade deficit and
the decline of the value of the dollar led to concern in the marketplace. Likewise, the financial
markets had recently been introduced to program trading. Program trading, specifically a strategy
known as ‘portfolio insurance’ was when a computer model optimized stock-to-cash ratios at
various market prices to suggest when to increase and decrease exposure to the market (Carlson,
2007). The week prior to the crash, the market began declining and resulted in one of the largest
one-week declines in decades, and program trader’s models were indicating that traders should
sell stocks and futures contracts (Carlson, 2007) . Record trading volume on October 19th
overwhelmed systems causing some trades to execute over an hour late, creating a significant

How One Trade Could Change the World: HFT and the Flash Crash of 2010 Senior Capstone Project for Sarah Perlman
11
amount of uncertainty in the market. The top ten sellers accounted for 50 percent of non-market-
maker volume, and one large institution sold thirteen installments of about $100 million each to
total $1.1 billion throughout the day. The NYSE put trade restrictions on using the designated
order turnaround (DOT) system which created unusual patterns in program trading (Carlson,
2007). Program trading was cited by the SEC as “both to the inability of non-portfolio insuring
investors to accurately gauge the amount of selling suggested by the portfolio insurance models,
which could reduce their buying interest and to an increase in the concentration and velocity of
selling, which may distort prices and have a negative impact of the capital position of stock
specialists” (Carlson, 2007). Program trading, margin calls and difficulty obtaining information
have all been associated with the causes of the market crash of 1987. In response to this event,
the Federal Reserve issued a public statement indicating their actions towards meeting needs for
market liquidity, lowered the federal funds rate to increase liquidity, liberalized rules regarding
lending securities from system accounts and encouraged banks lending to brokers and dealers to
work cooperatively with their customers (Carlson, 2007).
Therefore, some have claimed that HFT magnified the effects of the flash crash when
compared to Black Monday. However, the decline in 2010 was less than half of that in 1987.
Another difference Patterson points out is that in 2010, there was a heavy sell off of exchange
traded funds (ETFs), which are linked to other markets, thereby causing those markets to decline
(Patterson, 2010). Since ETFs were not prevalent in the 1980’s, this was one less factor that
needed to be thought about while the markets were plummeting. In his article “Rise of the
Machines”, Watson echoes these views pointing out that in 1987, prices did not instantly
rebound as they did during the flash crash. “So if you want to blame part of the flash crash on
HFT,” Watson claims,“then the robo-traders also deserve credit for the quick recovery” (Watson,
2011). Watson also quotes Mike Bignell, the president of a Canadian alternative trading system,
who points out that the world of trading is evolving, “They don’t play football the way we played
it in the ‘30s, and they don’t trade stocks like they did years ago” (Cited in Watson, 2011).
Another analysis of the flash crash and high frequency trading that takes a similar viewpoint to
Bignell,can be found in the Bloomberg Businessweek article “The Machines That Ate the

How One Trade Could Change the World: HFT and the Flash Crash of 2010 Senior Capstone Project for Sarah Perlman
12
Market”. The authors, Mehta et. al, also emphasize some of the benefits of high frequency
trading.
Wall Street’s extreme makeover has achieved its main goals: greater efficiency and much lower
commissions for pension and mutual funds, insurance companies, and endowment managers that
invest in equities. Reduced transaction costs benefit teachers, office workers, corporate executive
and retirees coast to coast.(Mehta, 2011)
While much of the industry criticizes high frequency trading as a drain of profits from traditional
investors, these authors do a good job in bringing the perspective of all of the other beneficiaries
to the financial markets that can get lost in a sea of trades. This is most definitely a major fact to
consider when determining the ultimate question of whether high frequency trading is positive or
negative. Another benefit that high frequency trading brings is the reduction of human biases in
the financial markets. “Computer systems are now becoming powerful enough, and subtle
enough, to help us reduce human biases from our decision-making. And this is the key: They can
do it in real-time…Neither we nor the computers are perfect, but in tandem, we might neutralize
our biased, intuitive failings…”(Berman, 2012). This is a very important key to note, because
while there is no control over the human bias, supplementing human ideas with algorithmic data
analysis can help to reduce investor bias, and in the future could be a major contributor to shifts
in trading practices. Financial markets are one of the quintessential foundations of world
economies there many believe should be evolving with the rest of the technological world.
How to Suit Everyone In the Market
Betancourt, VanDemburgh and Harmelink, the authors of “Understanding the Flash
Crash”, published in CPA Journal, point out that a fundamental changeoccurred in market
structure and technology over the past decade, most importantly the Regulation National Market
System (Reg NMS). This structure was supposed to increase market competition by lowering
costs, which has a greater benefit to the market system. However, it tended to do the contrary.
The author states that the Reg NMS created conditions to attract high frequency traders, brought
liquidity into dark pools, and did not allow markets to slow during times of panic because there
were so many stock trading platforms (Betancourt, 2011). The article continues to say that this

How One Trade Could Change the World: HFT and the Flash Crash of 2010 Senior Capstone Project for Sarah Perlman
13
new market environment created by much of the new regulations has diminished investor
confidence in equities and thus threatened capital formation (Betancourt, 2011).
Similarly, when reflecting on the flash crash, Craig Rothfeld, the executive director of
WJB Capital Group, looks to dark pools and HFT as a major source of the panic. He says
“There’s no liquidity anymore…We’re also kept in the dark about what’s being traded. Its not a
safe and secure market” (Rehfeld, 2010). Many industry professionals feel similarly to Rothfeld,
and thus the quest for afair and efficient form of regulation is on. One of the biggest problems is
that there is the distinct possibility for a crash like the flash crash to occur again. In the article A
Day to Remember, the author cites the example of Patrick Fay, the head of equity trading at D.A.
Davidson & Co.:
[Fay] doesn’t think Wall Street is equipped for debacles like this one-and he got a look into the abyss. He was one of the traders who had his biggest losses reversed…Next time-and no one doubts there could be one- he and the rest of Wall Street might not be so lucky (Rehfeld, 2010).
Eric Hunsader, of Nanex shares the same sentiments with Fay, but adds in the component that
the next flash crash may be done deliberately. In a 2011 article forthe Journal of Business &
Economics Research, Hundsader says that traders are using large volumes to intentionally slow
down the market, and skim profits from competitors. He feels that the last crash was caused on
purpose, in a situation where one trader tried to overload the NYSE to add latency. Likewise,
Hundsaderpoints to the fact that mini flash crashes have happened before, citing April 28th where
Wal-Mart and Procter and Gamble fell 50 cents for less than a second. Hundsader’s final
argument is that the system has shown delays more than once since the flash crash, “With dark
pools3, flash trading4, quote stuffing5 and sub-penny pricing all being included in the tricks of
HFTs, it is no wonder that the market can be manipulated. No one knows then the next flash
crash will happen, but it is reasonable to assume that another one will happen.” (Rose,
2011).There is currently a cloudy understanding of exactly what happened on May 6th, but there
3 A type of trading platform that allows large blocks of shares traded without prices being revealed publicly until after the trades are completed (Dark pools definition n.d.). 4 Flash trading is where orders are shown to members of an exchange for a split second before being passed onto the wider market (Flash trading definition n.d.). 5 Quote stuffing is an attempt to overwhelm the market with excessive numbers of quotes by traders. This is done by placing and almost immediately cancelling large numbers of rapid-fire orders to buy or sell stocks (Quote stuffing definition, n.d.)
How One Trade Could Change the World: HFT and the Flash Crash of 2010 Senior Capstone Project for Sarah Perlman
14
is no doubt in many minds across the industry that this same type of crash could happen again.
Thus, many in the industry are searching for solutions as to how to best operate the marketplace
in order to mitigate the risk of a similar crash happening again.
On the panel “What Makes and Exchange a Unique Institution”, at the Baruch College
Conference “The Economic Function of a Stock Exchange”, the panelists discussed how to serve
everyone in the marketwhile still making sure that the markets are a fair trading environment
with the addition of high frequency trading. Alfred Berkley of Pipeline Trading Systems, brought
up the point that in the blink of an eye, five trades are executed. Berkley feels that you need to
let the rules of engagement in the market evolve and not overregulate, but ask for more
innovation (Berkeley, 2011). Gary Katz of the International Securities Exchange agreed, saying
that the marketplace today is a completely different world than it was ten years ago and we need
to keep moving forward. William O’Brien of DirectEdge and AsaniSarkar, of the Federal
Reserve Bank of New York both came to the conclusion that more education on the subject of
high frequency trading is crucial. William O’Brien statedthat high frequency trading is generally
poorly portrayed, and it needs to be communicated to America that this technology creates a
mechanism to share insight and knowledge in a productive and collaborative way (Berkeley,
2011). AsaniSarkarbrought up the point that high frequency trading creates a huge network
effect that few people are familiar with. Sarkar feels that we need more education and research
in the field to demonstrate the way high frequency trading affects other aspects of trading and the
overall current market place (Berkeley, 2011). Due to the fact that nothing in the financial world
is static, you need to be constantly reevaluating the way that your firm trades and operates. Greg
Tusar, the head of Goldman Sachs Electronic Trading business in the Americas, points out the
fact that remaining competitive in high frequency trading involves a constant commitment to
improve infrastructure. He then discussed the opportunities that Goldman offers for their clients
to execute large orders across many pools, while managing risk, all over the course of
milliseconds (Ramage, 2010). As technology develops, it is crucial that there are developments
in infrastructure in order to stay competitive in the high frequency trading marketplace. New
technology develops everyday, so it will be crucial for big firms to make strategic decisions
when updating and adapting HFT infrastructure. While these are very costly improvements, it
will prove to be a cornerstone of the marketplace in the future.

How One Trade Could Change the World: HFT and the Flash Crash of 2010 Senior Capstone Project for Sarah Perlman
15
The flash crash did not take everyone by surprise. In an article published in the
January/February 2010 edition of Technology Review, Paul Wilmott spotted the trend early and
cautioned the need for the movement within the financial industry to be studied. “High –
frequency trading is the latest bandwagon, and everyone is jumping on board…Wall Street
always piles on to the next thing, and it always blows up…The potential is there for a crash to
happen quite quickly” (Urstadt, 2010). Wilmott’s seeming premonition demonstrates that HFT
was a concern for investors well before the actual flash crash occurred. In a survey conducted by
Liquidnet, a dark-pool operator, over 300 asset management firms with control over $13 trillion
of assets were polled on their feelings towards high-frequency trading. The results exposed that
approximately two thirds of industry participants were concerned about the impacts that HFT has
on market structures (Russolillo, 2011). The founder and chief executive of Liquidnet, Seth
Merrin explains, “It’s not the high frequency traders that are catalysts for the volatility. But
they’re simply exacerbating the moves” (Russolillo, 2011). This is a key point because similar
to the market crash of 1987, where program trading did not cause the market crash, it enhanced
the movements. At the top five firms surveyed, results revealed that 73% of traders felt HFT was
a “high priority market-structure issue” (Russolillio, 2011). While the article submitting the
results of the findings was short, Merrinhad a few very insightful quotes demonstrating the need
to look at HFT at a closer level:
“Investors are clearly concerned that their long-term investment styles are at odds with the speculative, nanosecond profit-taking approach utilized by high-frequency traders….The fundamentals simply don’t change on a daily percentage basis that we’ve been seeing, especially with these 400- and 500- point days” (Russolillo, 2011).
Russolillo summarizes Merrin’s views saying “the survey results exemplify how traditional
investors are vastly opposed to high-frequency traders, whose quick-fire moves raise the costs of
trading for traditional players” (Russolillio, 2011).This brings light to the fact that while the
industry opinions of HFT run a broad spectrum of acceptance, traditional traders are highly
opposed to HFT because they feel it puts the traditional traders at a disadvantage, and increases
the perceived risks in the market.
Despite the risks that are presented from high frequency trading, many of the larger firms
have realized the potential it holds for their firm. Not all firms have built up their HFT

How One Trade Could Change the World: HFT and the Flash Crash of 2010 Senior Capstone Project for Sarah Perlman
16
infrastructure, so there is a tremendous opportunity for these bulge bracket banks to createa
competitive HFT platform, so customerscan combine HFT with all of the offerings of a full
service prime brokerage. This combination will allow high frequency traders to borrow more
stock and make better usage of their leverage and capital. John Goeller, managing director within
Bank of America/Merrill Lynch’s global execution services described the process as “an arms
race of sorts” (Armstrong, 2011). Firms can also leverage the research and development that
goes into HFT to help their buy-side clients. Due to the constant evolution of technology, it is
important to provide these technological advantages to all aspects of the banking business.
The Introduction of Regulation
The recentness of these events, and the ever changing nature of the current financial
market landscape, makes high frequency trading and the flash crash a crucial component to
understanding and improving our current financial market system. The sole fact that the
definition of high frequency trading is so cloudy shows that there is a lot of research to be done
in this field. The financial market system is at the crux of economies across the world, and thus it
is crucial that it develops with the technology of the modern world. Moving forward, research
needs to address the long term effects that market crashes can have on the financial markets,
regulations that can help curb market crashes and technology that will be changing the industry
over the course of the next few years.
Ironically, high frequency trading was actually created from a set of regulations, and
many industry publications have pointed to items that high frequency traders deem necessary to
be addressed. Author Edgar Perez explains that SEC regulation, and the assistance of computers
and technology, helped create many jobs focused around quants and traders looking to make
profits on spreads. However, Perez feels that more forced regulation would tighten margins and
discourage trading (Perez, 2012). From an international perspective, France is one of the leaders
in high frequency trading reform, and EdouardVieillefond, managing director at French regulator
AMF explained, “To understand this debate we should separate surveillance of the technology
and surveillance of the strategy. High frequency trading (HFT) is not a strategy, it is a new
technology” (Becker, 2011). Chris Sparrow took this idea one step further explaining, “Put
simply, HFT is not a trading strategy. It’s a business model” (Sparrow, 2011). These two inputs

How One Trade Could Change the World: HFT and the Flash Crash of 2010 Senior Capstone Project for Sarah Perlman
17
explain that high frequency trading is no longer simply one type of trade used in the market.It
has evolved into a series of strategies, from latency arbitrage to pattern recognition, which all
need to be fully understood before regulation can be put forward. John Cartlidge of the
University of Bristol explained that “Economic theory has always lagged behind economic
reality, but now the speed of technology change is widening that gap at an exponential rate. The
scary result of this is that we now live in a world dominated by a global financial market of
which we have virtually no sound theoretical understanding” (Keim, 2012). It is therefore the
challenge of the current generation to not only further grow technology, but also keep markets
efficient and fair.
One of the problems with a constantly evolving and rapidly moving trading environment
is that, while there is a widespread agreement some components of the industry needs to change,
the high complexity of high frequency trading make regulators largely ignorant to the nature of
the practice. In his article in Bloomberg BusinessWeek, Matthew Philips explained “High-
frequency trading remains today as it was two years ago: an opaque, misunderstood, and almost
totally unregulated industry worth billions of dollars “(Philips, 2012). Later in the article, Philips
continues, explaining that the problem is that regulators lack both the expertise and the
technology to monitor high frequency traders effectively. He cites SEC Chairwoman Schapiro
who admitted that the regulators still did not understand the industry enough. The analogy
Philips made was “It’s as if regulators are on horseback while the traders are in Ferraris”
(Philips, 2012). Therefore, the high frequency trading industry is at an incredibly interesting
point in time. There are many steps that can be taken; however, technology advances so rapidly
that it is difficult to comprehend and invest in a regulation that could become outdated before it
is even enacted.
While it has proven difficult to grasp a definition of high frequency trading, there has
been a universal consensus that there needs to be an examination of regulation. Immediately
following the event, the Subcommittee on Securities, Insurance and Investment of the Committee
on Banking, Housing and Urban Affairs of the United States Senate held a hearing “examining
the causes and implications of the May 6, 2010 market plunge and identifying what policy
changes may be necessary to prevent such events from occurring again”(U.S. Senate, 2010). In
the two years since then, there has been ample discussion on the best way to keep the markets a

How One Trade Could Change the World: HFT and the Flash Crash of 2010 Senior Capstone Project for Sarah Perlman
18
fair and efficient place for people to raise capital. As Mary Schapiro, Chairman of the Securities
and Exchange Commission stated “At the end of the day, our goal has got to be that our markets
operate fairly and efficiently and effectively for all the constituencies… our markets have to be
about investors and the ability to raise capital. So that is how we are going forward on these
issues” (U.S. Senate, 2010). The Securities Industry and Financial Markets Associations
(SIFMA) echoes Schapiro’s sentiments in saying “In general, SIFMA believes that the business
of trading should never take precedence over the business of investing” (SIFMA, 2011). This
holistic view of regulation takes into account the evolution of technology in the marketplace and
acknowledges the end goal to create a fair and equitable financial markets system. However,
with the constant evolution of technology, creating a fair and equitable financial marketplace is
proving to be an increasingly difficult task.
In the time since the flash crash, several regulatory steps have already been taken. Key
items that SIFMA distinguishes include: the SEC’s Market Access Rule, the Single Stock Circuit
Breaker Program, Limit Up/Limit Down Mechanism, Revisions to Market-Wide Circuit
Breakers, Large Trader Reporting Systems and Consolidated Audit Trails (SIFMA, 2011). The
Market Access Rule was implemented in November of 2010 to further implement risk controls
for broker-dealer clients in the market. In a press release by the SEC, they explain that the rule
was intended to focus on ‘unfiltered’ or ‘naked’ access, in which broker-dealers provide
customers with sponsored access to markets. It requires broker-dealers “to put in place risk
management controls and supervisory procedures to help prevent erroneous orders, ensure
compliance with regulatory requirements, and enforce pre-set credit or capital thresholds” (US
Securities and Exchange Commission , 2010). Spurred by an effort to increase transparency in
the marketplace, this regulation will help to bring more accountability in the monitoring and
controlling of risk on the part of the broker –dealer.
The single stock circuit breaker program created a five minute pause in a stock across all
US equity markets if there is a 10% change in the stock price. Already having been pushed back
four separate dates, it was extended to July of 2012 (Securities and Exchange Commission,
2012). This program is a very crucial component to creating market regulation on high frequency
trading because on days such as the flash crash, stock prices were incredibly volatile, with many
moving in swings greater than 10%. Further investigation of this circuit breaker program is

How One Trade Could Change the World: HFT and the Flash Crash of 2010 Senior Capstone Project for Sarah Perlman
19
crucial because while there is an existing market wide circuit breaker, the influence of high
frequency trading has altered the way these circuit breakers operate. In his statements before the
Senate, Gary Gensler, the Chairman of the Commodity Futures Trading Commission explained
“A lot these algorithms, just because it is [an] algorithm, don’t think smart…And so giving the
30-minute pause in the inter-market circuit breaker or even overnight if it is a 30 percent decline,
for instance, today gives humans a chance and information to come in” (U.S. Senate, 2010).
Algorithms have created an environment where computers execute what they are told to execute,
which in turn has created a system that can lack human logic and reasoning. Single stock circuit
breakers provide the market with that opportunity to recover and respond logically and
appropriately to major market situations, such as the flash crash.
One of the problems with the existing circuit breaker approach is that the circuit breakers
can be triggered by single inaccurate trades. The Limit Up/Limit Down mechanism would be a
complementary piece of regulation to ensure the most efficient and transparent market. This
mechanism would not allow trades to occur outside of a specified price band above or below the
average price of the stock for the preceding five minutes. These bands, which are set as a
percentage, would be adjusted to accommodate fundamental price shifts, and the opening and
closing of the market (Securities and Exchange Commission, 2011). With high frequency
trading, stocks can move intensely up or down based on many different signals that a human
would not necessarily trade from. Therefore, there the limit up/limit down mechanism was put in
place to attempt to curb the extreme volatility that high frequency trading has brought to the
market.
Another regulation that has been implemented is the Large Trader Reporting Regime.
Large traders will be required to identify themselves to the SEC, who will in turn give them a
unique identification number. Broker-dealers will be required to keep all transaction records for
their traders and be able to provide that information to the SEC should they deem it necessary.
Acknowledging the need to enhance the ability to analyze events quickly and accurately,
Chairman Schapiro said in a press release “This new rule will enable us to promptly and
efficiently identify significant market participants and collect data on their trading activity so that
we can reconstruct market events, conduct investigations, and bring enforcement actions as
appropriate” (“SEC adopts”, 2011). This piece of regulation is good because it creates more

How One Trade Could Change the World: HFT and the Flash Crash of 2010 Senior Capstone Project for Sarah Perlman
20
transparency and accountability among large traders in the marketplace. Since the SEC is has
more oversight on large traders, it will also be a crucial component to studying market structure
in the future.
The final major pieceof regulation that has been enacted since the flash crash is the
introduction of a consolidated audit trail. This rule would require self-regulatory agencies
(SROs) to create a system that would allow regulators to track information about the way trading
orders are received and executed across markets. Currently, there is no single database, so to
track suspicious activity requires copious amounts of data (“SEC proposes consolidated”, 2010).
While this would help to create a more fair and efficient market, this system would cost $4.1
billion to build and $2.1 billion annually to maintain and would most likely not be operational
until 2014 (D’Antonia, 2012). In an article in Traders Magazine, JohnD’Antonia Jr. explains
“The thinking behind the audit trail was to give regulators a central database of trade information
to help them reconstruct trades during a destabilizing market event, so they could figure out what
happened and possibly create safeguards to prevent future occurrences” (D’Antonia, 2012). As
of March 2012, this regulation was still being debated. However, in light of the fact that the flash
crash is still being investigated two years later, it could be an indication that regulators do need
to be able to reconstruct market activity quickly and easily.
With such a controversial topic, there are many approaches that can be taken. Europe has
begun to establish initiatives aimed at high frequency trading, not only providing definitions of
high frequency trading and algorithmic trading, but also outlining provisions for providing
liquidity and maintaining a ratio of orders to transactions executed, as well as risk controls and
filters (Seitz, 2010). Likewise, the Intercontinental Exchange (ICE) has successfully
implemented an HFT policy for over a year. President and COO Chuck Vice explained, “These
traders [HFT] represent the natural evolution of the long-standing market-making role as trading
overwhelmingly shifted to electronic venues in the last two decades. ICE believes that it is
incumbent upon exchanges to adopt rules and design controls that effectively address the
existence of high frequency trading within the context of market structure”
(IntercontinentalExchange, 2012). ICE’s High Frequency Messaging Policy was implemented
on its most heavily traded futures and OTC contracts to discourage inefficient and excessive
messaging using a Weighted Volume Ratio (WVR). The results were that the WVR declined

How One Trade Could Change the World: HFT and the Flash Crash of 2010 Senior Capstone Project for Sarah Perlman
21
63% in ICE Futures US markets, 19% in ICE Futures Europe markets and 53% in ICE’s OTC
markets. The number of violations of the policy’s highest thresholds dropped 93% after the
implementation of the policy (IntercontinentalExchange, 2012). While this is only one year’s
worth of data, studies such as this one will be crucial in determining appropriate regulatory
measures for high frequency trading in the United States.
The success of ICE’s policy indicates that there are regulatory alternatives available that
could have a major impact on preventing future flash crashes. SIFMA believes that other
potential alternatives that are being evaluated are putting throttles or disincentives on excessive
market data inputs, steps to ensure market data quality, studying the impact of maker-taker
pricing/rebates and access fees, adapting incentives and obligations for new market makers, and
conducting more empirical studies on factors causing increased market volatility (SIFMA, 2011).
All of these items should be explored in order to keep up with the constantly changing
marketplace. Regulation can take months or even years to be implemented, and as we have seen
with the flash crash, it can take even longer for a situation to be understood. Therefore, firms
have shown that it is possible to implement successful regulation and many others are sharing
their view for alternatives to help bring the regulatory component of high frequency trading up to
speed with the technology that is quickly outpacing it.
HYPOTHESES
To determine the effects that high frequency trading may have had on the events of May
6th, 2010, this paper will examine five hypotheses. These hypotheses compare data from the day
of the flash crash with four other randomly selected days in 2010 that had little or no news that
would have a drastic impact on the market. These dates were February 4th, May 3rd, May 19th,
and October 11th. It was important to select dates both within close proximity to the event date as
well as further throughout the year to see if there were any other underlying occurrences in
market around the time of the event. February 4th was chosen as a day with little market news
months before the actual flash crash. May 3rd was chosen as a day with little market news the
same week was the flash crash to show if there were any other events occurring that week that
could have influenced the flash crash. May 19th was chosen as a little news day two weeks after
the flash crash to determine if there were any residual implications that the flash crash left in the
How One Trade Could Change the World: HFT and the Flash Crash of 2010 Senior Capstone Project for Sarah Perlman
22
marketplace, and October 11th was chosen as a little news day months after the flash crash as a
post-flash crash control date. The trading day was broken into 26 fifteen minute intervals to
create a clear picture of the small timeframe in which these events occurred. T-Tests and Sign
Rank Tests were conducted comparing the control dates with the event dates. Since the Dow
Jones Industrial Average consists of 30 securities, it was on the limit of the number appropriate
for a T-Test and for a Sign Rank test. So to ensure accuracy, both tests were conducted. Alphas
of less than 10% were considered significant. From the Trades and Quotes data, five key
variables appeared important to analyze and present as hypotheses.
Hypothesis 1a: The returns during the flash crash of May 6th were lower than those
on the other four days when measured in fifteen minute periods.
Hypothesis 1b: The returns during the recovery of the flash crash on May 6th were
greater than on the other four test days when measured in fifteen minute periods.
Average returns reflect the increase or decrease of the average return calculated over the course
of the 15 minute period. Due to the rapid and frequent price changes on the day of the flash
crash, this hypothesis estimates that the average returns across the 30 components of the Dow
would be lower than a normal market day during the flash crash, but higher than a normal market
day .
Hypothesis 2: The number of trades executed after 1:30 pm on May 6th were greater
than on other four test days.
Due to the technology of high frequency trading platforms, algorithms can be programmed to
trade on price changes. This leads to the hypothesis that there were more trades executed on May
6th than the other test dates because stock prices fluctuated so drastically, it caused algorithms to
buy and sell with no regards to the other market conditions.
Hypothesis 3: The average volatility of the Dow Jones Industrial Average will be
higher after 1:30 pm on May 6th than on the other four test days.

How One Trade Could Change the World: HFT and the Flash Crash of 2010 Senior Capstone Project for Sarah Perlman
23
The average volatility was calculated by finding the standard deviation of returns based on every
trade, calculated based on tick by tick trading prices. This demonstrates the average amount that
a price could go up or down within short period of time. Most importantly measures the amount
of risk that is present in the market. With the uncertainty of the market events on that day, this
hypothesis predicts that there will be higher average volatility on May 6th.
Hypothesis 4: The average trade size on the Dow Jones Industrial Average will be
larger after 1:30 pm on May 6th than on the other four test days.
The influence of high frequency trading algorithms has led to a change in the way that trading
occurs. Many algorithms are programmed to trade in small blocks of 100 or 200 shares so that
when they execute trades, it does not tip off other traders that they are buying or selling.
However, this hypothesis argues that on the day of the flash crash, larger trades were executed
because algorithms were programmed to either rapidly buy or sell stocks at a certain price. With
the price fluctuations in the market, this would have led to larger trades.
Hypothesis 5: The average volume of trades on the Dow Jones Industrial Average
will be higher after 1:30 pm on May 6th than the other four test days.
This hypothesis estimates that the average number of trades that occur in each period will be
higher on the day of the flash crash than on any other day. This is because on May 6th, investors
would have wanted to either capitalize on pricing by buying or remove themselves from riskier
situations by selling. Similarly, many algorithms are programmed to trade on price changes and
other market fundamentals that could have been triggered with the abnormal market conditions,
therefore creating more trades. This was measured by determining the cumulative size of trades
on the DJIA and taking the average across the periods.
METHODOLOGY This study uses a compilation of New York Stock Exchange (NYSE) data to examine the
effects that high frequency trading has on financial markets and the role it played in the flash
crash. In this study, only the thirty stocks from the Dow Jones Industrial Average will be

How One Trade Could Change the World: HFT and the Flash Crash of 2010 Senior Capstone Project for Sarah Perlman
24
examined. The Dow 30 was selected in order to provide a complete market picture, while still
maintaining a manageable amount of trades to observe. Other indices, such as the S&P 500
would have had too many components to analyze effectively. The 30 stocks in the Dow are all
industry leading corporations and are widely held by investors, making this index an accurate
representation of market activity.
Using the Trades and Quotes system from the New York Stock Exchange, and retrieved
data for May 6th, the day of the flash crash, as well as February 4th, May 3rd, May 19th and
October 11th, as randomly selected days will little to no news that could greatly affect the market.
The list of the thirty holdings that were examined in this study can be found in Appendix H.
The information retrieved from the quotes included the following: the exchanges on while the
trades occurred (AMEX, Boston, NSX, NASD ADF and TRF, Philadelphia, Chicago, NYSE,
ARCA, NASDAQ, ISE, CBOE, BATS), the time the trades were executed, the bid, the bid size,
the offer, the offer size, any quote conditions, as well as the market maker identification. The
information retrieved for the trades included: the exchange, the time, the trade price, the trade
size, any conditions on the trade, any corrections made to the trades, as the stopped stock trade
indicator.
Once this data was retrieved, it was filtered in order to provide accurate representations
of market activity. The trades that were included were regular trades , without any stated
conditions. This includes trades that were executed on NYSE Direct + and BSE Instant Liquidity
which are both high speed automatic order execution platforms, and trades that were made
without checking for trade throughs making the broker responsible for the best execution. The
trades were also filtered for any corrections made to them, showing only regular trades that were
not corrected, changed or cancelled, original trades that were later corrected in which the record
displays the original time but corrected data for the trade, and any symbol corrections that were
made. NYSE TAQ qualifies all of the above correction codes as ‘Good Trades’. In terms of time,
the data only included trades during normal market hours, 9:30 am to 4:00 pm.
The trading day was divided into 26, 15 minute periods in order to display the frequent
and abrupt changes that occur in the marketplace. From this point, the mean, median, standard
deviation and sum of the returns, trade size, and price for the trades were calculated for each day.
In order to conduct Match T-Tests, this data was combined into a database and the differences in

How One Trade Could Change the World: HFT and the Flash Crash of 2010 Senior Capstone Project for Sarah Perlman
25
the data between the event dates for each of the five variables that were studied were calculated.
The variables being studied were trade size, number of trades, volatility, cumulative return, and
volume.
In order to determine the statistical significance of the relationship between May 6th and
the control dates, both parametric and non-parametric statistical tests were used. The parametric
test that was conducted is known as a matched t test. The null and alternative hypotheses for this
test are:
: 0
: 0
is the mean difference between the values for two samples. From there, we find the mean and
sample standard deviation for the difference values.
Σ
=
The final test statistic for hypothesis tests using matched samples is:
√
If the p value is less than 10%, then the value is deemed statistically significant. (Anderson,
2011)
The second set of tests that was run was a Wilcoxon Signed Rank Test. This is a non-
parametric test that does not require the differences between the paired observations to be
normally distributed. The populations must be symmetrical when the shapes of the two
populations are the same to determine if there is a difference between the median of the two
populations. In this test, the hypotheses are:
: Median for method A- Median for method B >0
: Median for method A- Median for method B ≤0

How One Trade Could Change the World: HFT and the Flash Crash of 2010 Senior Capstone Project for Sarah Perlman
26
First,difference of zero are eliminated, and then the absolute value of the remaining
difference are calculated. Next, the absolute differences are ranked from lowest to highest,
beginning with 1. Each rank is then given the appropriate sign (positive or negative) based on
the original difference. denotes the sum of the positive signed ranks and used as the test
statistic. The next step is to determine the mean and standard deviation of the population
respectively:
:1
4
: 1 2 124
Then the p value is computed.If it is less than .10, this test will consider it statistically
significant. The results of these tests will demonstrate if there is a statistical significance between
the event day and the control day, thereby providing grounds to accept or reject the hypothesis
(Anderson, 2011).
RESULTS
Hypothesis 1
As can be seen in Appendix A, around 2 pm, returns started tobecomenegative, taking a sharp
turn down at about 2:20pm. Theyreach the low of -0.0439, or -4.3%. The average returns
rebound around 2:40, reaching a peak of .0835, or 8.35%, before returning to average levels and
closing the day at almost 0, .0027, or -.27% returns. The T-Test shows statistical significance at
10%. When evaluating the statistical analysis we do not observe a statistically significant
difference between return on May 6th and return on the control days. When looking at the Sign
Rank test, the values follow the same pattern, showing statistical significance. When examining
the alphas of both of these tests, from1:30 pm to 3:00 pm, the values are at or around 0.000,
meaning that these are very statistically significant. In a paper by Jialin Yu of Columbia Business
School, he presents the argument that stocks with better past returns crashed more on May 6th
than other stocks. Yu suggests this is because these stocks are unattractive to contrarian

How One Trade Could Change the World: HFT and the Flash Crash of 2010 Senior Capstone Project for Sarah Perlman
27
buyers(Yu, 2011). Contrarian traders are traders that buy or sell against market trends. In this
study, this phenomenon was found hold true when examining cumulative returns. In Appendix
F, it is evident that the flash crash produced wild swings for Procter and Gamble (PG), in terms
of both price and return. In the first chart of the appendix, it shows the constant price
appreciation PG has enjoyed over the past three years, and the following charts depict the
volatility in returns that PG experienced during the flash crash. In Yu’s conclusion, he explains
“…the glass is half full because the study simultaneously find a group of stocks a contrarian
buyer is unlikely interested in stabilizing, even with big crash sizes” (Yu, 2011). Therefore,
while contrarian stabilization is certainly not what led to drastic cumulative returns of securities
like PG during the flash crash, it could be one step closer to examining swings in cumulative
return that happened across major companies such as PG, ExxonMobil (XOM), and Alcoa (AA).
The results of this study differ from many widely reported industry statistics for two
possible reasons. The first reason is that when calculating the average return the first and last
price for the period of each security so many of the larger price swings of securities were not
included in the calculations. Secondly, this study only included trades designated as ‘good’ by
the New York Stock Exchange, which could eliminate some of the trades which were included in
the other industry studies.
Hypothesis 2 As can be seen in Appendix B on May 6th the average number of trades on the Dow Jones
Industrial Average began increasing around 2:00 and remained at above average levels
throughout the rest of the day. The interesting point to note about Appendix B is that on all days,
the number of trades appears to follow the U shaped curve indicating that there were more trades
made at the opening and close of the market. In August of 2010, the first and last hour of trading
generated almost 58% of New York Stock Exchange primary volume, in increase from 45% in
August of 2005 (Peterson, 2010). On May 6th, after the number of trades spiked and then
retreated, the levels still increased again for the close of the market. The t-test and sign rank tests
show statistical significance at 10% after 2:00 pm. Since number of trades rose before the flash
crash occurred, it could be an indication that there were smaller earlier market events that
triggered the flash crash that algorithms were picking up on and began buying and selling stock.

How One Trade Could Change the World: HFT and the Flash Crash of 2010 Senior Capstone Project for Sarah Perlman
28
Many argue that quote stuffing, in which trades are placed and then cancelled, is a major
problem that is associated with high frequency trading. However, as Adam Sussman of the
TABB Group points out in his discussion of “What Isn’t in the Flash Crash Report”, he says
“There is no evidence that quote stuffing played a part in the Flash Crash. Indeed, the report
implies the opposite, namely that quote volume dramatically increased because folks were
exiting the market en mass, replacing their tightly quoted spreads with stub quotes, for example”
(Sussman, 2010). When examining the average daily volume (ADV) of the VIX (volatility index
of the S&P 500), it shows that during times of uncertainty, volumes increase significantly.
Matthew Simon, also of the TABB Group, states “Case in point: Post the May 6 Flash Crash, the
VIX increased significantly above its five-year average of 23, and busier trading days followed.
Also, figures published by major exchanges show that equity market volumes increased to their
highest levels over the last 10 years during the 2008/2009 credit crisis” (Simon, 2011). The
concepts of trading under uncertain market conditions confirms the results of the event study that
shows a large increase in the number of trades on the day of the Flash Crash and the high
statistical significance between May 6th and the control dates. The event study has shown that
with more uncertainty in the market comes more trades in the marketplace.
Hypothesis 3
This event study found that average volatility peaked in the 2:45 period, where it reached a level
of .00532, which is significantly higher than levels on the other days, most of which remain close
to 0. Statistically, at 2:00 the Sign Rank values become both positive and much larger, and the
alphas for the sign ranks are very low demonstrating the statistical significance of therelationship
between May 6th and the other test days. Likewise, the T-Test values also increase and remain
positive, and the alphas fall to below 10%, confirming the significance of the increase in
volatility on May 6th. This shows that during the flash crash, there was a much larger amount of
risk in the market. In his speech at the International Economic Association Sixteenth World
Congress, Andrew Haldane of the Bank of England highlights the relationship between market
volatility and correlation. Figure 2 demonstrates the volatility correlation between the
components of the S&P 500 and showing that since the introduction of trading platform

How One Trade Could Change the World: HFT and the Flash Crash of 2010 Senior Capstone Project for Sarah Perlman
fragmentation and HFT in 2005, there has been an increase in volatility and correlation 10 and 8
percent respectively. In Figure 2, Haldane also points to excess correlation which is measured
market correlation in excess volatility on the S&P 500, which in July of 2011 was at all-time
highs (Haldane, 2011).
“Taken together, this evidence points towards market volatility being both higher and propagating further than in the past…Coincidence does not of course imply causality. Factors other than HFT may explain these patterns. Event studies provide one way of untangling this knitting…The official report on the flash crash, while not blaming HFT firms for starting the cascade, assigns them an important role in propagating it. (Haldane, 2011)
Figure 2: Volatility and Correlation and Excess Volatility
(Haldane, 2011).
While, Haldane’s evidence uses the S&P 500, similar conclusions can be drawn with this event
study of the Dow. In Appendix C, it is evident that the average volatility increases five-fold on
the day of the flash crash, and the alphas of the Sign Rank tests drop to zero, which proves the
statistical significance of the event. This further demonstrates Haldane’s point that “Taken
together, this evidence suggests something important. Far from solving the liquidity problem in
situations of stress, HFT firms appear to have added to it. And far from mitigating market stress,
HFT appears to have amplified it” (Haldane, 2011). The Flash Crash is an event that is directly
connected to high frequency trading, and this event study directly demonstrates the great effect
that high frequency trading can have on volatility in the marketplace.
29

How One Trade Could Change the World: HFT and the Flash Crash of 2010 Senior Capstone Project for Sarah Perlman
30
Hypothesis 4
This hypothesis was rejected because during the flash crash, the average trade size on the Dow
Jones Industrial Average remained in the 200 to 250 shares per trade range, as can be seen in
Appendix D. The Sign Rank tests show statistical significance at 10% in the relationship
between May 6th and February 4th; however, in comparison, October 14th only showed statistical
significance at 10% after 3:00 pm which was after the flash crash occurred. . The T-tests
confirmed these findings with similarly negative values and high alphas. This brings light to the
prevalence of algorithms in the market because the algorithms are frequently programmed to
trade in small blocks. With all of the uncertainty, many human traders could have stopped
trading or not traded large positions during the flash crash. Another factor that should be
considered is that there were many trades that were cancelled that had been executed within the
period the flash crash occurred in. These could have been larger trades with traders trying to
capitalize on low prices or get out of securities before prices dropped too far. In a transcript of an
interview with Joe Saluzzi, Partner at Themis Trading and member of the CTFC Subcommittee
on Automated and High Frequency Trading, Saluzzi says “The type of trades that are out there
now used to be dominated by institutional volume and the block trade was a big deal. When you
sold a block, the stock would move accordingly. Well the blocks are miniscule now compared to
overall volume. Most of the volume is 100-share prints to an average trade size of 5200 shares.
That’s because the type of trades have changed” (The Equity Market, 2011). This means that the
firm could be selling a total of 5200 shares; however, they split the transaction into several
smaller ones to further high frequency trader’s strategies. This would allow for example , the
trade would go undetected by other firms. Therefore, Saluzzi’s point of view confirms that there
has been a major shift in the types of trades made in the equity markets. The electronic markets
have opened the investing world up to new players who are trading faster, and in smaller blocks
in order to stay competitive. This further demonstrates the changing face of the financial
marketplace, because where there was once few and larger blocks of shares being traded, there

How One Trade Could Change the World: HFT and the Flash Crash of 2010 Senior Capstone Project for Sarah Perlman
31
are now more, smaller trades being placed which has implications on liquidity and infrastructure
in terms of firms remaining competitive in the market.
Hypothesis 5
According to Appendix Ethe volume of trades on the DJIA peaked in the 2:30 period and
remained high through the 2:45 period, retreated and then rose during the end of day trading.
This shows that trading volume was much higher than it usually is on the control days. The
statistical analysis confirms this, because after 1:30, the alphas demonstrate the statistically
significant relationships between May 6th and the control dates. This rise in trading volume can
be attributed to high frequency trading because with the introduction of computer and
algorithms, trades can take place so rapidly and are programmed to execute on many different
bases. Therefore, many of the abnormal trading conditions that the flash crash brought could
have triggered more trades than would have occurred on a normal day. According to industry
estimates, HFT accounts for about two thirds of US stock market volume (Patterson, 2010 June),
and this was evidenced on the day of the flash crash. However, the flow of volume is the crucial
component to examine in this case. In an article in Securities Technology Monitor, Tom Steinert-
Threlkeld brings together portions of SEC chairman Schapiro’s statements on the one-year
anniversary of the flash crash, pointing to structural problems in the market that are attributed to
high frequency trading. “Fundamental investors, in fact, she said, would have been strong buyers
in the decline, when prices plunged 600 points in five minutes. But high-frequency traders did
not act like fundamental investors—or market makers…The specialists, who accounted for 17%
for the volume, were net buyers in the decline. The crash took out 6.3% of the value of stocks, at
its max” (Steinert-Threlkeld, 2011). Therefore, this evidences the concept that volume and
liquidity, which are supposed to be made by high frequency traders, can often greatly fluctuate,
especially when HFT traders turn their computers off and get out of the market when there is all
of a sudden a downturn.
How One Trade Could Change the World: HFT and the Flash Crash of 2010 Senior Capstone Project for Sarah Perlman
32
CONCLUSION By conducting this event study of the flash crash, it further demonstrates the impact that
this market event had on the overall marketThe introduction of technology in the stock markets
has led to an increase in both adjusted close and volume to the Dow Jones Industrial Average
over the past fifteen years. The influx in volume and prices have created a more high stakes
environment in which both traders and regulators are trying to keep up with the developments in
the market landscape. With the introduction and increased popularity of high frequency trading,
the financial markets are operating in uncharted waters. The lack of a common definition of high
frequency trading contributes to the investor uncertainty that exists. Likewise, the fact that
algorithms execute on command without the traditional logic that goes into trading has changed
the face of the market place.
This however is not saying it has changed for the worse, as can be seen in the comparison
to the crash of 1987, it can prove to minimize some of the implications of market crashes. High
frequency trading has led to decreased transaction costs for some investors, yet has created a
liquidity crisis for others with the introduction of trade practices such as dark pools and quote
stuffing. Regulation is a part of this industry that needs to be further developed and moving
forward, concise and decisive action will needed to be taken by the appropriate regulatory
agencies. High frequency trading has evolved from a type of trade to a business strategy and
thus must be regulated as such. At the end of the day, it is most important that the financial
markets remain a fair and efficient place to do business.
The data analysis in the paper show that crashes such as the flash crash can have major
effects on the market and are statistically significant event . Four out of five hypotheses were
proven to be valid and all demonstrated drastic statistical significance, evidencing the gravity of
the flash crash. These studies have certainly proved that with an increase in technology comes
an increased risk, and with that must come a heightened understanding of the world in which we
live. Since this study used the 30 stocks that make up the Dow Jones Industrial Average, one of
the limitations to this study is that it does only incorporate 30 securities. With additional
resources and time, it would be interesting to study other indices as well and compare the results,
because companies such as Accenture had some of the larger price changes during the flash
crash. Due to the fact that it is not included in the Dow 30, this was not incorporated in the data

How One Trade Could Change the World: HFT and the Flash Crash of 2010 Senior Capstone Project for Sarah Perlman
33
and thus the results for the same study done on a different index may yield different results.
Likewise, due to the complexity of the way trades were cancelled during the flash crash, some of
the data was yielding outlier results and thus average return had to be calculated using the quotes
from the beginning and end of the period. With more concrete data on prices for that day it could
yield a different result for the average return numbers.
MOVING FORWARD Within a month of this paper being written, high frequency trading was brought into the limelight
again. After operating for years, BATS went public on March 23rd, only to be forced to withdraw
its IPO after a technical glitch caused erroneous trades. Explaining their company in their initial
public filing, they explain “…we are a technology company at our core. We developed, own and
operate the BATS trading platform, which we designed to optimize reliability, speed, scalability
and versatility” (Benoit, 2012). According to the Wall Street Journal, over the course of nine
seconds, BATS went from $15.25, already below their expected IPO price, dropping to
$0.0002cents before climbing back to 4 cents, where trading was halted (Benoit, 2012). This
glitch apparently caused Apple to have a brief crash itself, with shares falling 9.4% and hitting a
low of $542.80. However, Nasdaq cancelled the erroneous trades and APPL resumed trading as
usual (Russolillo, 2012). This mishap, which in hindsight was a software error on the part of
BATS, and which in hindsight was not actually related to high frequency trading per se, just
further demonstrates the need for accountability, transparency and most importantly, clarification
of terminology. Errors and confusion with technology is not a problem that will be going away
any time soon, and for the safety, security and transparency of our markets, it is crucial that there
more understanding of this high speed world that changes every second. The culmination of
market events since May 6th, 2010 has truly shown how one single trade can truly change the
world.
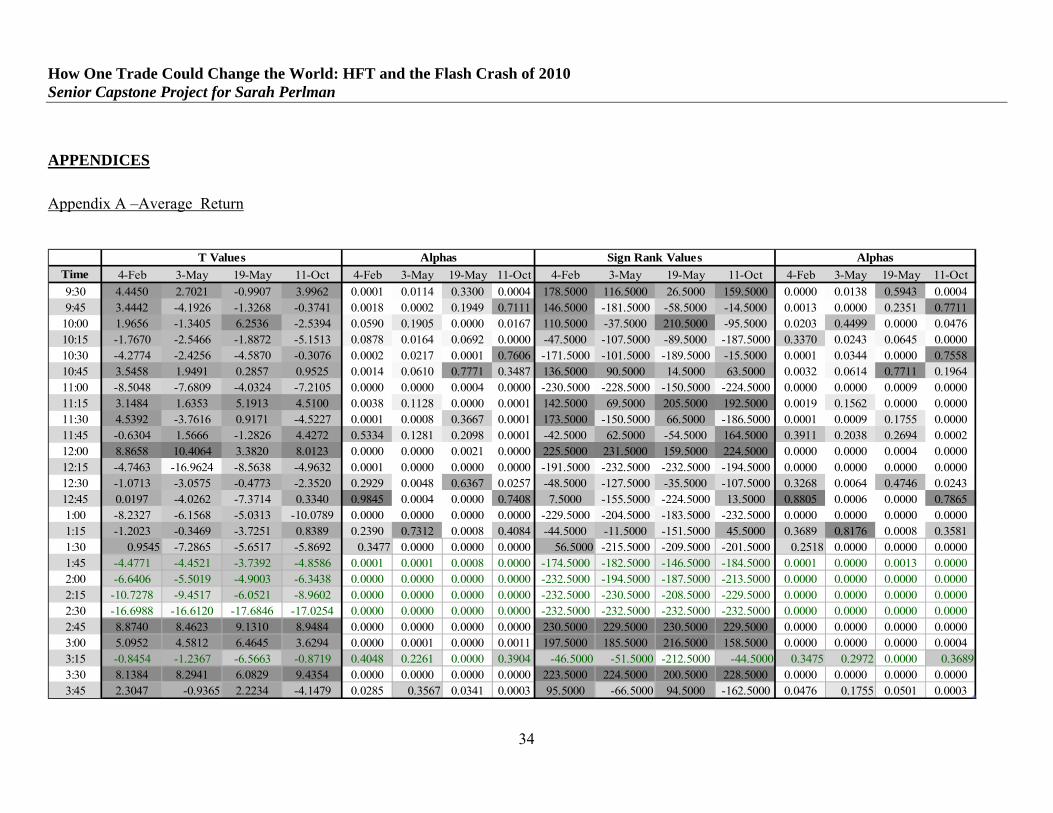
How One Trade Could Change the World: HFT and the Flash Crash of 2010 Senior Capstone Project for Sarah Perlman
APPENDICES
Appendix A –Average Return
Time 4-Feb 3-May 19-May 11-Oct 4-Feb 3-May 19-May 11-Oct 4-Feb 3-May 19-May 11-Oct 4-Feb 3-May 19-May 11-Oct9:30 4.4450 2.7021 -0.9907 3.9962 0.0001 0.0114 0.3300 0.0004 178.5000 116.5000 26.5000 159.5000 0.0000 0.0138 0.5943 0.00049:45 3.4442 -4.1926 -1.3268 -0.3741 0.0018 0.0002 0.1949 0.7111 146.5000 -181.5000 -58.5000 -14.5000 0.0013 0.0000 0.2351 0.7711
10:00 1.9656 -1.3405 6.2536 -2.5394 0.0590 0.1905 0.0000 0.0167 110.5000 -37.5000 210.5000 -95.5000 0.0203 0.4499 0.0000 0.047610:15 -1.7670 -2.5466 -1.8872 -5.1513 0.0878 0.0164 0.0692 0.0000 -47.5000 -107.5000 -89.5000 -187.5000 0.3370 0.0243 0.0645 0.000010:30 -4.2774 -2.4256 -4.5870 -0.3076 0.0002 0.0217 0.0001 0.7606 -171.5000 -101.5000 -189.5000 -15.5000 0.0001 0.0344 0.0000 0.755810:45 3.5458 1.9491 0.2857 0.9525 0.0014 0.0610 0.7771 0.3487 136.5000 90.5000 14.5000 63.5000 0.0032 0.0614 0.7711 0.196411:00 -8.5048 -7.6809 -4.0324 -7.2105 0.0000 0.0000 0.0004 0.0000 -230.5000 -228.5000 -150.5000 -224.5000 0.0000 0.0000 0.0009 0.000011:15 3.1484 1.6353 5.1913 4.5100 0.0038 0.1128 0.0000 0.0001 142.5000 69.5000 205.5000 192.5000 0.0019 0.1562 0.0000 0.000011:30 4.5392 -3.7616 0.9171 -4.5227 0.0001 0.0008 0.3667 0.0001 173.5000 -150.5000 66.5000 -186.5000 0.0001 0.0009 0.1755 0.000011:45 -0.6304 1.5666 -1.2826 4.4272 0.5334 0.1281 0.2098 0.0001 -42.5000 62.5000 -54.5000 164.5000 0.3911 0.2038 0.2694 0.000212:00 8.8658 10.4064 3.3820 8.0123 0.0000 0.0000 0.0021 0.0000 225.5000 231.5000 159.5000 224.5000 0.0000 0.0000 0.0004 0.000012:15 -4.7463 -16.9624 -8.5638 -4.9632 0.0001 0.0000 0.0000 0.0000 -191.5000 -232.5000 -232.5000 -194.5000 0.0000 0.0000 0.0000 0.000012:30 -1.0713 -3.0575 -0.4773 -2.3520 0.2929 0.0048 0.6367 0.0257 -48.5000 -127.5000 -35.5000 -107.5000 0.3268 0.0064 0.4746 0.024312:45 0.0197 -4.0262 -7.3714 0.3340 0.9845 0.0004 0.0000 0.7408 7.5000 -155.5000 -224.5000 13.5000 0.8805 0.0006 0.0000 0.78651:00 -8.2327 -6.1568 -5.0313 -10.0789 0.0000 0.0000 0.0000 0.0000 -229.5000 -204.5000 -183.5000 -232.5000 0.0000 0.0000 0.0000 0.00001:15 -1.2023 -0.3469 -3.7251 0.8389 0.2390 0.7312 0.0008 0.4084 -44.5000 -11.5000 -151.5000 45.5000 0.3689 0.8176 0.0008 0.35811:30 0.9545 -7.2865 -5.6517 -5.8692 0.3477 0.0000 0.0000 0.0000 56.5000 -215.5000 -209.5000 -201.5000 0.2518 0.0000 0.0000 0.00001:45 -4.4771 -4.4521 -3.7392 -4.8586 0.0001 0.0001 0.0008 0.0000 -174.5000 -182.5000 -146.5000 -184.5000 0.0001 0.0000 0.0013 0.00002:00 -6.6406 -5.5019 -4.9003 -6.3438 0.0000 0.0000 0.0000 0.0000 -232.5000 -194.5000 -187.5000 -213.5000 0.0000 0.0000 0.0000 0.00002:15 -10.7278 -9.4517 -6.0521 -8.9602 0.0000 0.0000 0.0000 0.0000 -232.5000 -230.5000 -208.5000 -229.5000 0.0000 0.0000 0.0000 0.00002:30 -16.6988 -16.6120 -17.6846 -17.0254 0.0000 0.0000 0.0000 0.0000 -232.5000 -232.5000 -232.5000 -232.5000 0.0000 0.0000 0.0000 0.00002:45 8.8740 8.4623 9.1310 8.9484 0.0000 0.0000 0.0000 0.0000 230.5000 229.5000 230.5000 229.5000 0.0000 0.0000 0.0000 0.00003:00 5.0952 4.5812 6.4645 3.6294 0.0000 0.0001 0.0000 0.0011 197.5000 185.5000 216.5000 158.5000 0.0000 0.0000 0.0000 0.00043:15 -0.8454 -1.2367 -6.5663 -0.8719 0.4048 0.2261 0.0000 0.3904 -46.5000 -51.5000 -212.5000 -44.5000 0.3475 0.2972 0.0000 0.36893:30 8.1384 8.2941 6.0829 9.4354 0.0000 0.0000 0.0000 0.0000 223.5000 224.5000 200.5000 228.5000 0.0000 0.0000 0.0000 0.00003:45 2.3047 -0.9365 2.2234 -4.1479 0.0285 0.3567 0.0341 0.0003 95.5000 -66.5000 94.5000 -162.5000 0.0476 0.1755 0.0501 0.0003
T Values Alphas Sign Rank Values Alphas
34

How One Trade Could Change the World: HFT and the Flash Crash of 2010 Senior Capstone Project for Sarah Perlman
35
-0.043935142
0.08356262
-0.06
-0.04
-0.02
0
0.02
0.04
0.06
0.08
0.1
0.12
Average Return
February 4 May 3 May 6 May 19 October 11

How One Trade Could Change the World: HFT and the Flash Crash of 2010 Senior Capstone Project for Sarah Perlman
Appendix B- Average Number of Trades
Time 4-Feb 3-May 19-May 14-Oct 4-Feb 3-May 19-May 14-Oct 4-Feb 3-May 19-May 14-Oct 4-Feb 3-May 19-May 14-Oct9:30 -1.3182 2.0892 -2.5267 5.3906 0.1978 0.0456 0.0172 0.0000 -105.5000 81.5000 -136.5000 231.5000 0.0274 0.0940 0.0032 0.00009:45 -2.3602 4.9083 -3.3589 6.1457 0.0252 0.0000 0.0022 0.0000 -104.5000 187.5000 -142.5000 217.5000 0.0290 0.0000 0.0019 0.000010:00 -2.4414 3.9652 -5.4593 4.4564 0.0210 0.0004 0.0000 0.0001 -145.5000 205.0000 -224.5000 223.5000 0.0015 0.0000 0.0000 0.000010:15 -1.8823 4.6932 -5.7813 5.2168 0.0699 0.0001 0.0000 0.0000 -85.5000 213.5000 -232.5000 228.5000 0.0782 0.0000 0.0000 0.000010:30 -1.5983 2.8529 -6.7514 5.4109 0.1208 0.0079 0.0000 0.0000 -113.5000 184.5000 -219.5000 231.5000 0.0168 0.0000 0.0000 0.000010:45 2.8354 5.3372 0.0606 5.6546 0.0083 0.0000 0.9521 0.0000 124.5000 215.5000 -24.5000 231.5000 0.0080 0.0000 0.6225 0.000011:00 3.3227 6.0412 3.9015 5.7746 0.0024 0.0000 0.0005 0.0000 172.5000 232.5000 193.5000 232.5000 0.0001 0.0000 0.0000 0.000011:15 2.4951 5.2743 0.3270 5.5331 0.0185 0.0000 0.7460 0.0000 116.5000 232.5000 85.5000 232.5000 0.0138 0.0000 0.0782 0.000011:30 -1.6755 5.1272 -0.8914 5.6314 0.1046 0.0000 0.3801 0.0000 -85.5000 231.5000 -16.5000 232.5000 0.0782 0.0000 0.7405 0.000011:45 5.2929 6.6295 -1.0919 6.5326 0.0000 0.0000 0.2839 0.0000 197.5000 232.5000 -71.5000 232.5000 0.0000 0.0000 0.1442 0.000012:00 3.2335 4.9288 2.7201 5.3544 0.0030 0.0000 0.0109 0.0000 208.5000 232.5000 144.5000 232.5000 0.0000 0.0000 0.0016 0.000012:15 1.8878 -0.7876 -3.8559 5.8362 0.0691 0.4373 0.0006 0.0000 106.5000 -42.5000 -193.5000 232.5000 0.0258 0.3911 0.0000 0.000012:30 0.7330 0.9761 -1.8209 6.7180 0.4695 0.3371 0.0790 0.0000 77.5000 94.5000 -80.5000 232.5000 0.1122 0.0501 0.0984 0.000012:45 1.0858 2.9288 0.3836 5.0655 0.2865 0.0066 0.7040 0.0000 24.5000 174.5000 48.5000 232.5000 0.6225 0.0001 0.3268 0.00001:00 3.6859 4.2627 -5.0346 5.2506 0.0009 0.0002 0.0000 0.0000 193.5000 206.5000 -194.5000 232.5000 0.0000 0.0000 0.0000 0.00001:15 4.3095 4.5799 2.0810 5.2077 0.0002 0.0001 0.0464 0.0000 232.5000 232.5000 100.5000 232.5000 0.0000 0.0000 0.0363 0.00001:30 3.7966 4.5378 3.1727 5.7759 0.0007 0.0001 0.0036 0.0000 215.5000 230.5000 157.5000 232.5000 0.0000 0.0000 0.0005 0.00001:45 2.2965 5.2194 2.2438 6.1399 0.0291 0.0000 0.0326 0.0000 135.5000 231.5000 94.5000 231.5000 0.0035 0.0000 0.0501 0.00002:00 4.9423 5.1638 4.7228 5.2580 0.0000 0.0000 0.0001 0.0000 232.5000 232.5000 232.5000 232.5000 0.0000 0.0000 0.0000 0.00002:15 7.3159 7.2467 7.3060 7.2883 0.0000 0.0000 0.0000 0.0000 232.5000 232.5000 232.5000 232.5000 0.0000 0.0000 0.0000 0.00002:30 6.9839 7.0726 7.0808 7.1171 0.0000 0.0000 0.0000 0.0000 232.5000 232.5000 232.5000 232.5000 0.0000 0.0000 0.0000 0.00002:45 6.0404 6.0985 5.8167 6.0946 0.0000 0.0000 0.0000 0.0000 232.5000 232.5000 232.5000 232.5000 0.0000 0.0000 0.0000 0.00003:00 6.2331 6.1951 6.0507 6.3271 0.0000 0.0000 0.0000 0.0000 232.5000 232.5000 232.5000 232.5000 0.0000 0.0000 0.0000 0.00003:15 5.6858 6.2636 5.5343 6.3825 0.0000 0.0000 0.0000 0.0000 232.5000 232.5000 232.5000 232.5000 0.0000 0.0000 0.0000 0.00003:30 4.7775 6.7201 4.4523 6.1861 0.0000 0.0000 0.0001 0.0000 213.5000 232.5000 230.5000 232.5000 0.0000 0.0000 0.0000 0.00003:45 5.8436 6.9769 6.2154 7.2573 0.0000 0.0000 0.0000 0.0000 232.5000 232.5000 232.5000 232.5000 0.0000 0.0000 0.0000 0.0000
T-Values Alphas Sign Rank Alphas
36

How One Trade Could Change the World: HFT and the Flash Crash of 2010 Senior Capstone Project for Sarah Perlman
37
2690.3
17589.7
0
2000
4000
6000
8000
10000
12000
14000
16000
18000
20000
Average Number of Trades
4-Feb 3-May 6-May 19-May 11-Oct

How One Trade Could Change the World: HFT and the Flash Crash of 2010 Senior Capstone Project for Sarah Perlman
Appendix C- Average Volatility
Time 4-Feb 3-May 19-May 11-Oct 4-Feb 3-May 19-May 11-Oct 4-Feb 3-May 19-May 11-Oct 4-Feb 3-May 19-May 11-Oct9:30 0.6393 1.1791 -0.9897 2.1921 0.5276 0.2479 0.3305 0.0365 43.5000 49.5000 61.5000 167.5000 0.3799 0.3167 0.2113 0.00029:45 -2.7383 3.1348 1.1587 4.2166 0.0104 0.0039 0.2560 0.0002 -123.5000 172.5000 45.5000 170.5000 0.0086 0.0001 0.3581 0.0001
10:00 -1.5766 3.9458 0.2235 4.7542 0.1257 0.0005 0.8247 0.0001 -47.5000 160.5000 7.5000 188.5000 0.3370 0.0003 0.8805 0.000010:15 -2.9356 4.1493 -5.2388 3.4683 0.0065 0.0003 0.0000 0.0017 -133.5000 174.5000 -189.5000 148.5000 0.0041 0.0001 0.0000 0.001110:30 -2.4090 5.8952 -3.3809 4.3798 0.0226 0.0000 0.0021 0.0001 -102.5000 215.5000 -138.5000 174.5000 0.0325 0.0000 0.0027 0.000110:45 -1.1246 3.0582 -3.5052 3.8235 0.2700 0.0048 0.0015 0.0006 -41.5000 176.5000 -139.5000 154.5000 0.4025 0.0000 0.0025 0.000611:00 1.1002 2.9504 1.0504 2.6767 0.2803 0.0062 0.3022 0.0121 10.5000 156.5000 3.5000 131.5000 0.8332 0.0005 0.9441 0.004811:15 -2.0752 3.8370 -1.4136 2.1814 0.0469 0.0006 0.1681 0.0374 -77.5000 157.5000 -69.5000 100.5000 0.1122 0.0005 0.1562 0.036311:30 -0.5551 1.9977 0.3951 1.3733 0.5831 0.0552 0.6957 0.1802 -110.5000 130.5000 -52.5000 45.5000 0.0203 0.0051 0.2878 0.358111:45 -1.8451 4.4141 -3.7166 2.6212 0.0753 0.0001 0.0009 0.0138 -87.5000 184.5000 -164.5000 118.5000 0.0711 0.0000 0.0002 0.012112:00 -0.4008 3.9786 0.3496 1.2153 0.6915 0.0004 0.7292 0.2340 -21.5000 170.5000 8.5000 49.5000 0.6659 0.0001 0.8646 0.316712:15 -1.3744 3.7086 -2.2912 1.6065 0.1798 0.0009 0.0294 0.1190 -85.5000 166.5000 -141.5000 89.5000 0.0782 0.0002 0.0021 0.064512:30 -2.2068 2.0534 -2.4673 2.2228 0.0354 0.0491 0.0198 0.0342 -104.5000 114.5000 -112.5000 132.5000 0.0290 0.0158 0.0179 0.004412:45 -3.8311 2.6975 -1.7020 0.8575 0.0006 0.0115 0.0994 0.3982 -161.5000 113.5000 -80.5000 88.5000 0.0003 0.0168 0.0984 0.06781:00 0.6199 3.6894 -0.8890 1.5445 0.5401 0.0009 0.3813 0.1333 -10.5000 167.5000 -88.5000 74.5000 0.8332 0.0002 0.0678 0.12741:15 0.3247 2.2986 -0.1358 1.3832 0.7477 0.0289 0.8929 0.1771 -16.5000 146.5000 -43.5000 103.5000 0.7405 0.0013 0.3799 0.03071:30 -0.8592 -1.2156 -0.1945 2.2597 0.3973 0.2340 0.8471 0.0315 -79.5000 -69.5000 -29.5000 116.5000 0.1028 0.1562 0.5530 0.01381:45 -1.9130 4.7819 -0.2940 2.0981 0.0657 0.0000 0.7709 0.0447 -121.5000 196.5000 -14.5000 98.5000 0.0099 0.0000 0.7711 0.04052:00 2.2596 7.5891 2.4641 5.1239 0.0315 0.0000 0.0199 0.0000 89.5000 227.5000 105.5000 184.5000 0.0645 0.0000 0.0274 0.00002:15 11.7853 12.0917 11.8402 7.6256 0.0000 0.0000 0.0000 0.0000 232.5000 232.5000 229.5000 220.5000 0.0000 0.0000 0.0000 0.00002:30 10.6150 11.2526 11.1840 11.0577 0.0000 0.0000 0.0000 0.0000 232.5000 232.5000 232.5000 232.5000 0.0000 0.0000 0.0000 0.00002:45 5.5280 5.5456 5.5186 5.5326 0.0000 0.0000 0.0000 0.0000 232.5000 232.5000 232.5000 232.5000 0.0000 0.0000 0.0000 0.00003:00 3.9655 4.0459 3.9822 3.9967 0.0004 0.0004 0.0004 0.0004 232.5000 232.5000 232.5000 232.5000 0.0000 0.0000 0.0000 0.00003:15 1.7319 1.8009 1.6722 1.7822 0.0939 0.0821 0.1052 0.0852 232.5000 232.5000 232.5000 229.5000 0.0000 0.0000 0.0000 0.00003:30 10.4752 13.9076 11.2624 11.5375 0.0000 0.0000 0.0000 0.0000 231.5000 232.5000 231.5000 232.5000 0.0000 0.0000 0.0000 0.00003:45 15.8474 14.2938 13.8438 13.0856 0.0000 0.0000 0.0000 0.0000 232.5000 232.5000 232.5000 232.5000 0.0000 0.0000 0.0000 0.0000
38

How One Trade Could Change the World: HFT and the Flash Crash of 2010 Senior Capstone Project for Sarah Perlman
39
0.005325872
0
0.001
0.002
0.003
0.004
0.005
0.006
Average Volatility
4-Feb 3-May 6-May 19-May 11-Oct

How One Trade Could Change the World: HFT and the Flash Crash of 2010 Senior Capstone Project for Sarah Perlman
Appendix D- Average Trade Size
Time 4-Feb 3-May 19-May 14-Oct 4-Feb 3-May 19-May 14-Oct 4-Feb 3-May 19-May 14-Oct 4-Feb 3-May 19-May 14-Oct9:30 0.8257 0.9625 1.2594 0.8070 0.4157 0.3438 0.2179 0.4263 0.5000 29.5000 123.5000 -2.5000 0.9920 0.5530 0.0086 0.96009:45 -0.6805 -0.5359 2.5740 -0.2550 0.5016 0.5961 0.0154 0.8005 -53.5000 -42.5000 140.5000 -17.5000 0.2785 0.3911 0.0023 0.725410:00 -0.2458 -0.3791 4.4281 0.1711 0.8075 0.7074 0.0001 0.8654 74.5000 1.5000 187.5000 27.5000 0.1274 0.9760 0.0000 0.580410:15 -0.7423 -0.6691 3.0922 -0.9294 0.4639 0.5087 0.0044 0.3604 -36.5000 -51.5000 155.5000 -47.5000 0.4622 0.2972 0.0006 0.337010:30 -2.6988 -0.4323 3.5117 -1.7096 0.0115 0.6687 0.0015 0.0980 -151.5000 -48.5000 174.5000 -79.5000 0.0008 0.3268 0.0001 0.102810:45 -1.6663 -0.2667 4.2828 -1.4553 0.1064 0.7916 0.0002 0.1563 -89.5000 -41.5000 171.5000 -53.5000 0.0645 0.4025 0.0001 0.278511:00 -1.0315 -0.0329 3.1490 0.4146 0.3108 0.9740 0.0038 0.6815 -83.5000 9.5000 162.5000 33.5000 0.0858 0.8489 0.0003 0.500111:15 -1.3945 -0.6015 3.1572 -0.0884 0.1738 0.5522 0.0037 0.9302 -69.5000 -29.5000 131.5000 -20.5000 0.1562 0.5530 0.0048 0.680611:30 -1.8290 -1.0015 1.6693 -0.4508 0.0777 0.3249 0.1058 0.6555 -93.5000 -35.5000 101.5000 23.5000 0.0528 0.4746 0.0344 0.636911:45 -1.7385 -1.6695 2.6146 -0.5174 0.0927 0.1058 0.0140 0.6088 -66.5000 -58.5000 109.5000 10.5000 0.1755 0.2351 0.0216 0.833212:00 -1.8541 -1.5410 0.9634 -0.7575 0.0739 0.1342 0.3433 0.4549 -60.5000 -23.5000 60.5000 9.5000 0.2190 0.6369 0.2190 0.848912:15 -1.5956 -1.4971 2.6056 0.0087 0.1214 0.1452 0.0143 0.9931 -57.5000 -83.5000 99.5000 32.5000 0.2434 0.0858 0.0384 0.513112:30 -3.5732 -2.6855 1.3958 -1.5786 0.0013 0.0119 0.1734 0.1253 -175.5000 -144.5000 78.5000 -64.5000 0.0001 0.0016 0.1074 0.189212:45 -4.5365 -3.3768 1.8747 -1.3029 0.0001 0.0021 0.0709 0.2029 -196.5000 -163.5000 88.5000 -20.5000 0.0000 0.0002 0.0678 0.68061:00 -3.0299 -1.6754 3.0014 0.4892 0.0051 0.1046 0.0055 0.6284 -138.5000 -70.5000 126.5000 14.5000 0.0027 0.1501 0.0069 0.77111:15 -2.7094 -1.3617 3.2140 0.4355 0.0112 0.1838 0.0032 0.6664 -105.5000 -67.5000 139.5000 -32.5000 0.0274 0.1688 0.0025 0.51311:30 -1.5963 -1.8740 1.8813 -0.5331 0.1213 0.0710 0.0700 0.5980 -78.5000 -107.5000 86.5000 -41.5000 0.1074 0.0243 0.0746 0.40251:45 -0.0997 -0.1584 2.0729 1.4257 0.9213 0.8752 0.0472 0.1646 -6.5000 -15.5000 92.5000 85.5000 0.8963 0.7558 0.0555 0.07822:00 -0.9755 -0.5030 3.9186 -0.3462 0.3374 0.6188 0.0005 0.7317 -21.5000 23.5000 198.5000 6.5000 0.6659 0.6369 0.0000 0.89632:15 -1.7896 -0.3472 1.2583 0.7342 0.0840 0.7310 0.2183 0.4687 -108.5000 -2.5000 90.5000 9.5000 0.0229 0.9600 0.0614 0.84892:30 -5.4897 -1.3829 3.5979 -1.0100 0.0000 0.1773 0.0012 0.3209 -201.5000 -63.5000 184.5000 -20.5000 0.0000 0.1964 0.0000 0.68062:45 -3.2621 -0.8491 2.1831 0.1638 0.0028 0.4028 0.0373 0.8710 -142.5000 22.5000 124.5000 51.5000 0.0019 0.6513 0.0080 0.29723:00 -4.5349 -3.2196 -1.3688 -1.8350 0.0001 0.0032 0.1816 0.0768 -200.5000 -157.5000 -48.5000 -82.5000 0.0000 0.0005 0.3268 0.08993:15 -4.3703 -4.4862 -0.5708 -2.1022 0.0001 0.0001 0.5725 0.0443 -198.5000 -199.5000 -63.5000 -109.5000 0.0000 0.0000 0.1964 0.02163:30 -4.7704 -4.9447 -2.0212 -3.4718 0.0000 0.0000 0.0526 0.0016 -215.5000 -214.5000 -127.5000 -173.5000 0.0000 0.0000 0.0064 0.00013:45 -5.1950 -5.7195 -2.2677 -2.0381 0.0000 0.0000 0.0310 0.0508 -228.5000 -204.5000 -104.5000 -71.5000 0.0000 0.0000 0.0290 0.1442
T-Values Alphas Sign Rank Alphas
40

How One Trade Could Change the World: HFT and the Flash Crash of 2010 Senior Capstone Project for Sarah Perlman
0
50
100
150
200
250
300
350
400
9:30 9:45 10:00 10:15 10:30 10:45 11:00 11:15 11:30 11:45 12:00 12:15 12:30 12:45 1:00 1:15 1:30 1:45 2:00 2:15 2:30 2:45 3:00 3:15 3:30 3:45
Average Trade Size
4-Feb 3-May 6-May 19-May 11-Oct
41

How One Trade Could Change the World: HFT and the Flash Crash of 2010 Senior Capstone Project for Sarah Perlman
Appendix E- Average Volume
42
Period 4-Feb 3-May 19-May 11-Oct 4-Feb 3-May 19-May 11-Oct 4-Feb 3-May 19-May 11-Oct 4-Feb 3-May 19-May 11-Oct9:30 -1.3175 1.7925 -1.5539 5.1094 0.1980 0.0835 0.1311 0.0000 -94.5000 91.5000 -92.5000 221.5000 0.0501 0.0584 0.0555 0.00009:45 -1.9573 3.3796 -2.0511 4.1981 0.0600 0.0021 0.0494 0.0002 -96.5000 182.5000 -91.5000 176.5000 0.0451 0.0000 0.0584 0.0000
10:00 -1.9349 2.4989 -2.9721 3.0053 0.0628 0.0184 0.0059 0.0054 -125.5000 158.5000 -172.5000 182.5000 0.0074 0.0004 0.0001 0.000010:15 -1.2381 3.2571 -3.3906 3.0128 0.2256 0.0029 0.0020 0.0053 -92.5000 209.5000 -196.5000 219.5000 0.0555 0.0000 0.0000 0.000010:30 -1.0063 2.2301 -3.3337 2.7852 0.3226 0.0336 0.0024 0.0093 -123.5000 170.5000 -170.5000 223.5000 0.0086 0.0001 0.0001 0.000010:45 2.4292 2.9991 1.6830 3.3313 0.0216 0.0055 0.1031 0.0024 124.5000 202.5000 149.5000 232.5000 0.0080 0.0000 0.0010 0.000011:00 1.9743 3.2626 2.7227 3.3110 0.0579 0.0028 0.0108 0.0025 153.5000 229.5000 208.5000 231.5000 0.0007 0.0000 0.0000 0.000011:15 1.1901 3.0275 0.5360 3.2237 0.2437 0.0051 0.5960 0.0031 128.5000 229.5000 101.5000 215.5000 0.0060 0.0000 0.0344 0.000011:30 -1.5646 3.2619 -0.0705 3.8491 0.1285 0.0028 0.9443 0.0006 -87.5000 231.5000 27.5000 232.5000 0.0711 0.0000 0.5804 0.000011:45 3.7465 3.5919 0.6684 3.6464 0.0008 0.0012 0.5092 0.0010 191.5000 218.5000 35.5000 232.5000 0.0000 0.0000 0.4746 0.000012:00 2.0958 3.2530 2.1756 3.4945 0.0449 0.0029 0.0379 0.0015 170.5000 232.5000 152.5000 232.5000 0.0001 0.0000 0.0008 0.000012:15 0.4583 -1.1736 -2.1925 3.5055 0.6501 0.2501 0.0365 0.0015 75.5000 -87.5000 -134.5000 230.5000 0.1222 0.0711 0.0038 0.000012:30 -0.2575 -0.4502 -0.5225 3.9960 0.7986 0.6559 0.6053 0.0004 19.5000 27.5000 19.5000 222.5000 0.6954 0.5804 0.6954 0.000012:45 0.6221 1.6513 1.3123 2.9971 0.5387 0.1095 0.1997 0.0055 -29.5000 113.5000 71.5000 217.5000 0.5530 0.0168 0.1442 0.00001:00 2.3814 2.1435 -2.6082 2.9874 0.0240 0.0406 0.0142 0.0057 173.5000 153.5000 -150.5000 217.5000 0.0001 0.0007 0.0009 0.00001:15 2.6270 2.9087 2.0045 3.1596 0.0136 0.0069 0.0544 0.0037 219.5000 229.5000 151.5000 232.5000 0.0000 0.0000 0.0008 0.00001:30 2.4526 2.7516 2.3700 3.3618 0.0204 0.0101 0.0247 0.0022 172.5000 183.5000 150.5000 232.5000 0.0001 0.0000 0.0009 0.00001:45 1.4978 2.8973 1.9426 3.6659 0.145 0.0071 0.0618 0.0010 98.5000 231.5000 132.5000 232.5000 0.0405 0.0000 0.0044 0.00002:00 2.8404 2.8952 2.6677 2.9613 0.0082 0.0071 0.0124 0.0061 232.5000 232.5000 232.5000 232.5000 0.0000 0.0000 0.0000 0.00002:15 4.2905 4.3305 4.1664 4.1698 0.0002 0.0002 0.0003 0.0003 232.5000 232.5000 232.5000 232.5000 0.0000 0.0000 0.0000 0.00002:30 3.9638 4.0929 4.0802 4.0926 0.0004 0.0003 0.0003 0.0003 232.5000 232.5000 232.5000 232.5000 0.0000 0.0000 0.0000 0.00002:45 4.2820 4.3460 4.1954 4.3311 0.0002 0.0002 0.0002 0.0002 232.5000 232.5000 232.5000 232.5000 0.0000 0.0000 0.0000 0.00003:00 4.5907 4.4776 4.4243 4.5425 0.0001 0.0001 0.0001 0.0001 232.5000 232.5000 232.5000 232.5000 0.0000 0.0000 0.0000 0.00003:15 3.8178 4.0092 3.7037 3.9685 0.0007 0.0004 0.0009 0.0004 220.5000 232.5000 232.5000 232.5000 0.0000 0.0000 0.0000 0.00003:30 2.7376 4.0204 2.9054 3.7476 0.0105 0.0004 0.0070 0.0008 169.5000 232.5000 218.5000 232.5000 0.0001 0.0000 0.0000 0.00003:45 2.7536 4.0728 4.1022 4.3433 0.0101 0.0003 0.0003 0.0002 186.5000 232.5000 232.5000 232.5000 0.0000 0.0000 0.0000 0.0000
T-Test Values T-Test Alphas Sign Rank Test Values Sign Rank Test Alphas

How One Trade Could Change the World: HFT and the Flash Crash of 2010 Senior Capstone Project for Sarah Perlman
848954.9333
5159442.533
0
1000000
2000000
3000000
4000000
5000000
6000000
Average Volume
4-Feb 3-May 6-May 19-May 11-Oct
43

How One Trade Could Change the World: HFT and the Flash Crash of 2010 Senior Capstone Project for Sarah Perlman
Appendix F: Procter and Gamble
0
10
20
30
40
50
60
70
80
05000000
100000001500000020000000250000003000000035000000400000004500000050000000
The Procter and Gamble Company
Volume Adj Close (Source data Yahoo, 2012)
-0.25-0.2-0.15-0.1-0.0500.050.10.150.20.250.3
010203040506070
14:4
4:00
14:4
4:29
14:4
4:41
14:4
4:45
14:4
4:58
14:4
5:10
14:4
5:18
14:4
5:25
14:4
5:31
14:4
5:43
14:4
5:52
14:4
6:12
14:4
6:27
14:4
6:37
14:4
6:42
14:4
6:55
14:4
7:03
14:4
7:09
14:4
7:15
14:4
7:39
14:4
7:52
14:4
7:56
14:4
8:02
14:4
8:08
14:4
8:27
14:4
8:46
14:4
8:49
14:4
9:18
14:4
9:39
PG Price and Returns6 Minutes
Price Return
44

How One Trade Could Change the World: HFT and the Flash Crash of 2010 Senior Capstone Project for Sarah Perlman
-0.25-0.2-0.15-0.1-0.0500.050.10.150.20.250.3
0
10
20
30
40
50
60
70
0.61
5277
778
0.61
5381
944
0.61
5416
667
0.61
5486
111
0.61
5555
556
0.61
5613
426
0.61
5648
148
0.61
5706
019
0.61
5717
593
0.61
5740
741
0.61
5787
037
0.61
5844
907
0.61
5902
778
0.61
5949
074
0.61
5972
222
0.61
6006
944
0.61
6018
519
0.61
6064
815
0.61
6099
537
0.61
6111
111
0.61
6145
833
0.61
6215
278
0.61
6388
889
0.61
6435
185
0.61
6504
630.
6165
7407
40.
6165
8564
80.
6166
2037
0.61
6620
37
PG Price and Returns 2 Minutes
Price Return
-0.25-0.2-0.15-0.1-0.0500.050.10.150.20.250.3
0
10
20
30
40
50
60
14:4
6:30
14:4
6:31
14:4
6:33
14:4
6:35
14:4
6:37
14:4
6:38
14:4
6:38
14:4
6:40
14:4
6:40
14:4
6:41
14:4
6:43
14:4
6:45
14:4
6:48
14:4
6:49
14:4
6:53
14:4
6:54
14:4
6:56
14:4
6:58
14:4
6:59
14:4
7:00
14:4
7:01
14:4
7:03
14:4
7:03
14:4
7:04
14:4
7:05
14:4
7:07
14:4
7:08
14:4
7:10
14:4
7:11
14:4
7:12
14:4
7:12
14:4
7:13
14:4
7:14
14:4
7:15
14:4
7:18
14:4
7:21
14:4
7:29
PG Price and Returns 1 Minute
Price Return
45

How One Trade Could Change the World: HFT and the Flash Crash of 2010 Senior Capstone Project for Sarah Perlman
-0.25-0.2-0.15-0.1-0.0500.050.10.150.20.250.3
0
10
20
30
40
50
60
14:4
7:00
14:4
7:00
14:4
7:01
14:4
7:02
14:4
7:03
14:4
7:03
14:4
7:03
14:4
7:04
14:4
7:04
14:4
7:05
14:4
7:06
14:4
7:07
14:4
7:08
14:4
7:08
14:4
7:09
14:4
7:10
14:4
7:11
14:4
7:11
14:4
7:12
14:4
7:12
14:4
7:12
14:4
7:12
14:4
7:13
14:4
7:14
14:4
7:14
14:4
7:15
14:4
7:15
14:4
7:16
14:4
7:19
14:4
7:21
14:4
7:24
14:4
7:29
PG Price and Returns 30 Seconds
Price Return
46

How One Trade Could Change the World: HFT and the Flash Crash of 2010 Senior Capstone Project for Sarah Perlman
Time Number Of Trades Average Return Time Number Of Trades Average Return Time Number Of Trades Average Return14:46:30 18 -0.000378495 14:46:59 59 -6.65755E-05 14:47:28 5 -0.00480897314:46:31 40 -0.000105328 14:47:00 30 4.64634E-05 14:47:29 28 0.00172905114:46:32 16 -0.000435619 14:47:01 25 0.000830214 14:47:30 3 -6.02417E-0514:46:33 15 -0.000470083 14:47:02 25 0.000652801 14:47:31 1 014:46:34 21 -0.000499258 14:47:03 54 -0.000936687 14:47:32 5 5.4493E-0514:46:35 16 -0.000246804 14:47:04 64 7.52915E-05 14:47:33 3 0.00509241614:46:36 16 -0.000674996 14:47:05 16 -0.000774406 14:47:35 15 -0.00128484214:46:37 57 0.000980666 14:47:06 9 -0.001136135 14:47:36 24 2.81353E-0514:46:38 66 -0.000943121 14:47:07 26 -9.30454E-05 14:47:38 7 5.71429E-0914:46:39 14 -0.000336694 14:47:08 42 0.000341023 14:47:39 47 0.00085399414:46:40 63 -4.60845E-05 14:47:09 24 -0.000155957 14:47:40 23 2.79996E-0514:46:41 21 -7.04308E-05 14:47:10 32 0.00188222 14:47:41 12 3.01633E-0714:46:42 28 0.001382751 14:47:11 44 -0.00036335 14:47:42 29 0.00098430414:46:43 21 -0.00201418 14:47:12 85 0.000281477 14:47:45 18 0.00042770814:46:44 15 -0.000655722 14:47:13 30 0.000842961 14:47:46 47 0.00087520414:46:45 19 -0.000234612 14:47:14 33 0.001514371 14:47:47 19 -0.00119583514:46:46 3 -0.000407083 14:47:15 52 0.002582087 14:47:48 6 0.00407705714:46:47 12 0.007068272 14:47:16 7 0.000886765 14:47:49 7 -0.00210079814:46:48 32 0.000473706 14:47:17 4 -0.027036553 14:47:50 11 0.00107006514:46:49 35 -0.000117837 14:47:18 10 0.028181757 14:47:51 6 0.00184952614:46:50 12 0.000175763 14:47:19 6 0.007236002 14:47:52 28 -0.00150371614:46:51 1 -0.047238095 14:47:20 13 -0.00193092 14:47:53 77 0.00072517514:46:52 4 0.01248277 14:47:21 14 0.006964939 14:47:54 11 0.00036092714:46:53 43 -0.000536132 14:47:22 3 -0.002446598 14:47:55 58 0.00018281114:46:54 18 -0.00125848 14:47:23 9 -0.003060361 14:47:56 123 -8.72158E-0614:46:55 29 -0.000643436 14:47:24 4 0.000553794 14:47:57 22 -0.00048072814:46:56 19 -0.00045211 14:47:25 3 0.001762217 14:47:58 36 -0.00049504714:46:57 21 -0.000198568 14:47:26 1 0.022918419 14:47:59 1 014:46:58 23 0.000051473 14:47:27 1 0.008633094 Grand Total 2566 0.000233638
1 Minute 30 Seconds of PG Trading
** Outlined cell indicates 10 highest entries
47
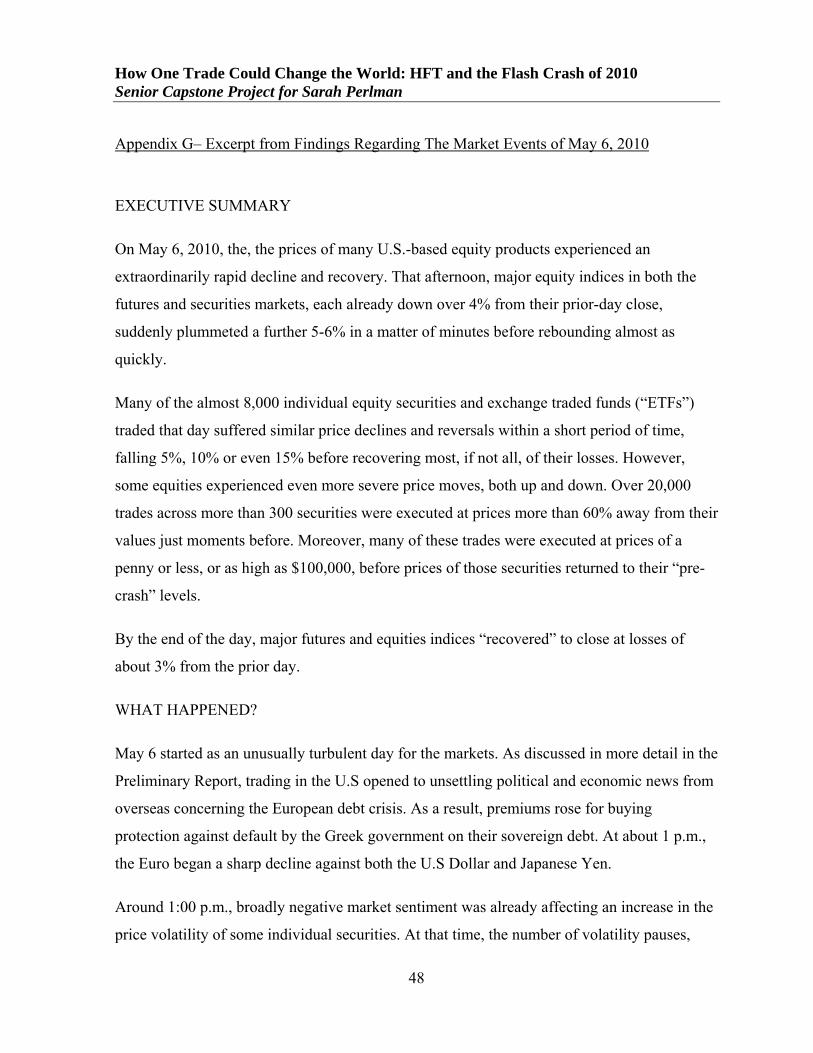
How One Trade Could Change the World: HFT and the Flash Crash of 2010 Senior Capstone Project for Sarah Perlman
48
Appendix G– Excerpt from Findings Regarding The Market Events of May 6, 2010
EXECUTIVE SUMMARY
On May 6, 2010, the, the prices of many U.S.-based equity products experienced an
extraordinarily rapid decline and recovery. That afternoon, major equity indices in both the
futures and securities markets, each already down over 4% from their prior-day close,
suddenly plummeted a further 5-6% in a matter of minutes before rebounding almost as
quickly.
Many of the almost 8,000 individual equity securities and exchange traded funds (“ETFs”)
traded that day suffered similar price declines and reversals within a short period of time,
falling 5%, 10% or even 15% before recovering most, if not all, of their losses. However,
some equities experienced even more severe price moves, both up and down. Over 20,000
trades across more than 300 securities were executed at prices more than 60% away from their
values just moments before. Moreover, many of these trades were executed at prices of a
penny or less, or as high as $100,000, before prices of those securities returned to their “pre-
crash” levels.
By the end of the day, major futures and equities indices “recovered” to close at losses of
about 3% from the prior day.
WHAT HAPPENED?
May 6 started as an unusually turbulent day for the markets. As discussed in more detail in the
Preliminary Report, trading in the U.S opened to unsettling political and economic news from
overseas concerning the European debt crisis. As a result, premiums rose for buying
protection against default by the Greek government on their sovereign debt. At about 1 p.m.,
the Euro began a sharp decline against both the U.S Dollar and Japanese Yen.
Around 1:00 p.m., broadly negative market sentiment was already affecting an increase in the
price volatility of some individual securities. At that time, the number of volatility pauses,

How One Trade Could Change the World: HFT and the Flash Crash of 2010 Senior Capstone Project for Sarah Perlman
49
also known as Liquidity Replenishment Points (“LRPs”), triggered on the New York Stock
Exchange (“NYSE”) in individual equities listed and traded on that exchange began to
substantially increase above average levels.
By 2:30 p.m., the S&P 500 volatility index (“VIX”) was up 22.5 percent from the opening
level, yields of ten-year Treasuries fell as investors engaged in a “flight to quality,” and
selling pressure had pushed the Dow Jones Industrial Average (“DJIA”) down about 2.5%.
Furthermore, buy-side liquidity6 in the E-Mini S&P 500 futures contracts (the “E-Mini”), as
well as the S&P 500 SPDR exchange traded fund (“SPY”), the two most active stock index
instruments traded in electronic futures and equity markets, had fallen from the early-morning
level of nearly $6 billion dollars to $2.65 billion (representing a 55% decline) for the E-Mini
and from the early-morning level of about $275 million to $220 million (a 20% decline) for
SPY7 Some individual stocks also suffered from a decline their liquidity.
At 2:32 p.m., against this backdrop of unusually high volatility and thinning liquidity, a large
fundamental trader8 (a mutual fund complex) initiated a sell program to sell a total of 75,000
E-Mini contracts (valued at approximately $4.1 billion) as a hedge to an existing equity
position.
Generally, a customer has a number of alternatives as to how to execute a large trade. First, a
customer may choose to engage an intermediary, who would, in turn, execute a block trade or
manage the position. Second, a customer may choose to manually enter orders into the
market. Third, a customer can execute a trade via an automated execution algorithm, which
can meet the customer’s needs by taking price, time or volume into consideration. Effectively,
6We use the term “liquidity” throughout this report generally to refer to buy-side and sell-side market depth, which is comprised of resting orders that market participants place to express their willingness to buy or sell at prices equal to, or outside of (either below or above), current market levels. Note that for SPY and other equity securities discussed in this report, unless otherwise stated, market depth calculations include only resting quotes within 500 basis points of the mid-quote. Additional liquidity would have been available beyond 500 basis points. See Section 1 for further details on how market depth and near-inside market depth are defined and calculated for the E-Mini, SPY, and other equity securities. 7However, these erosions did not affect “near-inside” liquidity – resting orders within about 0.1% of the last transaction price or mid-market quote. 8We define fundamental sellers and fundamental buyers as market participants who are trading to accumulate or reduce a net long or short position. Reasons for fundamental buying and selling include gaining long-term exposure to a market as well as hedging already-existing exposures in related markets.

How One Trade Could Change the World: HFT and the Flash Crash of 2010 Senior Capstone Project for Sarah Perlman
50
a customer must make a choice as to how much human judgment is involved while executing
a trade.
This large fundamental trader chose to execute this sell program via an automated
execution algorithm (“Sell Algorithm”) that was programmed to feed orders into the June
2010 E-Mini market to target an execution rate set to 9% of the trading volume calculated
over the previous minute, but without regard to price or time.
The execution of this sell program resulted in the largest net change in daily position
of any trader in the E-Mini since the beginning of the year (from January 1, 2010 through
May 6, 2010). Only two single-day sell programs of equal or larger size – one of which was
by the same large fundamental trader – were executed in the E-Mini in the 12 months prior to
May 6. When executing the previous sell program, this large fundamental trader utilized a
combination of manual trading entered over the course of a day and several automated
execution algorithms which took into account price, time, and volume. On that occasion it
took more than 5 hours for this large trader to execute the first 75,000 contracts of a large sell
program.9
However, on May 6, when markets were already under stress, the Sell Algorithm
chosen by the large trader to only target trading volume, and neither price nor time, executed
the sell program extremely rapidly in just 20 minutes. 10
This sell pressure was initially absorbed by:
• high frequency traders (“HFTs”) and other intermediaries11 in the futures market;
• fundamental buyers in the futures market; and
9Subsequently, the large fundamental trader closed, in a single day, this short position. 10At a later date, the large fundamental trader executed trades over the course of more than 6 hours to offset the net short position accumulated on May 6. 11See Section 1 for the context in which high-frequency trading and market intermediaries are defined for the E-Mini.

How One Trade Could Change the World: HFT and the Flash Crash of 2010 Senior Capstone Project for Sarah Perlman
51
• cross-market arbitrageurs12 who transferred this sell pressure to the equities markets
by opportunistically buying E-Mini contracts and simultaneously selling products like
SPY, or selling individual equities in the S&P 500 Index.
HFTs and intermediaries were the likely buyers of the initial batch of orders submitted
by the Sell Algorithm, and, as a result, these buyers built up temporary long positions.
Specifically, HFTs accumulated a net long position of about 3,300 contracts. However,
between 2:41 p.m. and 2:44 p.m., HFTs aggressively sold about 2,000 E-Mini contracts in
order to reduce their temporary long positions. At the same time, HFTs traded nearly 140,000
E-Mini contracts or over 33% of the total trading volume. This is consistent with the HFTs’
typical practice of trading a very large number of contracts, but not accumulating an aggregate
inventory beyond three to four thousand contracts in either direction.
The Sell Algorithm used by the large trader responded to the increased volume by
increasing the rate at which it was feeding the orders into the market, even though orders that
it already sent to the market were arguably not yet fully absorbed by fundamental buyers or
cross-market arbitrageurs. In fact, especially in times of significant volatility, high trading
volume is not necessarily a reliable indicator of market liquidity.
What happened next is best described in terms of two liquidity crises – one at the
broad index level in the E-Mini, the other with respect to individual stocks.
LIQUIDITY CRISIS IN THE E-MINI
The combined selling pressure from the Sell Algorithm, HFTs and other traders drove
the price of the E-Mini down approximately 3% in just four minutes from the beginning of
2:41 p.m. through the end of 2:44 p.m. During this same time cross-market arbitrageurs who
did buy the E-Mini, simultaneously sold equivalent amounts in the equities markets, driving
the price of SPY also down approximately 3%.
Still lacking sufficient demand from fundamental buyers or cross-market arbitrageurs,
HFTs began to quickly buy and then resell contracts to each other – generating a “hot-potato”
129 Cross-market arbitrageurs are opportunistic traders who capitalize on temporary, though often small, price differences between related products by purchasing the cheaper product and selling the more expensive product.

How One Trade Could Change the World: HFT and the Flash Crash of 2010 Senior Capstone Project for Sarah Perlman
52
volume effect as the same positions were rapidly passed back and forth. Between 2:45:13 and
2:45:27, HFTs traded over 27,000 contracts, which accounted for about 49 percent of the total
trading volume, while buying only about 200 additional contracts net.
At this time, buy-side market depth in the E-Mini fell to about $58 million, less than
1% of its depth from that morning’s level. As liquidity vanished, the price of the E-Mini
dropped by an additional 1.7% in just these 15 seconds, to reach its intraday low of 1056. This
sudden decline in both price and liquidity may be symptomatic of the notion that prices were
moving so fast, fundamental buyers and cross-market arbitrageurs were either unable or
unwilling to supply enough buy-side liquidity.
In the four-and-one-half minutes from 2:41 p.m. through 2:45:27 p.m., prices of the E-
Mini had fallen by more than 5% and prices of SPY suffered a decline of over 6%. According
to interviews with cross-market trading firms, at this time they were purchasing the E-Mini
and selling either SPY, baskets of individual securities, or other index products.
By 2:45:28 there were less than 1,050 contracts of buy-side resting orders in the E-
Mini, representing less than 1% of buy-side market depth observed at the beginning of the
day. At the same time, buy-side resting orders in SPY fell to about 600,000 shares (equivalent
to 1,200 E-Mini contracts) representing approximately 25% of its depth at the beginning of
the day.
Between 2:32 p.m. and 2:45 p.m., as prices of the E-Mini rapidly declined, the Sell
Algorithm sold about 35,000 E-Mini contracts (valued at approximately $1.9 billion) of the
75,000 intended. During the same time, all fundamental sellers combined sold more than
80,000 contracts net, while all fundamental buyers bought only about 50,000 contracts net, for
a net fundamental imbalance of 30,000 contracts. This level of net selling by fundamental
sellers is about 15 times larger compared to the same 13-minute interval during the previous
three days, while this level of net buying by the fundamental buyers is about 10 times larger
compared to the same time period during the previous three days.
At 2:45:28 p.m., trading on the E-Mini was paused for five seconds when the Chicago
Mercantile Exchange (“CME”) Stop Logic Functionality was triggered in order to prevent a

How One Trade Could Change the World: HFT and the Flash Crash of 2010 Senior Capstone Project for Sarah Perlman
53
cascade of further price declines. In that short period of time, sell-side pressure in the E-Mini
was partly alleviated and buy-side interest increased. When trading resumed at 2:45:33 p.m.,
prices stabilized and shortly thereafter, the E-Mini began to recover, followed by the SPY.
The Sell Algorithm continued to execute the sell program until about 2:51 p.m. as the
prices were rapidly rising in both the E-Mini and SPY.
LIQUIDITY CRISIS WITH RESPECT TO INDIVIDUAL STOCKS
The second liquidity crisis occurred in the equities markets at about 2:45 p.m. Based
on interviews with a variety of large market participants, automated trading systems used by
many liquidity providers temporarily paused in reaction to the sudden price declines observed
during the first liquidity crisis. These built-in pauses are designed to prevent automated
systems from trading when prices move beyond pre-defined thresholds in order to allow
traders and risk managers to fully assess market conditions before trading is resumed.
After their trading systems were automatically paused, individual market participants
had to assess the risks associated with continuing their trading. Participants reported that these
assessments included the following factors: whether observed severe price moves could be an
artifact of erroneous data; the impact of such moves on risk and position limits; impacts on
intraday profit and loss (“P&L”); the potential for trades to be broken, leaving their firms
inadvertently long or short on one side of the market; and the ability of their systems to handle
the very high volume of trades and orders they were processing that day. In addition, a
number of participants reported that because prices simultaneously fell across many types of
securities, they feared the occurrence of a cataclysmic event of which they were not yet
aware, and that their strategies were not designed to handle.13
1310 Some additional factors that may have played a role in the events of May 6 and that are discussed more fully in Sections 2 and 3 include: the use of LRPs by the NYSE, in which trading is effectively banded on the NYSE in NYSE-listed stocks exhibiting rapid price moves; declarations of self-help by The Nasdaq Stock Market, LLC (“Nasdaq”) against NYSE Arca, Inc. (“NYSE Arca”) under which Nasdaq temporarily stopped routing orders to NYSE Arca; and delays in NYSE quote and trade data disseminated over the Consolidated Quotation System (“CQS”) and Consolidated Tape System (“CTS”) data feeds. Our findings indicate that none of these factors played a dominant role on May 6, but nonetheless they are important considerations in forming a complete picture of, and response to, that afternoon.

How One Trade Could Change the World: HFT and the Flash Crash of 2010 Senior Capstone Project for Sarah Perlman
54
Based on their respective individual risk assessments, some market makers and other
liquidity providers widened their quote spreads, others reduced offered liquidity, and a
significant number withdrew completely from the markets. Some fell back to manual trading
but had to limit their focus to only a subset of securities as they were not able to keep up with
the nearly ten-fold increase in volume that occurred as prices in many securities rapidly
declined.
HFTs in the equity markets, who normally both provide and take liquidity as part of
their strategies, traded proportionally more as volume increased, and overall were net sellers
in the rapidly declining broad market along with most other participants. Some of these firms
continued to trade as the broad indices began to recover and individual securities started to
experience severe price dislocations, whereas others reduced or halted trading completely.
Many over-the-counter (“OTC”) market makers who would otherwise internally
execute as principal a significant fraction of the buy and sell orders they receive from retail
customers (i.e., “internalizers”) began routing most, if not all, of these orders directly to the
public exchanges where they competed with other orders for immediately available, but
dwindling, liquidity.
Even though after 2:45 p.m. prices in the E-Mini and SPY were recovering from their
severe declines, sell orders placed for some individual securities and ETFs (including many
retail stop-loss orders, triggered by declines in prices of those securities) found reduced
buying interest, which led to further price declines in those securities.
Between 2:40 p.m. and 3:00 p.m., approximately 2 billion shares traded with a total
volume exceeding $56 billion. Over 98% of all shares were executed at prices within 10% of
their 2:40 p.m. value. However, as liquidity completely evaporated in a number of individual
securities and ETFs,14 participants instructed to sell (or buy) at the market found no
immediately available buy interest (or sell interest) resulting in trades being executed at
1411 Detailed reconstructions of order books for individual securities are presented at the end of this report, exploring the relationship between changes in immediately available liquidity and changes in stock prices. This rich data set highlights both the broad theme of liquidity withdrawal on May 6, as well as some of the nuanced differences between securities that may have dictated why some stocks fell only 10% while others collapsed to a penny or less.

How One Trade Could Change the World: HFT and the Flash Crash of 2010 Senior Capstone Project for Sarah Perlman
55
irrational prices as low as one penny or as high as $100,000. These trades occurred as a result
of so-called stub quotes, which are quotes generated by market makers (or the exchanges on
their behalf) at levels far away from the current market in order to fulfill continuous two-sided
quoting obligations even when a market maker has withdrawn from active trading.
The severe dislocations observed in many securities were fleeting. As market
participants had time to react and verify the integrity of their data and systems, buy-side and
sell-side interest returned and an orderly price discovery process began to function. By
approximately 3:00 p.m., most securities had reverted back to trading at prices reflecting true
consensus values. Nevertheless, during the 20 minute period between 2:40 p.m. and 3:00
p.m., over 20,000 trades (many based on retail-customer orders) across more than 300
separate securities, including many ETFs,15 were executed at prices 60% or more away from
their 2:40 p.m. prices. After the market closed, the exchanges and FINRA met and jointly
agreed to cancel (or break) all such trades under their respective “clearly erroneous” trade
rules. (U.S. Commodity Futures Trading Commisision and U.S. Securities and Exchange
Commission, 2010)
15Section 2 discusses the disproportionate impact the market disruption of May 6 had on ETFs.

How One Trade Could Change The World Senior Capstone Project for Sarah Perlman
56
Appendix H- Components of the Dow Jones Industrial Average Ticker Company MMM 3M Co.
T AT&T
AA Alcoa Inc. AXP American Express Co. BAC Bank of America BA Boeing Co.
CAT Caterpillar Inc. CVX Chevron
CSCO Cisco Systems Inc. KO Coca-Cola Co.
DD E.I. DuPont de Nemours & Co. XOM Exxon Mobil GE General Electric Co.
HPQ Hewlett-Packard
HD Home Depot Inc. INTC Intel Corp.
IBM International Business Machines Corp. JPM JPMorgan Chase
JNJ Johnson & Johnson KFT Kraft Foods Inc. Cl A MCD McDonald's Corp. MRK Merck & Co. Inc. MSFT Microsoft Corp. PFE Pfizer Inc. PG Procter & Gamble Co.
TRV Travelers Cos. UTX United Technologies Corp. VZ Verizon Communications
WMT Wal-Mart Stores Inc. DIS Walt Disney Co.
(Dow Jones, 2012)

How One Trade Could Change The World Senior Capstone Project for Sarah Perlman
57
REFERENCES (2010). Brett mock, a senior sales trader at btig talks about.. Traders Magazine, Retrieved
from http://www.tradersmagazine.com/issues/23_317/high-frequency-trading-flash-crash-market-making-106827-1.html
Anderson , D. (2011). Statistics for business and econmonics. (11 ed.). Cengage Learning.
Armstrong, J. (2011). Up for grabs. Traders Magazine, Retrieved from http://www.tradersmagazine.com/issues/24_327/hfts-brokers-naked-access-108063-1.html
Becker,L. (2011). How France can regulate HFT. International Financial Law Review, 30(5), 49.
Barnes, S. (2010). Regulating High-Frequency Trading: An Examination of U.S. Equity Market Structure In Light of the May 6.2010 Flash Crash [Kindle Fire Version]. Retrieved from Amazon.com
Benoit, D. (2012, March 23). Bats initial public tease: Nine seconds of free fall. Retrieved from http://blogs.wsj.com/deals/2012/03/23/bats-initial-public-tease-nine-seconds-of-free-fall/?KEYWORDS=bats ipo
Benoit, D. (2012, March 25). Bats goes full court press to try and explain friday. Retrieved from http://blogs.wsj.com/deals/2012/03/25/bats-goes-full-court-press-to-try-and-explain-friday/?KEYWORDS=bats ipo
Berkeley,A., Katz,G., O’Brien,W. & Sarkar,A., R.Schwartz (Chair), “What Makes an Exchange a Unique Institution”. Baruch College, The Economic Function of a Stock Exchange. New York, NY. 4 October, 2011.
Berman, D. (2012, January 4). So, what's your algorithm? . Wall Street Journal. Retrieved from http://online.wsj.com/article/SB10001424052970203462304577138961342097348.html
Betancourt, L., VanDenburgh, W. M., & Harmelink, P. J. (2011). Understanding the 'Flash Crash.'. CPA Journal, 81(1), 40-45.
Caplan, K., Cohen, R., Lenz, J., & Pullano, C. (2009.). Dark Pools of Liquidity. Alternatives Newsletter. Retrieved April 22, 2012, from www.pwc.com/us/en/alternative-investment/assets/NY-10-0105-PwC-alt-Caplan.pdf
Carlson, M. (2007). Retrieved from Finance and Economics Discussion Series Divisions website: http://www.federalreserve.gov/Pubs/feds/2007/200713/200713pap.pdf

How One Trade Could Change The World Senior Capstone Project for Sarah Perlman
58
Chapman, P. (2011). Defending the turf. Traders Magazine, Retrieved from http://www.tradersmagazine.com/news/sellside-defends-buyside-hft-107526-1.html
Chapman, P. (2010). Hfts shun options marts. Traders Magazine, Retrieved from http://www.tradersmagazine.com/issues/23_316/hft-options-markets-exchanges-spdr-106689-1.html
CME Group Index Services LLC. (2010, 12 31). The History of the Dow. Retrieved 12 4, 2011, from Dow Jones Industrial Average: http://www.djindexes.com/mdsidx/downloads/brochure_info/Dow_Jones_Industrial_Average_Brochure.pdf
CME Group Index Services LLC. (2011). DJIA Historical Timeline. Retrieved December 4, 2011, from Dow Jones Industrial Average Interactive Learning Center: http://www.djaverages.com/
CME Group Index Services LLC. (2011, November 30). Fact Sheet. Retrieved December 4, 2011, from Dow Jones Industrial Averages: http://www.djindexes.com/mdsidx/downloads/fact_info/Dow_Jones_Industrial_Average_Fact_Sheet.pdf
D'Antonia, J. (2012, March). Cat's long and winding road. Traders Magazine, Retrieved from http://www.tradersmagazine.com/issues/25_334/consolidated-audit-trail-data-109845-1.html
Dark pools definition (n.d). Financial Times Lexicon, Financial Times, Retrieved April 22, 2012, from http://lexicon.ft.com/Term?term=dark-pools
Dow Jones. (2012). Retrieved from http://www.djaverages.com/?go=industrial-components
Flash trading definition (n.d). Financial Times Lexicon. Financial Times. Retrieved April 22, 2012, from http://lexicon.ft.com/Term?term=flash-trading
Gross, D. (2007, June). The Truth About Investment Bubbles. Inc. pp. 71-73.
Haldane, A. (2011). The race to zero - Speech by Andrew Haldane, 8 July 2011. Bank of England . Retrieved January 14, 2012, from http://www.bankofengland.co.uk/publications/news/2011/068.htm
Intercontinentalexchange announces first ear results of high frequency trading policy; innovative method proves highly effective. (2012, February 29). Retrieved from http://ir.theice.com/releasedetail.cfm?ReleaseID=652686
Keim, B. (2012, February 16). Nanosecond trading could make markets go haywire. Wired , Retrieved from http://www.wired.com/wiredscience/2012/02/high-speed-trading/

How One Trade Could Change The World Senior Capstone Project for Sarah Perlman
59
Mehta, N., Thomasson, L., Barrett, P. M., Kearns, J., Kisling, W., & Coy, P. (2010). The Machines That Ate The Market. Bloomberg Businessweek, (4180), 48-55.
One big, bad trade. (2010, October 1). The Economist, Retrieved from http://www.economist.com/blogs/newsbook/2010/10/what_caused_flash_crash
Patterson, S. (2010, May 18). How the ‘Flash Crash’ Echoed Black Monday---May 6 Selloff Had Parallels to 1987; Electronic Trading Magnified Selling Pressure This Time. Wall Street Journal (Eastern Edition), p C.1. Retrieved December 4, 2011, from ABI/INFORM Global. (Document ID: 2035448591).
Patterson, S. (2010, June 30). Fast Traders Face off With Big Investors over ‘Gaming’. Wall Street Journal (Eastern Edition), p. C.1. Retrieved December 4, 2011, from ABI/INFORM Global. (Document ID: 2069277411).
Perez, E. (2012, March 08). Edgar perez, author, the speed traders: An insider's look at the new high-frequency trading phenomenon that is transforming the investing world, at high frequency trading panel, seventh annual mit sloan investment management conference. Retrieved from http://prurgent.com/2012-03-08/pressrelease229455.htm
Peterson, K. (2010, September 10). These Traders Play Only the Open and Close - WSJ.com. Wall Street Journal. Retrieved April 22, 2012, from http://online.wsj.com/article/SB100014240
Philips, M. (2012, March 19). Regulators are slow to act on speed traders. Bloomberg Businessweek, Retrieved from http://www.businessweek.com/articles/2012-03-19/regulators-are-slow-to-act-on-speed-traders
Quote stuffing definition . (n.d.). Financial Times Lexicon . Retrieved April 22, 2012, from http://lexicon.ft.com/Term?term=quote-stuffing
Ramage, J. (2010). Making sense of the complex. Traders Magazine, Retrieved from http://www.tradersmagazine.com/issues/23_315/making-sense-of-the-complex-106428-1.html
Rehfeld, B. (2010). Flash crash: A day to remember. Traders Magazine, Retrieved from http://www.tradersmagazine.com/issues/23_310/flash-crash-may-6-105905-1.html
Rose, C. (2011). The Flash Crash Of May 2010: Accident Or Market Manipulation?. Journal Of Business & Economics Research, 9(1), 85-90.
Russolillo, S. (2011, September 12). Big Investors Cite Concern Over High-Frequency Trading. Wall Street Journal (Online). Retrieved December 4, 2011, from ABI/INFORM Global. (Document ID: 2451651181).

How One Trade Could Change The World Senior Capstone Project for Sarah Perlman
60
Russolillo, S. (2012, March 23). Apple shares go batty, but stock trading back to normal. Retrieved from http://blogs.wsj.com/digits/2012/03/23/apple-shares-go-batty-but-stock-trading-back-to-normal/?KEYWORDS=apple trade halt
Sassoon, A. B. (2011). Algo Trading in the Liquidity Mirage. Futures, 38-40.
Scotti, M. (2010). In a flash. Traders Magazine, Retrieved from http://www.tradersmagazine.com/issues/23_317/flash-crash-may-sec-brokerage-volumes-hft-106817-1.html
Securities and Exchange Commission. (2012). Self-Regulatory Organizations; EDGA Exchange, Inc.; Notice of Filing and Immediate Effectiveness of Proposed Rule Change to Amend EDGA Rule 11.14 to extend the operation of the single stock circuit breaker pilot program until July 31, 2012. Retrieved from Securities and Exchange Commission website: http://www.sec.gov/rules/sro/edga/2012/34-66227.pdf
Securities and exchange commission. (2011, April 05). SEC announces filing of limit up-limit down proposal to address extraordinary market volatility. Retrieved from http://www.sec.gov/news/press/2011/2011-84.htm
Sec adopts large trader reporting regime. (2011, July 26). Retrieved from http://www.sec.gov/news/press/2011/2011-154.htm
Sec proposes consolidated audit trail system to better track market trades. (26, May 2010). Retrieved from http://www.sec.gov/news/press/2010/2010-86.htm
Seitz,J.,&Kloos, E. (2010). Don’t overreact. International Financial Law Review, 29(10),39.
SIFMA, (2011). Impact of high frequency trading and considerations for regulatory change. Retrieved from SIFMA website: http://www.sifma.org/issues/item.aspx?id=8589936694
Simon, Matthew. "Equity Volumes? Expect the Worst, Hope for the Best." TABB Forum. TABB Group, 26 Jan. 2011. Web. 1 Apr. 2012. <http://tabbforum.com/opinions/equity-volumes-expect-the-worst-hope-for-the-best>.
Sparrow, C. (2011, November 22). Why its hard to know the impact of high frequency trading [Online forum comment]. Retrieved from http://www.tabbforum.com/channels/regulatory/opinions/why-it's-hard-to-know-the-impact-of-high-frequency-trading
Strasburg, J. (2011, August 16). A Wild Ride to Profits. Wall Street Journal - Eastern Edition. pp. C1-C2.
Steinert-Threlkeld, T. (2011, May 6). Flash crash flash: High frequency trading will get thoroughly examined, schapiro says. Retrieved from http://www.securitiestechnologymonitor.com/news/-27831-1.html?pg=1

How One Trade Could Change The World Senior Capstone Project for Sarah Perlman
61
Sussman, Adam. "What Isn't In the Flash Crash Report." TABB Forum. TABB Group, 01 Oct. 2010. Web. 01 Apr. 2012. <http://tabbforum.com/opinions/what-isn%27t-in-the-flash-crash-report>.
"The Equity Market Is Now Controlled By The Machines." Interview by Chris Martenson. Chris Martenson. 4 Feb. 2011. Web. 1 Apr. 2012. <http://www.chrismartenson.com/page/transcript-joe-saluzzi-high-frequency-trading-equity-market-now-controlled-machines>.
The Flash Crash Aftermath: Responses to the Trading Events of May 6, 2010. (2010). Insights: The Corporate & Securities Law Advisor, 24(7), 2-10.
U.S. Commodity Futures Trading Commisision and U.S. Securities and Exchange Commission. (2010). Findings Regarding The Market Events of May 6, 2010.
US Securities and Exchange Commission (2010, November 3). Sec adopts new rule preventing unfiltered market access. Retrieved from http://www.sec.gov/news/press/2010/2010-210.htm
U.S. Senate, Committee on Banking, Housing and Urban Affairs. (2010). Examining the causes and lessons of the may 6th market plunge. Retrieved from US Government Printing Office website: http://www.gpo.gov/fdsys/pkg/CHRG-111shrg62513/pdf/CHRG-111shrg62513.pdf
Urstadt, B. (2010). Trading Shares in Milliseconds. Technology Review, 113(1), 44-49.
Watson, T. (2011). Rise of the MACHINES. Canadian Business, 84(9), 56-59.
Watson, T. (2011, September 27). Journalists vs. high-frequency traders. Canadian Business. CanadianBusiness.com. Retrieved January 14, 2012, from http://www.canadianbusiness.com/blog/business_briefings/47825--journalists-vs-high-frequency-traders
What is e-mini. (2011). Retrieved from http://www.forexbite.com/trading-courses/forexdictionary-E-mini-681
Yahoo. (2011). Historical Prices. Retrieved December 4, 2011, from Yahoo Finance: http://finance.yahoo.com/q/hp?s=^DJI+Historical+Prices
Yahoo. (2012). Historical Prices. Retrieved April 9, 2012, from Yahoo Finance: http://finance.yahoo.com/q?s=PG&ql=1
Yu, J. (2011, August). A glass half full: contrarian trading in the flash crash. Retrieved from http://www.rhsmith.umd.edu/finance/pdfs_docs/SeminarFall2011/YuJialin.pdf
Zwick, S. (2011). High-Frequency Trading: Good, bad or just different? Futures, 54-58.