How health metrics work: health metrics relevant to...
30
How health metrics work: health metrics relevant to estimating the impact of black carbon interventions Jill Baumgartner Dept of Epidemiology, Biostatistics and Occupational Health Institute for Health and Social Policy McGill University, Montreal CCAC Expert Workshop on Metrics for Evaluating and Reporting on BC and Methane Interventions March 16, 2017 Empirical evidence and models from household air pollution in Asia
Transcript of How health metrics work: health metrics relevant to...

How health metrics work: health metrics relevant to estimating the impact of black
carbon interventions
Jill Baumgartner
Dept of Epidemiology, Biostatistics and Occupational Health
Institute for Health and Social Policy
McGill University, Montreal
CCAC Expert Workshop on Metrics for Evaluating and Reporting on BC and Methane Interventions
March 16, 2017
Empirical evidence and models from household air pollution in Asia
Bonjour et al, Environ Health Perspect, 2013
Population (%) cooking with biomass and coal in 2012
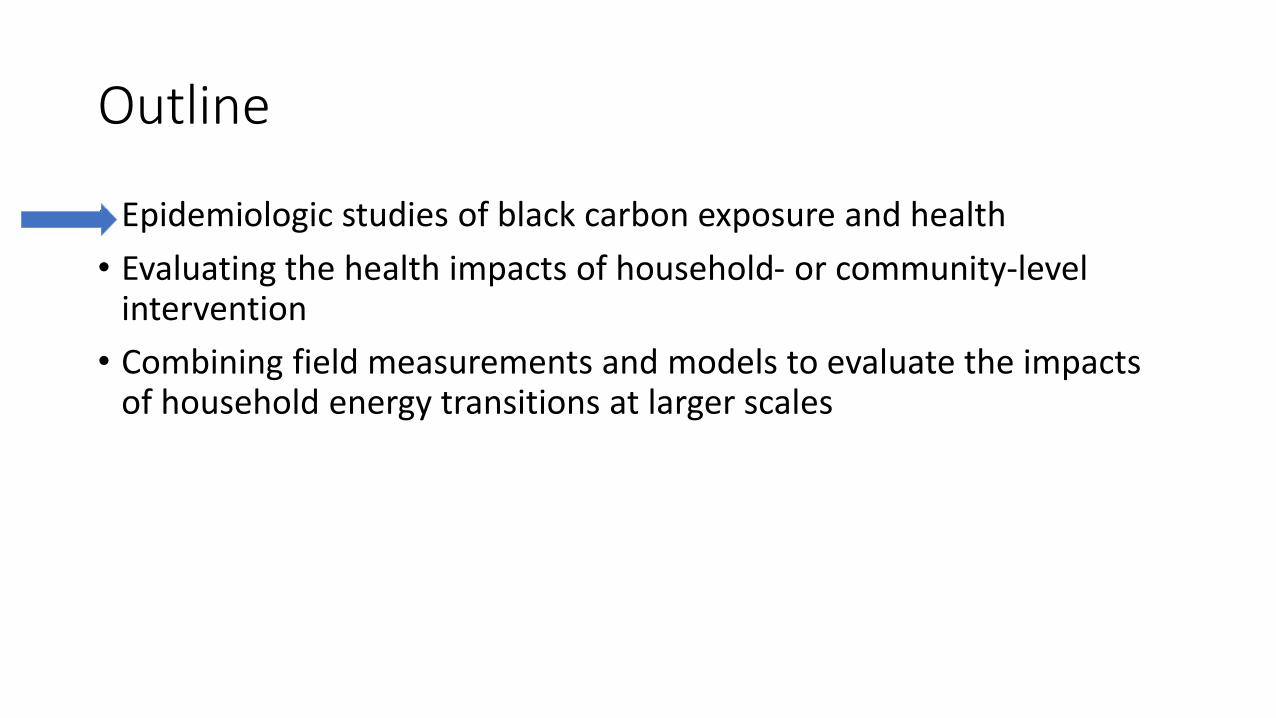
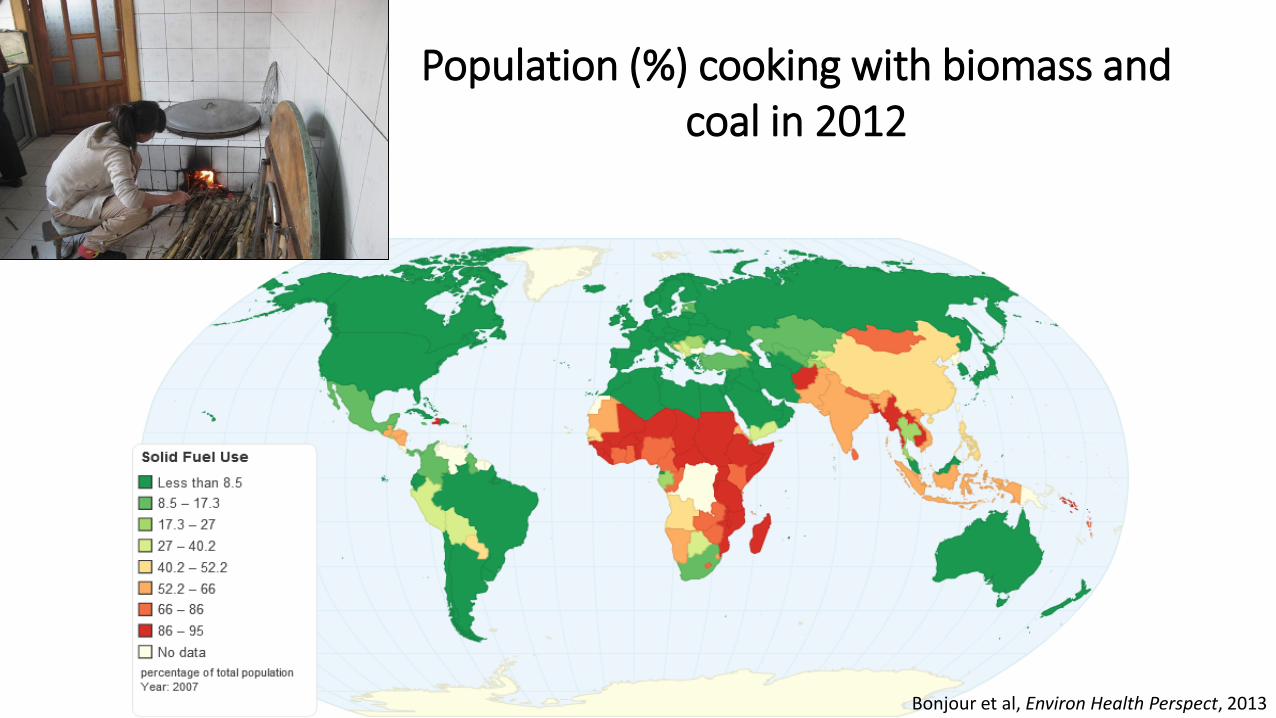
Outline
• Epidemiologic studies of black carbon exposure and health
• Evaluating the health impacts of household- or community-level intervention
• Combining field measurements and models to evaluate the impacts of household energy transitions at larger scales

Norris et al., Environ Research, 2016
Personal black carbon exposure & acute changes in blood pressure in Indian women
Study population: 45 non-smoking women (mean age=42 y)
Exposure: Real-time exposure to black carbon during cooking in winter and in summer
Health Outcome: Ambulatory systolic and diastolic blood pressure
Covariates: Age, body mass index, socioeconomic status, activity, sodium intake, temperature, time of day, and day of the week
Air intake
Blood pressure cuff
Black carbon & blood pressure
monitors

Norris et al., Environ Research, 2016
Personal black carbon exposure & acute changes in blood pressure in Indian women
Study population: 45 non-smoking women (mean age=42 y)
Exposure: Real-time exposure to black carbon during cooking in winter and in summer
Health Endpoints: Ambulatory systolic and diastolic blood pressure
Covariates: Age, body mass index, socioeconomic status, activity, sodium intake, temperature, time of day, and day of the week
Air intake
Blood pressure cuff
Black carbon & blood pressure
monitors
Activities and exposure to black carbon during cooking
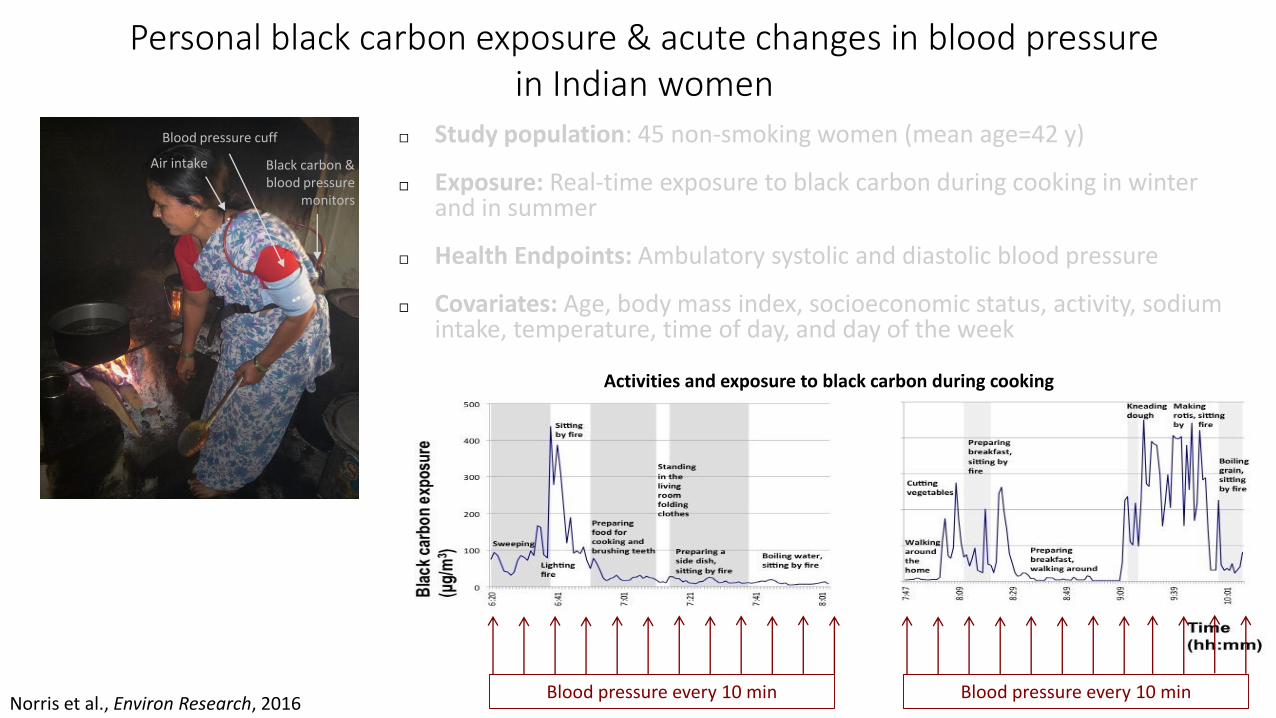
Blood pressure every 10 min Blood pressure every 10 min

Interquartile range changes in black carbon exposure (~100 μg/m3) and systolic blood pressure in Indian women
during cooking (n=45)
Adjusted for age, temperature, body mass index, socioeconomic status (asset index), time of day, salt intake, heart rate
Norris et al., Environ Research, 2016
-2
-1
0
1
2
3
4
5
6
ΔSB
P (
mm
Hg)
Time over which black carbon averaged (minutes)*
5 10 15 20
← 3 mmHg decrease
> 8% reduction in stroke> 10% reduction in coronary heart disease
Cardiovascular benefits of population interventions in Asian cohorts
Asia-Pacific Cohort Studies Collaboration, J Hyper, 20003
0
20
40
60
80
100
120
140
160
180
Winter Summer Winter Summer Winter Summer
Other Water soluble organic matter Black carbon
PM
2.5
ma
ss
(μ
g/m
3)
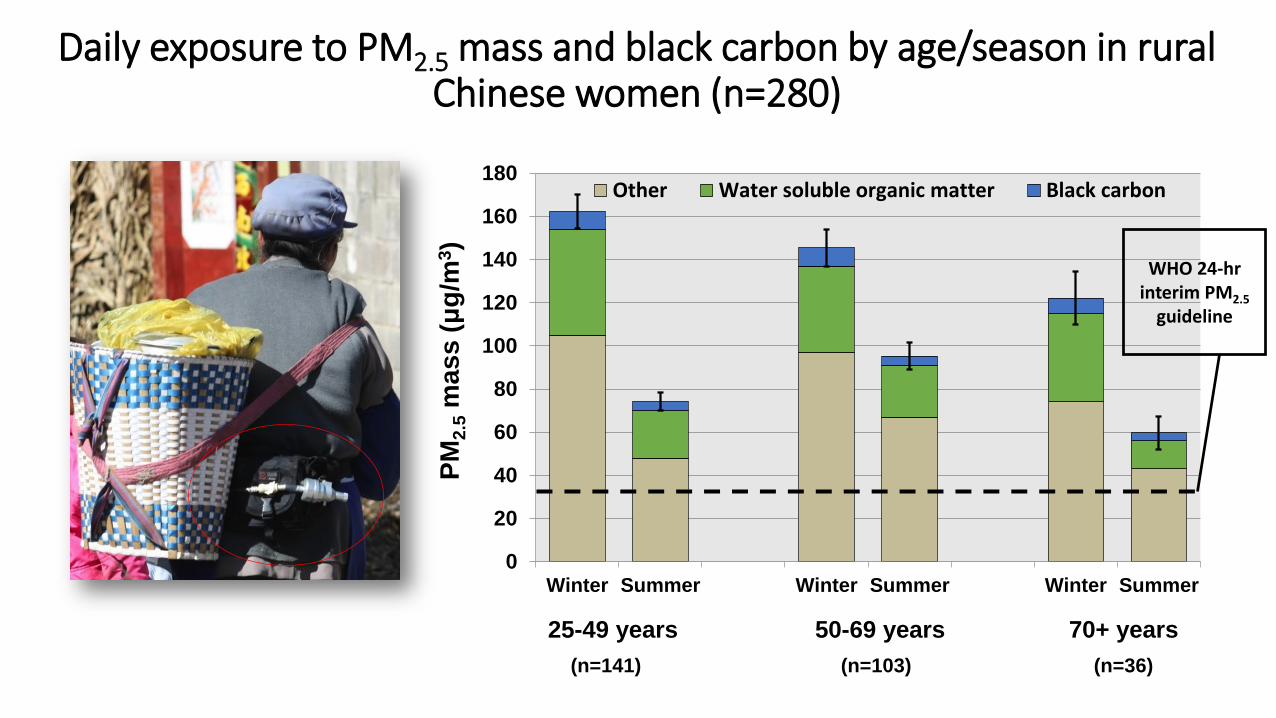
WHO 24-hr interim PM2.5
guideline
(n=141) (n=103) (n=36)
25-49 years 50-69 years 70+ years
Daily exposure to PM2.5 mass and black carbon by age/season in rural Chinese women (n=280)
110
115
120
125
130
135
140
145
0 100 200 300 400 500 600
SBP
(m
m H
g)
PM2.5 exposure (µg/m3)
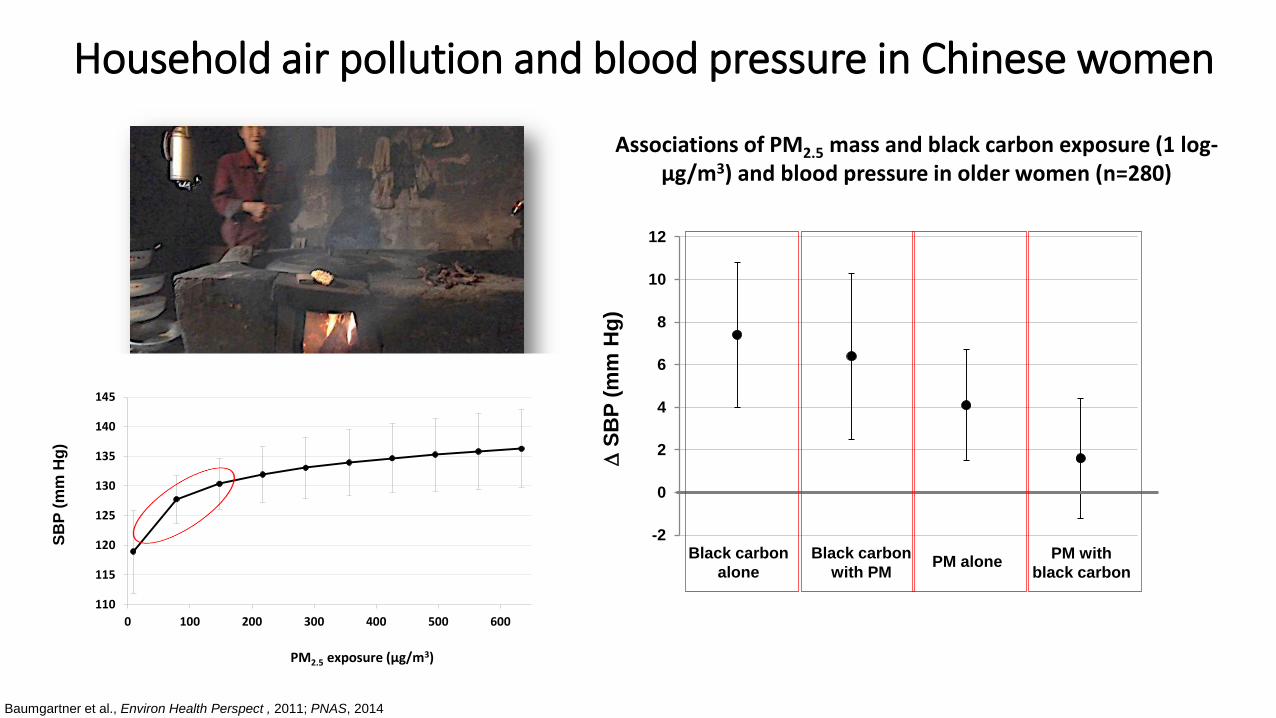
Baumgartner et al., Environ Health Perspect , 2011; PNAS, 2014
-2
0
2
4
6
8
10
12
S
BP
(m
m H
g)
Black carbon
alone
Black carbon
with PM
PM with
black carbonPM alone
Household air pollution and blood pressure in Chinese womenS
BP
(m
m H
g)
Associations of PM2.5 mass and black carbon exposure (1 log-μg/m3) and blood pressure in older women (n=280)
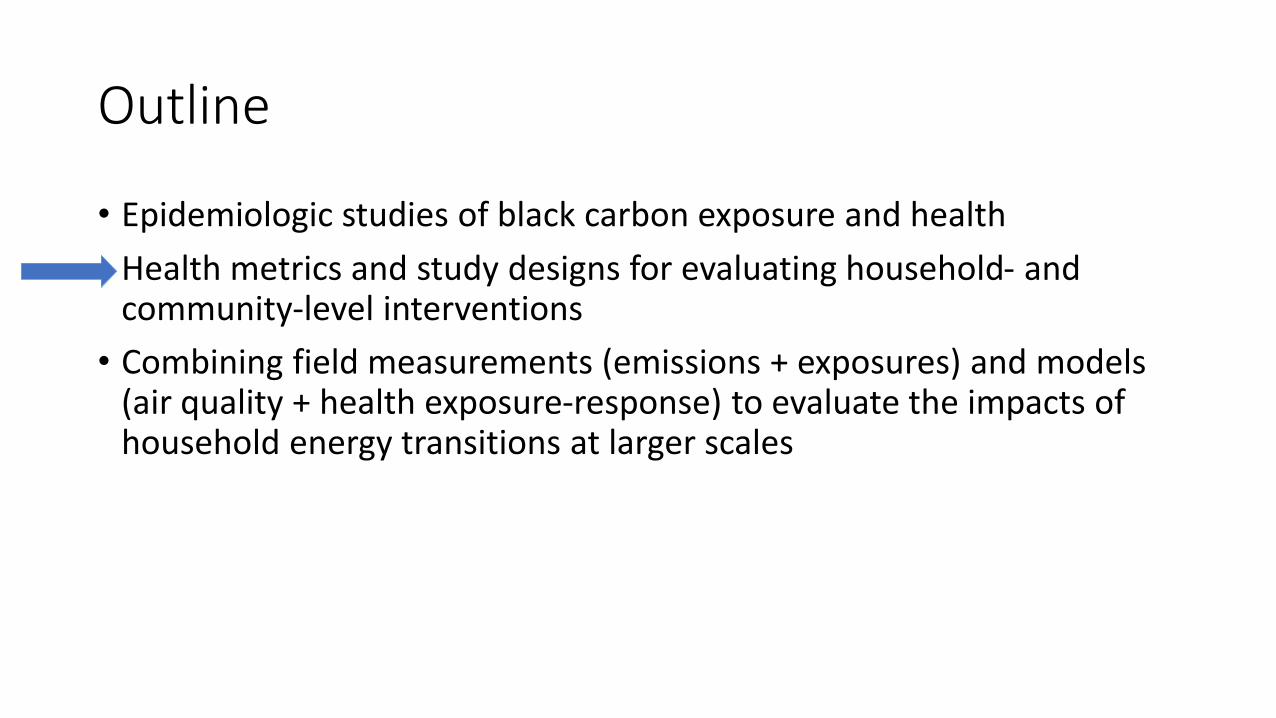
Outline
• Epidemiologic studies of black carbon exposure and health
• Health metrics and study designs for evaluating household- and community-level interventions
• Combining field measurements (emissions + exposures) and models (air quality + health exposure-response) to evaluate the impacts of household energy transitions at larger scales
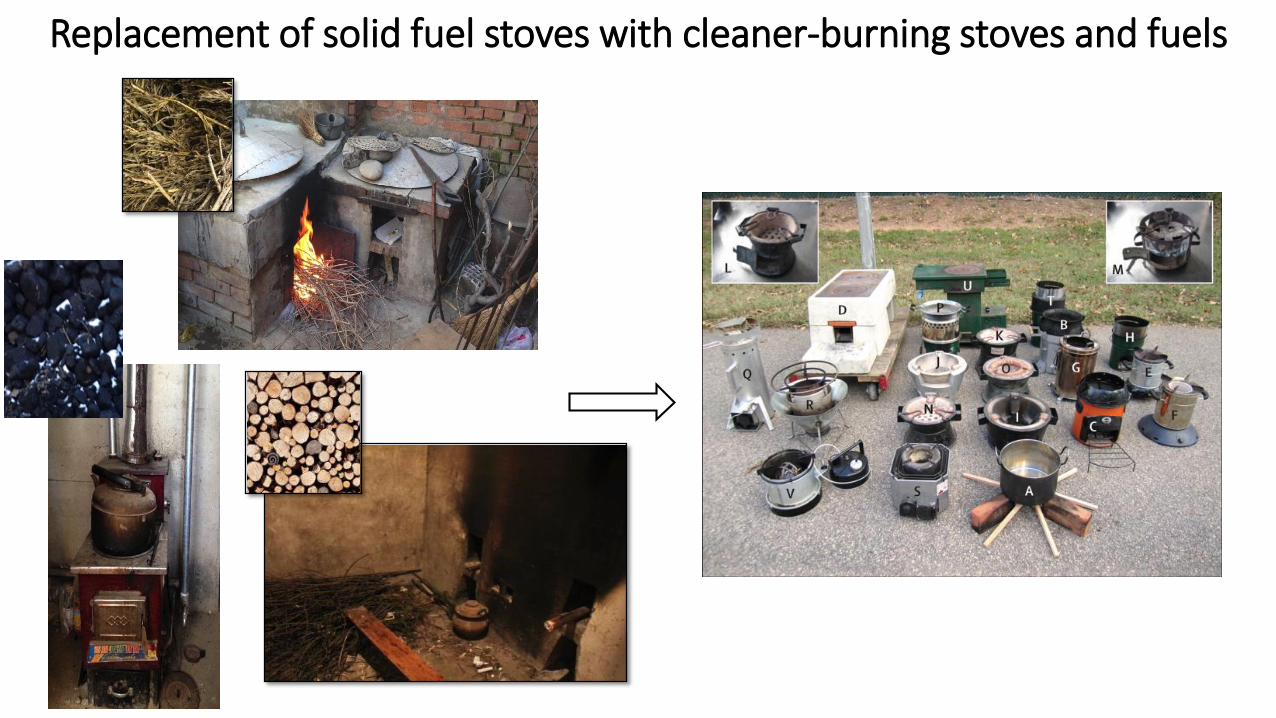
Replacement of solid fuel stoves with cleaner-burning stoves and fuels
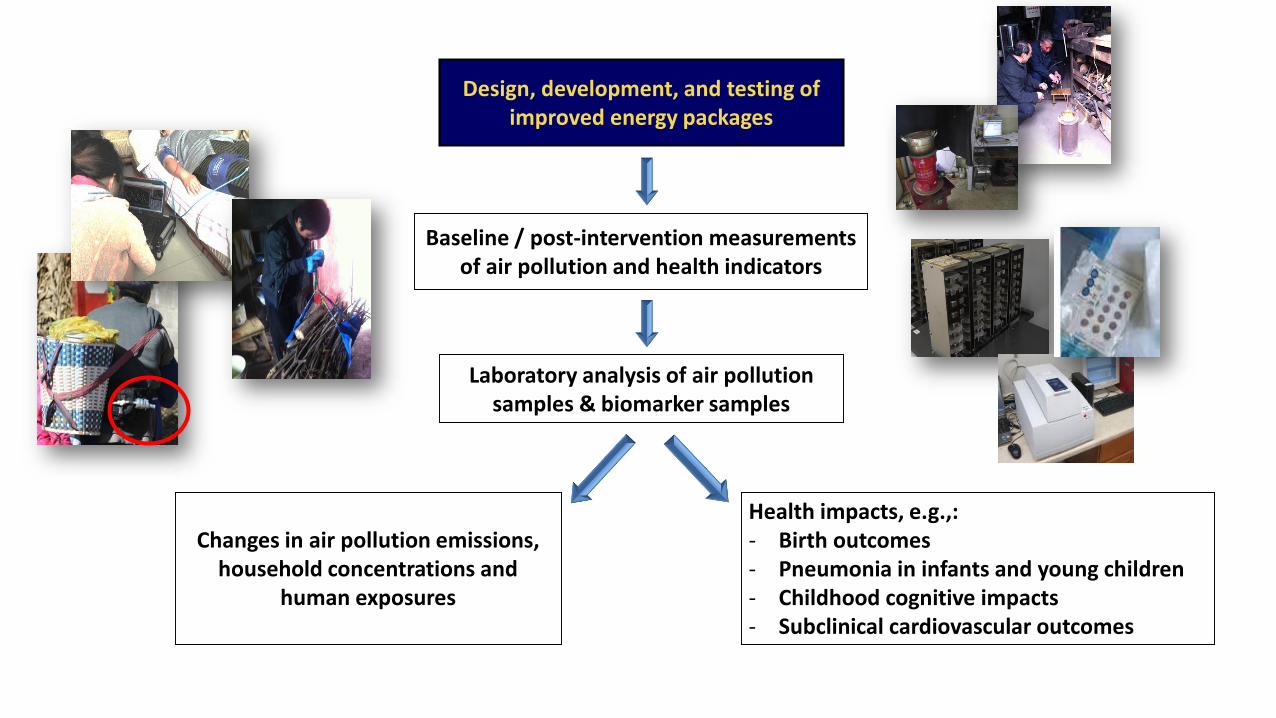
Baseline / post-intervention measurements of air pollution and health indicators
Laboratory analysis of air pollution samples & biomarker samples
Design, development, and testing of improved energy packages
Changes in air pollution emissions, household concentrations and
human exposures
Health impacts, e.g.,:- Birth outcomes- Pneumonia in infants and young children- Childhood cognitive impacts- Subclinical cardiovascular outcomes
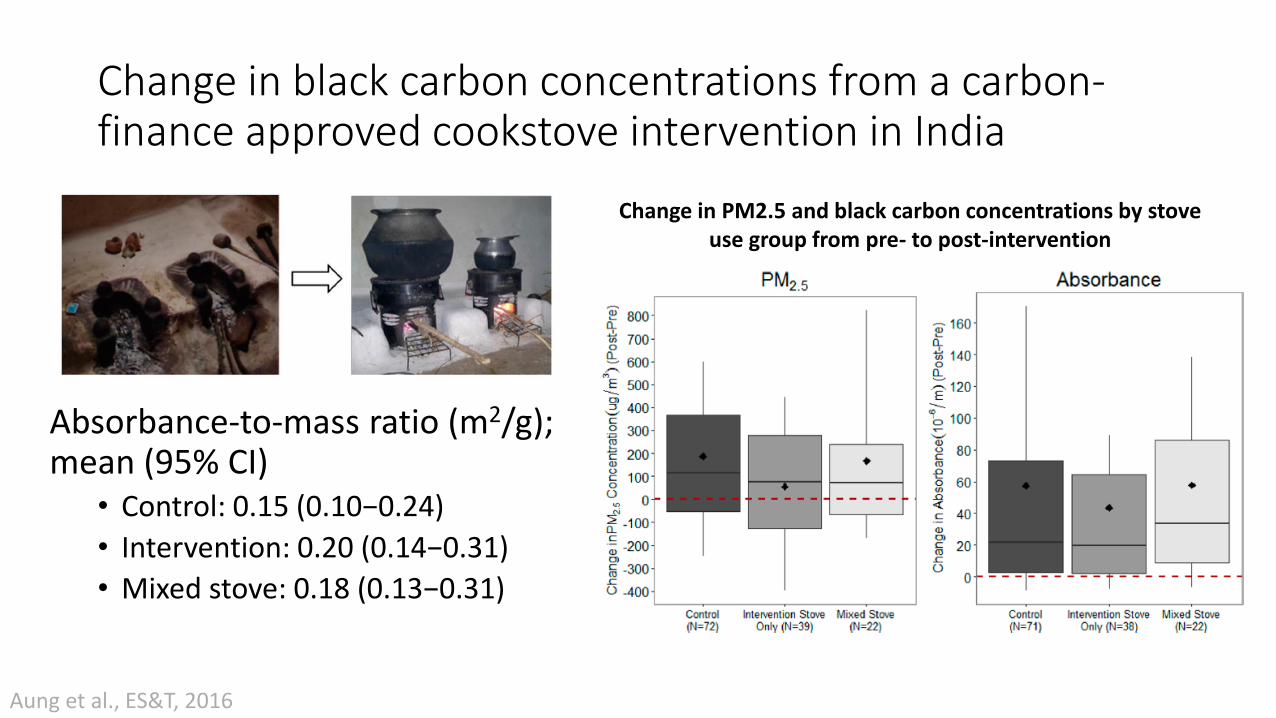
Change in black carbon concentrations from a carbon-finance approved cookstove intervention in India
Absorbance-to-mass ratio (m2/g); mean (95% CI)
• Control: 0.15 (0.10−0.24)
• Intervention: 0.20 (0.14−0.31)
• Mixed stove: 0.18 (0.13−0.31)
Aung et al., ES&T, 2016
Change in PM2.5 and black carbon concentrations by stove use group from pre- to post-intervention
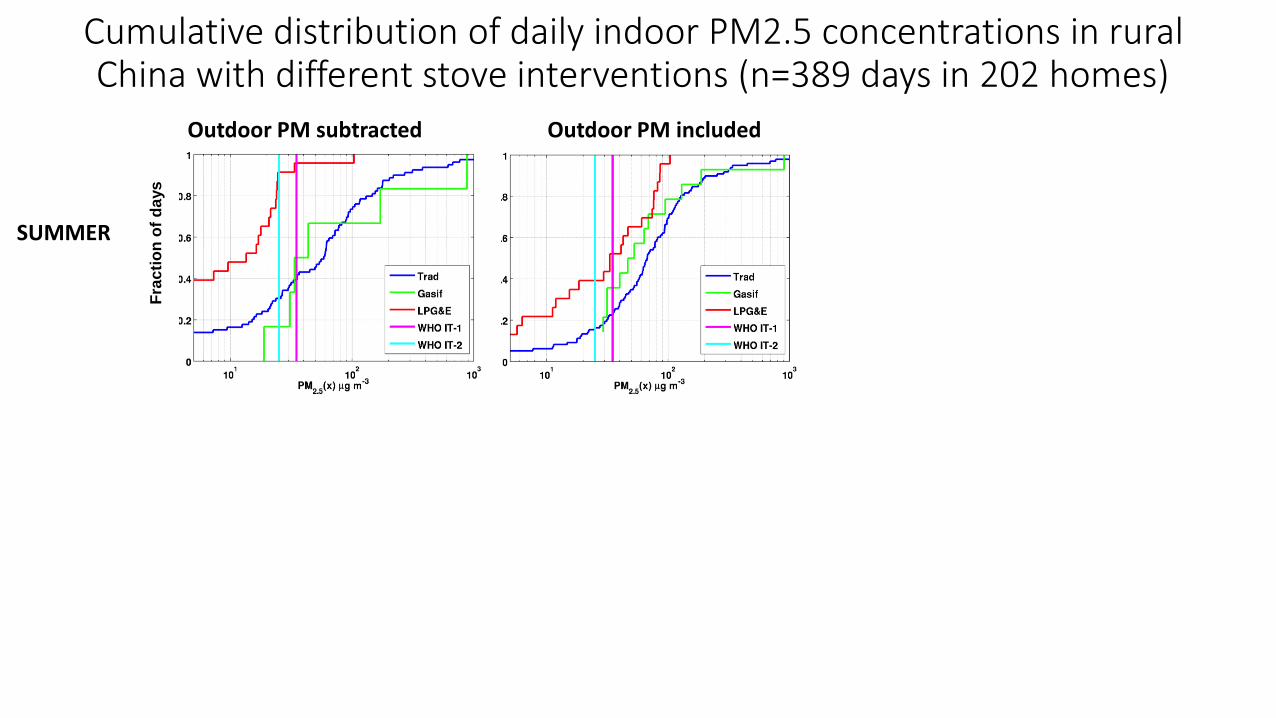
Cumulative distribution of daily indoor PM2.5 concentrations in rural China with different stove interventions (n=389 days in 202 homes)
SUMMER
Outdoor PM subtracted Outdoor PM includedF
rac
tio
n o
f d
ays
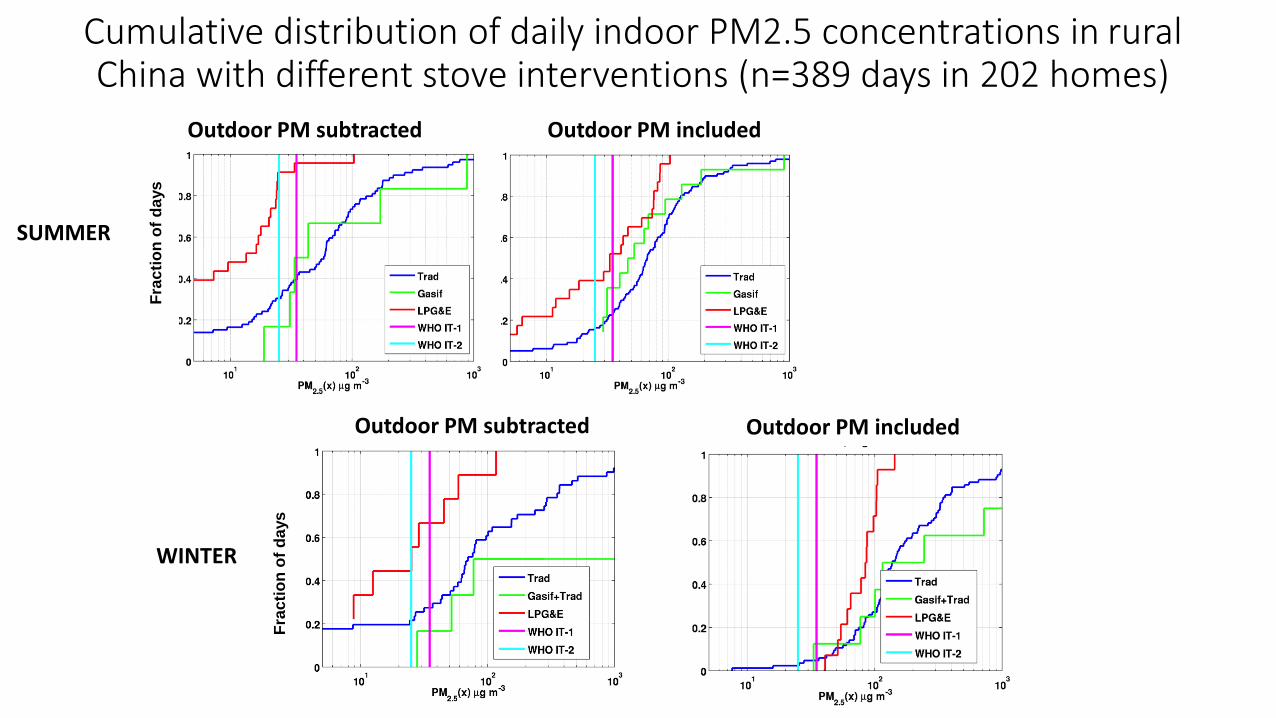
Cumulative distribution of daily indoor PM2.5 concentrations in rural China with different stove interventions (n=389 days in 202 homes)
SUMMER
WINTER
Fra
cti
on
of
da
ys
Outdoor PM includedOutdoor PM subtracted
Outdoor PM subtracted Outdoor PM includedF
rac
tio
n o
f d
ays
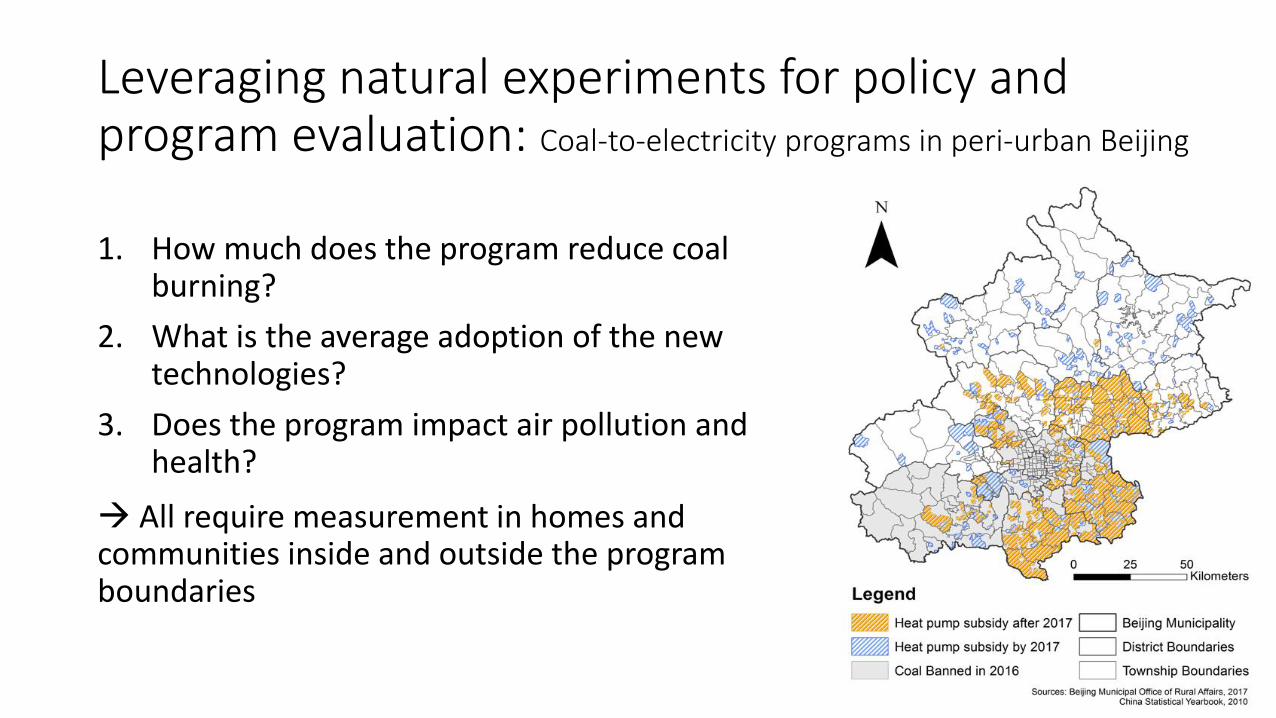
1. How much does the program reduce coal burning?
2. What is the average adoption of the new technologies?
3. Does the program impact air pollution and health?
Leveraging natural experiments for policy and program evaluation: Coal-to-electricity programs in peri-urban Beijing
All require measurement in homes and communities inside and outside the program boundaries
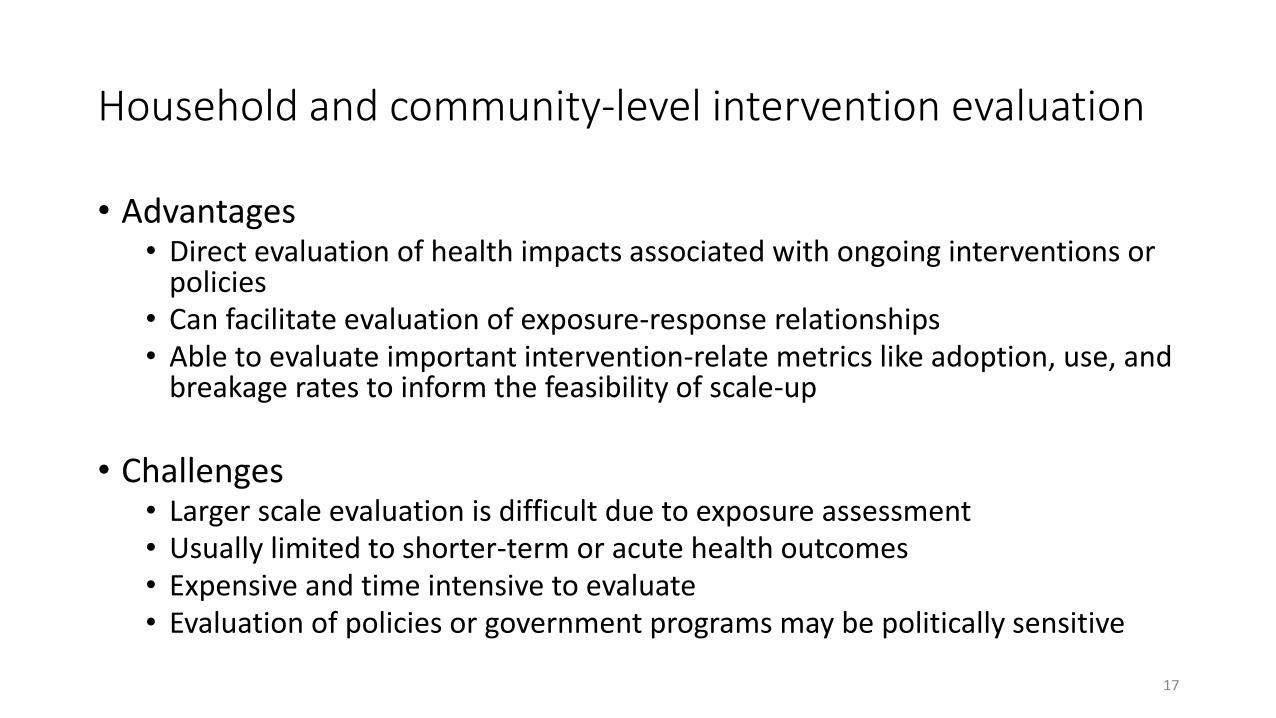
Household and community-level intervention evaluation
• Advantages • Direct evaluation of health impacts associated with ongoing interventions or
policies• Can facilitate evaluation of exposure-response relationships • Able to evaluate important intervention-relate metrics like adoption, use, and
breakage rates to inform the feasibility of scale-up
• Challenges • Larger scale evaluation is difficult due to exposure assessment• Usually limited to shorter-term or acute health outcomes• Expensive and time intensive to evaluate • Evaluation of policies or government programs may be politically sensitive
17
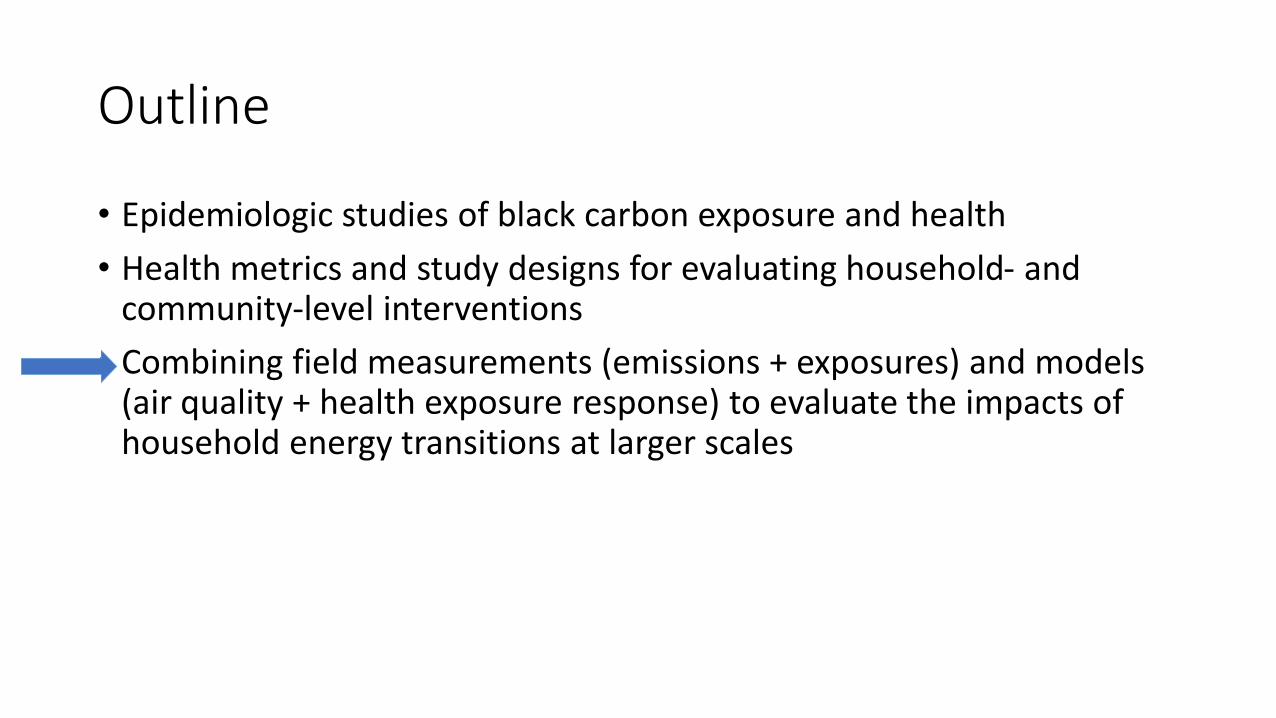
Outline
• Epidemiologic studies of black carbon exposure and health
• Health metrics and study designs for evaluating household- and community-level interventions
• Combining field measurements (emissions + exposures) and models (air quality + health exposure response) to evaluate the impacts of household energy transitions at larger scales
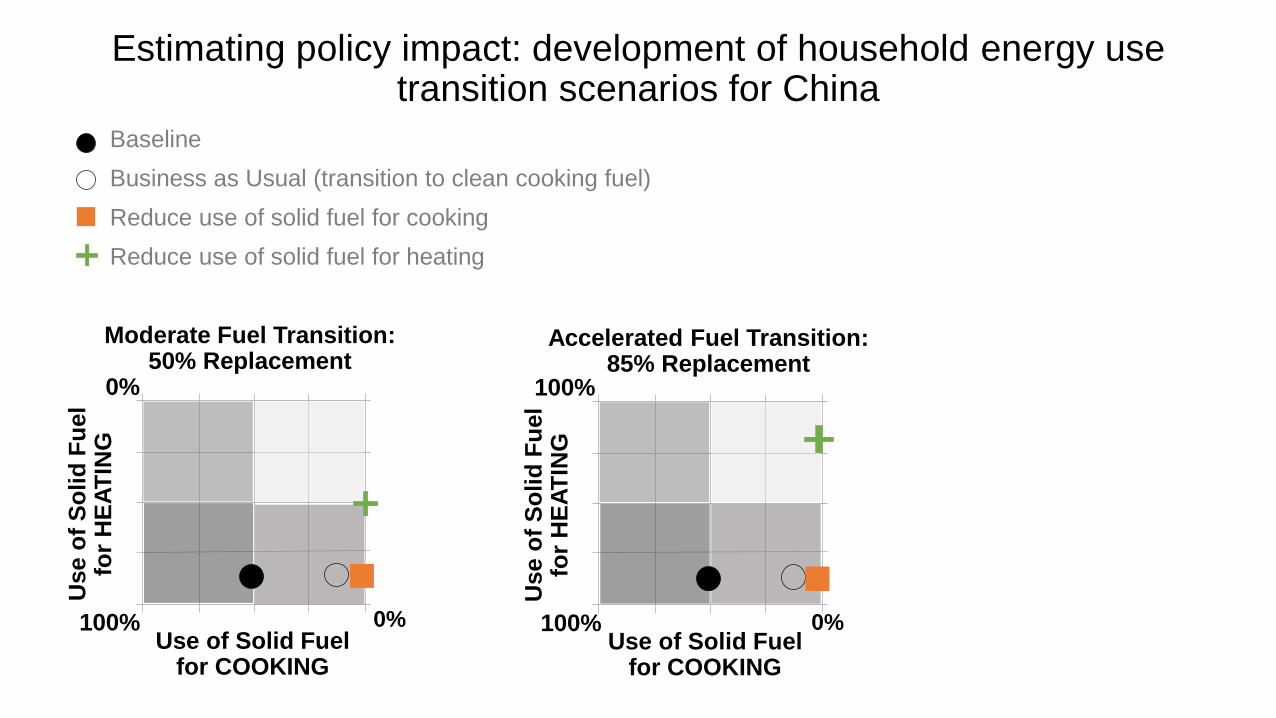
Estimating policy impact: development of household energy use transition scenarios for China
Baseline
Business as Usual (transition to clean cooking fuel)
Reduce use of solid fuel for cooking
Reduce use of solid fuel for heating
Use o
f S
oli
d F
uel
for
HE
AT
ING
100%
0%
Use of Solid Fuel for COOKING
0% 100%
100%
0%
Moderate Fuel Transition: 50% Replacement
Accelerated Fuel Transition: 85% Replacement
Use o
f S
oli
d F
uel
for
HE
AT
ING
Use of Solid Fuel for COOKING
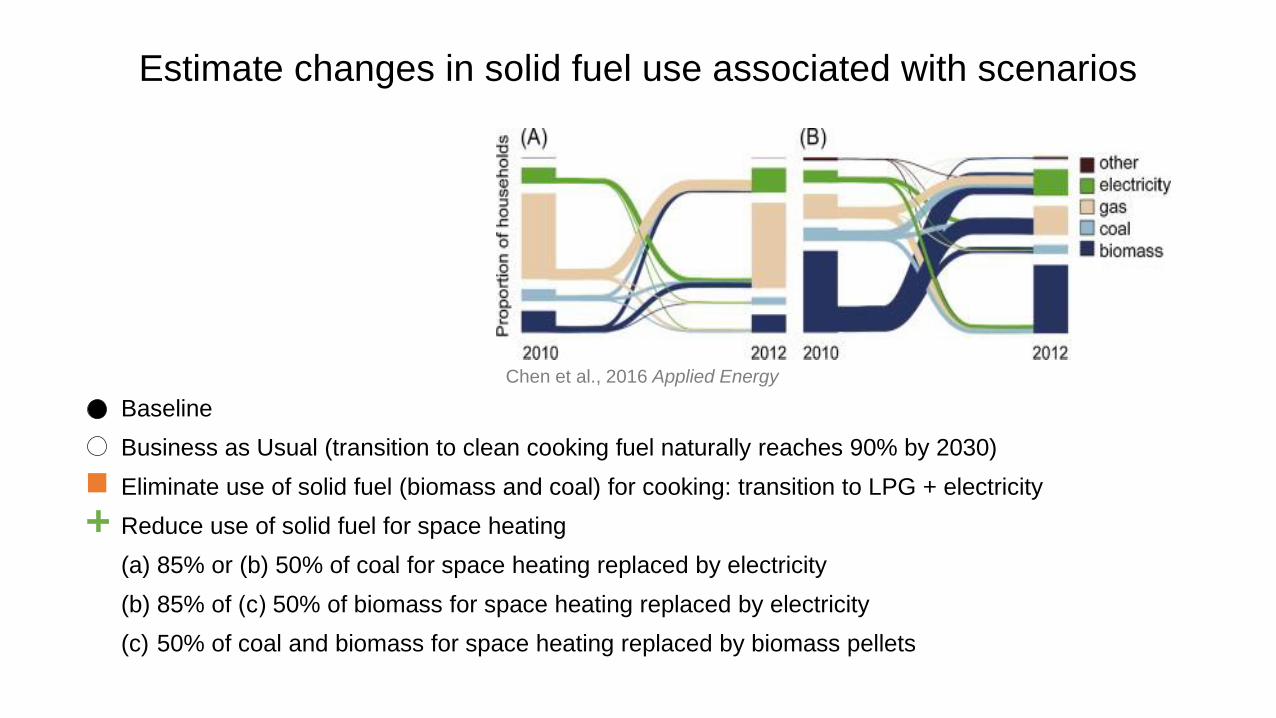
Estimate changes in solid fuel use associated with scenarios
Chen et al., 2016 Applied Energy
Baseline
Business as Usual (transition to clean cooking fuel naturally reaches 90% by 2030)
Eliminate use of solid fuel (biomass and coal) for cooking: transition to LPG + electricity
Reduce use of solid fuel for space heating
(a) 85% or (b) 50% of coal for space heating replaced by electricity
(b) 85% of (c) 50% of biomass for space heating replaced by electricity
(c) 50% of coal and biomass for space heating replaced by biomass pellets
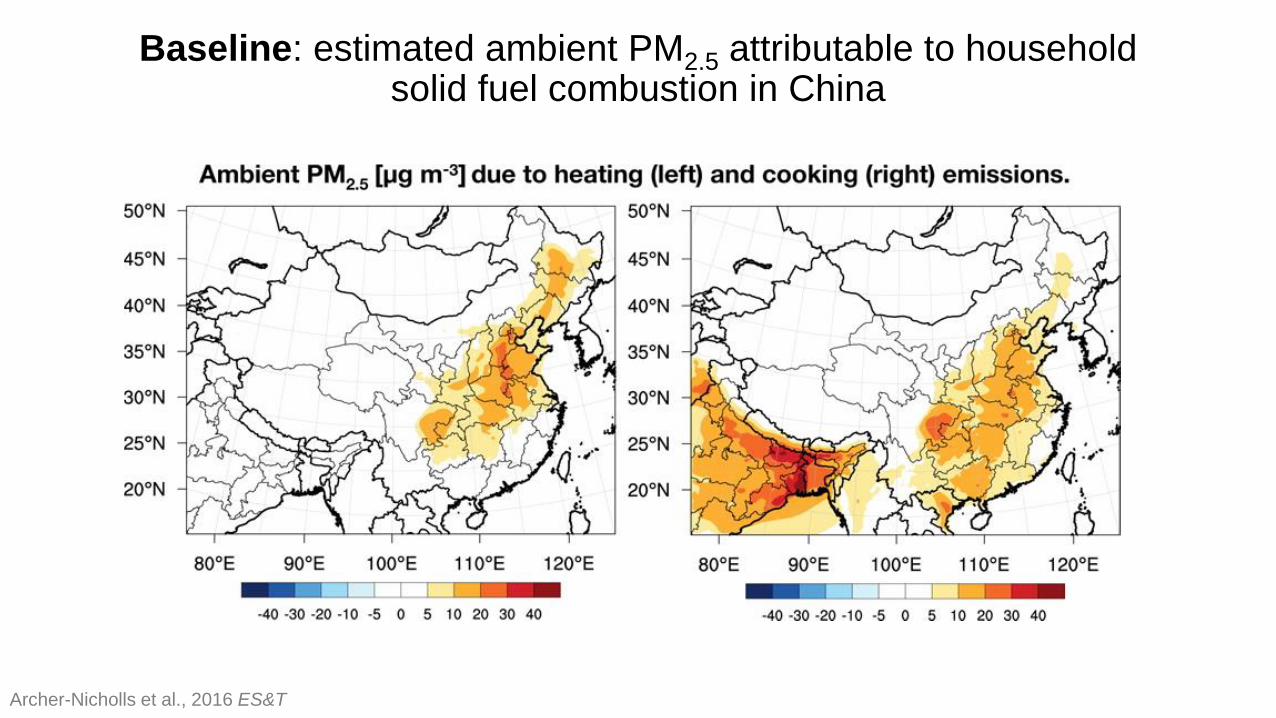
Baseline: estimated ambient PM2.5 attributable to household solid fuel combustion in China
Archer-Nicholls et al., 2016 ES&T
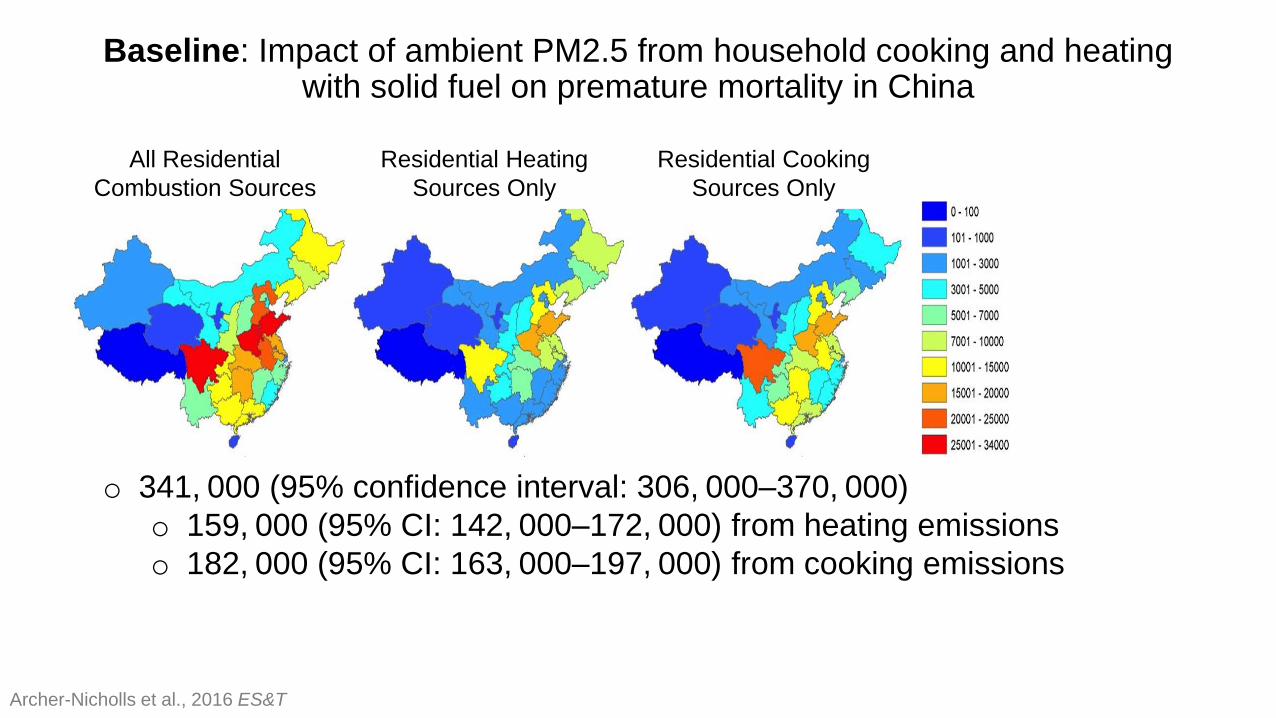
Baseline: Impact of ambient PM2.5 from household cooking and heating with solid fuel on premature mortality in China
Archer-Nicholls et al., 2016 ES&T
All Residential
Combustion Sources
Residential Heating
Sources Only
Residential Cooking
Sources Only
o 341, 000 (95% confidence interval: 306, 000–370, 000)
o 159, 000 (95% CI: 142, 000–172, 000) from heating emissions
o 182, 000 (95% CI: 163, 000–197, 000) from cooking emissions
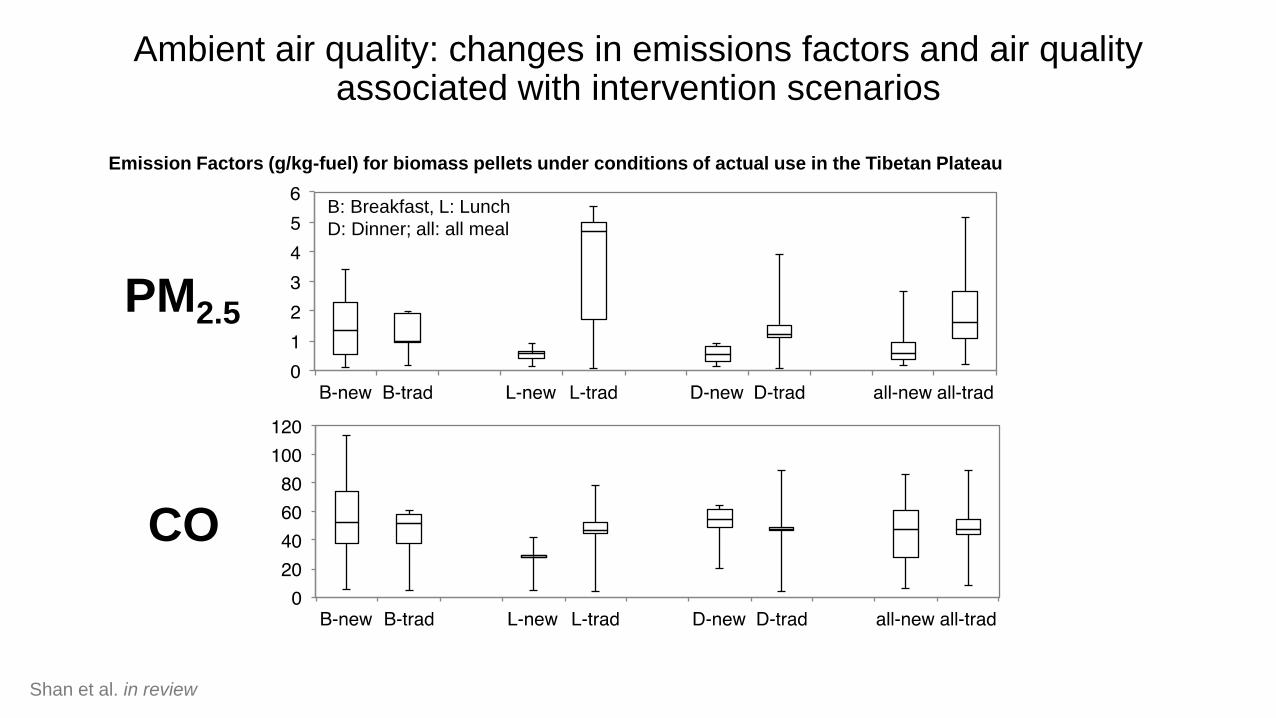
Ambient air quality: changes in emissions factors and air quality associated with intervention scenarios
B: Breakfast, L: Lunch
D: Dinner; all: all meal
CO
PM2.5
Emission Factors (g/kg-fuel) for biomass pellets under conditions of actual use in the Tibetan Plateau
Shan et al. in review

Household air pollution: Integrating measurements of indoor PM with different interventions into exposure-response models (n=389 days from 202 homes)
Outdoor PM subtracted Outdoor PM included
Fra
cti
on
of
da
ys
Relative risk scenario (outdoor included)
Burnett et al. Environ Health Perspect, 2014
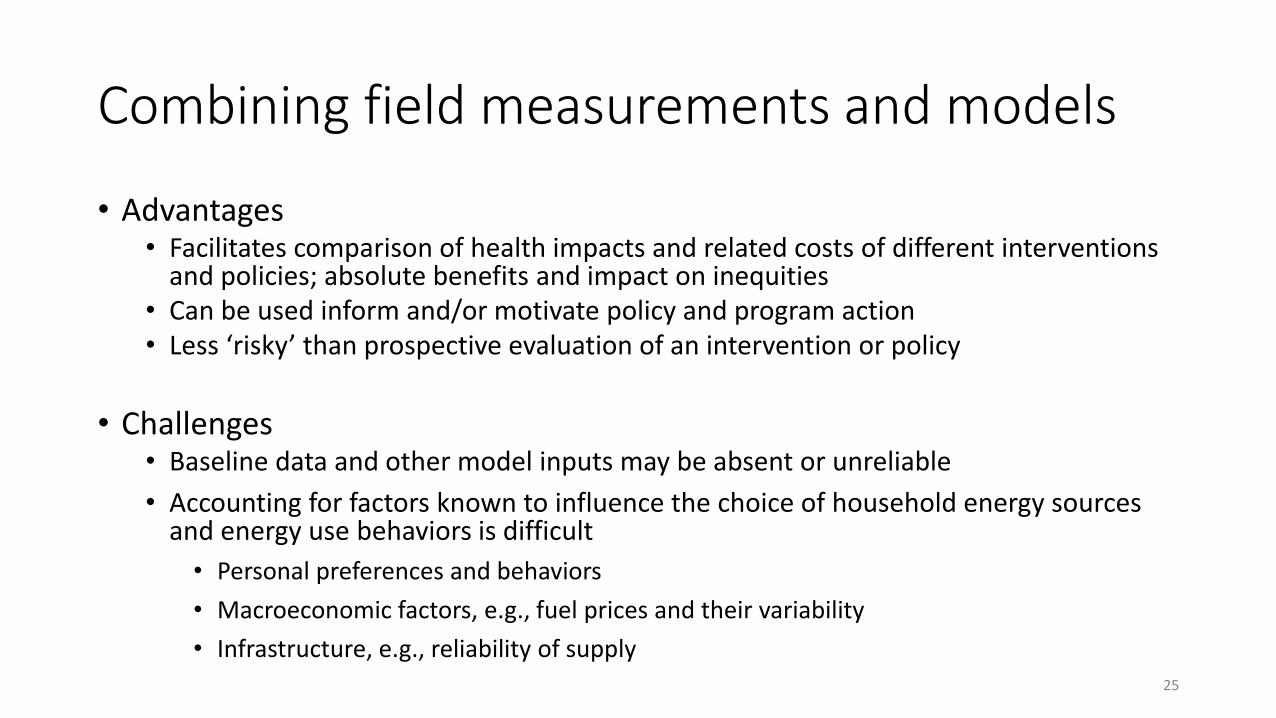
Combining field measurements and models
• Advantages • Facilitates comparison of health impacts and related costs of different interventions
and policies; absolute benefits and impact on inequities• Can be used inform and/or motivate policy and program action • Less ‘risky’ than prospective evaluation of an intervention or policy
• Challenges• Baseline data and other model inputs may be absent or unreliable
• Accounting for factors known to influence the choice of household energy sources and energy use behaviors is difficult
• Personal preferences and behaviors
• Macroeconomic factors, e.g., fuel prices and their variability
• Infrastructure, e.g., reliability of supply25
Key policy impacts
Black carbon from household solid fuel combustion may be a directly useful metric for both health and climate impacts
Selection of appropriate health metrics varies by study design, level of intervention, and goal of evaluation (i.e., exposure-response versus policy evaluation)
Health metrics are (relatively) straightforward; primary challenge is input of valid air pollution exposure metrics
26
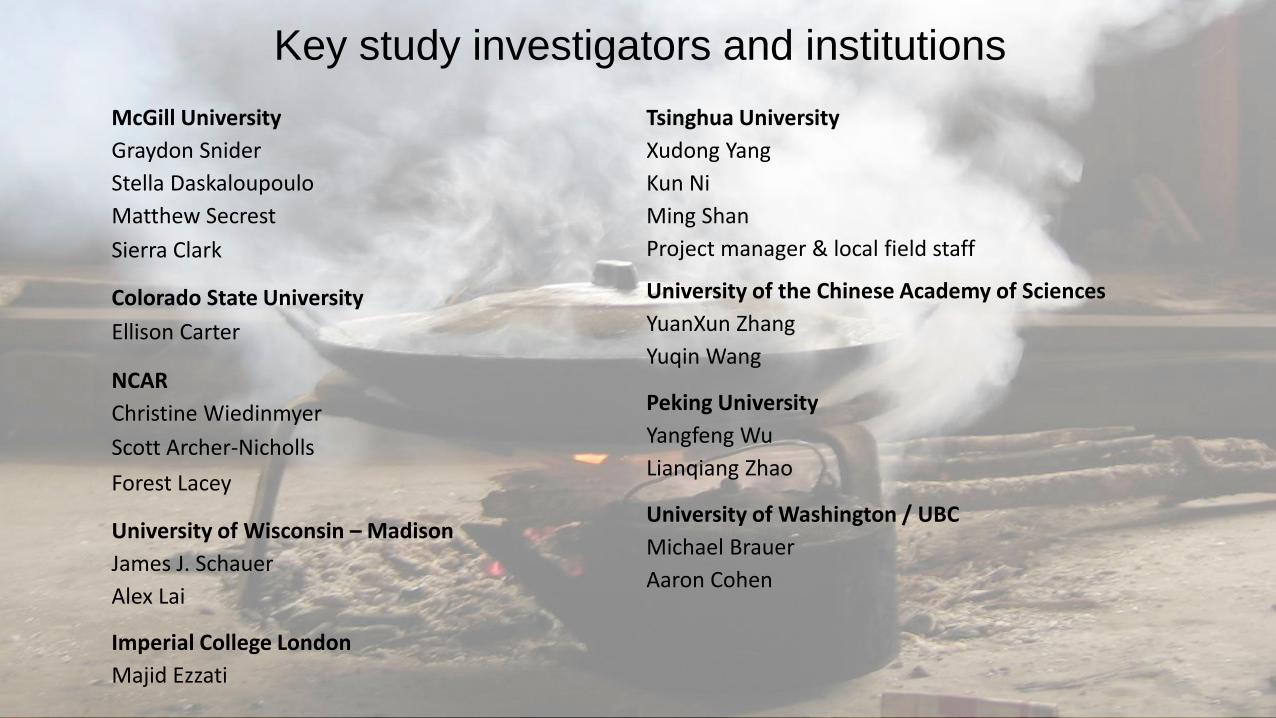
McGill University
Graydon Snider
Stella Daskaloupoulo
Matthew Secrest
Sierra Clark
Colorado State University
Ellison Carter
NCAR
Christine Wiedinmyer
Scott Archer-Nicholls
Forest Lacey
University of Wisconsin – Madison
James J. Schauer
Alex Lai
Imperial College London
Majid Ezzati
Key study investigators and institutions
Tsinghua University
Xudong Yang
Kun Ni
Ming Shan
Project manager & local field staff
University of the Chinese Academy of Sciences
YuanXun Zhang
Yuqin Wang
Peking University
Yangfeng Wu
Lianqiang Zhao
University of Washington / UBC
Michael Brauer
Aaron Cohen
How health metrics work: health metrics relevant to estimating the impact of black
carbon interventions
Jill Baumgartner
Dept of Epidemiology, Biostatistics and Occupational Health
Institute for Health and Social Policy
McGill University, Montreal
CCAC Expert Workshop on Metrics for Evaluating and Reporting on BC and Methane Interventions
March 16, 2017
Empirical evidence and models from household air pollution in Asia

References
• Archer-Nicholls S, Carter EM, Kumar R, Xiao Q, Liu Y, Forstad J, Forouzanfar MH, Cohen A, Brauer M, Baumgartner J, Wiedinmyer C. (2016) The regional impacts of cooking and heating emissions on ambient air quality and disease burden in China. Environmental Science and Technology, 50, 9416-9423.
• Ni K*, Carter E*, Schauer JJ, Ezzati M, Zhang YX, Niu HJ, Lai A, Shan M, Wang YQ, Yang XD, Baumgartner J. (2016) Seasonal variation in outdoor, household, and personal air pollution exposures of women using traditional wood stoves in the Tibetan Plateau: baseline assessment for an energy intervention study. Environment International, 4, 449-457.
• Carter E, Archer-Nicholls S, Ni K, Lai A, Niu HJ, Secrest M, Sauer S, Schauer JJ, Ezzati M, Wiedinmyer C, Yang XD, Baumgartner J. (2016) Seasonal and diurnal air pollution from residential cooking and space heating in the eastern Tibetan Plateau. Environmental Science and Technology, 50, 8353–8361.
• Aung T, Jain G, Sethuraman K, Baumgartner J, Reynolds C, Grieshop AP, Marshall JD, Brauer M. (2016) Health and climate-relevant pollutant concentrations from a carbon-finance approved cookstove intervention in rural India. Environmental Science and Technology, 50, 7228-7238.
• Norris C, Goldberg MS, Marshall JD, Valois MF, Pradeep T, Narayanswamy M, Jain G, Sethuraman K, Baumgartner J (2016). A panel study of exposure to black carbon from biomass burning and its association with acute changes in blood pressure in rural Indian women. Environmental Research, 147, 331-342.
• Baumgartner J, Zhang, YX, Schauer JJ, Huang W, Wang YQ, Ezzati M. (2014) Proximity to highways and black carbon from cookstoves as a risk factor for higher blood pressure in rural China. Proceedings of the National Academy of Sciences (PNAS), 111: 13229-13234
29
Acknowledgements
U.S. EPA Science to Achieve Results (STAR) program
The Wellcome Trust
Canadian Institutes for Health Research