How Europe’s cement sector benefits and the climate ... · 2 at Lafarge/AETHER) ... (Project...
32
The Final Carbon Fatcat How Europe’s cement sector benefits and the climate suffers from flaws in the Emissions Trading Scheme
Transcript of How Europe’s cement sector benefits and the climate ... · 2 at Lafarge/AETHER) ... (Project...
TheFinalCarbonFatcatHowEurope’scementsectorbenefitsandtheclimatesuffersfromflawsinthe
EmissionsTradingScheme

TheFinalCarbonFatcat–Sandbag–March2016 2
Acknowledgements
ThisreportwasproducedwiththehelpofagrantfromtheEuropeanClimateFoundation,butitsconclusionsremainindependent.
Theauthorsareenormouslygratefultotheindividualsandorganisationswhoseinputandexpertisehasbroughtthisprojecttofruition.Inparticular,wewouldliketoexpressourthanksto:
MrKoenCoppenholle(ChiefExecutive,CEMBUREAU),MsCristianaCiaraldiJolivet(ClimateProtectionandSustainabilityManagerattheWorldBusinessCouncilforSustainableDevelopment),MsClaudeLoréa(DeputyChiefExecutive,CEMBUREAU),andMrAlessandroSciamarelli(HeadofEconomicResearchandStatisticsCEMBUREAU)forhelpingclarifymanyissuesregardingbenchmarks,technologyandindustrydata.
MrRobertFielding(ProgrammeManageratÉcolepolytechniquefédéraledeLausanne),PeterLukas(DirectorGlobalEnvironmentalSustainabilityatHeidelbergCement),MrJanTheulen(DirectorAlternativeResources,HeidelbergCement)andDrGüntherWalenta(ProgramManagerInnovation&CO2atLafarge/AETHER)fordiscussionsontheeffortsofconventionalcementmakerstodecarbonise.
AlexandrosKatsiamboulas(Environment,Quality&SustainableDevelopmentSeniorManageratTitanCementCompanySA)andMrMarcoSollevanti(ControlleratColacemSpa)forverifyingcorporateownershipoftheircementinstallations.
DrPaulaCarey(QualityAssuranceandResearchDirectoratCarbon8AggregatesLtd),MrTomGlasby(ProjectManagerforEarthFriendlyConcreteatWagners),MrTomJensen(HeadofCorporateDevelopmentatJouleUnlimitedTechnologies,Inc.),MrDonalO’Riain(founderofECOCEM),MrMatthiasSpringborn(DeutschesInstitutfürBautechnik),andDrBrianSweeney(SeniorPartneratFastnetEnergyConsultants)fordiscussingthechallengesfacingmakersofnon-conventionalcementandcarbon-negativeproducts,andgettingusuptospeedoncementcarboncapturestoragetechnologies.
MsEleonoraArcese(ResearchAssociateatClimateStrategies),DrAndrzejAncygier(LectureronEuropeanEnvironmentalPolicyatNewYorkUniversity,Berlin),DrFrédéricBranger(GranthamResearchInstituteonClimateChangeandEnvironment),DrKarstenNeuhoff(DepartmentheadofClimatePolicyatDIW),PhilippeQuirion(DirectoratCIRED),andDrMisatoSatoh(GranthamInstitute)fortheirinestimablehelpindevelopingnewresearchmethodology.
MsSimoneCooperandcolleaguesattheUniversityofCambridgefortechnicalfeedbackondecarbonisationlevers.
MrMartijnBroekhof(SeniorAssociateattheEuropeanClimateFoundation)&DrJuliaReinaud(DirectoroftheResearchProgrammeandPartnershipsatIndustrialInnovationforCompetitiveness)forprovidingextensivefeedbackatallstagesofmakingthisreport.
DaveJones,PhilMacDonald,DamienMorris,BenNelmes,JulianRichardson&BaronessBryonyWorthingtonfortheireditinghelp,andTriciaBuckleyforherindefatigablehelpondatastructuring.
Authors:AlexLuta,WilfLytton.Formoreinformation,[email protected].

TheFinalCarbonFatcat–Sandbag–March2016 3
ContentsEXECUTIVESUMMARY.................................................................................................................................4
Cementandemissionstrading.................................................................................................................5
TheETSsofar:Alicencetopollute..........................................................................................................6
Urgentneedtorevisethefreeallocationsystem....................................................................................7
Needtoboostsupportinnovationsinindustrialabatement...................................................................8
SUMMARYOFRECOMMENDATIONS.......................................................................................................9
1. INTRODUCTION:Cement–TheFinalCarbonFatcat........................................................................10
Aboutthisreport....................................................................................................................................10
2. CEMENTINCONTEXT.........................................................................................................................11
3. LEVERSFORDECARBONISINGCEMENT............................................................................................12
4. CEMENTUNDERTHEETS...................................................................................................................13
4.1. Ineffectivedecarbonisationincentives.....................................................................................13
4.2. Problem1:Toolittleadjustment..............................................................................................17
4.2.1. Cause..................................................................................................................................17
4.2.2. Solution:Introduceahighergranularityoffreeallocationadjustments............................20
4.2.3. Expectedresults..................................................................................................................20
4.3. Problem2:Toomuchallocation...............................................................................................21
4.3.1. Cause..................................................................................................................................21
4.3.2. Solution:Adoptatieredsystemofleakageprotection.......................................................21
4.3.3. Expectedresults..................................................................................................................21
5. SUPPORTINGINNOVATION...............................................................................................................22
6. OVERVIEWOFDECARBONISATIONOPTIONS...................................................................................23
6.1. IndustrialCCS.............................................................................................................................24
6.2. Fuelswitching............................................................................................................................24
6.3. Kilnefficiency.............................................................................................................................26
6.4. Clinkershares.............................................................................................................................27
6.5. Non-Portlandcements...............................................................................................................28
6.6. CCUScementsandconcrete......................................................................................................29
7. ANNEX:METHODOLOGY...................................................................................................................31

TheFinalCarbonFatcat–Sandbag–March2016 4
EXECUTIVESUMMARYCementisthemostwidelyusedman-madematerialintheworld,responsiblefor5%ofworldwideman-madegreenhousegasemissions.1ThecementsectorinEuropecontributesasmuchcarbonpollutionasthewholeBelgianeconomy.TheEU’s‘flagship’climatechangepolicy,theEmissionsTradingScheme(ETS),isintendedtoincentiviseemissionscutsandinnovationinthecementsector.However,thisreportfindsthatwhilstmostindustrialsectorsarenowfacingreducingallowancesurpluses,thecementsectorsurpluscontinuestogrow(seeFigure1),hamperingprogresstowardsdecarbonisation.PerverseincentivesinfreeallocationdesignmeanthattheEUETSislikelytohavecausedemissionsinthecementsectortohaverisenbeyondbusinessasusual;weestimatebymorethan15milliontonnes.Ineffect,‘CarbonLeakage’hashappenedinreverse.EmissionshavebeenimportedintotheEUthatwouldnothaveoccurredwithouttheETS.Wealsoidentifyfive“CarbonFatcatCompanies”fromthecementsectorwhohavecollectivelyreceivednearly€1billionworthofspareEUallowances(EUAs)forfreebetween2008and2014.Thisreportshowsthatdeepreductionsincementemissionsarepossible,ifthecarbonpricerises,over-allocationofallowancesisended,andtheETSisredesignedtosupportinnovation,includingnewprocessesbeyondPortlandcement,andCarbonCapture&Storage.
Figure1:ExpecteddevelopmentofallowancesurplusesformajorindustrialsectorsuntiltheendofPhase3.Source:EUTL(Sandbagcalculations).
1LowCarbonTechnologyPartnershipsinitiative.(2015)Cement(link).
0.0
0.5
1.0
1.5
2.0
2.5
3.0
Years'worthofspareEUA
s
Phase3
Cement
Limeandplaster
Ironandsteel(EUTL)
Refineries
Paper
Organicchemicals
Inorganicchemicals

TheFinalCarbonFatcat–Sandbag–March2016 5
CementandemissionstradingEmissionsfromtheproductionofcementareregulatedundertheEU’sEmissionsTradingScheme(ETS).In2014theyaccountedfor6.3%ofETSemissions.Aroundtwothirdsofthesector’semissionsareprocessemissionsfromchemicalreactionsintheproductionofclinker.ClinkerisanintermediarymaterialinthemanufactureofPortlandcement–thevarietythatdominatestheglobalcementmarket.TheCommissionproposaltorevisetheETSpost-2020impliesacompletedecarbonisationofallindustrialsectorsby2058.Tomeetthischallenge,cementcompanieswillneedtofundamentallyreinventthemselves–andevenswifteremissionsreductionsmayyetberequiredofthemifEuropestepsupitsambitionsfollowingtheParisAgreement.Fortunately,manytechnologicaloptionsexisttodecarbonisethesectorbutexistingpolicyleversarepushinginthewrongdirection.TheETScouldassistthistransformation,butitisnotcurrentlyprovidingamarketsignalthatwouldsetthissectoronatransformativepathway,throughinvestmentsintocarboncaptureormassproductionoflow-carbonorcarbon-negativecements.Instead,ouranalysisshowsthattheexistingrulesforfreeallocationactasperverseincentiveskeepingtheproductionlevelofhigh-carbonclinkerartificiallyhigh.PoorruledesigniseffectivelyresultingintheimportofcarbonemissionsintotheEU.Weidentifysixdifferentoptionsfordecarbonisingthecementsector:
1. Capturingandstoring/usingdirectemissions(CCUS)2. Burningcleanerfuels3. Improvingkilnefficiency4. Reducingtheshareofclinkerincement5. ReplacingPortlandcementwithnon-conventionalvarieties6. Developingcarbon-negativevarietiesofcement
ThefirstfourleversliewithinthescopeofactivitiesthattheETScouldinfluencebutanumberofrulesmustbeimprovedbeforecarbonpricingcaneffectivelyencouragethem.Deliveringthelasttwowillrequireadditionalpolicyincentives.OutsidetheETS,ahostofsupportingproductstandardsatboththeEUandMemberStates(MS)levelcertifyingnewlow-carboncementorcementitiousproducts,aswellasdemonstrationprojectsandprocurementrules,willberequiredtofacilitatethediffusionofinnovationinthissector.SofaremissionsreductionsinthesectorhavebeenoverwhelminglyincentivisedbypoliciesoutsidetheETS.Forexample,switchingtobiomassissupportedbytheEU-wide2020renewableenergytarget(RenewablesDirective2009/28/EC)andotherDirectivesandMSpolicies.ThewidelydivergentprogressacrossMSs(seeTable1)demonstratesthatnational-leveltargetsrelatingtowastehandlingandrenewableenergyhavehadastrongerimpactonfuelswitchingthantheETS.Germany Czech
RepublicPoland United
KingdomFrance Spain Italy
64.4% 59.5% 47.3% 49.1% 32.3% 29.4% 13.0%Table1:Weightedaveragesfortheuseofalternativefuelsandbiomassinthethermalenergyconsumptionofgreyclinkerproduction.Source:CSI2013(dataset25aAGFC).
TheFinalCarbonFatcat–Sandbag–March2016 6
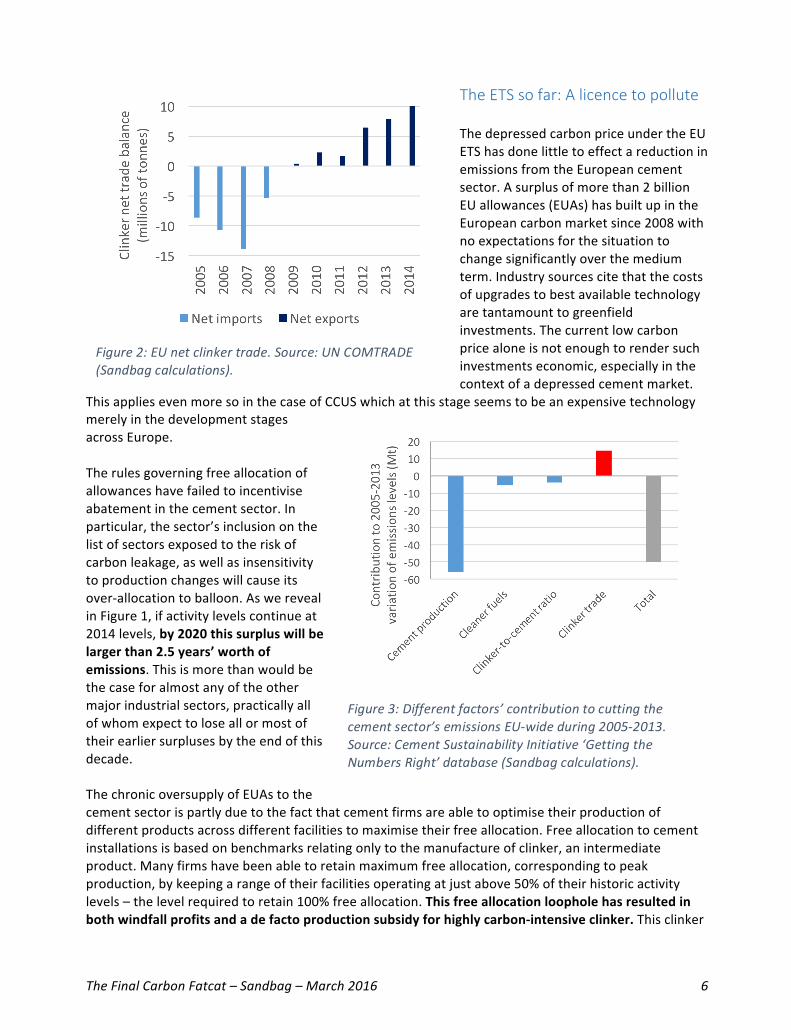
TheETSsofar:AlicencetopolluteThedepressedcarbonpriceundertheEUETShasdonelittletoeffectareductioninemissionsfromtheEuropeancementsector.Asurplusofmorethan2billionEUallowances(EUAs)hasbuiltupintheEuropeancarbonmarketsince2008withnoexpectationsforthesituationtochangesignificantlyoverthemediumterm.Industrysourcescitethatthecostsofupgradestobestavailabletechnologyaretantamounttogreenfieldinvestments.Thecurrentlowcarbonpricealoneisnotenoughtorendersuchinvestmentseconomic,especiallyinthecontextofadepressedcementmarket.
ThisappliesevenmoresointhecaseofCCUSwhichatthisstageseemstobeanexpensivetechnologymerelyinthedevelopmentstagesacrossEurope.Therulesgoverningfreeallocationofallowanceshavefailedtoincentiviseabatementinthecementsector.Inparticular,thesector’sinclusiononthelistofsectorsexposedtotheriskofcarbonleakage,aswellasinsensitivitytoproductionchangeswillcauseitsover-allocationtoballoon.AswerevealinFigure1,ifactivitylevelscontinueat2014levels,by2020thissurpluswillbelargerthan2.5years’worthofemissions.Thisismorethanwouldbethecaseforalmostanyoftheothermajorindustrialsectors,practicallyallofwhomexpecttoloseallormostoftheirearliersurplusesbytheendofthisdecade.ThechronicoversupplyofEUAstothecementsectorispartlyduetothefactthatcementfirmsareabletooptimisetheirproductionofdifferentproductsacrossdifferentfacilitiestomaximisetheirfreeallocation.Freeallocationtocementinstallationsisbasedonbenchmarksrelatingonlytothemanufactureofclinker,anintermediateproduct.Manyfirmshavebeenabletoretainmaximumfreeallocation,correspondingtopeakproduction,bykeepingarangeoftheirfacilitiesoperatingatjustabove50%oftheirhistoricactivitylevels–thelevelrequiredtoretain100%freeallocation.Thisfreeallocationloopholehasresultedinbothwindfallprofitsandadefactoproductionsubsidyforhighlycarbon-intensiveclinker.Thisclinker
Figure2:EUnetclinkertrade.Source:UNCOMTRADE(Sandbagcalculations).
Figure3:Differentfactors’contributiontocuttingthecementsector’semissionsEU-wideduring2005-2013.Source:CementSustainabilityInitiative‘GettingtheNumbersRight’database(Sandbagcalculations).

TheFinalCarbonFatcat–Sandbag–March2016 7
istheneitherblendedinhigherthannecessarysharesintocementor,asweshowinFigure2,actuallyexported,asEUcementsubsidisedbyfreeallowanceshasacompetitiveadvantagecomparedtomanufacturersoutsidetheETS.ThiscreatesanetimportofemissionstotheEU–thecompletereverseofthecarbonleakagethreatthatmanyindustrygroupshaveemphasised.AsweshowinFigure3,thisstimulationofclinkerexportstocountriesoutsidetheEUhasbeenthesinglemostdamagingfactortothedecarbonisationofthissector,pushing2013emissionsnearly15milliontonneshigherthantheycouldhavebeen.Aswellascausingasurgeinemissions,theinsufficientlyresponsivefreeallocationrulesleavecementcompaniesstronglyover-allocated.Table2showsthesurplusesweestimatethatthefivecementmajorshaveaccumulated(ormonetised)sincethebeginningofPhase2.Company 2008-2014surplus Value2 2014emissions
(Mill.EUAs) (Mill.EUR) (Mill.tonnes)Lafarge-Holcim 49.8 299.7 18.2Heidelberg-Italcementi 45.8 275.5 28.1CRH 31.9 191.8 10.3Cemex 26.2 157.5 8.0BuzziUnicem 10.4 62.5 7.3
Table2:Largestcementcompanies’surplusesandemissions(millionsofEUAs,eurosandtonnes).3
Source:EUTL(Sandbagcalculations).
Thesefive‘CarbonFatcats’fromthecementsectorhavecollectivelyreceivednearly€1billionworthofspareEUallowances(EUAs)forfreebetween2008and2014.Asthenumberoffreeallowancesavailabletoallindustryisfixed,over-allocationtocementcompaniesreducestheallowancesavailabletoothersectorsthatmightreallyneedprotection.TheETSthereforeprovidesfewincentivesforthesefirmstoinvestindecarbonisationtechnologies.Givenwidespreadexpectationsforanover-suppliedcarbonmarketwellintothe2020sand,consequently,alowcarbonprice,theopportunitycostofholdingontoallowancesisnegligiblewhencomparedtothehighcostofinvestmentinabatementtechnologies.UrgentneedtorevisethefreeallocationsystemIftheETSistoincentivisechangeinthecementsectoritneedstodeliverahighercarbonprice.Companiesmakeongoinginvestmentdecisionsonashort-termbasis.Thedistantprospectofhighcarbonpricesandashortageoffreeallowancesinthe2030sprovidesonlyaweakguideforinvestmentdecisionstoday,particularlyifproductionlevelsandcashflowareindecline.TheeasiestwaytoincreasetheshorttermcarbonpricesignalistomaketheETScarbonbudgetsmoreambitious,therebyreducingthemarketsurpluspre-and/orpost-2020.Thisremainsourleadrecommendation.
2CarbonpricefromMarch9,2016.3Weignoreoffsetusehere,becausetheEUTLstoppedreportinginstallation-leveldataaboutoffsetusein2013.BecauseoffsetsareentirelyfungiblewithEUAs,surpluseswouldbesignificantlyhigher,bothintermsofallowancesandmonetaryvalue.

TheFinalCarbonFatcat–Sandbag–March2016 8
However,irrespectiveofthequestionofambition,itisstillessentialthatpolicymakerschangethefreeallocationrulestomakethembothmoreresponsivetoproductionchangesandmoreinlinewithsectors’actualriskofcarbonleakage.Effectivereformcanbeachievedbyintroducingmoregranularproductionthresholdstoexistingex-postadjustmentstoallocationandbyshiftingfromabinarycarbonleakagesystem(withsectorseitheronorofftheleakagelist)toasystemthatrecognisesdifferenttiersofriskexposure.Thesearetwoofthemosteffectivetoolsforchangingthestatusquo.Moreresponsiveallocationwouldmitigatethegamingofproductionthresholdsandthewindfallprofitstofailingindustries.TieredfreeallocationwouldcontinuetoprotectEurope’smostleakageexposedsectors,notleastbyminimisingtheriskthatacross-sectoralcorrectionfactorwillbetriggered.Itwouldalsoavoidgivingfreeallowancestoinstallationsthatdonotreallyneedthem.NeedtoboostsupportinnovationsinindustrialabatementTheabovementionedreformsoftheETSwouldgoalongwayindrivingemissionreductions.However,theyareunlikelytoraisethecarbonpricetoalevelwhichcouldsupportthedevelopmentanddeploymentoftechnologiesthataddressthemostfundamentalobstacletofullydecarbonisingthecementsector–itsprocessemissions.WithoutCarbonCaptureandUtilisation/Storage(CCUS)therewillbenofutureinEuropeforthePortlandfamilyofcementsasthecapapproacheszerobymid-century.AnInnovationFundproposedforPhase4oftheEUETScouldstimulateinnovationinthisarea.However,wereiterateapreviousrecommendationthat,becausethisFundwouldbefinancedthroughtheauctioningofallowances,itwillneedtobecontainmoreofthemthancurrentlyproposedtocompensateforalowcarbonprice.Itwillalsoneedtobemoretargetedtowardsindustrialsectors.Wethereforere-emphasisethatitwillbenecessarytocontinuefundingthroughprogrammesdedicatingfixedamountsofmoneyforRD&Defforts(e.g.Horizon2020)orforinfrastructure(e.g.theEuropeanFundforStrategicInvestment).4WealsostandbyourearlierrecommendationthatMemberStatesshouldconsiderusingETSrevenuestosupportindeepdecarbonisationtechnologiesinindustrialsectorsthroughinstrumentssuchastheUK’scontractsfordifferenceorotherdiffusion-orientatedmeasures.5PolicymakersneedtocreatefurtherincentivesforthetwodecarbonisationleversbeyondthereachoftheETS–non-Portlandandcarboncapturingcements.Forinstance,sincetheETSregulatesthissectorbyfocusingonthedirectemissionsfromtheproductionofclinkerforPortlandcement,itisunabletorewardthemitigationopportunitiestobefoundintheproductionofotherformsofcement,ortoencouragemanufactureofcementsthatproducenegativeemissionsbyabsorbingcarbondioxidechemically.Unconventionallow-carboncementandconcreteproductswhichattainEuropeancertificationshouldbebackedbypublicprocurementprogrammesandenabledbyclimate-sensitiveproductstandardstosupportthetransitiontoagreenconstructionindustry.Thoughemissionsaredownoverallcomparedto2005,whentheETSwaslaunched,thisisthankstoacollapseindemandandtoincentivespromotingtheuseofrenewableenergy,suchastheRenewablesDirective(2009/28/EC),WasteFrameworkDirective(2008/98/EC)andLandfillDirectives(1999/31/EC).Thedecarbonisationofthecementsectorhasnotyetseriouslybegun.ItistimeforEuropetoprovidetheproperincentivestodevelopzero-carbonsolutionsforthefuture.Ifitdoesnot,othergeographicregionswilldeveloptheseproductsandprocessesforthemselves,hurtingthefuturecompetitivenessofEuropeanindustrymorethananydifferentialsinclimatepolicycould.
4‘Dischargingthepoliticalstorm’.5‘Financingdeepdecarbonisationinindustry’.

TheFinalCarbonFatcat–Sandbag–March2016 9
SUMMARYOFRECOMMENDATIONSSandbagadvocatesstrengtheningtheEU’sclimateambitionasthebestsolutiontoincreaseETSscarcity,raisethecarbonpriceandstimulatethetransitiontowardsalow-carboneconomy–bothgenerallyandinthecaseofthecementsector.Inadditiontothatwemakethefollowingmorespecificrecommendations:EmissionsTradingScheme(ETS):
• Stoptheaccumulationofsurplusallowancestocementcompaniesbymakingcarbonleakageprovisionssensitivetoactualrisk(tieredfreeallocation);
• Introducehighergranularityadjustmentstofreeallocationtoeliminateperverselyrewardingover-productionofhigh-carbonclinker;
• RecycleMemberStates’auctioningrevenuestofinanceindustrialabatement;• IncreasethesizeoftheInnovationFund;• IntroduceanMRVandcreditingmechanismforcarbonnegativeformsofcement.
Non-ETS:
• DevelopanEU-levelframeworktosupportthegenerationanddiffusionofinnovationinindustrialdecarbonisationthroughfixedsumsofmoneythatareunaffectedbyfluctuationsinthecarbonprice;
• HarmoniseEU-widelandfillregulations,aswellasregulationspermittingtheincinerationofthesenon-conventionalfueltypes;
• Phaseoutinefficientproductionfacilitiesthroughintroducingminimumefficiencystandards;• NarrowtherangeofallowableclinkersharesinPortlandcementsinEuropeannormsofcement
andconcrete;• ExtendtheEuropeannormsoncementandconcretebeyondtheparadigmofPortlandcement
andpromoteperformance-basedstandards;• Engageindemandcreationforlow-carbonandcarbon-negativecements.

TheFinalCarbonFatcat–Sandbag–March2016 10
1. INTRODUCTION:Cement–TheFinalCarbonFatcatSinceitsintroductionin2005,theEuropeanEmissionsTradingScheme(EUETS)hasregulatedemissionsofgreenhousegasesfromalllargepointsources,includingpowerandheavyindustry.OvertheyearsSandbaghastrackedtherelationshipbetweentheEUETSandemissionsfromthesectoritregulates.Weuncoveredthefactthatinindustrialsectorsoftenemissionswerewellbelowthelevelofallowancesgiventocompaniesforfree,andcoinedtheterm‘CarbonFatCats’torefertosuchover-allocatedcompanies.In2013newruleswereintroducedthatchangedthewayindustrialsectorsareallocatedallowances.Ourforwardprojectionsfromthatpointonshowedthatthemajorityofthefatcatswehadidentifiedinthepastbegantoslimdown.Onelargesector,however,stoodout,asitcontinuedtogrowsubstantiallyitssurplusemissions,nowandintothefuture:thecementsector.Cementisthemostwidelyusedman-madematerialintheworld,butitisalsoresponsiblefor5%ofworldwideman-madegreenhousegasemissions.6Ifthissectorwereacountry,itwouldcontributeasmuchcarbonpollutionasthewholeBelgianeconomy.Inthisreportweshowthat,ratherthanincentiviseemissionsreductions,thecurrentEUETSrulesareactingincounterproductiveways.Freeallocationofallowancestoindustryislimitedintotalvolume.Therefore,over-allocationtoanyonesectorleadstounderallocationtoothersthatmayneedmoreprotection.AfailuretoaddressthegrowingsurplusesinthecementsectorwilldamagetheETSasawholeandexacerbatetheriskofcarbonleakage,whereitgenuinelyexists.Urgentreformsareneeded,andthisreportcontainsclearrecommendationsthatmustbeimplementedintheforthcomingreviewoftheEUETSDirective.Emissionsaredowninthecementsectorthankstoreduceddemandandtoashifttowardscleanerfuelsthathasbeenbroughtonbysupplementarypoliciesthatsupportswitchingtowasteandbiomass.However,theETScapswilldeclinetozeroeventually.Thecementsectorhasanumberofadditionaloptionsavailabletoittofullyreduceitsemissions,butasyetthereareinsufficientpoliciestodriveinvestmenttowardssuchatransition.InadditiontohighlightingtheflawsintheETSrulesandhowtofixthem,thisreportalsoconsiderswhatmoreneedstobedonetosupportdeepdecarbonisation.Thesetechnologiesexistforcurrentcementproductionprocesses,aswellasfornewapproachesthat,thankstotheirrelianceondifferentfeedstocks,canpotentiallyturncementintoanetcarbonnegativeproduct.AboutthisreportInwritingthisreportSandbagusedin-housedataanalysisbasedonpubliclyavailabledatathatwecurateourselves.InadditiontotheEUETSTransactionLog(emissionsandfreeallocation),otherdatabaseswereliedonincludetheUnitedNationsComtrade(forcementandclinkertrade),theCementSustainabilityInitiative’s(CSI)‘GettingtheNumbersRight’(cementandclinkerproductionandemissions)andtheUSEnvironmentalProtectionAgency(fuelemissionfactors).Muchofouranalysisreliesonanumberofanalyticaltoolswehavedevelopedin-house.ThefirstoneoftheseallowsustoreconstitutewhatdeterminesPhase3freeallocationattheinstallation-level.Buildinguponitsoutput,wearealsoabletocalculate,withahighlevelofaccuracy,futurefreeallocationunderavarietyofpolicyscenarios–alsowithinstallation-levelgranularity.Anotherspin-offsofourworkonPhase3allocationallowustoidentifyvariationsinactivityandinstancesofpartialcessationorclosureattheinstallationlevel.(ItisbrieflydescribedintheAnnex.)6LowCarbonTechnologyPartnershipsinitiative.(2015)Cement(link).

TheFinalCarbonFatcat–Sandbag–March2016 11
WearegratefultotheEuropeanClimateFoundationforfundingthiswork.2. CEMENTINCONTEXTTheproductionofcement(NACE23.51)isthethirdbiggestindustrialsectorintermsofemissions(Figure4).Followingafallinproductionofnearly41%asaresultoftheeconomiccrisessince2008,thecementsector’semissionsaredownby33%relativetoa2007peak.However,asweshowinthisreport,thisfallinemissionsisnotduetomitigationactionpromptedbytheEUETS.
Figure4:2014cementemissionsrelativetootherindustrialsectors(allsectorsdepictedcover75%ofindustrialemissions).Source:Source:EUTL(Sandbagcalculations).
Figure5:Trendsinthecementsectorsince2005.Sources:EUTL(Sandbagcalculations),Cembureau.7
In2014,ETSemissionsfromcementproductionstoodatslightlyover114Mt(justover6.3%ofallETSemissions,andjustover15%ofallnon-poweremissionsundertheETS).AsshowninFigure6,in2014,nineEUMemberStates(MSs)accountedfornearly77%ofemissions-withGermany,SpainandItalyinthelead.Corporateownershipismuchmoreconcentrated:onlyfiveentitieswereresponsibleformore
7Cembureau’sfiguresconsistentlyrepresentthesame28countries,whereastheEUTLdataonlycapturesemissionsascountriesjointheEU.
0% 2% 4% 6% 8% 10% 12% 14% 16% 18% 20%
InorganicchemicalsAluminium
PaperLimeandplaster
PetroleumextractionFertilisers
OrganicchemicalsCement
IronandsteelRefineries
146.4 150.1169.0
157.9
126.5 124.4 122.2 114.7 108.3 112.8245.9261.2 268.4
250.0
208.2191.3 191.3
169.9 157.1 158.7
0
50
100
150
200
250
300
020406080100120140160180
2005 2006 2007 2008 2009 2010 2011 2012 2013 2014 Milliontonn
esce
men
tprodu
ced
MtC
O2em
issions
Totalemissions(EU-28) EU-28cementproduction

TheFinalCarbonFatcat–Sandbag–March2016 12
than80%ofthissector’sgreenhousegas(GHG)emissions.Thesecompaniesowned8138ofthe232cementproducinginstallationslistedintheEUTLduringthe2014complianceyear.
Figure6:Countrieswiththehighestsharesof2014ETSemissionsfromthemanufactureofcement.Source:EUTL(Sandbagcalculations).
Figure7:Companieswiththehighestsharesof2014ETSemissionsfromthemanufactureofcement.Source:EUTL(Sandbagcalculations).
3. LEVERSFORDECARBONISINGCEMENTThevaluechainforwhatisconventionallyreferredtoas“thecementsector”revolvesaroundaproductparadigmdefinedbythePortlandprocess.AsdepictedinFigure8,thisprocessextendsfromlimestonetoconcrete.Thevastmajorityofdirectemissionsinthisvaluechainoccuruptothestageofproductionofclinker.Twothirdsoftotalemissionsemanatefromthecalcinationprocess,i.e.thechemicaltransformationoflimestoneintolime.These“processemissions”areinherenttotheproductionoflimeandarethereforeunavoidableinthecaseofPortlandcement.Theremainingthirdofemissionsarethermalemissionsstemmingfromthecombustionoffuelstocreatetheheatrequiredforthiscalcinationandtheheatrequiredforthefurthertransformationoflimeintoclinkerinkilns–aprocesscalledsintering.Relativelylittledirectemissionsoccurfurtherdownstream.Figure8depictssixmajorleversforachievingemissionreductionsfromthecementsector:applyingcarboncaptureandusageorstorage(CCUS)toprocessemissions;increasingkilnenergyefficiency;usingalternativefuels;substitutingclinkerwithothermaterials;usingnon-Portlandcements;anddevelopingcementsthatcanactuallycapturecarbon.Ofthese,theEU’semissionstradingscheme(ETS)candirectlyincentiviseonlythefirstfour.Additionalpoliciesareneededtotriggertheothers.Section6ofthisreportlooksatthedifferentleversfordecarbonisingthecementsectorinmoredetail.
8By“owned”wemean“heldatleast50%ofshares”.
17.1%
12.2%
11.7%
8.4%8.3%5.4%
5.3%4.2%4.0%
23.3%
Germany
Spain
Italy
Poland
France
UnitedKingdomGreece
Portugal
Romania
Other
28.1
27.5
10.38.07.3
44.1
Heidelberg-Italcementi
Lafarge-Holcim
CRH
Cemex
BuzziUnicem
Other

TheFinalCarbonFatcat–Sandbag–March2016 13
Figure8:SchematicrepresentationofthePortlandcementparadigm.Note:Red=emissionssources.Lightgreen=decarbonisationleversforPortlandcement.Darkgreen=decarbonisationleversfornon-Portlandcement.
4. CEMENTUNDERTHEETS4.1. IneffectivedecarbonisationincentivesPhase3rulesonfreeallocationhaveturnedtheETSintoaproductionsubsidyforclinker–amaterialwithhighembeddedcarboncontent.Thisishugelycounterproductivefordecarbonisingthecementsector.TounderstandwhythishasoccurreditiscrucialtograspthattheETS,thoughnominallyregulatingthecementsector,islargelyfocusedontheproductionofclinker.Bothmeasuresdeterminingfreeallocation,i.e.historicalactivitylevelsandproductbenchmarks,referonlytothisstageofthevaluechain.AlthoughEuropehasindeedsteadilyimprovedtheefficiencyofclinkerproduction(Figure9)thishasverylittletodowiththeETS(seesections6.2and6.3fordetails).Furthermore,datafromtheCSIrevealsthat,insomeregionsoutsideEurope,performanceisbetterthantheEUaverageandthatlaggardregionsarecatchingup.WeacknowledgethatCSIcovers96%ofEuropeancementproductionwhereasthecoverageismuchmoreseverelyrestrictedinotherregions.However,thepointstillholds-theEuropeanaverageefficiencyisbeingheldbackwhilemuchmoreefficiententitiesareemergingelsewhere.WhileEuropemaybeamongtheworld’sleadersinthecarbonefficiencyofclinkerproduction,theefficiencygainsinFigure9areonlyanimprovementof9%relativeto1990.Thisiswhytheemergenceofincentivestooverproduceiscauseforalarm.AsweshowinFigure10,clinkerandcementproductionhistoricallyusedtoevolvehand-in-handuntil2011.However,since2012thetrendhasbeentooverproduceclinkerrelativetocement.Insection6.4weshowthatinsomecountriesthisextraclinker

TheFinalCarbonFatcat–Sandbag–March2016 14
hasgoneintocement,increasingtheproportionofclinkershareinthefinalproduct.Theremainingexcessclinker,asFigure10reveals,hasgoneabroad.
Figure9:RegionaltrendsingrossCO2efficiencyofgreyclinkerproduction.Source:CSI2013(dataset59cAG).
Figure10:Divergenceinclinkerandcementproduction(2009level=100%),againsttheEU’snetclinkertradewiththenon-EUworld.Source:CSI2013(datasets8TG,21TGWcm)andUNCOMTRADE.
Theseexportsofclinkerareanoticeabledragondecarbonisingthesector.AsweshowinFigure12,in2013,thelatestyearforwhichdataoncementproductionparametersisavailable,theproductionoftradedclinkerhaspushedthesector’semissions15milliontonnesabovewhattheywouldhavebeenifthetradebalancehadbeenthesameasin2005.WeshowbelowhowtheETShasdriventhisincreaseincementsectoremissions.
800
850
900
950
1,000
1,050
1,100
1990 2000 2010 2012 2013
kgCO2/tgreyc
linker
EU28 China IndiaCIS MiddleEast NorthAmericaSouthAmericaex.Brazil
2005 2006 2007 2008 2009 2010 2011 2012 2013-15
-10
-5
0
5
10
70%
80%
90%
100%
110%
120%
130%
140%
Clinkern
ettradebalance
(millionsofton
nes)
Prod
uctio
nrelativ
eto2009
Netimports(rightaxis) Netexports(rightaxis) Clinkerproduction Cementproduction

TheFinalCarbonFatcat–Sandbag–March2016 15
Wetracethistendencytowardsoverproductiontonewrulesthatwereintroducedin2013.Thesereducefreeallocationifclinkerproductiondipsbelowcertainthresholdsinapreviousyear(seesection4.2fordetails).Inthecaseofthecementsectortheserulescreateastrongincentivetokeepclinkerproductionlevelsjustabovethosethresholdsinordertocapturefreeallocationinfull.Farfromexposingthesectortocarbonleakage,theETShasincentivisedtheimportationofcarbonemissionstoserveothermarketsbycreatingasubsidyforEuropeanproducers.
Figure12:ExpecteddevelopmentofallowancesurplusesformajorindustrialsectorsuntiltheendofPhase3.Source:EUTL(Sandbagcalculations).
Figure13:EstimatedscaleofallowancesurplusesbyendofPhase3forthefivelargestcementmanufacturersof2014.Source:EUTL(Sandbagcalculations).
Thispossibilitytogainfreeallocationbyoverproducingacarbon-intensivematerialmeansthatthecementsectorcanactuallystillincreaseitssurplus–unlikeothersectorswhichlostthisabilityin2013
0.0
1.0
2.0
3.0
2008
2009
2010
2011
2012
2013
2014
2015
2016
2017
2018
2019
2020
Years'worthofspareEUA
s
Phase3 Cement
Limeandplaster Ironandsteel(EUTL)
Refineries Paper
Organicchemicals Inorganicchemicals
0
10
20
30
40
50
60
702008
2009
2010
2011
2012
2013
2014
2015
2016
2017
2018
2019
2020
MillionEU
As
Phase3 Lafarge-Holcim
Heidelberg-Italcementi Cemex
Buzzi CRH
Figure11:Differentfactors’contributiontocuttingthecementsector’semissionsEU-wideduring2005-2013.Source:CementSustainabilityInitiative‘GettingtheNumbersRight’database(Sandbagcalculations).

TheFinalCarbonFatcat–Sandbag–March2016 16
whenharmonisedproductbenchmarkswereintroduced.Figure12revealsthatthissurpluswillcontinuetogrowineachyearofPhase3–althoughataslowerpacethaninPhase2.9Thisfindingalsoholdsforthelargestcompaniesinthissector,our‘CarbonFatcats’.Thesehavemanagedtoaccumulateconsiderablesurplusessince2008(seeTable3)and,asweshowinFigure13,theirsurplusesmostlycontinuerisingtowards2020.10Thiscreatesaproblemforincentivisingdecarbonisation.Thepricesignalcannotgetthroughwhentheregulatorallocatesmoreallowancesthantherearecorrespondingemissions.Company 2014surplus Value(March9,2016) 2014emissions
Mill.EUAs Mill.EUR Mill.tonnesLafarge-Holcim 49.8 299.7 18.2Heidelberg-Italcementi 45.8 275.5 28.1CRH 31.9 191.8 10.3Cemex 26.2 157.5 8.0BuzziUnicem 10.4 62.5 7.3
Table3:Scaleoflargestcementcompanies’surplusesandemissions(millionsofEUAs,eurosandtonnes).Source:EUTL(Sandbagcalculations).
Figure14:ExpectedsurplusvolumesforcementsectorcompaniesacrossEUMSs–nowandinthefuture.11Source:EUTL(Sandbagcalculations).
9Wepresentsurplusesintermsoftheyears’worthofemissionstheycouldcovertoaccountfordifferencesinsectorsizes.Emissionsareheldconstantat2014levels.10Weacknowledgesomeofthesecompanies’statementsabouthavingsoldofflargepartsofthesesurpluses.Howeverwepointouttwothings:first,thattheyhavereceivedtens,ifnothundreds,ofmillionsofeurofortheseallowances,andsecond,asFigure13implies,therisingslopeofthesurpluscurvesduringPhase3meansthattheycouldrebuildthesesurplusesfromscratchtowards2020.11Futureemissionsareprojectedforwardatconstant2014levels.
-60
-40
-20
0
20
40
60
80
AT BE BG CY CZ DE DK EE ES FI FR GB GR HR HU IE IS IT LI LT LU LV NL NO PL PT RO SE SI SK
MillionsofE
UAs
2014 2020 2030

TheFinalCarbonFatcat–Sandbag–March2016 17
AllowancescontinuetobeallocatedinfulltocompaniesinthecementsectorallacrosstheEUdespitesubstantialfallsinproduction,triggeringchronicsurplusesacrosstheEU(Figure14).ParticularlyegregiousarethecasesofItalyandSpain,wheresurplusesareexpectedtototalover60millionEUAsevenin2020.AlthoughtheCommission’sProposalfortheETSReviewwouldreducetheamountofallowancesallocatedtocementcompanies,aroundhalfofthesevolumescouldpersistuntil2030inthesetwocountries.Morepressingthantheproblemofsurplussizesistheproblemofhowmanyyears’worthofemissionsthesesurplusescouldcover.UnderthecurrentProposal,notonlyinItalyandSpainbutinthemajorityofMSs,thesesurplusescouldinfactlastallthewayto2030,atwhichpointtheywouldstillcoververymanyyears’worthofemissions(seeFigure15).ThismeansthatthesystemoffreeallocationforPhase4mustberadicallyrevisedifincentivestodecarbonisearetoreturntothissector.
Figure15:ExpectedyearsofemissionssurplusescouldcoverforcementsectorcompaniesacrossEUMSs–nowandinthefuture.12Source:EUTL(Sandbagcalculations).
Therearetworeasonswhythecementsectorissostronglyover-allocatedrelativetoothers.First,thevolumeofallowancesitreceivesforfreeisdisproportionatetoitsexposuretothecarbonleakagerisk.Second,itretainsafartoolargevolumeofallowancesinspiteofsignificantfallsinproduction.Belowweexplorethesecausesandhowtosolvethem.4.2. Problem1:Toolittleadjustment4.2.1. CauseThecurrentrulesadjustinginstallations’freeallocationaretoocoarseandmustbechanged.AsofPhase3,ETSinstallationsreceivefreeallocationinproportiontotheirrespectivehistoricactivitylevel.Thisisdeterminedex-antebeforethePhaseevenbegan–lockinginfreeallocationforallyearsuntil2020.So,12Futureemissionsareprojectedforwardatconstant2014levels.
-6
-4
-2
0
2
4
6
8
10
12
AT BE BG CY CZ DE DK EE ES FI FR GB GR HR HU IE IS IT LI LT LU LV NL NO PL PT RO SE SI SK
Yearssurplusesstillexpectedtolast
2014 2020 2030
TheFinalCarbonFatcat–Sandbag–March2016 18
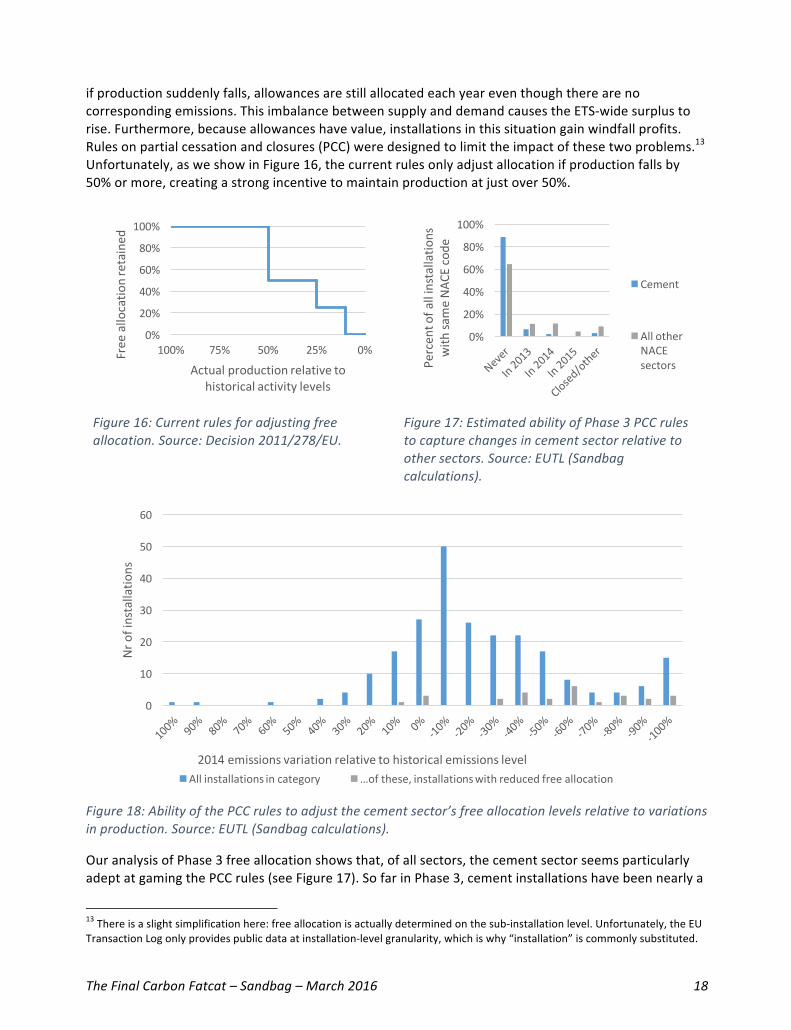
ifproductionsuddenlyfalls,allowancesarestillallocatedeachyeareventhoughtherearenocorrespondingemissions.ThisimbalancebetweensupplyanddemandcausestheETS-widesurplustorise.Furthermore,becauseallowanceshavevalue,installationsinthissituationgainwindfallprofits.Rulesonpartialcessationandclosures(PCC)weredesignedtolimittheimpactofthesetwoproblems.13Unfortunately,asweshowinFigure16,thecurrentrulesonlyadjustallocationifproductionfallsby50%ormore,creatingastrongincentivetomaintainproductionatjustover50%.
Figure16:Currentrulesforadjustingfreeallocation.Source:Decision2011/278/EU.
Figure17:EstimatedabilityofPhase3PCCrulestocapturechangesincementsectorrelativetoothersectors.Source:EUTL(Sandbagcalculations).
Figure18:AbilityofthePCCrulestoadjustthecementsector’sfreeallocationlevelsrelativetovariationsinproduction.Source:EUTL(Sandbagcalculations).
OuranalysisofPhase3freeallocationshowsthat,ofallsectors,thecementsectorseemsparticularlyadeptatgamingthePCCrules(seeFigure17).SofarinPhase3,cementinstallationshavebeennearlya
13Thereisaslightsimplificationhere:freeallocationisactuallydeterminedonthesub-installationlevel.Unfortunately,theEUTransactionLogonlyprovidespublicdataatinstallation-levelgranularity,whichiswhy“installation”iscommonlysubstituted.
0%
20%
40%
60%
80%
100%
0%25%50%75%100%Freeallocatio
nretained
Actualproductionrelativetohistoricalactivitylevels
0%
20%
40%
60%
80%
100%
Percen
tofa
llinstallatio
ns
with
sameNA
CEco
de
Cement
AllotherNACEsectors
0
10
20
30
40
50
60
Nrofinstallatio
ns
2014emissionsvariationrelativetohistoricalemissionslevelAllinstallationsincategory …ofthese,installationswithreducedfreeallocation

TheFinalCarbonFatcat–Sandbag–March2016 19
thirdmorelikelytoreapwindfallprofitsduetothedesignlimitationsofPCCrulesthaninstallationsinanyothersector.Conversely,installationsinallothersectorshavebeenmorethanthreetimesaslikelytosufferPCCadjustmentsatleastonce.PCCrulesseemparticularlyill-suitedforcopingwiththerangeofchangesthathappeninthecementsector.AswealsoshowinFigure18,mostcementsectorinstallationsexperiencevariationsinactivitylevelsthatarebelowthefirstthresholdofthecurrentrulesforwithholdingallowances.14Thefiguregroupsallcementinstallationsintocategoriesbasedonhowmuchtheyhavedivergedfromtheirhistoricalactivitylevels.ItthenalsorevealshowmanyinstallationsthePCCruleshaveactuallycapturedineachcategory.Thedifferencebetweenthosetwovaluesinabsolutelyallcategoriesunequivocallyshowshowpoorlytheseruleslimitsurplusesandwindfallprofitsinthecementsector.Thepoordesignoftheserulesmeansthatemissionsinthecementsectorareactuallyhigherthantheyneedtobe.Largecompaniesthatownmultiplekilnsareabletooptimiseproductionlevelsacrossmultipleinstallationsinordertoget100%freeallocationeventhoughmost,ifnotall,installationsarenotrunningatfullcapacity.Thiskeepsinefficientinstallationswithhighcarbonintensityrunning.AsweshowinFigure19,thevariationinactivitylevelsbetweenpre-crisisyearsand2013inthemostefficientthreecategoriesofkilnsislargerthanthetotal2013productionvolumeintheleastefficientkilns.ThismeansthatthereismorethanenoughefficientproductioncapacityintheEUtomakeinefficientkilnsredundant,butthecrudePCCrules,bygivingtheseinstallationsmillionsofeurosworthallowances,keeptheseinstallationsemittingCO2.
Figure19:Greyclinkerproductiontypeovertime.Source:CSI2013(dataset8TGK).
14BecausetheEUTLdoesnotofferdataoninstallations’activitylevels,wehadtorelyonemissionsasaproxyforactivity.UsingthemethodologydescribedintheBenchmarkingDecision,relyingyearlymeanvalues,wecalculated“historicalemissionslevels”foreachinstallationinthecementsector.Figure18compares2014emissionsagainsttheselevels.
-
50
100
150
200
250
1990 2000 2005 2006 2007 2008 2009 2010 2011 2012 2013
Milliontonn
esofgreyclinker
WET/SHAFTKILN SEMI-WET/SEMIDRY
MIXEDKILNTYPE DRYWITHOUTPREHEATER(LONGDRYKILN)
DRYWITHPREHEATERWITHOUTPRECALCINER DRYWITHPREHEATERANDPRECALCINER

TheFinalCarbonFatcat–Sandbag–March2016 20
4.2.2. Solution:IntroduceahighergranularityoffreeallocationadjustmentsWebelievethatintroducing10%adjustmentstofreeallocationforeach10%variationinactivitylevels,asdepictedinFigure20,wouldbethemosteffectivewayofdealingwiththisproblem.Suchachangewouldnotonlybeabletodealwithsuchproblemsnomatterwhatsectortheyappearin,butwouldalsoallowforincreasingfreeallocationincaseproductionrisesabovethehistoricalactivitylevels–
somethingthatisnotpossibleundercurrentrules.4.2.3. ExpectedresultsWecalculateinFigure21that,ifsuchruleshadbeeninplacealreadyatthebeginningofPhase3,thenetresultafteralsoallocatingallowancesforinstallationsexperiencinggrowthwouldhavebeentowithholdnearly180millionEUAsoverthedurationofthePhase–almost5timesmorethanweestimatewerewithheldunderthecurrentrules.Thiswouldnotonlyhavedampenedcementsurpluses,but,beingsuchanenormousvalue(afifthofallfreeallocationforallstationaryETSsectorsforoneyear),wouldalsohavegonealongwaytowardsreiningintheoverallETSsurplus.
Figure21:EstimatednetadjustmenttothevolumeofallowancesallocatedtocementsectorifSandbagproposalwereintroducedfromthebeginningofPhase3.
AtSandbagweexpectthemarketsurplusin2020tostillbearound2billionallowancesaftertheMSRhasacted.BetterPCCruleswouldhavewithheldnearly10%ofthatvolumefromthecementsectoralone.Thisrepresentsahugemissedopportunity–andwestronglyrecommendincludingsuchprovisionsintothedesignofPhase4freeallocation.
36.3
179.6
0
50
100
150
200
2013 2014 2015 2016 2017 2018 2019 2020 Phase3total
Millionsoffreely
allocatedEU
As
Norules Currentrules Alternativerules Nowwithheld Missedopportunity(net)
Figure20:SuggestedrulesforPhase4freeallocationadjustments.Source:EUTL(Sandbagcalculations),Sandbagproposal.

TheFinalCarbonFatcat–Sandbag–March2016 21
4.3. Problem2:Toomuchallocation4.3.1. CauseIfthecementsectorwerereceivingfreeallocationinaccordancewiththesameprinciplesasmostotherindustrialsectors,thevolumeitwouldgetwouldbemuchlower.TheETSgrantsfreeallocationinordertoshieldedsectorsagainstunfaircompetitionfromjurisdictionswherenocarbonpriceisimposedandtherebypreventrelocationofindustryawayfromEurope,i.e.carbonleakage.ToqualifyforprotectionagainstcarbonleakageriskinPhase3,sectorsneededtomeetminimalcarboncostintensityandtradeintensitycriteria.Cement,aswellastherelatedlimeandplastersector,weretheonlytwoactivitytypesthatwereplacedonthecarbonleakagelistduringPhase3duetotheircarboncostintensityalone.Theyinfactdidnotmeettheminimumthresholdforthetradeintensitycriterion,andthereforearetreatedasafullyleakage-exposedsectorduetoaDirectivearticleestablishinganexceptionfromthegeneralrule.Asaresult,thecementsectorisentitledtoapplytoreceive100%ofitsbenchmarkedfreeallocationforfree,insteadofonlyaprogressivelydiminishingsharethereof.Besidesdilutingtheeffectofthecarbonprice,anothernegativeconsequenceofplacingsuchlargesectorsonthesamefootingasothersintermsofleakageriskisthatallindustrialsectors’freeallocationsuffers.Onlyalimitedamountofallowancesisavailableforfreeallocation.Unfortunately,thePhase3listofrisk-exposedsectorsisovercrowded,soitwasnotpossibletograntallinstallationstheirfullapplication.Thishasresultedintheenforcementofacross-sectoralcorrectionfactor(CSCF)–amathematicalhaircutappliedtoallfreeallocationapplicationswhichuniformlyreducestheamountofallowancesacrossallrecipientstofittheavailableceilingonfreeallocation.Highlyrisk-exposedsectorsareextremelycriticaloftheCSCF,asitresultsinthemreceivinglessprotectionthantheirbenchmarkedentitlement.4.3.2. Solution:AdoptatieredsystemofleakageprotectionPolicy-makersshouldacknowledgethat,duetodifferencesinriskexposure,thecementsectoralongwithothersectors,mightneedfewerallowancesinPhase4thanotherindustrialsectors.WesupporttheCommission’sideatomoveinPhase4frombinaryleakageprovisions(eitheronoroffthelist)toanapproachrecognisingthatsectorsfallintodifferenttiersofprogressivelydiminishingrisk.Underthisapproach,eachactivitytype’sriskexposurewouldbeassessedbycombiningitstradeandemissionsintensityintoasinglemetric.TheCommissionsuggestsfourtiers.Thelessrisk-exposedthetiertowhichaninstallationbelongs,themoreitsapplicationforfreeallocationwouldbereduced–withonlythehighesttiereligibletoreceive100%ofitsapplication.4.3.3. ExpectedresultsAtieredsystemwouldswiftlyreducethecementsector’ssurplus.Thisisbecause,whileitisahighlycarbonintensivesector,ithasamuchlowertradeintensitythanothers.Onewouldthereforeexpectittofallintoalowerrisktier.TheCommission’sImpactAssessmenttotheETSreviewestimates,basedondatathatisnotpublicallyavailable,thecementsectorwouldhaveitsapplicationreducedto80%.Sandbag,basedonpublicallyavailableinformation,expectsareductionto60%.15AsweshowinFigure
15Neitherofthesevaluesaredefinitive,asthedatausedtodeterminetradeintensityislikelytochangeinthefuture.

TheFinalCarbonFatcat–Sandbag–March2016 22
22,adoptingatieredapproachcouldsignificantlybringforwardthedatebywhichcementmajorswillhavetointernalisetheenvironmentalcostoftheiractivitiesandceasetobemerecomplianceactors.16Theadditionalbenefitofatieredfreeallocationsystemwouldbethatallowances,whichwouldotherwisebeallocatedtocement,wouldbecomeavailabletoothersectors.Consequently,sectorsatthehighestriskofcarbonleakagecanapplyfor100%oftheirbenchmarkedfreeallocationwithoutfearingthatthiswouldtriggertheapplicationoftheCSCF.AsweshowinTable4,thesevolumescanbequitesubstantial.Therefore,aswellasincentivisinglow-carboninvestmentincement,tieringcanhaveveryconcreteco-benefitsfortheprotectionofrisk-exposedsectors–allwhileavoidinganyviolationoftheenvironmentalintegrityofthePhase4package.
Figure22:ImpactofbinaryversustieredleakageprovisionsonthesurplusesoflargestfiveEUcementcompanies(Sandbag’sriskassessment).Source:EUTL(Sandbagcalculations).
Tierforcement Metric
Growthscenario+2% +1% +0%
80%MillionEUAsmadeavailabletoothersectors 197.3 190.6 184.1…asshareofallPhase4freeallocation 3.1% 3.0% 2.9%
60%MillionEUAsmadeavailabletoothersectors 394.6 381.2 368.3…asshareofallPhase4freeallocation 6.3% 6.1% 5.6%
Table4:Volumesre-channelledfromcementtoothersectors,asafunctionofcement’sriskexposureandoverallindustrialgrowth.Source:EUTL(Sandbagcalculations).Note:Industrialgrowthisyear-on-year,andcontinuesuninterruptedlyfrom2014onward.
5. SUPPORTINGINNOVATION
16RefertoFigure12toseehowtheseearlierdatesarestillsignificantlylaterthantheyearswhensurplusesareexhaustedinothersectors,e.g.refineries,steelororganicchemicals.
2020 2021 2022 2023 2024 2025 2026 2027 2028 2029 2030
Lafarge-Holcim
Heidelberg-Italcementi
Cemex
BuzziGroup
CRH
Years
Notiering:freeallocation Tiering:freeallocation Notiering:Verifiedoffsetuse
Tiering:Verifiedoffsetuse Notiering:Stillavailableoffsetuse Tiering:Stillavailableoffsetuse

TheFinalCarbonFatcat–Sandbag–March2016 23
Unlikedecarbonisationthroughtheuseofrenewableenergyinpower,heatandtransport,thelandscapeforsupportingthedecarbonisationofindustryismuchsparser.Thelackofincentivesforinnovationandinvestmenthasforcedallindustrialsectorstofocustheirrequestsaboutclimatepolicyoncompensationpaymentsintheformoffreeallocation.Thedistortionshighlightedintheprevioussectionclearlydemonstratethatadifferentapproachisrequiredtobreaktheimpassepreventingdeepdecarbonisation.TheproposedInnovationFundcanpotentiallyalleviatesomeoftheshortcomingsoftheETSindrivingtechnologicalchange.Intheabsenceofprospectsforahighcarbonprice,industryboardroomsdonotfeelthatitisjustifiabletoinvestintoRD&Dforexpensivetechnologiesforcuttingprocessemissionsorforcreatingcarbon-negativeproducts.TheInnovationFundcanactasanalternativesourceoffundingforfirst-of-a-kindprojectsinindustrialabatement.OvercapacityintheEuropeancementsectorandtheresultingshortfallininvestmentforlongtermdecarbonisationprojectsmeansthatEUfundingisparticularlynecessaryforstimulatingdecarbonisationinthesector.Despitethispromise,wefearthatthevolumeofallowancesintheFundwillnotbesufficienttomakeadifference.TheNER300,theequivalentoftheInnovationFundinPhase3,containedonly300millionallowances,equivalentto37.5millionallowancesperyear.Forthe10yearsofPhase4,theInnovationFundwouldaward40millionallowancesperyear.17SincewedonotexpectthecapandtheMSRtoresolvetheproblemofoversupply,weanticipatethatallowanceswillfetchverylittlerevenuewhenmonetised.Weareconcernedthatthefinancewillbespreadtoothinlyand,aswithNER300,bebiasedtowardslow-budgetprojects,especiallyastheInnovationFundalsohastofinancerenewablesandCCSinadditiontoindustrialabatement.RecognisingtheneedtotightenthecapandtoavoidundulyincreasingsupplythrougharaidontheMSR,wethereforeadvocatealteringthebreak-downofthePhase4capsothatmoreallowancesareplacedintotheFund.However,itwouldbedangeroustoentrustthefinancingofexpensive,yetvital,RD&Dintolow-carbonproductsandproductionmethodsentirelytofundsraisedbyauctioningallowances.Thisisbecausethevolumeoffinancingavailablewouldrenderedunpredictablebycarbonpricefluctuations.Tocircumventthisvolatilityproblem,EU-levelprogrammeswithpre-determinedbudgetsshouldbedrawnuptofinancesuchprojects.Accordingly,theEUshouldplantoincludeindustrialabatementprojectsunderthepost-2020continuationsoftheEuropeanFundforStrategicInvestmentsandHorizon2020.6. OVERVIEWOFDECARBONISATIONOPTIONSInthissectionwetakeamoredetailedlookatthedifferenttechnologicaloptionsforreducingemissionsfromcementproductionincludingusingalternativematerials.Alone,evenareformedETScannotbereliedupontobringaboutthenecessaryinvestmentinlowcarbontechnologies.Wehaveincludedspecificnon-ETSrecommendationstoincentivisetheuptakeofthesetechnologieswhereverwehavebeenabletoidentifythem.ThesesupplementourcorerecommendationsaboveonfixingtheincentiveswithintheETS.
17WeareawarethatinfacttheauctioningoftheallowancesintheNER300wasfrontloadedtothebeginningofPhase3,andthatthescheduleformonetizingallowancesintheInnovationFundhasnotbeensetyet.Therefore,thesefiguresaremeanttomerelyillustratetherelativeimpactofdifferentvolumesofallowancesinphasesofdifferentlengths.

TheFinalCarbonFatcat–Sandbag–March2016 24
6.1. IndustrialCCSCCUShasthelargestemissionsabatementpotentialofanytechnologyfordecarbonisingtheconventionalcement-makingprocess.TotalemissionsfromPortlandcementmanufacturecannotbereducedbymorethan30%withoutusingCCSsincethatistheshareofemissionsresultingfromthermalemissions.TheremainingsharecomesfromprocessemissionsunavoidableunderthePortlandparadigm,andthereforetheseprocessemissionsmustbecaptured.Unfortunately,retrofittingcementplantswithcarboncaptureisoftendifficultandexpensive.Industrysourcesindicatethatintegratingcarboncaptureintonewplantswilldoubleconstructioncostsandincreaseproductioncostsby40-90%pertonneofclinkeroncetransportandstoragecostsaretakenintoaccount.18Also,somelargercementplantsarelocatedatconsiderabledistancesfrompotentialstoragesites.19Wethereforerecommend:
• GrantingfurthersupportfortheRD&Dofcarboncaptureincement.
• DevelopingpoliciessupportingthegrowthofaEuropeansectorforthetransportationandstorageofcarbon.
6.2. FuelswitchingSwitchingfromthetraditionalsourceofthermalenergyforcementplants,suchaspetcokeandcoal,toalternativeenergysourcescanreducethermalemissions(Figure23).Co-incineratingbiomassincementkilnsisapopularwayofreducingETSemissionsandhasbroughtnetCO2intensityfromofgreyclinkerproduction9%belowgrossin2013.TheRenewablesDirective(2009/28/EC),WasteFrameworkDirective(2008/98/EC)andLandfillDirectives(1999/31/EC)havecreatedindirectincentivesforcementmakerstousealternativefuelssuchasbiomassorpre-treatedwastesourcedfromotherindustriesfaceincreasinglandfillingcostsfortheirwastes.Thishasled,asweshowinFigure24,toastrongdivergencebetweengrossandnetcarbonintensityintheEU,markedlyimprovingitsaverageperformancerelativetootherareaswhencomparedtothesituationongrossemissionsintensity(Figure9,onpage14).
18ECRA.(2009).TehcnicalreportonCCS(p.6)(link).19TheEuropeanLimeAssociation.(2014).ACompetitiveandEfficientLimeIndustry(p.41)

TheFinalCarbonFatcat–Sandbag–March2016 25
Figure23:Directemissionfactorsfordifferentfueltypes.Note:MSW=municipalsolidwaste.Source:USEPA2015(link).
Figure24:RegionaltrendsingrossCO2efficiencyofgreyclinkerproduction.Source:CSI2013(datasets71AGand59cAG).
Decarbonisationwouldproceedfasteriftherewereamoreharmonisedapproachtotheuseofalternativefuelsandbiomass.During2005-2013theaverageshareofthermalenergyobtainedfromincineratingwaste-derivedfuelsandfrombiomassinEUcementinstallationsmorethandoubledandtripledrespectively(Figure25).However,theeconomicsofco-incineratingwaste-derivedfuelsdependontheavailabilityofwasteprocessinginfrastructure,therelativecostoffuelsandonnationally-determinedlandfillingtaxeswhichvaryconsiderablybetweendifferentMSs.20AsweshowinFigure26,progressonfuelswitchinghasbeenunevenacrosstheEU–withsomeWesternEuropeancountries,whichweexpectedtobeveryforwardthinkingonclimatepolicy,laggingbehindEasternEuropeanMSs.
Figure25:Thermalenergyconsumptionpertonneofclinkerbyfueltype.Basedongreyclinker
Figure26:Weightedaveragesfortheuseofalternativefuelsandbiomassinthethermal
20ETC/SPC.(2012).OverviewoftheuseoflandfilltaxesinEurope.(link)
4.063.75 3.72 3.60 3.41
2.97 2.97 2.822.10
0
1
2
3
4
5MtC
O2/Mtoe
700
750
800
850
900
950
1,000
1,050
1,100
kgCO2/tclinker
China
CIS
Europe
India
MiddleEast
N.Am.
S.Am.excl.Brazil
0%5%
10%15%20%25%30%35%40%45%
1990
2000
2005
2006
2007
2008
2009
2010
2011
2012
2013
Weightedaverage
Totalalternativefuels
Fossilandmixedwastes
Biomass
0% 20% 40% 60% 80%
DECZGBPLFRESIT
EU28
Percentageoftotalthermalenergyconsumptionforgreyclinker
Fossilandmixedwastes Biomass

TheFinalCarbonFatcat–Sandbag–March2016 26
productioninEU28countries.Source:CSI2013(dataset25aAGFC)
energyconsumptionofgreyclinkerproduction.Source:CSI2013(dataset25aAGFC).
Aproperlyalignedincentivesystemwouldneedtomakeitbothlegallypossibleandfinanciallyattractiveforcementmakerstotakeadvantageofthetechnologicalpossibilitytoburntheselesspollutingfuels.Thiscanbeachievedby:
• HarmonisingEU-widelandfillregulations,aswellasregulationspermittingtheincinerationofthesenon-conventionalfueltypes.Thiswillbroadenthepossiblescopeofthematerialsflowtowardsthecementsector.
• Reducingtheadministrativeburdenofcross-bordertransportofwastesforco-incineration.
6.3. KilnefficiencyImprovementsinenergyefficiencycanbeachievedbyusingbestavailabletechnology(BAT)kilnsandbyoperatingthematclosetonominalproductioncapacity.Upgradestokilnefficiencyaredrivenprimarilybylongterminvestmentdecisionsandcompliancewithregulatoryrequirements.BATinthecementsectorconsistsofdrykilnswithmultistagepreheaterandprecalcinerequipment.Theseusehalfasmuchenergyaswetkilnspertonneofclinkerproduced.21In2013,83%ofcementproductioninEuropewasbasedonthedryprocess(Figure27)comparedto78%in1990.Overthesameperiod,thermalenergyconsumptionforgreyclinkerproductionfellby10%EU-wide.WhilenewkilnsaretypicallybuiltusingBAT,asignificantnumberoflessefficientkilnshaveyettobereplaced.Overcapacityinthecementmarkethasresultedinashortfallininvestment.ThecostlinessofshippingclinkerandcementoverlandreinforcesthisaspectforcompaniesinlandlockedEUcountriesthatmaybecontemplatingsuchinvestments.
21InternationalEnergyAgency.(2009).EnergyTechnologyTransitionsforIndustry.p.78(link)

TheFinalCarbonFatcat–Sandbag–March2016 27
Figure27:Trendsingreyclinkerkilntechnology.Source:CSI2013(datasets25aAGand8TGK).
Furthermore,ourdiscussionswithindustrysuggestthatclimatepolicyisnotstrongenoughtodrivethisreplacement.LafargeforinstanceacknowledgesthatequippingallkilnswithBATcouldreducespecificheatconsumptionto2.9GJ/t(morethan20%lowerthanthe2013EUaveragereportedinFigure25).However,theyalsoaddthatthiswouldcostsinexcessof€100pertonneofCO2saved22–farinexcessofthecurrentcarbonprice.23HeidebergCementandCarbon8alsocorroboratethatupgradingextremelyoldkilnstoBATistantamounttogreenfieldinvestment.246.4. ClinkersharesItispossibletoachieveemissionsreductionsbysubstitutingclinkerwithmaterialsthathavelowerembeddedcarbonsuchaspulverisedflyash,groundgranulatedblast-furnaceslag,limestoneorcalcinedclayminerals.TheEU-widetrendhasbeentowardsusinglessclinkerbutprogressunderthisleverhasbeenuneven.WhileAustriareportedlyreducedclinkercontentfromnearly79%in1997tolessthan70%in2015,25theshareofclinkerinsomeMemberStateshasrisendespitetheintroductionoftheETS.Figure28showshowtheclinkerratiohasrisenfrom76%in2008to80%in2013inSpain,whileinItalyithasbeenrisingcontinuouslyfrom71%in1990to75%in2013.AsweshowinFigure29,theutilisationratesforslag,flyashandpuzzolanaremainlow.Scarcityofthesematerialsisafactorbutthelowcarbonpricemakesitdifficulttoachievehigherlevelsofclinker-substitutionasthebenefitsofsodoingareoutweighedbylogisticalcostssuchastransport.Substantialvolumesofwastearethereforeremainingunused.
22Gimenez,M.[Lafarge].(2015).HarnessingCO2.InternationalCementReview.23EUR4.88/tCO2(ICE–March4,2016).24CEMBUREAU.(2016).PersonalcommunicationwithCEMBUREAUon5February201625CemtechVienna(link,accessedFebruary2,2016).
3.4
3.5
3.6
3.7
3.8
3.9
4.0
4.1
4.2
0%
20%
40%
60%
80%
100%
1990 2000 2005 2006 2007 2008 2009 2010 2011 2012 2013
Thermalene
rgyc
onsumption
(GJ/Tclinker)
Shareofgreyc
linkerp
rodu
ction
WET/SHAFTKILN SEMI-WET/SEMIDRY
MIXEDKILNTYPE DRYWITHOUTPREHEATER(LONGDRYKILN)
DRYWITHPREHEATERWITHOUTPRECALCINER DRYWITHPREHEATERANDPRECALCINER
Thermalenergyconsumption(greyclinker)

TheFinalCarbonFatcat–Sandbag–March2016 28
Figure28:Theclinker-to-cementratiofortheEU28,SpainandItaly
Figure29:UseofcementsubstitutesasapercentageofallgreycementinEU28countries.
Sources:CSI2013(datasets92AGWand19AGW)
Theamountofclinkerusedintheproductionofcementfundamentallydeterminesthissector’sdirectemissions.Itisthereforeimperativetoeliminateincentivestoincludeincreasedlevelsofclinkerincement.Theveryfactthatclinkersharesvaryaccordingtocountrysuggeststhatthisisnotatechnicallychallenginghurdlebut,instead,largelyaproblemofincentives.Wethereforerecommend:
• NarrowingtherangeofclinkerinPortlandcementsinEuropeannormsofcementandconcrete.All27categoriesofcementrecognisedunderEN197prescribeafairlywiderangeofPortlandclinkercontent,e.g.80-94%forCEMIIA-S.Regulatingclinkercontentintothelowerendofthecontentrangemightbeasolutionworthexploring.
6.5. Non-PortlandcementsCementalternativesdifferfromclinker-substitutedPortlandcementsinthattheyareproducedviaseparateprocesses,whichoftenusenoneofthetraditionalrawingredientsofordinaryPortlandcement.Anumberofthesecementshavelowerembeddedcarbon.Examplesincludegeopolymercementandconcrete(Wagners),andmagnesiumcarbonatecements(Novacem).Alteringthechemistryofclinkercanalsoreduceitscarbonintensity.Thisisthecaseforthelow-carbonclinkerskilnedatlowertemperatures(Lafarge).Lackofpropercertificationcanhurtthemarketacceptanceofthesecements.ExistingstandardsprescribechemicalcompositionsthathavebeendeterminedinthepasttoguaranteetheparticularperformanceofaPortlandcement.Non-conventionalcements,eschewingthePortlandprocessentirely,cannotmeetsuchstandardsbydefinition.Thisisunfortunate,asmanynon-conventionalcementscaninfactattaingreaterstrengththanPortlandcement,especiallywhenperformanceisassessedat56daysratherthanthe28-dayperiodspecifiedinNormsforcementsinthePortlandfamily.Asinthecaseofclinkersubstitutes,theeconomicsofnon-Portlandcementsarehighlydependentonmanufacturers’abilitytosourcefeedstocksaffordably.CEMBUREAUestimatesthatnovelcementswill
65%
70%
75%
80%
85%
1990
2000
2005
2006
2007
2008
2009
2010
2011
2012
2013
Clinkertocemen
tratio
Spain Italy EU28
0.0%0.5%1.0%1.5%2.0%2.5%
1990
2000
2005
2006
2007
2008
2009
2010
2011
2012
2013
Ratio
ofcem
entsub
stitu
tes
Slag
Flyashandpuzzolana
Totalcementsubstitutes

TheFinalCarbonFatcat–Sandbag–March2016 29
achievea5%marketshareby2050.26Theycitemarketacceptanceasthemainbarrierslimitingnon-Portlandcementstonicheapplications.YetsomenovelcementscouldreplacePortlandcementsinagreatvarietyofenvironments.Non-Portlandcementssufferfromlackofexperienceofusingthemamongintermediateandfinalconsumers.Theirmarketabilitycanbegreatlyimprovedifbuyersarereassuredthatthesecementsconformtoproductsafetystandards.Currently,Europeannormsoncementandconcrete(EN197&EN206respectively)coverimperfectlyproductsthateschewthePortlandparadigmaltogether,andoftentheimplementationofthesenormsisleftuptoindividualMSs.ThishasresultedinasituationwheredivergingsafetyregulationspreventthesameproductfrombeingmarketeduniformlyacrosstheEU.Furthermore,regulationsshouldnotpreventinnovationstodiffusethroughouttheEU.Intermsofproducts,subsidiarityintheEuropeanNormsoncementandconcrete(EN197&EN206respectively)meansthatseveralformsoflow-carboncementthatalreadyexistcannotbemarketedinmostEUMSs–despitebeingdeemedsafeinothers.
• ExtendingtheEuropeannormsoncementandconcretebeyondtheparadigmofPortlandcement.Standardsshouldbedecidedwithclimatebenefitsinmind,mirroringforinstancetheCaliforniansystemwheretheperformanceassessmentperiodis56dayslong.ThefragmentationofthenormsystemamongMSsshouldbeavoidedasmuchaspossible.
• Engagingindemandcreationfornon-Portlandcements.Evenwithnewstandards,weexpectadoptiontobeslow.Toaddressthis,governmentsshouldshowcasethereliabilityofnon-conventionalcementsthroughdemonstrationprojectsandpublicprocurementprogrammes,andshouldeventuallyintroducemaximumnationalrequirementsfortheaverageembodiedcarbonofcement,whichshoulddecreaseinapredictablemannerovertime.
• Addressingshortcomingsinthebuildingmarketthatcauseconsumerstoselectagainstlow-carboncements.Contractorsfacecompetitivepressurestospecifyshorterconstructiontimeframes.Theyneedincentivestousecementsthatattainpeakperformancemoreslowly.
6.6. CCUScementsandconcreteCementsthatcanre-absorbCO2aresoldasprecastconcreteblocksbyCarbonCure(Canada),andIronShellLLCandSolidiaintheUS.Carbon8intheUKproducesasyntheticcarbon-negativeaggregatewhichcanbemixedwithordinarycementtoformaconcretewithlowerembodiedcarbon.TheseproductsholdgreatpotentialforactingasacarbonsinkbutthemixtureofhighRD&Dandproductionexpensestogetherwithlowcarbonprices,lackofconsumerinterestorincentiveshasastronglynegativeinfluenceonthepossibilitytocommercialisethem.However,questionssurroundingthelongtermperformanceofsuchcementtypesarejustassalientasinthecaseofnon-conventionalcementswhichiswhywemakesimilarrecommendationsforCCUScementsaswell.Aninterestingpointtomakeaboutthesecementtypesisthat,whiletheinducedabsorptionofCO2maysignificantlyreducelifecycleemissions,itsaccountingfallsoutsidethescopeoftheETS.Tocircumventthisproblem,Sandbagstronglysupportstheintroductionofanegativeemissionsaccreditationscheme.26CEMBUREAU.(2013).NovelCements(link,accessedon8March2016)

TheFinalCarbonFatcat–Sandbag–March2016 30
Thiswouldraiseconsumers’awarenessofthevaluethesenovelproductsadd,aswellasprovidingconsumerswithanincentivetopurchasethem.Atransferofwealth,fromMSsobligatedundertheESDtoprojectimplementers,wouldfunddemandcreationforproductstakingadvantageoftheleversforcementsectordecarbonisationthattheETS,byitsverydesign,cannotreach.BeyondthecaptureofcarbondioxideinCCUScements,thiswouldbehelpfulintheproductionofnon-Portlandcementsaswell.ItwouldalsoeliminatetheneedforMSstogeneratetheirownpoliciesbecauseprivateactorswouldbeabletoseekoutmitigationopportunitiesthroughouttheEUonceMRVmethodologieswereenacted.BecauseMSswouldbeacquiringcreditsgeneratedwithintheEUforESDcompliance,itwouldcreateapricesignalunderthenon-tradedtradedsectorwithoutcompromisingthe“domestic-only”natureoftheEU’s2030climateobjective.Therefore,inadditiontotherecommendationsmadefornon-Portlandcements,werecommend:
• CreatingaMRVandcreditingprocessthatallowsforcapturedandstoredCO2andnegativeemissionstobecreditedforuseintheEU’sclimatepolicies.WhileusingsuchcementtypeswillmakecompliancewiththeESDeasierforMSs,acreditingschemegeneratingrevenuesfortheactorsusingthemwouldincreasedemandandacceleratediffusion.Suchademand-creationexercisewouldinturnmakeitmoreattractiveforcementmakerstoinvestintoproductionlinesproducingthesecements.

TheFinalCarbonFatcat–Sandbag–March2016 31
7. ANNEX:METHODOLOGYSandbag’sprojectionsforhowdifferentpolicyscenarioswouldaffectfreeallocationinthecementreliesonasuiteoftoolsdevelopedin-house:
• ThestartingpointisanestimationforthenumericalvaluesthatwereusedtodetermineactualPhase3freeallocationattheinstallation-level,i.e.theirapplicationforfreeallocationbasedontheirsector’sproductbenchmarks.Wemathematicallyback-castedthevaluesfor10,400installationstogeneratethemostaccurateestimationforhowtheirfreeallocationintheEUTransactionLog(EUTL)wascalculated.UponreapplyingthevariouscorrectionfactorsusedduringPhase3,ourestimateswereabletoreproducetheactualEUTLvaluestowithin5allowancesineveryyearforinstallationsamountingto99%of2014freeallocation.
• Weconcludedthataninstallation’sactivityhadpartiallyceasedifourestimatefortheirapplicationforbenchmarkedfreeallocationonlymanagedtoreproducetheEUTLvaluesforalimitedsequenceofyears.
• Wehadtorelyonemissionsinordertoestimatevariationonactivitytypes,astheEUTLdoesnotprovideinstallation-dataonactivitylevels.Becausethereal-lifeHistoricalActivityLevel(HAL)isnotpublicallyavailable,wefollowedthemethodologyimpliedbytheBenchmarkingDecisiontoestimateaHistoricalEmissionsLevel(HEL).Weusedvariationsinemissionstoestimatevariationsinproductionsforinstallationswherewehadbeenunabletomathematicallyverifytheoccurrenceofpartialcessation.
• WemadesuretochangethereferenceyearfortheHELtoaccountforsectorsandinstallationsthathadonlyjoinedtheETSin2013duetoscopechange.
• Weusedasimplelinearadjustmenttoactivitylevelstogenerateapplicationsforfreeallocationforfutureyears.Weadjustedproductbenchmarksuniformlybythe1%/yearsuggestedbytheCommissionproposal.
• WecalculatedeachthecorrectionfactorforcarbonleakageduringPhase4foreachNACEcodebasedoninformationpresentintheCommission’sImpactAssessmentandothersimilardocuments.WeappliedthesecorrectionfactorstoeachinstallationinallNACEcodestogeneratetheirapplicationforfreeallocation.
• Comparingthesumofallinstallations’applicationforfreeallocationwiththePhase4ceilingonfreeallocationimpliedbytheCommission’sProposalfortheETSRevision,wegeneratedacross-sectoralcorrectionfactorforeachyearofPhase4.
• WeappliedthesetwocorrectionfactorstoeachinstallationwegeneratedthefreeallocationvaluesforeachinstallationineachyearofPhase4.
• Thesevalueswerethenaggregatedintodifferententities,e.g.acementcompany,anindustrialsector,acountry,etc.basedonourin-housecurateddatabaseofinstallationownership.
FortheanalysisdecomposingtheeffectofindividualfactorsoncementsectoremissionswereliedontheLog-MeanDivisiaIndexmethoddescribedinBranger&Quirion(2015)“Reapingthecarbonrent:AbatementandoverallocationprofitsintheEuropeancementindustry,insightsfromanLMDIdecompositionanalysis”,EnergyEconomics(availablehere–accessedMarch15,2016).

TheFinalCarbonFatcat–Sandbag–March2016 32
sandbag.org.ukEUTransparencyRegister:94944179052-82