How Does Row Placed - Soil Science at UW-Madisonsoils.wisc.edu/extension/materials/Row_Fert.pdf ·...
48
How Does Row Placed Fertilizer Fit in Today’s Agriculture Dick Wolkowski Extension Soil Scientist University of Wisconsin
Transcript of How Does Row Placed - Soil Science at UW-Madisonsoils.wisc.edu/extension/materials/Row_Fert.pdf ·...

How Does Row Placed
Fertilizer Fit in Today’s
Agriculture
Dick Wolkowski
Extension Soil Scientist
University of Wisconsin

Why Starter Fertilizer
Precision placement
Higher nutrient use efficiency
Avoid skips and lapping
Limits fixation of P and K by the soil
Soils slow to warm in the spring
Environmental incentives?

Historically Starter “Was a Good Thing”
Lower soil test levels
Smaller planters
Limited corn acreage
per farm
Lower availability of
custom application
Response often linked
to P

Early Season Growth Response Not a
Guarantee of Economic Response
Starter fertilizers stimulate
early plant growth and
development
Early season growth
response is not a always a
predictor of yield response
Yield response potential
lower on high testing soils
Grain moisture reductions
observed with starter

Effect of Starter Fertilizer on Corn
Growth Rate
Bullock et al., 1993

Starter Fertilizer Effects on Corn
Yield and Moisture, Urbana, IL
Grain yield Moisture
Treatment 1990 1991 1990 1991
---- bu/a ---- -------- % --------
Starter 181 140 21.0 22.4
Control 186 138 22.3 23.6
Soil test P = 68 ppm, K = 346 ppm. 10-34-0 starter, 13 lb N
and 47 lb P2O5/acre
Bullock et al., 1993

Starter Fertilizer Use Has Changed
Loss of time-use
efficiency at planting
Practicality of
mounting and carrying
attachments and
fertilizer on very large
planters
Cost of attachments
Lower potential for
response on high
testing soils John Deere Website

Many Attachment Options When
Purchasing a Planter
Source: Kinze Mfg. website

Economics of Starter Fertilizer Attachments in
Illinois No-Till Corn
Attachments on
8-row Planter
Total
Planter
List Price
Field
Capacity
$ ac/hr
No attachments 26,400 9.3
2 x 2-banded
fertilizer
attachments
34,700 8.0
Starter attachments increased planter
price 31 % and slowed planting 14 %
Cost of starter attachments decreases
with time and use (500 acres per year)
Avg. cost of 8-row
planter with starter
since purchase
Years after
purchase Seed-placed 2 x 2
------------ $/ac ----------
2 2.05 4.10
4 1.35 2.70
6 1.10 2.20
8 1.00 2.00
10 0.90 1.80
Hibbard et al., 1996

What Factors Affect the Probability of
Response to Starter ?
Soil test P and K
pH
Organic matter
Manure use
Soil texture
Hybrid maturity
Planting date
Previous crop
Soil type
Latitude
Fertilizer grade
Soil yield potential
Weather
Placement
Tillage
vs

Non-responsive range
Average soil test P levels of Wisconsin
cropland fields over time
Soil Test Levels Continue to Increase

Regional Trend for More
Conservation Tillage
Eight Midwestern states:
106 million acres of cropland
37 percent of all U.S. cropland
46% of no-till acres in U.S. in the Midwest
2002 Midwest data
17 million acres of no-till soybeans
7 million acres of no-till corn
Forty-five million acres (42.5 %) used
conservation tillage
CTIC Website (2002 data)

Soil Test Stratification Following Five Years of
Tillage Management, Arlington, Wis.
0 10 20 30 40 50 60 70
NT
CH
SOIL TEST P (ppm)
0 25 50 75 100 125 150 175 200
NT
CH
SOIL TEST K (ppm)
6-8" 4-6" 2-4" 0-2"
5 5.5 6 6.5 7
NT
CH
SOIL pH
Wolkowski, 2003 (corn/soybean rotation)

Fertilizer Placement Affects Corn Root
Distribution (0-15 In.)
Root length (km/m3)
Tillage Fert. placement Row Untracked
Inter-row
Tracked
Inter-row
CH ROW 17.1 3.0 0.8
CH INTER-ROW 12.0 4.4 1.4
NT ROW 19.8 2.5 0.8
NT INTER-ROW 10.8 6.1 1.5
Kaspar et al., 1991

Conservation Tillage is More
Responsive to Banding
Positional availability
Lack of mixing by tillage
Immobilization
Wheel track vs. non-wheel track effects on
root distribution
Cooler soil conditions
Reduced K uptake from zones of poor
aeration

No-till Corn Yield Response to
Starter Fertilizer in Selected Experiments
Location
Starter Treatment
Response
MissouriScharf (1999)
N,P,K; 2 x 2 6 of 6 expts.
13 bu/a incr.
IowaBuha et al. (1999)
N,P,K; 2 x 2 7 of 9 expts.
4-18 bu/a incr.
WisconsinBundy - Widen (1999)
N,P,K; 2 x 2 8 of 12 expts.
15 bu/a incr.
IllinoisRitchie et al. (1996)
N,P,K; 2 x 2 8 of 9 expts.
14 bu/a incr.

Soil Temperature Affected by Tillage
and Crop Residue
0
5
10
15
20
25
30
11-Apr 18-Apr 24-Apr 2-May 9-May 16-May 23-May
DE
GR
EE
C
CHISEL
STRIP-TILL
NO-TILL
2 " DEPTH, IN-ROW
MEASURED 4:00-5:00 PMEffect on in-row soil temperature,Arlington, 1994
0
20
40
60
80
100
Res
idue
(%)
Chisel
Strip-till
No-tillEffect on cropresidue,Arlington, 1994
Wolkowski, 2000

Interactive Effect of Tillage and Row Fertilizer,
Arlington, 1994-1996 (3 yr. avg.)
140
150
160
170
180
FZ SZ CH NT
YIE
LD
(b
u/a
)
NONE
FS
FZ
2x2
NPK STARTER
Wolkowski, 2000

Interaction Between Starter Fertilizer and Row
Cleaners
150
155
160
165
170
WITHOUT WITH
ROW CLEANER
YIE
LD
(b
u/a
)
NONE
STARTER
Vetsch and Randall, 2000
NP STARTER

Where Do We Put Starter
Trend toward lower rates and N or N-P
composition using fluids
More interest in seed-placement
Is 10-34-0 or similar N-P fertilizer adequate as
a starter?
Is a complete (N-P-K) fertilizer necessary?
2 x 2 versus seed

What About Seed-placement Some suggest higher availability
for seed-placed materials
Difficult to include K
Avoid high salt carriers and
use on salt-sensitive crops
No urea, UAN, ATS
Limit to 10 lb N + K2O/a
Use with caution on sandy or dry soils

Comparisons of Liquid and Dry Starter
Fertilizers Applied to Corn, Arlington, Wis.
Starter
N+P2O5+K20
----lb/a-----
Placement
Corn yield
3 yr. avg.
----bu/a----
0+0+0 ------ 125
3.2+6.5+3.2 “cold” seed 133
3.2+6.5+3.2 “hot” seed 128
6+24+24 liquid 2x2 139
6+24+24 dry 2x2 137
LSD (0.10) 11
Wolkowski and Kelling, 1985

Influence of Rate and Type of
Seed-placed Fertilizer
40
60
80
100
120
140
160
180
10 34 0 7 21 7 9 18 9
YIE
LD
(b
u/a
)
0
12.5
25
50
lb P2O5/a
Gelderman et al., 1995

Response Potential is Complicated
(Tillage, Planting Date, and Composition)
Tillage No-till
Moldboard plow
Planting Dates (four) Late April – Late May
Composition (lb/a, all received 10 lb N/a) Control (0 + 0)
P2O5 (25 + 0)
K2O (0 + 25)
P2O5 + K2O (25 + 25)
Bundy and Widen, 1992

Effect of Tillage and Starter
Fertilizer on Corn Yield
Starter
N-P2O5-K2O
Moldboard
plow No-till Mean
lb/acre -------------- Yield, bu/acre ---------------
10-0-0 153 b 143 b 148 c
10-25-0 157 b 149 ab 153 b
10-0-25 152 b 147 ab 150 bc
10-25-25 164 a 152 a 158 a
Average of four planting dates
(Bundy & Widen, 1992)
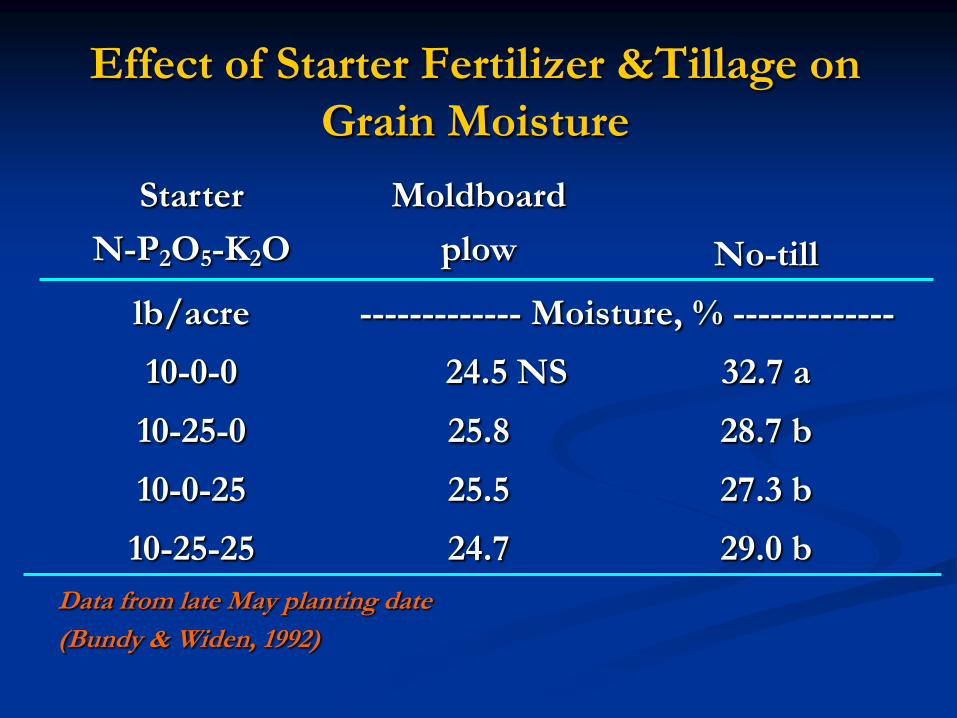
Effect of Starter Fertilizer &Tillage on
Grain Moisture
Starter
N-P2O5-K2O
Moldboard
plow No-till
lb/acre ------------- Moisture, % -------------
10-0-0 24.5 NS 32.7 a
10-25-0 25.8 28.7 b
10-0-25 25.5 27.3 b
10-25-25 24.7 29.0 b
Data from late May planting date
(Bundy & Widen, 1992)

Planting Date and Tillage
Effects on Starter Response
Planting Date
Yield Response
MP NT
(bu/acre)
Apr. 23-26 +16 - 2
May 2-3 + 3 +6
May 11-14 +15 +11
May 23-24 + 9 +21
Average of 3 years

On-farm Validation
100 On-farm sites (total over 3 years)
Major corn growing areas
With/without starter
Field scale strips, 3 reps.
Production practices, site histories
Plant height, 8 weeks
Grain yield w/, w/o starter
Bundy and Andraski, Wis.

Overall Results
Average starter rate = 15+26+32
Most soil tests excessively high
P = 93% EH
K = 73% EH
Average yield response: 4 bu/acre
Economic return (4.5 bu/a) positive at 40%
of sites

Relationship Between Selected Site
Factors and Response to Starter (pr>F)
Soil pH 0.99
Manure use 0.93
P in starter 0.91
Soil OM 0.91
Crop residue 0.87
Texture 0.77
Previous crop 0.64
Soil test P 0.63
N in starter 0.62
K in starter 0.36
Yield potential 0.31
Planting date 0.29
Soil test K 0.05
Rel. maturity 0.05

Importance of Potassium in
Starter Fertilizers

Research Shows the Value
of K in Starter Compared with Broadcast
Wagar and Rehm, 2004
Site 1 Site 2 Site 3
Trmt Yield Trmt Yield Trmt Yield
K2O (lb/a) bu/a K2O (lb/a) bu/a K2O (lb/a) bu/a
0 114 0 137 0 132
40 (2 x 2) 143 45 (2 x 2) 180 45 (2 x 2) 166
100 (bdct) 136 105 (bdct) 158 105 (bdct) 144
200 (bdct) 140 -- -- -- --

CC SbC
CH ST NT CH ST NT
------- % ------- ------- % -------
NONE 2.23 2.37 2.35 1.65 1.34 1.40
BDCT 2.35 2.19 2.51 2.51 2.18 1.40
2 x 2 2.85 3.26 2.81 2.46 2.58 2.16
Effect of Rotation, Tillage, and Fertilizer on Corn K
Concentration 45 DAP, Arlington, Wis., 2001
Wolkowski, 2003

Response Of Corn To Tillage And Fertilizer
Placement, Arlington, Wis. 2001-2003
140
160
180
200
220
CH ST NT CH ST NT
Yield (bu/a
)
None
BD
Row
Wolkowski, 2004200 lb 9-23-30/a
Continuous corn Soybean/corn

Evaluaton of Response to K in Long-
term Calibration Plots Long-term plots with wide range of soil test K (VL
to EH, 60 to 265 ppm).
Response to NPK starter (100 lb/a 9-23-30) across
range of soil test K levels.
Corn yield responses measured over 4 yr. (1993 to
1996)
Spring disked & chisel plowed in 1993 and 1996,
no-till in 1994 and 1996
Bundy and Andraski, Wis.

Growing Season Characteristics
Year PDRM* F.F. days GDD
1993 225 154 2055
1994 228 189 2293
1995 227 145 2413
1996 228 170 2043
* Planting dates: Apr. 30 to May 3; RM=105

Soil test K, ppm
50 100 150 200 250
Re
lati
ve
yie
ld,
%
20
40
60
80
100
120
VL L O H EH
69% 77% 93% 98% 100%
Soil K Response Relationship Relative to Current Soil Test
Interpretation Ranges at Arlington, 1993 To 1996
Soil test K, ppm
50 100 150 200 250
Yie
ld r
esp
on
se, b
u/a
cre
-40
-20
0
20
40
60
80
100
VL L O H EH(47) (19) (-2) (8) (1)
QRP
y=343-6.82x+0.034x2 if x<100
y=0 if x>100
R2=0.52 n=54
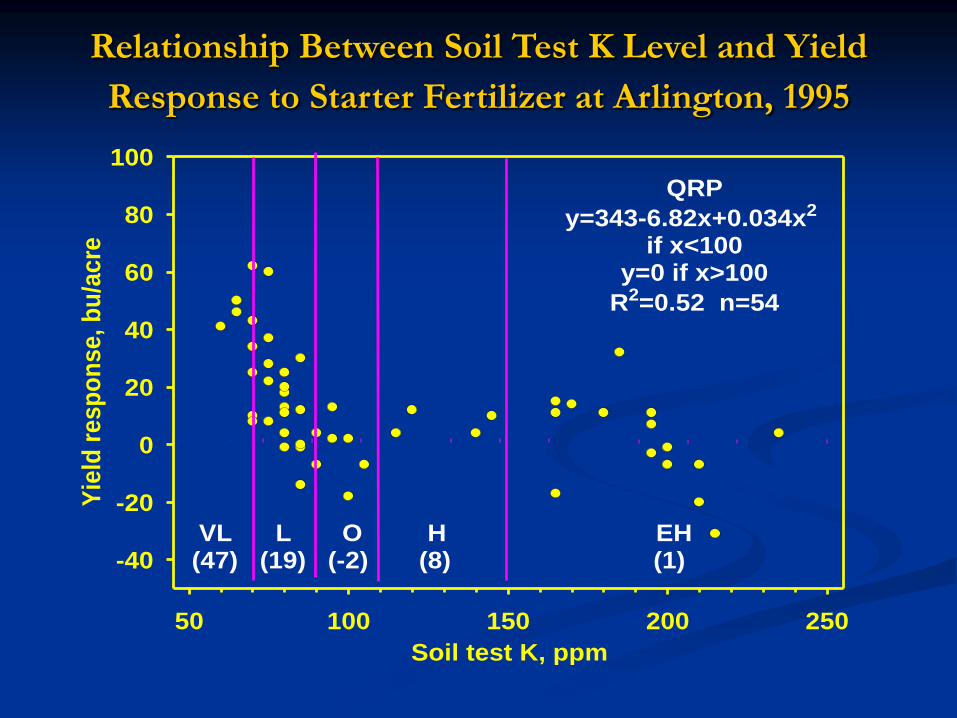
Relationship Between Soil Test K Level and Yield
Response to Starter Fertilizer at Arlington, 1995

Soil test K, ppm
50 100 150 200 250
Yie
ld r
esp
on
se, b
u/a
cre
-40
-20
0
20
40
60
80
100
VL L O H EH(34) (34) (12) (7) (7)
QRP
y=145-2.04x+0.0075x2 if x<136
y=6 if x>136
R2=0.32 n=111
Relationship Between Soil Test K Level and Yield
Response to Starter Fertilizer at Arlington, 1996

Soil test K, ppm
50 100 150 200 250
Yie
ld r
es
po
ns
e,
bu
/ac
re
-40
-20
0
20
40
60
80
100
VL L O H EH(38) (27) (6) (6) (3)
QRP
y=153-2.35x+0.0092x2 if x<128
y=0 if x>128
R2=0.34 n=309
Relationship Between Soil Test K Level and Yield
Response to Starter Fertilizer at Arlington, 1993-1996

Critical soil test K level, ppm
100 110 120 130
Cu
mu
lati
ve G
DD
2000
2100
2200
2300
2400
2500
Air
tem
pera
ture
dep
art
ure
,oF
-2
-1
0
1y = 1119 - 0.84x + 0.00017x2
R2 = 0.97
19961993
1994
1995
Relationship Between Temperature (GDD And Departure – May to
September) and Maximum Soil Test K Level Where Yield Response
Occurred to Starter Fertilizer

Soil compaction destroys structure, reduces
porosity, increases resistance to root growth, and
limits aeration needed for root respiration

Poorly Developed Root Systems
Cannot Explore the Entire Soil Volume
(Which Side Received Starter?)

Compaction Affects
Nutrient Uptake
Potassium Affected Most
Compaction reduces porosity and
limits root growth
Lowers soil O2 and slower
replenishment from the
atmosphere
O2 needed for root respiration and
active uptake of K
Compacted soils are often
responsive to K fertilization

Row K Effects on Corn Yield with
Increasing Soil Compaction
100
110
120
130
140
150
160
170
<5 9 19
Soil Compaction, tons
Yie
ld (
bu
/a)
No Row K
Row K2O45 lb/a
Wolkowski, 1989
Initial K Soil test = 102 ppm

Summary Are we be finished with starter?
Research shows it is worth the time and expense in
many situations
N or N-P starters may not maximize response
Complete (NPK) starters give a more consistent
response
Research shows K in starter is important
Reduced tillage
Low K soils
Compacted soils

Summary Frequency and size of response to starter is influenced by
GDD accumulation
Response to starter occurred at higher soil test K levels
in cooler growing seasons
Use a complete starter
Use fluids containing K
Risks with seed placement
Recommend 10+20+20 (N+P2O5+K2O) for soils slow to
warm in the spring