How Does Medicaid Reimbursement Impact the Quality...
32
How Does Medicaid Reimbursement Impact the Quality of Ohio Nursing Homes? JOHN BOWBLIS ROBERT APPLEBAUM Scripps Gerontology Center An Ohio Center of Excellence
Transcript of How Does Medicaid Reimbursement Impact the Quality...
How Does Medicaid Reimbursement Impact the
Quality of Ohio Nursing Homes?
JOHN BOWBLIS ROBERT APPLEBAUM
Scripps Gerontology CenterAn Ohio Center of Excellence

How Does Medicaid Reimbursement
Impact the Quality of Ohio
Nursing Homes?
John Bowblis*1
Robert Applebaum*2
May 2015
Scripps Gerontology Center
Miami University
Oxford, OH 45056
www.scrippsaging.org
*1Professor of Economics, Research Fellow Scripps Gerontology Center
*2Professor of Gerontology, Director Ohio Long-Term Care Research Project, Scripps Gerontology Center

This report was funded by the Ohio Department of Medicaid and the Ohio Long-Term Care Research Project.

TABLE OF CONTENTS
List of Figures .................................................................................................................................. i
List of Tables .................................................................................................................................. ii
Executive Summary ....................................................................................................................... iii
Background ................................................................................................................................ iii
Study Findings ........................................................................................................................... iii
Study Conclusions ...................................................................................................................... iv
Introduction ..................................................................................................................................... 1
Previous Research on Reimbursement and Quality ........................................................................ 2
Study Data and Methods ................................................................................................................. 4
Ohio Nursing Home Reimbursement Rates in a National Context ................................................ 4
Ohio’s Price System and Facility Specific Rates ........................................................................ 7
Understanding the Link Between Reimbursement and Quality .................................................. 8
Do facilities with higher reimbursement rates demonstrate higher quality? ........................... 8
Quality and reimbursement linkage ....................................................................................... 12
Price System’s Impact on Quality ............................................................................................. 15
Quality Changes from Fiscal Year 2007 to 2012 .................................................................. 17
Summary and Conclusion ............................................................................................................. 22
References ..................................................................................................................................... 23

i
LIST OF FIGURES
Figure 1. Nursing Home Medicaid Rates ...................................................................................... 5
Figure 2. Actual Reimbursement Rates by Rate Categorization ................................................. 17

ii
LIST OF TABLES
Table 1. Average Medicaid Reimbursement Rates (Adjusted for Inflation) ................................. 6
Table 2. Price System Reimbursement Components ..................................................................... 7
Table 3. Nursing Facility Actual and Price Reimbursement Rates 2007 .................................... 10
Table 4. Facility Characteristics by Reimbursement Category (Fiscal Year 2007) .................... 11
Table 5. Baseline Quality in Fiscal Year 2007 by Reimbursement Categorization .................... 13
Table 6. Quality in Fiscal Year 2007 by Reimbursement Categorization (MDS Quality
Measures) ...................................................................................................................................... 14
Table 7. Actual and Price Reimbursement Rates......................................................................... 16
Table 8. Change in Quality from FY 2007 to FY 2012 ............................................................... 18
Table 9. Change in Quality from FY 2007 to FY 2012 Relative to Control ............................... 20
Table 10. Change in Quality from FY 2007 to FY 2012 Relative to Control ............................. 21

iii
EXECUTIVE SUMMARY
BACKGROUND
In 2012 Ohio’s Medicaid program spent more than $2.4 billion on nursing home care.
Although spending public dollars for Ohioans with severe disability to receive assistance in skilled
nursing facilities is an important role of state government, an ever growing older population
highlights that nursing home expenditures must be efficient and effective. In an effort to improve
the efficiency of the Medicaid reimbursement system, beginning in 2006 the state shifted to a
“price reimbursement” system. The revised reimbursement system was designed to reward
providers seen as having more efficient staffing patterns and to reduce payments to facilities that
the state believed to be overstaffed. Under the price system the expectation was that some facilities
would receive an increase in their reimbursement rate, while others would see rates decrease.
Because a big component of the nursing home reimbursement rate is based on the level of disability
of the residents (known as case mix), there will always be rate differences across facilities.
However, the move to the price system was an attempt to lower the variation between the highest
and lowest priced facilities. This policy change has been both praised and criticized. The key policy
question is: does the move to price impact the quality of care in Ohio’s nursing homes?
STUDY FINDINGS
Our review of data for 2007 (prior to any reimbursement changes) found that higher priced
facilities had higher levels of direct care staffing and a lower number of inspection citations
compared to the lowest priced facilities.
Analysis of 2007 data did not show any significant quality differences between high price
and low price nursing homes on other quality measures, including resident or family
satisfaction, or for quality indicators included on the Nursing Home Minimum Data Set,
such as the proportion of residents with falls, pressure ulcers or physical restraints.
Prior to the implementation of the price system the variation between the highest priced
facility in the state ($253 per day) and the lowest priced facility ($113) was $140 per day.
In 2012 that difference was reduced to $77 per day.
The changes in the reimbursement system resulted in the average daily reimbursement for
the highest priced facilities being reduced from $186 per day to $169 and the
reimbursement for the lowest priced facilities being increased from $144 per day to $168
per day.
A review of staffing patterns between 2007 and 2012 found that there was an increase in
direct care staffing for the lowest priced facilities and there was a decrease in direct care
staffing for the highest priced facilities compared to those already at price over this time
period.

iv
Despite the staffing changes, there were no significant changes in quality for the low or
high priced facilities compared to the facilities that were already at price over this time
period.
STUDY CONCLUSIONS
Over the six year time period we found that there were significant changes in the pricing
structure in the Medicaid reimbursement system. The variation between the highest and lowest
priced facilities was reduced from $140 to $77 per day. Over the study period the lowest priced
facilities increased direct care staffing and the highest priced facilities reduced direct care
staffing. Our analysis across an array of quality measures did not find any significant changes
in quality across the three groups (above and below price) compared to the group that was at
price in 2007. Despite these findings, it will be important to look at these data for 2013, when
more sizable changes could be experienced. Also, it is possible that facilities have been able to
use reserves to mitigate impacts and these protections could be limited over time. Finally, it is
important to note that at the start of this change Ohio was a very high reimbursement state and
as it approaches a median ranking of state reimbursement, changes to rates could have a bigger
impact on quality.

1
INTRODUCTION
As one of the largest states in the nation, Ohio’s 2012 Medicaid expenditures topped $2.42
billion on nursing home care for individuals with physical and cognitive disabilities. Because
Medicaid represents such an important commitment of state resources, it is critical for Ohio policy
makers to make sure that the approach to reimbursing nursing facilities is both effective and
efficient. In an effort to improve the state’s reimbursement strategy, Ohio passed a law that
revamped the Medicaid reimbursement system for nursing homes in 2005. The revised
reimbursement system was designed to reward providers seen as having more efficient staffing
patterns and to reduce payments for facilities that the state believed to be overstaffed. This was to
be accomplished by reimbursing comparable nursing homes the same amount or “price.” Under
the 2005 law, reimbursement rates under the revamped system were to be slowly phased-in, to
allow facilities time to make adjustments to funding changes. On July 1, 2011, Ohio accelerated
the implementation of the revamped system.
The move towards a price system has been both lauded and criticized. Those praising the
approach highlight the wide variation in reimbursement rates without major differences in quality
under the previous system. Reimbursement rates that are too high could increase profits of
providers without adding to quality or at best reimburse facilities for more staff than needed to
achieve a quality outcome. By making reimbursement rates more uniform across the state, the
revamped system could save money without having any discernible impact on quality. However,
critics have suggested that higher reimbursement leads to higher staffing levels, which have been
shown to improve resident outcomes. Furthermore, payments that are too low can result in
facilities needing to reduce quality in order to break-even financially. Therefore, low payments
could result in poor quality and access issues.
The key challenge for state policy makers is finding the right balance. One of the criticisms
of the previous system was that it was re-based annually, and facilities had an incentive to increase
staffing, ancillary service, and capital costs as a way to increase their future reimbursement rate.
An outcome of the previous system was significant variation in both staffing and cost of facilities
across the state. As reimbursement rates change under the new reimbursement system, Ohio’s
nursing homes are experiencing rate changes of different magnitudes depending on individual
home circumstances, providing an opportunity to study whether nursing home quality is impacted
as a result of the new reimbursement system.
To conduct this study we examine a series of quality outcomes in the context of nursing
facility reimbursement levels. Measures include nursing home staffing levels, resident clinical
outcomes, resident and family satisfaction, and Department of Health Inspection Survey findings.
Total reimbursement rates for each facility, comprising direct care, ancillary and support, capital,
quality incentive payment, and taxes, are then compared to facility-specific quality outcome

2
measures. The analysis also includes a series of factors that could affect the quality/reimbursement
relationship. For example, a facility having a higher proportion of Medicaid and thus fewer private
pay residents could have fewer resources available, and this could impact quality scores. Facilities
with higher Medicare census could have additional resources available and this could have an
impact on quality outcomes. Other factors examined include percent of residents with dementia,
ownership, corporate structure, occupancy rates, size of facility, and geographic region. For
clinical measures of quality, we also include characteristics of the individual resident. The goal of
the research is to explore the relationships between reimbursement levels and quality to better
understand whether Ohio’s nursing home reimbursement changes had an impact on quality.
PREVIOUS RESEARCH ON REIMBURSEMENT AND QUALITY
What does the previous research tell us about the relationship between reimbursement and
quality? Our review of the recent literature found only seven studies addressing this topic. Overall
these earlier studies consistently found that an increase in reimbursement rates did show an
increase in staffing, but the impacts on quality were less consistent. Four of the studies reported a
positive link between reimbursement and quality; two found no relationship, and one showed a
negative impact.
A 2001 study found an increase in a state Medicaid reimbursement of $40 per day
significantly increased the number of RNs by 1.42 per 100 residents. A small but not statistically
significant increase in the number of LPNs and CNAs was also reported. The study found a small
impact on reducing medical errors, feeding tube use and catheterizations (Grabowski, 2001). A
2004 study found a 10% increase in the Medicaid reimbursement rate was associated with 1.8%
decrease in bedsores, 7.4% decrease in physical restraints and 1.3% decrease in feeding tube use
for Medicaid residents (Grabowski, 2004).
A study of Florida nursing homes in 2001 examined a Medicaid mandate for a new staffing
standard that was coupled with a rate increase. The study found that the average hours of nurse
staffing per resident day increased. Medicaid reimbursement in Florida was increased by $12.75
per day from January 2001 to January 2002 to an average rate of $132 per day. As a result of the
mandate, staffing (including RNs, LPNs and CNAs) per resident day increased from 3.6 in 2001
to 4.6 in 2007, which was significantly higher than national average of 3.7 in 2007 (Hyer et al.,
2009). The study also found the prevalence of adverse incidents decreased by 32% from 3505 in
2001 to 2389 in 2005 and regulatory deficiencies were reduced by 50% (Hyer et al., 2009). The
number of citations for insufficient staffing also decreased from 12.4% in 1999 to 4.9% in 2004
(Hyer et al., 2009).

3
Finally, a study by Mor et al., (2011) found a $10 daily increase in Medicaid payment was
associated with improved resident outcomes; resident functioning, as measured by activities of
daily living, improved by 9.2%, reported pain was reduced by 5.5%, and pressure ulcer prevalence
declined by 2.1%. In another study, Intrator and Mor (2004) found a $10 increase in state Medicaid
reimbursement rates reduced the risk of a resident being hospitalized by 9% and lowered the
mortality rate by 12%. In addition, residents in facilities with a case mix reimbursement were 30%
less likely to be hospitalized compared to residents in systems not using a case mix reimbursement
methodology (Intrator and Mor, 2004).
Two other studies showed that staffing levels increased due to higher Medicaid
reimbursement, but they did not provide evidence of quality improvement. It has been argued that
increased staffing is associated with nursing home quality. A study of wage pass through policies
for the period of 1996 through 2004 found an increase in hours per resident days for certified
nursing aides (CNAs) in the year following policy adoption, but no impact on quality (Feng, Lee,
Kuo, Intrator, Foster, & Mor, 2010). The study did not find any significant increase in RNs and
LPNs hours per resident days. Harrington and colleagues (2007) found a $10 increase in Medicaid
reimbursement increased RN hours by 1 hour for every 100 residents, while a $10 increase in
Medicaid reimbursement per resident day increased the total direct care staffing by 10 hours per
100 residents, but found no impact on quality. Finally, one study found increased Medicaid
reimbursement had a negative impact on quality. Higher reimbursement for feeding tubes resulted
in increased prevalence of feeding tubes (Teno et al., 2008). The increased use of feeding tubes
appeared to result in increased incidents of aspiration pneumonia, weight loss, and death of persons
with dementia (Teno et al., 2008).
Studies done before 1990 examined facility-specific rates, but the results are dated and
correspond to a period where the nursing home industry suffered from excess demand. Using data
from the 1980s for the state of Wisconsin, Nyman (1985; 1988) found that the number of severity-
weighted deficiency citations were not affected by Medicaid reimbursement rates if there was no
excess demand, but were higher (lower quality) if there was excess demand. Since then, occupancy
rates have declined as alternatives to nursing homes have become available and excess demand is
typically no longer an issue.
In summary, the studies identified generally found that higher Medicaid reimbursement
rates lead to higher nurse staffing levels, but the results on resident outcomes were mixed. The
overall evidence on the link between quality and reimbursement has not been widely examined,
despite the importance of this question. Several reasons for the limited research in this area include
the lack of a standard definition of quality, and significant variation in data collection, methods,
and quality measures. Finally, none of the studies reviewed included resident and/or family views
of the nursing home experience.

4
STUDY DATA AND METHODS
Information from multiple sources was used in this study. We first compared Ohio’s
Medicaid reimbursement rates to other states. Data for this component were obtained from the
Brown University Long-Term Care Focus website. The data contains per diem Medicaid
reimbursement rates for the lower forty-eight states from calendar years 2000 to 2009. These rates
have been adjusted for inflation to 2009 dollars by researchers at Brown University.
The main analysis for our study used data on Ohio’s Medicaid-reimbursed nursing facilities
from an array of sources. First, facility-specific Medicaid reimbursement rates were provided by
the Ohio Department of Medicaid (ODOM). The reimbursement data included the rates that would
have been in place had the price system been fully enacted in 2007 and the actual reimbursement
rates. Second, to examine the characteristics of facilities impacted by the implementation to the
price system and how quality in those facilities change over time, the reimbursement data were
merged with facility-level data from the Online Survey Certification and Reporting System
(OSCAR), Certification and Survey Provider Enhanced Reports (CASPER), and the Ohio resident
and family satisfaction surveys. These sources of data provided information on facility structure,
number of deficiencies, staffing levels, and satisfaction. Satisfaction scores are from surveys for
the closest available year. We should note that because of data availability, the analysis focuses on
the 811 nursing homes that had reimbursement and quality data for Fiscal Years 2007 and Fiscal
Years 2012.
We also use quality information from the Minimum Data Set (MDS) to construct resident-
level measures of quality for long-stay residents as defined by the Center for Medicaid and
Medicare Service’s (CMS) Nursing Home Compare website. We only use MDS to compare
quality in Fiscal Year 2007 because the MDS changed from version 2.0 to version 3.0 in 2011.
Many of the items collected in MDS 3.0 were changed as was the CMS approach to calculating
the quality measures.
OHIO NURSING HOME REIMBURSEMENT RATES IN A NATIONAL CONTEXT
Prior to 2006, Ohio’s nursing home per diem Medicaid reimbursement was primarily based
on the cost of providing care for each specific facility. This system lead to significant variation in
reimbursement rates across the state. Facilities with higher direct care and higher capital costs
received higher reimbursement rates. Policy-makers were concerned that this system rewarded
facilities for inefficient staffing and promoted strategies that increased capital costs to enhance
reimbursement rates. In fact, there was some concern that the rate Ohio was paying nursing homes
was not aligned with what other states were paying. To reward providers that had more efficient
staffing patterns and to reduce payments for facilities that the state believed to be overstaffed, the
state legislature in 2005, revised the reimbursement system. This law became effective starting
Fiscal Year 2006 (July 1, 2006).

5
Data comparing the average Ohio reimbursement rate to other states shows that in 2003,
prior to the shift to the new pricing system, Ohio’s reimbursement rate was the sixth highest in the
nation (See Table 1). In 2006, average reimbursement dropped to $173.34 which corresponded to
the 13th highest reimbursement rates and by 2009, Ohio was ranked 21st with an average rate of
$167.25.
Figure 1 summarizes the average Medicaid reimbursement rate paid between 2000 and
2009 for Ohio (solid black line), the average in the United States (dotted line) and the lowest
(dashed line) and highest (dash-dotted line) reimbursement rate in the United States. Ohio had a
higher reimbursement rate than the average for the entire period, with Ohio having its highest rate
compared to the U.S. average in 2003. However, since the passage of the price system and other
policy changes made in the state, there has been a convergence of Ohio with the U.S. average.
Figure 1. Nursing Home Medicaid Rates
$75.00
$95.00
$115.00
$135.00
$155.00
$175.00
$195.00
$215.00
$235.00
$255.00
2000 2001 2002 2003 2004 2005 2006 2007 2008 2009
Ave
rag
e P
er D
iem
(20
09 D
olla
rs)
Figure 1Nursing Home Medicaid Rates
Ohio
U.S. Average
Highest State
Lowest State

6
Table 1. Average Medicaid Reimbursement Rates (Adjusted for Inflation)
Table 1: Average Medicaid Reimbursement Rates (Adjusted for Inflation)
Ranking State Rate ($) State Rate ($) State Rate ($) State Rate ($)
1 NY 200.13 DE 215.54 NY 222.15 NY 228.52
2 CT 188.83 NY 206.72 CT 217.87 MD 218.25
3 NJ 158.98 CT 195.85 DE 206.61 CT 216.69
4 MA 155.05 MD 189.42 MD 198.34 OR 211.14
5 PA 153.10 MI 184.19 MA 190.63 DE 210.65
6 MD 152.16 OH 180.06 NH 189.85 NH 194.97
7 NC 152.14 NJ 175.26 OR 187.19 MA 194.70
8 WA 151.71 MA 175.13 PA 181.69 FL 192.49
9 OH 151.67 FL 172.42 RI 179.91 PA 188.70
10 NH 148.12 RI 165.21 WV 179.82 RI 186.49
11 DE 146.56 WV 164.96 ME 175.32 VT 180.92
12 MN 145.54 VT 161.62 NV 175.09 ND 180.90
13 ID 144.96 ID 161.40 OH 173.34 ME 176.94
14 RI 144.53 OR 159.57 FL 172.97 MS 176.05
15 ME 144.21 WI 157.87 NJ 169.53 NV 175.81
16 WV 141.60 WA 156.74 ID 166.72 CO 174.61
17 FL 141.32 ME 154.86 VT 164.01 NM 174.56
18 VT 140.21 CO 153.27 MS 162.73 NJ 174.08
19 AL 140.18 NC 153.06 CO 162.36 WV 172.00
20 CO 139.04 ND 151.21 WA 161.65 ID 171.29
21 CA 137.36 MN 150.78 ND 159.02 OH 167.25
22 ND 130.72 IN 150.17 MN 156.37 AZ 167.09
23 NV 125.81 NH 148.39 AL 155.66 AL 166.42
24 KY 125.00 AL 148.04 CA 153.78 WA 164.93
25 AZ 124.03 PA 144.75 AZ 148.94 WI 162.79
26 MI 123.16 WY 144.01 MT 148.81 MN 162.62
27 WI 123.03 NV 141.83 MI 148.67 CA 162.45
28 WY 121.94 AZ 140.78 TN 146.87 MI 160.08
29 OR 118.87 CA 137.62 WI 146.29 MT 158.84
30 SC 117.54 MS 135.80 NM 144.28 WY 158.17
31 MT 117.14 GA 133.19 NC 142.72 NC 156.59
32 NM 115.80 VA 130.64 IN 142.38 IN 151.15
33 IN 115.63 SC 126.54 UT 141.46 VA 150.23
34 MO 114.16 KY 125.62 VA 140.07 UT 149.95
35 MS 112.58 MT 123.91 WY 138.52 SC 147.58
36 UT 112.34 UT 123.05 SC 137.75 TN 147.38
37 IL 112.18 NM 119.65 AR 133.66 AR 143.59
38 VA 111.46 NE 119.28 KS 131.21 KY 138.17
39 IA 107.00 AR 118.52 KY 130.35 GA 135.59
40 GA 104.19 IA 117.60 GA 125.03 KS 135.21
41 KS 104.05 KS 115.26 LA 119.51 LA 133.87
42 TX 104.05 MO 113.45 IA 119.27 OK 129.18
43 TN 101.84 TX 112.20 NE 115.36 MO 126.12
44 NE 101.42 TN 110.96 MO 114.86 IA 126.10
45 SD 99.15 OK 109.81 TX 112.11 TX 122.35
46 AR 86.40 SD 106.80 OK 110.22 NE 120.46
47 LA 85.91 IL 105.49 SD 107.86 IL 117.44
48 OK 82.92 LA 100.50 IL 105.08 SD 114.03
Average 128.66 145.60 154.46 164.07
Median 124.52 146.40 151.36 163.86
Year 2000 Year 2003 Year 2006 Year 2009
The table reports the average per diem reimbursement rates for nursing home care in each
calander year. Rates are adjusted for inflation and are reported in year 2009 dollars. The table
excludes Alaska and Hawaii. The source of this data is Brown University LTC Focus website.

7
OHIO’S PRICE SYSTEM AND FACILITY SPECIFIC RATES
Prior to the new price system, the majority of a specific nursing home’s reimbursement rate
was determined by the costs incurred in providing care in that facility. Nursing homes that had
higher staffing ratios received a higher rate of reimbursement. Under the price system, the majority
of the reimbursement rate is determined by categorizing facilities into peer groups – with nursing
homes within that peer group receiving the same base reimbursement rate. A peer group is defined
using two factors – location and size. Location divides the state into three geographic groups based
on the county the nursing home is located. Facilities are classified into small and large using a 100
bed cut-off. Each nursing home is then categorized into one of six peer groups.
To calculate total reimbursement rates, under the new price system there are five
components that determine the Medicaid rate: direct care costs, capital costs, ancillary service
costs, taxes, quality incentives, and franchise taxes. Table 2. Price System Reimbursement Components
Table 2. Price System Reimbursement Components
Reimbursement Component How It Varies
Direct Care Costs Capital Costs
Ancillary & Support Costs Tax Costs
Franchise Costs Quality Incentive
Peer Group*Case-mix Peer Group Peer Group
Facility-specific No variation
Facility-specific
The largest component of the price system and the one with the most variation across
nursing homes is the direct care costs. Direct care costs reflect the costs of nursing, nursing aide
and other direct care staff in providing assistance to residents. Within each peer group, a specific
adjustment factor is calculated per case-mix unit for the median nursing home in the peer group.
This factor is then multiplied by the level of need (i.e. case-mix) of the average resident in the
facility.
Capital costs reflect the cost of ownership, such as depreciation, interest, or rent of land
and buildings. Ancillary and support services include all reasonable costs incurred that are not
direct care or capital costs. These include activities, social services, laundry, housekeeping, and
utilities, among other things. Both of these cost components were paid the same rate within each
peer group, with each component’s rate determined by the per diem cost of the median nursing
home within the peer group.
Tax costs reflect the reimbursement for real estate, commercial activities taxes, and
property taxes. These rates are specific to each facility, with some nursing homes receiving no
payments because they are not-for-profits. Another tax, which is broken out separately by the state

8
is the franchise cost (i.e. bed tax). All nursing homes in the state are required to pay the same bed
tax and there should be no variation across the state. Finally, Ohio includes a quality incentive as
part of Medicaid reimbursement. This rate is specific to the facility and is determined by the facility
meeting a certain set of criteria.
The implementation of the price system was expected to decrease reimbursement rates for
some facilities, and increase reimbursement rates for others. To reduce the immediate impact on
facilities, the state also passed a stop-loss/gain provision to allow rates to transition slowly to the
new price system. The provision stated that facilities could not have their reimbursement rates
increased or cut by more than 2% per fiscal year. This provision was effective from July 1, 2006
to June 30, 2011 (Fiscal Years 2007 to 2011).
UNDERSTANDING THE LINK BETWEEN REIMBURSEMENT AND QUALITY
The critical policy question raised by these reimbursement changes is simply: what is the
link between reimbursement rate and quality? Do facilities that receive a higher reimbursement
rate have higher quality outcomes? And if higher priced facilities experience reimbursement cuts,
will quality be negatively impacted?
Do facilities with higher reimbursement rates demonstrate higher quality?
To address this question we examined reimbursement and quality measures for the first
half of fiscal year 2007; the period before any reimbursement system changes. To determine if
there were differences in quality we classified facilities into one of four reimbursement groupings.
Group 1 included facilities that were “close” to price in 2007. These facilities were defined as
having an actual reimbursement rate that was within 5% (plus or minus) of the price reimbursement
rate. A second group of facilities included those with reimbursement rates below the price rate,
who would likely see reimbursement rates increase under the price system. These facilities were
defined as having an actual reimbursement rate that was at least 5% below the price rate. Finally,
two groups of facilities with actual reimbursement rates above price were identified and there was
an expectation that reimbursement would decline with implementation of the price system. The
first of these groups had an actual reimbursement rate 5 to 15% above the price rate and the second
of these groups had an actual reimbursement rate 15% or greater over price. Examining these
groups prior to the system changes allowed us to look at the link between level of reimbursement
and quality. In conducting this analysis, average quality levels were adjusted for a host of facility
characteristics and, for the resident outcome measures, resident demographic and case-mix
characteristics using a statistical technique called linear regression.

9
Table 3 shows the actual reimbursement rate paid to facilities in Fiscal 2007 and the price
rate, reflecting the rate the facility would have received in Fiscal Year 2007 if the price system was
fully implemented. The final column under Fiscal Year 2007 reports the expected decline in the
actual reimbursement the facility would be expected to receive if the price system was fully
implemented in Fiscal Year 2007. For this column, negative numbers imply increases in
reimbursement and positive numbers represent declines in reimbursement.
In Fiscal Year 2007, the average nursing home received $160.92 but if the price system
had been fully enacted, the average rate would have been $1.48 lower at $159.45. The range in the
difference between daily reimbursement rates in 2007 was substantial; $140 per day, with lowest
facility reimbursement at $112.50 and the highest at $253.40. Almost half (45%) of facilities were
found to be within 5% of price, with the average facility in this category having actual
reimbursement rates within 11 cents of price. Slightly under one-quarter of facilities had
reimbursement rates that were at least 5% below price. For this group, actual reimbursement rates
averaged $143.69 per day but under the price system these facilities would have received about
$18 more per day, to an average reimbursement of $161.67. In contrast, more than 30% of facilities
had actual reimbursement rates at least 5% over price, with 22% having actual reimbursement rates
5 to 15% over price and almost 9% having actual reimbursement rates 15% or more over price.
For the 5-15% group, the average reimbursement per day would need to decline by about $15 per
day in order for actual reimbursement rates to get to price. For the facilities the furthest over price,
this change would amount to a reduction of $31.44 per day.
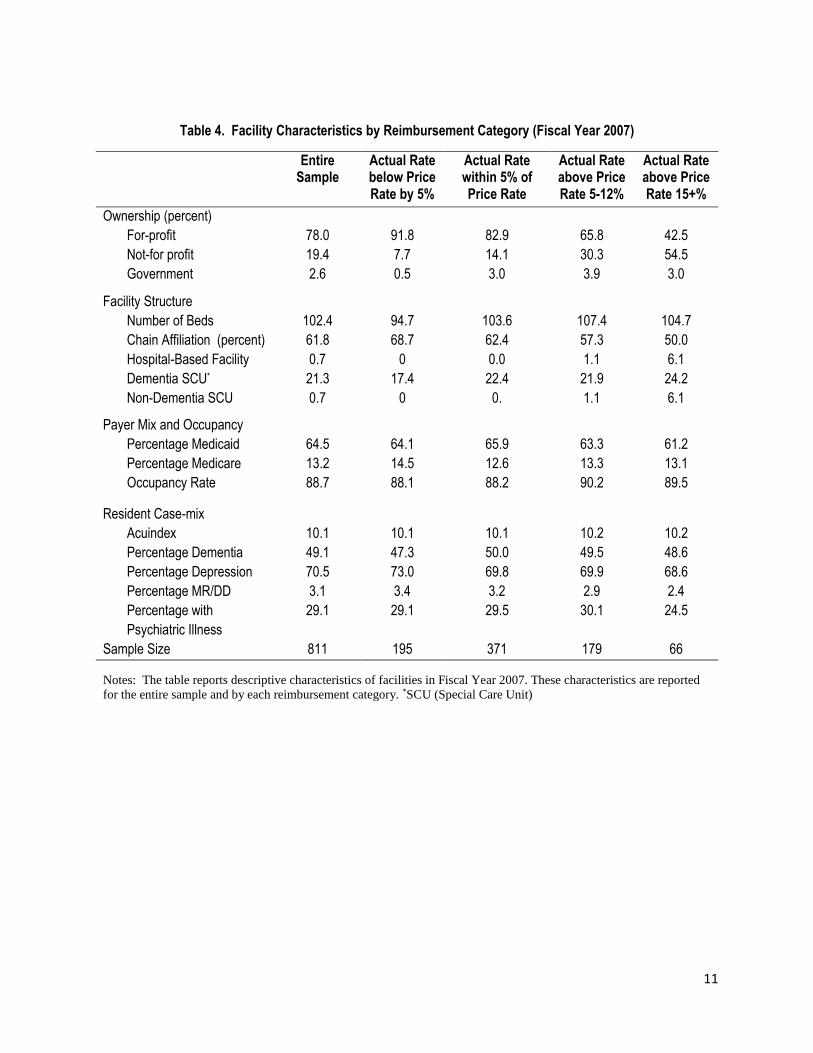
Table 4 presents the characteristics of all nursing homes that fall into each rate group based
on reimbursement in FY 2007. Nursing homes that had actual reimbursement rates below the rates
dictated by the price system were predominately for-profit (91.8%). Facilities that had actual rates
over the price rate had a greater mix of for-profit and not-for-profit ownership. For the facilities
that were 15+% above price, 55% were not-for-profit and 43% are for-profit. Given the distribution
of ownership in the state, not-for-profits were considerably more likely to be above price in the
2007 system.
Also more likely to be above price are independent facilities (i.e., not part of a chain),
hospital-based facilities and those with special care units. As for payer-mix and occupancy rates,
we do not see any significant patterns across the four groups. Additionally, resident case-mix,
which is measured at the facility level, tends to be rather similar across the four groups. The one
thing that does stand out is the group 15+% above price has a smaller percentage of residents with
other psychiatric illnesses, such as schizophrenia or bipolar disorder.

10
Table 3. Nursing Facility Actual and Price Reimbursement Rates 2007
Table 3. Nursing Facility Actual and Price Reimbursement Rates 2007
Fiscal Year 2007†
Rate Categorization in
First Half of FY 2007
Sample Size
% of Facilities
Actual Paid Rate
(Dollars)
Price Rate
Expected Decline
in Rates
All Facilities 811
100
Average 160.92 159.45 1.48
Lowest 112.50 122.03 -45.00
Highest 253.40 202.98 74.64
Actual Rate below Price
Rate by 5%
195
24
Average 143.69 161.67 -17.98
Lowest 112.50 133.18 -45.00
Highest 181.66 202.98 -7.83
Actual Rate within 5% of
Price Rate
371
46
Average 158.81 158.92 -.11
Lowest 122.70 122.03 -8.97
Highest 199.43 191.06 9.02
Actual Rate above Price
Rate 5-15%
179
22
Average 174.75 159.83 14.91
Lowest 137.42 129.42 6.68
Highest 217.95 193.24 28.34
Actual Rate above Price
Rate 15+%
66
8
Average 186.23 154.79 31.44
Lowest 157.61 131.36 21.06
Highest 253.40 201.47 74.64
Notes: Nursing homes are categorized based into four groups on the expected change in the facilities per diem reimbursement rate if the
Price system was fully enacted in FY 2007. The sample is restricted to only nursing homes that had complete data for FY 2007 and 2012.
The actual rate paid refers to the per diem rated paid to the facility in that fiscal year. The price rate refers to the per diem rate the facility
would have received if the price system went into full effect in that fiscal year.
†Fiscal Year 2007 refers to reimbursement rates in the first half of FY 2007 (July 1, 2006 to December 31, 2006)
11
Table 4. Facility Characteristics by Reimbursement Category (Fiscal Year 2007)
Table 4. Facility Characteristics by Reimbursement Category (Fiscal Year 2007)
Entire Sample
Actual Rate below Price Rate by 5%
Actual Rate within 5% of Price Rate
Actual Rate above Price Rate 5-12%
Actual Rate above Price Rate 15+%
Ownership (percent)
For-profit 78.0 91.8 82.9 65.8 42.5
Not-for profit 19.4 7.7 14.1 30.3 54.5
Government 2.6 0.5 3.0 3.9 3.0
Facility Structure
Number of Beds 102.4 94.7 103.6 107.4 104.7
Chain Affiliation (percent) 61.8 68.7 62.4 57.3 50.0
Hospital-Based Facility 0.7 0 0.0 1.1 6.1
Dementia SCU* 21.3 17.4 22.4 21.9 24.2
Non-Dementia SCU 0.7 0 0. 1.1 6.1
Payer Mix and Occupancy
Percentage Medicaid 64.5 64.1 65.9 63.3 61.2
Percentage Medicare 13.2 14.5 12.6 13.3 13.1
Occupancy Rate 88.7 88.1 88.2 90.2 89.5
Resident Case-mix
Acuindex 10.1 10.1 10.1 10.2 10.2
Percentage Dementia 49.1 47.3 50.0 49.5 48.6
Percentage Depression 70.5 73.0 69.8 69.9 68.6
Percentage MR/DD 3.1 3.4 3.2 2.9 2.4
Percentage with
Psychiatric Illness
29.1 29.1 29.5 30.1 24.5
Sample Size 811 195 371 179 66
Notes: The table reports descriptive characteristics of facilities in Fiscal Year 2007. These characteristics are reported
for the entire sample and by each reimbursement category. *SCU (Special Care Unit)
12
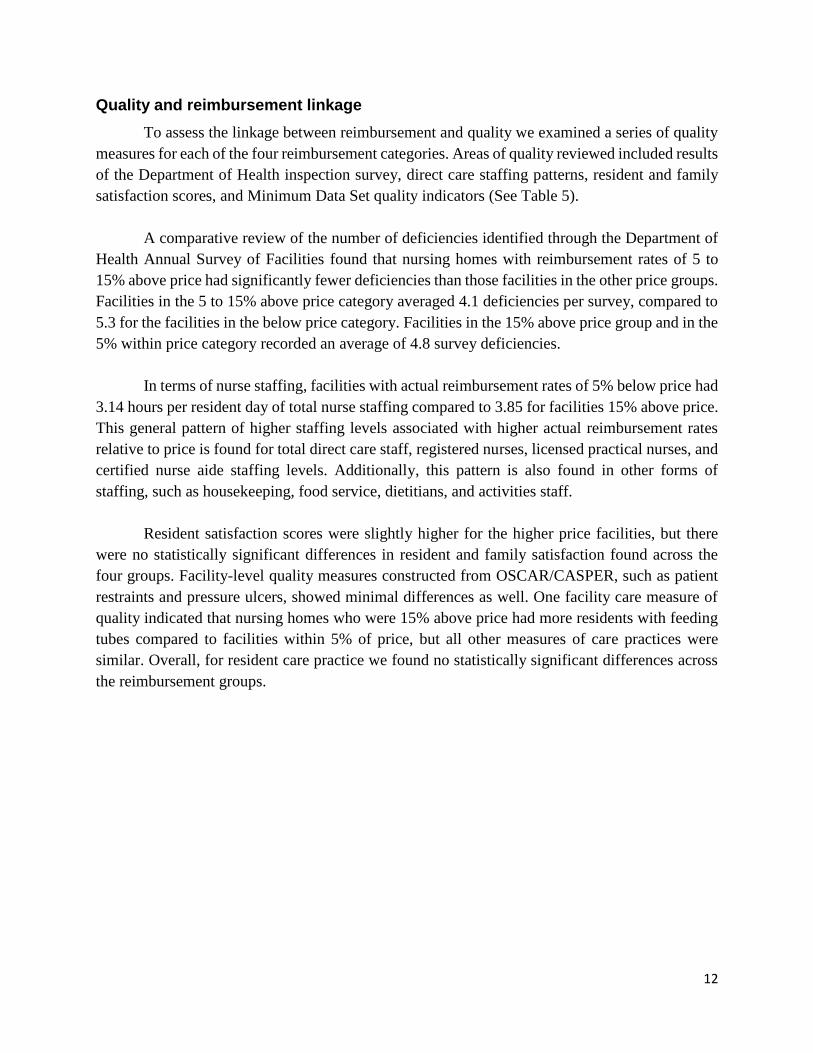
Quality and reimbursement linkage
To assess the linkage between reimbursement and quality we examined a series of quality
measures for each of the four reimbursement categories. Areas of quality reviewed included results
of the Department of Health inspection survey, direct care staffing patterns, resident and family
satisfaction scores, and Minimum Data Set quality indicators (See Table 5).
A comparative review of the number of deficiencies identified through the Department of
Health Annual Survey of Facilities found that nursing homes with reimbursement rates of 5 to
15% above price had significantly fewer deficiencies than those facilities in the other price groups.
Facilities in the 5 to 15% above price category averaged 4.1 deficiencies per survey, compared to
5.3 for the facilities in the below price category. Facilities in the 15% above price group and in the
5% within price category recorded an average of 4.8 survey deficiencies.
In terms of nurse staffing, facilities with actual reimbursement rates of 5% below price had
3.14 hours per resident day of total nurse staffing compared to 3.85 for facilities 15% above price.
This general pattern of higher staffing levels associated with higher actual reimbursement rates
relative to price is found for total direct care staff, registered nurses, licensed practical nurses, and
certified nurse aide staffing levels. Additionally, this pattern is also found in other forms of
staffing, such as housekeeping, food service, dietitians, and activities staff.
Resident satisfaction scores were slightly higher for the higher price facilities, but there
were no statistically significant differences in resident and family satisfaction found across the
four groups. Facility-level quality measures constructed from OSCAR/CASPER, such as patient
restraints and pressure ulcers, showed minimal differences as well. One facility care measure of
quality indicated that nursing homes who were 15% above price had more residents with feeding
tubes compared to facilities within 5% of price, but all other measures of care practices were
similar. Overall, for resident care practice we found no statistically significant differences across
the reimbursement groups.

13
Table 5. Baseline Quality in Fiscal Year 2007 by Reimbursement Categorization
Table 5. Baseline Quality in Fiscal Year 2007 by Reimbursement Categorization
Actual Rate below Price Rate by 5%
Actual Rate within 5% of Price Rate
Actual Rate above Price Rate 5-15%
Actual Rate above Price Rate 15+%
Number of Deficiencies 5.373 4.795 4.068** 4.758
Nursing Staffing (Hours Per Resident Day) Total 3.143*** 3.407 3.599*** 3.846*** Registered Nurse 0.274* 0.295 0.320 0.330 Licensed Practical Nurse 0.806 0.843 0.939*** 1.010*** Certified Nurse Aides 2.064*** 2.269 2.341 2.505***
Other Staffing (Hours Per Resident Day) Housekeeping 0.435*** 0.502 0.564*** 0.605** Food Service 0.655** 0.709 0.769** 0.898** Dietitians 0.023** 0.031 0.038 0.030 Activities 0.193 0.204 0.221** 0.236
Satisfaction Score (0-100) Resident 85.337 86.556 86.877 87.347 Family 85.641 85.878 85.651 85.416
Facility Care Practices (% of Residents) Facility-Acquired Physical Restraints 5.265 5.228 4.821 4.738 Facility-Acquired Catheters 2.418 1.812 1.834 1.915 Feeding Tubes 4.990 5.471 5.447 6.674**
Resident Quality Outcomes (% of Residents)
Facility-Acquired Pressure Ulcers 2.839 2.944 2.786 3.142 Facility-Acquired Contractures 15.854 15.168 17.660 18.513
Notes: The table reports the average adjusted-quality for each payment group and statistical tests compare the average adjusted-quality in each group compared to facilities with actual reimbursement rates within 5% of the price rate. Quality is adjusted using a linear regression that controls for-profit status, number of beds, chain membership, hospital-based facilities, presence of Alzheimer’s and other special care units, payer mix, occupancy rates, and facility-level case mix measures (acuindex and percent of residents with dementia, psychiatric illness, depression, MR/DD). Staffing outcome regressions exclude facilities that have staffing levels that are outside of three standard deviations from mean staffing. For deficiency, care practices, and quality outcomes higher numbers imply worse quality. For staffing and satisfaction quality measures, higher numbers imply better quality. ***p<0.01, ** p<0.05, * p<0.1
14
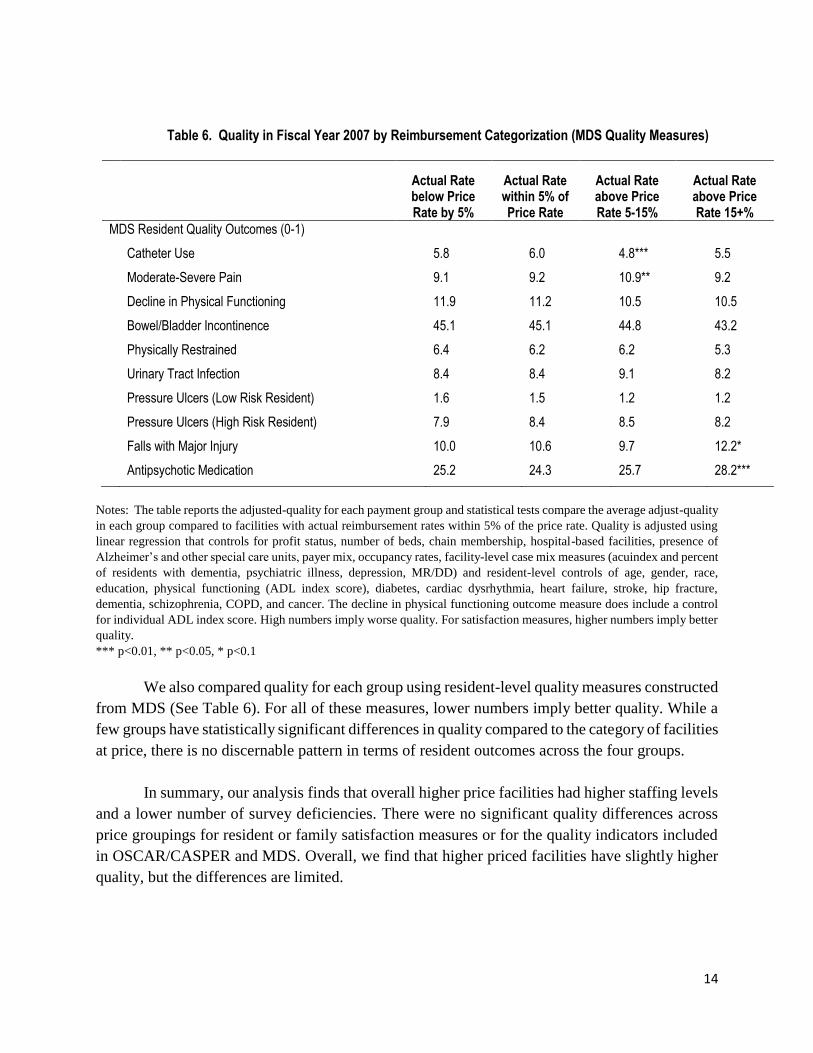
Table 6. Quality in Fiscal Year 2007 by Reimbursement Categorization (MDS Quality Measures)
Table 6. Quality in Fiscal Year 2007 by Reimbursement Categorization (MDS Quality Measures)
Actual Rate below Price Rate by 5%
Actual Rate within 5% of Price Rate
Actual Rate above Price Rate 5-15%
Actual Rate above Price Rate 15+%
MDS Resident Quality Outcomes (0-1)
Catheter Use 5.8 6.0 4.8*** 5.5
Moderate-Severe Pain 9.1 9.2 10.9** 9.2
Decline in Physical Functioning 11.9 11.2 10.5 10.5
Bowel/Bladder Incontinence 45.1 45.1 44.8 43.2
Physically Restrained 6.4 6.2 6.2 5.3
Urinary Tract Infection 8.4 8.4 9.1 8.2
Pressure Ulcers (Low Risk Resident) 1.6 1.5 1.2 1.2
Pressure Ulcers (High Risk Resident) 7.9 8.4 8.5 8.2
Falls with Major Injury 10.0 10.6 9.7 12.2*
Antipsychotic Medication 25.2 24.3 25.7 28.2***
Notes: The table reports the adjusted-quality for each payment group and statistical tests compare the average adjust-quality
in each group compared to facilities with actual reimbursement rates within 5% of the price rate. Quality is adjusted using
linear regression that controls for profit status, number of beds, chain membership, hospital-based facilities, presence of
Alzheimer’s and other special care units, payer mix, occupancy rates, facility-level case mix measures (acuindex and percent
of residents with dementia, psychiatric illness, depression, MR/DD) and resident-level controls of age, gender, race,
education, physical functioning (ADL index score), diabetes, cardiac dysrhythmia, heart failure, stroke, hip fracture,
dementia, schizophrenia, COPD, and cancer. The decline in physical functioning outcome measure does include a control
for individual ADL index score. High numbers imply worse quality. For satisfaction measures, higher numbers imply better
quality.
*** p<0.01, ** p<0.05, * p<0.1
We also compared quality for each group using resident-level quality measures constructed
from MDS (See Table 6). For all of these measures, lower numbers imply better quality. While a
few groups have statistically significant differences in quality compared to the category of facilities
at price, there is no discernable pattern in terms of resident outcomes across the four groups.
In summary, our analysis finds that overall higher price facilities had higher staffing levels
and a lower number of survey deficiencies. There were no significant quality differences across
price groupings for resident or family satisfaction measures or for the quality indicators included
in OSCAR/CASPER and MDS. Overall, we find that higher priced facilities have slightly higher
quality, but the differences are limited.

15
PRICE SYSTEM’S IMPACT ON QUALITY
The second question for the analysis is whether the change to a price system had an impact
on quality. In particular, one of the concerns was that reimbursement cuts to higher priced facilities
might result in a decline in quality. The first step in studying this question was to examine the
actual reimbursement changes between 2007 and 2012. As noted reimbursement changes from
2007 through 2011 included an annual 2% stop-loss/gain component. Effective with the start of
Fiscal Year 2012, the Ohio legislation eliminated the stop-loss/gain provision over two years. In
Fiscal Year 2012, rates were allowed to adjust by 10%, and additional adjustment over 10% was
shared by the state and the facility on a 50% basis. For example, a facility expected to see a 20%
cut would see a 15% reduction (10%, plus half of the additional 10% cut). In Fiscal Year 2013,
the stop-loss/gain provision was completely eliminated. The quality analysis in this study
compares Fiscal Year 2007 and Fiscal 2012. In Fiscal Year 2012, 136 nursing homes were subject
to a stop-loss provision. For these 136, if the stop-loss provision had not been in place,
reimbursement rates would have been $4.90 lower, but the impact would have varied considerably
ranging from as small as four cents per day to $46.30 per day. There were no nursing homes subject
to a stop-gain provision.
In looking at the actual reimbursement rates between Fiscal Years 2007 and 2011 (the last
year the 2% stop-loss/gain provision was in effect), the average nursing home received $176.17,
with the range from a low of $133.22 to a high of $257.97 (See Table 7). All four groups had
increases in actual reimbursement rates. Those expected to benefit from the transition to the price
system (actual rate 5% below price) saw average reimbursement rates increase from $143.69 in
2007 to $167.41 in 2011. For the group expecting the largest decreases in reimbursement (15% or
more over price), average actual rates went from $186.23 in 2007 to $192.58 in 2011.
Beginning in 2012, declines began to emerge. Statewide the average nursing home had a
reimbursement decline of $9 per day between Fiscal Year 2011 and 2012, from $176.17 to
$168.00, indicating that other policy changes had an impact on facility reimbursement rates.
Nursing homes who were 5% below price and thus expected to benefit from the price system saw
virtually no change in average reimbursement between Fiscal Years 2011 to 2012, but all other
groups did. The largest decreases occurred in nursing homes that were 15% above price in Fiscal
Year 2007. The decrease was $23.84 per day, going from $192.58 to $168.74. The range in
reimbursement rates was compressed in Fiscal Year 2012. These changes reflected the near
elimination of the stop-loss/gain provision and the change in how some reimbursement
components were calculated.

16
Table 7. Actual and Price Reimbursement Rates
Table 7. Actual and Price Reimbursement Rates
Fiscal Year 2007† Fiscal Year 2011†
Fiscal Year 2012†
Rate Categorization in First Half of FY 2007
Sample Size
% of Facilitie
s
Actual Paid Rate
Price Rate
Expected Decline in Rates
Actual Rate Paid
Actual Rate Paid
All Facilities
811
100
Average 160.92 159.45 1.48 176.17 168.01
Lowest 112.50 122.03 -45.00 133.22 130.89
Highest 253.40 202.98 74.64 257.97 208.43
Actual Rate below Price by
5%
195
24
Average 143.69 161.67 -17.98 167.41 167.78
Lowest 112.50 133.18 -45.00 133.22 134.15
Highest 181.66 202.98 -7.83 207.09 208.26
Actual Rate within 5% of
Price Rate
371
46
Average 158.81 158.92 -0.11 174.71 167.30
Lowest 122.70 122.03 -8.97 145.79 133.79
Highest 199.43 191.06 9.02 210.41 202.57
Actual Rate above Price
Rate 5-15%
179
22
Average 174.75 159.83 14.91 182.69 169.47
Lowest 137.42 129.42 6.68 145.74 130.89
Highest 217.95 193.24 28.34 223.22 208.43
Actual Rate above Price
Rate 15+%
66
8
Average 186.23 154.79 31.44 192.58 168.74
Lowest 157.61 131.36 21.06 164.40 143.24
Highest 253.40 201.47 74.64 257.97 208.26
Notes: Nursing homes are categorized based on four groups based on the expected change in the facility’s per diem reimbursement rate if the Price system was fully enacted in FY 2007. The sample is restricted to only nursing homes that had complete data for FY 2007 and 2012. The actual rate paid refers to the per diem rate paid to the facility in that fiscal year. The price refers to the per diem rate the facility would have received if the price system went into full effect in that fiscal year. †Fiscal Year 2007 refers to reimbursement rates in the first half of FY 2007 (July 1, 2006 to December 31, 2006). Fiscal Year 2011 refers to the second half of FY 2011(January 1, 2011 to June 30, 2011); and Fiscal Year 2012 refers to the second half of F2FY (January 1, 2012 to June 30, 2012).
To better show the transition to price over time, Figure 2 presents the average actual
reimbursement rates paid for each of the four groups from FY2007 to FY2012. The Figure shows
that in FY 2007 there was significant variation in the average rate across these four groups. By FY
2012, the average rate in all four groups converged, with rates declining for all but the group below
price.

17
Figure 2. Actual Reimbursement Rates by Rate Categorization
Figure 2
Quality Changes from Fiscal Year 2007 to 2012
To determine how the price system impacted quality, a statistical technique (linear
regression equations with facility fixed effects and a host of facility and resident controls) was
used to determine how each category of facilities changed on their quality outcomes from FY 2007
to 2012. Did facilities that received cuts or increases in reimbursement show declines or
improvements in quality?
Table 8 reports the change in quality between 2007 and 2012 for nursing homes based on
their reimbursement category in 2007. There were no statistically significant changes in the
number of deficiencies reported between 2007 and 2012. Nurse staffing and housekeeping staff
increased significantly in facilities in the 5% below price group. For example, total nurse staffing
increased 0.251 hours per resident day (15 minutes) and nurse aide staffing increased by 0.142
hours per resident day (8.5 minutes). Total nurse and aide staffing also increased in facilities within
5% of price slightly by about 4 minutes per resident per day. Facilities in the 5-15% above price
group substituted registered nurses for licensed practical nurses and reduced housekeeping staffing
levels. Facilities 15% above price lowered food service staffing levels. In looking at the remaining
quality measures we found resident satisfaction was stable between 2007 and 2012, but family
satisfaction scores declined for 3 of the 4 groups. Since these declines occurred even for facilities
regardless of reimbursement cuts, it is difficult to explain these results. Finally, two of the quality
indicators, physical restraints and contractures, showed improvement over the study period for all
groups.

18
Table 8. Change in Quality from FY 2007 to FY 2012
Table 8. Change in Quality from FY 2007 to FY 2012
Trends in Quality from FY 2007 to FY 2012
Actual Rate below Price Rate by 5%
Actual Rate within 5% of Price Rate
Actual Rate above Price Rate 5-15%
Actual Rate above Price Rate 15+%
Number of Deficiencies (#) 0.0008 0.247 0.745 0.122
Nurse Staffing (Hours Per Resident Day)
Total 0.251*** 0.073*** 0.005 -0.202
Registered Nurse 0.122*** 0.062*** 0.062*** 0.017
Licensed Practical Nurse -0.014 0.010 -0.052* -0.060
Certified Nurse Aides 0.142** 0.001 -0.005 -0.159
Other Staffing (Hours Per Resident Day)
Housekeeping 0.051** -0.001 -0.045** -0.075
Food Service 0.033 0.005 -0.039 -0.184*
Dietitians 0.002 -0.003 -0.005 0.000
Activities -0.004 0.000 -0.009 -0.028
Satisfaction Score (0-100)
Resident 0.629 -0.156 0.024 -1.382
Family -1.094* -0.830** -0.952* -0.532
Facility Care Practices (% of Residents)
Facility-Acquired Physical Restraints -3.035*** -2.609*** -2.751*** -1.785***
Facility-Acquired Catheters -0.296 0.139 -0.247 -0.399
Feeding Tubes -0.218 -0.394 -0.342 -0.814
Resident Quality Outcomes (% of Residents)
Facility-Acquired Pressure Ulcers 0.160 0.519 0.313 -0.422
Facility-Acquired Contractures -4.147** -2.608** -5.401*** -6.095**
Notes: The table reports the change (i.e. trend) in adjusted quality for each group over the FY 2007 to 2012 period. Quality is
adjusted using linear regressions controlling for profit status, number of beds, chain membership, hospital-based facilities,
presence of Alzheimer’s and other special care units, payer mix, occupancy rates, and facility-level case mix measures (acuindex
and percent of residents with dementia, psychiatric illness, depression, MR/DD) and facility fixed effects. For deficiency, care
practice, and quality outcomes measures, higher numbers imply worse quality. For staffing and satisfaction measures, higher
numbers imply better quality.
***p,0.01, ** p,0.05, * p,0.1

19
Although there are changes in some measures for all groups, Table 8 does not directly show
if these changes are due to other policies that affected all nursing homes similarly or were the
direct result of changes in the reimbursement rate the nursing home received. To answer this
question, we compared the three groups with reimbursement changes to the group that was already
at price on the quality measures. Any statistical difference is then likely to be the result of a change
in reimbursement and not from other policies. These results are summarized in Table 9. If the
change in quality over the period was statistically different from the group of facilities with actual
rates within 5% of price (we call the reference group) the differences are noted in the table.
Our analysis of staffing levels found that facilities with actual rates 15% or above price did
reduce the total nursing staff, and the 5-15% above price group reduced the number of licensed
practical nurses. Staffing levels were found to decrease in the facilities above price for
housekeeping and food service staff relative to the group that was at price to begin with. Staffing
levels for registered nurses, certified nursing assistants and housekeepers increased in the facilities
5% below price. In reviewing the direct quality measures, relative to those facilities within 5% of
price, there were no statistically significant differences in quality for the number of deficiencies
and satisfaction measures. We also found that the majority of resident quality indicators, as
measured by the OSCAR/CASPER showed no statistical differences relative to the group that was
at price. In one case where a difference was noted, quality actually improved for facilities in the
15% over price category, a group that received the largest cut in reimbursement.
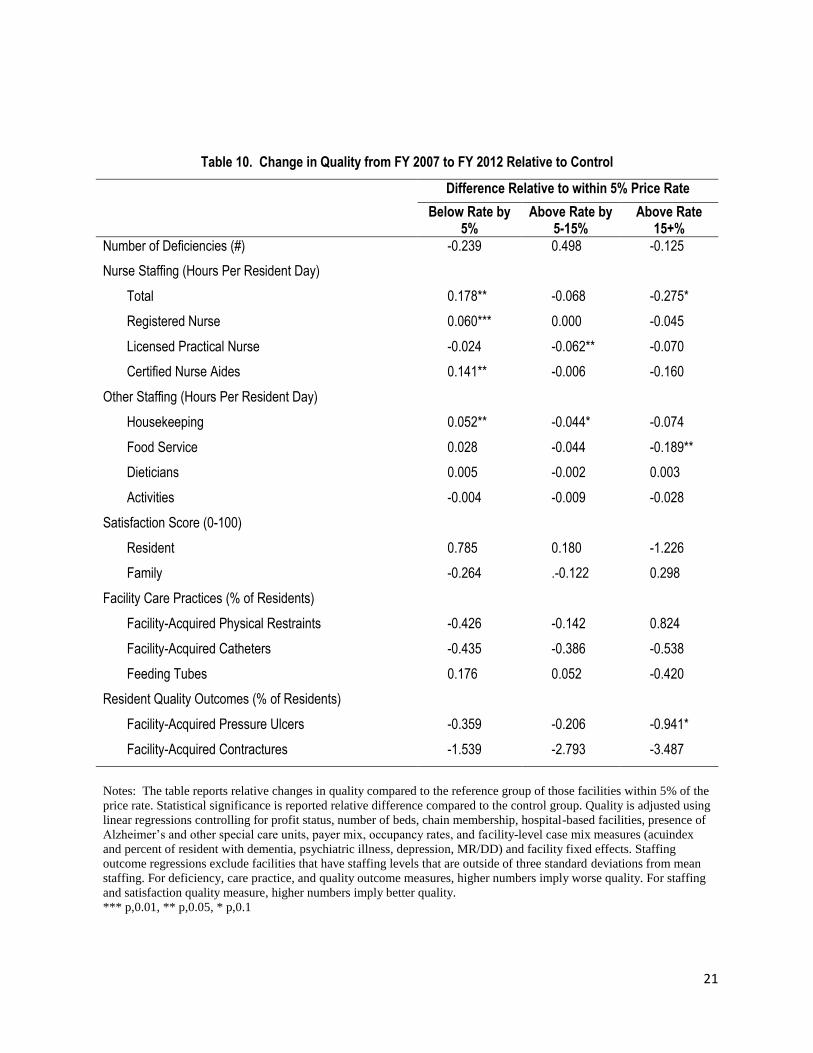
A more detailed presentation of quality changes is shown in Table 10. As noted in the
description of Table 9, only the staffing measures showed statistically significant changes over
time. The group under price increased the total number of nursing and nursing aide staff by 0.178
hours per resident day (about 10 minutes). The group 15% over price decreased the total number
of nursing and aide staff by about 0.275 hours per resident day (16.5 minutes). These changes were
statistically significant. Although there were other changes in the quality outcomes, such as the
group between 5 to 15% over price showing a 0.5 increase in the number of survey deficiencies
compared to the group already at price, none of these changes were statistically significant.

20
Table 9. Change in Quality from FY 2007 to FY 2012 Relative to Control
Table 9. Change in Quality from FY 2007 to FY 2012 Relative to Control
Difference Relative to within 5% Price Rate
Below Rate by 5%
Above Rate by 5-15%
Above Rate 15+%
Number of Deficiencies (#) N.S. N.S. N.S.
Nurse Staffing (Hours Per Resident Day)
Total Increase N.S. Decrease
Registered Nurse Increase N.S. N.S.
Licensed Practical Nurse N.S. Decrease N.S.
Certified Nurse Aides Increase N.S. N.S.
Other Staffing (Hours Per Resident Day)
Housekeeping Increase Decrease N.S.
Food Service N.S. N.S. Decrease
Dieticians N.S. N.S. N.S.
Activities N.S. N.S. N.S.
Satisfaction Score (0-100)
Resident N.S. N.S. N.S.
Family N.S. N.S. N.S.
Facility Care Practices (% of Residents)
Facility-Acquired Physical Restraints N.S. N.S. N.S.
Facility-Acquired Catheters N.S. N.S. N.S.
Feeding Tubes N.S. N.S. N.S.
Resident Quality Outcomes (% of Residents)
Facility-Acquired Pressure Ulcers N.S. N.S. Lower
Facility-Acquired Contractures N.S. N.S. N.S.
Notes: The table reports relative changes in adjusted-quality between FY 2007 and FY 2012 for each price group
relative to facilities within 5% of the price rate group. Details on adjustment process are reported in the appendix.
N.S. = No statistically significant difference at the 10% level.
Better/Increase = Improvement in quality measure of higher staffing levels.
Lower/Decrease = Decline in quality measure or lower staffing levels.
21
Table 10. Change in Quality from FY 2007 to FY 2012 Relative to Control
Table 10. Change in Quality from FY 2007 to FY 2012 Relative to Control
Difference Relative to within 5% Price Rate
Below Rate by 5%
Above Rate by 5-15%
Above Rate 15+%
Number of Deficiencies (#) -0.239 0.498 -0.125
Nurse Staffing (Hours Per Resident Day)
Total 0.178** -0.068 -0.275*
Registered Nurse 0.060*** 0.000 -0.045
Licensed Practical Nurse -0.024 -0.062** -0.070
Certified Nurse Aides 0.141** -0.006 -0.160
Other Staffing (Hours Per Resident Day)
Housekeeping 0.052** -0.044* -0.074
Food Service 0.028 -0.044 -0.189**
Dieticians 0.005 -0.002 0.003
Activities -0.004 -0.009 -0.028
Satisfaction Score (0-100)
Resident 0.785 0.180 -1.226
Family -0.264 .-0.122 0.298
Facility Care Practices (% of Residents)
Facility-Acquired Physical Restraints -0.426 -0.142 0.824
Facility-Acquired Catheters -0.435 -0.386 -0.538
Feeding Tubes 0.176 0.052 -0.420
Resident Quality Outcomes (% of Residents)
Facility-Acquired Pressure Ulcers -0.359 -0.206 -0.941*
Facility-Acquired Contractures -1.539 -2.793 -3.487
Notes: The table reports relative changes in quality compared to the reference group of those facilities within 5% of the
price rate. Statistical significance is reported relative difference compared to the control group. Quality is adjusted using
linear regressions controlling for profit status, number of beds, chain membership, hospital-based facilities, presence of
Alzheimer’s and other special care units, payer mix, occupancy rates, and facility-level case mix measures (acuindex
and percent of resident with dementia, psychiatric illness, depression, MR/DD) and facility fixed effects. Staffing
outcome regressions exclude facilities that have staffing levels that are outside of three standard deviations from mean
staffing. For deficiency, care practice, and quality outcome measures, higher numbers imply worse quality. For staffing
and satisfaction quality measure, higher numbers imply better quality.
*** p,0.01, ** p,0.05, * p,0.1

22
SUMMARY AND CONCLUSION
As a result of an array of policy changes Ohio has reduced its Medicaid reimbursement
rate compared to other states around the nation. In 2003, Ohio’s Medicaid reimbursement rate
ranked 6th in the nation, and by 2009 the ranking was 21st. One of the elements of Ohio’s revised
Medicaid reimbursement strategy was a move toward a price system implemented beginning in
July 2006. A stop- loss/gain provision modified the size of changes until Fiscal 2012. With other
reimbursement changes occurring and the stop-gain/loss provision in place, Ohio nursing homes,
even those in the high price group, did not see reimbursement reductions until 2012. Beginning in
Fiscal 2012 noticeable reimbursement changes were recorded and in this context the research
questions for this study were: (1) Is there a link between reimbursement rates and quality? (2) Did
reductions in Ohio’s Medicaid reimbursement rate impact the quality of Ohio nursing homes?
Our analysis examined a series of quality indicators in 2007 to comparable measures in
2012. Over the six year time period direct care staffing significantly increased for the facilities in
the below price grouping. Family satisfaction, even for the group below price, was reduced over
the time period. We do not have a definitive explanation for this finding. When comparing quality
changes to the group that was already at price we continued to find that facilities in the group that
was below price in 2007 did increase direct care staffing, while the groups above price experienced
staffing reductions. Our analysis across the array of quality measures did not find any significant
changes in quality across the three groups compared to the group at price (the reference group).
Ultimately, decisions about reimbursement have to be about cost-effectiveness. Do the
increased staffing costs generate improved outcomes for residents? While the data indicate direct
care staffing has become more uniform, to this point there do not appear to be major impacts on
quality. There are important provisos to this finding. First, it will be important to look at these data
for Fiscal 2013, where more sizable changes may be experienced. Also, it is possible that facilities
were able to call on reserves or other approaches to mitigate changes and these protections could
become more limited over time. Finally, through an array of changes Ohio has been able to realign
the Medicaid reimbursement system and it will be important to examine any further system cuts
in the context of the overall Medicaid reimbursement changes already experienced.

23
REFERENCES
Bowblis, J. R., Crystal, S., Intrator, O., & Lucas, J. A. (2012). Response to regulatory stringency:
The case of antipsychotic medication use in nursing homes. Health Economics, 21(8):
977-93.
Grabowski, D. C. (2001a). Does an increase in the Medicaid reimbursement rate improve
nursing home quality? Journal of Gerontology, 56B (2): S84-S92.
Grabowski, D. C. (2001b). Medicaid reimbursement and the quality of nursing home care.
Journal of Health Economics, 20:549-569.
Grabowski, D. C. (2004). A longitudinal study of Medicaid payment, private-pay price and
nursing home quality. International Journal of Health Care Finance and Economics, 4:
5-26.
Harrington C., Swan J. H., & Carrillo, H. (2007). Nurse staffing levels and Medicaid
reimbursement rates in nursing facilities. Health Services Research, 42(3):1105-1129.
Hyer K., Temple A., & Johnson, C. E. (2009). Florida’s efforts to improve quality of nursing
home care through nurse staffing standards, regulation, and Medicaid reimbursement.
Journal of Aging & Social Policy, 21:318-337.
Intrator, O., & Mor, V. (2004). Effect of state Medicaid reimbursement rates on hospitalizations
in nursing homes. Journal of the American Geriatrics Society, 52(3): 393-398.
Medicaid Nursing Home Reimbursement Rates by State Available at http://ltcfocus.org/
Mor, V., Gruneir, A., Feng, Z., Grabowski, D. C., Intrator, O., & Zinn, J. (2011). The effect of
state policies on nursing home resident outcomes. Journal of the American Geriatrics
Society, 59(1): 3-9.
Nyman, J. A. (1985). Prospective and ‘cost-plus’ Medicaid reimbursement, excess Medicaid
demand, and the quality of nursing home care. Journal of Health Economics, 4:237-59.
Nyman, J. A. (1988). Excess demand, the percentage of Medicaid patients, and the quality of
nursing home care. Journal of Human Resources, 23(1): 76-92.

24
Park, J., & Stearns, S. C. (2009). Effects of state minimum staffing standards on nursing home
staffing and quality of care. Health Services Research, 44(1): 56-78.
Straker, J. K., Ejaz, F. K., McCarthy, C., Jones, J.A. 2007. Developing and testing a satisfaction
survey for nursing home residents: The Ohio experience. Journal of Aging & Social
Policy, 19(2): 83-105.
Teno, J. M., Feng, Z., Mitchell, S. L., Kuo, S., Intrator, O., & Mor V. (2008). Do financial
incentives of introducing case mix reimbursement increase feeding tube use in nursing
home residents? Journal of the American Geriatrics Society (56):887-890.