Assessment of Reimbursement Rates for Medicaid...
22
Joint Legislative Audit and Review Commission of the Virginia General Assembly Assessment of Reimbursement Rates for Medicaid Home and Community-Based Services Staff Briefing Kimberly Sarte November 16, 2005
Transcript of Assessment of Reimbursement Rates for Medicaid...

Joint Legislative Audit and Review Commissionof the Virginia General Assembly
Assessment of Reimbursement Ratesfor Medicaid Home and
Community-Based ServicesStaff Briefing
Kimberly SarteNovember 16, 2005

2
Study Mandate
The 2005 Appropriation Act directed JLARC to report on the adequacy of Medicaid reimbursement rates for home and community-based care services
The Act also directed JLARC to examine the impact of reimbursement levels on access to care for the Medicaid recipient population

3
Virginia HCB Waiver Payments by Service Type in 2004
Total Payments = $358 Million
Personal Care (Agency &
Consumer Directed)29%
Day Support 15%
Respite Care (Agency &Consumer Directed) 4%
All Other Services, 2%
Skilled/Private DutyNursing 6%
In-Home Residential 5%
Congregate Residential 39%
4
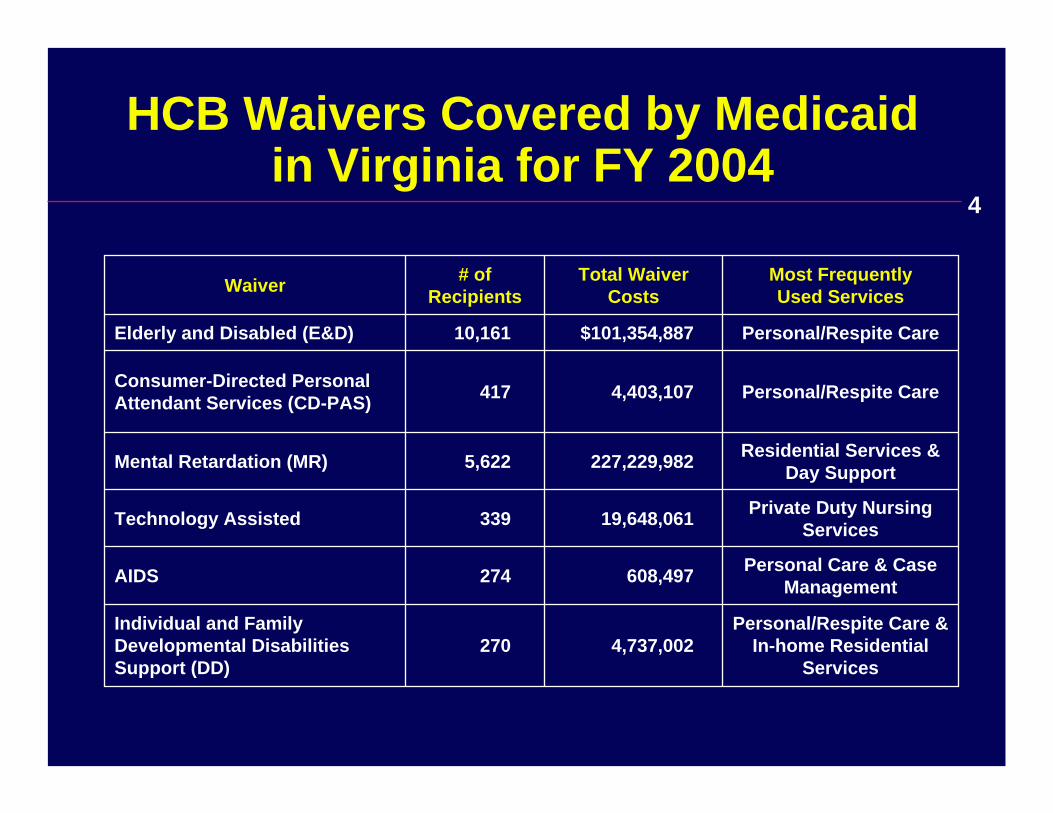
HCB Waivers Covered by Medicaidin Virginia for FY 2004
Personal/Respite Care & In-home Residential
Services4,737,002270
Individual and Family Developmental Disabilities Support (DD)
Personal Care & Case Management608,497274AIDS
Private Duty Nursing Services19,648,061339Technology Assisted
Residential Services & Day Support227,229,9825,622Mental Retardation (MR)
Personal/Respite Care4,403,107417Consumer-Directed Personal Attendant Services (CD-PAS)
Personal/Respite Care$101,354,88710,161Elderly and Disabled (E&D)
Most FrequentlyUsed Services
Total Waiver Costs
# of RecipientsWaiver

5
Virginia Spends Relatively Little on Medicaid HCB Services Compared to Other States
Virginia ranked 48th in terms of total Medicaid long-term care expenditures per capita
Above average proportion of long-term care spending in Virginia goes to institutional services rather than HCB services

6
Concern Over Medicaid Ratesfor HCB Services
Although overall spending for HCB services in Virginia has increased, rates generally have not
Many HCB services received only minor adjustments to Medicaid rates over past decadeSome services have not received any rate adjustments over this period
Resulted in concerns among providers and recipients of Medicaid HCB services that:
Rates are too low, andMay lead to inadequate access to care in some areas

7
Concerns Over Reduced Access to HCB Services in Certain Regions Not Warranted
Data on waiver recipients did not indicate Southwestern or Southside regions of State were disproportionately underserved
Data did not indicate less utilization of services in rural localities than in urban localities
Further, more providers have entered the market than left in recent years

8
Proportion of Local Poverty Population Receiving Personal Care Services
1. LENOWISCO 2. Cumberland Plateau 3. Mount Rogers 4. New River Valley 5. Fifth 6. Central Shenandoah 7. Lord Fairfax
8. Northern Virginia 9. Rappahannock -Rapidan
10. Thomas Jefferson 11. Central Virginia 12. West Piedmont 13. Southside 14. Piedmont
15. Richmond Regional 16. RADCO 17. Northern Neck 18. Middle Peninsula 19. Crater 22. Accomack -Northampton 23. Hampton Roads
Key toPlanningDistricts
Above statewide average
At or below statewide average
1
2
34
5
6
78
9
10
11
12 13
14
15
1617
18
1923
22
1
2
34
5
6
78
9
10
11
12 13
14
15
1617
18
1923
9
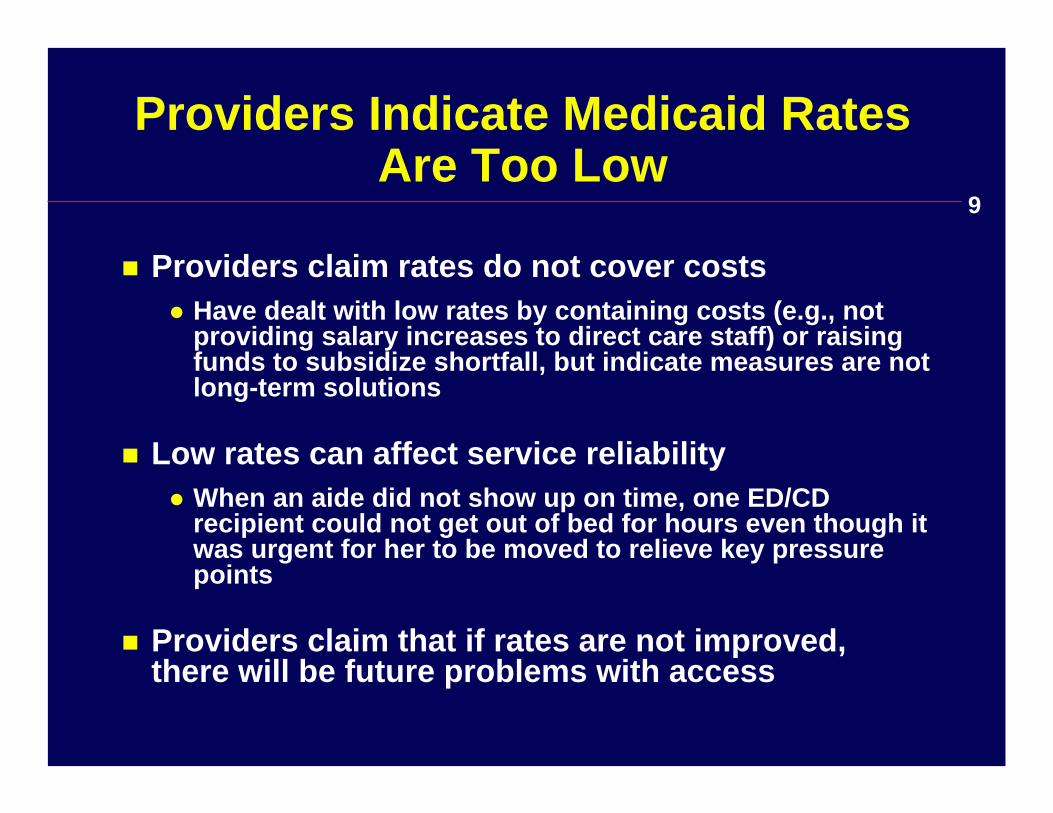
Providers Indicate Medicaid Rates Are Too Low
Providers claim rates do not cover costsHave dealt with low rates by containing costs (e.g., not providing salary increases to direct care staff) or raising funds to subsidize shortfall, but indicate measures are not long-term solutions
Low rates can affect service reliability When an aide did not show up on time, one ED/CD recipient could not get out of bed for hours even though it was urgent for her to be moved to relieve key pressure points
Providers claim that if rates are not improved, there will be future problems with access
10
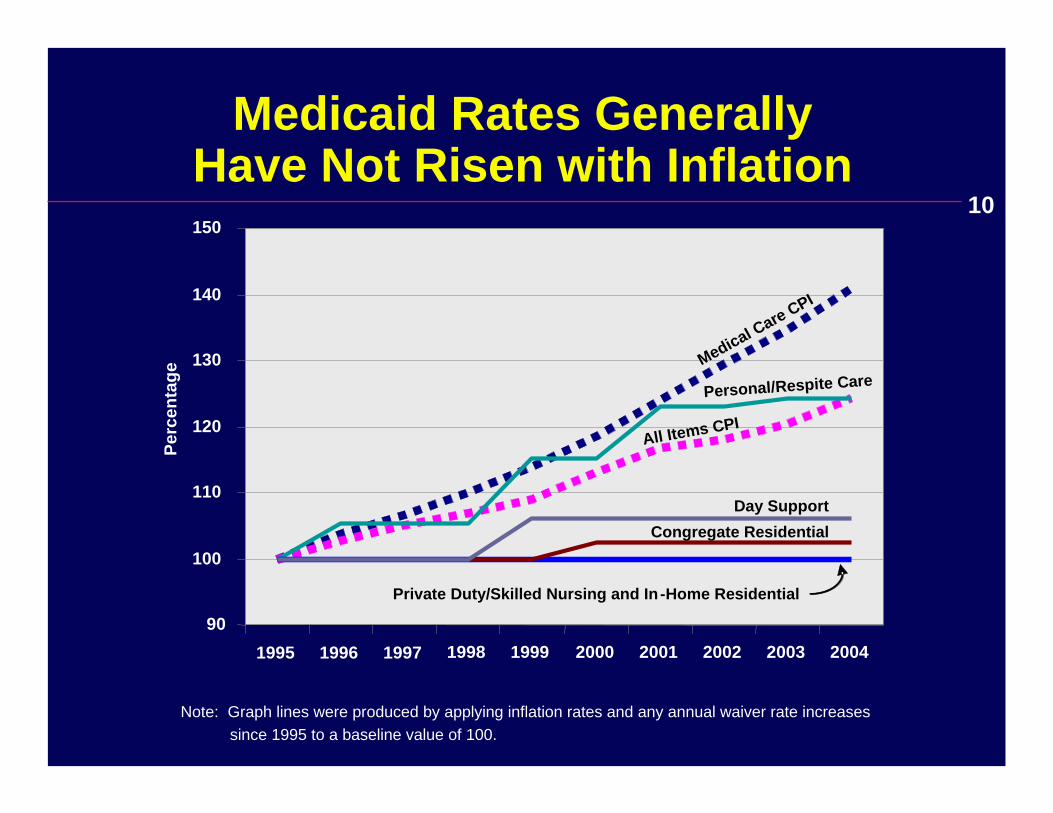
Medicaid Rates Generally Have Not Risen with Inflation
90
100
110
120
130
140
150
1995 1996 1997 1998 1999 2000 2001 2002 2003 2004
Medical Care CPI
All Items CPI
Personal/Respite Care
Private Duty/Skilled Nursing and In-Home Residential
Congregate ResidentialDay Support
Note: Graph lines were produced by applying inflation rates and any annual waiver rate increasessince 1995 to a baseline value of 100.
Perc
enta
ge

Virginia’s Rates Are
Low Compared to Other States
$10 $20 $30 $40 $50 $60 $70
Virginia
South CarolinaTennessee
Florida
Maryland
Georgia*
VirginiaGeorgia
South CarolinaNorth Carolina
Tennessee Florida
Kentucky
Virginia
South Carolina
Tennessee Florida
Georgia*
Rate Per Hour
Skilled/Private
Nursing:RN
Skilled/Private
Nursing:LPN
PersonalCare
Services11
Maryland
*Note: Reimbursement is provided on a per-visit basis. A typical visit could range from less than an hour to several hours.

12
Alternative Approaches for Estimating Potential Provider Costs
Comparable Position ApproachAssumes that direct care staff are paid hourly wages and fringe benefits comparable to State employees in comparable positions Staff providing personal care assumed to be paid wages and fringe benefits comparable to nurse aides in nursing homes
Living Wage ApproachAssumes that direct care staff are paid a living wage at least high enough that they don’t qualify for government assistanceFringe benefit assumptions consistent with current practice
Both approaches assume supervisory, administration, and overhead costs consistent with current practice

13
Rates Do Not Allow for a Competitive or Living Wage for Some Services
Note: Medicaid rate and estimated cost are for rest of state and do not include Northern Virginia.
22.22 -27.1315.46 -19.5118.90 In-Home Residential 31.41n/a21.45 Private Duty Nursing – LPN 44.99n/a24.70 Private Duty Nursing – RN 14.2110.108.19
Consumer DirectedPersonal/Respite Care
$20.65$15.16$11.93 Personal/Respite Care
Estimated Hourly Cost
Using Comparable
Position Approach
Estimated Hourly Cost
Using Living Wage
Approach
FY 2006 Medicaid
Rate Service

14
Option: Provide An Annual Inflation Adjustment
Adjust all rates annually using CPIIncreasing FY04 rates to FY06 CPI-adjusted rates estimated to cost about $10.2 million annually in State general funds, assuming constant levels of serviceGeneral Assembly adjusted rates for most services (except private duty nursing) for inflation in FY 06. However, rates still behind inflation over the long run.
Adjust rates for personal care, respite care, and nursing services annually by Medical Care CPI
Increasing FY04 rates to FY06 Medical Care CPI-adjusted rates estimated to cost about $7.2 million annually in State general funds

15
Option: Rebase Rates for Services Provided on a One-on-One Basis
Rebase rates using comparable position approachEstimated cost is approximately $62.8 to $65.9 million in State general funds
Rebase rates using living wage approachEstimated cost is approximately $23.3 to $24.1 million in State general fundsNo change to rates for nursing services because rates already above living wage approach
Consider whether to mandate that any rate increase be passed on to direct care staff

16
Northern Virginia Rate Adjustment Appropriate for MR and DD Services
Most HCB services receive a Northern Virginia rate differential reflecting higher cost of living
However, several services provided exclusively through the MR and DD waivers do not receive differential
Higher cost of living affects all services, including these
Cost of providing a 17.5% rate differential for services estimated to be $4.6 million in State general funds
17
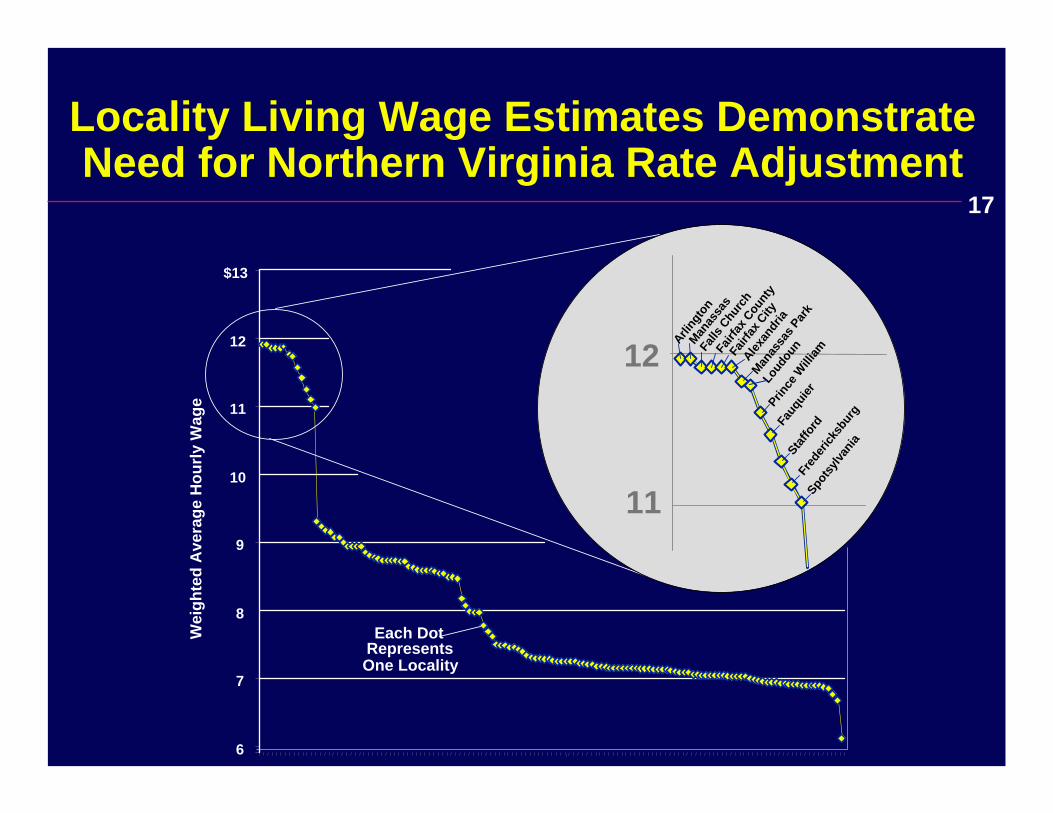
Locality Living Wage Estimates Demonstrate Need for Northern Virginia Rate Adjustment
6
7
8
9
10
11
12
$13
Wei
ghte
d A
vera
ge H
ourly
Wag
e
Each DotRepresentsOne Locality
12
11
Fairf
ax C
ount
y
Arling
ton
Manas
sas
Falls
Chu
rch
Fairf
ax C
ity
Alexan
dria
Manas
sas P
ark
Loud
oun
Prince
Willi
am
Fauq
uier
Staffo
rdFr
eder
icksb
urg
Spotsy
lvania

18
Consider Revising Rate Structure for HCB Services Provided in Group Settings
Services provided in a group setting, such as congregate residential support and day support, largely reimbursed on a constant per-recipient basis
Virginia one of few states where rates do not take into account factors such as health of recipient, needs of recipient, or staff-to-client ratios
Results in rates being too low, adequate, or too high, depending on situation

19
Illustration of Varying Levels of Provider Reimbursement in Group Settings
40.3513.45Congregate Residential 1:3
26.9013.45Congregate Residential 1:2
$13.45$13.45Congregate Residential 1:1
Hourly Provider Reimbursement
Amount
FY 2006 Hourly Rate
Per RecipientService and
Assumed Staff:Client Ratio

20
Consider Including General Supervision as a Part of Congregate Residential Services
“General supervision” is most often overnight supervision of group home residents
According to DMAS, federal guidelines prohibit providers from billing Medicaid for these services
Possible changes to federal guidelines may allow DMAS to begin reimbursing providers for these costs
May be appropriate for a working group to address issues of rate structure for services in group settings, including review of general supervision

21
Summary of Findings
Availability of Medicaid HCB services throughout State and increase in number of providers suggest concerns about reduced access in some regions due to rates not warranted
However, HCB service providers indicate rates are too low, and evidence supports their claim
Rates not routinely adjusted for inflationRates lower than in other statesRates do not appear to enable providers of some one-on-one services to pay a competitive or living wage

22
Summary of Findings
Further, a Northern Virginia rate adjustment appears appropriate for MR and DD services
Other issues with the rate structure for MR and DD waiver services warrant additional review
Review rate structure for services provided in group settingsReview whether general supervision costs can be included in congregate residential services

![State Medicaid Alternative Reimbursement and Purchasing ... · State Medicaid Alternative Reimbursement and Purchasing Test for High-cost Drugs [SMART-D] Project Prescription Drug](https://static.fdocuments.net/doc/165x107/5c69c84209d3f25e418b6945/state-medicaid-alternative-reimbursement-and-purchasing-state-medicaid-alternative.jpg)