
How do we know whether Three Dots form an Equilateral ... · Central rii cellece i e ccess JSM...
6
Central Bringing Excellence in Open Access JSM Brain Science Cite this article: Greene E (2016) How do we know whether Three Dots form an Equilateral Triangle? JSM Brain Sci 1(1): 1002. *Corresponding author Ernest Greene, Department of Psychology, University of Southern California, Laboratory for Neurometric Research, Los Angeles, CA 90089, Email: Submitted: 25 July 2016 Accepted: 29 August 2016 Published: 30 August 2016 Copyright © 2016 Greene OPEN ACCESS Research Article How do we know whether Three Dots form an Equilateral Triangle? Ernest Greene* Department of Psychology, University of Southern California, USA Abstract A shape can be perceived when a widely spaced pattern of dots is displayed, and the neurons that encode the pattern must be able to register spans and relative orientations of the dots. A number of widely endorsed concepts for how those cues might be registered are not biologically plausible. These include the concepts that spatial locations are specified using coordinate addresses, that cortical orientation- selective neurons can register the spatial relations of widely spaced dots, and that remapping of the pattern to higher visual centers can encode those spatial relations. An alternative retinal mechanism is proposed, along with a hypothesis for how distances from pattern dots to a sensor located at the center of the pattern could encode the shape that is perceived. “When we speak of the relation of direction of two points towards each other, we mean simply the sensation of the line that joins the two points together …. And the moment you have imagined the line, the relation stands before you in all its completeness… Just so the relation of direction between two lines is identical with the peculiar sensation of shape of the space enclosed between them.” William James [1]. ILLUSTRATING A MINIMAL SHAPE TASK Let’s do a thought experiment. Assume stimulus configurations that are illustrated in Figure (1). Each panel shows an LED array, designated as the display board, which can show any combination of patterns at arbitrary locations on the board with a brief and simultaneous flash of the pattern dots. Here the pattern dots are highly visible, and they are being displayed for a moment that is too short to allow any eye movement. Figure (1) is illustrating stimuli for a match-to-sample task. The left panel shows an equilateral 3-dot target pattern. The target is displayed at the same size in successive trials, but with location on the board being varied as well as the amount of rotation. The right panels have examples of choice-options that would be displayed shortly after the target. The upper-right panel shows a “matching” pattern, i.e., it is identical to the target except for being presented at a different location on the display board and at a different rotation. The lower-right panel shows a 3-dot pattern, designated as the non-matching pattern. Positioning of individual dots in non-matching patterns would vary, requiring also that they not be equidistant from one another. Assume that a fixation dot is provided between display trials, which is not shown in the Figure (1) illustration. For a given display trial, the dots of the target pattern are simultaneously flashed for one microsecond, and three hundred milliseconds later a matching or non-matching pattern is displayed for one microsecond. The flashes are of sufficient intensity that each pattern is quite visible. You, as the observer, are told that your task is to say whether the two patterns are the same or different. For differences of dot location that are as conspicuous as illustrated here, there can be no doubt that you would be able to answer this question correctly. USING ADDRESS VALUES TO MAKE THE JUDGMENT How can an observer know whether or not the choice options shown on a given trial are identical to the target? It is not sufficient to answer: “Because I can see that one is an equilateral triangle and the other is not.” This presumes that memory, i.e., knowing what an equilateral triangle looks like, is essential to judgment. Memory might contribute to judgment for this particular set of stimulus alternatives, but we are using a match-to-sample task that would not require memory-at least not long-term memory that included the concept of an equilateral triangle. Using a match- to-sample task helps focus on the specific stimulus attributes that define the shape, for these cues are needed for encoding shapes whether they are stored in memory or not. You might answer that it is because one of them is symmetrical and the other is not. That answer requires that the visual system has circuits that functionally bisect the space along an axis that
Transcript of How do we know whether Three Dots form an Equilateral ... · Central rii cellece i e ccess JSM...

CentralBringing Excellence in Open Access
JSM Brain Science
Cite this article: Greene E (2016) How do we know whether Three Dots form an Equilateral Triangle? JSM Brain Sci 1(1): 1002.
*Corresponding authorErnest Greene, Department of Psychology, University of Southern California, Laboratory for Neurometric Research, Los Angeles, CA 90089, Email:
Submitted: 25 July 2016
Accepted: 29 August 2016
Published: 30 August 2016
Copyright© 2016 Greene
OPEN ACCESS
Research Article
How do we know whether Three Dots form an Equilateral Triangle?Ernest Greene*Department of Psychology, University of Southern California, USA
Abstract
A shape can be perceived when a widely spaced pattern of dots is displayed, and the neurons that encode the pattern must be able to register spans and relative orientations of the dots. A number of widely endorsed concepts for how those cues might be registered are not biologically plausible. These include the concepts that spatial locations are specified using coordinate addresses, that cortical orientation-selective neurons can register the spatial relations of widely spaced dots, and that remapping of the pattern to higher visual centers can encode those spatial relations. An alternative retinal mechanism is proposed, along with a hypothesis for how distances from pattern dots to a sensor located at the center of the pattern could encode the shape that is perceived.
“When we speak of the relation of direction of two points towards each other, we mean simply the sensation of the line that joins the two points together …. And the moment you have imagined the line, the relation stands before you in all its completeness… Just so the relation of direction between two lines is identical with the peculiar sensation of shape of the space enclosed between them.” William James [1].
ILLUSTRATING A MINIMAL SHAPE TASKLet’s do a thought experiment. Assume stimulus
configurations that are illustrated in Figure (1). Each panel shows an LED array, designated as the display board, which can show any combination of patterns at arbitrary locations on the board with a brief and simultaneous flash of the pattern dots. Here the pattern dots are highly visible, and they are being displayed for a moment that is too short to allow any eye movement.
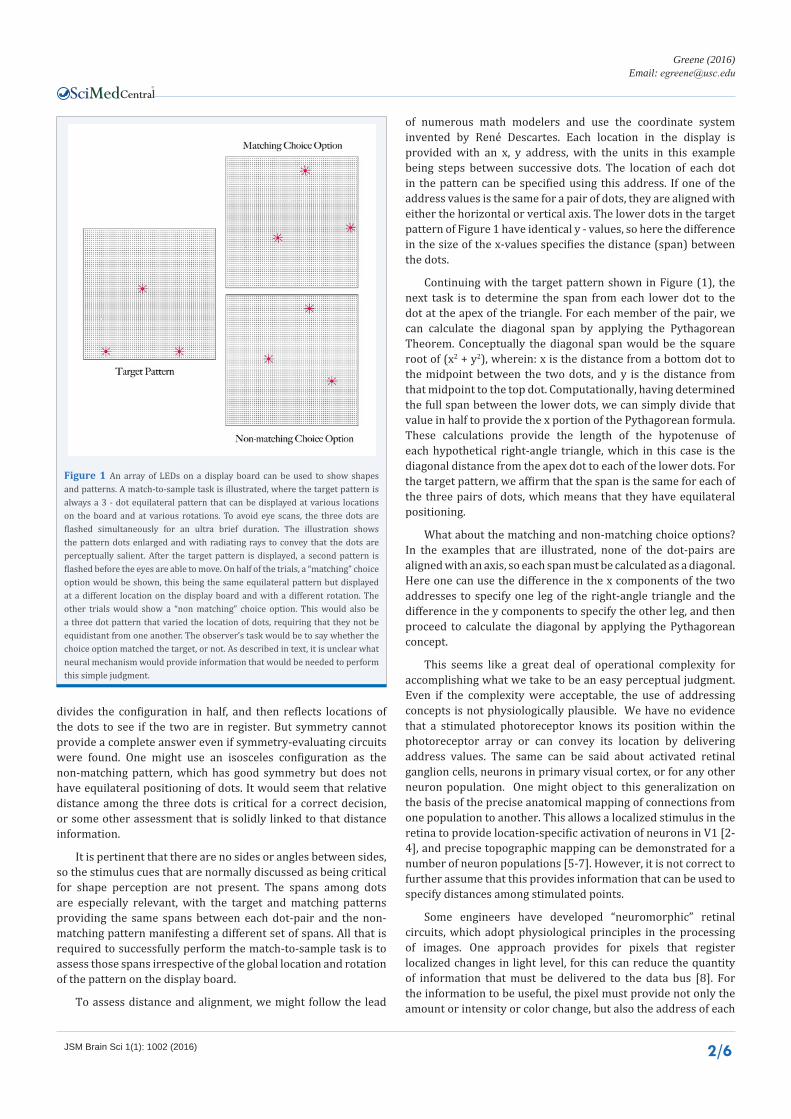
Figure (1) is illustrating stimuli for a match-to-sample task. The left panel shows an equilateral 3-dot target pattern. The target is displayed at the same size in successive trials, but with location on the board being varied as well as the amount of rotation. The right panels have examples of choice-options that would be displayed shortly after the target. The upper-right panel shows a “matching” pattern, i.e., it is identical to the target except for being presented at a different location on the display board and at a different rotation. The lower-right panel shows a 3-dot pattern, designated as the non-matching pattern. Positioning of individual dots in non-matching patterns would vary, requiring also that they not be equidistant from one another.
Assume that a fixation dot is provided between display trials, which is not shown in the Figure (1) illustration. For a given display trial, the dots of the target pattern are simultaneously flashed for one microsecond, and three hundred milliseconds
later a matching or non-matching pattern is displayed for one microsecond. The flashes are of sufficient intensity that each pattern is quite visible. You, as the observer, are told that your task is to say whether the two patterns are the same or different. For differences of dot location that are as conspicuous as illustrated here, there can be no doubt that you would be able to answer this question correctly.
USING ADDRESS VALUES TO MAKE THE JUDGMENT
How can an observer know whether or not the choice options shown on a given trial are identical to the target? It is not sufficient to answer: “Because I can see that one is an equilateral triangle and the other is not.” This presumes that memory, i.e., knowing what an equilateral triangle looks like, is essential to judgment. Memory might contribute to judgment for this particular set of stimulus alternatives, but we are using a match-to-sample task that would not require memory-at least not long-term memory that included the concept of an equilateral triangle. Using a match-to-sample task helps focus on the specific stimulus attributes that define the shape, for these cues are needed for encoding shapes whether they are stored in memory or not.
You might answer that it is because one of them is symmetrical and the other is not. That answer requires that the visual system has circuits that functionally bisect the space along an axis that
CentralBringing Excellence in Open Access
Greene (2016)Email:
JSM Brain Sci 1(1): 1002 (2016) 2/6
divides the configuration in half, and then reflects locations of the dots to see if the two are in register. But symmetry cannot provide a complete answer even if symmetry-evaluating circuits were found. One might use an isosceles configuration as the non-matching pattern, which has good symmetry but does not have equilateral positioning of dots. It would seem that relative distance among the three dots is critical for a correct decision, or some other assessment that is solidly linked to that distance information.
It is pertinent that there are no sides or angles between sides, so the stimulus cues that are normally discussed as being critical for shape perception are not present. The spans among dots are especially relevant, with the target and matching patterns providing the same spans between each dot-pair and the non-matching pattern manifesting a different set of spans. All that is required to successfully perform the match-to-sample task is to assess those spans irrespective of the global location and rotation of the pattern on the display board.
To assess distance and alignment, we might follow the lead
of numerous math modelers and use the coordinate system invented by René Descartes. Each location in the display is provided with an x, y address, with the units in this example being steps between successive dots. The location of each dot in the pattern can be specified using this address. If one of the address values is the same for a pair of dots, they are aligned with either the horizontal or vertical axis. The lower dots in the target pattern of Figure 1 have identical y - values, so here the difference in the size of the x-values specifies the distance (span) between the dots.
Continuing with the target pattern shown in Figure (1), the next task is to determine the span from each lower dot to the dot at the apex of the triangle. For each member of the pair, we can calculate the diagonal span by applying the Pythagorean Theorem. Conceptually the diagonal span would be the square root of (x2 + y2), wherein: x is the distance from a bottom dot to the midpoint between the two dots, and y is the distance from that midpoint to the top dot. Computationally, having determined the full span between the lower dots, we can simply divide that value in half to provide the x portion of the Pythagorean formula. These calculations provide the length of the hypotenuse of each hypothetical right-angle triangle, which in this case is the diagonal distance from the apex dot to each of the lower dots. For the target pattern, we affirm that the span is the same for each of the three pairs of dots, which means that they have equilateral positioning.
What about the matching and non-matching choice options? In the examples that are illustrated, none of the dot-pairs are aligned with an axis, so each span must be calculated as a diagonal. Here one can use the difference in the x components of the two addresses to specify one leg of the right-angle triangle and the difference in the y components to specify the other leg, and then proceed to calculate the diagonal by applying the Pythagorean concept.
This seems like a great deal of operational complexity for accomplishing what we take to be an easy perceptual judgment. Even if the complexity were acceptable, the use of addressing concepts is not physiologically plausible. We have no evidence that a stimulated photoreceptor knows its position within the photoreceptor array or can convey its location by delivering address values. The same can be said about activated retinal ganglion cells, neurons in primary visual cortex, or for any other neuron population. One might object to this generalization on the basis of the precise anatomical mapping of connections from one population to another. This allows a localized stimulus in the retina to provide location-specific activation of neurons in V1 [2-4], and precise topographic mapping can be demonstrated for a number of neuron populations [5-7]. However, it is not correct to further assume that this provides information that can be used to specify distances among stimulated points.
Some engineers have developed “neuromorphic” retinal circuits, which adopt physiological principles in the processing of images. One approach provides for pixels that register localized changes in light level, for this can reduce the quantity of information that must be delivered to the data bus [8]. For the information to be useful, the pixel must provide not only the amount or intensity or color change, but also the address of each
Figure 1 An array of LEDs on a display board can be used to show shapes and patterns. A match-to-sample task is illustrated, where the target pattern is always a 3 - dot equilateral pattern that can be displayed at various locations on the board and at various rotations. To avoid eye scans, the three dots are flashed simultaneously for an ultra brief duration. The illustration shows the pattern dots enlarged and with radiating rays to convey that the dots are perceptually salient. After the target pattern is displayed, a second pattern is flashed before the eyes are able to move. On half of the trials, a “matching” choice option would be shown, this being the same equilateral pattern but displayed at a different location on the display board and with a different rotation. The other trials would show a “non matching” choice option. This would also be a three dot pattern that varied the location of dots, requiring that they not be equidistant from one another. The observer’s task would be to say whether the choice option matched the target, or not. As described in text, it is unclear what neural mechanism would provide information that would be needed to perform this simple judgment.

CentralBringing Excellence in Open Access
Greene (2016)Email:
JSM Brain Sci 1(1): 1002 (2016) 3/6
pixel that registered a change [8]. This is an accommodation to the reality that having precise localization of a stimulus does not, in itself, provide any usable spatial information. Parallel fibers that map activation from one neuron population to another do not generate that information.
One presumes that the visual system has alternative mechanisms for deriving information about spatial relations, but the point here is that we have no basis for invoking a coordinate address system. Given this, it seems especially cavalier that math modelers have assumed addresses, and the ability to calculate distance, alignment, or other spatial relationships. Psychologists and neuroscientists alike appear to have been uncritical in accepting computational concepts.
AN ALTERNATIVE MEANS FOR NEURONS TO REGISTER DOT SPANS
Could we encode the spatial relations of these dots using orientation-selective, end-stopped neurons? [9-11] their physiology is most often discussed as being specific for contours, but one might argue that they could register the relative orientation and span of two dots. To answer this possibility, it is necessary to provide additional details about the Figure (1) stimuli, as they would normally be displayed and judged in my laboratory [12-15]. Room illumination would be dim, so the observer would be able to see the outlines of the display board and could easily center his or her gaze on the board. But to assure central fixation of gaze, we could add four dim dots that appear at the center of the board between trials, disappearing just before the stimuli are flashed. At the standard viewing distance the individual LEDs would subtend about 5 minutes of visual angle, roughly the diameter of the dendritic field of a parasol ganglion cell [16,17]. Given center-surround mechanisms in this population of neurons [18,19], one might argue that a flashed dot would selectively activate a single ganglion cell, though it does not seem terribly material whether the retinal signal is from just one cell or a small cluster at the stimulated location.
The pertinent point is that under these viewing conditions the span between dots in the target pattern would be about 5.5 degrees of visual angle, roughly twice the span of the longest receptive fields of orientation selective neurons in V1 [20]. Given that the span between the dots greatly exceeds the length of orientation-selective neurons, they would not be able to register alignment (orientation) or distances between dots. And there is no doubt that an observer could judge an even larger pattern and assess the spans among its dots.
There is an additional reason to reject the hypothesis that spans are being registered by orientation-selective neurons. The projections to V1 split the visual field down the middle, with stimulation of each retinal hemifield being sent to opposite hemispheres [21-23]. Therefore, viewed with only one eye and with fixation centered on the board, almost every display of a target or matching pattern would send two dots to one hemisphere, and send the third dot to the other hemisphere.
I know of no concept that specifies how spans and orientation of stimulus locations in separate hemispheres would be assessed. It is not plausible that callosal fibers provide information that
allows the alignments and spans to be registered. There is no evidence of a covert mapping of locations from V1 in one hemisphere to V1 in the other. This would allow a stimulus that was restricted to one visual field to activate neurons in both hemispheres, one coming directly from lateral geniculate nucleus and the other by means of callosal fibers. Such bi-hemispheric stimulation has not been reported. One might think that horizontal fibers that link orientation-selective neurons [24,25] could provide the assessment of orientation and span between the dots. But that presumes that a single dot displayed to one hemisphere can activate an orientation-selective neuron, and further, link to a horizontal fiber that connects to the margin of V1, then onward through a horizontal fiber in the other hemisphere, finally connecting to the location of the second dot. One would not expect a single dot to activate a V1 neuron that is designed to respond to an elongated bar or grating. Nor would the dot in the opposite hemisphere be able to direct which orientation-selective neuron and which set of horizontal fibers to recruit.
CAN NEURAL REMAPPING PROVIDE THE BASIS FOR SHAPE RECOGNITION?
Perhaps we need to look beyond primary visual cortex. Could the assessment of orientation and span between widely separated dots be done by extrastriate neurons that have much larger receptive fields? There is little support for this approach, for research in this area generally uses stimuli having linear extent, e.g., bars and gratings [26-29]. Orientation selectivity of extrastriate neurons is thought to derive from the early processing in V1, but as discussed above the V1 neurons would not be able to register information about the relative orientation or degree of separation of widely spaced dots. Whether the extra-striate neurons are being driven by V1 output, or not, there is at present no evidence that they can register the orientation or degree of separation of widely spaced dots.
Perhaps higher visual centers are directly encoding the triangular dot configurations. Neurons in several extrastriate areas respond selectively to stimuli such as faces and other shapes [30-32], and can do so when the stimulus is placed at various locations in the visual field. This is accomplished by remapping that makes spatial location irrelevant, which is often described as an increase in the size of the receptive field. That certainly appears to be what is needed to deal with the change of location for the tandem displays illustrated in Figure (1). When the target is shown to the lower left of the display board and the observer must judge a choice option that is shown in the upper right, then selective shape responding with a larger receptive field might seem a plausible neuronal mechanism.
However, the remapping concept is fraught with practical problems of implementation. It requires anatomical convergence of fiber connections that can handle the vast number of shapes that we can identify, and do so irrespective of size and location. This is known as the “combinatoric explosion” problem. Here I want to emphasize a different point. A remapping that preserves shape information but makes its location moot presumes that the earlier processing was successful in registering local shape attributes [33-35]. Once registered by the earlier stage, that information can be combined and elaborated upon by a later

CentralBringing Excellence in Open Access
Greene (2016)Email:
JSM Brain Sci 1(1): 1002 (2016) 4/6
stage where the neuronal response does not depend (or depends less) on global positioning of the local cues. But if the earlier stage has not registered the spatial relationships, none of the extant remapping concepts will provide that information.
Further, rather than call for a shape judgment, one can display two widely separated dots and ask only for assessment of span and/or relative orientation. An observer can provide effective discriminations even if one dot is presented to the right visual field and the other dot is presented to the left visual field. Here the entire focus is on the spatial relationship of the two dots, and remapping does not de novo create this information.
ELEMENTAL SHAPE ENCODING MIGHT BEGIN IN THE RETINA
The simple fact is that we can register the spans and orientations among widely separated dots, and use that information to perceive shape. If known cortical mechanisms are not able to explain how this is done, we should consider a retinal option. It is possible that these stimulus attributes are derived within the retina, making the hemifield/hemisphere issue moot. A number of retinal cell populations have extended arborization that might be relevant to this process, with horizontal cells and amacrine cells being most conspicuous [36-38]. Polyaxonal amacrine (PA1) cells have highly restricted dendritic fields and a dense arbor of axon branches that extend over a very large area [39-47]. Action potentials of PA1 cells spread like waves through the axonal arbors of these cells. This may play a role for encoding stimulus motion [44-46] and it may not be a great stretch to suggest that distances among stimulated points in the image might be registered by the travel time of these waves.
In macaque the axonal fields of PA1 cells have diameters of roughly 2000 microns in central vision and 6000 microns in the periphery [40]. If one can assume similar dimensions in human retina, a given PA1 cell would cover about 7.5 arco in central vision and about 40 arco in the periphery. These neurons tile the retina as a mosaic, with receptive fields that are slightly larger than parasol ganglion cells [47]. The kinetics of their light response is similar to parasols and they are more transient than midget ganglion cells [48]. Conduction velocity of the axons is approximately half a meter per second [47]. If one assumes an axon length of 3000 microns or less, travel time from soma to tip would be 5-10 milliseconds.
A model making use of travel time of PA1 spikes as a method for registering spatial location or distances among stimulus markers would have to assume distance-encoding sensors and methods for synchronizing the timing. The PA1 cells are especially sensitive to sharp transitions of the visual scene, [44,46,47] so they might be synchronized by microsaccades of the eye, thus providing signals that radiated from marked locations to distance sensors. This would allow time-of-travel to specify marker locations.
If the encoding system is provided with an array of sensors, do they all respond to passing waves or do we have a method for choosing one of them to deliver a summary of marked locations? The system may be designed to have the centroid of the pattern provide that summary. The amplitude of wave convergence
is maximal at the centroid, so the centroid of the equilateral triangle shown in Figure (1) would have waves arriving at the same moment from each of the three points. Assessing distance and angle of three dots in relation to the center of the pattern provides an excellent basis for specifying equilateral positioning and could well be how the nervous system encodes that configuration. A mechanism for registering those positions might be easier to implement than trying to determine distances and orientations among dot pairs. Further, it provides a simple basis for establishing that a non-matching pattern is different than the target, for their distances to the centroid would not be the same.
If the equilateral triangle illustrated in Figure (1) were shown on our LED display board at the viewing distance that I normally use, the span from each flashed dot to the centroid would be a little over 3 degrees of visual angle. That would be about 900 microns as measured on the retina. The wave of spike propagation out the PA1 axonal branches is roughly 500,000 microns/second [47] so it would take about two milliseconds for those distances to be registered at the centroid.
At this point we cannot affirm that PA1 cells are providing the encoding of spatial relations within a pattern. An alternative role for the fast-conducting PA1 spikes might be to coordinate or poll other neuron populations, with registering of distance and alignment being done by another population of wide-field neurons. The key point here is to suggest that encoding of spatial information might be done within the retina, with the travel-time of spreading signals providing a potential basis for delivering that information.
DISTANCE TO THE CENTROID OF A SHAPE OR PATTERN CAN PROVIDE FOR RECOGNITION
An optimal encoding of more complex patterns or shapes, the latter being considered as a plethora of stimulus-marked locations, would likely require registering the direction from which waves arrived as well as the distances from those locations. However, it is worth noting that a summary that only records the distances can be exceptionally effective at identifying the shape/pattern [49]. For example, one can create an inventory of arbitrary shapes, then for each shape calculate the location of the centroid and the distance of each dot from that centroid. For a given shape those distances are distributed into a histogram wherein each bin specifies how often a given distance was observed. This essentially converts the 2D information in the pattern into a 1D summary [49].
For discriminating among shapes in the inventory, one then compares the histograms for degree of match. A number of comparison methods are available, one of the simplest being the sum of squared differences. Here one calculates the difference in height for each bin of two histograms, squares that value, and then sums the squares that were derived across all bins. If the 1D histograms differ substantially, the sum of squared differences will be large; if they are similar, that value will be small [49].
As evidence that this method provides good discrimination among shapes, an inventory of 450 shapes like the one shown in Figure (2) was created. A centroid histogram was derived for each shape, and the sum of squared differences was calculated for all

CentralBringing Excellence in Open Access
Greene (2016)Email:
JSM Brain Sci 1(1): 1002 (2016) 5/6
pair combinations. In other words, each pattern was compared against itself and against each of the other patterns. This process provided 450 self-self comparison scores and 101,025 self-other scores from these combinatoric pairings (450 choose 2). A sum of squared differences of zero was found only when a given pattern was compared to itself. All of the 101,025 self-other comparisons were greater than zero, meaning that the histogram summaries provided an unambiguous basis for identifying each pattern.
Distance alone does not provide an optimal shape or pattern summary, but it is useful to note that summaries based on distance can be very efficient and effective. It is unlikely that the nervous system would derive distributions or compare them in the manner that is described above. Nonetheless, a biologically plausible mechanism that accomplishes something similar is not out of the question.
CONCLUSIONDiscrete dots can be used to surround a space and provide
the perception of a shape, the minimum being three dots. Further, the spatial positioning of the dots can be critical for what shape is perceived. If the three dots are equidistant from one another, we perceive an equilateral triangle. It is not clear how the neurons of the visual system derive information about the spatial relationships among dots, especially where they are widely separated and where members of the pattern are sent to opposite hemispheres. The neurons in primary visual cortex that are thought to be critical for shape encoding have receptive fields that are too small to register the positioning of widely spaced dots. The remapping to extrastriate cortex that is thought to provide for shape memory would not be able to recreate distance information that was not provided by earlier stages of image encoding. It seems most plausible that the spatial information is
encoded in the retina, where there are wide-field neurons that could register the relative positioning of the dots.
ACKNOWLEDGMENTResearch funding for this laboratory was provided by
the Neuropsychology Foundation and the Quest for Truth Foundation.
REFERENCES1. James W. The Principles of Psychology. London: MacMillan & Co.;
1901; 2: 149-150.
2. Schwartz EL. Spatial mapping in primate sensory projection - analytic structure and relevance to perception. Biol Cybern. 1977; 25: 181-194.
3. DeValois RL, DeValois KK. Spatial Vision. Annu Rev Psychol. 1980; 31: 309-341.
4. Braccini C, Gambardella G, Sandini G, Tagliasco V. A model of the early stages of the human visual-system – functional and topological transformations performed in the peripheral visual field. Biol Cybern. 1982; 44: 47-58.
5. Wong YC, Kwan HC, MacKay WA, Murphy JT. Topographic organization of afferent inputs in monkey precentral cortex. Brain Res. 1977; 138: 166-168.
6. Yaksai E, von Saint Paul F, Niessing J, Bundschuh ST, Friedrich RW. Transformation of odor representations in target areas of the olfactory bulb. Nature Neurosci. 2009; 12: 474-482.
7. Sereno MI, Huang RS. Multisensory maps in parietal cortex. Curr Opin Neurobiol. 2014; 24: 39-46.
8. Lichtsteiner P, Posch C, Delbruck T. A 128 x 128 dB 15 ms latency asynchronous temporal contrast vision sensor. IEEE J Solid-State Circuits. 2008; 43: 566-578.
9. Schiller PH, Finlay BL, Volman SF. Quantative studies of single-cell properties in monkey striate cortex. 5. multivariate statistical analysis and models. J Neurophysiol. 1976; 39: 1362-1374.
10. Henry GH, Goodwin AW, Bishop PO. Spatial summation of responses in receptive-fields of single cells in cat striate cortex. Exp Brain Res. 1978; 32: 245-266.
11. Zhu M, Rozell CJ. Visual nonclassical receptive field effects emerge from sparse coding in dynamical system. PLOS Comput Biol. 2013; 9: 1003191.
12. Greene E. Retinal encoding of ultrabrief shape recognition cues. PLoS One. 2007; 2: 871.
13. Greene E. Evaluating letter recognition, flicker fusion, and the Talbot-Plateau law using microsecond-duration flashes. PLoS One. 2015; 10: 0123458.
14. Greene E. Recognizing words and reading sentences with microsecond flash displays. PLoS One. 2016; 11: 0145897.
15. Greene E, Visani A. Recognition of letters displayed as briefly flashed dot patterns. Atten Percept Psycho. 2015; 77: 1955-1969.
16. DeVries SH, Baylor DA. Mosaic arrangement of ganglion cell receptive fields in rabbit retina. J Neurophysiol. 1997; 78: 2048-2060.
17. Chichilnisky EJ, Kalmar RS. Functional asymmetries in ON and OFF ganglion cells in primate retina. J Neurosci. 2002; 22: 2737-2747.
18. McMahon MJ, Packer OS, Dacey DM. The classical receptive field surround in primate parasol ganglion cells is mediated primarily by a non-GABAergic pathway. J Neurosci. 2004; 24: 3736-3745.
Figure 2 A pattern of dots that surrounds an area can be seen as a shape. Here a chain of adjacent dots provides what can be considered to be a continuous boundary, similar to a silhouette. Distances from each dot to the centroid of the shape can be collected into a distribution that specifies the frequency for observing each distance. If distributions are provided for an inventory of shapes like this example, a given shape can be unambiguously identified using a simple method for comparing distributions.

CentralBringing Excellence in Open Access
Greene (2016)Email:
JSM Brain Sci 1(1): 1002 (2016) 6/6
Greene E (2016) How do we know whether Three Dots form an Equilateral Triangle? JSM Brain Sci 1(1): 1002.
Cite this article
19. Zhang AJ, Jacoby R, Wu SM. Light and dopamine-regulated receptive field plasticity in primate horizontal cells. J Comp Neurol. 2011; 519: 2125-2134.
20. Sceniak MP, Hawken MJ, Shapley R. Visual spatial characterization of macaque V1 neurons. J Neurophysiol. 2001; 85: 1873-1887.
21. Perkel DJ, Bullier J, Kennedy H. Topography of the afferent connectivity of area-17 in the macaque monkey a double-labeling study. J Comp Neurol. 1986; 253: 374-402.
22. Beseler HA, Sutter EE, Klein SA, Carney T. The topography of visual-evoked response properties across the visual field. Electroencephalogr Clin Neurophysiol. 1994; 90: 65-81.
23. Tootell RBH, Silverman MS, Switkes E, DeValois RL. Deoxyglucose analysis of retinotopic organization in primate striate cortex. Science. 1982; 218: 902-904.
24. Matin L, Li W. Spatial summation among coextensive and parallel line segments across wide separations (50-degrees) - egocentric localization and the great-circle model. Vision Res. 1994; 34: 2577-2598.
25. Das A, Gilbert CD. Long-range horizontal connections and their role in cortical reorganization revealed by optical-recording of cat primary visual cortex. Nature. 1995; 375: 780-784.
26. Essen DC, Zeki SM. The topographic organization of rhesus monkey prestriate cortex. J Physiol. 1978; 277: 193-226.
27. Chose GM, Tso DY. Form processing modules in primate area V4. J Neurophysiol. 1997; 77: 2191-2196.
28. Van den Bergh G, Zhang B, Arckens L, Chino YM. Receptive-field properties of V1 and V2 neurons in mice and macaque monkeys. J Comp Neurol. 2010; 518: 2051-2070.
29. Lui LL, Bourne JA, Rosa MG. Relationship between size summation properties, contrast sensitivity and response latency in the dorsomedial and middle temporal areas of the primate extrastriate cortex. PLoS One. 2013; 8: 68276.
30. Perrett DI, Oram MW. Neurophysiology of shape processing. Image Vision Comput. 1993; 11: 317-333.
31. Tsunoda K, Yamane Y, Nishizaki M, Tanifuji M. Complex objects are represented in macaque inferotemporal cortex by the combination of feature columns. Nat Neurosci. 2001; 4: 832-838.
32. Quiroga RQ, Reddy L, Kreiman G, Koch C, Fried I. Invariant visual representation by single neurons in human brain. Nature. 2005; 435: 1102-1107.
33. Ullman S, Basri R. Recognition by linear-combinations of models. IEEE T Pattern Anal. 1991; 13: 992-1006.
34. Mel BW. SEEMORE: combining color, shape, and texture histogramming in a neurally inspired approach to visual object recognition. Neural Comput. 1997; 4: 777-804.
35. Riesenhuber M, Poggio T. Models of object recognition. Nature Neurosci. 2000; 3: 1199-1204.
36. Becker D, Donness V, Mobbs P. Cell coupling in the retina: patterns and purpose. Cell Biol Int. 1998; 22: 781-792.
37. Bloomfield SA, Volgyi B. Response properties of a unique subtype of wide-field amacrine cell in the rabbit retina. Vis Neurosci. 2007; 24: 459-469.
38. Reese BE, Keeley PW. Design principles and developmental mechanisms underlying retinal mosaics. Biol Rev. 2015; 3: 854-876.
39. Ammermuller J, Weiler R. Physiological and morphological characterization of OFF-center amacrine cells in the turtle retina. J Comp Physiol. 1988; 273: 137-148.
40. Dacey DM. Axon-bearing amacrine cells of the Macaque monkey retina. J Comp Neurol. 1989; 284: 275-293.
41. Famiglietti EV. Polyaxonal amacrine cells of rabbit retina: morphology and stratification of PA1 cells. J Comp Neurol. 1992; 316: 391-405.
42. Famiglietti EV. Polyaxonal amacrine cells of rabbit retina: size and distribution of PA1 cells. J Comp Neurol. 1992; 316: 406-421.
43. Volgyi B, Xin D, Amarillo Y, Bloomfield SA. Morphology and physiology of the polyaxonal amacrine cells in the rabbit retina. J Comp Neurol. 2001; 440: 109-125.
44. Olveczky BP, Baccus SA, Meister M. Segregation of object and background motion in the retina. Nature. 2003: 423: 401-408.
45. Ackert JM, Wu SH, Lee JC, Abrams J, Hu EH, Perlman I, et al. Light-induced changes in spike synchronization between coupled ON direction selective ganglion cells in the mammalian retina. J Neurosci. 2006; 26: 4206-4215.
46. Baccus SA, Olveczky BP, Manu M, Meister M. A retinal circuit that computes object motion. J Neurosci. 2008; 28: 6807-6817.
47. Greschner M, Field GD, Li PH, Schiff ML, Gauthier JL, Ahn D, et al. A polyaxonal amacrine cell population in the primate retina. J Neurosci. 2014; 34: 3597-3606.
48. Field GD, Sher A, Gauthier JL, Greschner M, Shlens J, Litke AM, et al. Spatial properties and functional organization of small bistratified ganglion cells in primate retina. J Neurosci. 2007; 27: 13261-13272.
49. Greene E. Encoding system providing discrimination, classification, and recognition of shapes and patterns. US Patent # 7809195 B1. 2010. Copy available from E. Greene.