How can summer jobs reduce crime among youth? · How can summer jobs reduce crime among youth? c1...
22
How can summer jobs reduce crime among youth? An evaluation of the Boston summer youth employment program December 2017 ALICIA SASSER MODESTINO
Transcript of How can summer jobs reduce crime among youth? · How can summer jobs reduce crime among youth? c1...

c1How can summer jobs reduce crime among youth?
How can summer jobs reduce crime among youth? An evaluation of the Boston summer youth
employment program
December 2017
ALICIA SASSER MODESTINO
Brookings Metropolitan Policy Program2
Summer youth employment programs (SYEPs) have become increasingly popular in cities and counties across the country, and are effective in reducing crime and incarceration among participants, according to recent evaluations. However, less is known about how they achieve these impacts, and which participants benefit the most. With more information about which program elements are the most effective, places can do more to ensure quality as they expand or launch programs.
This study used a randomized control trial to examine whether the Boston summer youth employment program reduced crime, and to explore whether short-term behavioral and attitudinal changes related to participation in the program are linked to crime reduction. The main findings include:
• Participants had fewer arraignments for violent and property crimes. Summer jobs participants had significantly fewer arraignments (charges) for violent crimes (-35 percent) and property crimes (-57 percent) in the 17 months following the intervention. Most of the decline occurred in the fifteen months after the program’s end. Declines were particularly pronounced among African-American and Latino males.
• Participants showed improvements in their skills, attitudes, and aspirations. At the end of the summer, program participants showed improvements in social skills, community engagement, job preparedness, and academic aspirations compared to youth who did not participate in the program. Improvements were larger for younger participants and youth of color.
• Improvements in social and emotional skills were linked to the decline in arraignments. Improvements in social and emotional skills, such as learning to manage one’s emotions and resolve conflicts with a peer, were associated with larger declines in the number of arraignments for both violent and property crimes.
These results highlight the potential of summer jobs programs to reduce crime and violence. While the results on program mechanisms are exploratory rather than definitive, they point to the value of targeting social and emotional skills in preventing criminal behavior, and suggest that summer jobs programs may be a vehicle for improving such skills.1
Summary
3How can summer jobs reduce crime among youth?
Mayors and local officials often use summer youth employment programs (SYEPs) to help young people gain work experience, earn wages, and stay out of trouble. Increasingly, policymakers are also using these programs to provide youth a pathway to careers and/or post-secondary education. Summer jobs programs are a vehicle to give young people a boost in the labor market and help them develop positive relationships with adults and peers; imagine new possibilities for themselves; and engage in positive, constructive activities during time that otherwise would likely be unstructured. The programs are politically popular and are often a local jurisdiction’s highest profile youth initiative. They can also feed into programs that take place during the academic year, especially if community-based organizations that hire or train young people over the summer refer participants to their own year-round programs.
Programs typically last six to eight weeks and serve youth aged 14 to 24, but mostly students of high school age. Most young people are hired into subsidized jobs in government or nonprofit settings and work between 15 and 30 hours per week. Private-sector employers frequently participate as well; they often offer competitive placements for more job-ready young people, and sometimes pay participants themselves rather than using a subsidy.
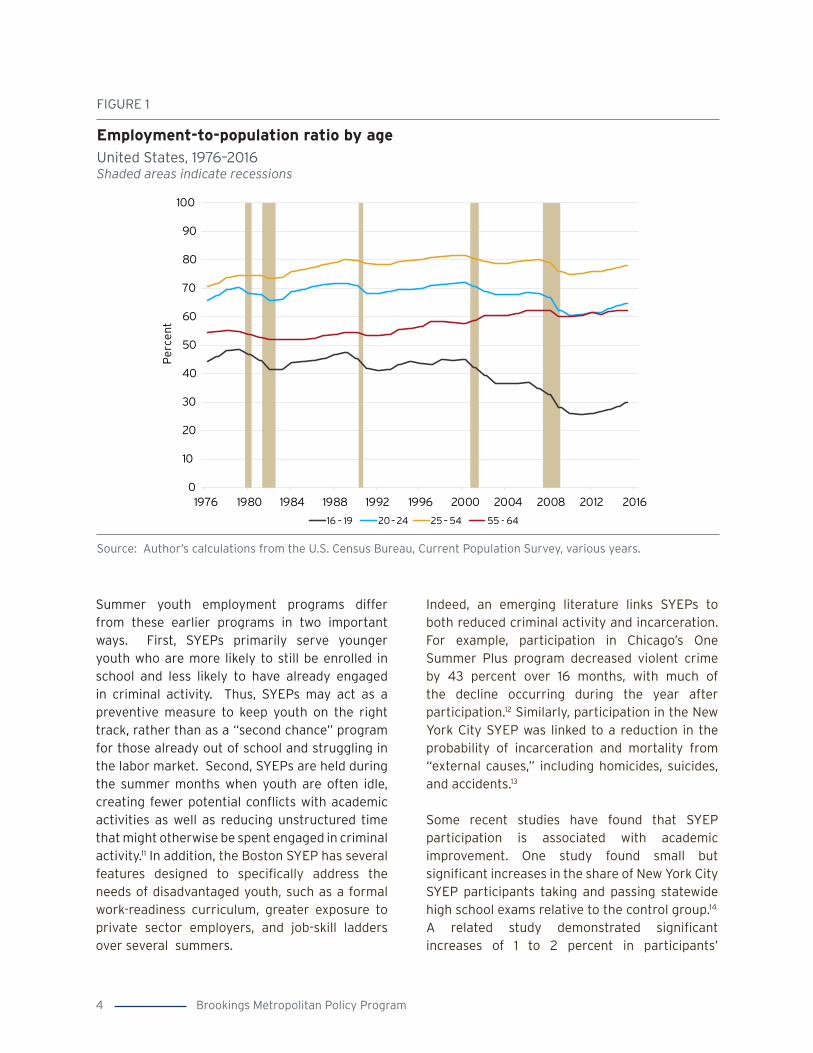
Declining employment rates among teens and young adults—particularly those who are low-income, African-American, or Latino—have raised concerns about their ability to find work (Figure 1). Employer expectations have risen for work readiness, communication, and other soft skills—qualifications that are difficult for youth to demonstrate without prior work experience.2 Teens, especially those not enrolling in college, may struggle to find pathways into the labor market as post-secondary credentials are now
required for many jobs that previously required only a high school degree.3 Together, these hurdles make it hard for many young people, particularly those with weak school and work records, to enter and move up in the labor market.
Youth are twice as likely as adults to be both victims and perpetrators of violence, and young people of color are more likely than their white peers to be arrested for violent crimes.4 Summer jobs programs strive to address one of the underlying causes of racial disparities in the criminal justice system—the diminished economic opportunity for those who live in neighborhoods with few job opportunities and failing schools, which disproportionately affects young people of color.5 By providing greater exposure to the workplace, formal career-readiness instruction, and job-skill ladders over several summers, SYEPs aim to give participants the tools and experience needed to navigate the job market on their own, with the belief that “nothing stops a bullet like a job.”6
Until recently, there was relatively little research on the effectiveness of summer jobs programs.7 Prior research focused on more intensive, longer-term programs serving youth who were older and more at-risk than typical summer jobs participants, and these produced mixed results. For example, the National Guard Youth ChalleNGe program improved education, employment, and earnings among participants, although it did not reduce delinquency.8 Other programs such as Job Corps and JOBSTART led to improvements in education and employment; they also lowered crime, but involved such intensity and expense that the benefits did not outweigh the costs.9 Attempts to provide shorter, more scalable employment services through programs such as those funded by the federal Job Training Partnership Act appeared to actually increase adolescents’ criminal behavior.10
Introduction
Brookings Metropolitan Policy Program4
Summer youth employment programs differ from these earlier programs in two important ways. First, SYEPs primarily serve younger youth who are more likely to still be enrolled in school and less likely to have already engaged in criminal activity. Thus, SYEPs may act as a preventive measure to keep youth on the right track, rather than as a “second chance” program for those already out of school and struggling in the labor market. Second, SYEPs are held during the summer months when youth are often idle, creating fewer potential conflicts with academic activities as well as reducing unstructured time that might otherwise be spent engaged in criminal activity.11 In addition, the Boston SYEP has several features designed to specifically address the needs of disadvantaged youth, such as a formal work-readiness curriculum, greater exposure to private sector employers, and job-skill ladders over several summers.
Indeed, an emerging literature links SYEPs to both reduced criminal activity and incarceration. For example, participation in Chicago’s One Summer Plus program decreased violent crime by 43 percent over 16 months, with much of the decline occurring during the year after participation.12 Similarly, participation in the New York City SYEP was linked to a reduction in the probability of incarceration and mortality from “external causes,” including homicides, suicides, and accidents.13
Some recent studies have found that SYEP participation is associated with academic improvement. One study found small but significant increases in the share of New York City SYEP participants taking and passing statewide high school exams relative to the control group.14 A related study demonstrated significant increases of 1 to 2 percent in participants’
0
10
20
30
40
50
60
70
80
90
100
1976 1980 1984 1988 1992 1996 2000 2004 2008 2012 2016
Pe
rce
nt
16 – 19 20 – 24 25 – 54 55 - 64
United States, 1976–2016Shaded areas indicate recessions
Employment-to-population ratio by age
FIGURE 1
Source: Author’s calculations from the U.S. Census Bureau, Current Population Survey, various years.
5How can summer jobs reduce crime among youth?
school attendance the following year, with larger improvements for students aged 16 and older with low baseline attendance.15 However, other research found no positive effects on college enrollment, school attendance, or grade point average.16
Findings on employment were also mixed. Research in New York City and Chicago found no employment-related improvements among summer jobs participants.17 However, new research highlights the varying effects that these programs can have across subgroups, which can be masked when reporting aggregate results. A creative machine-learning analysis found that a subset of participants in Chicago did show improvement in subsequent employment; this group was younger, more likely to be Hispanic, female and enrolled in school, and less likely to engage in criminal behavior.18
While this emerging literature demonstrates encouraging results in some cities—particularly for criminal justice and academic outcomes—replicating studies across different places and settings is important for cities looking to adopt similar programs. More information on the mechanisms driving improved outcomes is also critical for designing and running new programs. Are improvements driven by increased job-readiness skills? Increased income? Stronger networks? Better answers are needed to inform which program elements to emphasize.
This report builds on and adds to existing SYEP literature by linking survey data on behavioral impacts to administrative data on criminal justice outcomes to shed light not only on what works but also on what works for whom, and why. Future research will assess academic and employment outcomes as well.
Brookings Metropolitan Policy Program6
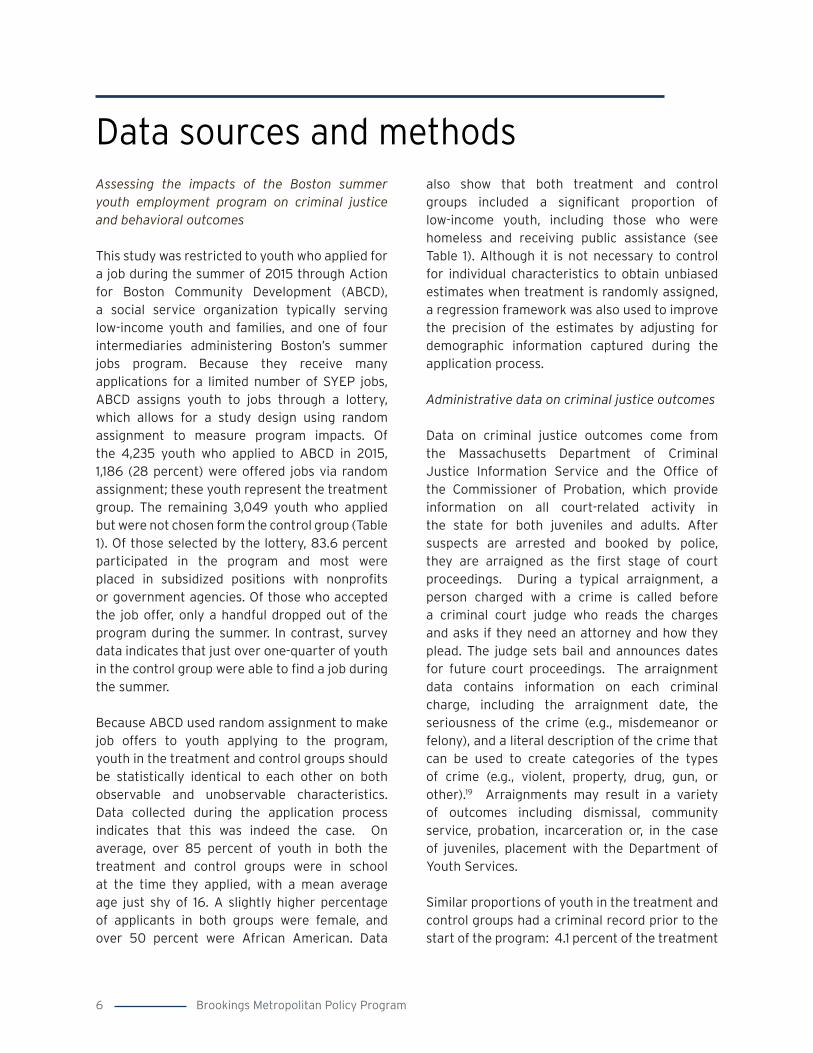
Assessing the impacts of the Boston summer youth employment program on criminal justice and behavioral outcomes
This study was restricted to youth who applied for a job during the summer of 2015 through Action for Boston Community Development (ABCD), a social service organization typically serving low-income youth and families, and one of four intermediaries administering Boston’s summer jobs program. Because they receive many applications for a limited number of SYEP jobs, ABCD assigns youth to jobs through a lottery, which allows for a study design using random assignment to measure program impacts. Of the 4,235 youth who applied to ABCD in 2015, 1,186 (28 percent) were offered jobs via random assignment; these youth represent the treatment group. The remaining 3,049 youth who applied but were not chosen form the control group (Table 1). Of those selected by the lottery, 83.6 percent participated in the program and most were placed in subsidized positions with nonprofits or government agencies. Of those who accepted the job offer, only a handful dropped out of the program during the summer. In contrast, survey data indicates that just over one-quarter of youth in the control group were able to find a job during the summer.
Because ABCD used random assignment to make job offers to youth applying to the program, youth in the treatment and control groups should be statistically identical to each other on both observable and unobservable characteristics. Data collected during the application process indicates that this was indeed the case. On average, over 85 percent of youth in both the treatment and control groups were in school at the time they applied, with a mean average age just shy of 16. A slightly higher percentage of applicants in both groups were female, and over 50 percent were African American. Data
also show that both treatment and control groups included a significant proportion of low-income youth, including those who were homeless and receiving public assistance (see Table 1). Although it is not necessary to control for individual characteristics to obtain unbiased estimates when treatment is randomly assigned, a regression framework was also used to improve the precision of the estimates by adjusting for demographic information captured during the application process.
Administrative data on criminal justice outcomes
Data on criminal justice outcomes come from the Massachusetts Department of Criminal Justice Information Service and the Office of the Commissioner of Probation, which provide information on all court-related activity in the state for both juveniles and adults. After suspects are arrested and booked by police, they are arraigned as the first stage of court proceedings. During a typical arraignment, a person charged with a crime is called before a criminal court judge who reads the charges and asks if they need an attorney and how they plead. The judge sets bail and announces dates for future court proceedings. The arraignment data contains information on each criminal charge, including the arraignment date, the seriousness of the crime (e.g., misdemeanor or felony), and a literal description of the crime that can be used to create categories of the types of crime (e.g., violent, property, drug, gun, or other).19 Arraignments may result in a variety of outcomes including dismissal, community service, probation, incarceration or, in the case of juveniles, placement with the Department of Youth Services.
Similar proportions of youth in the treatment and control groups had a criminal record prior to the start of the program: 4.1 percent of the treatment
Data sources and methods
7How can summer jobs reduce crime among youth?
Treatment group (assigned to SYEP)
Control group (not assigned to SYEP)
Total entering random assignment
1,186 3,049
Percent of youth with prior criminal record
4.1% 3.6%
Percent of youth
Standard errorPercent of
youthStandard errorAge as of time of
application
Mean 15.9 (0.064) 15.9 (0.033)
14-18 years 85.9% (0.011) 87.6% (0.006)
19-21 years 12.8% (0.011) 12.7% (0.006)
22-24 years 0.2% (0.001) 0.1% (0.001)
Gender
Female 52.0% (0.016) 53.9% (0.009)
Male 48.0% (0.016) 46.1% (0.009)
Current Education Status
In-school 88.3% (0.010) 87.7% (0.006)
Race
African American 56.6% (0.016) 57.6% (0.009)
Asian 6.3% (0.008) 5.8% (0.004)
White 9.9% (0.010) 9.0% (0.005)
Other / Mixed-Race 27.2% (0.014) 27.6% (0.008)
Preferred Language
Chinese 0.1% (0.001) 0.1% (0.001)
English 95.8% (0.006) 95.3% (0.004)
Spanish 3.0% (0.005) 2.8% (0.003)
Other 0.9% (0.003) 0.9% (0.002)
Limited English Ability
Yes 7.0% (0.008) 7.0% (0.005)
Housing Status
Homeless 3.4% (0.006) 2.9% (0.003)
Household Income Type
Public assistance 18.6% (0.012) 16.7% (0.007)
Disabled
Yes 3.5% (0.007) 3.1% (0.003)
TABLE 1
Characteristics of treatment and control groups
Source: Based on application data provided by the City of Boston Office of Workforce Development and criminal justice records supplied by the Department of Criminal Justice Information Services and the Office of the Commissioner of the Probation.
Note: None of the differences between the treatment and control groups were statistically significant at the 1%, 5%, or 10% levels.
Brookings Metropolitan Policy Program8
group and 3.6 percent of the control group had been arraigned in court before July 2015. Criminal record data measures criminal activity only to the extent that an individual was arrested and booked. It does not capture criminal activity that went undetected by police or encounters with the police that did not result in official documentation. It also does not reveal whether the individual was subsequently found guilty of the crime that they were charged with. Despite these caveats, the arraignment data represent a robust measure of involvement with the criminal justice system.
To assess the impact of the Boston SYEP on criminal justice outcomes, I compared criminal records during the 17 months following random assignment among youths who were offered SYEP placements (the treatment group) and those not offered placements (control group). Because SYEP participation is allocated via lottery, I was able to obtain causal estimates using a simple comparison of means on the outcome of interest. This method, known as the intent to treat (ITT) estimate, measures the impact of offering services on the outcome. In many cases, this is the policy-relevant estimate because program administrators want to know the overall effectiveness of a program, not just among program completers. This requires including everyone in the analysis who was offered the chance to participate, including those who did not enroll and those who enrolled but dropped out. Two outcomes were measured: (1) whether an individual was arraigned for any crime during the 17 months following random assignment, including the two-month summer program and the subsequent 15 months, and (2) the number of arraignments during the same time period.
Survey data on behavioral outcomes
I assessed the short-term behavioral impacts of the Boston SYEP using data from a survey that was administered to participants at both the beginning and the end of the two-month summer program to measure changes over time, and to the control group at the end of the program to provide a point of comparison.20 The questions, adapted from a survey developed by Boston’s Youth Violence Prevention Collaborative, assessed social skills and community engagement, job-readiness skills, future work plans, and aspirations to attend college, among other things.21 These pre-and post-program survey results were then linked to the criminal justice outcomes.
Although youth in the control group were randomly selected, those who chose to respond to the survey had slightly different demographic characteristics that are more positively correlated with employment than the treatment group, (e.g., they were older, more likely to be female, white, or Asian, and live in a two-parent household). As a result, this method set a relatively high bar for comparison and may underestimate the impact of the Boston SYEP on short-term behavioral outcomes. Only outcomes that a) showed significant improvement over time among participants and b) showed significant differences between the treatment and control groups were attributed to the Boston SYEP program.
This part of the analysis is exploratory in nature. Nevertheless, it is possible to explore whether improvement in short-term behavioral impacts are correlated with subsequent improvement in the criminal justice outcomes to shed light on the program’s mechanisms.
9How can summer jobs reduce crime among youth?
Findings
1 The Boston summer youth employment program reduced arraignments for violent
and property crimes among participants
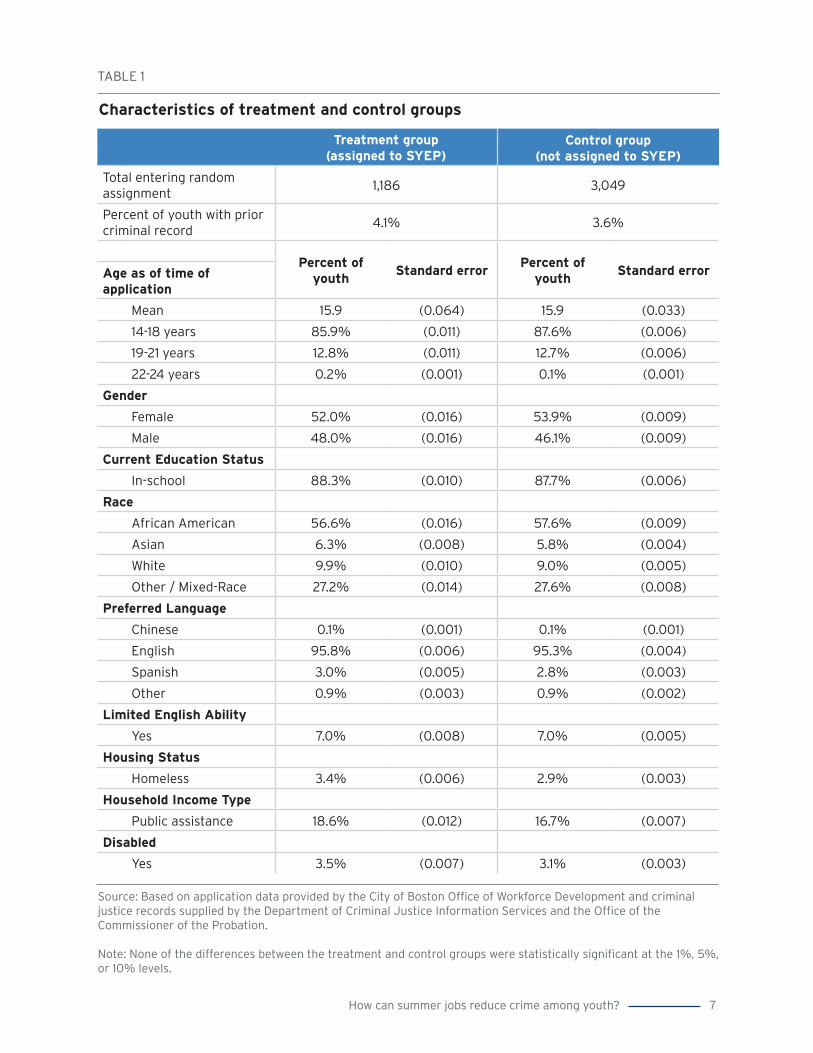
Similar to the results of the Chicago study discussed above, the Boston SYEP results showed it significantly reduced the frequency of criminal arraignments among youth.22 Violent-crime arraignments among the treatment group decreased 35 percent relative to the control group, with roughly 2.5 fewer arraignments per 100 youth (Figure 2). The percentage decline was even greater for property crimes (-57 percent). No significant changes in arraignments were found for other types of crimes (gun, drug, or other). Similar reductions in arraignments were observed regardless of the seriousness of the crime (i.e., misdemeanor versus felony).
The decrease in criminal activity was not limited to the duration of the program, as would be expected if the program’s primary mechanism were to “incapacitate” youth during the summer by giving them less opportunity to engage in
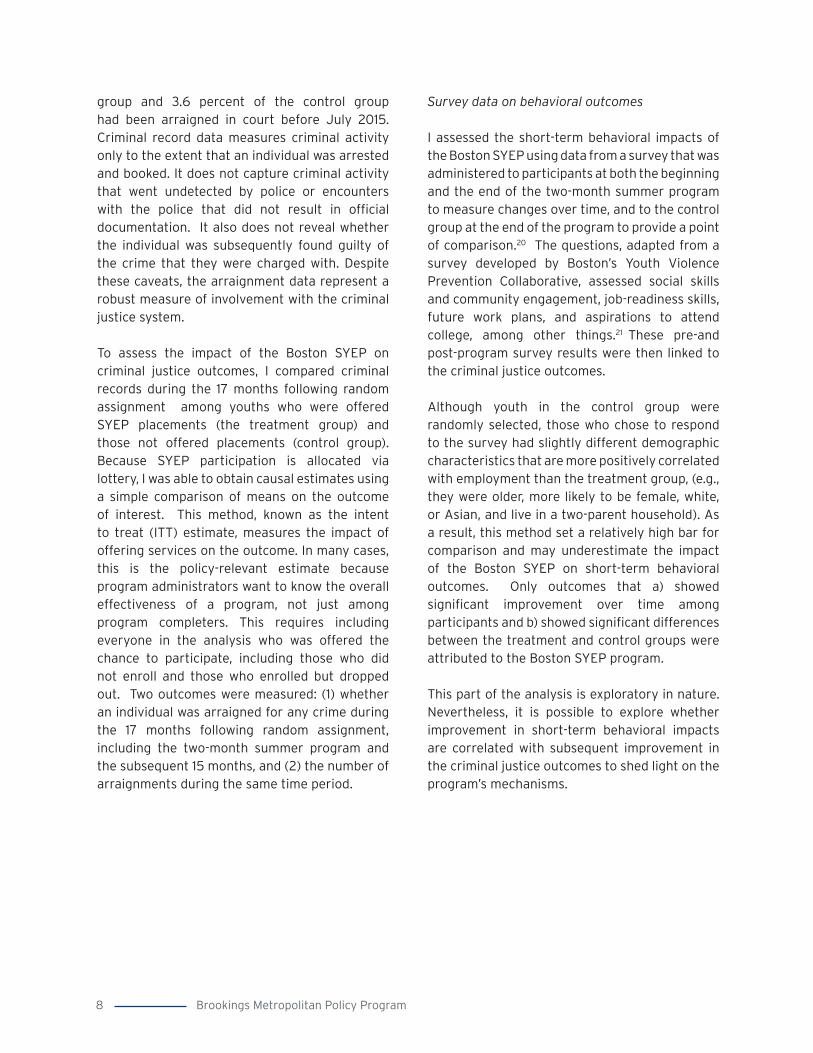
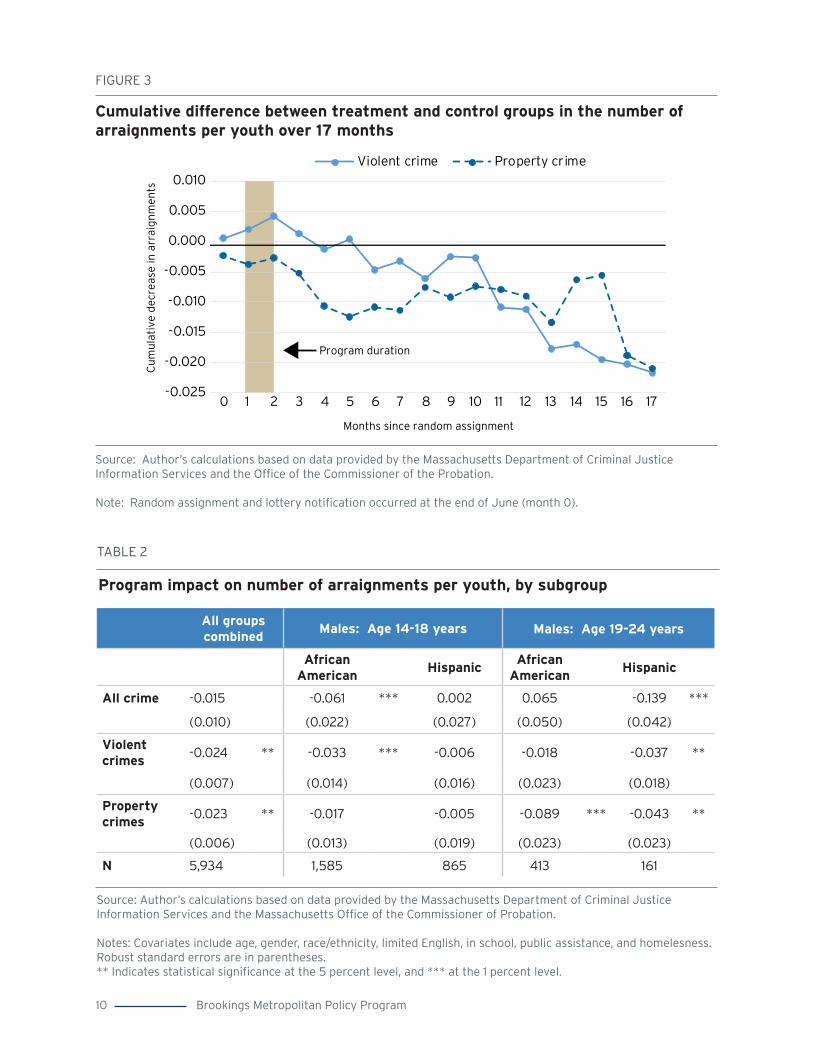
delinquent behavior. Instead, the number of arraignments for the treatment group continued to fall relative to the control group during the 15 months after the program ended. Figure 3 shows the cumulative treatment effect over time, with each point adding a month of data to the prior effect.
For example, in month six there were 0.5 fewer violent crime arraignments per 100 youth in the treatment group than the control group. This is the point at which the difference in violent crime arraignments between the treatment and control groups becomes statistically significant—a full four months after the end of the program—after which arraignments continue to fall through month 17. For property crimes, the drop in arraignments becomes significant around month four, after which it flattens out through month 13. The downward slope of the effect makes it clear that most of the reduction in criminal activity accrues well after the program ends at month two.
0
5
10
15
20
25
All Violent Property Drug Gun Other
Treatment Group Control group
0%
1%
2%
3%
4%
5%
6%
Number of arraignments per 100 youth Percent of youth ever arraigned
All Violent Property Drug Gun Other
** **
Treatment Group Control group
Arraignments among treatment and control groups at 17 months after random assignment
FIGURE 2
Source: Author’s calculations based on administrative records from the Massachusetts Department of Criminal Justice, Information Services and the Massachusetts Office of the Commissioner of Probation.
Note: ** Indicates difference is statistically significant at the 5 percent level.
Brookings Metropolitan Policy Program10
-0.025
-0.020
-0.015
-0.010
-0.005
0.000
0.005
0.010
0 1 2 3 4 5 6 7 8 9 10 11 12 13 14 15 16 17
Violent crime Property crime
Program duration
Cu
mu
lati
ve d
ecre
ase
in a
rrai
gn
men
ts
Months since random assignment
Cumulative difference between treatment and control groups in the number of arraignments per youth over 17 months
FIGURE 3
Source: Author’s calculations based on data provided by the Massachusetts Department of Criminal Justice Information Services and the Office of the Commissioner of the Probation.
Note: Random assignment and lottery notification occurred at the end of June (month 0).
All groups combined
Males: Age 14-18 years Males: Age 19-24 years
African American
HispanicAfrican
AmericanHispanic
All crime -0.015 -0.061 *** 0.002 0.065 -0.139 ***
(0.010) (0.022) (0.027) (0.050) (0.042)
Violent crimes
-0.024 ** -0.033 *** -0.006 -0.018 -0.037 **
(0.007) (0.014) (0.016) (0.023) (0.018)
Property crimes
-0.023 ** -0.017 -0.005 -0.089 *** -0.043 **
(0.006) (0.013) (0.019) (0.023) (0.023)
N 5,934 1,585 865 413 161
TABLE 2
Program impact on number of arraignments per youth, by subgroup
Source: Author’s calculations based on data provided by the Massachusetts Department of Criminal Justice Information Services and the Massachusetts Office of the Commissioner of Probation.
Notes: Covariates include age, gender, race/ethnicity, limited English, in school, public assistance, and homelesness.Robust standard errors are in parentheses.** Indicates statistical significance at the 5 percent level, and *** at the 1 percent level.
11How can summer jobs reduce crime among youth?
Significant reductions in arraignments for both violent and property crime were found among African American and Hispanic males of varying ages. No significant impacts were detected for females, who started out with much lower baseline arraignment rates. For example, Table 2 shows that among African American males aged 14–18, the total number of arraignments fell by 6.1 per 100 youth for those in the treatment group relative to the control group, primarily driven by a drop in violent crime. The reduction in arraignments among older African-American males aged 19–24 was driven primarily by a
reduction in property crimes (-8.9 crimes per 100 youths). In contrast, the drop in arraignments among Hispanic males aged 19–24 (-13.9 crimes per 100 youths) was driven by a fall in both violent and property crimes.
Yet in terms of the likelihood of ever being arraigned, there was no significant reduction in the percent of youth arraigned in the treatment group versus the control group. In the 17 months after the program started (including two months in the program and the following 15 months), 5.1 percent of the treatment group (53 youths) was
Treatment group
Number of arraignments per youth
Percent of youth arraigned for a criminal charge
Pre Post Diff: Post-Pre Pre Post Diff: Post-Pre
All crimes 0.12 0.18 0.06 ** 4.1% 5.1% 1.1 **
Violent crimes 0.07 0.06 -0.01 3.2% 3.9% 0.7 *
Property crimes 0.04 0.06 0.01 3.1% 3.7% 0.6 *
Drug crimes 0.00 0.02 0.02 0.7% 0.9% 0.2
Gun crimes 0.00 0.02 0.02 0.4% 0.8% 0.4
Other crimes 0.01 0.03 0.02 1.6% 2.2% 0.5 *
Control group
Number of arraignments per youth
Percent of youth arraigned for a criminal charge
Pre Post Diff: Post-Pre Pre Post Diff: Post-Pre
All crimes 0.14 0.21 0.08 ** 3.6% 5.4% 1.8 **
Violent crimes 0.06 0.09 0.03 ** 2.8% 4.3% 1.4 **
Property crimes 0.05 0.08 0.03 ** 2.1% 3.0% 0.9 **
Drug crimes 0.01 0.01 0.00 0.4% 0.6% 0.2
Gun crimes 0.00 0.01 0.01 0.2% 0.4% 0.2
Other crimes 0.02 0.02 0.00 1.2% 1.9% 0.7
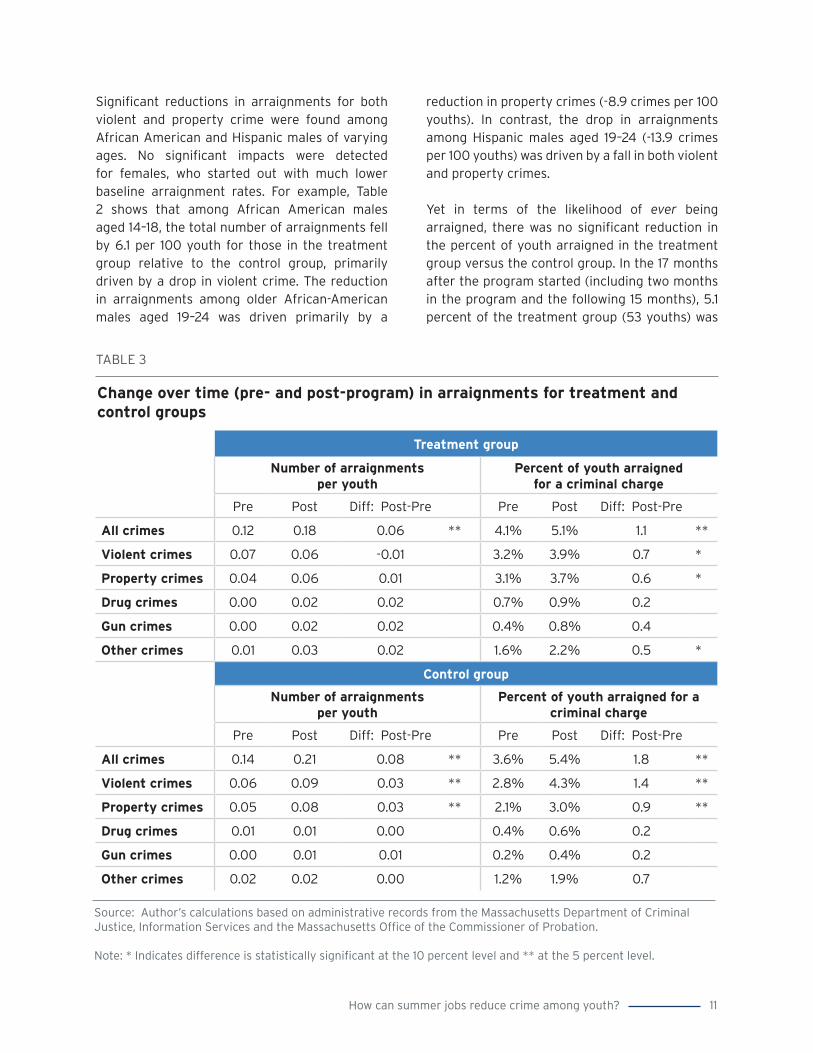
TABLE 3
Change over time (pre- and post-program) in arraignments for treatment and control groups
Source: Author’s calculations based on administrative records from the Massachusetts Department of Criminal Justice, Information Services and the Massachusetts Office of the Commissioner of Probation.
Note: * Indicates difference is statistically significant at the 10 percent level and ** at the 5 percent level.
Brookings Metropolitan Policy Program12
arrested for any crime compared with 5.4 percent of the control group (165 youths; Table 3). In other words, the program did not reduce the number of youth who were charged with a crime. Rather, it reduced the number of charges. A similar number of youth in the treatment and control groups were charged, but members of the treatment group were charged with fewer offenses. Indeed, the relative reduction in the number of arraignments for violent and property crimes was driven by a significantly smaller increase over time among the treatment group. Yet the percentage of youth being arraigned for any crime increased for both the treatment and control groups. Moreover, the re-arraignment rate for both groups was similar: 43 percent of individuals with a prior criminal record in the treatment group were arraigned compared with 48 percent in the control group.
What might be driving this result? It could be that participating in the Boston SYEP disrupted youth activities over the summer which provided them with fewer opportunities to engage in delinquent behavior even after the program’s end. Yet we see little reduction in the number of arraignments during the program—the impacts do not become significant until four to six months after the program’s end. Alternatively, it could be that youths learned new patterns of behavior during the summer that are correlated with a reduction in delinquency and crime, such as how to resolve conflict with a peer. If such behavioral changes are lasting, this could explain why we observe a cumulative reduction in the number of arraignments over time. We explore this idea further in the next section by assessing the degree to which SYEP participants learned new skills over the summer and how these changes are correlated with the relative reduction in arraignments over the longer term.
2 Participants reported improved social skills and attitudes toward their
communities, enhanced job readiness skills, and higher academic aspirations
During the summer, participants’ attitudes toward their communities improved greatly and
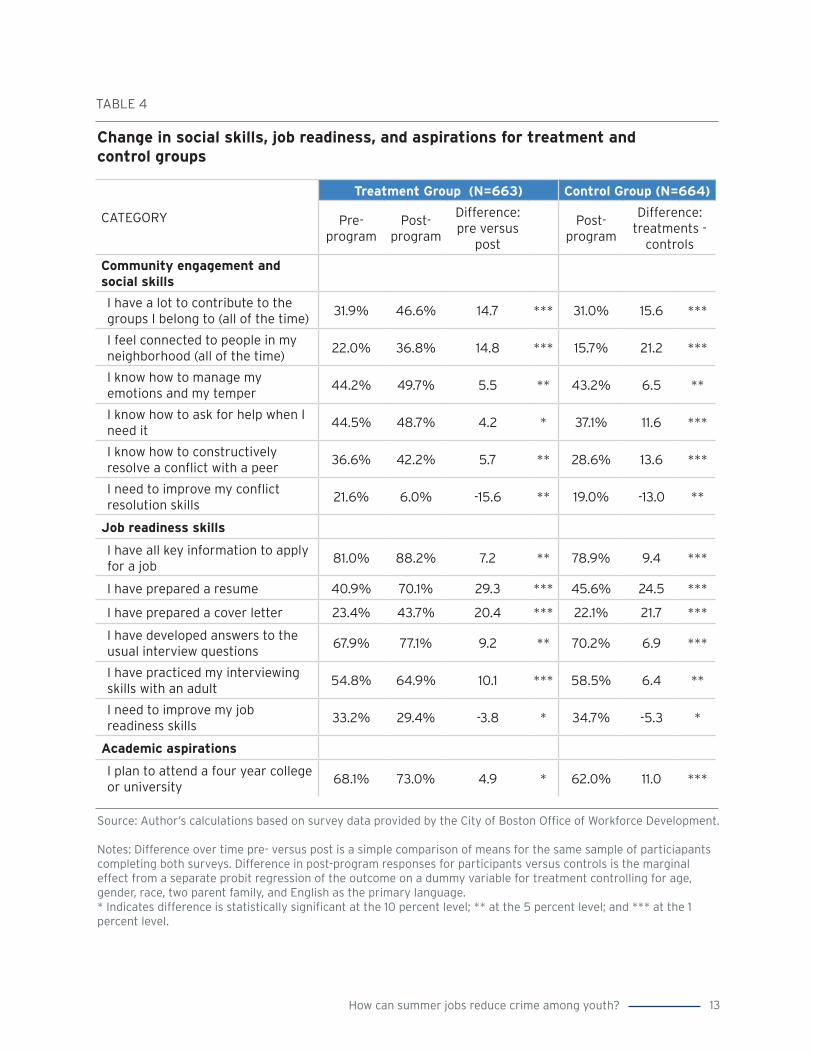
were significantly better than those reported by the control group at the end of the summer. For example, the percentage of participants who said that over the past 30 days they always had a lot to contribute to the groups to which they belonged jumped by 15 percentage points (Table 4). Similar positive improvements were seen in the share of teens who said they always felt connected to their neighborhood. These large improvements may be driven by the nature of SYEP placements. Most participants worked in community-based organizations in the neighborhoods in which many of them lived, providing an opportunity for youth to engage in their communities in a positive way.
Participants also showed significant but smaller improvements relative to the control group regarding social skills and behaviors correlated with delinquent and criminal behavior.23 For example, by the end of the summer, a greater share of participating youth reported knowing how to manage their emotions, how to ask for help when they needed it, and how to constructively resolve conflict with a peer. In addition, there was a large and significant reduction in the percentage of youth indicating that they needed to improve their conflict-resolution skills (-15.6 percentage points).
Participants also indicated sizeable growth in job-readiness skills, such that their skill levels at the end of the summer were significantly greater than those reported by the control group. These included a large increase in the percent of participants reporting that they had prepared a resume (+29.3 percentage points) and a cover letter (+20.4 percentage points). More modest improvements in the percentage of participants who had practiced interviewing skills with an adult (+10.1 percentage points) and had developed answers to typical interview questions (+9 percentage points) were also observed.
Over the course of the summer, the percentage of participants indicating that they planned to work in the fall increased by 7.4 percentage points to 48 percent, perhaps reflecting a sense of being
13How can summer jobs reduce crime among youth?
CATEGORY
Treatment Group (N=663) Control Group (N=664)
Pre-program
Post-program
Difference: pre versus
post
Post-program
Difference: treatments -
controls
Community engagement and social skills
I have a lot to contribute to the groups I belong to (all of the time)
31.9% 46.6% 14.7 *** 31.0% 15.6 ***
I feel connected to people in my neighborhood (all of the time)
22.0% 36.8% 14.8 *** 15.7% 21.2 ***
I know how to manage my emotions and my temper
44.2% 49.7% 5.5 ** 43.2% 6.5 **
I know how to ask for help when I need it
44.5% 48.7% 4.2 * 37.1% 11.6 ***
I know how to constructively resolve a conflict with a peer
36.6% 42.2% 5.7 ** 28.6% 13.6 ***
I need to improve my conflict resolution skills
21.6% 6.0% -15.6 ** 19.0% -13.0 **
Job readiness skills
I have all key information to apply for a job
81.0% 88.2% 7.2 ** 78.9% 9.4 ***
I have prepared a resume 40.9% 70.1% 29.3 *** 45.6% 24.5 ***
I have prepared a cover letter 23.4% 43.7% 20.4 *** 22.1% 21.7 ***
I have developed answers to the usual interview questions
67.9% 77.1% 9.2 ** 70.2% 6.9 ***
I have practiced my interviewing skills with an adult
54.8% 64.9% 10.1 *** 58.5% 6.4 **
I need to improve my job readiness skills
33.2% 29.4% -3.8 * 34.7% -5.3 *
Academic aspirations
I plan to attend a four year college or university
68.1% 73.0% 4.9 * 62.0% 11.0 ***
TABLE 4
Change in social skills, job readiness, and aspirations for treatment and control groups
Source: Author’s calculations based on survey data provided by the City of Boston Office of Workforce Development.
Notes: Difference over time pre- versus post is a simple comparison of means for the same sample of particiapants completing both surveys. Difference in post-program responses for participants versus controls is the marginal effect from a separate probit regression of the outcome on a dummy variable for treatment controlling for age, gender, race, two parent family, and English as the primary language. * Indicates difference is statistically significant at the 10 percent level; ** at the 5 percent level; and *** at the 1 percent level.
Brookings Metropolitan Policy Program14
better prepared for the workforce. However, this was actually lower than the share of the control group reporting that they planned to work in the fall (56.1 percent). This may be because participants felt less need to work in the fall compared with those in the control group, who were far less likely to report being employed during the summer. In fact, the SYEP program, by enabling youth to shift their work experiences to a part of the year when they are not also attending school, might provide the additional benefit of increasing the time and attention these students can devote to academics during the school year.
In terms of academic aspirations, while the Boston SYEP did not significantly change the share of participants planning to enroll in post-secondary education or training, it did shift those aspirations toward a four-year degree. Youth in the treatment group reported an increased desire to attend a four-year college (+4.9 percentage points) instead of shorter-term educational or training options.
3 The results suggest that reductions in violent and property crimes are linked
to participants’ improved social and emotional skills
Four rationales are often cited in support of summer jobs programs as a strategy to prevent crime: (1) reducing opportunities to engage in delinquent or criminal behavior, also referred to as “incapacitation,” (2) improving behaviors that are correlated with crime, (3) making crime less attractive by improving future employment prospects, and (4) providing direct income to youth and their families. While it is hard to say which of these channels is the primary one without a full analysis of mediator effects, the evidence provided in this study gives some clues. First, consistent with other research, it appears unlikely that the Boston SYEP primarily reduced
criminal activity by decreasing opportunities for youth to engage in delinquent or criminal behavior. The drop in criminal activity was not limited to the duration of the program, as would be expected if the program’s primary mechanism were to “incapacitate” youth during the summer. Instead, the impact of the Boston SYEP on the number of arraignments becomes statistically significant four to six months after the program’s end and continues to increase until the end of the 17 month study period, suggesting that the program may have longer-lasting effects that change youth behavior.
Second, there is some suggestive evidence that the Boston SYEP is more likely to affect criminal justice outcomes by improving behaviors that are correlated with crime rather than by making crime less attractive through improving future employment prospects. In a recent paper, I found that while participants showed improvements in a number of short-term behavioral outcomes, only some behaviors were correlated with the subsequent reduction in criminal arraignments.24 For example, improvements in short-term measures related to social and emotional skills—such as learning to manage one’s emotions and resolve conflicts with a peer—were correlated with larger decreases in both violent and property crimes. Other short-term behavioral outcomes, such as increasing job readiness and raising academic aspirations, were not correlated with the decrease in criminal activity, implying that these channels do not appear to play a role in reducing longer-term delinquent behavior. However, this analysis has limitations. It does not fully disentangle the SYEP program effects from the benefits of simply providing youth and their families with additional income. Additionally, the survey data are self-reported and the responses are not benchmarked against specific definitions of the measures in question. As such, the results should be interpreted with caution.
15How can summer jobs reduce crime among youth?
This report builds on an emerging literature that finds youth workforce development programs of short duration can have significant impacts. The results from Boston presented here on the long-term criminal justice outcomes are remarkably similar to those from Chicago and New York City, confirming the replicability of SYEP effectiveness in reducing crime across cities. Moreover, by linking the survey data on short-term program impacts to administrative data on longer-term criminal justice outcomes, this report suggests that short-term changes in social skills can reduce violence. While the findings are exploratory, they are aligned with other recent research on the value of behavioral interventions in preventing crime and improving school outcomes.25
However, it is not clear how the Boston SYEP compares with other interventions that do not involve the substantial direct costs of subsidized wages as well as the indirect costs and staff time to solicit commitments from employers, match teens to jobs at the start of each summer, and supervise youth at multiple job sites. For example, the Becoming a Man intervention uses an approach derived from cognitive behavioral therapy to reduce violence and prevent young people from dropping out of school. Becoming a Man helps participants examine their decisionmaking processes so they can choose which responses are appropriate for a given situation, rather than relying on automatic responses that may be maladaptive. A recent evaluation of the program in Chicago found that it achieved even larger impacts than the Boston SYEP (e.g., reducing violent crime arrests by up to 50 percent) for nearly the same participant cost (about $2,000 per participant) with a benefit-cost ratio of up to 30-to-1.26
Yet SYEPs have advantages over other programs, providing benefits to individuals, families, and even communities that may outweigh the costs.
First, unlike year-round programs, SYEPs occur during the summer months when youth are more likely to be idle, and thus they are less likely to interfere with academic studies or extracurricular activities. Second, unlike more targeted behavioral programs, SYEPs confer job experience, which may yield advantages in future employment, career pathways, or post-secondary education—although the evidence on this is admittedly thin. Third, SYEPs help families at or near the poverty line by providing income to youth, about one in five of whom contributes directly to their household’s expenses, according to our survey. Fourth, SYEPs supply a low-cost source of labor for many community-based programs serving cities, particularly summer camps that provide inexpensive daycare for working parents.
However, practitioners need more answers about program design as they seek to improve summer jobs programs and enhance access to post-secondary education and career pathways. For example, it is difficult to tell whether the program’s impact stems from participants learning new skills on the job or through the career-readiness curriculum—an important distinction for cities like Los Angeles and Philadelphia that are considering adding a career-readiness curriculum to their programs. Future work using alternative sources of random variation within the other Boston SYEP intermediaries that dictate which participants receive the career-readiness curriculum may help answer this question. In addition, understanding the intensity needed to produce better outcomes would be helpful as cities seek to serve the greatest number of youth with limited funding. For example, a portion of the Boston SYEP funding comes from state sources, which stipulate that only 20 percent of the youth served in any given year can be repeat participants. Additional analyses using historical participation records may be useful for determining the minimum “dosage” (i.e., number of summers) needed to
Policy implications and conclusions
Brookings Metropolitan Policy Program16
achieve meaningful impacts while also helping to alleviate oversubscribed programs.
One way to do further research and test different approaches would be a federally funded competitive grant program with an explicit evaluation and capacity-building component, as was suggested by Ross and Kazis.27 For practitioners, a greater understanding of what teens learn in the short term over the summer through their participation in the SYEP can help establish best practices and improve efficiency
throughout the program. For policymakers, being able to articulate which short-term program outcomes translate into better long-term outcomes may lead to a more effective intervention and serve as the basis for pay-for-performance contracting as is currently being explored in Boston. The findings from this report, as well as the ongoing multiyear Boston SYEP evaluation, can help guide program development aimed at employing youth in cities across the nation.
17How can summer jobs reduce crime among youth?
1. This publication provides a condensed version of the findings. For a fuller discussion of methods and results, please see Alicia Sasser Modestino, “How Do Summer Youth Employment Programs Improve Criminal Justice Outcomes, and for Whom?” (Boston: Federal Reserve Bank of Boston, 2017).
2. Paul Harrington and others, “Signaling Success: Boosting Teen Employment Prospects” (Boston: Commonwealth Corporation, 2013).
3. Julia Dennet and Alicia S. Modestino, “Uncertain Futures? Youth Attachment to the Labor Market in the United States and New England” (Boston: New England Public Policy Center, 2013); Alicia S. Modestino, Daniel Shoag, and Joshua Ballance, “Upskilling: Do Employers Demand Greater Skill When Workers Are Plentiful?” Working Paper 14-17 (Federal Reserve Bank of Boston, 2014).
4. Sara B. Heller, “Summer Jobs Reduce Violence among Disadvantaged Youth,” Science 346 (6214) (2014): 1219–1223; Office of Juvenile Justice and Delinquency Prevention. OJJDP Statistical Briefing Book, 2014. (U.S. Department of Justice, 2014). Retrieved from www.ojjdp.gov/ojstatbb/crime/JAR_Display.asp?ID=qa05261.
5. William J. Wilson, When Work Disappears: The World of the Urban Poor (New York: Alfred Knopf, 1996); Raj Chetty, Nathaniel Hendren, and Lawrence F. Katz, “The Effects of Exposure to Better Neighborhoods on Children: New Evidence from the Moving to Opportunity Experiment,” American Economic Review 106 (4) (2016): 855–902.
6. Philip J. Cook and Jens Ludwig, “Economical Crime Control.” In Philip J. Cook, Jens Ludwig, and Justin McCrary, ed., Controlling Crime: Strategies and Tradeoffs (Chicago: University of Chicago Press, 2011).
7. Sara B. Heller, “Summer Jobs Reduce Violence among Disadvantaged Youth,” Supplementary Material.
8. Megan Millenky and others, “Staying on Course: Three-Year Results of the National Guard Youth ChalleNGe Evaluation” (New York: Manpower Demonstration Research Corporation, 2011).
9. Peter Z. Schochet, John Burghardt, and Sheena McConnell, “Does Job Corps Work? Impact Findings from the National Job Corps Study,” American Economic Review 98 (5) (2008): 1864-1886; George Cave and others, “JOBSTART: Final Report on a Program for School Dropouts” (New York: Manpower Demonstration Research Corporation, 1993).
10. Howard S. Bloom and others, “The Benefits and Costs of JTPA Title II-A Programs: Key Findings from the National Job Training Partnership Act Study,” Journal of Human Resources 32 (3) (1997): 549-576.
11. The evidence regarding the impacts of early work experience on academic performance during the school year is mixed. It has been shown that when students work too many hours, this ultimately decreases high school graduation and college attendance rates and inhibits later economic success; see Jeylan T. Mortimer, “The Benefits and Risks of Adolescent Employment,” Prevention Researcher 17 (2) (2010): 8–11; Matthew A. Painter, “Get a Job and Keep It! High School Employment and Adult Wealth Accumulation,” Research in Social Stratification and Mobility 28 (2010): 233–249; Cathleen Stasz and Dominic J. Brewer, “Academic Skills at Work: Two Perspectives” (Berkeley: National Center for Research in Vocational Education, 1998). Indeed, the association between hours of work and performance in school appears to follow an inverted-U pattern, with students who work
Endnotes
Brookings Metropolitan Policy Program18
moderate hours performing at a higher level than students who work more or not at all. See David Stern and Derek Briggs, “Does Paid Employment Help or Hinder Performance in Secondary School? Insights from US High School Students,” Journal of Education and Work 14 (3) (2001): 355-372).
12. Heller, “Summer Jobs Reduce Violence among Disadvantaged Youth.”
13. Alexander Gelber, Adam Isen, and Judd B. Kessler, “The Effects of Youth Employment: Evidence from New York City Summer Youth Employment Program Lotteries.” Working Paper 20810 (National Bureau of Economic Research, 2014).
14. Amy E. Schwartz, Jacob Leos-Urbel, and Matthew Wiswall, “Making Summer Matter: The Impact of Youth Employment on Academic Performance.” Working Paper 21470 (National Bureau of Economic Research, 2015).
15. Jacob Leos-Urbel, “What Is a Summer Job Worth? The Impact of Summer Youth Employment on Academic Outcomes,” Journal of Policy Analysis and Management 33 (4) (2014): 891–911.
16. Gelber, Isen, and Kessler, “The Effects of Youth Employment”; Heller, “Summer Jobs Reduce Violence among Disadvantaged Youth.”
17. Gelber, Isen, and Kessler, “The Effects of Youth Employment”; Jonathan M.V. Davis and Sara Heller, “Rethinking the Benefits of Youth Employment Programs: The Heterogeneous Effects of Summer Jobs.” Working Paper 23443 (National Bureau of Economic Research, 2017).
18. Davis and Heller, “Rethinking the Benefits of Youth Employment Programs.”
19. To separate crimes by type, I categorized charges associated with each arrest based on the offense code. Violent crimes include all crimes against a person: assault, homicide, sexual offenses, robbery, threats, kidnapping,
and aggravated arson (arson when someone is known to be home). Property crime includes larceny, burglary, nonaggravated arson, and motor vehicle theft. Drug crimes include both possession and dealing. Gun crimes include possession of a firearm, firearm violations, possession of ammunition, and carrying without a license. Other crimes include other offenses such as possession of alcohol by a minor, operating under the influence, trespassing, disturbing the peace, cruelty to animals, and parole violations. Note that status offenses (or “child in need of assistance”) as well as revocations (e.g., rules violations) were not included. I then counted the number of pre- and post-program incidents of each type, defining “post” as after the date of notification of the lottery at the end of June.
20. For a more detailed account of survey results, please see Alicia S. Modestino and Trinh Nguyen, “The Potential for Summer Youth Employment Programs to Reduce Inequality: What Do We Know?” (Boston: Federal Reserve Bank of Boston, 2016).
21. Boston Youth Violence Prevention Collaborative. “Career Pathways Framework: An Approach to Addressing Youth Violence” (Funder Learning Collaborative, 2013, December). Retrieved from https://drive.google.com/file/d/0B7bbSb4eFPQoZVF0UVpyQ0FHOW9aRjZydmFzM0NqazlNYTlV/view.
22. Heller, “Summer Jobs Reduce Violence among Disadvantaged Youth.”
23. Mark W. Lipsey and James H. Derzon, “Predictors of Violent and Serious Delinquency in Adolescence and Early Adulthood: A Synthesis of Longitudinal Research.” In Rolf Loeber and David P. Farrington, ed., Serious and Violent Juvenile Offenders: Risk Factors and Successful Interventions (Thousand Oaks: Sage Publications, 1998).
24. Alicia S. Modestino, “How Do Summer Youth Employment Programs Improve Criminal Justice Outcomes, and For Whom?” (Boston: Federal
19How can summer jobs reduce crime among youth?
Reserve Bank of Boston, 2017).
25. Philip J. Cook and others, “The (Surprising) Efficacy of Academic and Behavioral Intervention with Disadvantaged Youth: Results from a Randomized Experiment in Chicago.” Working Paper 19862 (National Bureau of Economic Research, 2014); Sara Heller and others, “Thinking, Fast and Slow? Some Field Experiments to
Reduce Crime and Dropout in Chicago,” Quarterly Journal of Economics 132 (1) (2017): 1–54.
26. Heller and others, “Thinking, Fast and Slow?”
27. Martha Ross and Richard Kazis, “Renew the Federal Commitment to High-Quality Summer Youth Employment Programs” (Washington: Brookings Institution, 2016).
Brookings Metropolitan Policy Program20
About Brookings
The Brookings Institution is a nonprofit organization devoted to independent research and policy solutions. Its mission is to conduct high-quality, independent research and, based on that research, to provide innovative, practical recommendations for policymakers and the public. The conclusions and recommendations of any Brookings publication are solely those of its author(s), and do not reflect the views of the Institution, its management, or its other scholars.
Acknowledgements
The Brookings Metropolitan Policy Program gratefully acknowledges the Annie E. Casey Foundation for its generous support of this publication. The Program is also grateful to the Metropolitan Council, a network of business, civic, and philanthropic leaders who act as financial and intellectual partners of the Metro Program.
Brookings is committed to quality, independence, and impact in all of its work. Activities supported by its donors reflect this commitment.
The author thanks the Boston Mayor’s Office of Workforce Development for collecting and sharing the data that made this evaluation possible as well as the generous financial support of the William T. Grant Foundation. The author also gratefully acknowledges Howard Bloom, Harry Holzer, and John Roman for providing valuable feedback and commentary on earlier drafts.
Image Credits
College of DuPage Newsroom (cover) via Shutterstock (CC by 2.0).
21How can summer jobs reduce crime among youth?
About the Metropolitan Policy Program at Brookings
The Metropolitan Policy Program at Brookings delivers research and solutions to help metropolitan
leaders build an advanced economy that works for all.
To learn more, visit www.brookings.edu/metro.
For more information
Alicia Sasser Modestino Associate ProfessorDepartment of Economics and School of Public Policy and Urban AffairsNortheastern University [email protected]

1775 Massachusetts Avenue, NW
Washington, D.C. 20036-2188
telephone 202.797.6139
fax 202.797.2965
website www.brookings.edu/metro