How are refugees faring on the labour market in Europe? · 2017-04-04 · How are refugees faring ....
43
How are refugees faring on the labour market in Europe? A first evaluation based on the 2014 EU Labour Force Survey ad hoc module Working Paper 1/2016 ISSN: 1977-4125
Transcript of How are refugees faring on the labour market in Europe? · 2017-04-04 · How are refugees faring ....

How are refugees faring
on the labour market in Europe?
A first evaluation based on the
2014 EU Labour Force Survey ad
hoc module
Working Paper 1/2016
W
ISSN: 1977-4125

2
TABLE OF CONTENTS
TABLE OF CONTENTS ................................................................................................................................................ 2
NOTE BY THE EUROPEAN COMMISSION AND THE OECD................................................................................. 3
DISCLAIMER ................................................................................................................................................................. 3
GLOSSARY .................................................................................................................................................................... 4
KEY FINDINGS ............................................................................................................................................................. 5
HOW ARE REFUGEES FARING ON THE LABOUR MARKET IN EUROPE? A FIRST EVALUATION BASED
ON THE 2014 EU LABOUR FORCE SURVEY AD HOC MODULE ........................................................................ 7
Data limitations and coverage ..................................................................................................................................... 7
Migrants by main reason for migration and key socio-demographic characteristics ................................................... 8
Education and knowledge of the host country language ........................................................................................... 13
Labour market outcomes of refugees in the European Union.................................................................................... 17
The special case of refugee women ........................................................................................................................... 19
A first look at the drivers of the employment of refugees ......................................................................................... 20
The determinants of refugees' employment performance .......................................................................................... 23
Characteristics of refugees’ employment .................................................................................................................. 25
Citizenship acquisition .............................................................................................................................................. 28
Conclusion ................................................................................................................................................................. 30
Annex A. First time asylum requests – evolution and size ........................................................................................ 34
Annex B. Economic activity rate of refugees in the European Union ....................................................................... 37
Annex C. Language skills and employment performance ......................................................................................... 39
Annex D. Calculating controlled employment rates from odds ................................................................................. 40
Annex E. The complete results of the regression: The ratio of odds for all variables included ................................. 42

3
NOTE BY THE EUROPEAN COMMISSION AND THE OECD
This paper is a joint effort by the OECD Secretariat and the DG Employment, Social Affairs and
Inclusion of the European Commission to make a first evaluation of the labour market outcomes of
refugees based on the 2014 EU LFS ad hoc module on migrants. It was drafted by Jean-Christophe
Dumont (OECD), Thomas Liebig (OECD), Jorg Peschner (EC), Filip Tanay (EC), Theodora Xenogiani
(OECD).
ISBN: 978-92-79-61277-0
doi: 10.2767/350756
© European Union, 2016
Reproduction is authorised provided the source is acknowledged.
DISCLAIMER
The content of this joint working paper is the opinion of the author and the opinions expressed and
arguments employed herein do not necessarily reflect the official views of OECD member countries or the
European Union.
This document and any map included herein are without prejudice to the status of or sovereignty over any
territory, to the delimitation of international frontiers and boundaries and to the name of any territory, city
or area.

4
GLOSSARY
Asylum seeker: Person seeking international protection who has applied but not yet been granted the
status of "beneficiary of international protection".
"Refugee" generally refers to a third-country national or stateless person who, owing to a well-founded
fear of being persecuted for reasons of race, religion, nationality, political opinion or membership of a
particular social group, is outside the country of nationality and is unable or, owing to such fear, is
unwilling to avail himself or herself of the protection of that country, or a stateless person, who, being
outside of the country of former habitual residence for the same reasons as mentioned above, is unable or,
owing to such fear, unwilling to return to it (Directive 2011/95/EU).
"Subsidiary protection" is given to a third-country national or a stateless person who does not qualify as
a refugee, but in respect of substantial grounds which have been shown to believe that the person
concerned, if returned to his or her country of origin or, in the case of a stateless person, to his or her
country of former habitual residence, would face a real risk of suffering serious harm and who is unable
or, owing to such risk, unwilling to avail himself or herself of the protection of that country.
Unaccompanied minor: A non-EU national or stateless person below the age of eighteen who arrives on
the territory of the EU Member States unaccompanied by an adult responsible for him/her whether by law
or custom, and for as long as s/he is not effectively taken into the care of such a person, or a minor who
has left unaccompanied after s/he has entered the territory of the EU States.
Migration: the movement of a person or a group of persons, either across an international border
(international migration), or within a State (internal migration). It is a population movement,
encompassing any kind of movement of people, whatever its length, composition and causes; it includes
migration of refugees, displaced persons, economic migrants and persons moving for other purposes,
including family reunification.
Non-EU born: People who were born outside of the EU. When analysing integration it is useful to also
consider country of birth as migrants might get naturalised over time in which case they will not be
captured by looking at citizenship but they still may experience integration difficulties even after
naturalisation.
Other non-EU born/ other migrant: For the purposes of this paper, a non-EU born person who has
immigrated to the country for reasons other than international protection.
Naturalisation: People of citizenship other than that of the country in question (host country) who obtain
nationality of that country.
Third-country national: A person not having the nationality of an EU State.
Second generation: The children of immigrants that were born in the host country.

5
KEY FINDINGS
In 2014, 1.8 million refugees resided in the 25 countries of the European Union covered by the
2014 Ad Hoc Module of the European Labour Force Survey, representing the smallest non-EU
born migrant group, just 7% of all.
The refugees are concentrated in a small number of countries. Four fifths of all refugees are
found in four EU member States (Germany, the United Kingdom, Sweden and France), with an
additional 10% living in Belgium and Austria. Even before the recent refugee surge, Germany was
the top host country with more than 660 thousand refugees and the United Kingdom ranks second
with about 300 thousand refugees. Sweden was the highest share of refugees among all categories
of migrants, followed by Croatia and Belgium.
In most countries, refugees are more likely to be men. On average, about 59% of all refugees in
the European countries included in the survey were men, compared with 58% of other non-EU
born. The share of women has been growing progressively over the different waves of arrivals in
need of international protection, but has dropped among those who arrived in the past 5 years prior
to 2014, possibly linked to a change in the mix of origin countries among more recent waves of
refugees.
One out of five refugees aged 15-64 in the European Union in 2014 had a tertiary level of
education, which is a rather high share, but still below the 27% for other non-EU born migrants.
The share of tertiary educated has slightly decreased in recent cohorts, as refugees who have
arrived in the past 10 years are less likely to be tertiary educated than those who came 10-20 years
ago, but this could be somewhat driven by the difference in age between the cohorts.
The education level of refugees varies greatly by country. Two thirds of refugees in Spain have
higher education, while the respective share is less than 15% in Germany, Italy and Croatia.
The gap between refugees and other non-EU migrants in terms of educational attainment is
particularly large for men. Refugee women who arrived in the last 15 years tend to have
significantly higher education levels than men, which is not the case for other non-EU born
immigrant groups. Among those who came to Europe between 1999 and 2014 and still resident in
Europe, one in four women is tertiary educated, which is 4 percentage points higher than the share
among their male counterparts.
Less than half (45%) of refugees in the EU reported to have at least an advanced knowledge of the
host-country language, compared with two thirds of other migrants from non-EU countries.
Knowledge of the host-country language tends to improve with longer durations in the host
country, and the share of refugees who have advanced knowledge of the host-country language is
twice as large among those who have been in the country for more than ten years compared with
more recent arrivals. The gap in the host-country language knowledge between refugees and other
migrants is significantly reduced for those who have been in the country for longer, suggesting that
refugees converge to other migrants.
Refugees represent one of the most vulnerable groups of migrants on the labour market.
Their employment rate is 56%, just 3 percentage points higher than family migrants and 9
percentage points lower than native-born persons. In addition, one in five economically active
refugees is unemployed and one in eight is unemployed for 12 months or longer and about one in

6
fourteen was unemployed for 2 years or longer, suggesting that once unemployed, refugees have
difficulties to return to employment
On average, it takes refugees up to 20 years to have a similar employment rate as the native-
born. In the first 5 years after arrival, only one in four refugees is employed, the lowest of all
migrant groups. After 10 years, their employment rate reaches 56% but it remains below the
employment rate of native-born persons in most countries. A significant part of the difference in
the employment rates between refugees and other migrants can be explained by differences in their
education level, i.e. that refugees are more often found among the low-educated whose
employment rate is far below average.
Bringing refugee women into employment is a particular challenge. The employment rate for
refugee women is on average 45%, 17 percentage points lower than that of refugee men and 6
percentage points lower than that of other non-EU born women. This result is to some extent
driven by the fact that nearly half of them have a low level of education, a substantially higher
share than that for other migrant groups. It also reflects the low activity rates of refugee women
relative to men, 57% versus 77%.
The level of knowledge of the host country language has a considerable impact on the
employment outcomes of refugees which holds across education levels. Even though
knowledge of the host country language is positively correlated with the education level of
refugees, findings nevertheless suggest that bringing refugees' host country language knowledge to
an intermediate level could be associated significant employment gains. Analysis conducted in this
paper shows that if refugees had the same command of the host-country language as natives, their
employment rates would be 10%-pts higher than their actual levels, whereas the gains would be
lower for all other migrant groups.
Refugees are much more likely to be overqualified than other migrants. In total, almost 60%
of employed tertiary-educated refugees in the EU are overqualified for the jobs they occupy, more
than twice the level of the native-born and also well above the levels for other migrant groups. The
reasons for the observed large discount of refugees’ formal qualifications relate to the fact that
most of them have foreign qualifications which employers may have difficulties in evaluating and
they also often lack documentation of their degrees.
In most EU member states, refugees, and even more so refugee women, have a higher
likelihood of taking up the host-country nationality than other migrants. In the EU, 61% of
refugees with more than ten years of residence have taken up the host-country nationality,
compared with 57% of other non-EU born migrants. One of the reasons behind this finding is that
refugees tend to benefit more from citizenship take-up than those that came for employment
reasons including in terms of employment outcomes. Among those who have been in the country
for longer than ten years, naturalised refugees have +12 percentage points higher employment rates
than migrants who came for economic reasons or as students.

7
HOW ARE REFUGEES FARING ON THE LABOUR MARKET IN EUROPE?
A FIRST EVALUATION BASED ON
THE 2014 EU LABOUR FORCE SURVEY AD HOC MODULE
In 2014, the EU Labour Force Survey (LFS) included 11 additional variables on migrants and their
descendants to supplement the information already contained in the core EU-LFS (also known as the 2014
LFS Ad Hoc Module on the Labour market situation of migrants and their immediate descendants)1. This
additional information allows notably identifying migrants by reason for migration. Although self-
declared, this information is particularly valuable because, for the first time since 2008, it enables to
analyse the characteristics and the labour market outcomes of people who have come to Europe in need of
international protection and to compare them of other migrant groups.
As Europe is facing an unprecedented wave of asylum seekers, many of whom are likely to be granted
international protection and stay, the question of the integration of refugees is gaining central stage.
Several EU Member States and other OECD countries have already taken steps to cope with this issue
while others, who are less exposed or less experienced, are still in the inception phase regarding integration
policies for refugees and other people in need of protection.
While the 2014 Ad Hoc Module does not capture the situation of the refugees who came in 2014 and 2015,
it provides important lessons from previous waves of refugees coming to the EU (i.e. those that came
before 2014). It provides a unique opportunity to shed light on how refugees are faring in Europe in the
medium- and long-term and to inform policy making in this area.
After briefly discussing the coverage and limitations of the data source, this report looks at the main socio-
demographic characteristics of refugees, their labour market outcomes and their determinants. The analysis
also pays special attention to refugee women and to long-term integration through the acquisition of
citizenship. The last section draws some key conclusions emerging from this analysis.
Data limitations and coverage
The information in the 2014 EU-LFS ad hoc module on the reason for migration refers to the self-declared
reason for coming to Europe rather than the actual legal category under which the person entered. People
who self-declared that they came to Europe to seek international protection may have obtained or not a
formal refugee status (according to the 1951 refugee Convention status or temporary/subsidiary
protection). Given that the survey anonymises data, it is reasonable to assume respondents answered
honestly what their main reason for migrating was. For the sake of simplicity, in this report, all people who
have declared migrating for “international protection purposes” are referred to as “refugees”.
Data may include some asylum seekers (i.e. persons who have not yet completed the recognition process)
but as these are more likely to be hosted in collective accommodations, which are usually not covered by
the LFS, this case should be marginal.
1 The last LFS ad hoc module on this topic was in 2008 and the next one is planned for 2021.

8
Data may also include some people who have been denied the status of refugees and may be staying in the
country irregularly. Again, the probability that these people will be captured by the survey and identify
themselves as “refugees” is limited.
It is often difficult to make clear distinction between family migrants and refugees. Family members may
have received refugee status and thus replied that they also came for reasons of international protection. On
the other hand, all people who were younger than 15 when they arrived were coded as coming for family
reasons.
The 2014 LFS ad hoc module covers 25 countries of the European Union (Ireland, Denmark and the
Netherlands did not participate), but in 11 EU countries, no refugees or only insignificant numbers were
identified (i.e. Bulgaria, the Czech Republic, Estonia, Hungary, Latvia, Lithuania, Luxembourg, Malta,
Romania, Poland and the Slovak Republic). Data on Germany, which have been collected separately,2 is
excluded from some analyses due to the lack of detailed specific information. Data for Norway and
Switzerland, which are covered by the ad hoc module, are presented separately whenever possible.
Like other labour force surveys, the sample size may limit the level of detail that can be analysed. For
reliability reasons, the publication of results is constrained to cases where the population group observed is
significantly large. This reliability threshold varies from a sample of 500 persons in Cyprus3 to 50 thousand
in Germany, France and for the EU total. The presentation of country-specific results is limited to cases
where this condition is satisfied.
In this paper, “refugees” are restricted to those who were born outside the European Union4. They are
systematically compared to “other non-EU born migrants”, that is those who declare to have come to
Europe for reasons such as employment, study or family.
Migrants by main reason for migration and key socio-demographic characteristics
Among the group of working age non-EU-born, by far the greatest number of migrants came to the EU for
family reasons5 (52% in 2014), followed by those that came for work (25%) and study (7%). Refugees
2 The authors thank Eurostat and the German Federal Statistical Office for their support.
3 Note by Turkey: The information in this document with reference to “ Cyprus “ relates to the southern part of the Island. There is
no single authority representing both Turkish and Greek Cypriot people on the Island. Turkey recognises the Turkish
Republic of Northern Cyprus (TRNC). Until a lasting and equitable solution is found within the context of United
Nations, Turkey shall preserve its position concerning the “Cyprus issue”.
2. Footnote by all the European Union Member States of the OECD and the European Union: The Republic of Cyprus is
recognised by all members of the United Nations with the exception of Turkey. The information in this document
relates to the area under the effective control of the Government of the Republic of Cyprus.”
4 In addition, the 2014 European Labour Force Survey ad hoc module identifies 128 000 persons who were born in one EU-28
country and migrated to another Member State as “refugees”.
5 Some of which are likely to have come to join a member of the family who was granted international protection status and hence
under the Geneva Convention has a right to family reunification.

9
make the smallest non-EU born migrant group (7%). The number of refugees identified in the survey
totalled 1.8 million overall.6
In 20147, Sweden had the largest share of refugees among its migrant population (26% of the total non-EU
born population in the EU) followed by Croatia (17%) and Belgium (16%) (Figure 1). In absolute
numbers, Germany ranked first with more than 660 thousand refugees or more than a third of the total
hosted within the European Union. The United Kingdom ranked second with about 300 thousand refugees
(Figure 2).
Figure 1. Non-EU born people by reason for migration in selected European countries, 15-64, 2014,
Thousands
Source: Own calculations based on EU LFS 2014 AHM. Data cover 25 countries of the European Union plus Switzerland and
Norway. Limited reliability for data on some categories in Slovenia, Finland, Croatia and Greece.
Migrants are unevenly distributed across EU-25 Member States, as only five countries (Germany, the
United Kingdom, France, Italy and Spain) host 79% of the 25 million non-EU-born people, aged 15 to 64,
who reside in the EU, compared with 63% of the native population. The concentration is even more
marked for refugees. In 2014, 80% of the 1.8 million refugees residing in the EU (and identified in the
2014 LFS module) were living in just four EU member States (Germany, the United Kingdom, Sweden
and France).8 If one adds Belgium and Austria to the list, this percentage is over 90%. Inversely, according
6 Given that no data are available for the Netherlands, Ireland and Denmark this is an underestimate of the real number.
7 As a reminder, 2014 was is just before the unprecedented refugee inflow, hence the share may have been higher in the past two
years.
8 The top countries in terms of the number of refugees they host is similar to that identified in the UNHCR population statistics for
2014 albeit in a somewhat different order (starting with highest number): France, Germany, Sweden, the United
Kingdom, Italy, Netherlands (not included in our sample), Austria and Belgium. However, these include refugees of all
ages, while our sample notes only those of working age (15-64).

10
to the 2014 LFS module, countries like Italy or Spain which have received large number of migrants
hosted only few refugees (around 23 thousand each).9
Figure 2. Refugees by main host countries in selected European countries, 15-64, 2014, thousands
Source: Calculations based on EU LFS 2014 AHM. Data cover 25 countries of the European Union plus Switzerland and Norway.
On average in the EU, refugees are older than other migrants, with about three quarters of refugees
being aged between 35 and 64, compared with 64% of other migrants (Figure 3). This mostly reflects the
fact that a larger share of refugees have been in the country for more than 15 years (Figure 4), in sharp
contrast to recent refugee flows in 2014 and 2015 (see Annex A). It also reflects the fact that the 2014 EU-
LFS ad hoc module tends to better capture people who have been in the country for a long time. This long
duration of residency is particularly apparent in Germany, where as of 2014, 41% of all refugees have been
in the country more than 20 years and a further 27% for more than 15 years – reflecting in particular the
implications of the Yugoslav Wars. By contrast, in Norway, for example, where migration is a more recent
phenomenon, refugees and migrants alike tend to be in younger age groups.
9 Caution should be exercised, nevertheless, in terms of using absolute figures from the Labour Force survey. For reasons
mentioned in the Data limitations and coverage section above, administrative data sources are better placed to estimate
absolute numbers of refugees in each country. As such, the absolute numbers noted here provide a useful snapshot of
the relative distribution among the countries included in the 2014 ad hoc module and provide a better idea of the
relative distribution across countries of the refugee population.

11
Figure 3. Working-age (15-64) refugees and other non-EU-born in the European Union, Norway and
Switzerland, 2014
European Union Norway & Switzerland
Source: Own calculations based on EU LFS 2014 AHM. Data cover 25 countries of the European Union plus Switzerland and
Norway.
Figure 4. Duration of stay of refugees and other non-EU born in the European Union, 15-64, 2014
Source: Own calculations based on EU LFS 2014 AHM. Data cover 25 countries of the European Union.
In most countries, men represent a larger share amongst refugees. On average, about 59% of all
refugees in the European countries included in the survey were men, compared with 58% of other non-EU
born (Figure 5). There are, however, large variations across European countries, as the share of men ranges
from around 30% in Portugal and Spain to about 80% in Greece and Italy.
6% 12% 18%19%
24%19%
59%50% 43%
16% 14% 20%
0%
10%
20%
30%
40%
50%
60%
70%
80%
90%
100%
Refugees other non-EU born Native born
55-64
35-54
25-34
15-24
11% 14%
48%28%
32%
50%
8% 9%
0%
10%
20%
30%
40%
50%
60%
70%
80%
90%
100%
CH-Refugees NO-Refugees
0%
5%
10%
15%
20%
25%
30%
35%
40%
0 to 4 5 to 9 10 to 14 15 to 19 20+
non-EU born Refugees

12
Figure 5. Distribution of refugees by gender in selected European countries, 15-64, 2014
Source: Own calculations based on EU LFS 2014 AHM. Data cover 25 countries of the European Union plus Switzerland and
Norway. Limited reliability of data for France, Croatia, Italy and Slovenia.
During the last decades, the different waves of arrivals in need of international protection have seen the
share of women grow progressively to almost 50%. However, the share has dropped among those who
arrived in the past 5 years (Figure 6). This evolution is not observed for other non-EU migrants where the
high share of women continued at a level beyond 50%. This could be due to changes in the composition of
refugees by country of origin. This trend is even more marked in recent waves of asylum seekers, with
almost three fourths of those who arrived in 2015 being men (Annex A).
Figure 6. Share of women among refugees and other non-EU born by years of residence
Source: Own calculations based on EU LFS 2014 AHM. Data cover 25 countries of the European Union. Limited reliability for
refugees in 0 to 4 and 5 to 9 categories.
The estimates of refugee stocks based on the 2014 Labour Force Survey ad hoc module are consistent,
although slightly lower, with the data on flows of entries for humanitarian reasons as recorded by the
OECD. Indeed, cumulated admissions of refugees in the 25 EU countries covered by the survey in the past
14 years would total 1.3 million persons (all ages). The survey identifies about 800 thousand people aged
0%
10%
20%
30%
40%
50%
60%
Refugees Other non-EU born
0 to 4 5 to 9 10 to 14 15 to 19 20+

13
15 to 64 who have been residing in those 25 EU countries for at 15 years or less.10 Taking into account the
attrition due to return migration and death, as well as the fact that refugee children below 15 years old are
not included in labour force data, the two estimates do seem consistent overall.
Education and knowledge of the host country language
Table 1 shows that in 2014, according to the LFS, one out of five refugees aged 15-64 in the European
Union had a tertiary level of education, which is a rather high share.11 Slightly less than half have at
most lower secondary education. The share of tertiary educated has slightly decreased in recent cohorts, as
refugees who have arrived in the past ten years are less likely to be tertiary educated than those who came
10-20 years ago, but this could be somewhat driven by the difference in age between the cohorts. This is in
contrast with what is observed for other non-EU born migrants. The latter have seen the share of tertiary
educated increase by more than 12 percentage points in the past ten years; reaching 34.4% among those
who have arrived in the EU during that period.12
Figure 7. Distribution of refugees and other non-EU born in selected European countries by level of
education, 15-64, 2014, Percentages
Refugees Other non-EU born
Source: Own calculations based on EU LFS 2014 AHM.
Note: Total refers to the average for the 25 countries of the European Union covered by the survey plus Switzerland and Norway.
*Limited reliability of refugee data for Spain, Slovenia, France, Italy and Croatia and of other non-EU born data for Croatia.
The share of tertiary educated varies significantly by country (Figure 7) from 66% in Spain to less than
15% in Germany, Italy and Croatia. Only in four countries for which data are available (Spain, Slovenia,
Italy and Austria) is the share of tertiary educated refugees higher than for other non-EU born. In most
cases the difference is however relatively small (around 7 percentage points), except in the United
Kingdom where it reaches 30 percentage points.
10 Over the same period, Denmark, the Netherlands and Ireland hosted about 200 thousand refugee and non-EU OECD countries
received as many as 2.7 million refugees.
11 It cannot be ruled out that over-reporting of high education may have created noise in the data to a certain extent, particularly
amongst refugees.
12 This percentage is even higher than for natives (15-64), 26% of whom are tertiary educated. Disruption of the education path of
refugees due to fleeing conflict is also likely to be a strong driving factor of these differences.

14
The gap between refugees and other non-EU migrants in terms of educational attainment is
particularly large for men. Similar to native born women, refugee women who arrived in the last 15
years tend to have significantly higher education levels than men, which is not as much the case for other
non-EU born immigrant groups. Among those who came to Europe between 1999 and 2014 and still
resident in Europe, one in four women is tertiary educated, which is 4 percentage points higher than the
share among their male counterparts.
Table 1. Distribution of refugees by education level, duration of stay and gender in the European Union, 2014
Source: Own calculations based on EU LFS 2014 AHM. Data cover 25 countries of the European Union.
Notes: high educated people are defined as those having the highest level of qualification equal or above tertiary education level
(ISCED 5–6), medium educated are defined as those who have finished upper secondary and post-secondary non-tertiary education
(ISCED 3 to 4) and low educated are defined as those who have finished up to lower secondary school level (ISCED 0-2). Limited
reliability for the highly educated refugees and for medium educated female refugees 0-14 years of residence.
Available data on the education level of asylum seekers who arrived in the EU in 2015 are limited and
show large variability by origin. Data for Germany and Sweden tend to show that about half of the Syrians
have at least upper secondary education and between a fifth and a fourth have tertiary education (Box1).
Box 1 – Information on the qualifications of asylum seekers and refugees
Qualifications of asylum seekers and refugees are rarely assessed systematically. A few countries – including
Belgium, Germany, Portugal and Spain – assess the skills and qualifications of asylum seekers (OECD 2016).
However, this is often done in surveys and a select number of asylum seekers or, where it is universal, on a voluntary
basis. Germany, for example, records during the asylum process on a voluntary basis with the help of translators the
highest level of education attended (but not necessarily completed). Almost 73% of adult asylum seekers in 2015
provided such information to the Federal Office for Migration and Refugees (see Rich 2016). Of these, 18% declared to
have attended a university, and a further 20% upper secondary education. 22% declared to have attended only
primary education, and 7% said that they never attended formal schooling. There were wide variations across origin
countries, however, with 78% of the Iranians and 54% of the Syrians declaring to have attended upper secondary
education or more. In contrast, more than 27% of the Afghans never attended a school, and a further 27% only
attended primary education.
Such self-reported data on qualifications of asylum seekers have a number of drawbacks. First, as they are
collected during the asylum process, people may respond “strategically” if they think that higher qualification will
enhance their chances of obtaining asylum. Second, even if the information is correct, this does not necessarily imply
that the qualifications are equivalent with a domestic degree – not least since there are large differences in the quality
of education systems.
In contrast to the limited information on the skills and qualifications of asylum seekers, about half of all OECD and
EU countries record the skills or qualifications of refugees (OECD 2016). Again, the information on the qualifications is
generally self-declared and provided to the authorities on a voluntary basis. According to information from Statistics
Duration of stay Education level Male Female Total Male Female Total
Low 44.9% 43.8% 44.4% 6.6 6.1 6.5
Medium 32.8% 30.0% 31.6% 0.4 -2.2 -0.7
High 22.4% 26.3% 24.0% -7.0 -3.8 -5.8
Low 36.9% 47.0% 40.9% -1.5 9.7 3.2
Medium 46.6% 35.5% 42.3% 6.6 -6.0 1.3
High 16.4% 17.5% 16.8% -5.2 -3.7 -4.5
Low 40.5% 45.5% 42.5% 3.8 7.1 5.0
Medium 40.5% 32.9% 37.4% 2.6 -3.2 0.4
High 19.1% 21.7% 20.1% -6.4 -4.0 -5.4
Total
RefugeesDifference in pps
with other non-EU born
0 to 14
15+

15
Sweden among those who were registered in 2015, coverage differs from 80% for Syrians to below 50% for Afghans.
Overall, there is a similar picture as among the asylum seekers in Germany, that is the majority of refugees from Syria
and Iran have at least upper secondary education, whereas the majority of those from Afghanistan have at most lower
secondary education. The same goes for the education level of those from Eritrea and Somalia. Regarding Iraqis,
refugees in Sweden report levels similar to those of the Syrians, whereas the average level of the asylum seekers in
Germany is significantly lower: almost 60% of Iraqis in Sweden report to have at least upper secondary in Sweden,
compared with less than 30% for Iraqi asylum seekers in Germany.
Knowledge of the host country’s language is a key factor for integration (as shown in the analysis
presented below). Although it is difficult to measure how well migrants master the host-country language,
one basic but widely-used measure is the self-reported command of their host countries’ languages. The
2014 LFS ad hoc module includes such a question. This is of course far from being an objective measure
of language skills, but it provides the point of view of the migrant on his/her language skills. In practice,
migrants who self-report to have lower language skills also score much less well on other integration
indicators, suggesting that this self-reported language knowledge provides a relatively good proxy for
migrants’ proficiency in the host-country language on average (Damas de Matos and Liebig, 2014).
In total, less than half (45%) of refugees in the EU reported to have at least an advanced knowledge of the
host-country language, compared with two thirds of other migrants from non-EU countries. One would
expect that a host country whose language is widely spoken in countries of origin will have a much greater
share of migrants who speak their language than one which does not share that advantage. However, this
seems to be less the case for refugees than for other migrant groups. While the overwhelming majority of
refugees in Spain and Portugal speak the host-country language well, this is only the case for about a third
of refugees in France and the United Kingdom, reflecting different compositions of origin countries
compared to other non-EU born people (Figure 8). Large shares of refugees who report having an
advanced knowledge of the host-country language are also found in Croatia and Slovenia, mirroring the
fact that most of these are from neighbouring countries of the former Yugoslavia.

16
Share of refugees and other non-EU born who report having at least advanced knowledge of the host-country
language, 15-64, 2014
Source: Own calculations based on EU LFS 2014 AHM. Data cover 25 countries of the European Union. Limited reliability of data for
refugees in France and Slovenia.
Knowledge of the host-country language tends to improve with longer durations in the host country, and
the share of refugees who have advanced knowledge of the host-country language is twice as large among
those who have been in the country for more than ten years compared with more recent arrivals (Table 2).
At more than 40 percent, the difference is particularly stark in Germany and Austria, although it is also
large in a number of other countries such as France, Italy, Norway and Sweden.
An important observation from Table 2 is that the gap in the share of those with advanced host-country
language knowledge between refugees and other migrants is significantly reduced for those who have been
in the country for longer. That is, although refugees start from a lower level, there seems to be some
convergence.13
13 Note, however, that these are not longitudinal data – that is, following the same migrants over time – but cross-sectional data
looking at migrants with different durations of residence at a given time. This means that there may be so-called cohort
effects, for example that refugees who have arrived many years ago may come from different countries and have
different characteristics. In particular, many refugees with more than ten years of residence in countries like Austria,
Germany and Switzerland have come from the successor countries of the former Yugoslavia.

17
Share of refugees and other non-EU born who have at least advanced host-country language knowledge, by
duration of stay, 2014
up to ten years more than ten years
Refugees Other Refugees Other
Spain 98 76 97 79
Italy 39 46 73 70
Belgium 33 45 57 70
United
Kingdom
29 66 42 78
Sweden 29 37 57 83
EU total (25) 24 54 49 69
Austria 15 40 54 61
France 14 46 45 71
Finland 9 26 30 70
Germany 9 29 50 64
Switzerland 61 30 66 58
Norway 22 30 53 61
Source: Own calculations based on EU LFS 2014 AHM. Data cover 25 countries of the European Union
Labour market outcomes of refugees in the European Union
The non-EU born in the EU have on average weaker labour market outcomes than the native born
population both in terms of their employment levels and their transitions from unemployment back to jobs
(European Commission, 2016a). Refugees represent one of the most vulnerable groups of migrants on the
labour market. Refugees have on average lower employment rates than other migrant groups except family
migrants. On average, in the European Union in 2014, only 56% of refugees are employed, and refugees’
unemployment rate reaches 19% (Figure 9). Activity rates of refugees are relatively high, but this partly
reflects the gender composition with an overrepresentation of men (see Annex B for a more detailed
discussion on participation).
Figure 9. Labour market outcomes of refugees and other non-EU born in the European Union, 15-64, 2014
Source: Own calculations based on EU LFS 2014 AHM. Data cover 25 countries of the European Union.

18
The employment rate of refugees varies widely across Member States. In Belgium, France, Italy,
Croatia and Slovenia, refugees fare better than other non EU-born migrants. Inversely, in Finland, the
United Kingdom, Spain and Portugal the employment rate of refugees is lower by at least 10 percentage
points (Figure 10). Only around 40% of refugees are employed in Spain and Finland compared to 66% in
Switzerland and more than 60% in Italy, Greece and Malta. Including refugees who were born in (the
current borders of) the European Union significantly increases the average employment rate of refugees,
notably for Switzerland and Slovenia where it reaches 78% and 74%, respectively.
Figure 10. Employment rate of refugees and other non-EU born in the European Union, 2014
Source: Own calculations based on EU LFS 2014 AHM. Data cover 25 countries of the European Union. *Low reliability for data on
refugees in Slovenia and Croatia.
Once unemployed, refugees have difficulties to return to employment (Figure 11). Among the
economically active refugees, one in five were unemployed in 2014 (20%), one in eight were unemployed
for 12 months or longer (12%; long-term unemployed) and about one in fourteen were unemployed for 2
years or longer (7%, very long-term unemployed). In other words, the long term unemployed made up 60%
of the unemployed refugees, more than half which were unemployed for longer than 2 years. Refugees in
2014 faced a long-term unemployment rate twice as high as that of natives (12% vs. 5%) and more than
twice the very long-term unemployment rate of natives (7% vs. 3%). They also had significantly higher
risk of long-term and very-long-term unemployment than other non-EU born persons. These findings are
also true for all third country migrants, and for those from Africa and the Middle East in particular
(European Commission, 2016a). For the latter, once they are unemployed their chances to find a job are
significantly lower compared with native born working-age population. On the other hand, when
employed, they face more than double the risk of losing their job.

19
Figure 11. Long term unemployment rates of refugees and other non-EU born by duration of stay, 15-64, 2014
Source: Own calculations based on EU LFS 2014 AHM. Data cover 25 countries of the European Union.
The unemployment rate of refugees across the EU differs significantly between Member States (for which
data is available), ranging from 15% in the United Kingdom to more than 50% in Spain. While other non-
EU born migrants also have higher unemployment rates than the native born in all of the countries
presented, in Spain, Finland and Belgium they have considerably better outcomes than the refugees in
terms of unemployment (-19, 9 and -8 percentage points, respectively).
The special case of refugee women
Bringing refugee women into employment is a particular challenge. Low education and low labour-
market participation contribute to the trend. The employment rate for refugee women is on average
45%. It is lower than for other female non-EU born and native born women and 17 percentage points lower
than that of refugee men (Figure 12). Moreover, they have the highest rate of unemployment of all groups,
21%, versus 19% for refugee men and 17% for non-refugee migrant women from outside the EU.
Figure 12. Labour market outcomes of refugees and other non-EU born by gender and level of education, 15-
64, 2014
Source: Own calculations based on EU LFS 2014 AHM. Data cover 25 countries of the European Union.
Notes: Education is defined as in Figure 7. ER stands for employment rate and UR for unemployment rate.
This result is to some extent driven by the fact that more refugee women are low-educated, relative to other
migrant groups. Nearly half of them have a low level of education, versus 40% among refugee men and
0
10
20
30
40
50
60
70
80
90
100
M F M F M F
Refugees Other non-EU born Native born
%
Employment ratelow-skilled high-skilled overall
0
5
10
15
20
25
M F M F M F
Refugees Other non-EUborn
Native born
%
Unemployment rate
0%
10%
20%
30%
40%
50%
60%
70%
80%
90%
M F M F M F
Refugees Other non-EUborn
Native born
%
Activity rate

20
37% among non-refugee women from outside the EU. Indeed, the employment rates of refugee women
vary sharply with the level of education. High-educated refugee women have an employment rate close to
69%. This is three percentage points higher than that of equivalent refugee men and five percentage points
higher than that of other highly educated foreign-born women from non-EU countries. In contrast, low
educated refugee women have by far the lowest employment rates of all other groups, with less than one in
three in employment (30%). In addition, they face the highest unemployment rate (34%).
Another factor explaining the low employment rate of refugee women compared to their male counterparts
is their relatively low activity rate. The activity rate of refugee women stood at 57% compared to 77% for
refugee men. Refugee women are also somewhat less economically active than other non-EU born migrant
women (61%) and the native born women (66%). Female labour market participation behaviour in the
country of origin may explain this finding to a certain extent.
The employment rates of refugee women, but also the gap between them and their male peers, varies
sharply across European countries with available data (Figure 13). Their employment rate is 38% in the
United Kingdom and 43% in Germany, whereas it reaches 53% in Sweden and 49% in Austria. What is
more preoccupying though in Sweden and Austria is the gender employment gap. Not only the gender
employment gap is 22 percentage points or more in these two countries, but also the employment rates of
refugee women lag significantly behind those of non-refugee migrant women from outside the EU. In
contrast, refugee women enjoy the highest employment rates in two non-EU countries, Switzerland (60%)
and Norway (57%).
Figure 13. Employment rates by gender and reason for migration, 15-64, and 2014
Source: Own calculations based on EU LFS 2014 AHM. Data cover 25 countries of the European Union.
A first look at the drivers of the employment of refugees
The evolution of the employment rate of non-EU born migrants by duration of stay and by reason for
migration sheds new light on how migrants are faring on the labour market. In the first years after arrival,
those who came for employment (with or without a job offer) have the highest employment rates of all
non-EU migrants (80%). Their employment rate stays fairly high and declines gradually over time, which

21
in part reflects that this group tends to be older.14 International students catch up rapidly and have very
high employment rates even after a long duration of stay, reflecting the high share of tertiary-educated in
that group.
Figure 14. Employment rate by reason for migration and years of residence in the European Union, 15-64,
2014
Source: Own calculations based on EU LFS 2014 AHM. Data cover 25 countries of the European Union.
Family migrants and refugees have more difficulties and seem to evolve over time in parallel. The
employment outcomes of refugees improve over time, as they integrate more into the labour market and
society, but it takes them up to 20 years to catch up with the native-born (65%).15 In the first 5 years
after arrival, only 27% of refugees are employed. After 10 years, this percentage reaches 56% but it
remains below native born averages in most countries. It is finally after 15 to 19 years that the gap closes
and that native born and migrants are at par on the labour market. If looking at the national level, refugees
catch up with the native born over time in five out of nine Member States for which data is available or of
sufficient reliability.16
A significant part of the difference in the employment rates between refugees and other migrants can be
explained by differences in their education level, i.e. that refugees are more often found among the low-
educated whose employment rate is far below average. Figure 15 (left) shows that refugees have
comparable employment rates to other non-EU born migrants at given education levels. Migrants, and
notably refugees, with higher secondary or tertiary education have however significantly lower
employment rates than native-born with a similar education level. This may be due to a number of
unobserved factors such as a low command of the host-country language, lower abilities or discrimination
(European Commission, 2016a, Bonfanti and Xenogiani, 2014).
14 Again, note, however, that these are not longitudinal data – that is, following the same migrants over time – but cross-sectional
data looking at migrants with different durations of residence at a given time. This means that there may be so-called
cohort effects.
15 See also European Commission (2016a), p. 167, for third country-migrants in general. Residence periods of more than one, five,
and ten years are distinguished. Even though migrants catch up, their labour-market dynamics (their chance to find a
job if unemployed or inactive) remains significantly below the one of native-born people in the EU even as residence
periods get longer (p. 174).
16 The identified improvement in the labour market outcomes of refugees corresponds also to studies based on administrative data
in Germany (IAB, 2015).
0%
20%
40%
60%
80%
100%
0 to 4 5 to 9 10 to 14 15 to 19 20+
Employment Study Family Refugees
22
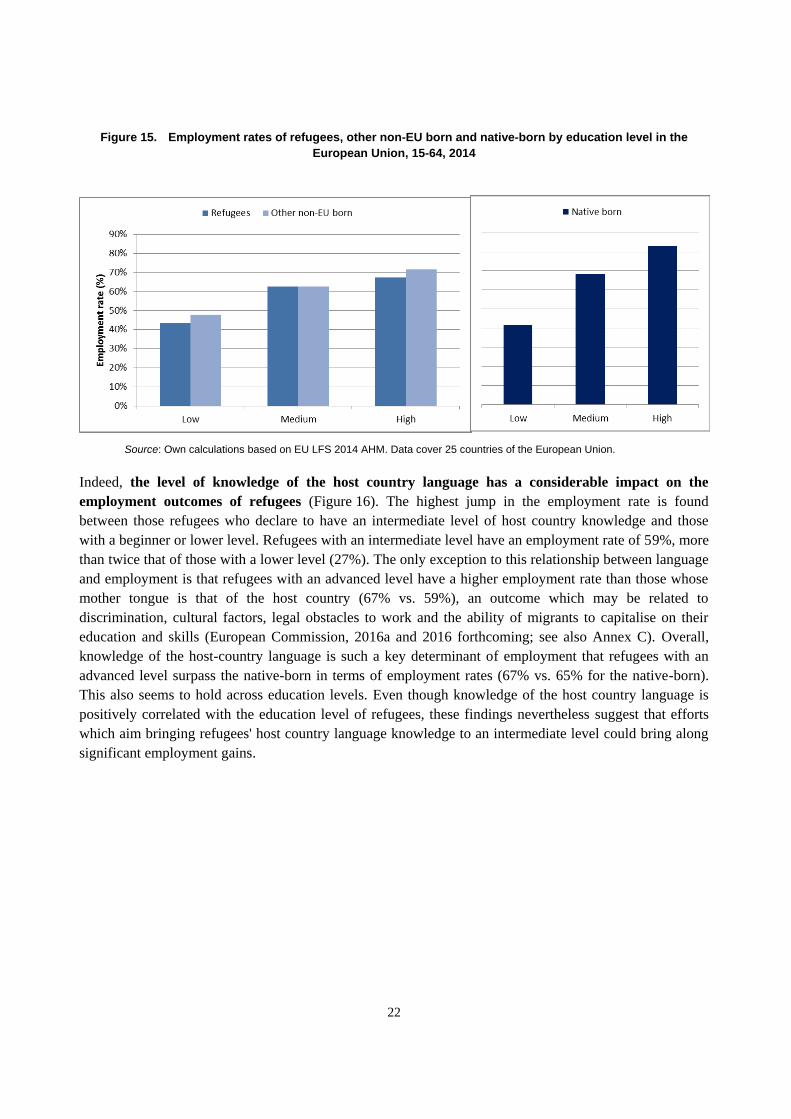
Figure 15. Employment rates of refugees, other non-EU born and native-born by education level in the
European Union, 15-64, 2014
Source: Own calculations based on EU LFS 2014 AHM. Data cover 25 countries of the European Union.
Indeed, the level of knowledge of the host country language has a considerable impact on the
employment outcomes of refugees (Figure 16). The highest jump in the employment rate is found
between those refugees who declare to have an intermediate level of host country knowledge and those
with a beginner or lower level. Refugees with an intermediate level have an employment rate of 59%, more
than twice that of those with a lower level (27%). The only exception to this relationship between language
and employment is that refugees with an advanced level have a higher employment rate than those whose
mother tongue is that of the host country (67% vs. 59%), an outcome which may be related to
discrimination, cultural factors, legal obstacles to work and the ability of migrants to capitalise on their
education and skills (European Commission, 2016a and 2016 forthcoming; see also Annex C). Overall,
knowledge of the host-country language is such a key determinant of employment that refugees with an
advanced level surpass the native-born in terms of employment rates (67% vs. 65% for the native-born).
This also seems to hold across education levels. Even though knowledge of the host country language is
positively correlated with the education level of refugees, these findings nevertheless suggest that efforts
which aim bringing refugees' host country language knowledge to an intermediate level could bring along
significant employment gains.

23
Figure 16. Employment rates of refugees by level of knowledge of the host country language in the European
Union, 15-64, 2014
Source: Own calculations based on EU LFS 2014 AHM. Data cover 25 countries of the European Union except for "Language is
mother tongue" where data from Germany was excluded due to lack of reliable data..
Labour market integration of the refugees and other non-EU born differs considerably by country of origin.
Countries of origin reflect a combination of factors such as the duration of stay in the host country for a
specific refugee wave, the language proficiency and the level of education. Due to data limitations it is
quite challenging to provide detailed evidence on this. Only 5 countries of origin have large enough groups
of refugees to be identifiable in 2014 making up 23% of all 1.8 million refugees: Bosnia Herzegovina (109
thousand), Iraq (92 thousand), Iran (81 thousand), Afghanistan (74 thousand) and Serbia (50 thousand).
The first and the last groups are long standing refugees who have been in the European Union for more
than 10 years at more than 90%. The employment rate of Bosnians is very high (70%), whereas that of
people born in Serbia is much lower (59%). Large differences also exist between Iraqis 44% of whom are
employed compared with Iranians (55%) or Afghans (57%). Better understanding the determinants of these
differences would require further data and analysis but seems key to inform policy making in the field of
the integration of refugees and their children.
The determinants of refugees' employment performance
A logistic regression enables to test the impact of individual characteristics on the employment
performance of non-EU born migrants aged between 25 and 6417 by category of entry relative to the
native-born. Figure 17 reveals that the employment performance of family migrants and refugees remains
below that of other groups even after controlling for differences in key socio-demographic characteristics18.
The further right one goes alongside the x-axis, the more control variables are included. In other words, the
analysis takes into account individual characteristics such as the gender, the age, or the education which
17 This is in order to be able to deduce meaningful conclusion on the impact of education. People may not have attained high
(tertiary) education before the age of 25 years.
18 These findings will be presented in detail in European Commission (2016, forthcoming).

24
also have an impact on employment. By controlling for their impact one assumes that migrants' gender,
age, or education would not be different from the native populations'. Hence, the effect of these personal
characteristics is being netted out, so that it will be possible to see whether there is a systematic difference
in the employment performance which would not have anything to do with people's individual socio-
demographic characteristics. Controlling for those variables adding one by one also allows estimating their
individual impact on the employment rates, separately for the different groups of migrants. The
methodology is explained in Annex D.
Figure 17. Logistic regression: Employment rates (non-EU born aged 25-64 years) by reason for migration,
estimation controlled for individual characteristics in the European Union, 26 countries, 2014
Source: Own calculations based on EU LFS 2014 AHM. Data cover 24 countries of the European Union (Germany is not included)
plus Switzerland and Norway. "Actual" refers to the observed employment rate of the different groups in the EU LFS. Annex D
explains the methodology. Annex E displays detailed results of the underlying logistic regression.
Country-effects capture the fact that migrants' distribution across host-countries is different from the host-
countries' relative size (of their native populations). Migrants, especially refugees, tend to be
overrepresented in countries where the labour market is relatively stable and unemployment is low. As of
the countries included in the analysis (which do not include Germany), almost half of the refugees are
resident in the United Kingdom and Sweden. These countries' relatively good labour market situation
improves the refugees' own labour-market performance. The country-selection effect has a strong positive
impact on migrants’ average employment rate, some 9 percentage points and 4 percentage points for
refugees and family migrants, respectively.
Sex: Amongst refugees, men are overrepresented (57:43), whereas it is the opposite for family migrants
(36:64). Bearing in mind that men's employment rate is higher, the gender differences mean a decrease in
the employment rate of family migrants and an increase in the case of refugees.
Age: Within the age group 25 to 64 years, the share of prime-agers (35-54 years) is higher amongst
refugees (61%) than amongst the native population (52%). This favourable age-composition effect
increases their employment rate by some 4 percentage points. For family migrants the effect is a bit lower.
20%
40%
60%
80%
100%
Act
ual
Coun
try
+ Se
x
+ A
ge
+ Ed
uc
+ Pa
rent
edu
c
+ La
ngua
geEmployment, job found before migrating
Employment, no job found before migrating
Family
Int. protection, Asylum
Native-born

25
Education: The share of high-educated people in the age group 25-64 years amongst refugees (26%) and
family migrants (around 29%) is comparable to the share amongst native-born people (29%). However,
their share of low-educated people is much higher (around 35% vs. 25%). This explains, as discussed
above, a part of the observed difference regarding employment. However, the negative effect on the
employment rate is moderate for both refugees and family migrants.
Parental education: In the regression, the link between the (highest) level of parental education and one's
own employment performance is strong: people whose parents are medium-educated (ISCED 2011 level 5-
8) stand the highest chance to be in employment. The general statistical chance of high-(low-) educated
parent's children to be employed is 8% (15%) lower, compared to medium educated parents (all statistical
odds are shown in detail in Annex E). Though statistically significant, these differences are modest, as
their effect on the employment rate of refugees and family migrants.
The effect of language proficiency is on the contrary quite strong. It holds even after controlling for
country-effects, sex, age, and education: the better one's self-assessed host country language command, the
brighter tend to be the employment prospects. Controlling for the language effect assumes that there was
no difference between the migrants' language command and the native populations'. As a consequence,
refugees would improve their employment rate by 10 percentage points, family migrants by 7 percentage
points.
Both age and education are important determinants of one's success on the labour market. However, in the
case of refugees (and migrants in general), at least the impact of education tends to be relatively modest.
The favourable selection of refugees in terms of their gender (more men) and age (prim age), as well as
their overrepresentation in countries with more favourable labour market condition imply that refugees
would have had lower employment rates if they had similar distribution to natives along these dimensions.
The possible lack of the specific human capital needed in the host country (e.g. language, recognised skills
and diploma) together with other factors (e.g. skills mismatch, lack of social capital, discrimination)
prevent specific migrant groups, including refugees, to realise their full potential on the labour market.19
Indeed, language is a key determinant of labour market success in the labour market and this is even more
the case for refugees. The results in this section show that if refugees had the same command of the host-
country language as natives, their employment rates would be 10%-pts higher.
Characteristics of refugees’ employment
Do refugees who find employment have, controlling for observable basic characteristics, access to
comparable jobs to other groups of migrants and the native-born? This is an important question both for the
refugees and for the host countries, in order to understand how refugees’ skills are used and compare with
other residents on the labour market.
The 2014 LFS ad hoc module shows that almost 14% of employed refugees have a temporary job. This is
similar to the average figure for the native born (13%) but with significant variation across education levels
(+5.5 percentage points more for tertiary educated refugees and 10 percentage points less for lower-skilled
19 See also European Commission (2016b), Bonfanti and Xenogiani (2014).

26
refugees). However, it is important to note that in most countries, refugees are less likely to be in
temporary employment than other migrant groups in the European Union.
Even when in employment, refugees are more likely to be in part-time employment than other migrants
(30% vs. 25%) and considerably more compared to their native born peers (30% vs. 17%). This holds even
when controlling for education, where in all of the said groups the share of those working part-time drops
as the education level rises.20
Distribution by sector shows a relatively even sectoral distribution of employed refugees (Figure 18). The
largest group is employed in the manufacturing (16%), followed by health and social work (15%);
wholesale, retail and motor repair (13%) and the accommodation and food service (13%). Many of them
also work in transportation and storage (10%), administrative and support services (8%), construction (8%)
and education, professional services and public administration (8%). This distribution is similar to that of
the native born but with relatively more refugees employed in accommodation and food service (+9
percentage points) and human health and social work (+5 percentage points). Refugees were less likely to
work in education, professional services and public administration compared with the native born (-14
percentage points).
Figure 18. Sectoral distribution of employed refugees and native born in the European Union, 15-64, 2014
Source: Own calculations based on EU LFS 2014 AHM. Data cover 25 countries of the European Union.
Overqualification is a situation where worker’s levels of formal education are higher than those actually
required by the jobs they occupy. Two alternative measures of overqualification are available from the ad
hoc module of the labour force survey and are compared below for persons with tertiary degrees. The first
is an estimate that is obtained by comparing the occupational level with the degree obtained. A tertiary-
educated person is thus considered overqualified if he or she is working in a job that is classified as low- or
medium-skilled by the International Standard Classification of Occupations. The second is self-reported,
20 Source: Own calculations based on EU LFS 2014 AHM. Data cover 25 countries of the European Union. Limited reliability of
data on highly educated refugees working part-time.

27
i.e. workers who responded positively to the question of whether they consider themselves overqualified
for the job they are currently undertaking. In all countries, and regardless of their category of entry,
migrants have much higher incidences of overqualification than their native-born peers (Table 3). This is a
situation that can represent a waste of migrants’ skills, although research suggests that a part of the
discount of migrants’ qualifications is due to lower skills in the host-country language and also at the same
qualification level.21 This holds for both self-declared and estimated overqualification.
However, refugees are much more likely to be overqualified than other migrants. In total, a full 60%
of employed tertiary-educated refugees in the EU are overqualified for the jobs they occupy, more than
twice the level of the native-born and also well above the levels for other migrant groups. The differences
compared with the native-born are particularly large in Austria, Belgium, Germany and Sweden. In
contrast, they are small in Spain and Slovenia, where many refugees speak the host-country language, as
well as in Switzerland.
The reasons for the observed large discount of refugees’ formal qualifications in most countries are
numerous and relate to the fact that most of them have obtained their degrees in education systems that are
very different from those in their host countries and which employers may have difficulties in evaluating.22
They also often lack documentation of their degrees. Table 3 also provides some evidence that refugees
may be aware of this or at least more willing to accept jobs that require lower qualification levels than
other groups: whereas other migrants and the native-born have globally higher shares of self-reported
overqualification than estimated based on their occupation, this is not the case for refugees.
21 Estimates suggest that between one-third and one-half of the observed high level of overqualification of migrants compared with
the native-born is associated with lower skills at given qualification levels (Bonfanti and Xenogiani, 2014; OECD,
2008; Dumont and Monso, 2007).
22 Indeed, overqualification among migrants is more closely related to the origin of the qualification than to the origin of the
migrant (Damas de Matos and Liebig, 2014; see also Liebig and Huddleston 2014). Bratsberg, Raaum and Røed (2016)
found that in Norway, even a lower-level host-country degree provides better returns for refugees in the labour market
than a degree from the origin country.

28
Table 3. Overqualification among refugees, other non-EU born and natives
Source: Own calculations based on EU LFS 2014 AHM. Data cover 25 countries of the European Union.
Citizenship acquisition
Having the host-country citizenship is an important step in the integration process. Naturalised migrants
often tend to have better integration outcomes than their peers who do not opt for host-country nationality,
even after controlling for observable factors such as education, country of origin, and length of stay
(OECD 2011).23
Ideally, nationality acquisition rates should be calculated as the percentage of those who are eligible for it
(OECD 2015 and European Commission 2016a). Citizenship take-up is generally not possible for recent
arrivals and subject to a minimum number of years of residence, in addition to other requirements. In
virtually all EU and OECD countries, however, the minimum residency requirement is at most ten years.
23 Nevertheless, selection may contribute to this effect to some degree as well as accession to citizenship may be conditional on
factors that reflect success or are drivers of success in integration.
Estimated Self-declared
other non-EU-born 48 other non-EU-born 34
native-born 26 native-born 10
refugees 64 refugees 54
other non-EU-born 35 other non-EU-born 30
native-born 18 native-born 9
refugees 66 refugees 48
other non-EU-born 38 other non-EU-born 29
native-born 16 native-born 10
refugees 71 refugees 54
other non-EU-born 58 other non-EU-born 69
native-born 33 native-born 57
refugees 40 refugees 57
other non-EU-born 24 other non-EU-born 35
native-born 12 native-born 19
refugees 47 refugees 49
other non-EU-born 19 other non-EU-born 18
native-born 12 native-born 16
refugees 29 refugees 29
other non-EU-born 27 other non-EU-born 30
native-born 24 native-born 23
refugees 55 refugees 36
other non-EU-born 30 other non-EU-born 36
native-born 21 native-born 23
refugees 60 refugees 57
other non-EU-born 30 other non-EU-born 28
native-born 12 native-born 15
refugees 44 refugees 36
other non-EU-born 20 other non-EU-born 28
native-born 17 native-born 18
refugees 14 refugees 29
CH
UK
EU total (25)
NO
AT
BE
ES
SE
SI
DE

29
To focus on those who are likely to be eligible in principle, Figure 19 shows the percentage of migrants
with more than ten years of residency who have taken up the nationality of the host country.
In total, in the EU 61% of refugees with more than ten years of residence have taken up the host-country
nationality, compared with 57% of other non-EU born migrants. Indeed, in most countries, refugees have
a higher likelihood of taking up the host-country nationality. The only major exception among the
main recipient countries is Germany where refugees are less likely to become naturalised than other non-
EU born.24
Figure 19. Share of nationals among non-EU born who have been in the country for more than ten years
Source: Calculations based on EU LFS 2014 AHM. Data cover 25 countries of the European Union. *Limited reliability of data for
refugees in Italy and Slovenia.
Indeed, empirical research suggests that refugees are more likely to take-up the host-country nationality
than other migrant groups with the same socio-economic characteristics (OECD 2011). There are two main
reasons for this. First, refugees – as a group that is vulnerable on the labour market – tend to benefit more
from citizenship take-up than those that came for employment reasons including in terms of employment
outcomes. Among those who have been in the country for longer than ten years, naturalised refugees have
+12 percentage points higher employment rates while migrants who came for economic reasons or as
students have +1 percentage point higher employment rates). Second, it is also conceivable that refugees
take up host-country citizenship because return migration is often not an option. Several countries
acknowledge this and provide facilitated access to citizenship for refugees.
The higher likelihood of refugees to take-up host-country citizenship is even more apparent when looking
separately at gender (Table 4). This is due to the fact that women tend to have a higher probability to be
naturalised (Liebig and Von Haaren 2011).
24 This might in part be due to the fact that many refugees from the former Yugoslavia had initially an unstable residence status
and were not eligible for naturalisation.

30
Table 4. Share of nationals among non-native born who have been in the country for at least 10 years, by
gender and category, 15-64, 2014
Source: Calculations based on EU LFS 2014 AHM. Data cover 25 countries of the European Union.
Conclusion
The 2014 Labour Force Survey ad hoc module provides a unique data source to analyse the characteristics
and labour market outcomes of refugees from previous waves, both in international comparison and also
compared with other migrant categories and the native-born. Available evidence – although subject to
some limitation- clearly confirms that refugees are one of the most vulnerable groups when it comes to
labour market integration. On average, in the European Union, the employment rate of refugees lags
behind that of labour migrants and natives by about 10 percentage points but it is comparable to that of
family migrants which make up the largest group of non-EU born in the EU.
There are, however, significant differences across countries, partly due to differences in the composition of
refugee flows and in the time different refugee waves arrived. At the same time, the integration of refugees
progresses significantly over time. That notwithstanding, it takes more than 15 to 19 years in the host
country for refugees to be at par with native-born in terms of employment rates – a finding which is
broadly consistent with what was observed in the 2008 LFS ad hoc module. Decreasing the time that it
takes for refugees to integrate into the labour market should remain a priority for policy makers, notably in
the current context of large inflows of asylum seekers. The same holds true for family migrants who
account for the bulk of migration from third countries to the EU and who have similar results as refugees
on average.
Many refugees from pre-2014 waves have qualifications and skills on which host-countries can build. On
average, one refugee out of five in the European Union is tertiary-educated. Slightly less than half have at
most lower secondary education. Despite a significant gap with tertiary-educated native-born (13
percentage points), tertiary-educated refugees have a much higher employment rate than the low-educated
(+26 percentage points). In the same vein, knowledge of the host-country language is a very strong
determinant of labour market outcomes, surpassing the difference between education levels. The highest
gain in employment (+28 percentage points) is found between those refugees who declare to have an
Refugees Other Refugees Other
Sweden 97 86 94 84
Croatia 97 100 94 99
France 87 61 73 58
Belgium 80 69 81 60
Spain 79 38 42 34
Slovenia 76 93 71 84
United Kingdom 66 63 64 65
Finland 60 70 62 64
Austria 59 47 50 45
EU total (25) 57 52 53 49
Italy 48 38 35 31
Germany 42 49 42 46
Norway 88 66 89 67
Switzerland 49 50 56 39
Women Men

31
intermediate level of host country knowledge and those with a beginner or lower level. An early
investment into the language skills of refugees may actually be one of the most cost-effective to integrate
them and enable them to fully capitalise on their formal qualification and thus contribute to society. In a
context of large inflow of refugees, most of whom are likely to stay, this critical finding should be
considered closely.
The possible lack of the specific human capital needed in the host country (e.g. language, recognised skills
and diploma) together with other factors (e.g. skills mismatch, lack of social capital, discrimination)
prevent specific migrant groups, including refugees, to realise their full potential on the labour market.25
Indeed, language is a key determinant of labour market success in the labour market and this is even more
the case for refugees.
Refugee women, although better qualified than their male counterparts among the arrivals in the last 10
years, face specific and persisting difficulties in integrating the labour market. The employment rate of low
educated refugee women is particularly low (30%) and this group therefore merits special attention.
The analysis above was wholly made possible due to the addition of several extra questions to the EU
Labour Force Survey. In doing so it highlights the importance and need to be able to distinguish between
different types of migrants in the EU in the data we gather. With more than 14 major conflicts taking place
across the world in 2015 the refugee flows are likely to continue. The recently proposed Action Plan on
Integration, Skills Agenda and revised Qualification Directive by the Commission demonstrate that the
European Union is taking significant steps to improve the integration of refugees and other migrants and
support their economic and social contribution to the EU. Collecting more, better and timelier data will
thus be of great importance to both existing integration policy efforts and those in the years to come.
25 See also European Commission (2016b), Bonfanti and Xenogiani (2014).

32
REFERENCES
Bonfanti, S. and T. Xenogiani (2014), “Migrants’ skills: Use, mismatch and labour market outcomes – A first
exploration of the International Survey of Adult Skills (PIAAC)”, in OECD and European Union, Matching
Economic Migration with Labour Market Needs, OECD Publishing, Paris,
http://dx.doi.org/10.1787/9789264216501-11-en.
Bratsberg, B.; Raaum, O. and K. Røed (2016), Flyktninger på det norske arbeidsmarkedet. Frisch Centre,
mimeographed.
Chiswick, B. and P. Miller (2015), “International Migration and the Economics of Language”, Chapter 5 in Chiswick,
B. and P. Miller (eds.), Handbook on the Economics of International Migration, Elsevier.
Damas de Matos, A. and T. Liebig (2014), “The qualifications of immigrants and their value in the labour market: A
comparison of Europe and the United States”, in OECD/EU, Matching Economic Migration with Labour
Market Needs, OECD Publishing, Paris, http://dx.doi.org/10.1787/9789264216501-9-en.
Dumont, J.-C. and O. Monso (2007), “Matching Educational Background and Employment: A Challenge for
Immigrants in Host Countries”, in OECD, International Migration Outlook 2007, OECD Publishing, Paris,
http://dx.doi.org/10.1787/migr_outlook-2007-4-en.
European Commission (2008), “The labour market situation and impact of recent third-country migrants” in
Employment in Europe 2008, 2008, Chapter 2.
European Commission (2015a), A European Agenda on Migration, Commission Communication COM(2015) 240
final, Brussels, 13.05.2015.
European Commission (2015b), ‘European Economic Forecast, Autumn 2015’, European Economy, Institutional
Paper 011, November 2015.
European Commission (2016a), "Mobility and Migration in the EU: Opportunities and Challenges" in 2015
Employment and Social Developments in Europe Review
http://ec.europa.eu/social/BlobServlet?docId=14954&langId=en
European Commission (2016b), Action Plan on the Integration of Third Country Nationals, Commission
Communication COM(2016) 377 final, Brussels, 7.6.2016.
European Commission (2016 forthcoming), "Integration of Refugees" in 2016 Employment and Social Developments
in Europe Review
IAB (2015), Qualifications and labour market integration of refugees: overview of current state of research. 10 Dec
2015
Liebig, T. and F. Von Haaren (2011), “Citizenship and the Socio-economic Integration of Immigrants and their
Children: An Overview across European Union and OECD Countries”, in OECD, Naturalisation: A Passport
33
for the Better Integration of Immigrants?, OECD Publishing, Paris, http://dx.doi.org/10.1787/9789264099104-
4-en.
Liebig, T. and T. Huddleston (2014), "Labour Market Integration of Immigrants and their Children: Developing,
Activating and Using Skills", International Migration Outlook 2014, OECD Publishing, Paris,
http://dx.doi.org/10.1787/migr_outlook-2014-5-en.
OECD (2008), Jobs for Immigrants (Vol. 2): Labour Market Integration in Belgium, France, the Netherlands and
Portugal, OECD Publishing, Paris, http://dx.doi.org/10.1787/9789264055605-en.
OECD (2011), Naturalisation: A Passport for the Better Integration of Immigrants?, OECD Publishing, Paris,
http://dx.doi.org/10.1787/9789264099104-en.
OECD (2016), Making Integration Work – Refugees and Others in Need of International Protection. OECD
Publishing, Paris.
OECD (2016), Making Integration Work: Refugees and others in need of protection. OECD Publishing, Paris.
OECD (2016 forthcoming), Making Integration Work – The Assessment and Recognition of Foreign Qualifications.
OECD Publishing, Paris.
OECD and European Commission (2015), Settling In – Indicators of immigrant integration, OECD Publishing, Paris.
Rich, A.-K. (2016). Asylerstantragsteller in Deutschland im Jahr 2015: Sozialstruktur, Qualifikationsniveau und
Berufstätigkeit. BAMF-Kurzanalyse 3/2016, German Federal Office for Migration and Refugees, Nuremberg.
UNHCR (2015), “Mid Year Trends 2015” (www.unhcr.org/56701b969.html).

34
ANNEXES
Annex A. First time asylum requests – evolution and size
The discussion on the current inflow of asylum seekers and refugees and its size requires first a note on how it is
measured and how the different groups are defined (Box 2). There are many indicators and many actors that provide
data including among others Eurostat, EASO, UNHCR and Frontex. Three main indicators have been commonly used
to try and indicate the most up to date numbers of people coming into the EU to seek asylum: (1) first time asylum
applications, (2) first instance decisions on applications and (3) national border crossings data.
Box 2. An asylum seeker is not a refugee
In public debate, the terms “asylum seeker”, “refugee” and “migrant” are often used synonymously. However, it is
important to distinguish between them. The term “migrant” is a generic term for anyone moving to another country with
the intention of staying for a certain period of time – not, in other words, tourists or business visitors. It includes both
permanent and temporary migrants with a valid residence permit or visa, asylum seekers, and undocumented migrants
who do not belong to any of the three groups.
The UN defines a long-term migrant as a person who moves to a country other than that of his or her usual
residence for a period of at least a year (12 months), so much so that the country of destination effectively becomes
his or her new country of usual residence (United Nations, 1998). The OECD defines permanent migrants as people
whose status enables them to stay in the host country under the circumstances that prevailed at the time they arrived
(Lemaître et al., 2007). In this group, four broad categories may be distinguished: long-term migrants within a free-
mobility zone, labour migrants, family migrants and refugees and others in need of protection. The term “international
protection” refers to people who have successfully applied for asylum and have been granted some sort of protection –
refugee or other status. It also includes migrants resettled through humanitarian programmes with the assistance of the
UNHCR or through private sponsorship – often the case in Australia, Canada and the United States. For the sake of
simplicity, the terms “refugee” and “person with international protection status” are used interchangeably in this report.
“Asylum seekers” are people who have formally applied for asylum, but whose claim is pending. In practice, only
a part of asylum seekers are granted refugee or some other form of humanitarian migrant status, while the rest have to
leave the country. If people remain after being denied protection they become undocumented migrants.
Source: Adapted from OECD (2016).
As an illustration of the differences in figures, in 2015 in Europe there were 1.3 million first time asylum
applications, 590 000 first instance decisions on asylum and 1 million total migrant arrivals to the EU by sea. In the
meantime, more than one million initial asylum applications were recorded in the German Easy registration system.26
This indicates potential lags and double counts that make difficult to estimate the exact numbers for 2015 still.
What is clear, however, is that the numbers are unprecedented for Europe. In the last seven years, the yearly
inflow of first-time asylum seekers almost increased ten-fold, from 153.000 in 2008 to 1.3 million in 2015
(Figure A1a). Nevertheless, for many Member States who are receiving high numbers of asylum seekers, this
26 Persons registered by Laender and therefore includes double counts.

35
situation will remind them of similarly high and sudden asylum inflows in the early 1990s (e.g. in Germany, Sweden
and Denmark) and the late 90s/early 2000s (e.g. in France, Austria and the United Kingdom) (Figure A1b).
Figure A1a. Evolution of asylum applications in the EU, 1985-2015
Source: Eurostat [migr_asyctz] and [migr_asyappctza].
Note: EU-27 asylum applicants by citizenship till 2007 (all citizenship) and first time asylum applications by third-country nationals
from 2008 onwards (only third-country nationals)
The age and gender composition of asylum seekers arriving to the EU in 2014 and 2015 was similar to that in
previous years (Figure A2). Persons seeking asylum have been almost exclusively below the age of 65 (99%), mostly
of working age (18-64: 70%) (Figure A2 and A3b). The most represented age group has been that of young working
age adults aged 18-34 (53%), followed by children below the age of 14 (19%), older working age adults (17%) and
adolescents aged 14-17 (10%).
Figure A2a First time asylum applications by third-country nationals by age, 2008-16Q2
Source: Eurostat [migr_asyappctzm].

36
Most asylum seekers in 2015 were men (73%) and this is true across all age groups except for the 65+ where
53% of this small age group are women (Figures A3a and A3b). In other age groups, men were the most represented
among asylum seekers aged 14-17 (83%) and least among children below the age of 14 (55%).
In absolute numbers (Figure A3a), more than two fifths of all arrivals seeking asylum in 2015 were young
working age men aged 18-34 (42% or 530.000) followed by men aged 35-64 and young working age women aged 18-
34 (11% and 140.000 in both cases).
Figure A3. Age and composition of asylum seekers, 2015
A3a. Age and distribution, 2015
A3b. Gender distribution (all ages) and age
distribution (both genders), 2015
Source: Eurostat [migr_asyappctzm].
The increase in asylum seekers in 2014-2015 has brought with it an increased flow of the most vulnerable group
seeking asylum, namely unaccompanied minors (Figure A4a). Unaccompanied minors are generally defined as
people under the age of 18 who arrive without parents, other adult relatives or guardians (UNHCR, 1997). As such,
this group requires additional protection and integration assistance in order for the most durable solution to be found
in the child's best interest.

37
Annex B. Economic activity rate of refugees in the European Union
Similar to the employment rate, the activity rate of refugees improves over time (Figure B1).27 However,
whereas the employment rate of the refugees did not catch up until they were resident in the host country between 15
and 19 years, their activity rate caught up to that of the native-born a few years earlier. Moreover, the activity rate gap
between refugees and the native-born is already in the first 5 years considerably lower than their employment rate gap
(-24pp vs. -33pp), and becomes even lower in the following 5 years after that (-6pp vs. -26pp). Hence, activation
appears to have been less of a problem among refugees compared to the need for improving their employment
outcomes.
Figure B1. Activity rate by reason for migration and years of residence in the European Union, 15-64, 2014
Source: Calculations based on EU LFS 2014 AHM. Data cover 25 countries of the EU.
As is the case in other segments of the population, activity rates for refugees rise with the level of their
educational attainment (Figure B2). This is the same trend that was observed regarding their employment rates.
Similarly to their employment rates, low educated refugees appear to be more active on the labour market than their
native-born peers (60% vs. 51%) but at medium and high education levels the relationship is reversed.
27 Again, note, however, that these are not longitudinal data – that is, following the same migrants over time – but cross-sectional
data looking at migrants with different durations of residence at a given time. This means that there may be so-called
cohort effects.

38
Figure B2. Activity rate by reason for migration and education levels in the European Union, 15-64, 2014
Source: Calculations based on EU LFS 2014 AHM. Data cover 25 countries of the EU.
Activity rates of refugees, similar to the pattern observed for employment rates, increase with the level of
knowledge of the host country language. Activity rates of refugees ranged from less than 50% in Cyprus to almost
90% in Spain (Figure B3). It is interesting to note that Spain, while having the lowest employment rate of refugees
(41%) had at the same time the highest activity rate of refugees (87%). Finally, in Croatia, Italy and Spain refugees
display a considerable willingness of to join the labour market with higher activity rates than even the native born.
Their activity rates are also higher than those of other migrants in most of the Member States shown.
Figure B3. Activity rates by reason for migration and by country, 15-64, and 2014
Source: Calculations based on EU LFS 2014 AHM. Data cover 25 countries of the EU. The average for native-born includes all EU-28
Member States. *Data for Croatia is of limited reliability.

39
Annex C. Language skills and employment performance
Figure 16 reveals that the employment rate of refugees will increase as their language skills improve. This holds
for people who have to learn the host-country language, especially when they start with no or only low command at
all of host-country's language. Progress seems to be negative, though, when it comes to change from 'advanced'
command to 'mother tongue'. Even though the difference is not significant, this finding appears counter-intuitive and
deserves more in-depth analysis.
It is strongly linked to the origin of a significant share of refugees. Especially those from the northern part of
Africa have French as their mother tongue. There is evidence that people arriving from this area are particularly
disadvantaged on the labour market. Indeed, no language barrier keeps them from performing more favourably on the
labour market. But they do face major obstacles both to finding a job and to keeping it. Those obstacles seem to have
little to do with their individual characteristics or skills (especially their language skills or their education). Rather
than that, non-observable external factors, including cultural barriers, and discrimination seem to play a major role.28
The table shows the result of a logistic regression with the labour status of working-age refugees (to work or not
to work) as the dependent variable. The regression bases on the 2014 AHM in those countries where data is available.
It shows the refugees odds (the chance) to be in employment, relative to the respective reference groups. Apart from
the language skills, three control variables are included: the refugees' sex, their age group, and their education level
(as reported in the survey).
Table C1. Chance to be in employment, 15-64, 2014 (logistic regression
Source: Calculations based on EU LFS 2014 AHM. Data cover 24 countries of the EU, plus Norway and Switzerland (1.3m refugees
taken into account).
28 European Commission (2016a), p. 172.
without
France
language language language language language
sex sex sex sex
age age age
education education
Beginner or less 0.23 0.22 0.21 0.27 0.24
Intermediate 0.73 0.69 0.66 0.73 0.62
Advanced 1.22 1.17 1.13 1.09 0.91
Mother tongue 1 1 1 1 1
1.Males 1.61 1.67 1.66 1.71
2.Females 1 1 1 1
15-24 0.19 0.25 0.28
25-34 0.78 0.77 0.89
35-54 1 1 1
55-64 0.61 0.60 0.55
Low 0.53 0.55
Medium 1 1
High 1.25 1.25
controll variables:

40
The finding of Figure 16 that people whose language skills are 'advanced' face higher employment odds than
those speaking 'mother tongue' re-appears in the blue bars. It holds also if one controls for sex, age, and education.
What is more, if one excludes France as a destination country, the phenomenon disappears. However, in all cases the
difference between the two groups remains insignificant. That is, the language effect plays a strong role especially
when refugees start investing into learning the host-country's language.
Annex D. Calculating controlled employment rates from odds
An ordinal logistic regression delivers the odds (or chance/risk) that a certain event happens, relative to a reference event. The
basic methodology applied for an ordinal logistic regression is detailed in the 2015 Employment and Social Developments in
Europe review (Box 1 on p. 170). One can calculate the statistical odds that a person aged between 25 and 64 years is in
employment. That person can be a migrant of a certain category: a labour migrant, a migrant who came for family reasons, a
refugee or a migrant who came to study. The analysis would then deliver the odds that a person of one of these categories is in
employment, relative to the odds that the native population is in employment. An odds ratio higher (lower) than one would imply
that the odds of that category of migrants of being employed is higher (lower) than the odds that native-born people are employed
(the latter being the reference category). Applied to the model used here, the following odds ratios are calculated (see Annex E).
Table D1: Odds of being in employment, age group 25-64 years, AHM 2014.
The categories of migrants are captured in the variable “Migreas” (reasons for having migrated). Looking only at the fist column of
odds ratios, one can see that the chance of people who came to seek International Protection / Asylum (refugees) to be employed is
only 53% the chance of native-born people to be employed. For family migrants the chance is equally as low. However, that first
column only shows pure correlations without taking into account that migrants may differ substantially from native-born people in
terms of, for example, age or education. Part of the huge difference in the odds ratios may be due to their lower education profile
or their younger age. Therefore, in search for the pure effect of ‘being a migrant’ on employment, one clears or ‘controls’ the odds
ratios for these individual characteristics.
The advantage of a regression analysis is that it allows controlling for relevant characteristics such as age, sex, education etc.
However, odds ratios as the typical outcome of such ordinal regressions are often more difficult to interpret than employment rates
(probabilities). The question is therefore: After controlling for relevant variables, how to come from odds ratios to ‘controlled’
employment rates?
From the perspective of a certain category of migrants, the odds of being employed is the probability of being employed (their
employment rate), relative to the counter-probability (of not being employed):
(1) 𝑂𝑑𝑑𝑠(𝑒𝑚𝑝𝑙𝑜𝑦𝑒𝑑) = 𝑝(𝑒𝑚𝑝𝑙𝑜𝑦𝑒𝑑)
1−𝑝(𝑒𝑚𝑝𝑙𝑜𝑦𝑒𝑑) , implying
(2) 𝑝(𝑒𝑚𝑝𝑙𝑜𝑦𝑒𝑑) = 𝑂𝑑𝑑𝑠(𝑒𝑚𝑝𝑙𝑜𝑦𝑒𝑑)
1+𝑂𝑑𝑑𝑠(𝑒𝑚𝑝𝑙𝑜𝑦𝑒𝑑) .
Using (1) one can calculate the odds of being employed ‘Odds (employed)’ for variable ‘Migreas’, see second column in
Table D2:
controlled by variable ….
Country Country Country Country Country Country
Sex Sex Sex Sex Sex Sex
Age Age Age Age Age
Educ Educ Educ Educ
ParentEduc ParentEduc ParentEduc
No control Langhost Langhost
variable ParBorn
Migreas Employment + job 1.51 1.48 1.38 1.20 1.21 1.24 1.71 2.22
Employment, no job 1.02 1.20 1.11 0.94 1.15 1.15 1.62 2.12
Family 0.53 0.46 0.49 0.43 0.47 0.47 0.62 0.76
Int. protection, Asylum 0.53 0.37 0.35 0.29 0.34 0.34 0.51 0.65
Study 1.11 0.87 0.83 0.72 0.47 0.47 0.59 0.75
Other 0.75 0.66 0.66 0.58 0.59 0.59 0.75 0.95
Native-born - Reference 1.00 1.00 1.00 1.00 1.00 1.00 1.00 1.00
Ratio of odds, relative to respective reference class (=1)

41
Table D2: Calculating Odds ratios from employment rate (uncontrolled model)
The third column divides each migrant category’s odds by the reference category’s odds (native-born: 2.4). It is identical to the
outcome of the regression shown in the first column of the Table D1 with only ‘Migreas’ as explanatory variable, i.e., the
uncontrolled regression.
It is now possible to derive the employment rate after controlling for various individual characteristics by starting from the
regression’s odds ratios and simply back-tracing this calculation. For example, for the model controlling for all eight variables
(rightmost column in Table D1):
Table D3: Calculating back employment rates from odds ratios for the controlled models
The second column in Table D3 calculates the odds by simply multiplying the given reference class’ odds (2.4) with the respective
category’s odds ratio as it came out of the regression (first column, identical to last column in Table D1). The controlled
employment rates in this specification of the model then follow from equation (2).
Employment
rate Odds Odds
p(employed) (employed) ratio
Migreas Employment + job 78% 3.6 1.51
Employment, no job 71% 2.4 1.02
Family 56% 1.3 0.53
Int. protection, Asylum 56% 1.3 0.53
Study 73% 2.7 1.11
Other 64% 1.8 0.75
Native-born - Reference 71% 2.4 1.00
Employment
Odds ratio Odds rate
(employed) p(employed)
Migreas Employment + job 2.22 5.3 84%
Employment, no job 2.12 5.1 84%
Family 0.76 1.8 65%
Int. protection, Asylum 0.65 1.6 61%
Study 0.75 1.8 64%
Other 0.95 2.3 69%
Native-born - Reference 1.00 2.4 71%

42
Annex E. The complete results of the regression: The ratio of odds for all variables included
Table E displays the results of the logistic regression. It shows the ratio of odds of being employed, relative to the
respective reference class for each variable. For the reference class, the ratio of odds is normalised to one.
Table E: Logistic regression: The odds of being employed, different model specifications
In the first model with only ‘Migreas’ as explanatory variable, an odds ratio of 0.53 for ‘Int. protection, Asylum’
implies that the statistical chance of refugees of being in employment is only 53% relative to native-born people.
Migreas Country Country Country Country Country Country Country
Migreas Migreas Migreas Migreas Migreas Migreas Migreas
Sex Sex Sex Sex Sex Sex
Age Age Age Age Age
Educ Educ Educ Educ
ParentEduc ParentEduc ParentEduc
Langhost Langhost
ParBorn
Ratio of odds, relative to the respective reference class (=1)
Migreas Employment + job 1.51 1.48 1.38 1.20 1.21 1.24 1.71 2.22
Employment, no job 1.02 1.20 1.11 0.94 1.15 1.15 1.62 2.12
Family 0.53 0.46 0.49 0.43 0.47 0.47 0.62 0.76
Int. protection, Asylum 0.53 0.37 0.35 0.29 0.34 0.34 0.51 0.65
Study 1.11 0.87 0.83 0.72 0.47 0.47 0.59 0.75
Other 0.75 0.66 0.66 0.58 0.59 0.59 0.75 0.95
Born in this country - Reference 1.00 1.00 1.00 1.00 1.00 1.00 1.00 1.00
Country AT 0.93 0.92 0.91 0.91 0.88 0.89 0.89
BE 0.72 0.72 0.71 0.71 0.71 0.72 0.72
BG 0.59 0.58 0.58 0.58 0.57 0.57 0.55
CH 1.55 1.55 1.60 1.47 1.43 1.49 1.84
CY 0.67 0.68 0.65 0.64 0.65 0.68 0.67
CZ 0.92 0.92 0.92 0.87 0.81 0.82 0.80
EE 1.04 1.04 1.08 0.93 0.89 0.96 1.01
ES 0.48 0.47 0.43 0.49 0.50 0.49 0.48
FI 0.83 0.82 0.87 0.76 0.76 0.76 0.75
FR 0.78 0.78 0.78 0.79 0.82 0.82 0.83
GR 0.35 0.35 0.32 0.34 0.34 0.34 0.34
HR 0.49 0.48 0.48 0.48 0.48 0.46 0.46
HU 0.62 0.62 0.61 0.63 0.61 0.61 0.60
IT 0.48 0.47 0.45 0.55 0.56 0.56 0.55
LT 0.83 0.84 0.83 0.72 0.71 0.71 0.71
LU 0.83 0.83 0.82 0.78 0.76 0.75 0.76
LV 0.84 0.84 0.85 0.77 0.74 0.76 0.79
MT 0.55 0.54 0.54 0.79 0.81 0.83 0.80
NO 1.17 1.17 1.21 1.15 1.16 1.17 1.56
PL 0.59 0.59 0.59 0.55 0.53 0.54 0.53
PT 0.69 0.69 0.67 0.96 0.98 0.96 0.94
RO 0.62 0.61 0.60 0.71 0.71 0.71 0.69
SE 1.57 1.56 1.61 1.51 1.49 1.50 1.51
SI 0.71 0.70 0.70 0.67 0.65 0.65 0.65
SK 0.62 0.62 0.60 0.58 0.55 0.55 0.54
UK - Reference 1.00 1.00 1.00 1.00 1.00 1.00 1.00
Sex 1.Males 1.83 1.90 2.00 2.01 2.01 2.01
2.Females 1.00 1.00 1.00 1.00 1.00 1.00
Age 25-34 0.74 0.65 0.63 0.64 0.64
55-64 0.24 0.27 0.27 0.27 0.27
35-54 - Reference 1.00 1.00 1.00 1.00 1.00
Education Low education 0.48 0.49 0.50 0.50
High education 1.95 1.91 1.91 1.91
Medium Education - Reference 1.00 1.00 1.00 1.00
Yearesid 01-05 years
(2b) 06-10 years
11-15 years
16-20 years
more than 20 years
Born in this country - Reference
Parents' Low parental education 0.85 0.85 0.85
Education High parental education 0.92 0.92 0.92
Medium parental education - Reference 1.00 1.00 1.00
Language Beginner or less 0.37 0.39
skills Intermediate 0.62 0.65
Advanced 0.83 0.87
Mother tongue 1.00 1.00
Born in this country - Reference 1.00 1.00
Parents' both other EU 0.91
place both outside EU 0.72
of birth one other EU, one reporting country 0.90
one outside EU, one reporting country 0.80
one outside EU, one other EU 0.77
unknown, but both abroad 0.56
both born in reporting country - Reference 1.00
Regression incudes the following set of variables:

KE-EW
-16-001-EN-N
[Ca
talo
gu
e n
um
ber]