How and why is land use changing within the El Raval area ...
45
Theresa Karolina Reichlin, form 5,Kensington School of Barcelona, 2008/2009 - 1 - How and why is land use changing within the El Raval area of Barcelona? Theresa Karolina Reichlin, form 5
Transcript of How and why is land use changing within the El Raval area ...

Theresa Karolina Reichlin, form 5,Kensington School of Barcelona, 2008/2009
- 1 -
How and why is
land use changing
within the El Raval
area of Barcelona?
Theresa Karolina Reichlin, form 5

Theresa Karolina Reichlin, form 5,Kensington School of Barcelona, 2008/2009
- 2 -
Introduction
The area of El Raval, a quarter of the medieval district of Barcelona is now
going through big changes, which I wish to investigate throughout my
study. Until not so long ago El Raval of Barcelona was one of the most
dangerous parts of the city and one of the most densely populated areas of
the world. Therefore levels of crime, violence and prostitution were also
very high.
In Catalan, “raval” means suburb. In the late 1400s there were new walls
built all around the city of Barcelona to enclose the Raval.
Until the 1800s el Raval was not as full of buildings and factories as it is
now. Until then there were only a couple of small market gardens that
supplied the city with food. The south was mostly inhabited by the poor
people, because they were not allowed to be in the richer area, Barri Gotic.
By 1850, as the Industrial Revolution was also affecting Barcelona, el
Raval was rapidly filling with cheap housing for the workers from the
countryside and textile mills powered by coal. These building were several
storeys high to save space, as the whole city of Barcelona was still tightly
packed within its very big walls. These buildings were high rise slums –
bad living conditions for everyone, as the toilets and water were shared in
the courtyard of each block. Illnesses were rapidly expanding and death
rates were high – mostly dieing in their late teens.
Barcelona- L`eixample, Barri Gótic and El Raval
This image shows how dense the Raval area is in comparison to the
surrounding, LEixample which was built later. It is clear from the image
that people in the medieval Barcelona had and still have way less space to
live in.
El Raval L´Eixample

Theresa Karolina Reichlin, form 5,Kensington School of Barcelona, 2008/2009
- 3 -
There still were older industries that were competing with the mill industry,
such as brick making, slaughtering and tanning leather, and there were
considered too dangerous or polluting to be placed in the Bari Gotic old
city area where the richer people lived.
The area always was and still is a home for the poor people. It got a label of
“Barrio Chino” (Chinatown) in the 1920’s by a local journalist Francesc
Madrid, who was inspired by a movie about vice in San Francisco’s
Chinatown and although el Raval has no Chinese connections, this new
name got adopted very quickly. El Raval was always the underworld centre
of Barcelona.
The ongoing urban reforms have changed a little part of the district, and
there are yet many more changes to be done. The purpose if this is to
change the area and make it a better place, as Barcelona is one of the
important cities of the world.
In the Burgess land use model we see that the city tends to grow as it ages.
Surrounding the Central Business District, where all the business centres,
offices, shopping malls and no open space, we have an inner city zone, or
the old factory zone, which contains also the oldest and highest
concentration housing – turning into slums. The inhabitants are mostly poor
social groups and first generation immigrants. That is where the Raval area
is. It used to be the suburbs with cheap housing a couple of centuries ago.
The Burgess Model 1
Some of the main changes were in 2 phases. The first one was the setting
up of the Contemporary Art Museum, the Geography University and the
El Raval
L´Eixample

Theresa Karolina Reichlin, form 5,Kensington School of Barcelona, 2008/2009
- 4 -
second phase was the building of a new 5 star hotel right in the centre of
Rambla de Raval, and the new street that goes through the centre of el
Raval. The government is also making some changes in the appearance of
el Raval in general. For example, demolishing some of the slums and
widening the streets. Most of the streets were built to be wide enough only
for a horse carriage to pass through, and as the building are 5 or 6 storeys
high, not much sunlight gets into the area, and that creates a perfect setting
for drama.
The Generalitat de Catalunya, the local Catalonian government, has learned
from the unsuccessful attempt to change the inner cities. They have seen
how Margaret Thatcher unsuccessfully tried to invest into education and
facilities with no positive response. The Barcelona government is therefore
trying the opposite - changing the area by changing the people.
The plan of the government for museums, hotels and universities is to draw
new people and new money into the Raval. In the Geography University
for example, there were no cafeterias, so about 6000 students had to go out
into the Raval and spend their money there and try and affect the local
businesses. Also the Hotel is very cheap for a five star hotel, so many
people come to the Raval and bring new money into the area.
The current situation of Raval is displayed on the cycle of poverty. Poor
employment leads to poverty, which then leads to crime, poor housing,
stress and strain. That then causes poor health leading onto inadequate
education, because ill children cannot attend school daily and also poor
employment again, because usually people do not work when they are in
poor health. And so the cycle goes on and on again.
The aim of the generalitat de Catalunya is to break that cycle. They want to
do it by bringing new money and jobs into the area.
The Poverty Cycle
In my study I wish to investigate how these changes were effective in
changing the area.

Theresa Karolina Reichlin, form 5,Kensington School of Barcelona, 2008/2009
- 5 -
Where is El Raval?
El Raval is in the region of Catalonia in Spain, which is situated in
southwest Europe. It is in the medieval area of Barcelona, the capital city of
Catalonia.

Theresa Karolina Reichlin, form 5,Kensington School of Barcelona, 2008/2009
- 6 -

Theresa Karolina Reichlin, form 5,Kensington School of Barcelona, 2008/2009
- 7 -
Aims of the Study
In this study my aim is to identify the changes in land use in the different
parts of el Raval and analyze the differences.
To get the data I need to analyze my study, I will need to collect random
samples from zones of the Raval in order for my data to be reliable and not
biased.
I divided the Raval into four representative areas, so the differences in the
social, economic and life quality are visible.
I also plan to compare present land use with historical records in, so I can
identify land use changes over a long period of time.
I also want to see if the changes have helped El Raval to change to a better
place. That is if the urban re-branding was successful so far.

Theresa Karolina Reichlin, form 5,Kensington School of Barcelona, 2008/2009
- 8 -
Methodology
The method being used to identify the changes in the environmental,
economic and social characteristics of el Raval is to take random samples
from representative areas of the zone. The other method is to carry out a
census, which takes a very long time and involves collecting all the data
about every street in the zone, but as I only have a limited amount of time
to explore the Raval and write this study I will rather take random sampling
as an option.
I identified four representative areas based on a pilot study, each differing
socially, economically and environmentally. I made sure that they were
more or less the same size and that they were randomly chosen to avoid
bias. They were the North East, North West, South East and South West.

Theresa Karolina Reichlin, form 5,Kensington School of Barcelona, 2008/2009
- 9 -
The representative areas of el Raval
The Northwest zone has traditionally been more residential then industrial,
but census data reveals that the levels of deprivation are the lowest in the
district.
The Northeast zone was the location most favoured by convents and
monasteries during the medieval times. It had been the location in which
recent redevelopment has taken place in order to renew the culture. A
cultural axis has been built connecting the area with the Opera House
located on the Rambla.
South west zone: has the majority of the steam powered factories located
during the 19th
century, when the Industrial Revolution was taking place. It
still has a bit of the industrial atmosphere today.
The South east zone reveals urban decay at its worst in many streets. It was
traditionally the red light district and the centre of the underworld.

Theresa Karolina Reichlin, form 5,Kensington School of Barcelona, 2008/2009
- 10 -
But the problem is that the representative areas are still very big to collect
data and we have a limited amount of time. And the areas need to be more
stratified, so what I did is found a random sampling zone within each of
those areas. To avoid any possible bias I put a numbered grid over each of
the maps. The image below is the map of the northeast part of El Raval
with a numbered grid.
The Grid overlaying map
I need to use random numbering in order to avoid bias. I get those either by
using the random number button on my calculator (Ran#) or by using a
random number generator. An example of a Random Number table is
shown below.

Theresa Karolina Reichlin, form 5,Kensington School of Barcelona, 2008/2009
- 11 -
Then what I do is correlate these numbers with the grid overlay over the
map and select my sampling zones. It is very important that the sampling
zones are approximately the same size so our results are valid.
The map below shows my sampling zones.
Sampling Zones
What I plan to complete is the land use map and also an environmental and
perception survey and a residential decay survey, which had all been
prepared earlier. Before completing the papers though, I walked through all
the streets and made myself familiar with them, because if I did not know
the zone at all, I would have made very unreliable results show in the first
part of the survey due to over estimating the bad qualities of the areas.
Then finally I completed the worksheets and checked if my readings were
accurate.

Theresa Karolina Reichlin, form 5,Kensington School of Barcelona, 2008/2009
- 12 -
Index of Residential quality
In the residential decay survey I am going to categorize six qualities
into 6 features.
Much Some Little None
Deterioration of walls 0 1 3 5
Part peeling 0 1 2 3
Broken glass in windows 0 1 3 7
Structural damage e.g. settling cracks 0 3 6 11
Rotting timber 0 2 4 8
Broken gutters, etc. 0 1 3 7
Score Physical condition of buildings
33 - 41 Good/excellent
23 -32 Satisfactory
14 - 22 Generally unsatisfactory. May be bad in specific
parts
5 -13 Action needed in very near future to improve
structure
Below
5 Need to demolish or rebuild
FINAL
TOTAL
The total score will be calculated by subtracting the negative score from the
positive score. The higher the total score, the better quality of the area.
Then I can compare the total scores of each sampling zones with each
other, and that way conclude which area has the best qualities.
There are different score numbers available in the question paper relating to
the quality, and if the score is highest for that one feature, then there is
none of it. For example, if I chose the highest score for part peeling, I am
showing clearly that there is none of it on the buildings I am walking by.
And if my score is lowest, it means that there is much of it there. In all
cases that lowest score is zero, whereas it differs as the quality of the
building increases and that shows the change of land use to the better. The
score increases as the land use changes throughout the whole area over
time.

Theresa Karolina Reichlin, form 5,Kensington School of Barcelona, 2008/2009
- 13 -
Environmental survey
The copy of the worksheet is shown below
Location:
Method: Record data for a 100 metre section BOTH sides of the street at the sampling location. As this is a subjective survey it should always be completed by the same person.
Feature Score Feature Score
Landscape quality
Trees and well-kept grassed spaces.
8
Few trees and/or unkept grassed spaces
4
No trees or grassed spaces. 0
Noise
Normal residential standard - quiet
5
Above residential standard - with some noise 2
Main street standard - very noisy 0
Derelict (waste) land
None 10
Small area 4
Large area 0
Air pollution
No offensive smells or obvious air pollution
10
Offensive smells and/or obvious air poIlution
0
Litter/vandalism
No litter, no vandalism 8
Some litter or vandalism 4
Very untidy, much vandalism
0
Access to Recreational Amenities
Nearby Park visible 4
Some street seating, but no visible Park
2
No street seating or visible Parks 0
Industrial work shop premises
All residential properties 10
Some work shops 5
Mainly industrial work shops
0
Traffic flow
Normal residential traffic 6
Above normal residential traffic
3
Heavy vehicles and through traffic
0

Theresa Karolina Reichlin, form 5,Kensington School of Barcelona, 2008/2009
- 14 -
As we go through our sampling zone we mark each feature as needed and
then we add up the score. The higher to amount of total points, the better
the environmental quality of the area, and the lower the amounts of total
points, the lower the quality of the area. The quality of the area is related to
how the land use changes over time. If the quality is better then in some
other areas, the land use there has changed.
This image shows one of my classmates at work. She was ticking the worksheet about the environmental quality. She has a whole lot of sheets to fill out, from which we will later extract data.

Theresa Karolina Reichlin, form 5,Kensington School of Barcelona, 2008/2009
- 15 -
Perception Survey
This section is based on my personal perceptions and opinions about the
safety of the sampling zones. The zones are judged by looking at both
positive and negative aspects of the area and it is better if its done by only
one person to have only one point of view so the results are not affected.
The copy of the worksheet I was given is shown below.
Location: Method: Record data for a 100 metre section BOTH sides of the street at the sampling location.
POSITIVE QUALITIES
VERY STRONGLY
FELT
STRONGLY FELT
FELT NOT FELT
SCORE 3 2 1 0
Rich
Safe
Friendly/relaxed
Improving
Community atmosphere
Attractive area
TOTAL POSITIVE SCORES:
NEGATIVE QUALITIES
Poor
Dangerous
Declining
Risk of crime
Unattractive area
Vandalised
TOTAL NEGATIVE SCORES:
OVERALL SCORE:________________ (Positive/Negative)
The total score will be calculated by subtracting the score of the negative
qualities from the score of the positive qualities. The higher the total score
the better are my opinions and perceptions of the area. When I have the

Theresa Karolina Reichlin, form 5,Kensington School of Barcelona, 2008/2009
- 16 -
scores from all four sampling zones, I can compare them and see which
zone appears to be the safest and it also gives an idea about the economic
state of the representative areas. We can also detect the land use changes
within el Raval by looking at graphs we made with the collected data.

Theresa Karolina Reichlin, form 5,Kensington School of Barcelona, 2008/2009
- 17 -
Index of Services and Amenities This section shows us the amount and the quality of the service branches in
El Raval. In my table they are divided into the type of service (bars and
restaurants, banks, personal services, etc) and the quality. That is given by
a number from 1 to 3. If the number is 1, then the service is there only for
the locals and its not expensive and tourists would rather avoid them. If its
marked with a 2, it tells us that the service is for both locals and tourists,
and 3 is only for tourists, as locals would not be able to afford that. The
more 3 shops are in the zone, the more gentrified the area is. We can see
that the land use has changed by that.
A copy of the work sheet is shown below.
Weighting
1: Services used by traditional resident
2: Services used by tourists and traditional residents
3: Services most used by tourists or luxury items
Service Weighting (w) Number seen
(n) w x n
Closed Premises n/a n/a
1
2 Bars and restaurants
3
1
2 Food and drink (shops)
3
1
2 Banks
3
1
2 Offices and professional services
3
1 Services to the home e.g. Hairdresser, Dry Cleaner 2

Theresa Karolina Reichlin, form 5,Kensington School of Barcelona, 2008/2009
- 18 -
3
1
2 Services of poverty e.g. Electrical Repair
3
1
2 Clothing and shoes
3
1
2 Bookshops and Art Galleries
3
SUBTOTAL
OTHERS: please specify
Service Weighting (w) Number seen
(n) w x n
1
2
3
1
2
3
1
2
3
SUBTOTAL (from previous page)
TOTAL

Theresa Karolina Reichlin, form 5,Kensington School of Barcelona, 2008/2009
- 19 -
Price of a certain product across El Raval.
Unlike other surveys, this one is not based going through the sampling
zones, but through el Raval as a whole. We chose a transect line that is on
an environmental gradient. To avoid bias, we chose to ask for the same
product in all shops. In this study I will be asking for the price of a bottle of
coca cola. The transect line is chosen to go from the Contemporary Art
Museum and the Rambla de Raval. Both of these points are in different
zones, so both will have differing social, economic and environmental
qualities. The transect line is shown below.
Transect line through the Raval
As we move further away from the CAM, we would expect that the price of
the item (coca-cola) will decrease, because we move further away from the
gentrified zone where people with more money are. From the results we
could predict the economic changes. This is called hypothesis testing.

Theresa Karolina Reichlin, form 5,Kensington School of Barcelona, 2008/2009
- 20 -
Problems associated with data collection
Common Sampling Problems
Sampling Sections or Quadrats
Problem 1: The size of the representative area is too large. we only have a limited amount of time and it
is impossible to walk through and pick data from
the whole of el Raval. We need smaller sampling
zones.
Problem 2: As the layout of the Raval is differing
in every street, it is hard to make equally sized sampling zones, usually sized 100 by 100 metres.
We have to arrange the shape of the sampling
zones.
Problem 3. We will not identify the environmental
gradients nor transition zones across an area using
quadrats. A transect line is better for this purpose.
Problem 4. It will take a long time to measure
everything within a sample zone, so what we do is
select a 100 metre street section, if it is necessary.
Factors affecting Sampling Reliability
Factor How reliability is affected
Time of Day Many shops and other services are closed between 1.30pm and 5pm. Gentrified
restaurants and cafes open often only at nighttime, from 8pm to 2am and may be shut
during normal working hours, when we are doing the study. Therefore we do not get
to see the real life in the Raval.
Conducting a street questionnaire during a weekday morning is biased against
working people and biased towards the retired and elderly.
Perception surveys often have their most negative results when the researcher is tired or hungry.
Weather and time
of year
The results are also affected by the mood of the person that is actually taking the
samples. If the weather makes the person feel negatively, the perceptions are affected
and opinions on safety are lowered as well.
Shock of the
unexpected
If you have never been in the Raval, it might be a shock for you and you will end up
giving worse results to the zones because of the expectation you have ha before. The
solution for that is to walk the zones beforehand.
Keeping
consistency in the
same level
Its important for the results to be taken by one person, so the results wouldn’t be
biased. If more people work out one sheet, different tastes are visible on the results.
Access difficulties Some areas may be dangerous, closed off or inaccessible for other reasons. Avoiding
these zones will affect the reliability of your results.

Theresa Karolina Reichlin, form 5,Kensington School of Barcelona, 2008/2009
- 21 -
Data Presentation
In my study I will use different types of graphs to show my data, because it
might make the comparing of data easier.
The Bar charts are good for showing how the data changes as we go from
one zone to the next.
Graph 1
Residential Quality
47,5
32
16,6
30
0
5
10
15
20
25
30
35
40
45
50
resid
en
tial
qu
ali
ty i
nd
ex
Residential Quality
Residential
Quality
47,5 32 16,6 30
Zone 1 Zone 2 Zone 3 Zone 4

Theresa Karolina Reichlin, form 5,Kensington School of Barcelona, 2008/2009
- 22 -
Graph2
Environmental Quality
75,5
50
4045
0
20
40
60
80
en
vir
on
me
nta
l q
ua
lity
in
de
x
Environmental Quality
Environmenta
l Quality
75,5 50 40 45
Zone 1 Zone 2 Zone 3 Zone 4
Graph 3
Perceptions
4 6
-31,5
-15
-40
-30
-20
-10
0
10
zones
pe
rce
pti
on
s i
nd
ex
Perceptions
Perceptions 4 6 -31,5 -15
1 2 3 4

Theresa Karolina Reichlin, form 5,Kensington School of Barcelona, 2008/2009
- 23 -
Graph4
Total Services
35
31,5
38
24,5
0
5
10
15
20
25
30
35
40
Zone
nu
mb
er
of
tota
l serv
ices
Total Services
Total Services 35 31,5 38 24,5
1 2 3 4
Graph 5
% Gentrification
70%
46%
10,50%18%
0%
20%
40%
60%
80%
Zones
% Gentrification
% Gentrification 70% 46% 10,50% 18%
1 2 3 4

Theresa Karolina Reichlin, form 5,Kensington School of Barcelona, 2008/2009
- 24 -
Graph 6
Total 2s and 3s
0
5
10
15
20
25
30to
tal
nu
mb
er
of
sh
op
s w
ith
ra
tin
g 2
or
3
Total 2s and 3s
Total 2s and
3s
24,5 14,5 4 4,5
Zone 1 Zone 2 Zone 3 Zone 4

Theresa Karolina Reichlin, form 5,Kensington School of Barcelona, 2008/2009
- 25 -
Radar Graphs are useful for showing a range of all different data values for
different features (e.g. perceptions: rich, poor, dangerous, safe, etc) all on
one diagram. The shapes of the diagrams for each different zone can be
compared and the differences identified and explained.
Graph 7
Positive Perceptions for Zones 1, 2, 3,4
0
1
2
3rich
friendly
improvingcomunity atmosphere
attractive area zone 1
zone 2
zone 3
zone 4
Graph 8
Negative perceptions for Zones 1, 2, 3, 4
0
1
2
3poor
dangerous
declining
risk of crime
unattractive area
vandalised
Zone 1
Zone 2
Zone 3
Zone 4

Theresa Karolina Reichlin, form 5,Kensington School of Barcelona, 2008/2009
- 26 -
Pie charts show the proportions of multiple classes of data, and easiest to
undertand because they are visuably simpler than other graphs.
Graph 9
Total Services
Zone 1
27%
Zone 2
24%
Zone 3
30%
Zone 4
19%
Zone 1
Zone 2
Zone 3
Zone 4
Graph 10
% Gentrification
Zone 1
49%
Zone 2
32%
Zone 3
7%
Zone 4
12%
Zone 1
Zone 2
Zone 3
Zone 4

Theresa Karolina Reichlin, form 5,Kensington School of Barcelona, 2008/2009
- 27 -
Graph 11
Total number of services for locals and tourists (rating 2 and 3)
(Gentrified services)
Zone 1
52%
Zone 2
31%
Zone 3
8%
Zone 4
9%
Zone 1
Zone 2
Zone 3
Zone 4
Graph12
Sevices in Zone 3
92%
5% 3%
Local services only Local and Tourist services Tourist services only

Theresa Karolina Reichlin, form 5,Kensington School of Barcelona, 2008/2009
- 28 -
Graph 13
The total number of services in Zone 1
Locals only
30%
Locals and
Tourists
70%
Locals only
Locals and Tourists
Graph 14
Total Number of services in Zone 2
Local services only
54%
Local and Tourist
services
46%Local services only
Local and Tourist services

Theresa Karolina Reichlin, form 5,Kensington School of Barcelona, 2008/2009
- 29 -
Graph 15
Total number of services in Zone 4
82%
18%
Local services only Local and Tourist services

Theresa Karolina Reichlin, form 5,Kensington School of Barcelona, 2008/2009
- 30 -
Analysis
Now I am going to analyse the social, environmental, economical and land
use changes. All my data is set up into a table shown below.
Zone 1 Zone 2 Zone 3 Zone 4
Residential Quality 47,5 32 16,6 30
Environmental
Quality 75,5 50 40 45
Perceptions 4 6 -31,5 -15
Total Services 35 31,5 38 24,5
Total 2s and 3s 24,5 14,5 4 4,5
% Gentrification 70% 46% 10,50% 18%
A price of a convenience item – 0,5 litre Coca- Cola
Prices Zone 1 Zone 2 Zone 4
.45,.80,.50,.60,.50 1.10,.90,.50,.60,.48,.90 .56,.60,.50
Zone 3 was not the ideal place to ask for prices because it was too
dangerous. So we only collected coke prices from zones 1, 2 and 4.
Photographs
This is the new Barceló Raval hotel, just in
the middle of the Raval, right by Zone 3.

Theresa Karolina Reichlin, form 5,Kensington School of Barcelona, 2008/2009
- 31 -
An old and now unused factory, built during
the Industrial revolution.
The state of most of the walls in
zone 3 and 4.
The expensive Air shop located in Zone 1 is a sign of gentrification going
on. It is there for the tourists and wealthier locals, because the average
residents will obviously not go shopping for “air.”

Theresa Karolina Reichlin, form 5,Kensington School of Barcelona, 2008/2009
- 32 -
Simply start gentrifying
an area by adding a new verb to the language. (To Ravalejar, simply visit
and take in the atmosphere of the Raval and have fun in the wide range of
bars and clubs.http://geographyfieldwork.com/UrbanRebranding.htm)
An old chimney from a
factory in Zone 4 that
was taken down
because its not needed
anymore.
The Contemporary Art
Museum. Opened to
public in 1995. Zone one
has changed alot since
then.

Theresa Karolina Reichlin, form 5,Kensington School of Barcelona, 2008/2009
- 33 -
The Mann-Whitney U Test
The meaning of this test is to give us an idea how reliable the results we
collected are. We need the Mann-Whitney U test because obviously
sampling is not a very accurate method of collecting data, because its only
collected in one go and no further updates are made. It is quite different
from census data, because the census is collected over a long time and so
the data that occured by chance could be eliminated, whereas in sampled
data that is not possible.
We did the test on the range of prices of a certain product that are supposed
to vary within the Raval.
The hypothesis is that prices would normally be more expensive in Zone 1
because tourists go there and I expect that they could be able to afford a
coca cola that is as expensive as in the rest of touristic Barcelona. But on
the otherhand, I would also think that prices could be lower in Zone 1 than
in Zone 2, because as there is a university and an Art Museum the shops
would be competing for customers that go out for lunch into the area.
Prices Zone 1 Zone 2
.45,.80,.50,.60,.50 1.10,.90,.50,.60,.48
The first stage of this test is to get all the prices into rank order from lowest
to highest. Call the prices from Zone 1 “A” and the ones from Zone 2 “B”.
A B A A B A B A B B
.45 .48 .50 .50 .50 .60 .60 .80 .90 1.10
The next thing I do is inspect each “A” sample in turn and count the
number of “A”s which come before it. Add up the total to get a U value.
Then I do the same thing, but with “B”s and I count the numbers of “A”s
that come before it.
A B A A B A B A B B
.45 .48 .50 .50 .50 .60 .60 .80 .90 1.10
AU- 0 +1 +1 +2 +3 =7
BU- 1 +3 +4 +5 +5 =18
Out of the 2 numbers we chose the lowest one. Then look up the
probability value in the table which is shown below. The number we get

Theresa Karolina Reichlin, form 5,Kensington School of Barcelona, 2008/2009
- 34 -
gives me the percentage probability that the difference between the two sets
of data is not actually reliable, in other words could have occured by
chance.
On the left hand side I selected number 7, which was the smaller one out of
our previous calculations. From the top I went down by number 5, which is
the number of prices I had for each zone. If I trace them all the way to the
point I get when they cross, I get the number 3.3, which signifies that the
unreliability of my sample is 3.3%. In other words, my sampling is 96.4%
accurate.

Theresa Karolina Reichlin, form 5,Kensington School of Barcelona, 2008/2009
- 35 -
Links between different sets of data
There are some links noticable when I look at my table of resutls. I have
chosen to select the results from the Gentrification percetages and the
Environmental survey and tried to put them in a graph.
Links between Gentrification and Environmental
Quality
0
10
20
30
40
50
60
70
80
0% 20% 40% 60% 80%
Gentrification
En
vir
on
men
tal
Qu
ali
ty
Zone 1
Zone 2
Zone 4
Zone 3
In this graph is is visible that the lower the gentrification, the lower the
environmental Quality. There is a negative correlation between these two
factors. It is quite logical that if there is a bad environment, ie no parks, alot
of traffic or vandalism, not many new shops will be able to open up in that
area because of the possible lack of customers. This can be also the other
way around: if there are no shops to attract tourists or wealthier locals, the
area becomes bad and hence the environmental quality decreases or does
not have the chance to increase.

Theresa Karolina Reichlin, form 5,Kensington School of Barcelona, 2008/2009
- 36 -
Summary of each individual zone
Viewing the changes within El Raval through this study is not completely
certain, because I had only a limited amout of time and also because I do
not have enough historic data to make accurate conclusions.
But as I know a bried history of each of the areas I think I can make some
statements and give reasons for the changes in land use and the
consequences.
The Barcelona Goverment carefully studied the history of each of the
zones, and according to that they assigned specific changes to the areas.
Zone 1
Zone 1 is overall the best zone in the Raval. It has the highest residential
quality, as shown on graph 1 (page 21) with almost no damage done to the
buildings, no broken windows or gutters. The buildings are sturdy and of
good quality. The Environmental quality is also highest for zone 1. The
landscape quality is satisfactory, there is not much of waste land, no litter,
noise and vandalism and no offensive smells or air pollution. The traffic
flow is normal residential, so there are no heavy vehicles driving on the
roads and the roads are not packed with cars.
Theresa Karolina Reichlin, form 5,Kensington School of Barcelona, 2008/2009
- 37 -
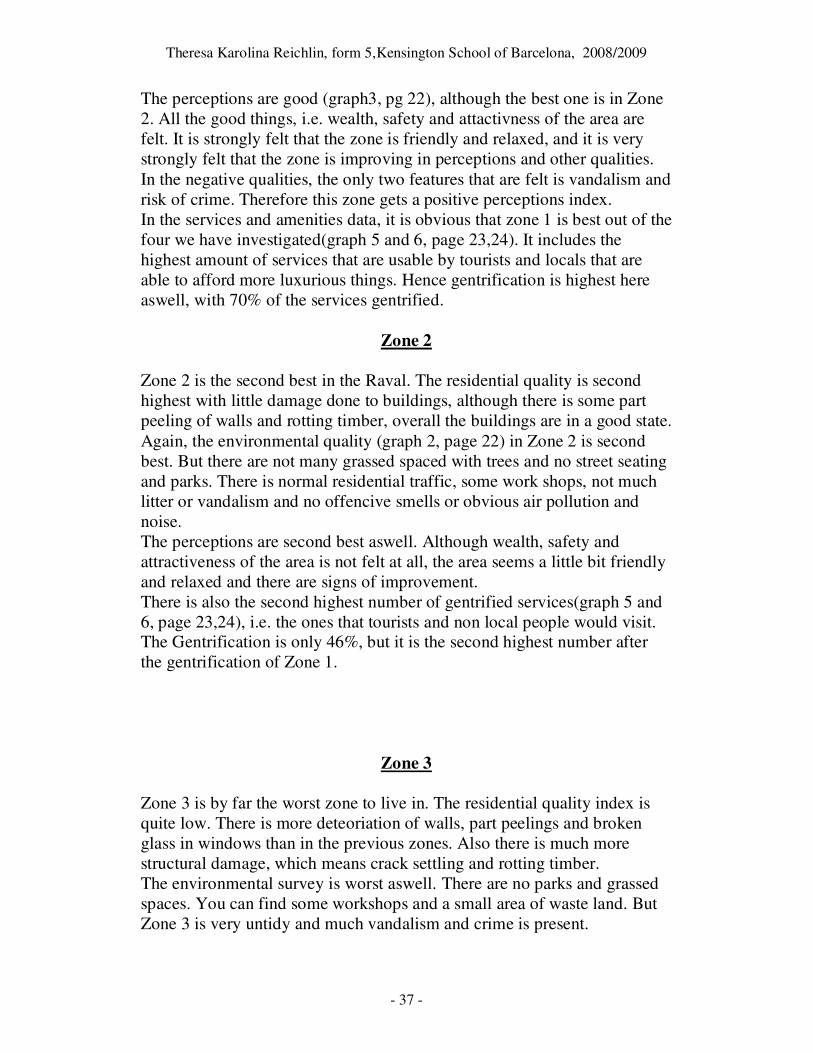
The perceptions are good (graph3, pg 22), although the best one is in Zone
2. All the good things, i.e. wealth, safety and attactivness of the area are
felt. It is strongly felt that the zone is friendly and relaxed, and it is very
strongly felt that the zone is improving in perceptions and other qualities.
In the negative qualities, the only two features that are felt is vandalism and
risk of crime. Therefore this zone gets a positive perceptions index.
In the services and amenities data, it is obvious that zone 1 is best out of the
four we have investigated(graph 5 and 6, page 23,24). It includes the
highest amount of services that are usable by tourists and locals that are
able to afford more luxurious things. Hence gentrification is highest here
aswell, with 70% of the services gentrified.
Zone 2
Zone 2 is the second best in the Raval. The residential quality is second
highest with little damage done to buildings, although there is some part
peeling of walls and rotting timber, overall the buildings are in a good state.
Again, the environmental quality (graph 2, page 22) in Zone 2 is second
best. But there are not many grassed spaced with trees and no street seating
and parks. There is normal residential traffic, some work shops, not much
litter or vandalism and no offencive smells or obvious air pollution and
noise.
The perceptions are second best aswell. Although wealth, safety and
attractiveness of the area is not felt at all, the area seems a little bit friendly
and relaxed and there are signs of improvement.
There is also the second highest number of gentrified services(graph 5 and
6, page 23,24), i.e. the ones that tourists and non local people would visit.
The Gentrification is only 46%, but it is the second highest number after
the gentrification of Zone 1.
Zone 3
Zone 3 is by far the worst zone to live in. The residential quality index is
quite low. There is more deteoriation of walls, part peelings and broken
glass in windows than in the previous zones. Also there is much more
structural damage, which means crack settling and rotting timber.
The environmental survey is worst aswell. There are no parks and grassed
spaces. You can find some workshops and a small area of waste land. But
Zone 3 is very untidy and much vandalism and crime is present.

Theresa Karolina Reichlin, form 5,Kensington School of Barcelona, 2008/2009
- 38 -
The perceptions overall are negative, the worst out of the 4 zones i went
through. Poverty and unattractivness of the area are very strongly felt, and
danger, risk of crime and vandalism are strongly felt. But the area is not
declining, infact improvment is felt a little bit. The people are in a
community spirit.
For the index of services and amenities it was too dangerous to walk
through and tick the list with what types of shops there are, so i used
secondary data and found that there are in total 38 shops or services, but
only 3 of them are advisable to be used by tourists. On the graph of “Total
2s and 3s” it is visible that Zone 3 has therefore the least amount of
gentrified services and needs alot of improvement.
Zone 4
Zone 4 is overall the second worst zone out of the four I have investigated.
It is just slightly better than Zone 3 but worse than Zone 2.
In the part I have been through the deterioration of walls and structural
damage to buildings, rotting timber and part peeling is high. There are
some broken windows and gutters.
The environmental quality is second worst here aswell. Again, no parks or
grassed spaces or wasteland. The streets are noisy and there is alot of
pollution and offencive smells. Some litter and vandalism present.
Perceptions are second worst, and in total they are negative. Almost none
of the positve features are felt, only some imporvement and friendlyness of
the zone. But the poverty and danger and risk of crime is high. Zone 4 has
the lowest number of services, but not the lowest percentage of
gentrification. It is still the second worst in that aspect, though.
Brief history of each the Zones to explain current issues and current
issues
Zone 1 was always favoured for convents and monasteries. It was a place
for the rich people to live, because of its good and peaceful environment.
Hence also the qualities of buildings had a much higher standard than in the
other 3 zones. The price was and is higher there as well. Now the situation
is that the Generalitat de Catalunya has found it a good solution to break
the cycle of poverty and start the cycle of affluence by investing most of
the money into this Zone. The Contemporary Art Museum was built, and a
new university was established in the areas of the old hospital. Many
libraries, schools and cultural centres were changed from being monasteries
and convents as well. The streets have been “open up” to let some light in,
and they are not so narrow anymore. A public square was made infront of

Theresa Karolina Reichlin, form 5,Kensington School of Barcelona, 2008/2009
- 39 -
the new cultural centre in order to help people mixing and communicating
and hence create a more friendly atmosphere and loweiring the levesl of
crime.This helps to attract tourists and local wealthier residents who bring
money to the Zone to enjoy the historical value of the Area.
By introducing these new facilities, more money came into the area and the
people and businesses there have been hugely benefited, and hence the
gentrification level is higher than in other zones. This will atract more and
more tourists and wealthier locals, bringin more money into the area, hence
gentrifying the shops as the shops get more and more money, business will
be better there, which will atract more shops again and will attract more
people and more money. This is the multiplier effect. It is obvious that due
to this effect many more jobs have been brought into the area directly or
indirectly.
As the periphery of
el Raval improves,
soon the changes
would move further
into the centre,
which is zone 3 and
4. It works the way
that if the new jobs
in the gentrified
jobs and places
attract people from
that zone and other
places outside like
zone 3 and 4.
This graph shows
the reversal of the
core-periphery
model. It shows the
situation the
government was
facing with El
Raval. The situation
was that the core of el Raval was really the worst out of the whole area.
The wealthier people lived in the periphery part of the old town, and the
residents of the inner part were poor, had many illnesses and there was a
high crime rate. The further we go away from the core, the wealthier and
more educated the people get.
The point of gentrification is to try and disrupt this model and bring money
into the area in the way I explained above.
Reversal of the Core-Periphery Model

Theresa Karolina Reichlin, form 5,Kensington School of Barcelona, 2008/2009
- 40 -
The diagram above shows the process of urban filtering. Over time, the
housing in the centre becomes desirable and is being upgraded and
gentrified. Then the wealthier move into the core of the city, as the young
Process of Urban Filtering Model
Raval, Zone 3
Raval, Zone 1

Theresa Karolina Reichlin, form 5,Kensington School of Barcelona, 2008/2009
- 41 -
and poorer people move out into the next zone, which in this case is
L´Eixample or Barri Gótic (labelled in image 1, page 2). The area of el
Raval is attractive because of its location, being very close to the central
business district it can provide a lot of entertainment, night life, shops, bars
and restaurants, and of course, offices and other things that make it cool to
live there.
This zone also has the most key gentrification indicators, which are there to
attract wealthier locals and also tourists. There is the Air Shop, which sells
objects filled with air, useless, but for stylish decoration for homes. Then
there is the Camper hotel, the Food Ball and an Ambassador Hotel.
Zone 2 was the most densely populated area in the Raval, and in the world.
The number of people living in 1 km² reached up to 68 000. The reason for
that is that all the people moved to the cheaper area in north Raval in order
to stay away from the port where there was a lot of prostitution, crime and
violence. Also when the Industrial Revlution occured in the 18 hundreds
and all the factories were built in zone 4, people wanted to find a cheap
living that was close enough to the factories so they can go to work by foot
and not waste money on transport. Also, it was better to live there because
there was not as much crime, prostitution and violence as there was in zone
3. So basically most of El Raval´s population was packed up in the
northwest. It is the second best zone in perceptions, and in residential
quality, etc., so the Catalan Government invested into the area as well, by
supporting pedestrianisation and street beautification. The residential
buildings have been improved and new pneumatic under-street waste
disposal has been built. But the Key gentrification indicator of zone 2 is
the Indian Museum.
Zone 3 was infamous for its bad reputation. It is located near the old port,
so therefore it was the “red light district” available for the sea men that
arrived to Barcelona through the port once in a long time. The Zone was
full of prostitution, crime, violence, drug dealing, etc. That is why it was so
unpopular for average tourists or wealthier local citizens. Therefore, the
land values are relatively cheap, and so poor immigrants may come and
live here, not because they want to, but because they cannot afford it
anywhere else in Barcelona. Due to that, there is a mixture of different
nationalities, cultures, religions and lifestyles. This can be seen in the fact
that the most immigrant services are in zone 3. Also the only mosque out of
those four zones is found in zone 3.
The local government still finds it hard to invest money into that zone
because it is too gone to be repaired in the next few years. Yet the

Theresa Karolina Reichlin, form 5,Kensington School of Barcelona, 2008/2009
- 42 -
government has planned and built the Barceló Raval Hotel, just next to the
Rambla de Raval to attract tourists. The plan is also to mix private and
public housing, so a wider range of people with wider ranges of money
come into the zone.
Zone 4 was the place where all the farm land was, and when the Industrial
Revolution came, all the factories and workshops moved there. This
explains the highest percentage of workshops out of the four zones. The
factories and warehouses are also harder to convert into tourist attractions
or other suitable facilities for the wealthier locals. That means that the
income of money from tourists and wealthier local residents will be smaller
than in Zone 1, where it is much easier because the old convents and
monasteries are now attractive to tourists. The land value was cheapest,
meaning many of the poor immigrants wanted to live there. Therefore its
residential quality is low, because all the housing is maintained by poor
unskilled manual workers.
Values and attitudes as a result of land use change
Winners Losers
Tourists- They come and see the
trendy area, have a good time in bars,
restaurants Barcelona overall and
spend some money in the streets of
Zone 1. Some people might end up
buying a flat close to the city centre.
Locals- The pick-pockets and thieves
have many opportunities to “make”
money. The beggars in the streets
may be felt sorry for by the tourists
who wouldn’t hesitate to give a few
Euros to an old legless lady sitting
against a wall with an old picture of
her family with 15 members, or a
Locals- The tourists that come buy their
second homes or flats make the value of
the land rise so high that the locals
cannot afford to live there anymore. In
general Franco´s time, the flats were
contracted in a way that the person
living in it cannot be thrown out and
should be able to pay the same price that
was give at the beginning of the rent.
That was some 30 years ago, and land
value was so cheap those days that still
today people pay about 30 per month for
their rent, including electricity. There
are “speculators” these days that try to
get the old original residents out of their

Theresa Karolina Reichlin, form 5,Kensington School of Barcelona, 2008/2009
- 43 -
child that appears to be all alone.
The City Council – The Barcelona
City council will have a good image
in Spain and abroad if they show
effort in "Rebranding" the city, it
gives Barcelona a trendy and
glamorous look, hence more tourists
would come in and put money into
the local system.
homes by shocking them, for example
letting a pack of rats into a home of an
old lady. She will get a big shock, and
probably die. That will make the flat
free so the place can be sold or rented
for a much higher price than before.
Other “methods” are used, for example
cutting the energy supply, so the
residents freeze to death in their homes.
That is why in the eyes of the locals the
tourist is the terrorist. Nobody except
profitable businesses feels that tourism
brings benefits into the area.
Tourists- When they walk through the
Raval it is quite possible that they get
robbed. Hence they lose money and
other possessions, which make them
losers.

Theresa Karolina Reichlin, form 5,Kensington School of Barcelona, 2008/2009
- 44 -
Conclusion
El Raval is changing because of the changes made by the scheme is the
local government, which has managed to change the social, environmental
and financial situation of the area. These changes are starting to attract
businesses, and other higher socio-economic groups into the area which
increases the income to the people and the whole land value, which means
that the area is richer. The higher land values could have driven the poorer
residents who might have made it uncomfortable for tourists until now
away. In general the Raval is changing, although some zones might be
evolving in a different way.
The changes in Zone 1 are occurring rapidly due to cultural facilities like
the CAM or the Catalan National Library or Universities. Thanks to the
location of Zone 1, on the periphery of the Raval, and close to Barcelona´s
Central Business district, the integration of different types of people and
lifestyles can occur. Money will flow faster into the Zone because tourists
will come and spend their money in the shops while they are exploring the
area around Las Ramblas, which is very close to it.
Zone 2 is changing as well, not as fast as Zone 1 and not as slow as Zone 4,
as seen in the set of results. The benefits from being situated near Zone 1
with the cultural buildings can be that money will somehow get there as
well and so the area will become more gentrified in the future.
Zone 3 is not improving very well, because its right in the middle of El
Raval. Its situation is so bad that the local government has decided to wait
some 10 years or so and then start trying to do something with it. But lately
some slums have been taken down to make new social spaces and modern
buildings such as the new Barceló Raval Hotel and Private housing, which
is hoped to help the poor and wealthy people mix and so gentrification
would occur.
In the results we see that Zone 4 has improved slower than Zone 2, and
since it’s the farthest away from the educational buildings in Zone 1 or the
CBD of Barcelona, we cannot expect for gentrification to happen there so
quickly. However since it is close to the hotel in zone 3 it should be
possible that money will be brought into the area as well, which then
attracts other businesses, which will bring more money and so on. In all
four zones we can expect the multiplier effect to start taking place sooner
or later, but no money will be lost, it will only be gained to the area.

Theresa Karolina Reichlin, form 5,Kensington School of Barcelona, 2008/2009
- 45 -
Evaluation
In my study there were some things which limited me to get all the data and
some things which I would change next time if I did this again. I would try
and remove some limitations which might have affected my results. For
example, we did not have a chance to look inside in some of the homes, or
we only had a limited amount of time to get our sample data. If we had
access to a census, or we carried out one, the results might have been a
little bit different. Also, I would like to know the further impact that
tourists would have in the area.
Another thing which limited me and my group while collecting results was
the time of day, year and so on. We were in El Raval from the morning to
early afternoon, and its quite possible that some shops and services have
been closed, and also, a type of people which might give Zone 3 its
characteristic might not have been out yet, as the Underworld starts to
function at night.
While collecting prices, the shopkeepers could have made up the prices
depending on what the “customer” looked like and also because they knew
we only went to ask, how much a coca cola costs. Apparently there were
some groups in the same area and shops doing the same thing, which might
have provoked the shopkeepers into lying about prices.