Housing subsidy quantum and innovative building systems-a...
28
HOUSING SUBSIDY QUANTUM AND INNOVATIVE BUILDING SYSTEMS-A CRITICAL LITERATURE REVIEW AUTHORS: EMMANUEL KIZITO KABUNDU PROF. SIJEKULA MBANGA PROF. BRINK BOTHA DR. VUYISANI MOSS
Transcript of Housing subsidy quantum and innovative building systems-a...
HOUSING SUBSIDY QUANTUM AND INNOVATIVE
BUILDING SYSTEMS-A CRITICAL LITERATURE
REVIEW
AUTHORS:EMMANUEL KIZITO KABUNDU
PROF. SIJEKULA MBANGA
PROF. BRINK BOTHA
DR. VUYISANI MOSS
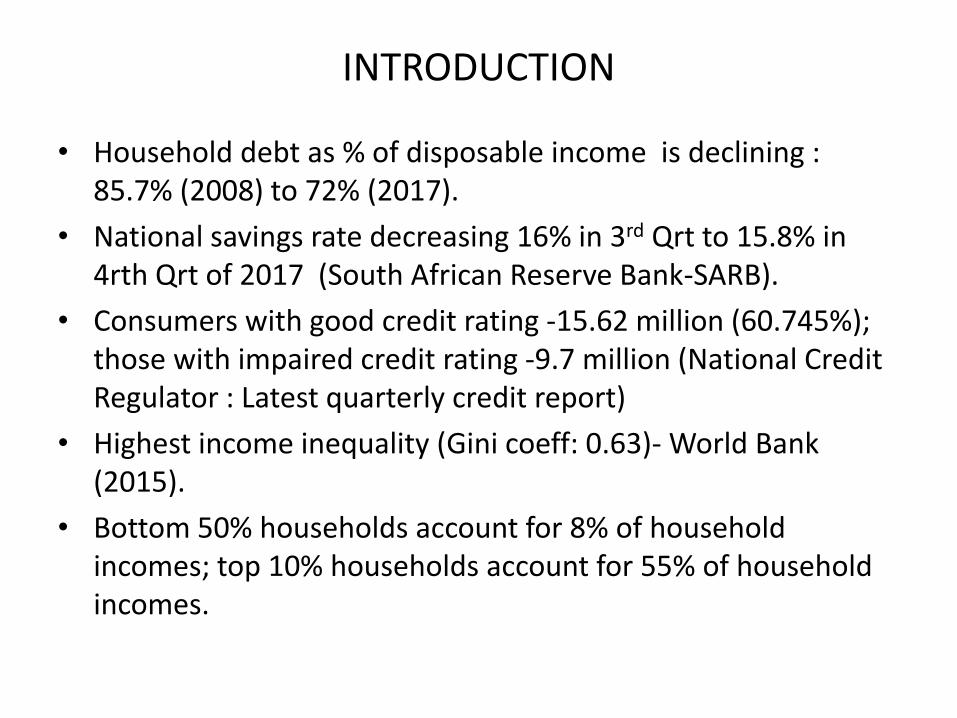
INTRODUCTION
• Household debt as % of disposable income is declining : 85.7% (2008) to 72% (2017).
• National savings rate decreasing 16% in 3rd Qrt to 15.8% in 4rth Qrt of 2017 (South African Reserve Bank-SARB).
• Consumers with good credit rating -15.62 million (60.745%); those with impaired credit rating -9.7 million (National Credit Regulator : Latest quarterly credit report)
• Highest income inequality (Gini coeff: 0.63)- World Bank (2015).
• Bottom 50% households account for 8% of household incomes; top 10% households account for 55% of household incomes.
INTRODUCTION
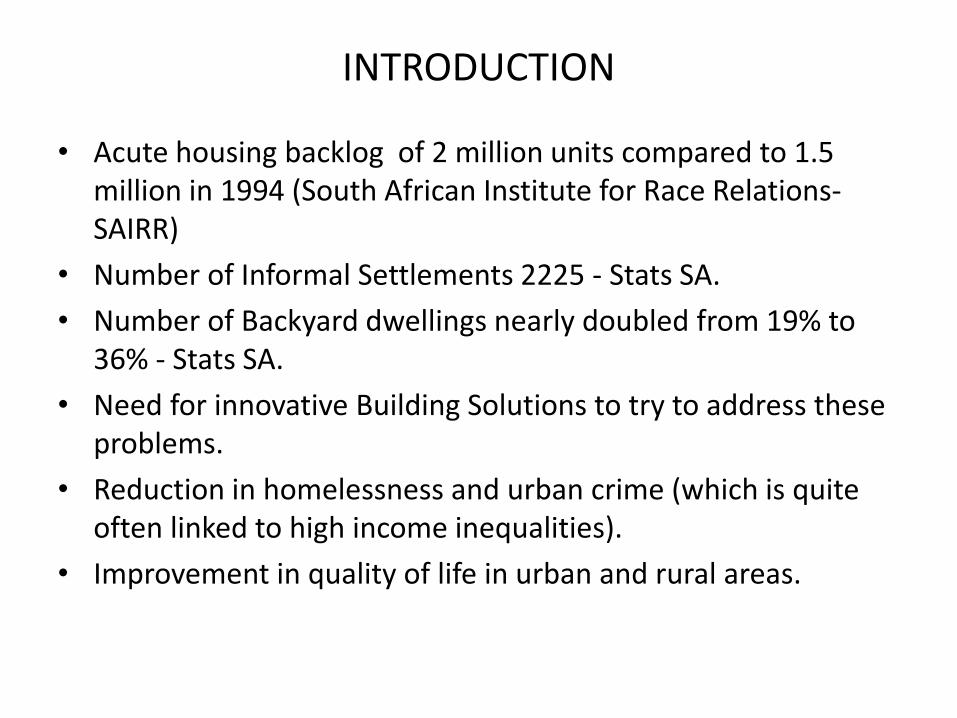
• Acute housing backlog of 2 million units compared to 1.5 million in 1994 (South African Institute for Race Relations-SAIRR)
• Number of Informal Settlements 2225 - Stats SA.
• Number of Backyard dwellings nearly doubled from 19% to 36% - Stats SA.
• Need for innovative Building Solutions to try to address these problems.
• Reduction in homelessness and urban crime (which is quite often linked to high income inequalities).
• Improvement in quality of life in urban and rural areas.
INTRODUCTION
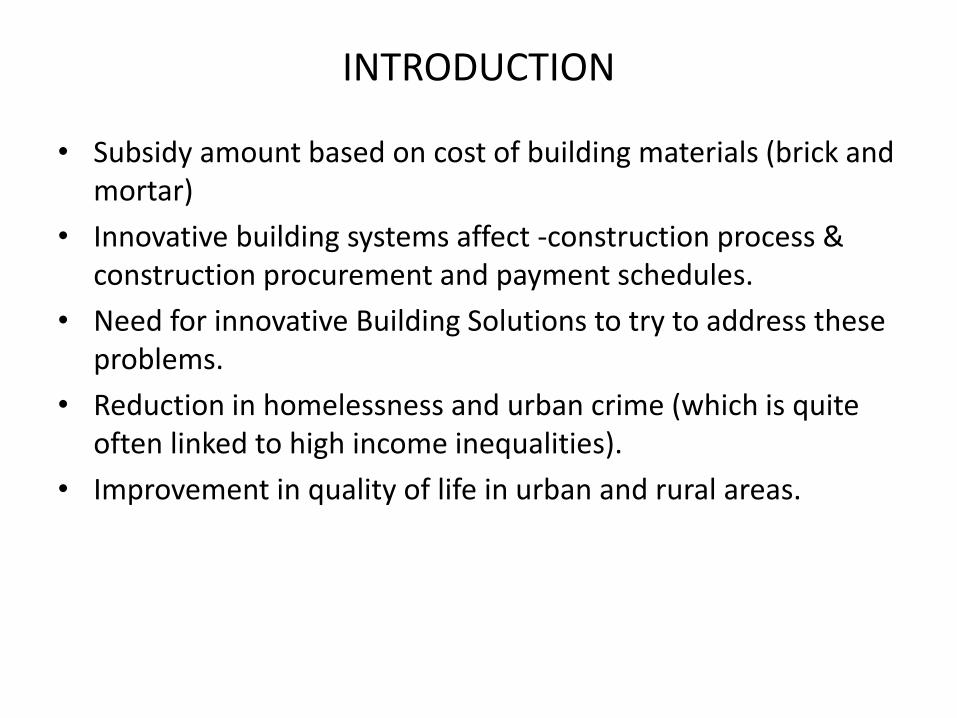
• Subsidy amount based on cost of building materials (brick and mortar)
• Innovative building systems affect -construction process & construction procurement and payment schedules.
• Need for innovative Building Solutions to try to address these problems.
• Reduction in homelessness and urban crime (which is quite often linked to high income inequalities).
• Improvement in quality of life in urban and rural areas.
Aims and Objectives
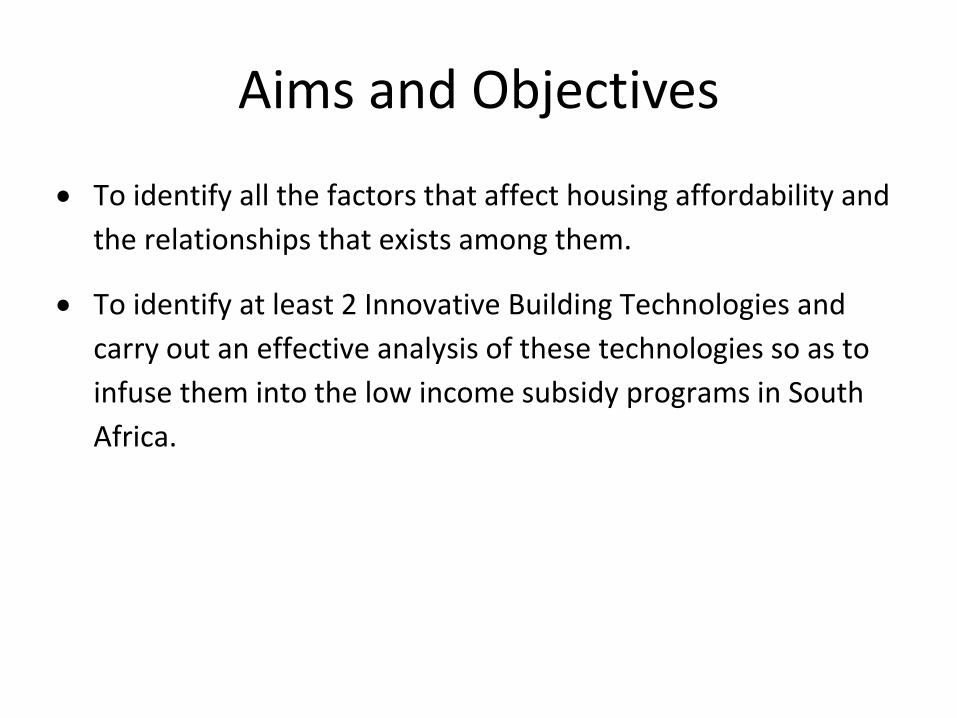
• To identify all the factors that affect housing affordability and
the relationships that exists among them.
• To identify at least 2 Innovative Building Technologies and
carry out an effective analysis of these technologies so as to
infuse them into the low income subsidy programs in South
Africa.
Housing Affordability
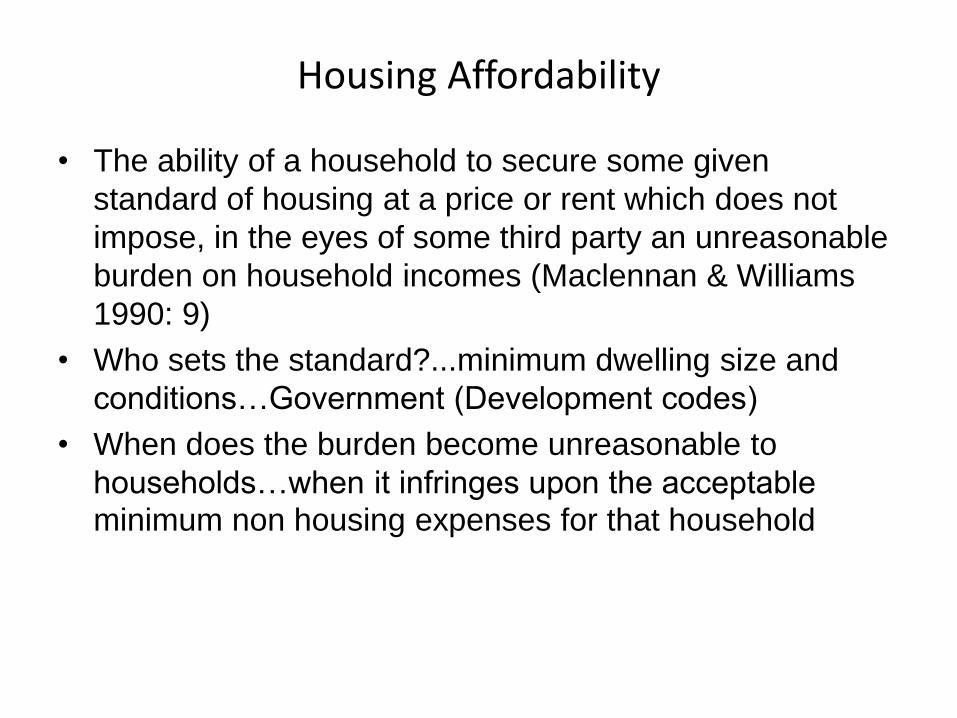
• The ability of a household to secure some given
standard of housing at a price or rent which does not
impose, in the eyes of some third party an unreasonable
burden on household incomes (Maclennan & Williams
1990: 9)
• Who sets the standard?...minimum dwelling size and
conditions…Government (Development codes)
• When does the burden become unreasonable to
households…when it infringes upon the acceptable minimum non housing expenses for that household
Methods: 1.Percentage of income
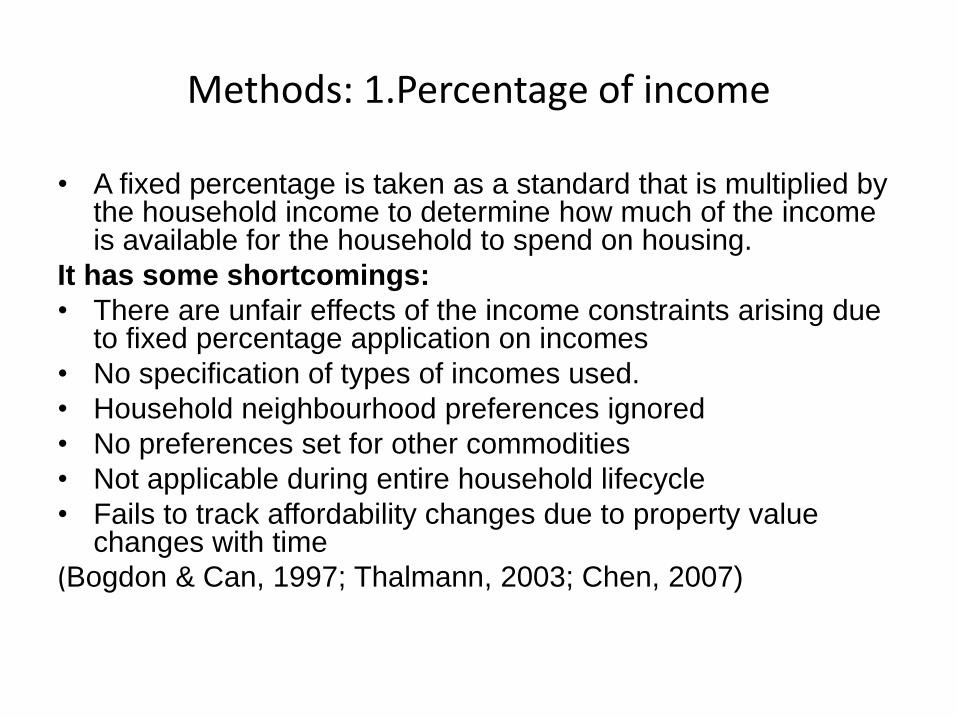
• A fixed percentage is taken as a standard that is multiplied by the household income to determine how much of the income is available for the household to spend on housing.
It has some shortcomings:
• There are unfair effects of the income constraints arising due to fixed percentage application on incomes
• No specification of types of incomes used.
• Household neighbourhood preferences ignored
• No preferences set for other commodities
• Not applicable during entire household lifecycle
• Fails to track affordability changes due to property value changes with time
(Bogdon & Can, 1997; Thalmann, 2003; Chen, 2007)
Methods: 1.Percentage of income
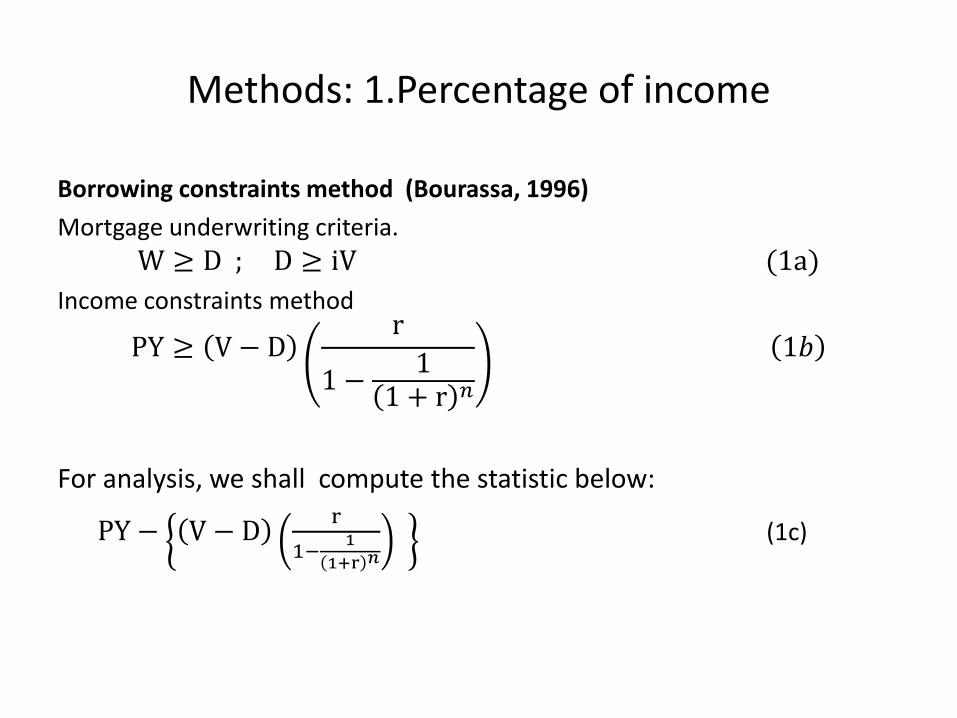
Borrowing constraints method (Bourassa, 1996)
Mortgage underwriting criteria.
W ≥ D ; D ≥ iV (1a)
Income constraints method
PY ≥ V − Dr
1 −1
1 + r 𝑛
1𝑏
For analysis, we shall compute the statistic below:
PY − V − Dr
1−1
1+r 𝑛
(1c)
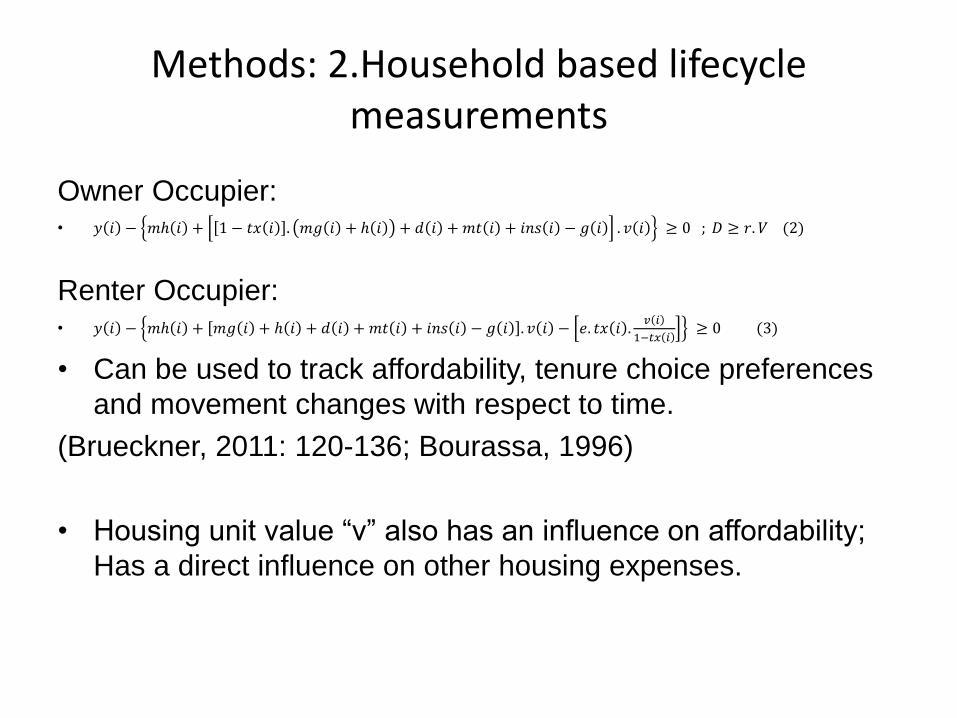
Methods: 2.Household based lifecycle measurements
Owner Occupier:• 𝑦 𝑖 − 𝑚ℎ 𝑖 + 1 − 𝑡𝑥 𝑖 . 𝑚𝑔 𝑖 + ℎ 𝑖 + 𝑑 𝑖 + 𝑚𝑡 𝑖 + 𝑖𝑛𝑠 𝑖 − 𝑔 𝑖 . 𝑣 𝑖 ≥ 0 ; 𝐷 ≥ 𝑟. 𝑉 (2)
Renter Occupier:• 𝑦 𝑖 − 𝑚ℎ 𝑖 + 𝑚𝑔 𝑖 + ℎ 𝑖 + 𝑑 𝑖 + 𝑚𝑡 𝑖 + 𝑖𝑛𝑠 𝑖 − 𝑔 𝑖 . 𝑣 𝑖 − 𝑒. 𝑡𝑥 𝑖 .
𝑣 𝑖
1−𝑡𝑥 𝑖≥ 0 (3)
• Can be used to track affordability, tenure choice preferences
and movement changes with respect to time.
(Brueckner, 2011: 120-136; Bourassa, 1996)
• Housing unit value “v” also has an influence on affordability;
Has a direct influence on other housing expenses.
Advantages
• Takes into account the differing household sizes and incomes
• Eliminates the unfair effects due to income constraints
• Can allow for household neighborhood preferences
• Can allow for preferences for other commodities to be set
• Can track house affordability changes with time
• Considers household lifecycle
• In its improved state it can modeled so that it takes into account the spatial dimension, hence spatially based analysis

Methods: 2.Household based lifecycle measurements
• Housing unit value (V) with respect to time can also be
estimated (cost approach to valuation) using the following
equation (Maritz,1993: 110):
• 𝑉 = 𝑐𝑐 − 𝑑 + 𝑙 ( 4)
• “cc”…Initial construction costs to build the housing unit also significantly influence the value of the unit later.
• Initial construction costs –directly influenced by the building technologies
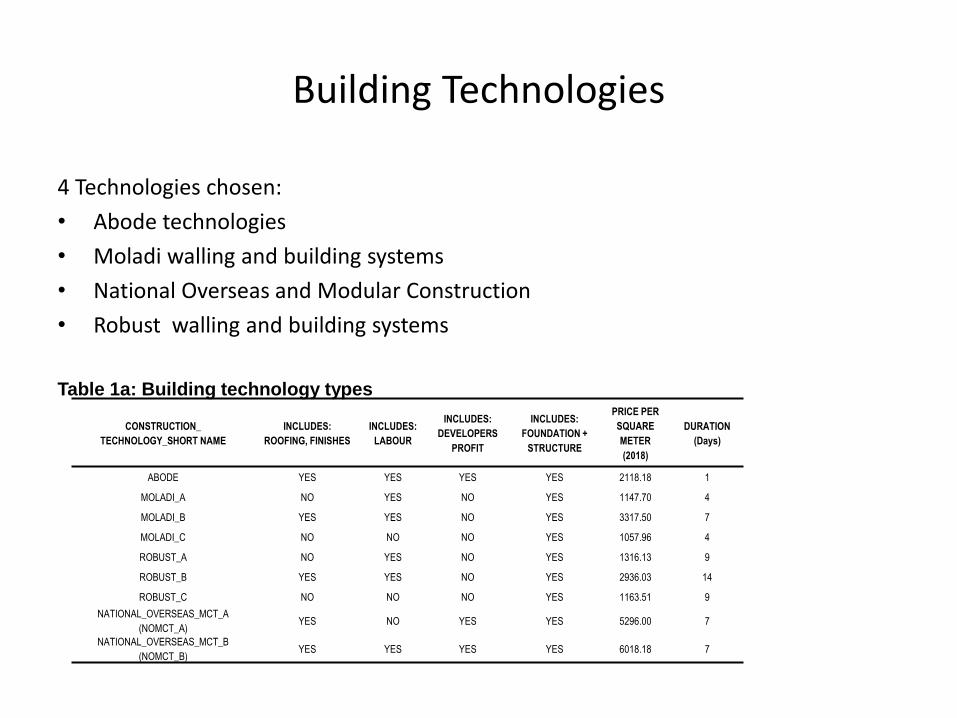
Building Technologies
4 Technologies chosen:
• Abode technologies
• Moladi walling and building systems
• National Overseas and Modular Construction
• Robust walling and building systems
Table 1a: Building technology types
CONSTRUCTION_
TECHNOLOGY_SHORT NAME
INCLUDES:
ROOFING, FINISHES
INCLUDES:
LABOUR
INCLUDES:
DEVELOPERS
PROFIT
INCLUDES:
FOUNDATION +
STRUCTURE
PRICE PER
SQUARE
METER
(2018)
DURATION
(Days)
ABODE YES YES YES YES 2118.18 1
MOLADI_A NO YES NO YES 1147.70 4
MOLADI_B YES YES NO YES 3317.50 7
MOLADI_C NO NO NO YES 1057.96 4
ROBUST_A NO YES NO YES 1316.13 9
ROBUST_B YES YES NO YES 2936.03 14
ROBUST_C NO NO NO YES 1163.51 9
NATIONAL_OVERSEAS_MCT_A
(NOMCT_A)YES NO YES YES 5296.00 7
NATIONAL_OVERSEAS_MCT_B
(NOMCT_B)YES YES YES YES 6018.18 7
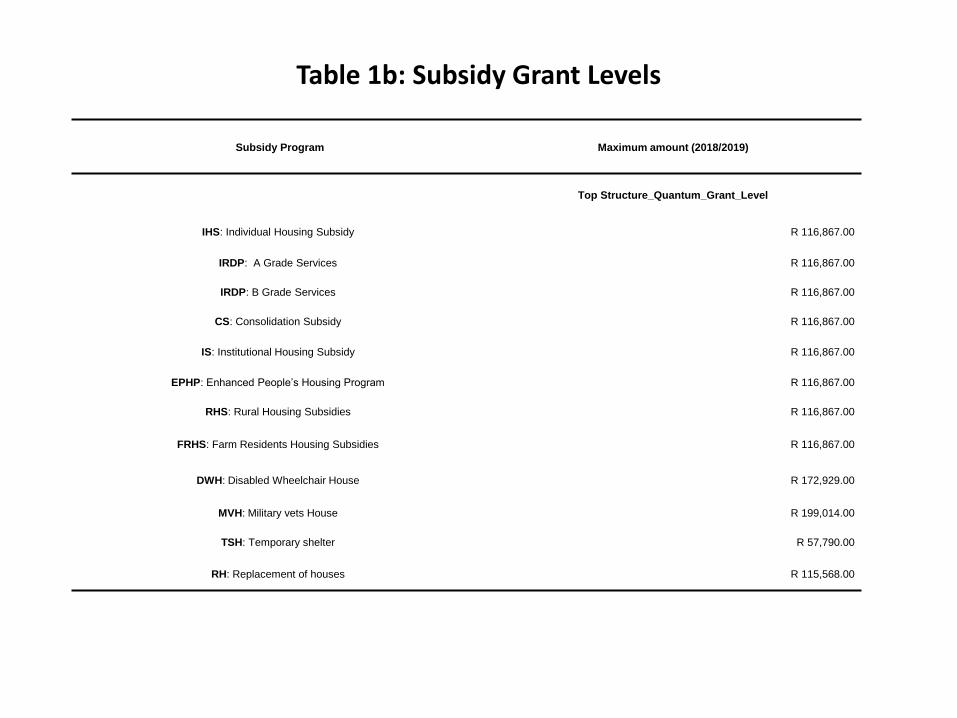
Table 1b: Subsidy Grant Levels
Subsidy Program Maximum amount (2018/2019)
Top Structure_Quantum_Grant_Level
IHS: Individual Housing Subsidy R 116,867.00
IRDP: A Grade Services R 116,867.00
IRDP: B Grade Services R 116,867.00
CS: Consolidation Subsidy R 116,867.00
IS: Institutional Housing Subsidy R 116,867.00
EPHP: Enhanced People’s Housing Program R 116,867.00
RHS: Rural Housing Subsidies R 116,867.00
FRHS: Farm Residents Housing Subsidies R 116,867.00
DWH: Disabled Wheelchair House R 172,929.00
MVH: Military vets House R 199,014.00
TSH: Temporary shelter R 57,790.00
RH: Replacement of houses R 115,568.00
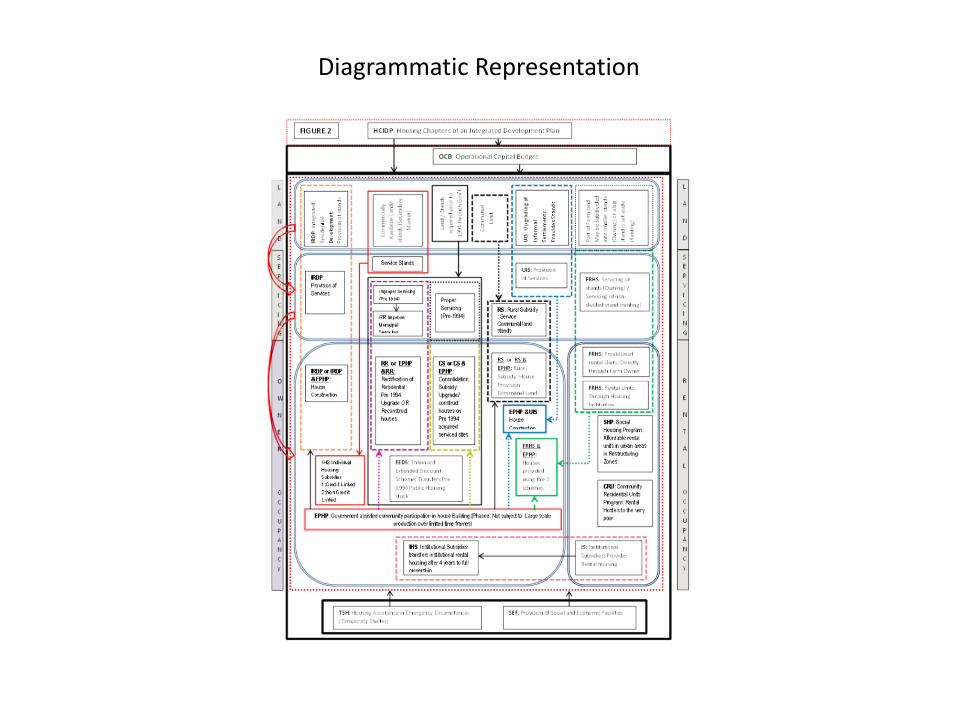
Diagrammatic Representation
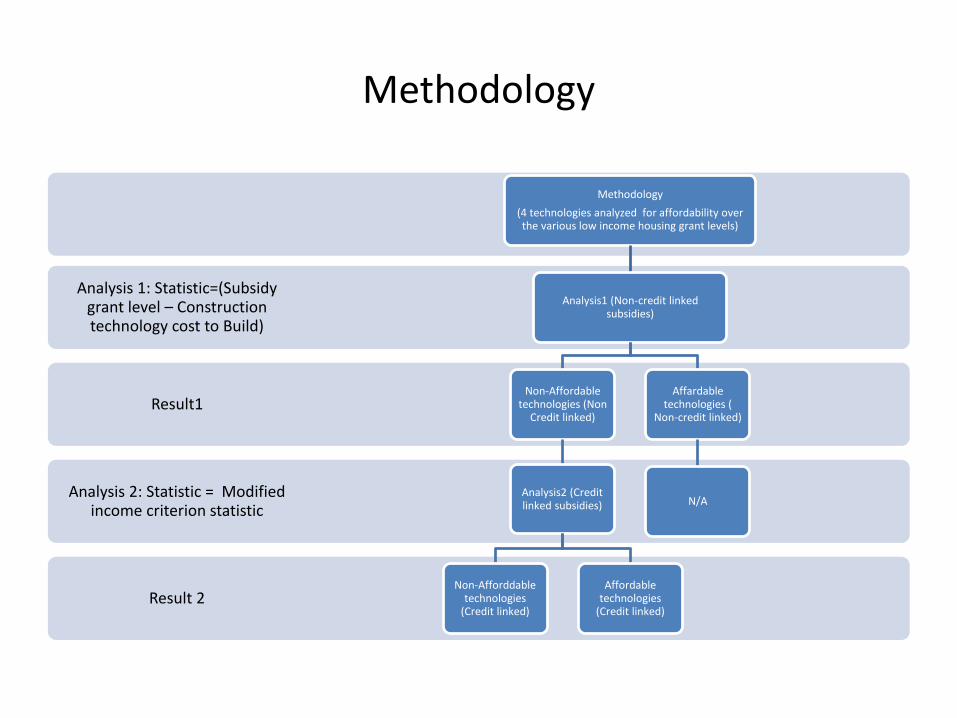
Methodology
Result 2
Analysis 2: Statistic = Modified income criterion statistic
Result1
Analysis 1: Statistic=(Subsidy grant level – Construction technology cost to Build)
Methodology
(4 technologies analyzed for affordability over the various low income housing grant levels)
Analysis1 (Non-credit linked subsidies)
Non-Affordable technologies (Non
Credit linked)
Analysis2 (Credit linked subsidies)
Non-Afforddable technologies
(Credit linked)
Affordable technologies
(Credit linked)
Affardable technologies (
Non-credit linked)
N/A
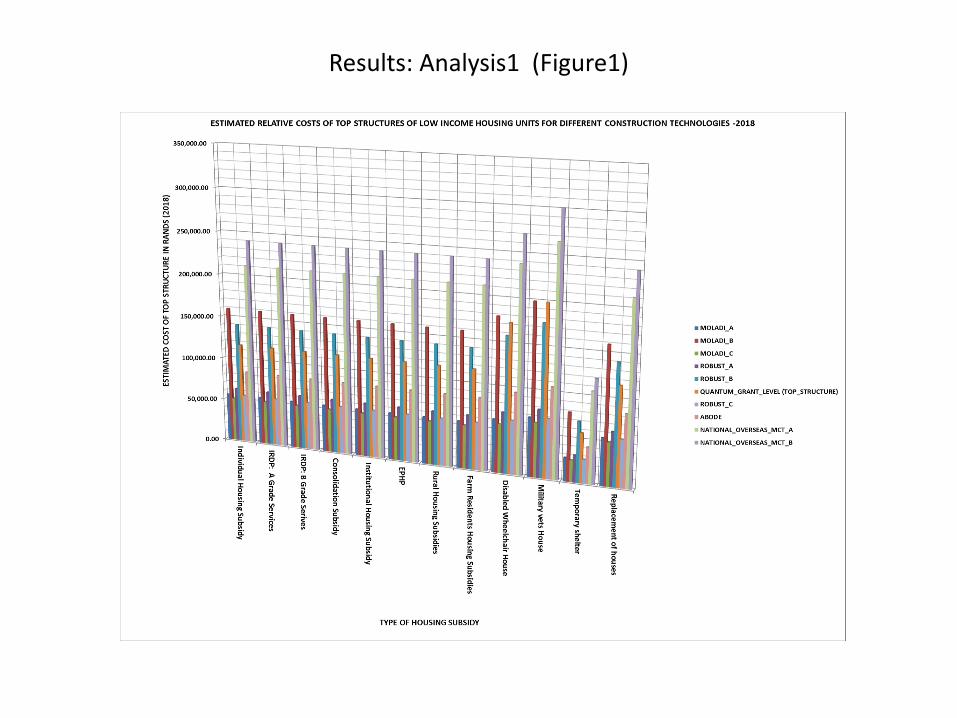
Results: Analysis1 (Figure1)
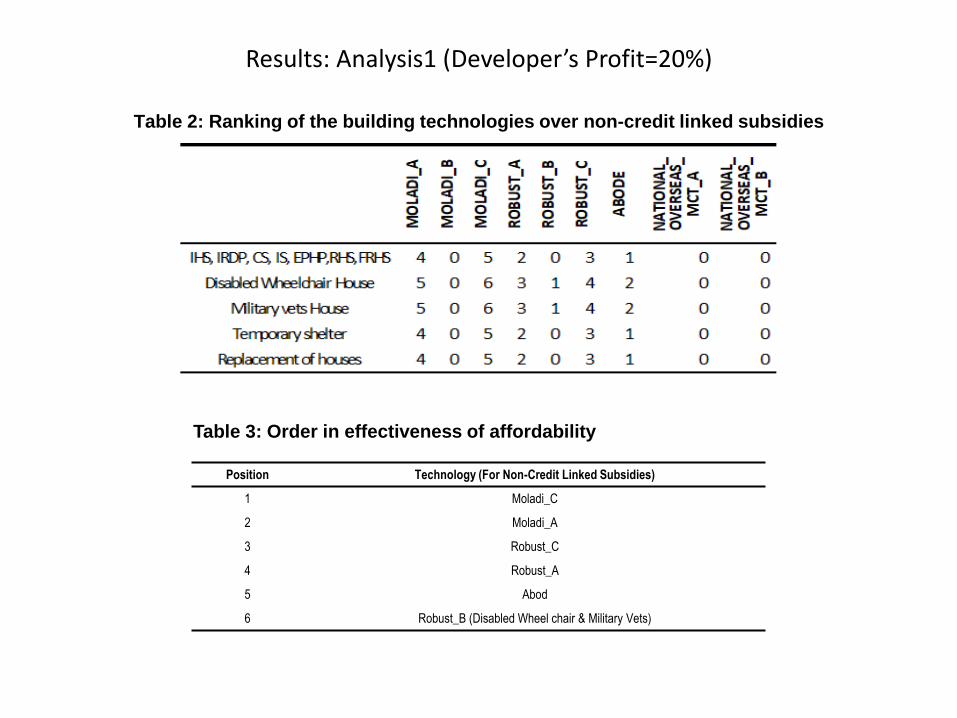
Results: Analysis1 (Developer’s Profit=20%)
Table 2: Ranking of the building technologies over non-credit linked subsidies
Position Technology (For Non-Credit Linked Subsidies)
1 Moladi_C
2 Moladi_A
3 Robust_C
4 Robust_A
5 Abod
6 Robust_B (Disabled Wheel chair & Military Vets)
Table 3: Order in effectiveness of affordability
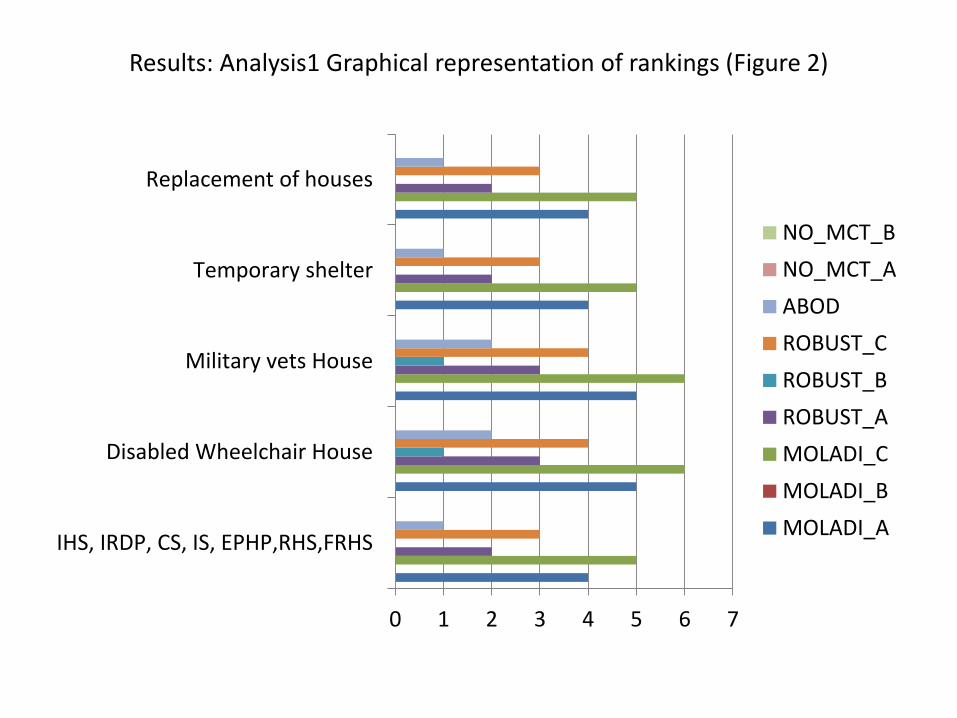
Results: Analysis1 Graphical representation of rankings (Figure 2)
0 1 2 3 4 5 6 7
IHS, IRDP, CS, IS, EPHP,RHS,FRHS
Disabled Wheelchair House
Military vets House
Temporary shelter
Replacement of houses
NO_MCT_B
NO_MCT_A
ABOD
ROBUST_C
ROBUST_B
ROBUST_A
MOLADI_C
MOLADI_B
MOLADI_A
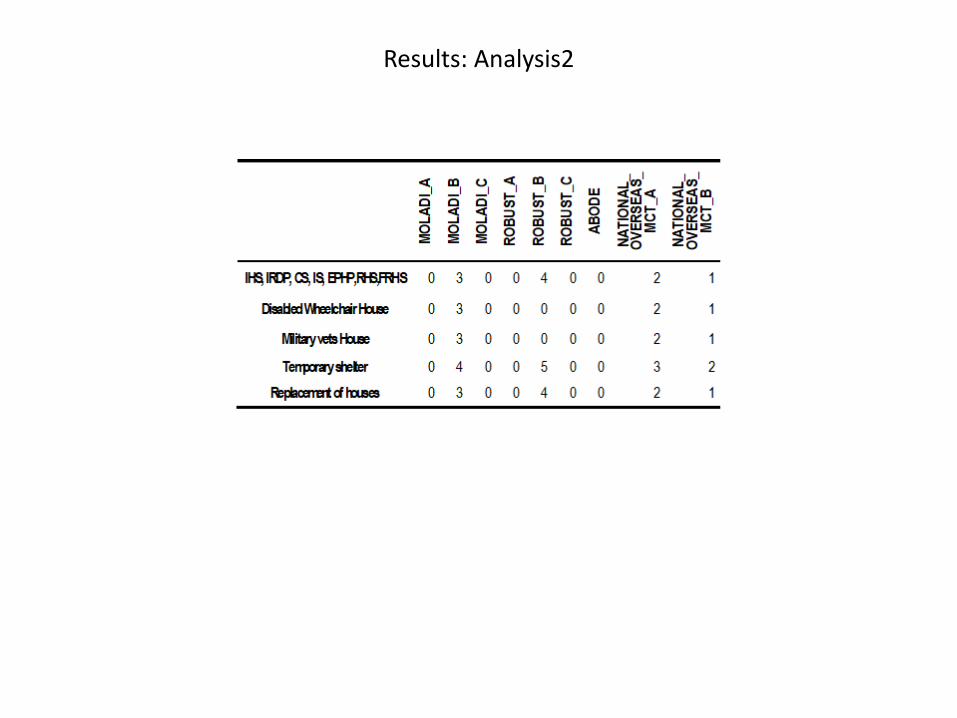
Results: Analysis2
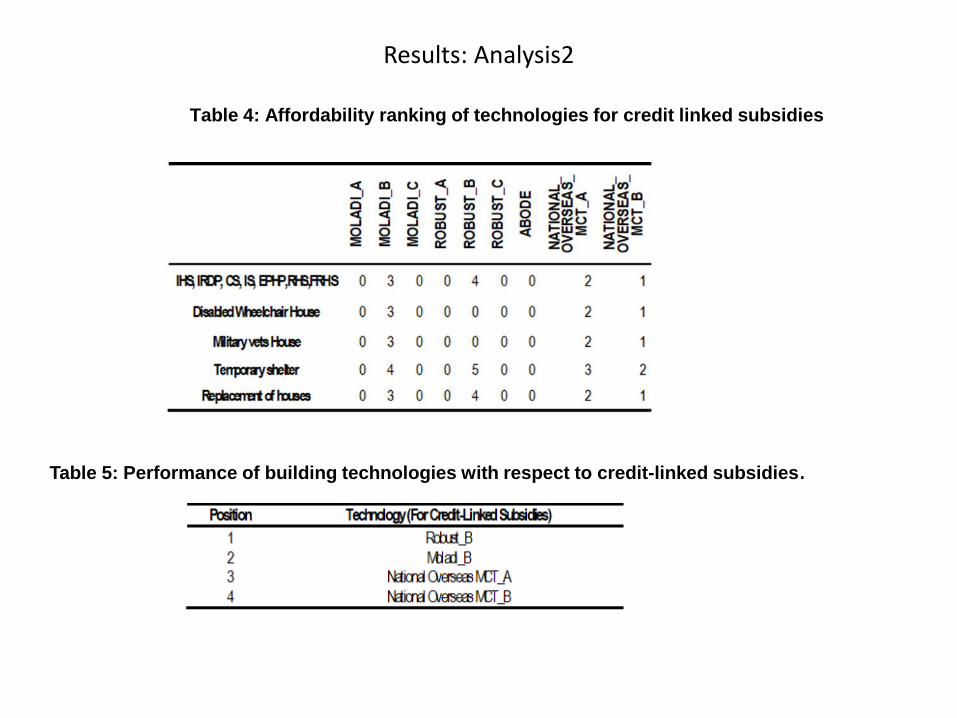
Results: Analysis2
Table 5: Performance of building technologies with respect to credit-linked subsidies.
Table 4: Affordability ranking of technologies for credit linked subsidies
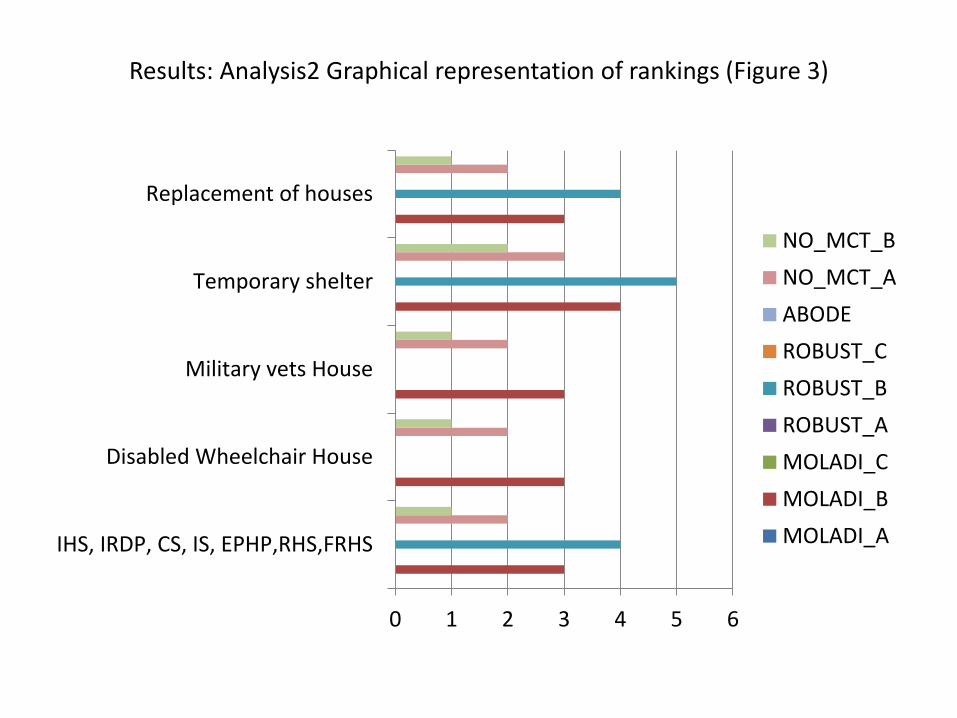
Results: Analysis2 Graphical representation of rankings (Figure 3)
0 1 2 3 4 5 6
IHS, IRDP, CS, IS, EPHP,RHS,FRHS
Disabled Wheelchair House
Military vets House
Temporary shelter
Replacement of houses
NO_MCT_B
NO_MCT_A
ABODE
ROBUST_C
ROBUST_B
ROBUST_A
MOLADI_C
MOLADI_B
MOLADI_A
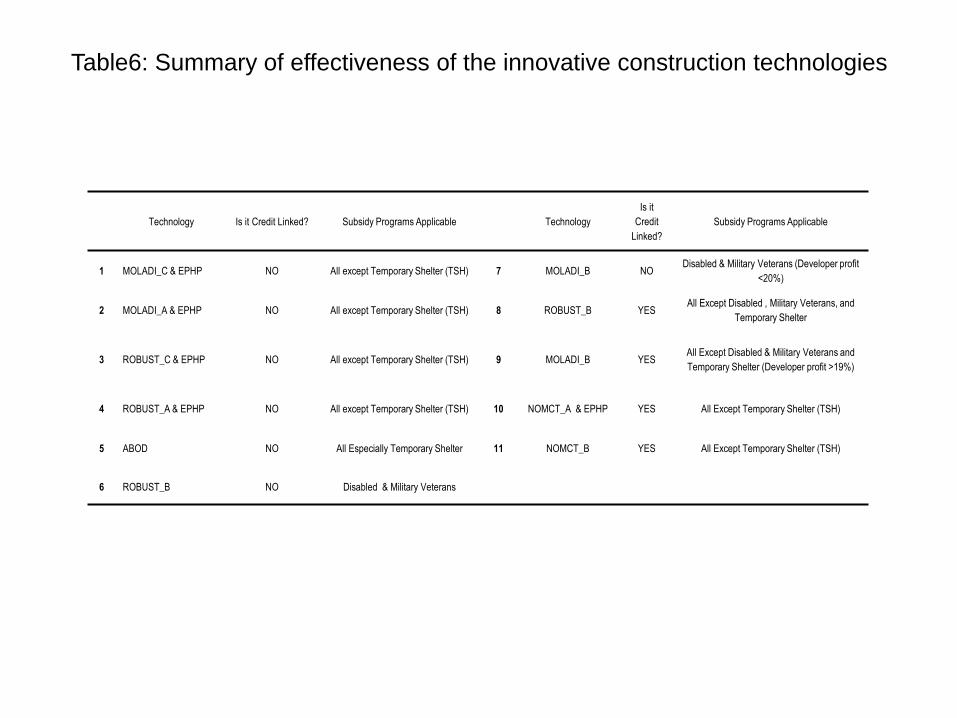
Table6: Summary of effectiveness of the innovative construction technologies
Technology Is it Credit Linked? Subsidy Programs Applicable Technology
Is it
Credit
Linked?
Subsidy Programs Applicable
1 MOLADI_C & EPHP NO All except Temporary Shelter (TSH) 7 MOLADI_B NODisabled & Military Veterans (Developer profit
<20%)
2 MOLADI_A & EPHP NO All except Temporary Shelter (TSH) 8 ROBUST_B YESAll Except Disabled , Military Veterans, and
Temporary Shelter
3 ROBUST_C & EPHP NO All except Temporary Shelter (TSH) 9 MOLADI_B YESAll Except Disabled & Military Veterans and
Temporary Shelter (Developer profit >19%)
4 ROBUST_A & EPHP NO All except Temporary Shelter (TSH) 10 NOMCT_A & EPHP YES All Except Temporary Shelter (TSH)
5 ABOD NO All Especially Temporary Shelter 11 NOMCT_B YES All Except Temporary Shelter (TSH)
6 ROBUST_B NO Disabled & Military Veterans
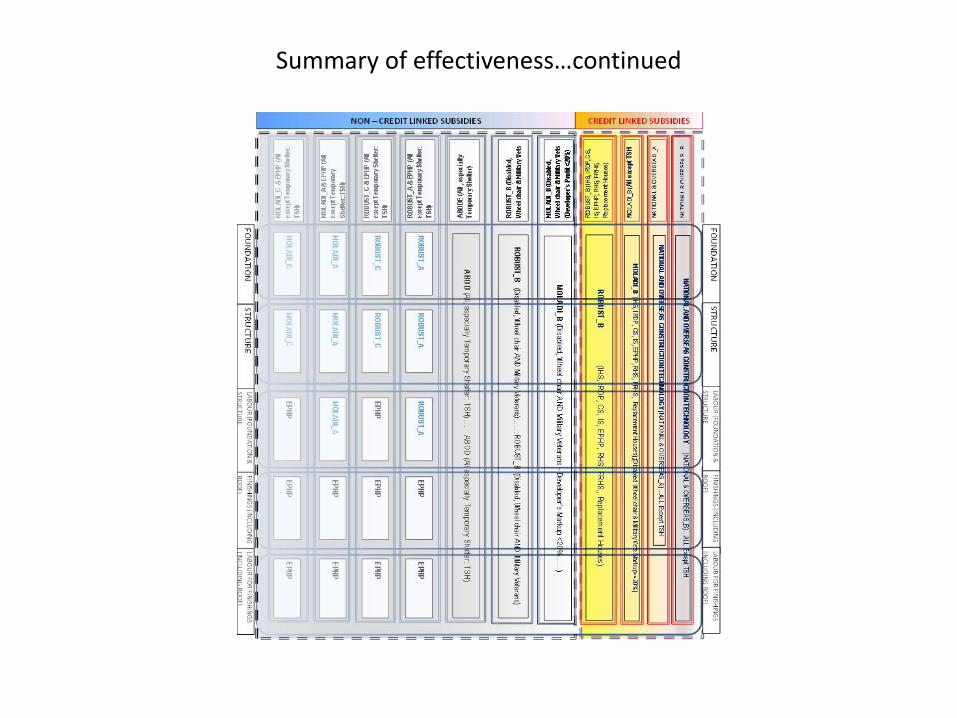
Summary of effectiveness…continued
Conclusions
• Need to address weaknesses in the percentage of income method
• Thus need for lifecycle evaluation of housing affordability
• Application of EPHP into the various building technologies improves
affordability for the year 2018, and for some time (years) into the
future.
Further research
• Modelling and implementation of the method that measures housing
affordability by using lifecycle based household profile data.
• Using the developed model to forecast of the performance (In terms
of affordability) and suitability of all the approved innovative building
technologies in South Africa
References Used• Abode, 2018. Abod Homes. Online Available at http://www.abod.co.za/ .Accessed on 26/08/2018.
• Bogdon, A. S. & Can, A. 1997. Indicators of Local Housing Affordability: Comparative and Spatial Approaches. Journal of Real Estate Economics,
Volume 25, pp. 43-80.
• Bourassa, S.C. 1996. Measuring the Affordability of Home-Ownership. Urban Studies. Volume 33, pp. 1867-1877.
• Brueckner, J. K. 2011. Lecture Notes on Urban Economics. Massachusetts: Massachusetts Institute of Technology Press 2011.
• Central Statistics Office, Botswana. 2008a. Poverty Datum Line for Botswana 2003. Department of Printing and Publishing Services 2008.
• Central Statistics Office, Botswana. 2008b. Botswana Census Based Poverty Map Report. Department of Printing and Publishing Services 2008.
• Chambers, M., Garriga, C. & Schlagenhauf, D. E. 2007.The Tax Treatment of Home Owners and Land Lords and the Progressivity of Income
Taxation. Research Division of the Federal Reserve Bank of St. Louis: Working Paper 2008-6.
• Chen, D. 2007. Econometric measure of Housing Affordability. Available at https://www.kth.se/polopoly_fs/1.113631!/Menu/general/column-
content/attachment/361.pdf Accessed on 27/06/2015.
• Department of Human Settlements. 2009. National Housing Code, Volume1: Simplified Guide to the National Housing Code 2009.
• Diaz, A. & Luengo-Prado, M. J. 2008. On the User Cost and Home Ownership. Review of Economic Dynamics, Volume 11, pp. 584-613.
• Jewkess, M. & Deldadillo, L. (2010). Weaknesses of housing affordability indices used by practitioners. Journal of Financial Counselling and Planning,
Volume 21, pp. 43-52.
• Maclennan, D. & Williams, P. 1990. Affordable Housing in Britain and America. York: Rowntree Foundation.
• Maritz, N.G. 1993. The Property Business: Readings in real estate. Pretoria: University of South Africa.
• Moladi. 2018. Moladi Construction Technology. Online Available at http://www.moladi.net . Accessed on 26/08/2018.
References Used• National & Overseas Modular Construction. 2012. Prices. Online Available at https://noversea.co.za/modular-homes/prices/ . Accessed on
27/08/2018.
• National Home Builders’ Registration Council. 2018. Innovative Building Systems Database. Online available at https://www.nhbrc.org.za/innovative-
building-systems/ . Accessed on 26/08/2018.
• National Home Builders’ Registration Council 2009. Eric Molobi Housing Innovation Hub Brochure, 2009. Online Available at
http://www.nhbrc.org.za/files/nhbrc_final_brochuredec2009.pdf . Accessed on 28/08/2018.
• O’Sullivan, T. & Gibb, K. 2006. Housing Economics and Public Policy: Essays in honor of Duncan Maclennan. Oxford: Blackwell Publishing 2006.
• Quigley, J. M. & Raphael, S. 2003. Is Housing Affordable? Why Isn’t it more Affordable? Journal of Economic Perspectives, Volume 18, pp. 191-214.
• Robust Structure, 2018.The Robust Building System. Online Available at http://www.robuststructure.com/home.html accessed on 26/08/2018.
• Schmuecker, K. 2011. The Good, the Bad and the Ugly: Housing Demand 2025. Institute for Public Policy Research, Buckingham Street, London.
Available Online at https://www.ippr.org/publications/the-good-the-bad-and-the-ugly-housing-demand-2025. Accessed on 07/04/2015.
• Thalmann, P. 2003. ‘Housing Poor’ or simply ‘poor’. Journal of Housing Economics, Volume 12, pp. 291-317.

END