Household-Level Determinants of Soil and Water ... · seminated in the watershed by the government...
17
Household-Level Determinants of Soil and Water Conservation Adoption Phases: Evidence from North-Western Ethiopian Highlands Akalu Teshome 1,2 • Jan de Graaff 1 • Menale Kassie 3 Received: 17 December 2013 / Accepted: 18 November 2015 / Published online: 8 December 2015 Ó The Author(s) 2015. This article is published with open access at Springerlink.com Abstract Soil and water conservation (SWC) practices have been promoted in the highlands of Ethiopia during the last four decades. However, the level of adoption of SWC practices varies greatly. This paper examines the drivers of different stages of adoption of SWC technologies in the north-western highlands of Ethiopia. This study is based on a detailed farm survey among 298 households in three watersheds. Simple descriptive statistics were applied to analyze the stages of adoption. An ordered probit model was used to analyze the drivers of different stages of adoption of SWC. This model is used to analyze more than two outcomes of an ordinal dependent variable. The results indicate that sampled households are found in different phases of adoption, i.e., dis-adoption/non-adoption (18.5 %), initial adoption (30.5 %), actual adoption (20.1 %), and final adoption (30.9 %). The results of the ordered probit model show that some socio-economic and institutional factors affect the adoption phases of SWC differently. Farm labor, parcel size, ownership of tools, training in SWC, presence of SWC program, social capital (e.g., cooperation with adjacent farm owners), labor shar- ing scheme, and perception of erosion problem have a significant positive influence on actual and final adoption phases of SWC. In addition, the final adoption phase of SWC is positively associated with tenure security, culti- vated land sizes, parcel slope, and perception on SWC profitability. Policy makers should take into consideration factors affecting (continued) adoption of SWC such as profitability, tenure security, social capital, technical sup- port, and resource endowments (e.g., tools and labor) when designing and implementing SWC policies and programs. Keywords Adoption phases Soil and water conservation Ordered probit Ethiopia Africa Introduction Background and Research Objective The Ethiopian economy is heavily dependent on agricul- ture which is dominated by subsistence smallholder farm- ers that are partially integrated into markets. The fate of the agricultural sector directly affects economic development, food security, and poverty alleviation. However, the role of this sector in alleviating poverty and food insecurity is undermined by land degradation such as soil erosion and nutrient depletion (Bekele and Drake 2003; Taddese 2001; Tekle 1999). Over the last four decades, the government of Ethiopia and a consortium of donors have been promoting soil and water conservation (SWC) technologies for improving agricultural productivity, household food security, and rural livelihoods, while simultaneously mitigating envi- ronmental degradation. Smallholders’ agriculture in the country is nonetheless characterized by widespread failure to make adequate SWC and soil replenishment investments in order to sustain the productivity of farmlands (Shiferaw & Akalu Teshome akalu_fi[email protected]; akalu.fi[email protected] 1 Soil Physics and Land Management Group, University of Wageningen, P.O. Box 47, 6700 AA Wageningen, The Netherlands 2 Amhara Regional Agricultural Research Institute, P.O. Box ?527, Bahir Dar, Ethiopia 3 International Maize and Wheat Improvement Centre (CIMMYT), P. O. Box 1041, Village Market, Nairobi 00621, Kenya 123 Environmental Management (2016) 57:620–636 DOI 10.1007/s00267-015-0635-5
Transcript of Household-Level Determinants of Soil and Water ... · seminated in the watershed by the government...

Household-Level Determinants of Soil and Water ConservationAdoption Phases: Evidence from North-Western EthiopianHighlands
Akalu Teshome1,2 • Jan de Graaff1 • Menale Kassie3
Received: 17 December 2013 / Accepted: 18 November 2015 / Published online: 8 December 2015
� The Author(s) 2015. This article is published with open access at Springerlink.com
Abstract Soil and water conservation (SWC) practices
have been promoted in the highlands of Ethiopia during the
last four decades. However, the level of adoption of SWC
practices varies greatly. This paper examines the drivers of
different stages of adoption of SWC technologies in the
north-western highlands of Ethiopia. This study is based on
a detailed farm survey among 298 households in three
watersheds. Simple descriptive statistics were applied to
analyze the stages of adoption. An ordered probit model
was used to analyze the drivers of different stages of
adoption of SWC. This model is used to analyze more than
two outcomes of an ordinal dependent variable. The results
indicate that sampled households are found in different
phases of adoption, i.e., dis-adoption/non-adoption
(18.5 %), initial adoption (30.5 %), actual adoption
(20.1 %), and final adoption (30.9 %). The results of the
ordered probit model show that some socio-economic and
institutional factors affect the adoption phases of SWC
differently. Farm labor, parcel size, ownership of tools,
training in SWC, presence of SWC program, social capital
(e.g., cooperation with adjacent farm owners), labor shar-
ing scheme, and perception of erosion problem have a
significant positive influence on actual and final adoption
phases of SWC. In addition, the final adoption phase of
SWC is positively associated with tenure security, culti-
vated land sizes, parcel slope, and perception on SWC
profitability. Policy makers should take into consideration
factors affecting (continued) adoption of SWC such as
profitability, tenure security, social capital, technical sup-
port, and resource endowments (e.g., tools and labor) when
designing and implementing SWC policies and programs.
Keywords Adoption phases � Soil and water
conservation � Ordered probit � Ethiopia � Africa
Introduction
Background and Research Objective
The Ethiopian economy is heavily dependent on agricul-
ture which is dominated by subsistence smallholder farm-
ers that are partially integrated into markets. The fate of the
agricultural sector directly affects economic development,
food security, and poverty alleviation. However, the role of
this sector in alleviating poverty and food insecurity is
undermined by land degradation such as soil erosion and
nutrient depletion (Bekele and Drake 2003; Taddese 2001;
Tekle 1999).
Over the last four decades, the government of Ethiopia
and a consortium of donors have been promoting soil and
water conservation (SWC) technologies for improving
agricultural productivity, household food security, and
rural livelihoods, while simultaneously mitigating envi-
ronmental degradation. Smallholders’ agriculture in the
country is nonetheless characterized by widespread failure
to make adequate SWC and soil replenishment investments
in order to sustain the productivity of farmlands (Shiferaw
& Akalu Teshome
[email protected]; [email protected]
1 Soil Physics and Land Management Group, University of
Wageningen, P.O. Box 47, 6700 AA Wageningen,
The Netherlands
2 Amhara Regional Agricultural Research Institute,
P.O. Box ?527, Bahir Dar, Ethiopia
3 International Maize and Wheat Improvement Centre
(CIMMYT), P. O. Box 1041, Village Market,
Nairobi 00621, Kenya
123
Environmental Management (2016) 57:620–636
DOI 10.1007/s00267-015-0635-5

and Holden 1998, 1999; Bewket 2007; Tefera and Sterk
2010; Kassie et al. 2010). In some cases, farmers have dis-
adopted (abandoned) earlier adopted technologies (Shi-
feraw and Holden 1998; Tadesse and Kassa 2004; BoARD
2010). Moreover, farmers also modify or adapt the tech-
nology to their own real situations, among others by
reducing the area occupied by SWC line interventions (e.g.,
soil bunds or stone bunds along the contour lines to reduce
soil erosion).
A better understanding of constraints that condition
farmers’ adoption behavior is therefore important for
designing promising pro-poor policies that could stimulate
and sustain adoption of SWC and agricultural productivity.
A substantial literature has explored the adoption process
of SWC technologies in order to understand the failure to
make these critical investments (Ervin and Ervin 1982).
Most previous adoption studies in Ethiopia and elsewhere
(e.g., Tesfaye et al. 2013; Kassie et al. 2009; Tiwari et al.
2008; Bewket 2007; Shiferaw and Holden 1998) assumed
homogenous adopters (all adopters are at the same stage)
while farmers are at different stages of adoption. Adoption
analyses made without considering the different stages of
adoption in a complex farming system may underestimate
or overestimate the influences of various factors on the
decision to adopt. Like other technologies farmers pass
through different stages in adopting SWC measures and
also these measures are long-term investments which
require continuous maintenance. This suggests that it is
important to understand the different adoption phases (dis-
adoption/non-adoption, initial adoption, actual adoption,
and final adoption; defined in Table 1) instead of focusing
on binary adoption decision. In this paper, we study the
main institutional, socio-economic, and bio-physical dri-
vers for the different stages of adoption of SWC tech-
nologies in three watershed areas of north-western
Ethiopian highlands. The SWC technologies considered in
this study include soil bunds, Fanya juu bunds (made by
digging a trench and throwing the soil uphill to form an
embankment), and stone bunds.1
Soil and Water Conservation Practices in Ethiopia
The importance of soil conservation was largely neglected
in Ethiopia prior to 1974. The problem attracted the
attention of policy makers and international donors only
after the disastrous drought and famine of 1974. An effort
to halt the problem of soil erosion started after the Ethio-
pian government initiated massive soil conservation pro-
grams following the 1975 land reform. A large number of
conservation and afforestation projects were undertaken by
food-for-work (FFW) programs (Hurni 1988). This mas-
sive campaign in soil conservation under FFW did not
bring a wide dissemination and adoption of the practices by
farmers. This is because farmers constructed SWC prac-
tices during the campaign, but they had no interest to
implement or expand these without food for work (Shi-
feraw and Holden 1998). Most of the conservation mea-
sures were removed after the government changed in 1991
(Shiferaw and Holden 1998).
Between 1995 and 2009, soil conservation activities
have been undertaken as part of the agricultural extension
package of the present government through mass mobi-
lization with a top-down approach and without incentives
for the time farmers spent on SWC activities. The approach
was to construct conservation measures at individual level
but not at watershed level. Emphasis was given to the
quantity of measures rather than the quality of measures.
SWC is mainly limited to physical measures. Dis-adoption
and non-adoption of SWC measures were common phe-
nomena in this period. This indicates that the extension
system did not bring about behavioral changes among
farmers probably because the focus was on changing the
farmland rather than farmers’ behavior.
Since 2010, the government of Ethiopia has embarked
again on a massive SWC campaign. The current approach
is also mass mobilization, but then at watershed level. And
there is an attempt to make such SWC program more
participatory. In each watershed area, agricultural offices
along with local administrators organize a 15-day farmers’
workshop to create awareness about the problems of soil
erosion and its causes. During the workshop, farmers pri-
oritize their major natural resource problems, causes, and
possible solutions. Then, they reach consensus about the
natural resource problems that require collective action.
Farmers participate in SWC activities in nearby sub-wa-
tershed areas.
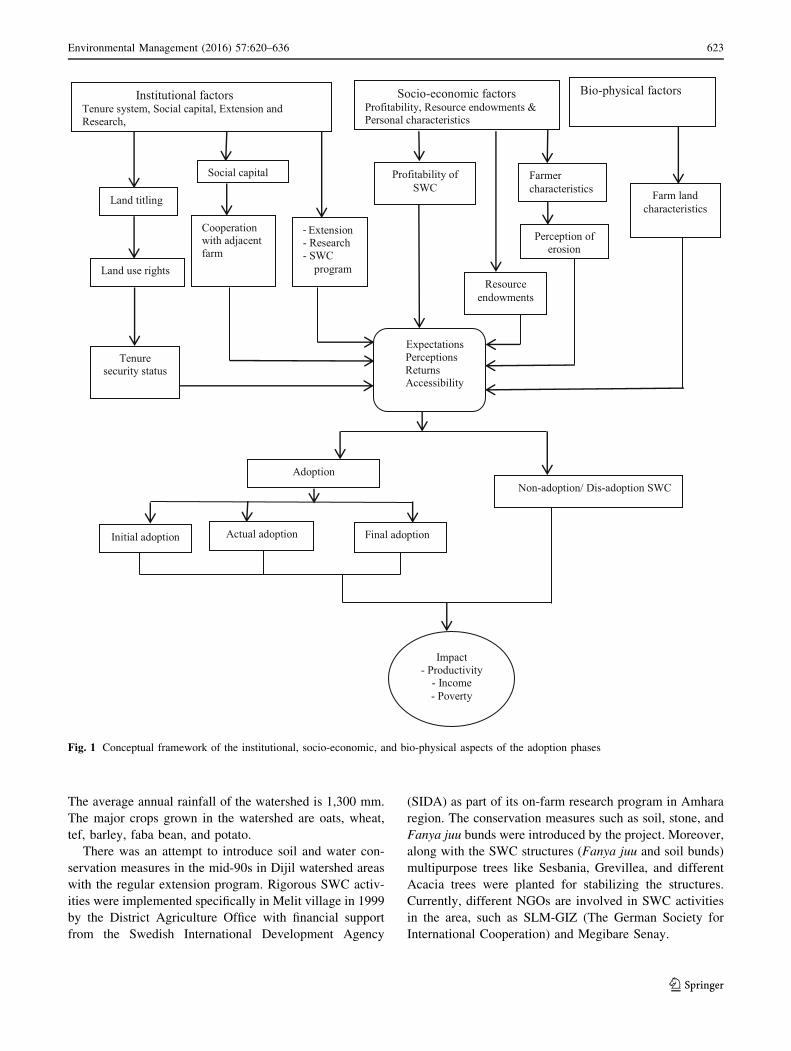
Conceptual Framework
Our conceptual framework is based on the adoption pro-
cess of investment in SWC measures (de Graaff et al.
2008) and on the concept of dis-adoption (abandonment)
of the earlier adopted technologies (Neill and Lee 2001).
This framework also incorporates important elements
from decision-making processes for the use of soil con-
servation practices (Ervin and Ervin 1982), property rights
and investment incentives (Besley 1995), and the role of
social capital (Foster and Rosenzweig 1995; Nyangena
2008; Njuki et al. 2008). This analytic framework
includes all major institutional and socio-economic
aspects of SWC (Fig. 1).
1 The three measures are not that different, they all three have the
same function: line interventions along the contour lines to reduce soil
erosion.
Environmental Management (2016) 57:620–636 621
123
Adoption is a sequential decision process and one could
distinguish three major phases, i.e., the acceptance phase,
the actual adoption phase, and the continued use phase (de
Graaff et al. 2008). The acceptance phase generally
includes the awareness, evaluation, and the trial stages and
eventually leads to starting investment in certain measures.
We will refer to this as the initial adoption phase, which is
basically a pilot phase in which farmers experiment with
SWC measures. The actual adoption phase is a stage
whereby SWC investments are already made on part of the
land since a few years, on more than a trial basis. The third
phase, final adoption, is a stage in which the existing SWC
measures are maintained over many years and farmers are
intrinsically motivated to expand these measures to
untreated plots. In addition, some farmers may dis-adopt
(or abandon) once-adopted technologies, while some
farmers will not adopt SWC measures at all for various
reasons. Therefore, there are four major categories in the
adoption process as defined below: initial adopters, actual
adopters, final adopters, and non-adopters/dis-adopters2
(Table 1).
Methodology
Description of Study Areas
The study was undertaken in three selected watersheds
(Debre Mewi, Anjeni, and Dijil watersheds) of East and
West Gojam Zones of Amhara Region, Ethiopia (Fig. 2).
These watersheds are part of the north-western highlands of
Ethiopia. The zones and the watersheds are selected pur-
posively because of their specific experience with SWC
development activities, and they differ in the extent of
SWC measures that have actually been implemented.
Moreover, the watersheds have diverse physical and socio-
economic characteristics (Table 2). Agricultural systems in
these watersheds are small-scale subsistence crop–live-
stock mixed farming systems.
Anjeni Watershed
This watershed is situated in Dembecha district of West
Gojam Zone at 260 km southeast of Bahir Dar. Anjeni lies
at 10.68�N and 37.53�E at an altitude of approximately
2450 m.a.s.l. The watershed covers an area of 113 ha. It is
home to 95 households. Anjeni receives an average annual
rainfall of around 1790 mm. The crops grown are barley,
tef, maize, wheat, faba bean, potato, niger seed (Guizotia
abyssinica), field pea, lupine, and linseed.
Soil and water conservation measures have a long his-
tory in this watershed. Fanya juu soil conservation bunds
were introduced in 1984 by the soil and water conservation
project (SCRP) which was initiated by Bern University of
Switzerland in collaboration with the Ethiopian Ministry of
Agriculture. The construction of bunds was done by local
communities without payment for individual participating
farmers. As an incentive, a health clinic was constructed by
the project to compensate for labor and material contri-
butions by the community. The Anjeni watershed has been
one of the six SWC research experimental stations of the
country. Moreover, SWC measures have also been dis-
seminated in the watershed by the government extension
program.
Digil Watershed
The Digil watershed is found in Gozamen district of East
Gojam Zone. It is located at 10.24�N and 37.43�E at an
altitude of approximately 2480 m.a.s.l. and 285 km
southwest of Bahir Dar. Dijil watershed (Melit, Enerata,
Yaya, and Yedenigia villages) covers an area of 936 ha.
The total number of households in the watershed is 628.
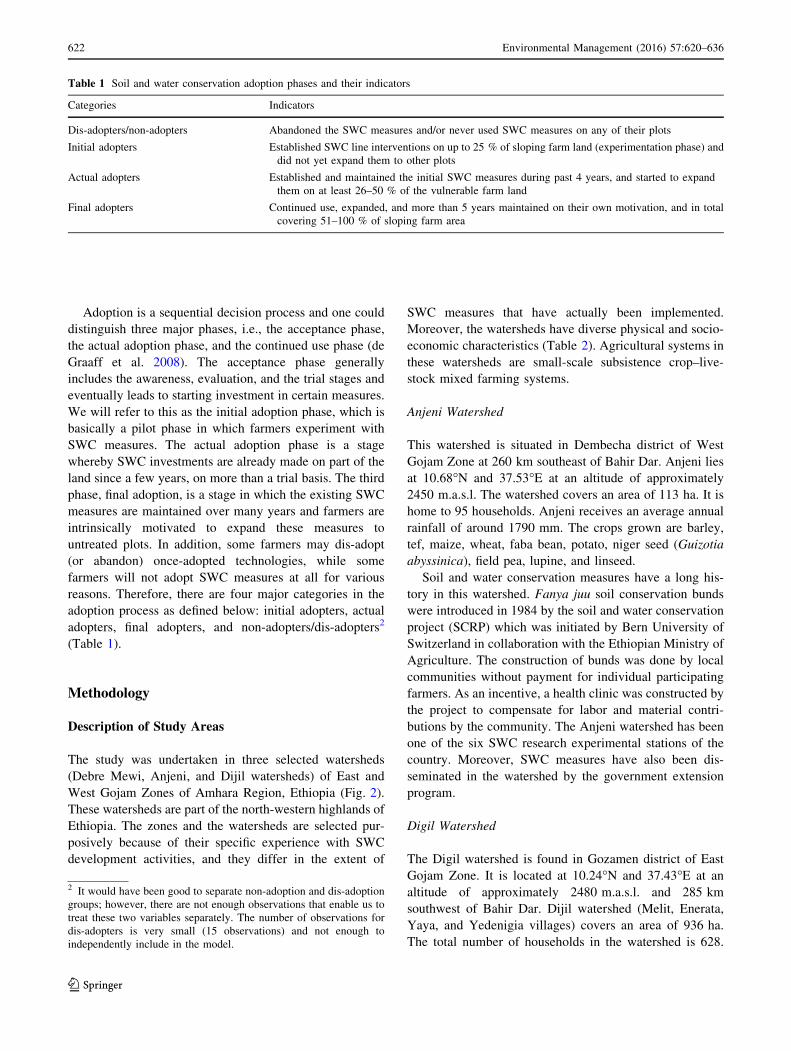
Table 1 Soil and water conservation adoption phases and their indicators
Categories Indicators
Dis-adopters/non-adopters Abandoned the SWC measures and/or never used SWC measures on any of their plots
Initial adopters Established SWC line interventions on up to 25 % of sloping farm land (experimentation phase) and
did not yet expand them to other plots
Actual adopters Established and maintained the initial SWC measures during past 4 years, and started to expand
them on at least 26–50 % of the vulnerable farm land
Final adopters Continued use, expanded, and more than 5 years maintained on their own motivation, and in total
covering 51–100 % of sloping farm area
2 It would have been good to separate non-adoption and dis-adoption
groups; however, there are not enough observations that enable us to
treat these two variables separately. The number of observations for
dis-adopters is very small (15 observations) and not enough to
independently include in the model.
622 Environmental Management (2016) 57:620–636
123
The average annual rainfall of the watershed is 1,300 mm.
The major crops grown in the watershed are oats, wheat,
tef, barley, faba bean, and potato.
There was an attempt to introduce soil and water con-
servation measures in the mid-90s in Dijil watershed areas
with the regular extension program. Rigorous SWC activ-
ities were implemented specifically in Melit village in 1999
by the District Agriculture Office with financial support
from the Swedish International Development Agency
(SIDA) as part of its on-farm research program in Amhara
region. The conservation measures such as soil, stone, and
Fanya juu bunds were introduced by the project. Moreover,
along with the SWC structures (Fanya juu and soil bunds)
multipurpose trees like Sesbania, Grevillea, and different
Acacia trees were planted for stabilizing the structures.
Currently, different NGOs are involved in SWC activities
in the area, such as SLM-GIZ (The German Society for
International Cooperation) and Megibare Senay.
Institutional factorsTenure system, Social capital, Extension and Research,
Land titling
Land use rights
Tenure security status
Social capital
Cooperation with adjacent farm
ExtensionResearchSWC program
Profitability of SWC
Resource endowments
Farmer characteristics
Perception oferosion
Farm land characteristics
Initial adoption
Non-adoption/ Dis-adoption SWC
ExpectationsPerceptionsReturnsAccessibility
Adoption
Impact- Productivity
- Income- Poverty
Bio-physical factors Socio-economic factorsProfitability, Resource endowments & Personal characteristics
Final adoptionActual adoption
Fig. 1 Conceptual framework of the institutional, socio-economic, and bio-physical aspects of the adoption phases
Environmental Management (2016) 57:620–636 623
123

Debre Mewi Watershed
This watershed is located in Yilmana Densa and Bahir Dar
Zuria districts of West Gojam Zone. It is located at
11.34�N and 37.43�E. It is situated at an altitude of about
2300 m.a.s.l. and receives an average annual rainfall of
about 1260 mm. The total area of the watershed is esti-
mated at 523 ha, and about 324 households are living in the
watershed. Major crops grown in the watershed are tef,
maize, barley, finger millet, wheat, faba bean, potato, grass
pea, and noug (Guizotia abyssinica).
In Debre Mewi areas, SWC measures were introduced in
1990s with the regular government extension program.
Different approaches have been followed to disseminate
SWC practices in the area. Before 2005, farmers were
participating in SWC programs through mass mobilization
with a top-down approach. The approach was not water-
shed based but it was Kebele based (the lowest adminis-
trative body). Thus, farmers constructed bunds for other
villages (at distance) in their Kebele. Some of the farmers
were not the beneficiaries of what they constructed. They
constructed bunds without incentives. Between 2005 and
Fig. 2 Map of study areas
Table 2 Socio-economic and physical characteristics of the study areas
Features Anjeni watershed Dijil watershed Debre Mewi watershed
Altitude (m.a.s.l) 2450 2480 2300
Average annual rainfall (mm) 1790 1300 1260
Dominant soil types Alisols, Nitosols, Regosols,
and Leptosols
Nitosols Vertic Nitosols, Nitosols,
and Vertisols
Degradation Degraded Very degraded Not heavily degraded
Dominant crop in farming systems Barley Oats Tef
Average number of TLU (tropical livestock units) per farm 5.2 6.0 4.6
Productivity Low Low High
Number of households 95 628 324
All weather road and transport access Poor Good Good
Availability of local market Yes No Yes
Distance to district market (Km) 20 8 12
SWC projects (exposure to SWC) SCRP (long term) SIDA; SLM-GIZ No specific project
Source: Aemro 2011; Tesfaye 2011; Zegeye 2009; Zeleke and Hurni 2001; own surveys
624 Environmental Management (2016) 57:620–636
123

2009, individual-level implementation rather than mass
mobilization of SWC was advocated. However, it was also
not effective. Currently, the watershed approach is being
used again through community mass mobilization. There is
an SWC experimental site in the Debre Mewi area which is
handled by Adet Research Centre in collaboration with the
SWHISA (Sustainable Water Harvesting and Institutional
Strengthening in Amhara) project since 2008. Adet
Research Centre and the District Agricultural Office are
involved in the dissemination of SWC measures in the
area. Although Debre Mewi is a high-production area, soil
erosion is now a severe problem. Currently, gully erosion is
threatening cultivated and grazing land in the watershed.
The common type of physical SWC measure introduced in
the area is soil bunds, and very recently also Fanya juu
bunds.
Sampling and Data Collection
The data for this study were obtained from 298 farm
households surveyed in the three watersheds in 2011 (ac-
tually the data were collected from 300 households, but
Table 3 Description and summary statistics of the variables used in the analysis
Variables Description Mean SD
Household characteristics and labor resources
Age Age of household heads (in years) 45.35 12.34
Family size Size of households (in numbers) 5.80 1.77
Farm labor Persons working fulltime in agriculture (it includes the hired laborer on annual base);(in numbers) 2.18 0.70
Distance from road Distance to main road from home (in walking minutes) 15.00 13.33
Land resources
Average parcel size Average parcel size (total farm size divided by the number of parcels); (in ha) 0.26 0.62
Cultivated land size Actual cultivated land size (it refers to the annual crop production area); (in ha) 1.03 0.50
Farm size Total area of farm (cultivated land, grazing land, woodland, and bare land); (in ha) 1.17 0.53
Flat slope Flat slope (1 if on average the slopes of parcels are flat (\10 %), 0 otherwise) 0.101 –
Moderate Slope Moderate slope (1 if on average the slopes of parcels are moderate steep (between 10 and 20 %), 0
otherwise)
0.515 –
Steep slope Steep slope (1 if on average the slopes of parcels are steep ([20 %), 0 otherwise) 0.383 –
Other resources
Size of iron roof1 Size of iron roof house (number of iron sheets) 55.54 20.72
Tools Ownership of tools (1 if the household has tools (e.g., shovels), 0 otherwise) 0.596 –
Off-farm income Average off-farm monthly income (in Birr2) 56.72 147.29
Institutions and social capital
Tenure security Perception of tenure security (1 if feeling secure, 0 otherwise) 0.802 –
SWC training Training in SWC measures (1 if the household got training on SWC, 0 otherwise) 0.361 –
SWC program Presence of SWC assisted program in the village/watershed in past/present (1 if there is an SWC
program, 0 otherwise)
0.547 –
Low cooperation Low cooperation with adjacent farm (1 if the extent of working together between adjacent farms in
erosion control is low, 0 otherwise)
0.243 –
Medium cooperation Medium cooperation with adjacent farm (1 if the extent of working together between adjacent
farms in erosion control is medium, 0 otherwise)
0.291 –
High cooperation High cooperation with adjacent farm (1 if the extent of working together between adjacent farms in
erosion control is high, 0 otherwise)
0.465 –
Formal position Executive bodies in formal associations (1 if the household has position in executive body, 0
otherwise)
0.088 –
Labor sharing
(assistance)
The number of participating farmers during labor-sharing activities (labor shortage periods like
weeding and harvesting); (numbers)
5.82 6.91
Perceptions
Erosion problems Perception on erosion problem (1 if erosion is perceived, 0 otherwise) 0.969 –
SWC profitability Perception on the profitability of SWC (1 if profitability is perceived, 0 otherwise) 0.979 –
1 Proxy variable for wealth. The size of an iron sheet is 2 9 0.75 m. The total size of an iron roof does not indicate the house size of the farm
household. It includes the veranda. The roofing design also affects the size of iron roof vis-a-vis the house size2 Birr is the unit of Ethiopian currency. It is equal to 0.059 Dollar (2011)
Environmental Management (2016) 57:620–636 625
123

two households could not recall the years on which they
constructed their bunds). The survey was conducted on a
one-to-one interview basis using a structured survey ques-
tionnaire. A pre-test survey was also conducted in order to
customize the questionnaire more to the situation in each
study site.
The enumerators were supervised by the first author of
the paper. The first author was in the field with the enu-
merators throughout the data collection period. The same
person also participated in data collection and conducted
group discussions to collect general information related to
SWC and the watersheds.
In the first stage of the sampling procedure, the watersheds
were selected purposely based on their SWC experience. In
the second stage, farmers from each watershed were selected
randomly from lists of all households in the watershed.A total
of 60, 125, and 113 farmers were selected randomly from
Anjeni, Dijil, and Debre Mewi watersheds, respectively. We
used a formula for selecting sample size, with farm size and
variation in farm size as determining factors. We found that
the farm size in Digil and Debre Mewi appeared to be more
skewed and therefore required a larger sample. The coefficient
of variation (CV) of farm size is 0.77, 1.11, and 1.06 for
Anjeni, Dijil and Debre Mewi, respectively.
The survey collected detailed information about house-
hold characteristics and labor resources, institutions and
social capital, household assets, land resources and plot
characteristics, and soil and water conservation (SWC)
investments (see Table 3 below).
Analytical Model
Some multinomial choice variables are inherently ordered,
for example the adoption phases of SWC measures (non-
adoption/dis-adoption, initial adoption, actual adoption,
and final adoption). In this case, although the outcome is
discrete, the multinomial logit or probit model would fail to
account for the ordinal nature of the dependent variable.
The use of the ordered probit is appropriate when the
dependent variable involves more than two alternatives that
must take a logical ordering form as it is in our case.
Following Greene (2003), the ordered probit model can
be determined by
y�i ¼ X0ibþ e i ¼ 1; . . .Nfarmer ; ð1Þ
where i refers to the observation (i.e., a farmer), y�i is a
latent variable (i.e., unobservable) that represents the
adoption phases of farmer i, Xi is a vector of socio-eco-
nomic and institutional variables including a constant, b is
a vector of parameters to be estimated, and e are the ran-
dom error terms assumed to be standard normal distributed.
Since y�i is latent (unobserved), we observe discrete
responses of the variable yi as follows:
yi ¼ 0 ðdis ðnon)-adoptersÞ if y�i � 0; ð2Þ
yi ¼ 1 ðinitial adoptersÞ if 0\y�i � l1; ð3Þyi ¼ 2 ðactual adoptersÞ if l1\y�i � l2; ð4Þ
yi ¼ 3 ðfinal adoptersÞ if l2\y�i � l3: ð5Þ
The lj s are unknown ordered threshold parameters to be
estimated with the unknown coefficients b. The probabilitythat the ordered dependent variable y takes the different
possible values is
prob ðy ¼ 0=XÞ ¼ / ð�X0bÞ; ð6Þ
prob ðy ¼ 1=XÞ ¼ / ðl1 � X0bÞ � / ð�X
0bÞ; ð7Þ
prob ðy ¼ 2=XÞ ¼ / ðl2 � X0bÞ � / ðl1 � X
0bÞ; ð8Þ
prob ðy ¼ 3=XÞ ¼ / ðl3 � X0bÞ � / ðl2 � X
0bÞ; ð9Þ
where / indicates a cumulative normal distribution. The
cut-points lj divide the categories of the dependent
variable.
The marginal effect is used to determine the influences
of the independent variable per unit change on the depen-
dent variable while everything else is constant. Computa-
tion of marginal effects is meaningful for the ordered probit
model because estimated parameter coefficients do not
represent the magnitudes of the effects of independent
variables on the categories of dependent variable. There-
fore, the marginal effects of changes in the regressors are
o prob ðy ¼ 0=XÞoX
¼ �/ ðX 0bÞb; ð10Þ
o prob ðy ¼ 1=XÞoX
¼ ½/ ð�X0bÞ � / ðl1 � X
0bÞ�b; ð11Þ
o prob ðy ¼ 2=XÞoX
¼ ½/ ðl1 � X0bÞ � / ðl2 � X
0b�b;
ð12Þo prob ðy ¼ 3=XÞ
oX¼ ½/ ðl2 � X
0bÞ � / ðl3 � X
0b�b:
ð13Þ
The parameter of the ordered probit model is estimated
by the maximum likelihood method. We report the mar-
ginal effects of the variables.
Review of Major Variables
Adoption phases (dependent variables) are categorized in
this study based on the extent of implementation of SWC
measures on the farms and the age of SWC measures
(Table 1). The key socio-economic and institutional vari-
ables expected to influence the investments in SWC mea-
sures that were investigated in this study are household
characteristics and labor resources, land and other
626 Environmental Management (2016) 57:620–636
123

resources, institutions and social capital, and perceptions of
farmers (Table 3). Some of these variables are briefly
discussed below.
The establishment and maintenance of SWC measures is
labor intensive. Consequently, the availability of farm
labor at the household level affects the adoption of SWC
(Neill and Lee 2001). Households with a large amount of
farm labor are probably better able to provide the labor
required for the construction and maintenance of SWC
measures (Tenge et al. 2005).
SWC investments are determined by qualities and
quantities of land resources (Amsalu and de Graaff 2007).
The average parcel size provides an indication of the
fragmentation of farm land. Land fragmentation may
weaken farmer’s interest and motivation for investing in
SWC practices. In addition, the total cultivated land, which
refers to the annual crop production area, can influence
investment in SWC as well. This is because the opportunity
cost3 of the cultivated land lost due to the width of con-
servation measures may be greater than the benefits of
SWC structures especially for small farmers (Hengsdijk
et al. 2005).
Tenure security influences the propensity to invest in
SWC (Gebremedhin and Swinton 2003). Tenure security
measures the perception of not running the risk of losing
land at some time in the future. Investment is undertaken
when the household is assured that it will reap the benefits
for a considerable time period. In addition, project-sup-
ported SWC intervention programs are likely to influence
the adoption of SWC measures (Posthumus et al. 2010).
Project-supported interventions generally have ample
resources and incentives for SWC.
Investment behavior of farmers is also shaped by the level
and type of social capital (Nyangena 2008). This is because
the social capital/social network influences farmers’ col-
laboration, preferences, transaction costs, and information
exchange (Grootaert et al. 2004; Lapple andRensburg 2011).
Continued use of SWC measures is influenced by the coop-
eration and willingness of the adjacent farm owners to
(construct and) maintain SWC measures. This is because
there is a strong physical interdependency between adjacent
farms with respect to hydrology and soil erosion. This aspect
highlights the social components of SWC measures. The
availability of labor through labor sharing (assistance) gives
a chance to relax labor constraints of SWC investments
(Mbaga-Semgalawe and Folmer 2000).
The perception of the economic significance of soil
erosion and SWC is also important for the adoption of
SWC measures. Farmers’ decisions pertaining to SWC are
largely determined by their knowledge of the problems
(Amsalu and de Graaff 2006). Moreover, the perception of
the marginal net benefits must be greater than the marginal
cost of SWC investment in order to undertake and maintain
the SWC investment.
Empirical Results
Data and Descriptive Statistics
The results of the descriptive analysis indicate that sample
households are found in different stages of adoption
(Table 4). Among the sample households, initial adopters
(30.5 %) and final adopters (30.9 %) form the largest
groups. Most of the initial adopters have implemented
SWC measures in the last 2 years. About 21.2 and 18.5 %
of the sample households fall under actual adopter and non-
adopter/dis-adopter categories. Reasons for dis-adoption
(according to farmers) are as follows: measures were built
by mass mobilization without farmers’ willingness, lack of
cooperation with adjacent farm owners (low social capital),
free grazing, difficult for oxen plowing, and reduction of
cultivable land.
Information on the adoption process of SWC technolo-
gies in Debre Mewi watershed was gathered during an
interview which was held with a key informant (the
chairman of the farmers’ research group). The practice of
stone and soil bunds’ construction was first introduced in
the watershed in 1996–97. According to the chairman, the
first attempts were based on campaign work and did neither
aim at nor succeed in raising awareness about the problem
of soil erosion. People were forced to partake in these
programs. As a consequence, some farmers refused to
implement introduced SWC measures on their farms. The
chairman further claimed that today all farmers see the
different types of terraces as being beneficial for their
production. However, they supposedly fail to construct
them because of a lack of tools, limited technical assis-
tance, free grazing, and a lack of cooperation between
farmers of neighboring fields.
The high percentage of farmers (81.6 %) involved in
SWC does not mean that so much land is protected with
SWC measures. There is a large difference in the intensity
of SWC adoption among adopter categories.
There is also a large difference among the adopter cat-
egories across the watersheds. Almost all households in
Anjeni are already final adopters of SWC practices. This is
the result of long-term SWC project interventions in the
area. In addition, bio-physical factors and social capital
may have influenced the adoption of SWC measures. On
the other hand, more non-adopters/dis-adopters are found
in the Debre Mewi watershed. This is probably because of
limited project-assisted SWC interventions compared to
3 The benefits that an individual could have received by taking an
alternative action.
Environmental Management (2016) 57:620–636 627
123
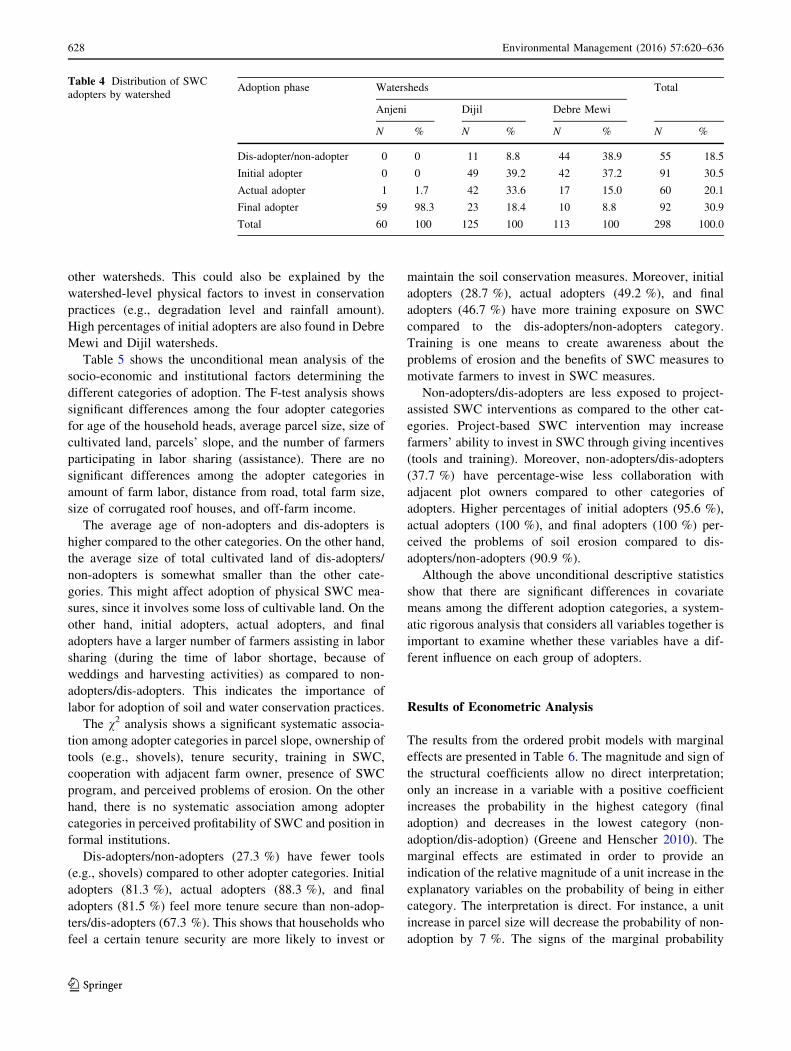
other watersheds. This could also be explained by the
watershed-level physical factors to invest in conservation
practices (e.g., degradation level and rainfall amount).
High percentages of initial adopters are also found in Debre
Mewi and Dijil watersheds.
Table 5 shows the unconditional mean analysis of the
socio-economic and institutional factors determining the
different categories of adoption. The F-test analysis shows
significant differences among the four adopter categories
for age of the household heads, average parcel size, size of
cultivated land, parcels’ slope, and the number of farmers
participating in labor sharing (assistance). There are no
significant differences among the adopter categories in
amount of farm labor, distance from road, total farm size,
size of corrugated roof houses, and off-farm income.
The average age of non-adopters and dis-adopters is
higher compared to the other categories. On the other hand,
the average size of total cultivated land of dis-adopters/
non-adopters is somewhat smaller than the other cate-
gories. This might affect adoption of physical SWC mea-
sures, since it involves some loss of cultivable land. On the
other hand, initial adopters, actual adopters, and final
adopters have a larger number of farmers assisting in labor
sharing (during the time of labor shortage, because of
weddings and harvesting activities) as compared to non-
adopters/dis-adopters. This indicates the importance of
labor for adoption of soil and water conservation practices.
The v2 analysis shows a significant systematic associa-
tion among adopter categories in parcel slope, ownership of
tools (e.g., shovels), tenure security, training in SWC,
cooperation with adjacent farm owner, presence of SWC
program, and perceived problems of erosion. On the other
hand, there is no systematic association among adopter
categories in perceived profitability of SWC and position in
formal institutions.
Dis-adopters/non-adopters (27.3 %) have fewer tools
(e.g., shovels) compared to other adopter categories. Initial
adopters (81.3 %), actual adopters (88.3 %), and final
adopters (81.5 %) feel more tenure secure than non-adop-
ters/dis-adopters (67.3 %). This shows that households who
feel a certain tenure security are more likely to invest or
maintain the soil conservation measures. Moreover, initial
adopters (28.7 %), actual adopters (49.2 %), and final
adopters (46.7 %) have more training exposure on SWC
compared to the dis-adopters/non-adopters category.
Training is one means to create awareness about the
problems of erosion and the benefits of SWC measures to
motivate farmers to invest in SWC measures.
Non-adopters/dis-adopters are less exposed to project-
assisted SWC interventions as compared to the other cat-
egories. Project-based SWC intervention may increase
farmers’ ability to invest in SWC through giving incentives
(tools and training). Moreover, non-adopters/dis-adopters
(37.7 %) have percentage-wise less collaboration with
adjacent plot owners compared to other categories of
adopters. Higher percentages of initial adopters (95.6 %),
actual adopters (100 %), and final adopters (100 %) per-
ceived the problems of soil erosion compared to dis-
adopters/non-adopters (90.9 %).
Although the above unconditional descriptive statistics
show that there are significant differences in covariate
means among the different adoption categories, a system-
atic rigorous analysis that considers all variables together is
important to examine whether these variables have a dif-
ferent influence on each group of adopters.
Results of Econometric Analysis
The results from the ordered probit models with marginal
effects are presented in Table 6. The magnitude and sign of
the structural coefficients allow no direct interpretation;
only an increase in a variable with a positive coefficient
increases the probability in the highest category (final
adoption) and decreases in the lowest category (non-
adoption/dis-adoption) (Greene and Henscher 2010). The
marginal effects are estimated in order to provide an
indication of the relative magnitude of a unit increase in the
explanatory variables on the probability of being in either
category. The interpretation is direct. For instance, a unit
increase in parcel size will decrease the probability of non-
adoption by 7 %. The signs of the marginal probability
Table 4 Distribution of SWC
adopters by watershedAdoption phase Watersheds Total
Anjeni Dijil Debre Mewi
N % N % N % N %
Dis-adopter/non-adopter 0 0 11 8.8 44 38.9 55 18.5
Initial adopter 0 0 49 39.2 42 37.2 91 30.5
Actual adopter 1 1.7 42 33.6 17 15.0 60 20.1
Final adopter 59 98.3 23 18.4 10 8.8 92 30.9
Total 60 100 125 100 113 100 298 100.0
628 Environmental Management (2016) 57:620–636
123

effects can only change once when moving from the
smallest category to the largest one.
The highest categories (i.e., actual and final adoption
phases) are discussed in detail in this paper. The results of
the first and the second categories are almost the same.
This is due to bell-shaped density functions of the standard
normal and the logistic distribution.
The v2 results show that likelihood ratio statistics are
highly significant (P\ 00001) suggesting that the model
has a strong explanatory power. Endogeneity bias (casual
Table 5 Descriptive statistics of the explanatory variables for the adoption of SWC line interventions
Variables Mean/percentages proportion of adopter category F/v2 valuea
Initial adopter
(N = 91)
Actual adopter
(N = 60)
Final adopter
(N = 92)
Non-adopter/
dis-adopter (N = 55)
Household characteristics and labor resources
Age 43.51 43.28 45.55 50.32 0.005***
Family size 5.79 5.83 5.98 5.58 0.606
Farm labor 2.14 2.18 2.30 2.03 0.141
Distance from road 13.57 14.26 16.96 15.23 0.362
Land resources
Average parcel size 0.19 0.24 0.29 0.23 0.001***
Cultivated land 0.94 1.19 1.11 0.89 0.001***
Farm size 1.08 1.27 1.20 1.15 0.157
Parcel slope
Flat 11.0 1.7 4.3 27.3 0.001***
Medium 45.0 61.0 50.0 54.5 0.268
Steep 44.0 37.3 45.7 18.2 0.005***
Other resources
Size of iron roof 56.7 57.1 53.3 55.1 0.640
Tools
Yes 54.9 70.0 76.1 27.3 0.001***
Off-farm income 72.6 34.3 49.9 66.7 0.423
Institutions and social capital
Tenure security
Yes 81.3 88.3 81.5 67.3 0.037**
SWC training
Yes 28.6 49.2 46.7 16.7 0.001***
SWC program
Yes 41.2 70.0 85.9 9.1 0.001***
Cooperation
High 40.4 42.4 67.0 26.4 0.001***
Medium 24.7 33.9 26.4 35.8 0.394
Low 34.8 23.7 6.6 35.8 0.001***
Formal position
Yes 13.2 6.8 9.9 1.9 0.119
Labor sharing (assistance) 5.9 6.1 7.1 3.4 0.022**
Perceptions
Erosion problems
Yes 95.6 100 100 90.9 0.007***
SWC profitability
Yes 97.8 96.7 100 96.3 0.361
*, **, *** Significant at 10, 5, and 1 % level of significance, respectivelya F-test is used to compare the means’ difference of more than two continuous variables, but v2 test is used to measure an association between
discrete variables
Environmental Management (2016) 57:620–636 629
123

relation) is suspected between tenure security and invest-
ments (initial, actual, and final adoptions). Thus, an endo-
geneity test is undertaken. To investigate the relationship
between investment and tenure security, we used a simul-
taneous probit equation model which consists of two
simultaneous binary choice equations. The estimation
procedure comprises the following steps: First, the reduced
form of tenure security (exogenous variable) is estimated
and then its predicted value obtained. Second, the predicted
value of tenure security is used as a regressor in the
investment (all adopter categories) equation. The process is
repeated for the tenure security equation using the pre-
dicted value of investment (adoption). Two-stage probit
estimation results reveal that tenure security is an important
factor that affects the probability of investing in soil con-
servation technologies. However, the reverse relation is
Table 6 Ordered probit results of adoption phases of SWC
Variable Ordered probit Marginal effects
Coef. Robust
std. err.
Pro (yi = 0)
(non-
adopter)
Pro (yi = 1)
(initial adopter)
Pro (yi = 2)
(actual adopter)
Pro (yi = 3)
(final adopter)
Household characteristics and labor resources
Age -0.01 0.01 0.01 0.01 -0.01 -0.01
Family size -0.02 0.04 0.01 0.01 -0.01 -0.01
Farm labor 0.31** 0.13 -0.05** -0.08 0.03** 0.01*
Distance from road 0.00 0.01 -0.01 -0.01 0.01 0.01
Land resources
Average parcel size 0.47*** 0.16 -0.07*** -0.12*** 0.05** 0.14***
Cultivated land size 0.16* 0.09 -0.02* -0.04 0.02 0.05*
Farm size -0.17* 0.09 0.02* 0.04* -0.02* -0.05*
Flat slope -0.53* 0.28 0.10 0.10*** -0.07 -0.13**
Steep slope 0.08 0.16 -0.01 -0.02 0.01 0.02
Other resources
Size of iron roof -0.01 0.00 0.01 0.01 0.01 -0.01
Tools 0.44*** 0.17 -0.07** -0.11*** 0.05** 0.13***
Off-farm income -0.00 0.00 0.01 0.01 -0.01 -0.01
Institutions and social capital
Tenure security 0.33* 0.19 -0.06 -0.07** 0.04 0.09*
SWC training 0.33* 0.17 -0.05** -0.08 0.03* 0.10**
SWC program 1.15*** 0.19 -0.19*** -0.24*** 0.11*** 0.32***
Medium cooperation 0.02 0.20 -0.01 -0.01 0.01 0.01
High cooperation 0.43** 0.18 -0.06** -0.11* 0.04* 0.13**
Formal position 0.31 0.24 -0.04 -0.01 0.02* 0.10
Labor sharing (assistance) 0.03*** 0.01 -0.01*** -0.01*** 0.01*** 0.01***
Perceptions
Erosion problems 1.21*** 0.41 -0.19*** -0.07 0.19*** 0.21***
SWC profitability 0.56 0.34 -0.12 -0.10*** 0.08 0.13**
Cut1 2.23*** 0 .64
Cut2 3.60*** 0.64
Cut3 4.38*** 0.65
Number of observations = 272
Wald v2 (21) = 194.48
Prob[ v2 = 0.0000
Pseudo R2 = 0.2489
Log pseudo-likelihood = -277.58386
*, **, *** Significant at 10, 5, and 1 % level of significance, respectively
630 Environmental Management (2016) 57:620–636
123

insignificant. This shows that there is a uni-directional
causal-effect relationship between investments and tenure
security. The reason may be that during the previous
redistribution, investments did not guarantee tenure secu-
rity and most farmers have lost what they invested and
were denied of their rights to compensation and payments
for their investment. Investments may influence tenure
security in flexible indigenous and customary land tenure
systems. The same step was applied to investigate the
relation between investment and ownership of tools (e.g.,
shovels). There is also a uni-directional causal-effect
relationship between investment and ownership of tools
(e.g., shovels).
Non-adoption/Dis-adoption and Initial Adoption
Phases
The study shows that the non-adoption/dis-adoption of
SWC practices is higher when there is a decrease of the
farm labor, average parcel size, and cultivated land size.
Lack of tools and SWC training and lower degree of
cooperation with adjacent farm are also the major reasons
for non-adoption/dis-adoption of SWC. In addition, low
level of perception about the erosion problems also con-
tributes to non-adoption/dis-adoption of SWC practices.
The initial adoption phase is also influenced by a
decrease of parcel size, lack of tools, absence of tenure
security, absence of SWC program, low cooperation with
adjacent farms, decreasing labor assistance, and low per-
ception of SWC profitability.
Actual and Final Adoption Phases
Some variables are equally important for the actual and
final adoption phases of SWC. Farm labor, average parcel
size, ownership of tools (e.g., shovels), training in SWC,
presence of SWC assisted program, cooperation with
adjacent farm owners, labor sharing (assistance), and per-
ception of erosion problem have a positive and significant
influence on actual and final adoption phases of SWC.
These factors are important for a farmer to decide whether
to go from the initial phase to the actual and final adoption
phases.
The amount of farm labor has an influence on the
actual and continued use of SWC measures. This suggests
that households who have more persons fulltime involved
in agriculture are more likely to invest in and maintain
SWC measures. This can be explained by the fact that
labor inputs constitute the largest cost factors for SWC
line interventions. In addition, the average parcel size
positively influences the actual and final adoption phases.
The result suggests that a unit increase in parcel size
results in a 5 % increase in the probability of actual
adoption and a 14 % increase in the final adoption of
SWC. On average, the households managed 4.5 parcels
(total farm size divided by average parcel size (Table 3).
Managing 4.5 parcels each at some distance from each
other is cumbersome.
Ownership of tools needed for the construction of SWC
measures (e.g., shovels) is found to have a significant and
positive influence on actual and final adoption stages of
SWC measures. The result of the marginal effect suggests
that farmers who have SWC equipment are more probably
to be actual (5 %) and final (13 %) adopters. This is
because the availability of (conservation) tools is a pre-
requisite for construction and maintenance of SWC
measures.
The presence of SWC assisted programs has a signifi-
cantly positive influence on the actual and final adoption
stages of SWC. SWC project-assisted farmers are 11 and
32 % more likely to belong to actual and final adoption
phases of SWC, respectively. This shows the importance of
project-assisted SWC interventions for diffusion and
adoption of soil and water conservation measures. Projects
generally provide training, tools, and knowledge to
implement SWC measures.
Training on SWC is positively related to the actual and
final adoption phases of SWC measures. The marginal
effect confirms that farmers who received trainings on
SWC are 3 and 10 % more likely to fall in actual and final
adoption phases of SWC, respectively. Training (e.g.,
training delivered by the Agricultural Office) is one means
to create awareness about the problems of erosion and the
benefits of SWC measures to motivate farmers to invest in
SWC measures.
Cooperation with adjacent farm owners in erosion con-
trol has also a positive influence on actual and final
adoption stages of SWC. The result of the marginal effect
indicates that farmers who have a high degree of cooper-
ation with adjacent farm owners are more likely to be
actual (4 %) and final (13 %) adopters. This shows the role
of social components of SWC measures and particularly
the importance of cooperation and willingness of neigh-
boring farmers for the construction of SWC measures.
In addition, the number of farmers participating in labor-
sharing (assistance) scheme influences the actual and final
adoption phases of SWC measures. This suggests that
farmers who work together with many farmers in their
labor-sharing activities (during labor shortage time) are
more likely to replicate and continue the use of SWC
measures. Labor sharing is a way of smoothing labor
constraints through social networks in rural areas of
Ethiopia. In addition, the perception of the economic sig-
nificance of erosion is positively related to the actual and
final adoption phases of SWC. The marginal effect shows
that farmers who perceive the problem of erosion are 19
Environmental Management (2016) 57:620–636 631
123

and 21 % more likely to belong to actual and final adoption
phases of SWC, respectively.
Final Adoption Phase
The study results show that the final adoption phase is
specifically influenced by different factors. The effect of
cultivated land size is found to be positive and significant
(P\ 0.10) on the final adoption phase of SWC. The result
of the marginal effect indicates that a unit increase in
cultivated land would increase the probability of the con-
tinued use of SWC measures by 5 %. This is because the
potential loss of land for SWC and temporal yield decline
do not constrain the adoption of SWC for large holdings.
The slope degree of parcels influences the final adoption
stage of SWC measures and is statistically significant. The
finding illustrates that farmers who operate on fields with
gentle slope are 13 % less likely to invest, replicate, and
maintain SWC technologies. This may be explained by the
positive relationships between slope level and severity of
soil erosion. (Amsalu and de Graaff 2007; Anley et al.
2007).
Farmers’ perceived profitability of SWC measures has a
positive (P\ 0.01) influence on the final adoption phase of
SWC measures. The marginal effect indicates that farmers
who perceive SWC measures to be profitable are 13 %
more likely to maintain SWC measures. This is because
financially viable SWC measures encourage adoption
(continued use) of SWC measures.
Tenure security is positively (P\ 0.10) related to the
final adoption phase of SWC. More specifically, the result
of the marginal effect shows that tenure security signifi-
cantly increases the likelihood of final adoption of SWC by
a margin of 9 %. This result is consistent with findings of
other studies (Neill and Lee 2001; Soule et al. 2000). On
the other hand, total farm size, a proxy variable of wealth,
has a negative influence on the final adoption phase of
SWC measures. A unit increase in the total farm size
reduces the probability of maintaining SWC measures by
5 %. This is because wealthy farmers may focus on other
income-generating activities and they may give less
attention to SWC measures.
We made a rerun of the model excluding the dis-adopter
group (i.e., only considering the non-adopter groups), and
the results are presented in Appendix 1. The estimates are
quite similar except cultivated land size and farm size
variables.
For a robustness check, we have run multinomial
logistic regression, the results of which are shown in
Appendix 2. The estimates of the two models (ordered and
multinomial) are almost similar.
Discussion
As mentioned earlier, the adoption of SWC measures is a
sequential process. The factors that influence (the stages of)
adoption are highly context specific, which makes gener-
alizations difficult (de Graaff et al. 2008; Lapar and Pandey
1999). Moreover, cooperation between several different
types of actors is a key to successful innovation (Klerkx
and Leeuwis 2009). This is because complex technologies
are developed and disseminated by innovation networks
(Ekboir 2003).
This study found that final adoption depends mostly on
the size of a parcel, the size of cultivable land (land frag-
mentation), resource endowments (labor and tools), tenure
security, technical support (availability of training and
SWC program), perceived erosion problems, and prof-
itability of SWC and social capital.
On average, the sample households managed 4.5 parcels
(Table 3). This study shows that land fragmentation neg-
atively influences the continued adoption of SWC, sug-
gesting that farmers who have a smaller parcel size and/or
fragmented parcels are less likely to invest in and maintain
SWC measures. This is probably because it increases the
transaction cost for investments, which is in line with
previous findings (Gebremedhin and Swinton 2003; Tenge
et al. 2004; Sklenicka et al. 2014).
The study further revealed that technical support
(availability of training and SWC programs) and resource
endowments (farm labor) influenced the continued use of
SWC measures. This is because these interventions are
knowledge and labor intensive. These results are consistent
with the findings of Bekele and Drake (2003), Posthumus
et al. (2010), and Adimassu et al. (2012).
Tenure security is important to undertake long-term land
improvement investments (Besley 1995). Our result is
consistent with findings of Neill and Lee (2001) in
Northern Honduras, Gavian and Fafchamps (1996) in
Nigeria, and Gebremedhin and Swinton (2003) in the
Tigray region of North Ethiopia. Conversely, Holden and
Yohannes (2002) revealed that tenure insecurity had in
Southern Ethiopia no negative effect on long-term invest-
ment. This difference could be explained by the differences
in socio-economic and land redistribution experiences
between Amhara and Southern regions.
The significance of farmers’ perception of how soil
erosion affects their land productivity indicates that high
awareness about soil erosion problems is crucial to increase
the likelihood of adoption of SWC measures. Amsalu and
de Graaff (2006) and Ervin and Ervin (1982) found similar
results. Perceived profitability is also important in the
adoption of SWC. Bunds have an effect on crop produc-
tivity (Nyssen et al. 2007). Promoting technologies that
632 Environmental Management (2016) 57:620–636
123
increase the productivity and income of farmers is there-
fore important to speed up the adoption process. This result
is consistent with findings of Cary and Wilkinson (1997)
and Amsalu and de Graaff (2007).
Cooperation with adjacent farm owners in erosion con-
trol is important for the continued adoption of SWC. There
is a strong physical interdependency between adjacent
farms with respect to hydrology and soil erosion. This
result is in line with findings of Beekman and Bulte (2012)
in Burundi.
Conclusions
A better understanding of factors affecting adoption
behavior is vital for designing promising pro-poor policies
that could stimulate and sustain adoption of SWC. In this
study, the adoption process of SWC measures is catego-
rized into four major phases, i.e., non-adoption/dis-adop-
tion, initial adoption, actual adoption, and final adoption.
The study indicates that sample households find themselves
in different phases of adoption due to different institutional
and socio-economic factors. Among other things, these
findings indicate that adoption studies should not only
focus on the classic comparison between adopter and non-
adopter categories, but rather investigate the adoption
process of SWC measures at different phases of adoption.
The study shows that the non-adoption/dis-adoption and
initial adoption of SWC are mainly due to land fragmen-
tation, lack of technical support and resource endowment,
low social capital, and low level of perception of erosion
problems and profitability of SWC.
The results of the study indicate that availability of labor
is very important for the actual and final adoption phases of
SWC. Specifically, the maintenance costs for the final
adoption stage are very important. This implies that con-
servation structures need to be made less labor demanding
by reducing the maintenance costs, i.e., by stabilizing
bunds through biological measures. The study results also
indicate that ownership of tools (e.g., shovels) and project
assistance for SWC interventions are very important fac-
tors that affect the actual and final adoption phases of
SWC. This implies that there is a need for technical support
and resources (tools for SWC measures) for farmers to
increase their investment capacity and know-how in order
to facilitate the adoption process.
In addition, the study reveals that social capital specif-
ically cooperation with adjacent farm owners is a key
factor for the actual and final adoption phases of SWC.
This means that conservation on one farm will have little
spill-over impact when farm land on adjacent farm areas is
not conserved. This implies that the adjacent farm owners
need to work together to avert the problems of erosion.
Thus, a watershed approach applied at community level is
the remedy for the problems of cooperation between
adjacent farms. With a watershed approach, SWC mea-
sures are implemented more comprehensively at commu-
nity level. The average parcel size is also influencing the
actual and final adoption stages positively. The average
parcel size is an indication of the fragmentation of the farm
parcels. On dispersed and fragmented small parcels, the
cost of investing in SWC measures may be excessive.
Either land consolidation or alternative SWC measures are
important to enhance the productivity of farm land.
The final adoption phase of SWC is positively associ-
ated with cultivated land size and farmers’ perceived
profitability of SWC measures. Thus, investigation of the
economic efficiency of the different SWC measures under
different circumstances is of paramount importance to
select feasible measures. In addition, the results of the
analysis show that tenure security is an important factor
that affects the final adoption phase of SWC. Secure land
rights increase the planning horizon of farmers to under-
take long-term investments. Therefore, the land policies
should provide long-term and lasting tenure security to the
farmers.
The overall results of this empirical analysis indicate
that institutional and socio-economic factors functioning at
national, regional, watershed, village, farm, and household
level play a strong role in shaping farmers’ investment
behavior at the different phases of SWC adoption. Thus,
policy makers should take into consideration the factors
affecting adoption (continued) of SWC such as profitabil-
ity, tenure security, social capital, technical support, and
resource endowments (e.g., tools and labor) when design-
ing and implementing SWC policies and programs.
Acknowledgments This research was funded by NUFFIC
(Netherlands Universities Foundation for International Cooperation).
We are very grateful to the farmers who cooperated during the
research survey. We would also like to thank the Amhara Regional
Agricultural Research Institute for providing logistical support.
Open Access This article is distributed under the terms of the
Creative Commons Attribution 4.0 International License (http://crea
tivecommons.org/licenses/by/4.0/), which permits unrestricted use,
distribution, and reproduction in any medium, provided you give
appropriate credit to the original author(s) and the source, provide a
link to the Creative Commons license, and indicate if changes were
made.
Environmental Management (2016) 57:620–636 633
123

Appendix
See Tables 7 and 8.
Table 7 Ordered probit results of adoption phases of SWC excluding the dis-adopter group
Variable Ordered probit Marginal effects
Coef. Robust
std. err.
Pro (yi = 0)
(non-
adopter)
Pro (yi = 1)
(initial adopter)
Pro (yi = 2)
(actual adopter)
Pro (yi = 3)
(final adopter)
Household characteristics and labor resources
Age -0.01 0.01 0.01 0.01 -0.01 -0.01
Family size -0.02 0.04 0.01 0.01 -0.01 -0.01
Farm labor 0.37*** 0.13 -0.04** -0.11*** 0.03** 0.12*
Distance from road 0.00 0.01 -0.01 -0.01 0.01 0.01
Land resources
Average parcel size 0.51*** 0.16 -0.05*** -0.14*** 0.04** 0.16***
Cultivated land size 0.11 0.01 -0.01 -0.03 0.01 0.04
Farm size -0.13 0.09 0.01 0.04 -0.01 -0.04
Flat slope -0.62* 0.29 0.09 0.15*** -0.07 -0.16***
Steep slope 0.01 0.16 -0.01 -0.01 0.01 0.01
Other resources
Size of iron roof -0.01 0.00 0.01 0.01 0.01 -0.01
Tools 0.41** 0.17 -0.05** -0.11** 0.03* 0.13**
Off-farm income -0.00 0.00 0.01 0.01 -0.01 -0.01
Institutions and social capital
Tenure security 0.27 0.19 -0.03 -0.08 0.27 0.08
SWC training 0.28 0.17 -0.03* -0.08 0.02 0.09
SWC program 1.10*** 0.19 -0.14*** -0.28*** 0.09*** 0.32***
Medium cooperation 0.08 0.20 -0.01 -0.03 0.01 0.03
High cooperation 0.45** 0.18 -0.05** -0.13** 0.32** 0.14**
Formal position 0.31 0.24 -0.03 -0.09 0.01 0.10
Labor sharing (assistance) 0.03*** 0.01 -0.01*** -0.01*** 0.01** 0.01***
Perceptions
Erosion problems 1.26*** 0.41 -0.29** -0.14** 0.19*** 0.24***
SWC profitability 0.61* 0.36 -0.09 -0.14*** 0.08 0.15**
Cut1 1.98*** 0.64
Cut2 3.49*** 0.65
Cut3 4.29*** 0.66
Number of observations = 258
Wald v2 (21) = 170.53
Prob[ v2 = 0.0000
Pseudo R2 = 0.2389
Log pseudo-likelihood = -261.87
*, **, *** Significant at 10, 5, and 1 % level of significance, respectively
634 Environmental Management (2016) 57:620–636
123

References
Adimassu Z, Kessler A, Hengsdijk H (2012) Exploring determinants
of farmers’ investments in land management in the Central Rift
Valley of Ethiopia. Appl Geogr 35:191–198
Aemro T (2011) The role of soil and water conservation measures on
soil carbon accumulation, soil physico-chemical properties and
yield of crops: A Case Study from Anjeni and Chentetial
Watersheds. MSc. thesis. Bahir Dar University, Ethiopia
Amsalu A, de Graaff J (2006) Farmers’ views of soil erosion problems
and their conservation knowledge at Beressa watershed, central
highlands of Ethiopia. Agric Hum Values 23:99–108
Amsalu A, de Graaff J (2007) Determinants of adoption and
continued use of stone terraces for soil and water conserva-
tion in an Ethiopian highland watershed. Ecol Econ 61:
294–302
Anley Y, Bogale A, Haile Gabriel A (2007) Adoption decision
and use intensity of soil and water conservation measures
by smallholder subsistence farmers in Dedo district,
Western Ethiopia. Land Degrad Dev 18:289–302
Beekman G, Bulte E (2012) Social norms, tenure security and soil
conservation: evidence from Burundi. Agric Syst 108:50–63
Bekele W, Drake L (2003) Soil and water conservation decision
behaviour of subsistence farmers in the eastern highlands of
Table 8 Multinomial logit results of adoption phases of SWC
Variable Adopter category
Initial adopter Actual adopter Final adopter
Coefficient Robust std. err. Coefficient Robust std. err. Coefficient Robust std. err.
Constant -1.397 2.061 -21.201*** 2.551 -37.760*** 2.656
Household characteristics and labor resources
Age -0.052** 0.023 -0.071** 0.028 -0.048* 0.028
Family size -0.065 0.147 -0.104 0.163 -0.052 0.164
Farm labor 0.411 0.369 0.541 0.443 1.056** 0.486
Distance from road -0.021 0.018 -0.015 0.019 0.008 0.021
Land resources
Average parcel size -0.760 0.682 0.201 0.728 1.270* 0.742
Cultivated land size 0.274 0.242 0.775** 0.314 0.745** 0.324
Farm size -0.122 0.283 -0.322 0.337 -0.657* 0.341
Flat slope -0.182 0.790 -2.844** 1.158 -1.140 1.011
Steep slope 1.500** 0.592 0.566 0.652 1.131* 0.662
Other resources
Size of iron roof -0.005 0.011 -0.001 0.013 -0.016 0.014
Tools 1.759*** 0.490 1.877*** 0.588 2.265*** 0.570
Off-farm income -0.002** 0.001 -0.004*** 0.001 -0.003* 0.001
Institutions and social capital
Tenure security 1.198* 2.112 2.112*** 0.722 1.625** 0.714
SWC training 0.311 0.633 0.553 0.661 0.970 0.689
SWC program 3.158*** 1.081*** 4.452*** 1.100 4.596*** 1.089
Medium cooperation -1.356* 0.646 -1.299* 0.725 0.793 1.069
High cooperation -0.320 0.655 -0.448 0.746 2.297** 1.038
Formal position 1.851 1.681 0.245 1.812 2.138 1.688
Labor sharing (assistance) 0.084 0.055 0.101* 0.057 0.146*** 0.054
Perceptions
Erosion problems 0.762 1.027 17.821*** 1.516 16.614*** 1.406
SWC profitability 1.367 1.367 1.254 1.33658 15.125*** 1.571
Base category = non-adoption/dis-adoption
Number of observation = 272
LR chi(88) = 293.69
Prob[ v2 = 0.000
Pseudo R2 = 0.37
Log likelihood = -252.38
*, **, *** Significant at 10, 5, and 1 % level of significance, respectively
Environmental Management (2016) 57:620–636 635
123
Ethiopia: a case study of the Hunde-Lafto area. Ecol Econ
46:437–451
Besley T (1995) Property rights and Investment Incentives: theory
and Evidence from Ghana. J Polit Econ 103(5):903–937
Bewket W (2007) Soil and water conservation intervention with
conventional technologies in north western highlands of Ethiopia:
acceptance and adoption by farmers. Land Use Policy 24:404–416
BoARD (Bureau of Agriculture and Rural Development of Amhara
Region) (2010) Problem identification and need assessment
study report. Bahir Dar, Ethiopia
Cary JW, Wilkinson RL (1997) Perceived profitability and farmers’
conservation behaviour. J Agric Econ 48(1):13–21
de Graaff J, Amsalu A, Bodnar F, Kessler A, Posthumus H, Tenge A
(2008) Factors influencing adoption and continued use of long-
term soil and water conservation measures in five developing
countries. Appl Geogr 28:271–280
Ekboir JM (2003) Research and technology policies in innovation
systems: zero tillage in Brazil. Res Policy 32:573–586
Ervin CA, Ervin DE (1982) Factors affecting the use of soil
conservation practices: hypothesis, evidence and policy impli-
cations. Land Econ 58(3):277–292
Foster A, Rosenzweig MR (1995) Learning by Doing and Learning
from Others: human Capital and Technical Change in Agricul-
ture. J Polit Econ 103(6):1176–1209
Gavian S, Fafchamps M (1996) Land tenure and allocative efficiency
in Nigeria. Am J Agric Econ 78:469–471
Gebremedhin B, Swinton S (2003) Investment in soil conservation in
northern Ethiopia: the role of land tenure security and public
programs. Agric Econ 29:69–84
Greene WH (2003) Econometric analysis, 5th edn. Prentice Hall, New
Jersey
Greene WH, Henscher DA (2010) Modeling ordered choices.
A Primer Cambridge University Press, Cambridge
Grootaert C, Narayan D, Jones VN, Woolcock M (2004) Measuring
social capital: an integrated questionnaire, vol 18. World Bank,
Washington DC
Hengsdijk H, Meijerink GW, Mosugu ME (2005) Modeling the effect
of three soil and water conservation practices in Tigray,
Ethiopia. Agric Ecosyst Environ 105:29–40
Holden S, Yohannes H (2002) Land redistribution, tenure insecurity,
and intensity of production: a study of farm households in
Southern Ethiopia. Land Econ 78(4):573–590
Hurni H (1988) Degradation and conservation of the resource in the
Ethiopian highlands. Mt Res Dev 8(3):123–130
Kassie M, Zikhali P, Manjur K, Edwards S (2009) Adoption of
sustainable agriculture practices: evidence from a semi-arid
region of Ethiopia. Nat Resour Forum 33:189–198
Kassie M, Zikahli P, Pender J, Kohlin G (2010) The economics of
sustainable land management practices in the ethiopian high-
lands. J Agric Econ 61(3):605–627
Klerkx L, Leeuwis C (2009) Establishment and embedding of
innovation brokers at different innovation system levels: insights
from the Dutch agricultural sector. Technol Forecast Soc Change
76:849–860
Lapar LA, Pandey S (1999) Adoption of soil conservation: the case of
the Philippine uplands. Agric Econ 21:241–256
Lapple D, Rensburg TV (2011) Adoption of organic farming: are
there differences between early and late adoption? Ecol Econ
70:1406–1414
Mbaga-Semgalawe Z, Folmer H (2000) Household adoption behaviour
of improved soil conservation: the case of theNorth Pare andWest
Usambara Mountains of Tanzania. Land Use Policy 17:321–336
Neill SP, Lee DV (2001) Explaining the adoption and disadoption of
sustainable agriculture: the case of cover crops in Northern
Honduras. Econ Dev Cult Change 49:793–820
Njuki JM, Mapila MT, Zingore S, Delve R (2008) The dynamics
of social capital in influencing use of soil management options
in the Chinyanja Triangle of Southern Africa. Ecol Soc
13(2):9–25
Nyangena W (2008) Social determinants of soil and water conser-
vation in rural Kenya. Environ Dev Sustain 10:745–767
Nyssen J, Poesen J, Gebremichael D, Vancampenhout K, D’aes M,
Yihdego G, Govers G, Leirs H, Moeyersons J, Naudts J,
Haregeweyn N, Haile M, Deckers J (2007) Interdisciplinary on-
site evaluation of stone bunds to control soil erosion on cropland
in Northern Ethiopia. Soil Tillage Res 94:151–163
Posthumus H, Gardebroek C, Ruben R (2010) From participation to
adoption: comparing the effectiveness of soil conservation
programs in the Peruvian Andes. Land Econ 86(4):645–667
Shiferaw B, Holden S (1998) Resource degradation and adoption of
land conservation technologies in the Ethiopian high lands: a
case study in Andit Tid, North Shewa. Agric Econ 18:233–247
Shiferaw B, Holden S (1999) Soil erosion and smallholders’
conservation decisions in the highlands of Ethiopia. World
Dev 27(4):739–752
Sklenicka P, Janovska V, Salek M, Vlasak J, Molnarova K (2014) The
Farmland Rental Paradox: extreme land ownership fragmenta-
tion as a new form of land degradation. Land Use Policy
38:587–593
Soule MJ, Tegene A, Wiebe KD (2000) Land tenure and the adoption
of conservation practices. Am J Agric Econ 82(4):993–1005
Taddese G (2001) Land degradation: a challenge to Ethiopia. Environ
Manag 27(6):815–824
Tadesse M, Kassa B (2004) Factors influencing adoption of soil
conservation measures in Southern Ethiopia: the case of Gununo
area. J Agric Rural Dev Trop Subtrop 105(1):49–62
Tefera B, Sterk G (2010) Land management, erosion problems and
soil and water conservation in Fincha’a watershed, Western
Ethiopia. Land Use Policy 27:1027–1037
Tekle K (1999) Land degradation problems and their implications for
food shortage in south Wello, Ethiopia. Environ Manag
23:419–427
Tenge AJ, de Graaff J, Hella JP (2004) Social and economic factors
for adoption of soil and water conservation in West Usambara
Highlands, Tanzania. Land Degrad Dev 15:99–114
Tenge AJ, de Graaff J, Hella JP (2005) Financial efficiency of major
soil and water conservation measures in West Usambara
highlands, Tanzania. Appl Geogr 25:348–366
Tesfaye H (2011) Assessment of sustainable watershed management
approach case study Lenche Dima, Tsegur Eyesus and Dijilwatershed. Master of Professional Studies thesis. Cornell
University
Tesfaye A, Negatu W, Brouwer R, van der Zaag P (2013)
Understanding soil conservation decision of farmers in the
Gedeb watershed. Land Degrad Dev, Ethiopia. doi:10.1002/ldr.
2187
Tiwari KR, Sitaula BK, Nyborg LP, Paudel GS (2008) Determinants
of farmers’ adoption of improved soil conservation technology in
a middle mountain watershed of central Nepal. Environ Manag
42:210–222
Zegeye A.D (2009) Assessment of Upland Erosion Processes and
Farmer’s Perception of Land Conservation in Debre-Mewi
Watershed, Near Lake Tana, Ethiopia. Master of Professional
Studies thesis. Cornell University
Zeleke G, Hurni H (2001) Implications of land use and land cover
dynamics for mountain resource degradation in the northwestern
Ethiopian highlands. Mt Res Dev 21:184–191
636 Environmental Management (2016) 57:620–636
123