Household and Community Socioeconomic and Environmental ...
20
Household and Community Socioeconomic and Environmental Determinants of Child Nutritional Status in Cameroon The Harvard community has made this article openly available. Please share how this access benefits you. Your story matters Citation Pongou, Roland, Majid Ezzati, and Joshua A. Salomon. 2006. Household and community socioeconomic and environmental determinants of child nutritional status in Cameroon. BMC Public Health 6:98. Published Version doi:10.1186/1471-2458-6-98 Citable link http://nrs.harvard.edu/urn-3:HUL.InstRepos:4522586 Terms of Use This article was downloaded from Harvard University’s DASH repository, and is made available under the terms and conditions applicable to Other Posted Material, as set forth at http:// nrs.harvard.edu/urn-3:HUL.InstRepos:dash.current.terms-of- use#LAA
Transcript of Household and Community Socioeconomic and Environmental ...

Household and Community Socioeconomicand Environmental Determinants of
Child Nutritional Status in CameroonThe Harvard community has made this
article openly available. Please share howthis access benefits you. Your story matters
Citation Pongou, Roland, Majid Ezzati, and Joshua A. Salomon. 2006.Household and community socioeconomic and environmentaldeterminants of child nutritional status in Cameroon. BMC PublicHealth 6:98.
Published Version doi:10.1186/1471-2458-6-98
Citable link http://nrs.harvard.edu/urn-3:HUL.InstRepos:4522586
Terms of Use This article was downloaded from Harvard University’s DASHrepository, and is made available under the terms and conditionsapplicable to Other Posted Material, as set forth at http://nrs.harvard.edu/urn-3:HUL.InstRepos:dash.current.terms-of-use#LAA

BioMed Central
Page 1 of 19(page number not for citation purposes)
BMC Public Health
Open AccessResearch articleHousehold and community socioeconomic and environmental determinants of child nutritional status in CameroonRoland Pongou*1,2, Majid Ezzati1 and Joshua A Salomon1
Address: 1Harvard School of Public Health, Boston, MA, USA and 2Population Studies and Training Center, Brown University, Providence, RI, USA
Email: Roland Pongou* - [email protected]; Majid Ezzati - [email protected]; Joshua A Salomon - [email protected]
* Corresponding author
AbstractBackground: Undernutrition is a leading cause of child mortality in developing countries,especially in sub-Saharan Africa. We examine the household and community level socioeconomicand environmental factors associated with child nutritional status in Cameroon, and changes in theeffects of these factors during the 1990s economic crisis. We further consider age-specific effectsof household economic status on child nutrition.
Methods: Child nutritional status was measured by weight-for-age (WAZ) and height-for-age(HAZ) z-scores. Data were from Demographic and Health Surveys conducted in 1991 and 1998.We used analysis of variance to assess the bivariate association between the explanatory factorsand nutritional status. Multivariate, multilevel analyses were undertaken to estimate the net effectsof both household and community factors.
Results: Average WAZ and HAZ declined respectively from -0.70 standard deviations (SD), i.e.0.70 SD below the reference median, to -0.83 SD (p = 0.006) and from -1.03 SD to -1.14 SD (p =0.026) between 1991 and 1998. These declines occurred mostly among boys, children over 12months of age, and those of low socioeconomic status. Maternal education and maternal healthseeking behavior were associated with better child nutrition. Household economic status had anoverall positive effect that increased during the crisis, but it had little effect in children under 6months of age. Improved household (water, sanitation and cooking fuel) and communityenvironment had positive effects. Children living in the driest regions of the country wereconsistently worst off, and those in the largest cities were best off.
Conclusion: Both household and community factors have significant impact on child health inCameroon. Understanding these relationships can facilitate design of age- and community-specificintervention programs.
BackgroundChildhood and maternal undernutrition is currently thesingle leading cause of the global burden of disease [1].The fraction of total global health loss attributable to
undernutrition was 9.5% in the year 2000, and 14.9% inhigh-mortality developing regions [1]. In Cameroon, theprevalence of childhood stunting and underweight rosefrom 23% to 29% and from 16% to 23%, respectively,
Published: 17 April 2006
BMC Public Health 2006, 6:98 doi:10.1186/1471-2458-6-98
Received: 02 February 2005Accepted: 17 April 2006
This article is available from: http://www.biomedcentral.com/1471-2458/6/98
© 2006 Pongou et al; licensee BioMed Central Ltd.This is an Open Access article distributed under the terms of the Creative Commons Attribution License (http://creativecommons.org/licenses/by/2.0), which permits unrestricted use, distribution, and reproduction in any medium, provided the original work is properly cited.

BMC Public Health 2006, 6:98 http://www.biomedcentral.com/1471-2458/6/98
Page 2 of 19(page number not for citation purposes)
between 1991 and 1998 [2], mirroring the trends inunder-5-mortality rates, which increased from 126 perthousand to 152 per thousand between 1991 and 1998[3,4]. Worsening child nutritional status in Cameroonduring the 1990s was in line with highest burden of mal-nutrition in Africa [1], but was opposite to downwardtrends in much of the world [5], with many countriesexperiencing growth and nutrition transitions [6]. Under-standing the determinants of malnutrition and theirtrends during periods of declining health is crucial for pol-icy design.
Poor nutritional status reflects an imbalance in dietaryintake and/or infectious diseases [7-9], and therefore isaffected by multiple environmental and socioeconomicfactors such as household socioeconomic status (SES),maternal education, household hygiene, and access tocase management in health services [10-16]. Variation bychild age in the nutritional effect of household SES andthe effect of community-level infrastructure (e.g. hygieneor health service delivery) on malnutrition also have beenrecognized, but have been investigated in only a few stud-ies [17-19]. Studies combining individual, household andcommunity factors in a single analytical framework arestill needed to provide reliable information for policy andprogram design.
Cameroon is characterized by a marked socio-cultural,economic and environmental diversity likely to cause var-iations in health and nutrition in children. However, fewstudies on determinants of child nutritional status havebeen conducted in Cameroon, and almost all have beenin a single district, town or province [20-22]. Further, thevariables included in these studies were all at the level ofthe household, without the inclusion of community char-acteristics. Therefore the effects of geographical variablesand countrywide socioeconomic factors on child nutri-tion have not been evaluated. Key studies on nutritionand child health conducted at the country or regionallevel either identified the multiple determinants of healthwithout quantifying their effects in a multivariate frame-work [23], or estimated the cross-level interactions of par-ticular household and community factors [19], but withno reference to the role of important geographical varia-bles like region of residence, an important predictor ofchild nutritional status [2] and a notable confounder ofthe SES-malnutrition relationship in the country. Differ-ent regions in Cameroon exhibit different levels of eco-nomic development as well as variation in climaticconditions and food production likely to affect childhealth independently of household or neighborhood eco-nomic status [24,25].
In this study, we use nationally representative householdsurveys from 1991 and 1998 and comparable measures
across years to examine the role of multiple household,community, and regional socioeconomic and environ-mental variables in childhood undernutrition in Cam-eroon. We include an analysis of how the nutritionaleffect of household economic status may vary by childage. By considering data from two periods, between whichthere were important changes in national economy, wealso consider how the effects of these determinants maychange in response to macroeconomic factors.
MethodsData sourcesDemographic and Health Surveys (DHS) [26] were con-ducted in Cameroon in 1991 and 1998, designed to berepresentative at the national, urban-rural and regionallevel. A two-stage probabilistic sampling technique wasused to select clusters at the first level and households atthe second level (table 1). The household response ratewas 83% in 1991 and 94% in 1998. The survey includeda household module, as well as a questionnaire adminis-tered to women aged 15 to 49 years, comprising a birthhistory, information on individual characteristics andhealth behaviors, and details on their children.
For children alive at each survey (those under age 5 yearsin 1991 and under age 3 years in 1998), weight and heightwere measured and used to calculate anthropometric indi-cators. For the purpose of cross-year comparability, werestricted our study to children under 3 in both surveys.Of the 1966 children born after 1988 and surviving to1991, anthropometric data were available for 1587(80.7% of the weighted sample), and of the 2260 childrenborn after 1995 and surviving to 1998, anthropometricdata were reported for 1923 (85%).
VariablesChild nutritional status is measured by weight-for-age z-scores (WAZ) and height-for-age z-scores (HAZ) using theUnited States National Center for Health Statistics/WHOinternational reference population. WAZ has been used inmany epidemiological studies of undernutrition andchild mortality, including in the latest systematic reviewand meta-analysis [27], and is suitable for the analysis ofmultiple determinants of child health, including socioe-conomic determinants [12]. HAZ is an indicator for lineargrowth and reflects cumulated and chronic child healthconditions. At the individual and household level(referred to as level 1), independent variables includedmother's characteristics (education, health seeking behav-ior, age at child birth, and marital status), household var-iables (economic status, source of drinking water,sanitation and cooking fuel), and child characteristics(age, sex, size at birth, breastfeeding status and precedingbirth interval). Individual and household variables wereconsidered at the same level because there was less than

BMC Public Health 2006, 6:98 http://www.biomedcentral.com/1471-2458/6/98
Page 3 of 19(page number not for citation purposes)
one child per household in our data (table 1). Details onthe definitions and distributions of these variables appearin table 2.
Household economic status and maternal health-seekingbehavior (MHSB) are index variables constructed basedon the statistical model developed by Ferguson et al. [28].The model was designed to measure economic statusbased on possession of household consumer durablessuch as electricity, television, bicycle and car. The basicpremise of the model is that wealthier households aremore likely to own any given set of assets; and that someassets are likely to be consumed at relatively low levels ofeconomic status (e.g. radio or bicycle), while others willbe owned only at higher levels (e.g. television or car). Themodel postulates a continuous level of economic status(unobserved) predicted by a series of socio-demographiccovariates (age and sex of the head of the household,mother's education and occupation, and urban or ruralplace of residence), with observed ownership of each assetcaptured in a set of indicator variables. The inclusion ofcertain assets presumed to be owned at roughly the samelevel on an internationally comparable economic statusscale allows comparisons across countries or over time. Asimilar approach was used to estimate levels of MHSB,with predictive covariates including mother's educationand occupation, and place of residence, and dichotomousindicator variables for prenatal visit, tetanus injection dur-ing pregnancy, medical assistance at delivery, knowledgeof oral rehydration solutions (ORS) and possession of ahealth card for the child.
Increasing awareness of the effects of community orneighborhood on health beyond individual and house-hold-level influences has produced a vast literature[29,30]. In developing countries, community-level factorsthat may influence health include community economicdevelopment, climatic conditions (these two factors areoften captured by region of residence) and environmentalhygiene. Children residing in clean neighborhoods mayhave better health than similar children living in uncleanneighborhoods. In our study, community statistical unitswere the DHS clusters sample for the years 1991 and1998, and community-level independent variables(referred to as level 2 variables) included place of resi-dence, region of residence and environmental status(table 2). Community environmental status is a continu-ous variable built using pooled 1991 and 1998 datasetsand principal components analysis on 5 variables includ-ing the proportion of children in households with accessto water, sanitation, electricity, using electric stove or gasas cooking fuel, or having finished floor in each cluster.This variable therefore represents access to clean environ-mental conditions at the community level, affected byboth household resources and the broader community-level infrastructure (e.g. waste disposal infrastructure anddistance to water source or electricity grid).
Statistical analysisAnalysis of variance (ANOVA) was used to assess thebivariate association between average WAZ and HAZ andselected independent variables, including child sex andage, maternal education, MHSB, economic status (the lat-ter two recoded into 5-level variables using the quintile
Table 1: Regional distribution of clusters, households and children
Clusters Households Children
1991 1998 1991 1998 1991 1998RegionsYaounde/Douala 43 (28.8%) 43 (21.2%) 483 (13.6%) 553 (11.8%) 260 (13.2%) 201 (8.9%)West/Littoral 24 (16.1%) 39 (19.2%) 643 (18.2%) 780 (16.6%) 306 (15.6%) 303 (13.4%)North-West/South West 19 (12.7%) 39 (19.2%) 535 (15.1%) 923 (19.7%) 288 (14.7%) 401 (17.7%)Center/South/East 23 (15.4%) 41 (20.2%) 669 (18.9%) 1045 (22.2%) 374 (19.0%) 527 (23.3%)Adamaoua/North/Far North 40 (26.8%) 41 (20.2%) 1208 (34.1%) 1395 (29.7%) 738 (37.5%) 828 (36.6%)Type of place of residenceYaounde/Douala 43 (28.9%) 43 (20.7%) 483 (13.6%) 553 (11.8%) 260 (13.2%) 201 (8.9%)Other cities/towns 37 (24.8%) 50 (24.6%) 835 (23.6%) 983 (20.9%) 518 (26.3%) 421 (18.6%)Rural 69 (46.3%) 110 (54.2%) 2220 (62.7%) 3160 (67.3%) 1188 (60.4%) 1638 (72.4%)Total sample size 149 (100%) 203 (100%) 3538 (100%) 4696 (100%) 1966 (100%) 2260 (100%)
Notes: -Two clusters in the North-West/South-West region were not surveyed in 1991; so the total number of clusters surveyed was 350 for the two periods.-The sample sizes for households and children under 3 years old reported in the table are weighted sample sizes; anthropometric measures were taken or were consistent for 1587 children in 1991 and 1923 children in 1998, resulting in a total weighted sample size of 3500 children for the two periods. The non-weighted total sample size was 3321 for children.-Yaounde and Douala are the largest cities in Cameroon and were sampled separately from other regions and other cities and towns that can be considered as intermediate cities.

BMC Public Health 2006, 6:98 http://www.biomedcentral.com/1471-2458/6/98
Page 4 of 19(page number not for citation purposes)
Table 2: Distribution (%) of variables
Variables 1991 1998 Variables 1991 1998
N 1587 1923 1587 1923Level 1 variables Level 1 variables (cont'd)Child characteristics Economic status (ES)Sex 1st quintile 16.5 22.6Male 49.4 50.0 2nd quintile 15.7 23.0Female 50.6 50.0 3rd quintile 22.6 18.0Age (months) 4th quintile 20.3 19.50–5 17.7 19.0 5th quintile 24.9 16.96–11 21.1 17.7 Continuous (Mean) -0.82 -0.9912–23 34.6 33.9 MHSB24–35 26.6 29.4 1st quintile 14.8 20.6Breastfeeding duration 2nd quintile 18.3 21.9Never breastfed 0.9 0.7 3rd quintile 19.5 21.3Still breastfeeding 56.7 58.9 4th quintile 20.1 20.8Breastfed 0–4 months 1.9 0.9 5th quintile 27.3 15.4Breastfed 5–6 months 1.6 0.8 Continuous (Mean) 0.89 0.68Breastfed 7–18 months 28.5 25.8 Household environmentBreastfed 19 months or more 10.4 12.6 WaterMissing 0.0 0.2 Poor = Well, rain, river 61.2 64.7Preceding birth interval Medium = Public tap 20.2 17.8First born child 18.6 22.0 Good = Piped water 18.4 11.27–18 months 6.4 4.7 Missing 0.2 6.219–23 months 7.8 8.6 Sanitation24 months or more 67.2 64.7 Poor = Pit latrine 55.3 69.6Birth size Medium = Bucket or improved pit latrine 7.3 4.0Smaller than average 15.6 10.8 Good = Flush toilet 37.3 20.4Average 54.6 52.0 Missing 0.1 6.0Larger than average 29.8 37.2 Cooking fuelMaternal characteristics Poor = No electric stove or portable gas 78.9 73.1Education Good = Electric stove, portable gas 20.9 20.9No education 34.7 33.5 Missing 0.2 6.0Primary 41.8 40.2Secondary or + 23.5 26.3 Level 2 variablesMaternal age at birth (yrs) Place of residence<20 22.8 21.1 Yaounde/Douala 14.0 7.720–29 51.3 52.5 Intermediate cities 25.7 18.730–49 25.8 26.4 Rural 60.3 73.6Marital status Region of residenceMarried monogamy 51.4 52.2 Yaounde/Douala 14.0 7.7Other 48.6 47.8 West/Littoral 17.6 12.5Household characteristics North-West/South-West 15.8 17.6Indicators for ES (% yes) Center/South/East 20.7 24.5Radio 66.1 52.6 Adamaoua/North/Far-North 31.9 37.7Electricity 35.3 34.2 Community environmental status (Mean) -0.46 -0.75Television 22.8 18.3Car 7.9 4.7Indicators for MHSB (% yes)Prenatal attendance 83.9 79.5Tetanus injection during pregnancy 76.5 70.4Medical assistance at delivery 68.0 59.0Knowledge of ORS 42.4 56.6
ABBREVIATIONS: ES = household economic status; MHSB = maternal health-seeking behaviorNotes: The ES and MHSB quintiles were constructed using pooled 1991 and 1998 DHS data to facilitate cross-year comparability. Higher proportion of children in the 1st and 2nd ES and MHSB quintile in 1998 compared with 1991 indicates declines in ES and MHSB during the 1990s, as confirmed by change in the mean value of these variables between the two periods; these changes were statistically significant at 0.001. Also note that ES and MHSB "indicators" were not included as independent variables in multivariate analyses.

BMC Public Health 2006, 6:98 http://www.biomedcentral.com/1471-2458/6/98
Page 5 of 19(page number not for citation purposes)
cut-off points of the pooled 1991 and 1998 data), water,sanitation, cooking fuel, and place and region of resi-dence. A two tailed t-test was also performed to test thestatistical significance of the change in the average WAZand HAZ between 1991 and 1998 (table 4).
In multivariate analysis, we pooled the 1991 and 1998data and used a two-level random intercept model to esti-mate the specific effect of household and communityindependent variables on WAZ and HAZ, using the Stata9 statistical software. This model takes into account thehierarchical sample selection design characterizing theDHS surveys, and further adjusts for spatial correlationand heteroskedasticity, as the nutritional status of chil-dren living in the same neighborhoods (hereafter 'clus-ter') may be correlated due to common neighborhoodsinfluences (e.g. access to water, electricity, etc.) Thismodel also allows estimation of the fraction of variance ofthe dependent variable occurring at each level of the anal-ysis [31,32], and is specified (for WAZ) as follows.
where
WAZij = weight-for-age z-score for a child i in cluster j
β0 = intercept
yeart = dummy indicator for the year t (t = 1991, 1998)
β1 = coefficient on the year 1998
xkij = value of variable xk for a child i in cluster j (xk is anindividual or household level variable)
xkij * yeart = interaction term between variable xk and year t(t = 1991, 1998) evaluated for a child i in cluster j
= coefficient on variable xk in period t(t = 1991, 1998),
representing increase in WAZ due to a unit increase in xk if
xk is continuous, or the differential effect of xk on WAZ rel-
ative to a reference category if xk is a dummy indicator rep-
resenting a category of a categorical variable
zkj = value of variable zk for a cluster j (zk is a communitylevel variable)
zkj * yeart = interaction term between variable zk and year t(t = 1991, 1998) evaluated for a cluster j
= coefficient on variable zk in period t (t = 1991, 1998),
interpreted similarly as
µj = clusters residuals assumed to be independent and nor-mally distributed
εij = within-cluster individuals residuals assumed to beindependent and normally distributed.
The residual terms µj and εij are assumed to have zero
mean, with respective variances and , which are
the variance of WAZ occurring at the cluster and individ-ual level, respectively, after netting out the effects of inde-
pendent variables. Only coefficients and
estimating simultaneously the effects of these independ-ent variables for the years 1991 and 1998, respectively,were reported in addition to the individual and cluster
level variances and (table 5).
To estimate changes across years in the effects of inde-pendent variables, we used the following equation:
WAZij k kij k kijk
kyear x year x year= + + +( ) +∑β β β β δ0 1 9891
9198
9891* * zz year z yearkj k kj j ij
k
* *9198
98 1+( ) + + ( )∑ δ µ ε
βkt
δkt
βkt
σ µ2 σε
2
βk91 βk
98
σε2 σ µ
2
WAZij k kij k kijk
kyear x year x z= + + +( ) +− −∑α α α α ϕ0 1 9898 91
9891 98 91* kkj k kj j ij
k
year z* 9891 2+( ) + + ( )∑ ϕ µ ε
Table 3: Nutritional status in Cameroon in 1991 and 1998
1991 1998 P-value of change
Crude estimates
WAZ -0.70 -0.83 0.006HAZ -1.03 -1.14 0.026WHZ -0.09 -0.16 0.069% WAZ<-2 SD 16.3 22.2 <0.0001% HAZ<-2 SD 22.9 29.3 <0.0001% WHZ<-2 SD 3.8 5.9 0.004
Standardized estimates1
WAZ -0.70 -0.79 0.042HAZ -1.03 -1.08 0.239WHZ -0.09 -0.15 0.138% WAZ<-2 SD 16.3 20.6 <0.0001% HAZ<-2 SD 22.8 27.3 0.002% WHZ<-2 SD 3.8 6.0 0.004
-ABBREVIATIONS: WAZ: weight-for-age z-score; HAZ: height-for-age z-score; WHZ: weight-for-age z-score; % WAZ<-2 SD: percentage of children with weight-for-age z-score 2 standard deviations (SD) below the median value of weight-for-age z-score of the international reference population; the same definition applies to %HAZ<-2SD and %WHZ<-2SD by replacing WAZ by HAZ and WHZ, respectively. 1 The 1998 estimates were standardized by urban/rural place of residence and child sex and age; they measure child nutritional status in 1998 if the distributions of study population across urban and rural areas and across child sex and age in 1998 were similar to the 1991 distributions.

BMC Public Health 2006, 6:98 http://www.biomedcentral.com/1471-2458/6/98
Page 6 of 19(page number not for citation purposes)
Note that equation (2) is algebraically equivalent to equa-
tion (1) in that = ,
and .
Therefore only coefficients and estimat-
ing respectively the cross-year changes in the effects of
individual/household and community independent vari-ables were reported (table 7). Equation (1) and equation(2) were also estimated for height-for-age z-score byreplacing WAZ by HAZ (tables 6–7).
Summarizing what precedes, while equation (1) estimatesthe effects of independent variables for the years 1991 and
αk91 βk
91
ϕ δ α β βk k k k k91 91 98 91 98 91= = −−, ϕ δ δk k k
98 91 98 91− = −
αk98 91− ϕk
98 91−
Table 4: Average weight-for-age and height-for-age for selected variables
Weight-for-age z-score Height-for-age z-score
1991 1998 Change 1991 1998 Change
Household Economic status1st quintile -1.03 -1.20 -0.17 -1.26 -1.47 -0.212nd quintile -0.71 -0.91 -0.20 -1.02 -1.16 -0.143rd quintile -0.94 -0.96 -0.02 -1.35 -1.27 0.084th quintile -0.51 -0.62 -0.11 -0.95 -0.97 -0.025th quintile -0.42 -0.35 0.07 -0.68 -0.75 -0.07MHSB1st quintile -1.31 -1.34 -0.03 -1.38 -1.54 -0.162nd quintile -0.83 -0.92 -0.09 -1.05 -1.12 -0.073rd quintile -0.66 -0.76 -0.10 -1.11 -1.22 -0.114th quintile -0.64 -0.58 0.06 -0.94 -0.92 0.025th quintile -0.36 -0.47 -0.11 -0.84 -0.84 0Household environmentWaterPoor -0.88 -0.94 -0.06 -1.20 -1.23 -0.03Medium -0.56 -0.71 -0.15 -0.91 -1.01 -0.10Good -0.24 -0.38 -0.14 -0.60 -0.84 -0.24**SanitationPoor -0.88 -0.94 -0.06 -1.20 -1.24 -0.04Medium -0.39 -0.13 0.26 -0.68 -0.51 0.17Good -0.50 -0.58 -0.08 -0.84 -0.90 -0.06Cooking fuelPoor -0.25 -0.55 -0.30* -0.82 -0.88 -0.06Good -0.82 -0.94 -0.12** -1.15 -1.24 -0.09**Maternal educationNo education -1.08 -1.35 -0.27** -1.28 -1.48 -0.20Primary -0.57 -0.65 -0.08 -1.01 -1.06 -0.05Secondary or + -0.38 -0.45 -0.07 -0.71 -0.84 -0.13Child sexMale -0.71 -0.91 -0.20** -1.03 -1.21 -0.18**Female -0.70 -0.76 -0.06 -1.04 -1.08 -0.04Child age (months)0–5 0.43 0.45 0.02 -0.02 -0.07 -0.056–11 -0.65 -0.80 -0.15 -0.75 -0.64 0.1112–23 -1.16 -1.35 -0.19** -1.42 -1.69 -0.27**24–35 -0.91 -1.09 -0.18** -1.43 -1.51 -0.08Place of residenceYaounde/Douala -0.16 -0.31 -0.15 -0.57 -0.75 -0.18Intermediate cities -0.71 -0.73 -0.02 -1.00 -1.01 -0.01Rural (reference) -0.82 -0.91 -0.09 -1.15 -1.22 -0.07RegionWest/Littoral -0.35 -0.37 -0.02 -0.96 -0.96 0.0North-West/South-West -0.45 -0.44 0.01 -1.10 -0.94 0.16Center/South/East -0.83 -0.82 0.01 -1.01 -1.12 -0.11Adamaoua/North/Far-North -1.17 -1.29 -0.12 -1.25 -1.40 -0.15
-Statistical significance of change: *: P < 0.10; **: p < 0.05; ***: p < 0.001-Gradient in weight-for-age and height for age z-scores for each independent variable shown in the table was statistically significant at 0.001.

BMC Public Health 2006, 6:98 http://www.biomedcentral.com/1471-2458/6/98
Page 7 of 19(page number not for citation purposes)
1998 simultaneously, equation (2) estimates changes inthe effects of these variables between the two years.
The testing strategy used in the multivariate analysis esti-mated first the effects of some socioeconomic factors(tables 5–6, models 1–2) and environmental factors(tables 5–6, model 3) on nutritional status in separateequations; because maternal education and place of resi-dence were used as predictors in the construction of eco-nomic status and MHSB, the adjusted effects of thesevariables were estimated separately (tables 5–6, models4–6). We also estimated the full model including all inde-pendent variables (tables 5–6, model 7). Finally, we esti-mated the age-specific effects of household economicstatus to check variations in these effects by child age(table 8). Multilevel analyses were not weighted.
ResultsDescriptive and bivariate analysisAverage WAZ and HAZ in children younger than 3 yearsold in Cameroon declined respectively from -0.70 stand-ard deviations (SD), i.e. 0.70 SD below the referencemedian value, to -0.83 SD (p = 0.006), and from -1.03 SDto -1.14 SD (p = 0.026) between 1991 and 1998. Duringthis period, the prevalence of underweight (defined asWAZ<-2 SD) and stunting (% HAZ<-2 SD) increasedrespectively from 16% to 22% (P < 0.0001), and from
23% to 29% (p < 0.0001). Average weight-for-height z-score (WHZ) also deteriorated, mirroring increase in theprevalence of wasting (%WHZ<-2 SD) (table 3). Becauseof a shift of the sample toward rural children during thisperiod (see tables 1 and 2), trends in nutritional indica-tors were adjusted for place of residence and child sex andage, and we still found evidence of a decline in nutritionalstatus. It should be noted that this sample shift mightreflect a massive urban-to-rural migration flow during the1990s economic crisis [33-35], in addition to a lower fer-tility decline in rural areas compared to urban areas dur-ing this period [36,37].
Results for bivariate analyses are presented in table 4. Thedecline in nutritional status occurred mostly in boys, chil-dren aged 12–23 months, those born to uneducatedmothers, and those of low economic status. Child sex wasnot significantly associated with nutritional status in1991, but girls had higher average WAZ and HAZ com-pared to boys in 1998 due to uneven declines. Child agewas also a significant predictor of nutritional status.
In both years, nutritional status improved with maternaleducation (table 4, figures 1a-b). Further, the advantageassociated with education increased between 1991 and1998, as decline in WAZ and HAZ was concentrated inchildren of uneducated mothers, although this advantage
Educational gradient in weight-for-age (WAZ) and height-for-age z-scores (HAZ) in 1991 and 1998 in Cameroon. error bars represent 95% CI around the meanFigure 1a-bEducational gradient in weight-for-age (WAZ) and height-for-age z-scores (HAZ) in 1991 and 1998 in Cameroon. error bars represent 95% CI around the mean.
a-b
� 1991
� 1998
Year
No education Primary Secondary or higher
Maternal education
-1.50
-1.00
-0.50
waz
� 1991
� 1998
Year
No education Primary Secondary or higher
Maternal education
-1.50
-1.25
-1.00
-0.75
haz

BMC Public Health 2006, 6:98 http://www.biomedcentral.com/1471-2458/6/98
Page 8 of 19(page number not for citation purposes)
was not statistically significant when clustering of obser-vations was taken into account (see unadjusted model intable 7). A positive economic status gradient was alsonoted in 1991 and 1998 (table 4, figures 2a-b). Moreover,the gap between the richest and the poorest economicgroups increased during this period, although not signifi-cantly. Maternal health seeking behavior also had a signif-icantly positive effect on nutritional status in both years(table 4, figures 3a-b). Further, the difference in HAZbetween children born to mothers with the highest MHSBand those born to mothers with the lowest MHSBincreased during the crisis, but not significantly.
Improved water and cleaner cooking fuels were also asso-ciated with better nutritional status in 1991 and 1998(table 4; also see figures 4a-b for water). Similar resultswere found for sanitation. Children with flush toilets intheir houses had lower nutritional status than those withimproved pit latrines, but this anomaly was not statisti-cally significant.
At the community level, child nutritional status washigher in urban areas in each year (table 4). Average WAZwas -0.16 SD in the largest cities Yaounde and Douala and-0.82 SD in rural areas in 1991 (p < 0.001); it was respec-tively -0.31 SD and -0.91 SD in 1998 (p < 0.001). AverageHAZ was -0.57 SD in Yaounde/Douala and -1.15 SD in
rural areas in 1991 (p < 0.001), and was respectively -0.75SD and -1.22 SD in 1998 (p < 0.001). In both years, theadvantage of children in intermediate cities versus ruralareas was not statistically significant for either nutritionalindicator. Significant regional variation in child nutritionwas also observed in the country (table 4; also see figures5a-b). Children living in the West or Littoral province hadthe highest nutritional status after those living in the larg-est cities; in contrast, children in northern Cameroon hadthe lowest average WAZ and HAZ.
Multivariate resultsEffects of socioeconomic and environmental factorsThe multivariate, multilevel linear regression confirmedmany of the results found in bivariate analyses, but theeffects of some variables declined. Controlling for eco-nomic status and MHSB showed positive effects of thesevariables on WAZ (table 5, model 1) and HAZ (table 6,model 1); however, the effect of MHSB completely disap-peared in 1998 after additional control for maternal edu-cation, while remaining significantly positive in 1991(table 5–6, model 2). Maternal education had a positiveeffect in both years. Model 3 shows positive effects ofwater, sanitation and cooking fuel, but some of theseeffects diminished in favor of community environmentalstatus after additional control for this variable (model notshown).
Effect of household economic status on WAZ and HAZ. error bars represent 95% CI around the meanFigure 2a-bEffect of household economic status on WAZ and HAZ. error bars represent 95% CI around the mean.
a-b
� 1991
� 1998
Year
Very low Low Medium High Very high
Economic status quintiles
-1.25
-1.00
-0.75
-0.50
-0.25
waz
� 1991
� 1998
Year
Very low Low Medium High Very high
Economic status quintiles
-1.50
-1.25
-1.00
-0.75
-0.50
haz

BMC Public Health 2006, 6:98 http://www.biomedcentral.com/1471-2458/6/98
Page 9 of 19(page number not for citation purposes)
Because maternal education and place of residence wereused as predictors in the construction of economic statusand MHSB, and because of the high correlation of eco-nomic status with community environmental status (R2 =0.74 in each year), showing that poorer households mostoften live in unclean neighborhoods, we estimated theeffects of these variables in separate regressions afteradjusting for all other variables. The effects of economicstatus and MHSB were still positive (tables 5–6, model 4),but the effect of economic status diminished in 1991 infavor of water, sanitation and cooking fuel after addi-tional adjustment for these variables (tables 5–6, model5). Also, maternal education and community environ-mental status still have positive effects (tables 5–6, model6).
The full model (model 7) did not significantly change theeffects of our main exposures on WAZ and HAZ. We notethat either economic status or household or communityenvironmental variables became non-significant, show-ing that environmental conditions are systematic modula-tors of the income-nutrition relationship. We also notethat in general, either maternal education or MHSBbecame non-significant, thus highlighting the positivecorrelation of education with better use of primary healthcare facilities, and their joint positive impact on childnutrition.
The full model also showed that children living in thelargest cities were still better off than those in rural areas(this is true for WAZ in both years and for HAZ in 1998),but those in the intermediate cities were eventually worseoff as compared with rural areas (this is true for WAZ).This implies that the relative advantage associated withthe intermediate cities over the rural areas was entirely dueto the socioeconomic composition of those milieus.Regional differentials in child nutritional status remainedrobust to all controls for WAZ, and the relative advantageof some southern regions over the northern regionincreased over time, although not significantly.
Changes in the effects of independent variables during the crisisWe estimated changes over time in the effects of inde-pendent variables (table 7). The full model including allindependent variables was first used for this purpose, butto avoid possible bias due to correlation between somevariables as previously discussed, model 5 was used for allvariables except for maternal education, place and regionof residence, and community environmental index whichwere estimated from model 6. However the results of thisexercise were very similar. We note that the positive effectof economic status (significant for WAZ and non-signifi-cant for HAZ) increased during the crisis, while the effectsof environmental variables diminished in general. Mater-nal education also had a non-significant increasing effect
Effect of MHSB on WAZ and HAZ. error bars represent 95% CI around the meanFigure 3a-bEffect of MHSB on WAZ and HAZ. error bars represent 95% CI around the mean.
a-b
� 1991
� 1998
Year
Very low Low Medium High Very high
MHSB quintiles
-1.50
-1.00
-0.50
waz
� 1991
� 1998
Year
Very low Low Medium High Very high
MHSB quintiles
-1.60
-1.40
-1.20
-1.00
-0.80
haz

BMC Public Health 2006, 6:98 http://www.biomedcentral.com/1471-2458/6/98
Page 10 of 19(page number not for citation purposes)
during this period. The relative advantage of girls overboys also increased over time, while the advantage of liv-ing monogamously diminished, perhaps suggesting thatthe crisis had a greater impact on stable families.
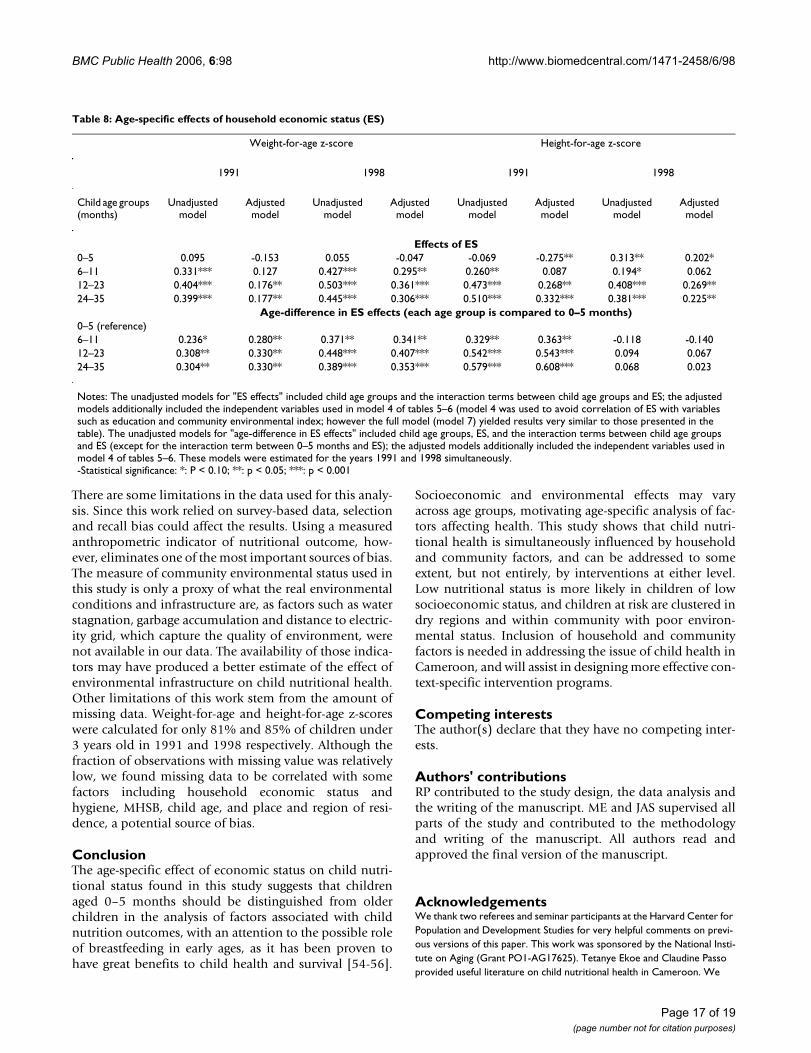
Age-specific effects of household economic statusWe estimated variation across child age groups in thenutritional effects of household economic status (table 8).We note that this variable had little effect in childrenunder 6 months of age, but its effect was positive onlength-for-age in that age group in 1998. The effect of eco-nomic status was in general significantly greater in chil-dren above 6 months, compared to younger children. Thisresult suggests that children under 6 months of age shouldbe distinguished from older children in the analysis of fac-tors associated with child nutrition outcomes.
DiscussionWe examined the household and community level socio-economic and environmental factors associated withnutritional status among children under 3 years old inCameroon and assessed the changes in the effects of thosefactors between 1991 and 1998, which was a period ofsevere economic crisis in the country. Real GDP per capitafell from I$ 2266 in 1990 to I$ 1949 in 1998 (1996 con-stant price) [38]. Average weight-for-age z-score andheight-for-age z-score declined respectively from -0.70 SDto -0.83 SD (p = 0.006) and from -1.03 SD to -1.14 SD (p
= 0.026) during this period. The situation experienced inCameroon during this period was opposite to globaltrends in malnutrition [5,39]. The prevalence of stuntingdeclined in Africa, Asia, Latin America and the Caribbeanduring the 1990s, but remained stable in Western andEastern Africa, as well as Central America. Downwardtrends in malnutrition were also noted in Indonesiadespite the 1997/1998 financial crisis [12,40]. Growthexperienced by many developing countries was followedby nutrition transition, often implying a rising pattern ofobesity [6,41] or a double burden of malnutrition andobesity in some households [42].
The positive effect of maternal education and health seek-ing behavior on child nutritional status found in ourstudy is consistent with other studies on factors affectingchild health, such as those in India and Mali [43,44].
Economic status had a positive effect in general, but it hadlittle effect in children aged 0–5 months, and had signifi-cantly positive effect in older ages. It is possible that thelittle effect of economic status in 0–5 months is due to therole of breastfeeding, which is less frequent in high-eco-nomic status mothers than lower economic status moth-ers due to time budget and the ability to pay forsupplementation foods. The effect of economic status inchildren aged 0–5 months increased between 1991 and1998 (this is particularly true for HAZ where it was posi-
Variation in WAZ and HAZ by quality of drinking water. error bars represent 95% CI around the meanFigure 4a-bVariation in WAZ and HAZ by quality of drinking water. error bars represent 95% CI around the mean.
a-b
� 1991
� 1998
Year
Poor Medium Good
Quality of drinking water
-1.00
-0.80
-0.60
-0.40
-0.20
waz
� 1991
� 1998
Year
Poor Medium Good
Quality of drinking water
-1.25
-1.00
-0.75
-0.50
haz
BMC Public Health 2006, 6:98 http://www.biomedcentral.com/1471-2458/6/98
Page 11 of 19(page number not for citation purposes)
tive in 1998), however, perhaps reflecting the high sensi-tization toward breastfeeding during the 1990s, shiftingeven high-economic status mothers to frequently breast-feeding their children. Unavailability of adequate data onquality of breastfeeding did not allow us to test thishypothesis. When supplementation food becomes impor-tant (after the age of 6 months), economic status is asso-ciated with improved child nutritional status because ofthe relative facility of high economic status mothers toafford supplementation. The age-specific effect of eco-nomic status found in our study is consistent with Sahn etal. [17], although this study used more aggregated agegroups.
The positive nutritional effect of improved water and san-itation found in this study is consistent with other studiesconducted in developing countries [11,45]. Uncleanwater may affect nutritional status through diarrhoeal dis-eases [46-49]. Further, we found that cleaner fuels wereassociated with better anthropometric indicators, consist-ent with the only other available study, in South India[43]. The role of clean fuels may be mediated by effects onbirth weight [50], or on the risk of respiratory infections[51,52], which may in turn influence growth. Consist-ently with Fotso et al. [19], we also found that better com-munity environmental status positively affectednutritional status after other factors were adjusted, sug-gesting that community hygiene affects health irrespec-tively of individual or household characteristics.
Our study suggests that urban-rural differentials in childnutritional status in Cameroon –especially those betweenthe intermediate cities and rural areas–are mediated bythe socioeconomic composition of those areas. The rela-tive advantage of the largest cities over the rural areasdeclined after all controls, but remained positive (exceptfor HAZ in 1991), which may be attributable to some con-textual factors such as better access to and quality ofhealth care in the main cities. This is consistent to someextent with Kuate [53] who found urban advantage in sur-vival of children under 5 years old in Cameroon to becompletely mediated by hospital delivery.
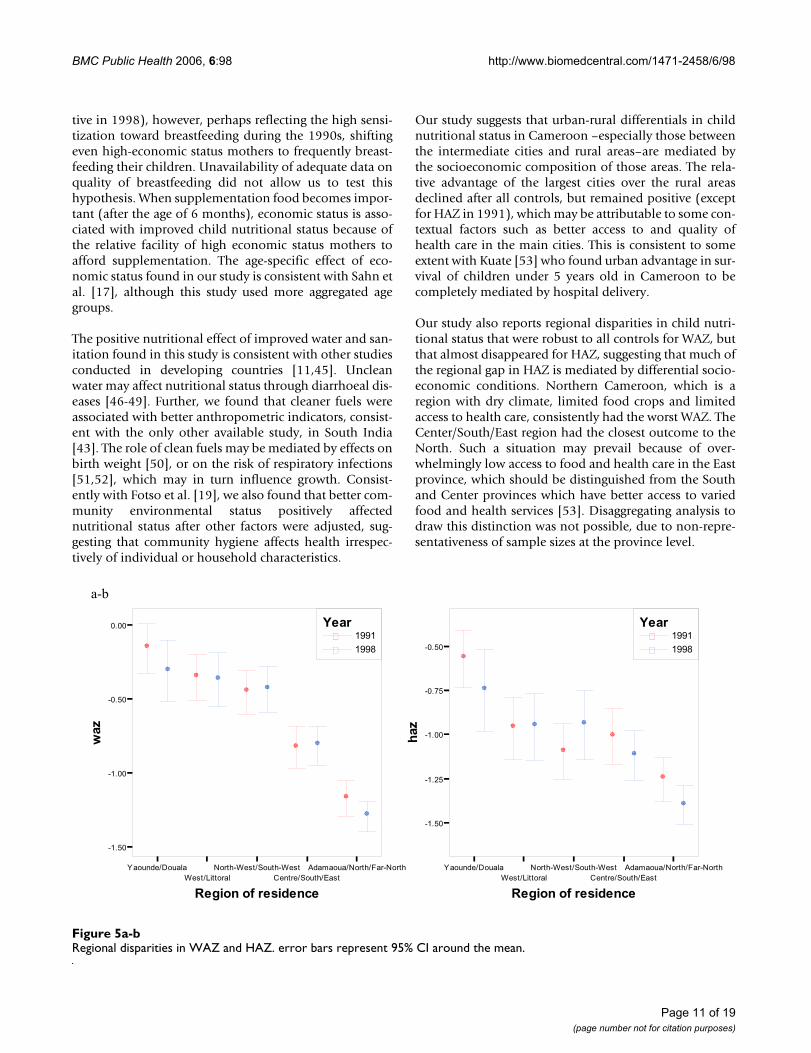
Our study also reports regional disparities in child nutri-tional status that were robust to all controls for WAZ, butthat almost disappeared for HAZ, suggesting that much ofthe regional gap in HAZ is mediated by differential socio-economic conditions. Northern Cameroon, which is aregion with dry climate, limited food crops and limitedaccess to health care, consistently had the worst WAZ. TheCenter/South/East region had the closest outcome to theNorth. Such a situation may prevail because of over-whelmingly low access to food and health care in the Eastprovince, which should be distinguished from the Southand Center provinces which have better access to variedfood and health services [53]. Disaggregating analysis todraw this distinction was not possible, due to non-repre-sentativeness of sample sizes at the province level.
Regional disparities in WAZ and HAZ. error bars represent 95% CI around the meanFigure 5a-bRegional disparities in WAZ and HAZ. error bars represent 95% CI around the mean.
a-b
� 1991
� 1998
Year
Yaounde/Douala
West/Littoral
North-West/South-West
Centre/South/East
Adamaoua/North/Far-North
Region of residence
-1.50
-1.00
-0.50
0.00
waz
� 1991
� 1998
Year
Yaounde/Douala
West/Littoral
North-West/South-West
Centre/South/East
Adamaoua/North/Far-North
Region of residence
-1.50
-1.25
-1.00
-0.75
-0.50
haz
BMC Public Health 2006, 6:98 http://www.biomedcentral.com/1471-2458/6/98
Page 12 of 19(page number not for citation purposes)
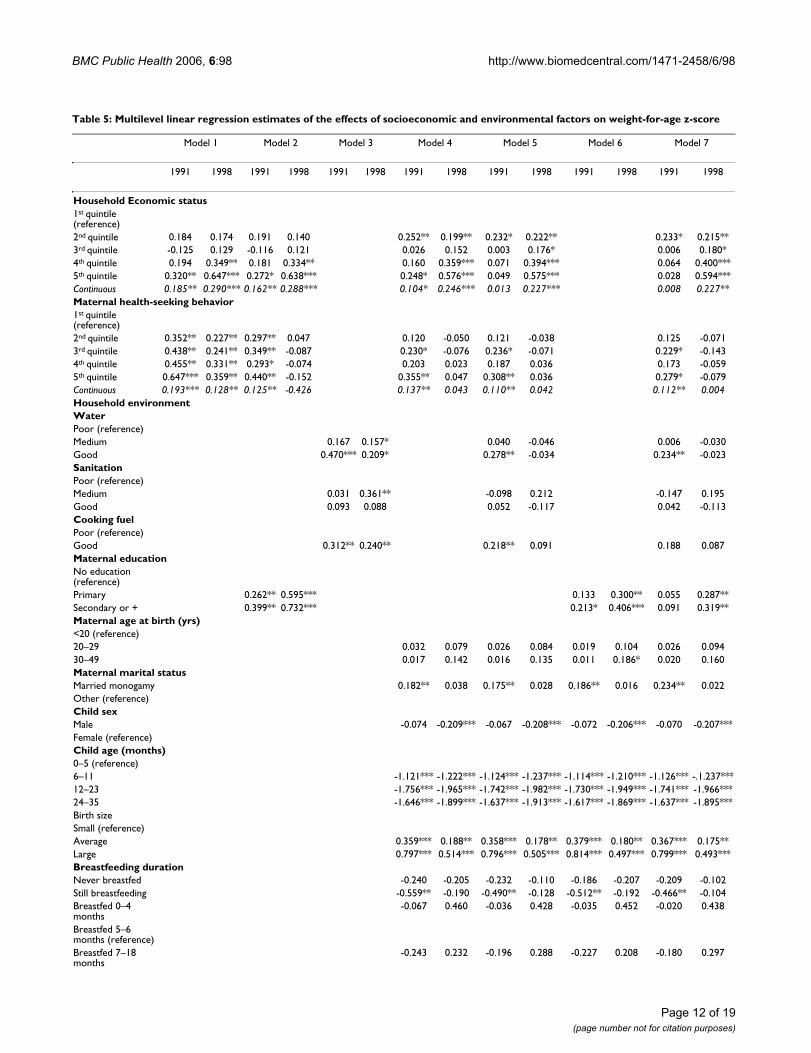
Table 5: Multilevel linear regression estimates of the effects of socioeconomic and environmental factors on weight-for-age z-score
Model 1 Model 2 Model 3 Model 4 Model 5 Model 6 Model 7
1991 1998 1991 1998 1991 1998 1991 1998 1991 1998 1991 1998 1991 1998
Household Economic status1st quintile (reference)2nd quintile 0.184 0.174 0.191 0.140 0.252** 0.199** 0.232* 0.222** 0.233* 0.215**3rd quintile -0.125 0.129 -0.116 0.121 0.026 0.152 0.003 0.176* 0.006 0.180*4th quintile 0.194 0.349** 0.181 0.334** 0.160 0.359*** 0.071 0.394*** 0.064 0.400***5th quintile 0.320** 0.647*** 0.272* 0.638*** 0.248* 0.576*** 0.049 0.575*** 0.028 0.594***Continuous 0.185** 0.290*** 0.162** 0.288*** 0.104* 0.246*** 0.013 0.227*** 0.008 0.227**Maternal health-seeking behavior1st quintile (reference)2nd quintile 0.352** 0.227** 0.297** 0.047 0.120 -0.050 0.121 -0.038 0.125 -0.0713rd quintile 0.438** 0.241** 0.349** -0.087 0.230* -0.076 0.236* -0.071 0.229* -0.1434th quintile 0.455** 0.331** 0.293* -0.074 0.203 0.023 0.187 0.036 0.173 -0.0595th quintile 0.647*** 0.359** 0.440** -0.152 0.355** 0.047 0.308** 0.036 0.279* -0.079Continuous 0.193*** 0.128** 0.125** -0.426 0.137** 0.043 0.110** 0.042 0.112** 0.004Household environmentWaterPoor (reference)Medium 0.167 0.157* 0.040 -0.046 0.006 -0.030Good 0.470*** 0.209* 0.278** -0.034 0.234** -0.023SanitationPoor (reference)Medium 0.031 0.361** -0.098 0.212 -0.147 0.195Good 0.093 0.088 0.052 -0.117 0.042 -0.113Cooking fuelPoor (reference)Good 0.312** 0.240** 0.218** 0.091 0.188 0.087Maternal educationNo education (reference)Primary 0.262** 0.595*** 0.133 0.300** 0.055 0.287**Secondary or + 0.399** 0.732*** 0.213* 0.406*** 0.091 0.319**Maternal age at birth (yrs)<20 (reference)20–29 0.032 0.079 0.026 0.084 0.019 0.104 0.026 0.09430–49 0.017 0.142 0.016 0.135 0.011 0.186* 0.020 0.160Maternal marital statusMarried monogamy 0.182** 0.038 0.175** 0.028 0.186** 0.016 0.234** 0.022Other (reference)Child sexMale -0.074 -0.209*** -0.067 -0.208*** -0.072 -0.206*** -0.070 -0.207***Female (reference)Child age (months)0–5 (reference)6–11 -1.121*** -1.222*** -1.124*** -1.237*** -1.114*** -1.210*** -1.126*** -.1.237***12–23 -1.756*** -1.965*** -1.742*** -1.982*** -1.730*** -1.949*** -1.741*** -1.966***24–35 -1.646*** -1.899*** -1.637*** -1.913*** -1.617*** -1.869*** -1.637*** -1.895***Birth sizeSmall (reference)Average 0.359*** 0.188** 0.358*** 0.178** 0.379*** 0.180** 0.367*** 0.175**Large 0.797*** 0.514*** 0.796*** 0.505*** 0.814*** 0.497*** 0.799*** 0.493***Breastfeeding durationNever breastfed -0.240 -0.205 -0.232 -0.110 -0.186 -0.207 -0.209 -0.102Still breastfeeding -0.559** -0.190 -0.490** -0.128 -0.512** -0.192 -0.466** -0.104Breastfed 0–4 months
-0.067 0.460 -0.036 0.428 -0.035 0.452 -0.020 0.438
Breastfed 5–6 months (reference)Breastfed 7–18 months
-0.243 0.232 -0.196 0.288 -0.227 0.208 -0.180 0.297

BMC Public Health 2006, 6:98 http://www.biomedcentral.com/1471-2458/6/98
Page 13 of 19(page number not for citation purposes)
Breastfed 19 months or more
-0.534** 0.054 -0.465** 0.119 -0.503** 0.061 -0.435* 0.152
Preceding birth intervalFirst born child -0.002 0.023 -0.008 0.034 -0.029 0.005 -0.009 0.02507–18 months -0.088 -0.248* -0.102 -0.233* -0.099 -0.279** -0.102 -0.248*19–23 months -0.182 -0.864 -0.161 -0.089 -0.164 -0.089 -0.158 -0.09624 months or more (reference)Place of residenceYaounde/Douala 0.373** 0.366** 0.298 0.337*Intermediate cities -0.140 0.001 -0.162 -0.060RuralRegionWest/Littoral 0.686*** 0.778*** 0.663*** 0.791*** 0.601*** 0.533*** 0.575*** 0.618***North-West/South-West
0.599*** 0.808*** 0.605*** 0.831*** 0.574*** 0.558*** 0.520*** 0.657***
Center/South/East 0.308** 0.356** 0.276** 0.362*** 0.211 0.091 0.186 0.177Adamaoua/North/Far-North (reference)Community environmental index
0.117** 0.078** 0.074* 0.003
Log-Likelihood -5729.851 -5705.574 -5739.404 -5198.523 -5183.880 -5205.653 -5177.527Number of children 3321 3321 3321 3321 3321 3321 3321Number of clusters 350 350 350 350 350 350 350Random-effects parametersBetween-individual variance (95 CI)
1.749 (1.663–1.841)
1.745 (1.659–1.836)
1.740 (1.654–1.830)
1.30 (1.232–1.363) 1.285 (1.221–1.352)
1.300 (1.236–1.367)
1.281 (1.218–1.348)
Between-cluster variance (95 CI)
0.132 (0.089–0.196)
0.095 (0.059–0.153)
0.172 (0.124–0.239)
0.054 (0.031–0.097)
0.053 (0.030–0.097)
0.0572 (0.033–0.099)
0.052 (0.028–0.094)
Notes: -Each model (except for models 3 and 6) was estimated twice; for the first estimation, economic status and maternal health-seeking behavior were included as continuous variables, all other variables remaining unchanged, and for the second estimation, the quintiles of these variables were included; the table reports coefficients on other variables for the second estimation. A dummy indicator for missing values was also included for each variable with missing values. CI denotes confidence interval.-Statistical significance: *: P < 0.10; **: p < 0.05; ***: p < 0.001
Table 5: Multilevel linear regression estimates of the effects of socioeconomic and environmental factors on weight-for-age z-score

BMC Public Health 2006, 6:98 http://www.biomedcentral.com/1471-2458/6/98
Page 14 of 19(page number not for citation purposes)
Table 6: Multilevel linear regression estimates of the effects of socioeconomic and environmental factors on height-for-age z-score
Model 1 Model 2 Model 3 Model 4 Model 5 Model 6 Model 7
1991 1998 1991 1998 1991 1998 1991 1998 1991 1998 1991 1998 1991 1998
Household economic status1st quintile (reference)2nd quintile 0.163 0.241** 0.172 0.213* 0.181 0.248** 0.140 0.248** 0.147 0.241**3rd quintile -0.186 0.120 -0.171 0.113 -0.115 0.143 -0.152 0.134 -0.141 0.1444th quintile 0.154 0.312** 0.147 0.298** 0.107 0.300** -0.023 0.277** -0.025 0.305**5th quintile 0.429** 0.560*** 0.384** 0.550*** 0.317** 0.502*** 0.067 0.439** 0.047 0.478**Continuous 0.250*** 0.245*** 0.221*** 0.239*** 0.146** 0.206** 0.011 0.160** -0.007 0.176**Maternal health-seeking behavior1st quintile (reference)2nd quintile 0.275* 0.295** 0.217 0.160 0.146 0.129 0.167 0.124 0.175 0.1023rd quintile 0.147 0.135 0.054 -0.111 0.117 -0.037 0.128 -0.035 0.117 -0.0894th quintile 0.301* 0.361** 0.132 0.054 0.234 0.253* 0.214 0.248* 0.193 0.1675th quintile 0.326** 0.365** 0.112 -0.045 0.259 0.260* 0.204 0.237 0.155 0.117Continuous 0.087* 0.123** 0.06 -0.007 0.083 0.108** 0.060 0.103** 0.050 0.071Household environmentWaterPoor (reference)Medium 0.189* 0.146 0.119 -0.026 0.073 0.014Good 0.381** 0.090 0.254** -0.134 0.190 -0.094SanitationPoor (reference)Medium 0.045 0.496** -0.080 0.399** -0.150 0.402**Good 0.125 0.219** 0.089 0.042 0.076 0.051Cooking fuelPoor (reference)Good 0.380*** 0.187** 0.292** 0.059 0.245** 0.064Maternal educationNo education (reference)Primary 0.206* 0.356*** 0.141 0.258** 0.100 0.199Secondary or + 0.374** 0.535*** 0.241* 0.459*** 0.150 0.313**Maternal age at birth (yrs)<20 (reference)20–29 0.015 0.100 -0.004 0.098 0.012 0.129 -0.001 0.10630–49 0.044 0.137 0.040 0.131 0.047 0.188* 0.051 0.157Maternal marital statusMarried monogamy 0.223** -0.022 0.212** -0.029 0.230** -0.032 0.222** -0.030Other (reference)Child sexMale -0.065 -0.198** -0.052 -0.198** -0.065 -0.196** -0.056 -0.198**Female (reference)Child age (months)0–5 (reference)6–11 -0.727*** -0.612*** -0.741*** -0.620*** -0.718*** -0.589*** -0.745*** -0.614***12–23 -1.511*** -1.770*** -1.497*** -1.769*** -1.492*** -1.745*** -1.497*** -1.752***24–35 -1.664*** -1.743*** -1.653*** -1.743*** -1.645*** -1.707*** -1.656*** -1.727***Birth sizeSmall (reference)Average 0.302** 0.120 0.315** 0.124 0.325** 0.114 0.329** 0.124Large 0.552*** 0.352*** 0.567*** 0.124*** 0.566*** 0.356*** 0.572*** 0.351***Breastfeeding durationNever breastfed -0.258 -0.687 -0.258 -0.691 -0.190 -0.679 -0.221 -0.652Still breastfeeding -0.407* -0.412 -0.335 -0.343 -0.313 -0.410 -0.297 -0.307Breastfed 0–4 months
0.052 -0.108 0.081 -0.969 0.104 -0.100 0.110 -0.076
Breastfed 5–6 months (reference)Breastfed 7–18 months
-0.027 -0.103 0.019 -0.041 0.036 -0.111 0.046 -0.013

BMC Public Health 2006, 6:98 http://www.biomedcentral.com/1471-2458/6/98
Page 15 of 19(page number not for citation purposes)
Breastfed 19 months or more
-0.213 -0.189 -0.144 -0.123 -0.142 -0.179 -0.095 -0.077
Preceding birth intervalFirst born child 0.032 -0.074 0.029 -0.075 0.022 -0.100 0.030 -0.0887–18 months -0.021 -0.233 -0.036 -0.237 -0.023 -0.274* -0.033 -0.253*19–23 months -0.152 -0.224** -0.129 -0.221** -0.130 -0.220* -0.125 -0.227**24 months or more (reference)Place of residenceYaounde/Douala -0.092 0.276 -0.198 0.175Intermediate cities -0.206* 0.158 -0.245* 0.041Rural (reference)RegionWest/Littoral 0.218 0.293** 0.185 0.273** 0.069 0.152 0.052 0.160North-West/South-West
0.143 0.400** 0.150 0.406** 0.028 0.268** 0.025 0.315**
Center/South/East 0.251* 0.175 0.217* 0.161 0.096 -0.013 0.072 0.024Adamaoua/North/Far-North (reference)Community environmental index
0.156*** 0.021 0.103** -0.049
Log-Likelihood -5951.931 -5939.119 -5953.087 -5594.023 -5578.431 -5600.445 -5571.327Number of children 3321 3321 3321 3321 3321 3321 3321Number of clusters 350 350 350 350 350 350 350Random-effects parametersBetween individual variance (95 CI)
2.059 (1.958–2.165 2.055 (1.954–2.161)
2.057 (1.957–2.163)
1.660 (1.578–1.746)
1.649 (1.567–1.734)
1.675 (1.592–1.762)
1.647 (1.565–1.732)
Between cluster variance (95 CI)
0.059 (0.029–0.118)
0.042 (0.017–0.105)
0.063 (0.033–0.121)
0.047 (0.022–0.100)
0.041 (0.018–0.095)
0.036 (0.015–0.090)
0.034 (0.013–0.090)
Notes: -Each model (except for models 3 and 6) was estimated twice; for the first estimation, economic status and maternal health-seeking behavior were included as continuous variables, all other variables remaining unchanged, and for the second estimation, the quintiles of these variables were included; the table reports coefficients on other variables for the second estimation. A dummy indicator for missing values was also included for each variable with missing values. CI denotes confidence interval.-Statistical significance: *: P < 0.10; **: p < 0.05; ***: p < 0.001
Table 6: Multilevel linear regression estimates of the effects of socioeconomic and environmental factors on height-for-age z-score

BMC Public Health 2006, 6:98 http://www.biomedcentral.com/1471-2458/6/98
Page 16 of 19(page number not for citation purposes)
Table 7: Change in the coefficients of selected variables between 1991 and 1998
Weight-for-age z-score Height-for-age z-score
Unadjusted model Adjusted model Unadjusted model Adjusted model
Household Economic status1st quintile (reference)2nd quintile -0.027 -0.017 (-0.009) 0.081 0.094 (0.107)3rd quintile 0.194 0.174 (0.172) 0.302* 0.286* (0.286*)4th quintile 0.087 0.337* (0.322*) 0.179 0.331* (0.301)5th quintile 0.238 0.566** (0.526**) 0.164 0.431* (0.371*)Continuous 0.055 0.219** (0.214**) -0.017 0.183 (0.150)MHSB1st quintile (reference)2nd quintile -0.086 -0.196 (-0.160) 0.057 -0.073 (-0.043)3rd quintile -0.144 -0.372* (-0.308*) 0.007 -0.206 (-0.163)4th quintile -0.044 -0.232 (-0.150) 0.059 -0.026 (0.034)5th quintile -0.142 -0.358* (-0.272) 0.106 -0.038 (0.033)Continuous -0.039 -0.108 (-0.068) 0.022 0.021 (0.043)Household environmentWaterPoor (reference)Medium -0.018 -0.036 (-0.087) -0.042 -0.059 (-0.145)Good -0.215 -0.257 (-0.312**) -0.250* -0.284 (-0.387**)SanitationPoor (reference)Medium 0.552*** 0.342 (0.310) 0.078 0.553** (0.479**)Good -0.084 -0.155 (-0.169) -0.031 -0.024 (-0.047)Cooking fuelPoor (reference)Good -0.114 -0.101 (-0.127) -0.201* -0.180 (-0.233*)Maternal educationNo education (reference)Primary 0.142 0.232 (0.167) 0.066 0.099 (0.117)Secondary or + 0.159 0.229 (0.193) 0.074 0.162 (0.218)Maternal marital statusMarried monogamy -0.223** -0.212* (-0.147*) -0.295** -0.251** (-0.241**)Other (reference)Child sexMale -0.187** -0.137* (-0.141*) -0.154 -0.142 (-0.145)Female (reference)Child age (months)0–5 (reference)6–11 -0.129 -0.111 (-0.113) 0.089 0.130 (0.120)12–23 -0.216* -0.225* (-0.240*) -0.320** -0.255* (-0.271*)24–35 -0.204 -0.257 (-0.275) -0.146 -0.071 (-0.090)Place of residenceYaounde/Douala -0.160 0.039 (-0.007) -0.139 0.373 (0.368)Intermediate cities 0.071 0.102 (0.141) 0.084 0.286 (0.364**)Rural (reference)RegionWest/Littoral -0.125 0.043 (-0.068) 0.091 0.107 (0.082)North-West/South-West 0.107 0.137 (-0.016) 0.237 0.291 (0.240)Center/South/East 0.053 -0.008 (-0.120) 0.003 -0.048 (-0.109)Adamaoua/North/Far-North (reference)Community environmental index -0.032 -0.070 (-0.040) -0.049 -0.152** (-0.134**)
Notes: The unadjusted models included only the independent variable of interest; the adjusted models additionally included all other independent variables used in this study (see tables 5–6, model 7); values in parentheses were estimated from model 5 for all variables in the table except for maternal education, place of residence, region and community environmental index which were estimated from model 6. Only selected variables are presented in the table.-Statistical significance: *: P < 0.10; **: p < 0.05; ***: p < 0.001
BMC Public Health 2006, 6:98 http://www.biomedcentral.com/1471-2458/6/98
Page 17 of 19(page number not for citation purposes)
There are some limitations in the data used for this analy-sis. Since this work relied on survey-based data, selectionand recall bias could affect the results. Using a measuredanthropometric indicator of nutritional outcome, how-ever, eliminates one of the most important sources of bias.The measure of community environmental status used inthis study is only a proxy of what the real environmentalconditions and infrastructure are, as factors such as waterstagnation, garbage accumulation and distance to electric-ity grid, which capture the quality of environment, werenot available in our data. The availability of those indica-tors may have produced a better estimate of the effect ofenvironmental infrastructure on child nutritional health.Other limitations of this work stem from the amount ofmissing data. Weight-for-age and height-for-age z-scoreswere calculated for only 81% and 85% of children under3 years old in 1991 and 1998 respectively. Although thefraction of observations with missing value was relativelylow, we found missing data to be correlated with somefactors including household economic status andhygiene, MHSB, child age, and place and region of resi-dence, a potential source of bias.
ConclusionThe age-specific effect of economic status on child nutri-tional status found in this study suggests that childrenaged 0–5 months should be distinguished from olderchildren in the analysis of factors associated with childnutrition outcomes, with an attention to the possible roleof breastfeeding in early ages, as it has been proven tohave great benefits to child health and survival [54-56].
Socioeconomic and environmental effects may varyacross age groups, motivating age-specific analysis of fac-tors affecting health. This study shows that child nutri-tional health is simultaneously influenced by householdand community factors, and can be addressed to someextent, but not entirely, by interventions at either level.Low nutritional status is more likely in children of lowsocioeconomic status, and children at risk are clustered indry regions and within community with poor environ-mental status. Inclusion of household and communityfactors is needed in addressing the issue of child health inCameroon, and will assist in designing more effective con-text-specific intervention programs.
Competing interestsThe author(s) declare that they have no competing inter-ests.
Authors' contributionsRP contributed to the study design, the data analysis andthe writing of the manuscript. ME and JAS supervised allparts of the study and contributed to the methodologyand writing of the manuscript. All authors read andapproved the final version of the manuscript.
AcknowledgementsWe thank two referees and seminar participants at the Harvard Center for Population and Development Studies for very helpful comments on previ-ous versions of this paper. This work was sponsored by the National Insti-tute on Aging (Grant PO1-AG17625). Tetanye Ekoe and Claudine Passo provided useful literature on child nutritional health in Cameroon. We
Table 8: Age-specific effects of household economic status (ES)
Weight-for-age z-score Height-for-age z-score
1991 1998 1991 1998
Child age groups (months)
Unadjusted model
Adjusted model
Unadjusted model
Adjusted model
Unadjusted model
Adjusted model
Unadjusted model
Adjusted model
Effects of ES0–5 0.095 -0.153 0.055 -0.047 -0.069 -0.275** 0.313** 0.202*6–11 0.331*** 0.127 0.427*** 0.295** 0.260** 0.087 0.194* 0.06212–23 0.404*** 0.176** 0.503*** 0.361*** 0.473*** 0.268** 0.408*** 0.269**24–35 0.399*** 0.177** 0.445*** 0.306*** 0.510*** 0.332*** 0.381*** 0.225**
Age-difference in ES effects (each age group is compared to 0–5 months)0–5 (reference)6–11 0.236* 0.280** 0.371** 0.341** 0.329** 0.363** -0.118 -0.14012–23 0.308** 0.330** 0.448*** 0.407*** 0.542*** 0.543*** 0.094 0.06724–35 0.304** 0.330** 0.389*** 0.353*** 0.579*** 0.608*** 0.068 0.023
Notes: The unadjusted models for "ES effects" included child age groups and the interaction terms between child age groups and ES; the adjusted models additionally included the independent variables used in model 4 of tables 5–6 (model 4 was used to avoid correlation of ES with variables such as education and community environmental index; however the full model (model 7) yielded results very similar to those presented in the table). The unadjusted models for "age-difference in ES effects" included child age groups, ES, and the interaction terms between child age groups and ES (except for the interaction term between 0–5 months and ES); the adjusted models additionally included the independent variables used in model 4 of tables 5–6. These models were estimated for the years 1991 and 1998 simultaneously.-Statistical significance: *: P < 0.10; **: p < 0.05; ***: p < 0.001

BMC Public Health 2006, 6:98 http://www.biomedcentral.com/1471-2458/6/98
Page 18 of 19(page number not for citation purposes)
thank Ajay Tandon and Emmanuela Gakidou for valuable inputs to the con-struction of the economic status and MHSB index.
References1. Ezzati M, Lopez AD, Rodgers A, Vander Hoorn S, Murray CJ, The
Comparative Risk Assessment Collaborating Group: Selectedmajor risk factors and global and regional burden of disease.Lancet 2002, 360:1347-1360.
2. Kemgo P: Allaitement et état nutritionnel des enfants et desfemmes. In Cameroun: Enquête Démographique et de Santé 1998Edited by: Bureau Central des Recensements et des Etudes de Popu-lation. Yaoundé; 1999:135-149.
3. Barrère B: Mortalité des enfants de moins de cinq ans. In Cam-eroun: Enquête démographique et de santé 1991 Edited by: DirectionNationale du Deuxième Recensement Général de la Population et del'Habitat. Yaoundé; 1992:131-135.
4. Libité PR: Mortalité des enfants. In Cameroun: Enquête démo-graphique et de santé 2004 Edited by: Bureau Central des Recense-ments et des Etudes de Population. Yaoundé; 2004:213-220.
5. de Onis M, Blossner M, Borghi E, Frongillo EA, Morris R: Estimatesof global prevalence of childhood underweight in 1990 and2015. JAMA 2004, 291(21):2600-06.
6. Popkin BM: The nutrition transition in the developing world.Development Policy Review 2003, 21(5–6):581-597.
7. Scrimshaw NS, Taylor CE, Gordon JE: Interaction of nutrition andinfection. World Health Organization 1968. Monograph Series 57
8. Pelletier DL: Malnutrition, morbidity and child mortality indeveloping countries. In Too young to die: Genes or Gender? Editedby: United Nations. New York: Department of Economic and SocialAffairs, Population Division; 1998:109-132.
9. Pelletier DL, Frongillo EA Jr, Habicht JP: Epidemiologic evidencefor a potentiating effect of malnutrition on child mortality.American Journal of Public Health 1993, 83:1130-1133.
10. Webb Webb P, Block S: Nutrition information and formalschooling as inputs to child nutrition. Economic Development andcultural change 2004, 52(4):. 030014
11. Merchant AT, Jones C, Kiure A, Kupka A, Fitzmaurice G, HerreraMG, Fawzi WW: Water and sanitation associated withimproved child growth. European Journal of Clinical Nutrition 2003,57:1562-1568.
12. Waters H, Saadah F, Surbakti S, Heywood P: Weight-for-age mal-nutrition in Indonesian children, 1992–1999. Int J Epidemio2004, 33:1-7.
13. Frongillo EA Jr, de Onis M, Hanson K: Socioeconomic and demo-graphic factors are associated with Worldwide patterns ofstunting and wasting. Journal of Development 1997,127(12):2302-09.
14. World Bank: Nutritional status and poverty in sub-SaharanAfrica. Findings Africa Region World Bank 1998:108.
15. Mosley WH, Chen LC: An Analytical Framework for the Studyof Child Survival in Developing Countries. Population and Devel-opment Review 1984:25-45.
16. Gwatkin DR, Rustein S, Johnson K, Pande R, Wagstaff A: Socioeco-nomic differences in health, nutrition, and population. WorldBank/HNP Discussion Papers 2000.
17. Sahn DE, Alderman H: On the determinants of nutrition inMozambique: The importance of age-specific effects. WorldDevelopment 1997, 25(4):577-588.
18. Case A, Lubotsky D, Paxson C: Economic status and health inchildhood: the origins of gradient. NBER working paper 2001,8344:.
19. Fotso JC, Kuate DB: Socioeconomic inequalities in early child-hood malnutrition and morbidity: modification of the house-hold-level effects by the community SES. Health & place 2005,11(3):205-225.
20. Lape MBome, Garba Messomo MT, Rikong Adie H, Sajo Nana EC,Noubi L, Njinang KM, Fotso M: Enquête Nutritionnelle dans le district desanté de Moloundou. Rapport technique Yaoundé: Ministère de laRecherche Scientifique et Technique; 2000.
21. Ganyam NG: Nutritional Status of Children (0–5 years) in BaliSub-Division: Anthropometry and risk factors. Doctor of Med-icine thesis, Universty of Yaounde 1, Faculty of Medicine and Biomedical Sci-ences 1998.
22. Piechulek H, Mendoza JA: Les enfants de poids insuffisant à lanaissance: Les exigences d'un programme de surveillance
nutritionnelle. Exemple: La zone rurale de la province duLittoral (Cameroun). Médecine d'Afrique Noire 1996, 43(2):67-70.
23. Kuate DB, Ed: Nutrition and child health in Cameroon Westmount:Price-Patterson Ltd, Canadian publishers; 2001.
24. Gibbons LS: Income distribution, poverty and consumer preferences inCameroon Washington: World Bank; 1991. CMR00613
25. Bureau of Statistics and National Accounts: Living conditions and pov-erty in Cameroon in 2001 World Bank; 2002. CMR03518
26. [http://www.measuredhs.com]. (access 09/15/2003)27. Fishman SM, Caulfield LE, de Onis M, Blössner M, Hyder AA, Mullany
L, Black RE: Childhood and maternal underweight. In Compara-tive Quantification of Health Risks: The Global and Regional Burden of Dis-ease Attributable to Selected Major Risk Factors Edited by: Ezzati M,Lopez AD, Rodgers A, Murray CJL. Geneva:World Health Organisa-tion; 2004:39-131.
28. Ferguson BD, Tandon A, Gakidou E, Murray CJL: Estimating per-manent income using indicator variables. In Health Systems Per-formance Assessment: Debates, Methods and Empiricism Edited by:Murray CJL, Evans DB Geneva. World Health Organization;2003:747-760.
29. Kawachi I, Berkman LF, eds: Neighborhoods and Health New York:Oxford University Press; 2003.
30. Subramanian SV, Chen J, Rehkopf D, Waterman PD, Krieger N:Racial disparities in context: a multilevel analysis of neigh-borhood variations in poverty and excess mortality amongblack populations. American Journal of Public Health 2005,95(2):260-265. [Errata: 95, 3: 375]
31. Jones K, Duncan C: Individuals and their ecologies: analyzingthe geography of chronic illness within a multilevel modelingframework. Health & Place 1995, 1(1):27-40.
32. Golstein H: Multilevel models in educational and social research London:Charles Griffin; 1987.
33. Gubry P, Lamlenn BS, Ngwé E, Tchégho JM, Timnou JP, Véron Jacques, eds: Le retour au village Une solution à la crise économique au Cameroun?Paris: L'Harmattan, MINREST, IFORD, CEPED; 1996.
34. Beauchemin C, Bocquier P: Migration and urbanization in Fran-cophone West Africa: A review of the recent empirical evi-dence. Développement, Institutions & Analyses de Long Terme Workingpaper 2003:DT/2003/09.
35. Sunderlin WD, Pokam J: Economic crisis and forest coverchange in Cameroon: The roles of migration, crop diversifi-cation, and gender division of labor. Economic Development andCultural Change 2002, 50:581-606.
36. Libité PR: Fécondité. In Cameroun: Enquête démographique et desanté 1991 Edited by: Direction Nationale du Deuxième Recense-ment Général de la Population et de l'Habitat. Yaoundé; 1992:30-42.
37. Libité PR: Fécondité. In Cameroun: Enquête démographique et desanté 1998 Edited by: Bureau Central des Recensements et desEtudes de Population. Yaoundé; 1998:37-56.
38. Heston A, Summers R, Bettina A: Penn World Table Version 6.1 Centerfor International Comparisons at the University of Pennsylvania(CICUP); 2002.
39. de Onis M, Frongillo EA, Blossner M: Is malnutrition declining?An analysis of changes in levels of child malnutrition since1980. Bulletin of the World Health Organization 2000, 78:1222-1233.
40. Block SA, Kiess L, Webb P, Kosen S, Moench-Pfanner R, Bloem MW,Timmer CP: Macro shock and micro outcomes: child nutritionduring Indonesia's crisis. Economic and Human Biology 2004,2:21-44.
41. Ezzati M, Vander Hoorn S, Lawes CMM, Leach R, James WPT, LopezAD, Rodgers A, Murray CJL: Rethinking the "diseases of afflu-ence" paradigm: global patterns of nutritional risks in rela-tion to economic development. PloS Medecine 2005, 2(5):e133.
42. Doak C, Adair LS, Bentley ME, Monteiro C, Popkin BM: The dualburden household and the nutrition transition paradox. Inter-national Journal of Obesity 2005, 29:129-136.
43. Jeyaseelan L, Lakshman M: Risk factors for malnutrition in SouthIndian children. J Biosoc Sci 1997, 29:93-100.
44. Masudi UJ: Covariates of child mortality in Mali: Does theHealth-Seeking Behavior of the mother matter? J biosoc Sci2001, 33:33-54.
45. Magnani RJ, Mock NB, Bertrand WE, Clay DC: Breastfeeding,water and sanitation, and childhood malnutrition in the Phil-ippines. J Biosoc Sci 1993, 25:195-211.
46. Alam DS, Marks GC, Baqui AH, Yunus M, Fuchs GJ: Associationbetween clinical type of diarrhea and growth of children
http://www.ncbi.nlm.nih.gov/entrez/query.fcgi?cmd=Retrieve&db=PubMed&dopt=Abstract&list_uids=8342721
http://www.ncbi.nlm.nih.gov/entrez/query.fcgi?cmd=Retrieve&db=PubMed&dopt=Abstract&list_uids=8342721
http://www.ncbi.nlm.nih.gov/entrez/query.fcgi?cmd=Retrieve&db=PubMed&dopt=Abstract&list_uids=9881122
http://www.ncbi.nlm.nih.gov/entrez/query.fcgi?cmd=Retrieve&db=PubMed&dopt=Abstract&list_uids=9881122
http://www.ncbi.nlm.nih.gov/entrez/query.fcgi?cmd=Retrieve&db=PubMed&dopt=Abstract&list_uids=8478369

Publish with BioMed Central and every scientist can read your work free of charge
"BioMed Central will be the most significant development for disseminating the results of biomedical research in our lifetime."
Sir Paul Nurse, Cancer Research UK
Your research papers will be:
available free of charge to the entire biomedical community
peer reviewed and published immediately upon acceptance
cited in PubMed and archived on PubMed Central
yours — you keep the copyright
Submit your manuscript here:http://www.biomedcentral.com/info/publishing_adv.asp
BioMedcentral
BMC Public Health 2006, 6:98 http://www.biomedcentral.com/1471-2458/6/98
Page 19 of 19(page number not for citation purposes)
under 5 years in rural Bangladesh. Int J Epidemio 2000,29:916-921.
47. Guerrant RL, Schorling JB, McAuliffe JF, de Souza MA: Diarrhea asa cause and an effect of malnutrition: diarrhea preventscatch-up growth and malnutrition increases diarrhea fre-quency and duration. Am J Trop Med Hyg 1992, 47:28-35.
48. Black RE, Brown KH, Becker S: Effects of diarrhoea associatedwith specific enteropathogens on the growth of children inrural Bangladesh. Pediatrics 1984, 73:799-805.
49. Martorell R, Yarbrough C, Lechtig A, Habicht JP, Klein RE: Diarrhealdiseases and growth retardation in preschool Guatemalanchildren. American Journal of Physical Anthropology 1975, 43:341-346.
50. Boy E, Bruce N, Delgado H: Birth weight and exposure tokitchen wood smoke during pregnancy in rural Guatemala.Environmental Health Perspectives 2002, 110:109-114.
51. Ezzati M, Kammen MD: Indoor air pollution from biomass com-bustion and acute respiratory infections in Kenya: an expo-sure-response study. Lancet 2001, 358:619-624.
52. Smith KR, Samet JM, Romieu I, Bruce N: Indoor air pollution inDeveloping Countries and acute lower respiratory infectionsin Children. Thorax 2000, 55:518-532.
53. Kuate DB: Areal and socioeconomic differentials in infant andchild mortality in Cameroon. Soc Sc Med 1996, 42(3):399-420.
54. Black RE, Victora CG: Optimal duration of exclusive breastfeeding in low economic status countries. BMJ 2002,325:1252-3.
55. Arifeen S, Black RE, Antelman G, Baqui A, Caulfield L, Becker S:Exclusive breastfeeding reduces acute respiratory diseaseand diarrhoea deaths among infants in Dhaka slums. Pediatrics2001, 108:E67.
56. Victora CG, Smith PG, Vaughan JP, Nobre LC, Lombardi C, TeixeiraAM, Fuchs SM, Moreira LB, Gigante LP, Barros FC: Evidence forprotection by breast-feeding against infant deaths frominfectious diseases in Brazil. Lancet 1987, 2(8554):319-321.
Pre-publication historyThe pre-publication history for this paper can be accessedhere:
http://www.biomedcentral.com/1471-2458/6/98/prepub
http://www.ncbi.nlm.nih.gov/entrez/query.fcgi?cmd=Retrieve&db=PubMed&dopt=Abstract&list_uids=1632474
http://www.ncbi.nlm.nih.gov/entrez/query.fcgi?cmd=Retrieve&db=PubMed&dopt=Abstract&list_uids=1632474
http://www.ncbi.nlm.nih.gov/entrez/query.fcgi?cmd=Retrieve&db=PubMed&dopt=Abstract&list_uids=1632474
http://www.ncbi.nlm.nih.gov/entrez/query.fcgi?cmd=Retrieve&db=PubMed&dopt=Abstract&list_uids=6374599
http://www.ncbi.nlm.nih.gov/entrez/query.fcgi?cmd=Retrieve&db=PubMed&dopt=Abstract&list_uids=6374599
http://www.ncbi.nlm.nih.gov/entrez/query.fcgi?cmd=Retrieve&db=PubMed&dopt=Abstract&list_uids=6374599
http://www.ncbi.nlm.nih.gov/entrez/query.fcgi?cmd=Retrieve&db=PubMed&dopt=Abstract&list_uids=1211430
http://www.ncbi.nlm.nih.gov/entrez/query.fcgi?cmd=Retrieve&db=PubMed&dopt=Abstract&list_uids=1211430
http://www.ncbi.nlm.nih.gov/entrez/query.fcgi?cmd=Retrieve&db=PubMed&dopt=Abstract&list_uids=1211430
http://www.ncbi.nlm.nih.gov/entrez/query.fcgi?cmd=Retrieve&db=PubMed&dopt=Abstract&list_uids=2886775
http://www.ncbi.nlm.nih.gov/entrez/query.fcgi?cmd=Retrieve&db=PubMed&dopt=Abstract&list_uids=2886775