Socioeconomic and environmental impacts of the Prestige ... · SOCIOECONOMIC AND ENVIRONMENTAL...
36
SOCIOECONOMIC AND ENVIRONMENTAL IMPACTS OF THE PRESTIGE OIL SPILL IN SPAIN Maria L. Loureiro ([email protected]) University of Santiago de Compostela (Spain)
Transcript of Socioeconomic and environmental impacts of the Prestige ... · SOCIOECONOMIC AND ENVIRONMENTAL...

SOCIOECONOMIC AND
ENVIRONMENTAL IMPACTS OF
THE PRESTIGE OIL SPILL IN
SPAIN
Maria L. Loureiro
University of Santiago de Compostela (Spain)

Objective
This present work contributes to the previous
assessment literature mostly assessing the total
damages (total economic value) of the Prestige
oil spill in Spain, including environmental damages.
It has been used by the Prosecutor in the Spanish
trial against the Prestige tank.

The Prestige Accident
On November 13, 2002, the single-hull 26 year-old oil tanker, Prestige, suffered a serious accident just 46 kilometers away from the Finisterra Cape, in the Northwest of Galicia (Spain).
It carried about 77,000 metric tons (MT) of heavy low-quality oil.
The Prestige sank 222 Kilometers away from the Cies Islands on November 19, 2002, after splitting in two during a storm.

The Prestige Spill
The Prestige spilled more than 60,000 MT of oil, polluting more
than 1,300 kilometers of coastline. Its spill was the most serious
environmental accident ever suffered in Spanish and European
waters.

The largest oil spill in Europe in the last 30 years
Ship Year Place Oiled Birds Collected Mortality
Torrey Canyon 1967 Cornualles (UK) 7,000 25,000
Amoco Cadiz 1978 Bretaña (France) 5,000 22,000
Exxon Valdez 1989 Alaska(USA) 30,000 100,000-300,000
Braer 1993 Shetland (UK) 1,500 5,000
Sea Empress 1996 Gales (UK) 4,600 10,000-15,000
Erika 1999 Bretaña (France) 77,000 150,000-300,000
Prestige 2002 Galicia (Spain) 15,610 115,000-230,000
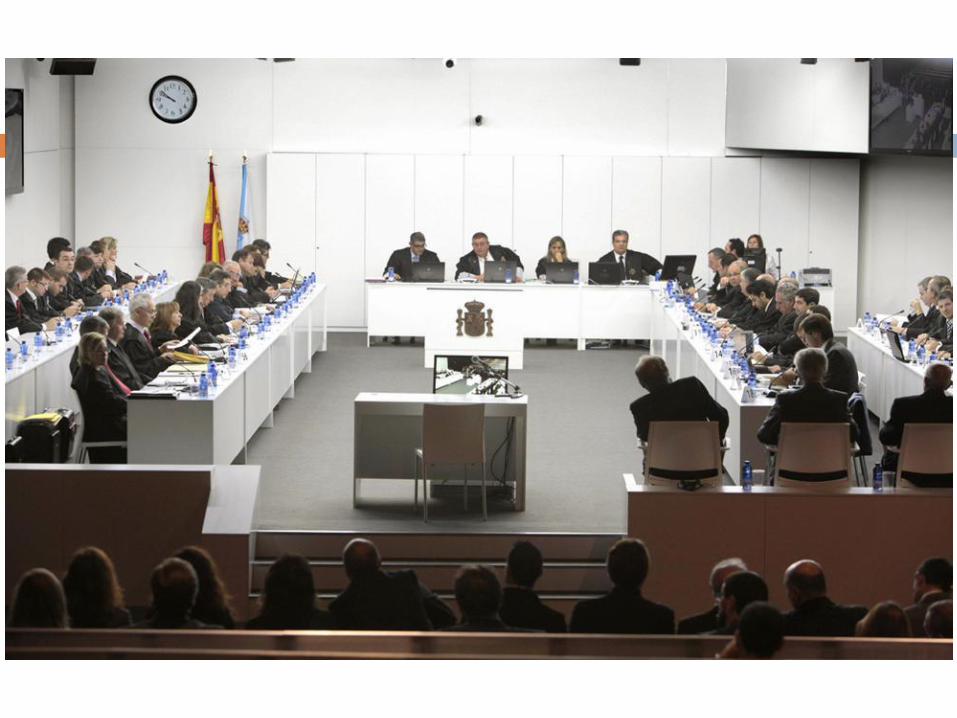

Testifying in trial
8 hours of oral
testification
MAIN ISSUES:
causality, causality,
causality....

SOCIAL COST of PRESTIGE OIL SPILL
Oil Spill
Direct Cost
Cleaning Cost
Restoration Activities
Other losses
Daño ambiental puro
Total Economic Cost
Ecosystem
Services
Damages to Fisheries
Canning and Fish Processing Sector
Marine Transport
Health Damages
Tourims and Recreational Losses
Pure Environmental Damage (Non-Use Values)

• Fisheries Losses: Market prices
• Losses in tourism sector: Travel cost method
• Image Losses: Hedonic Price Model
• Non-use values: Contingent Valuation
• Health Costs: “Cost of Illness Approach”
Tecnhiques
METHODOLOGY: ECOSYSTEM SERVICE ASSESSMENT
Exxon Valdez (EE.UU, 1991): Coste de viaje y método de valoración contingente (Carson et al., 1992) http://are.berkeley.edu/~gh082644/Exxon%20Valdez%20Oil%20Spill.pdf
Erika (Francia, 1999): Coste de viaje y método de valoración contingente (Bonnieux y Rainelli, 2001)
Deep Water Horizon (EE.UU, 2010): valoración contingente y coste de viaje

Premises of Work
ECONOMIC MAGNITUDES:
expressed in 2011 (prices updated via
CPI)
Sources: OFFICIAL DATA
GEOGRAPHICAL AREA: GALICIA
AND CANTABRIC COAST
SHORT TERM (accident- 2004)
& MID_TERM COSTS (accident-
2006)

LOSSES IN THE FISHERIES
SECTOR

FISH CATCH LOSSES
0
20,000,000
40,000,000
60,000,000
80,000,000
100,000,000
120,000,000
140,000,000
160,000,000
180,000,000
200,000,000
1998 1999 2000 2001 2002 2003 2004 2005 2006 2007 2008
Total Fish Catches in Kilos
Capturas (Kg)
Elaborado a partir del Cuadro 3.2 Pág 21, Informe
Pericial

Fishing and Sellfish sectors
Data from different regional statistical departments from all the
Cantabric coast in North Spain (all affected regions).
Total losses for the entire Spanish fishing sector: 296.26 millions
for the period 2002-2006.
Economic value of fisheries
Mean 1999-2001 2002 2003 2004 2005 2006
Galicia 471.76 406.12 400.94 452.37 463.72 469.85
Asturias 49.17 48.02 49.24 52.89 57.64 48.94
Cantabria 40.42 36.91 24.47 28.24 26.67 32.31
Basque
Country 115.05 98.66 84.59 111.12 90.27 129.75
Losses at real prices -86.69 -117.24 -35.50 -46.57 -10.24

PRICE DROP AFTER SPILL
0
20
40
60
80
100
120
140
160
180
1998 2000 2002 2004 2006
Media anual crustaceos, moluscos y preparados de pescado España
Media anual crustaceos, moluscos y preparados de pescado Galicia
Figura Pág 31, Informe Pericial Fuente: INE
Evolución del IPC de las rúbricas crustáceos, moluscos y preparados de pescado
en Galicia y España durante el período 1998-2006 (Precios constantes, base
1996=100 base 2001=100)

Examples of price drop: Mackarel

Time series of fish prices
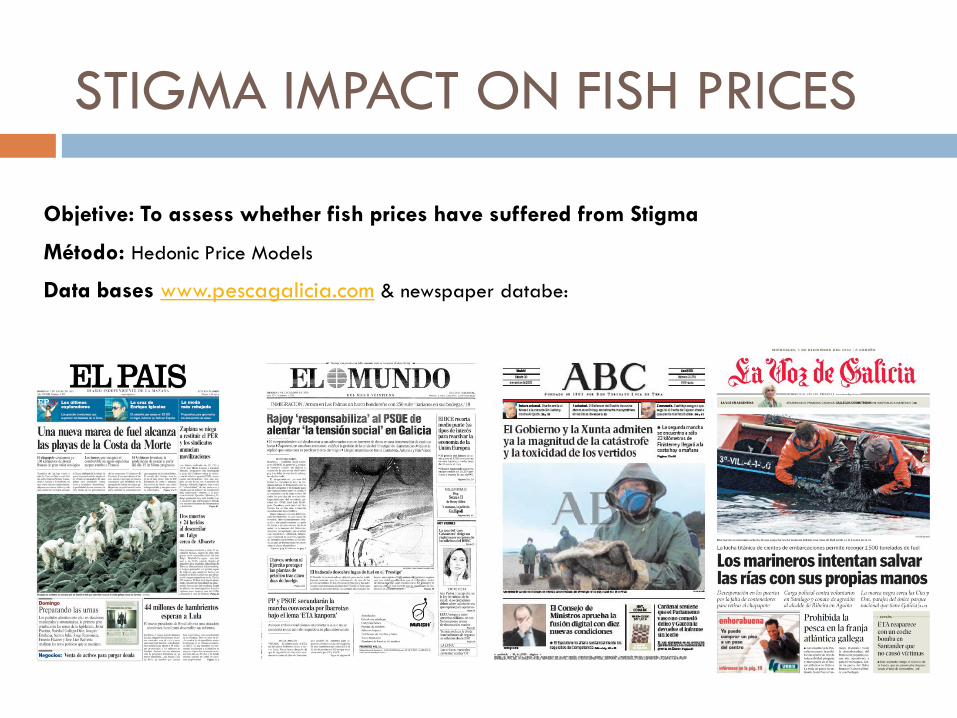
Objetive: To assess whether fish prices have suffered from Stigma
Método: Hedonic Price Models
Data bases www.pescagalicia.com & newspaper databe:
STIGMA IMPACT ON FISH PRICES

NUMBER OF PUBLISHED NEWS OVER TIME
Definición de variables:
Periodo 1: antes del hundimiento del buque Prestige
Periodo 2: desde la fecha del accidente hasta el 31/12/2003
Periodo 3: Año 2004
Periodo 4: Año 2005
Periodo 5: Año 2006
236
478
379
259 252
187 199 171
139 119 102 107
179
115 84 74
96 87 67
89 52 52 43 59
120
38 47 76 59 42 54 51 38 22 18
43 34 37 18 11 11 10 18 25 16 25 20 30 26 16 0
100
200
300
400
500
600
Noticias totales por meses
El Mundo La Voz de Galicia ABC El Pais
Figura Pág 323,
Informe Pericial

STIGMA EFFECT: HEDONIC MODEL
The model was estimated as:
Price=F(lagged news, fish species, local
variables….)
The hypothesis to be tested:
Do news impact in a negative way….?

PELAGIC SPECIES : HeDONIC REGRESSION MODEL
Precio Coeficiente Std. Err. P>|t|
Periodo 1=Antes del Prestige 4,561 0,048 0,000
Periodo 2= 4,298 0,049 0,000
Periodo 3=2003 4,211 0,048 0,000
Periodo 4=2004 4,220 0,048 0,000
Periodo 5=2005 4,198 0,048 0,000
Noticias no negativas -0,015 0,006 0,013
Vigo -0,433 0,016 0,000
Pontevedra -0,357 0,016 0,000
Muros -0,654 0,019 0,000
Fisterra -0,320 0,024 0,000
Costa da Morte -0,444 0,017 0,000
Cedeira -0,208 0,021 0,000
Mariña -0,814 0,016 0,000
Coruña-Ferrol -0,787 0,016 0,000
Abadejo 1,796 0,047 0,000
Bonito del Atlántico 0,442 0,083 0,000
Bacaladilla -2,902 0,048 0,000
Merluza 1,171 0,047 0,000
Quenlla -2,410 0,056 0,000
Sardina -2,852 0,048 0,000
Caballa -3,150 0,047 0,000
Jurel -2,862 0,047 0,000
Invierno 0,211 0,013 0,000
Primavera 0,020 0,012 0,086
2 0,692R
N=114.720
Figura Pág 68-69,
Informe Pericial

Cantidades
vendidas (kg)
Diferencias de
precios(€/kg) Pérdida por periodo(€)
12/11/2002-
31/12/2003 71.196.720 -0,263 -18.706.867
Año 2004 87.811.882 -0,350 -30.697.453
Año 2005 97.437.816 -0,340 -33.168.125
Año 2006 100.716.070 -0,363 -36.559.128
TOTAL -119.131.573
Pérdidas de Imagen: GALICIA
Modelo de Regresión del Precio: Especies Pelágicas
Pérdidas de imagen en los pescados pelágicos(€ nominales)
Figura Pág 71, Informe Pericial

For more information

Sectorial analyses were conducted in order to
assess economic damages. The most affected
sectors were the fishing and tourism sectors.
Tourism losses

Tourism sector
Data collected from the Institute of Tourism Studies. Total damages in
the first four years after the Prestige oil spill: €718.78 million.
Total expenditures of domestic tourists
2002 2003 2004 2005 2006
Galicia 1,287.96 1,136.07 1,486.89 1,105.97 1,182.76
Asturias 342.72 354.87 454.39 480.41 500.79
Cantabria 349.49 319.40 362.83 495.20 497.98
Basque Country 288.98 276.16 390.04 359.10 338.34
Losses at real prices -151.89 -181.99 -105.20
Total expenditures of international tourists
2002 2003 2004 2005 2006
Galicia 589.95 468.63 608.65 937.23 876.11
Asturias 130.54 105.40 184.16 282.40 226.22
Cantabria 129.66 120.59 215.26 319.92 273.14
Basque Country 558.57 477.38 572.96 611.46 638.51
Losses at real prices -236.72

Other Economic Damages
Maritime transportation:
To compute the reduction in the international shipping, we collected data from different regional maritime departments, such as the Galician Institute of Statistics and the Department of Transportation.
In year 2003, the damage amounted to €0.80 millions in Galicia and €4.58 millions in the entire Cantabrian coast.
Cleaning tasks:
In Galicia during 2002-2003 amounted to €387.43 millions. In the case of Spain, the losses rose to € 446.97 million until 2006.

Public Administration Expenditures
Total: €451.69 million in Galicia and €737.18 million for the total of Spain.
These amounts include expenses related to:
Cleaning tasks (€446.97 millions)
Expenses to build infrastructures (€31.12 millions)
Fiscal measures taken to assist those affected by the sinking of the Prestige (€26.75 millions)
Campaigns made with the goal to restore the image of Galicia as a desirable tourist destination (€31.04 millions)
Payments to support fishermen while fishing bands were established (€171.33 millions).
Restoring of the food safety standards of fish and shellfish (about €49 millions)
Research to learn about the impact of this spill (€15 millions).

Computing environmental damages
Environmental Damages (or non-market damages) were computed in a similar fashion as in the Exxon Valdez oil spill; i.e. asking individuals how much they would be willing to pay from their own pocket to avoid the environmental damages caused by the Prestige oil spill.

Contingent Valuation (CV)
A survey was employed following the guidelines suggested by
Carson et al. (2003).
Data collection: Steps
2006
1. Five discussion groups: La Coruña, Orense, Vigo, Madrid y Barcelona.
2. Pre-test survey-pilot 1: Oviedo and León (North part)
3. Pretest survey-pilot 2: Murcia y Castellón (South eastern part)
4. Final survey: data collection over 3 months, concluded in August 2006
A total of 1,140 surveys were collected

Contingent Valuation (CV) II
Invididuals were asked how much they would be willing to pay to finance an oil spill
prevention program. This program would reduce the impact and damages of future oil
spills.
Oil Spill Prevention Program
European Program
Experimental stage in Spanish
waters
Survillance of ships across
Spanish waters
Scort ships: carry equipment
and qualified personell

Contingent Valuation (CV) III
Realistic Description of:
Economic damages
Environmental Damages
Health Effects on voluntiers
Use of photographs of
healthy animals, clean
beaches, etc.

Contingent Valuation (CV) IV
Based on scientific predictions of damages, individuals were shown the difference between the expected environmental damages in the next 7 years with and without the proposed program.

WTP question and results
The WTP question for the oils spill prevention and response program was the following:
Mean WTP by household:
Spain: €40.51
Galicia (the most affected area): €228.28
According to last national statistics, Loureiro, Loomis and Vázquez (2009) estimated the mean social WTP amounts to:
Spain: €1174.76 millions
Galicia: €669.30
It is expected that this program is in full operation in 2010. If the application of
the escort ship program described above would cost your household xx€-, would
you vote in favour to pay this amount just one single time (say in the next tax
declaration) to reduce the damages described from the oil spill to the nature and
fauna by oil spills?
YES …..1 NO …..2 DON´T KNOW….. 3

For more information

TEV= Use values + Non-use values
Conclusion

Conclusion
Total amount of damages:
Galicia 2002-2006: €2413 million
Spain 2002-2006: €3551.81 million
Spain + France 2002-2006: €3635.18 million
Public Administration expenditure:
Galicia: €451.69 million
Spain: €737.18 million

Conclusion II
Nowadays, such important losses have not been yet compensated/awarded to the affected parties.
The capitan was found not guilty of negligence or wrong doing.
Thus, although human and governmental actions were significant in order to restore the affected ecosystems, still much work has to be done to restore the damage caused to the private affected parties, and to the public.