
Host Immune Responses That Promote Initial HIV Spread · Abstract The host in ammatory response to...
54
Host Immune Responses That Promote Initial HIV Spread K. Wendelsdorf a , G. Dean b , Shuhua Hu c , S. Nordone b , and H.T. Banks c a Virginia Bioinformatics Institute Virginia Polytechnic Institute and University Washington Street, MC 0477 Blacksburg, Virginia 24061 USA b Center for Comparative Medicine and Translational Research Department of Molecular Biomedical Sciences College of Veterinary Medicine North Carolina State University Raleigh, NC 27606 USA and c Center for Research in Scientific Computation Center for Quantitative Sciences in Biomedicine North Carolina State University Raleigh, NC 27695-8205 USA July 1, 2011 1
Transcript of Host Immune Responses That Promote Initial HIV Spread · Abstract The host in ammatory response to...

Host Immune Responses That Promote Initial HIV Spread
K. Wendelsdorfa, G. Deanb, Shuhua Huc, S. Nordoneb, and H.T. Banksc
aVirginia Bioinformatics InstituteVirginia Polytechnic Institute and University
Washington Street, MC 0477Blacksburg, Virginia 24061 USA
bCenter for Comparative Medicine and Translational ResearchDepartment of Molecular Biomedical Sciences
College of Veterinary MedicineNorth Carolina State University
Raleigh, NC 27606 USA
and
cCenter for Research in Scientific ComputationCenter for Quantitative Sciences in Biomedicine
North Carolina State UniversityRaleigh, NC 27695-8205 USA
July 1, 2011
1

Abstract
The host inflammatory response to HIV invasion is a necessary component of the innateantiviral activity that vaccines and early interventions seek to exploit/enhance. However,the response is dependent on CD4+ T-helper cell 1 (Th1) recruitment and activation. Itis this very recruitment of HIV-susceptible target cells that is associated with the initialviral proliferation. Hence, global enhancement of the inflammatory response by T-cellsand dendritic cells will likely feed viral propagation. Mucosal entry sites contain inherentpathways, in the form of natural regulatory T-cells (nTreg), that globally dampen theinflammatory response. We created a model of this inflammatory response to virus as wellas inherent nTreg-mediated regulation of Th1 recruitment and activation. With simulationsusing this model we sought to address the net effect of nTreg activation and its specificfunctions as well as identify mechanisms of the natural inflammatory response that are besttargeted to inhibit viral spread without compromising initial antiviral activity. Simulationresults provide multiple insights that are relevant to developing intervention strategiesthat seek to exploit natural immune processes: i) induction of the regulatory responsethrough nTreg activation expedites viral proliferation due to viral production by nTregitself and not to reduced Natural Killer (NK) cell activity; ii) at the same time, inductionof the inflammation response through either DC activation or Th1 activation expeditesviral proliferation; iii) within the inflammatory pathway, the NK response is an effectivecontroller of viral proliferation while DC-mediated stimulation of T-cells is a significantdriver of viral proliferation; and iv) nTreg-mediated DC deactivation plays a significantrole in slowing viral proliferation by inhibiting T-cell stimulation, making this function anaide to the antiviral immune response.
Key Words: HIV; Innate inflammatory response pathway; Regulatory response pathway;Mathematical model
2

1 Introduction
Once HIV viremia has peaked in the lymphoid tissue there is little hope of eliminatingthe virus as this marks systemic spread and establishment of tissue and cellular reservoirs.Research has, therefore, been focussed on what is often referred to as the “window period”,the initial two weeks of infection, between exposure to virus and peak viremia.
The vaginal mucosa is the most common site of infection and vaccine strategies focusmainly on promoting inflammation response in this tissue. The immune response at mu-cosal sites, however, are characterized by the presence of anti-inflammatory factors, suchas CD4+ natural regulatory T-cells (CD4+ nTreg), that allow these tissues to generallyremain refractory to inflammation. The purpose of this regulation is to allow immunecells of the lungs, GI tract, nasal passages, and genital mucosa to maintain contact withinnocuous foreign agents in the external environment without dwelling in a constant stateof tissue-damaging hyper-inflammation. In the case of viral infection, a potential effectof anti-inflammatory nTreg is to directly and indirectly dampen key mechanisms of theprotective antiviral response, such as DC activation and Natural Killer (NK) cell stimula-tion. The role that these anti-inflammatory factors play in initial viremia remains unclear.The effect of these interacting pathways on HIV infection is particularly complicated bythe fact that the immune cells themselves are permissive hosts for this virus. Relevantquestions for infection intervention strategies include Should one reduce the regulatory re-sponse in order to aid antiviral activity, i.e., NK recruitment and activation? This couldunintentionally lead to greater viral proliferation through increased host recruitment andinfected Th1 proliferation. Therefore, Should one enhance the regulatory response to reduceinflammation-associated recruitment and T-cell proliferation? This strategy could also aidviral proliferation by dampening antiviral NK activity as well as promoting nTreg-derivedviremia.
There are a number of models that have been developed in different contexts to answer thegeneral question of whether one should enhance or reduce the immune response in orderto better control HIV. For example, a mathematical model of interaction of uninfectedCD4+ T cells and the free HIV virus in the plasma is developed in [36] to investigate theeffect of immunotherapy with cytokine interleukin-2 (IL-2) on an HIV-infected patient,and it was found that this type of immunotheray can be successful in delaying AIDSprogression. While the authors in [16] developed mathematical models of the clinicallatency stage of HIV-1 infection with the assumption that HIV-1 infection is limited eitherby the availability of cells that HIV can infect or by a specific anti-HIV cellular immuneresponse. This assumption is based on the suggestions of various clinical data sets (seethe references in [16] for more information) that HIV viral replication is limited by theavailability of target cells. The effects of tetanus vaccination on chronically infected HIV
3

patients were explored in [30] through a mathematical model of interaction between Tcells, HIV and other antigen. The study was able to reproduce the general features of thepost-vaccination rise in viral load observed in some clinical data sets (see the references in[30] for more information).
In addition, the synergistic interaction between HIV and some other pathogens were in-vestigated by a number of researchers (e.g., [3, 35, 43, 44, 58]). In what follows, we givea brief review of some of this type of work. In [44], mathematical models of populationdynamics of T helper cells, HIV, and other pathogens were formulated to address the threefacets of the interactions between HIV and other pathogens: enhanced HIV replication dueto immune stimulation by other pathogens; modified immune control of other pathogensdue to immunological suppression by HIV; and the vicious circle formed by the positivefeedback between these effects. This study indicates that there is a threshold number of ac-tivated T helper cells above which the immune system is unable to control pre-establishedpathogens. A mathematical model was created in [35] to describe the interaction of HIVand tuberculosis (TB) with the immune system (T cells and macrophages), and this studyindicates that co-infection may indeed play a dramatic role in disease. The authors in[58] proposed a simple mathematical model for the interaction of the immune effector cellswith HIV and malaria parasites in an individual host, and showed that HIV infection mayincrease the risk of malaria and, subsequently, malaria infection promotes the proliferationof HIV.
Recently, a mathematical model describing the dynamics of HIV, CD4+ and CD8+ Tcells, and DCs interacting in a human lymph node was formulated and analyzed in [26]to investigate the dual role (enhancing HIV infection process as well as promoting anantiviral immune response) of dendritic cells in immune response to HIV infection. Herewe present a study unique in that it explores the net effects of HIV-induced inflammationand subsequent nTreg-induced regulation on initial viral replication and spread to thelymph node specifically in the acute phase, i.e., upon vaginal inoculation. The resultingmathematical model is based on mechanistic knowledge of NK, Th1 and nTreg activationby dendritic cells.
1.1 Innate Inflammatory and Regulatory Pathways
Experimental data regarding the early immune response to HIV upon viral exposure inhumans is difficult to obtain as it requires invasive tissue biopsies taken from the gutand genital tissues, the initial site of entry, within a very short time period post-infection.Hence, the current biological model is largely based on data gathered from rhesus macaquesinfected experimentally with Simian Immunodeficiency Virus (SIV) [2, 24, 47]. Based on
4

these studies, the current biological model for early immune response to SIV and HIVinfection are generally assumed to be similar and are described as follows.
Virus enters the vaginal lumen and, within hours, gains access to susceptible immunecells: dendritic cells (DC), CD4+ T-helper cells (Th), and CD4+ natural T-regulatorycells (CD4+ nTreg) in the lamina propria (LP) [47]. This initial, small population ofinfected cells begins to bud virus approximately 2-4 days post-infection at which point theimmune response outlined in Figure 1 is elicited. Specifically, infected cells secrete factors
Virus enters Lumen
Virus access LP
Infects initial population of T-cells and DC
Initial generation of host cells bud free virus
Factors secreted by infected cells
leads to Di recruitment
Mature DC recruits more Tm
DC stimulates Tm to Th
Th proliferates
DC and Th1
induce NK response
DC recruits resting nTreg
DC stimulate nTreg to an active,
IL-10 secreting state
!t
!t
"T
µNK
µNK
"T
kT
m
X
X
!m
X
Di phagocytoses free
virus and matures
k#2
Figure 1: Immune response to first generation of infected cells A scheme of theinflammatory (solid lines) and regulatory (dashed lines) included in the model. Arrows arelabelled with parameters that determine the rate at which each event occurs.
that trigger a pathway by which monocytes are recruited to the tissue and differentiateinto immature dendritic cells (Di). Free virus, budded from infected cells, is phagocytosedby immature DC leading to their maturation. At this point mature DC secrete factors
5
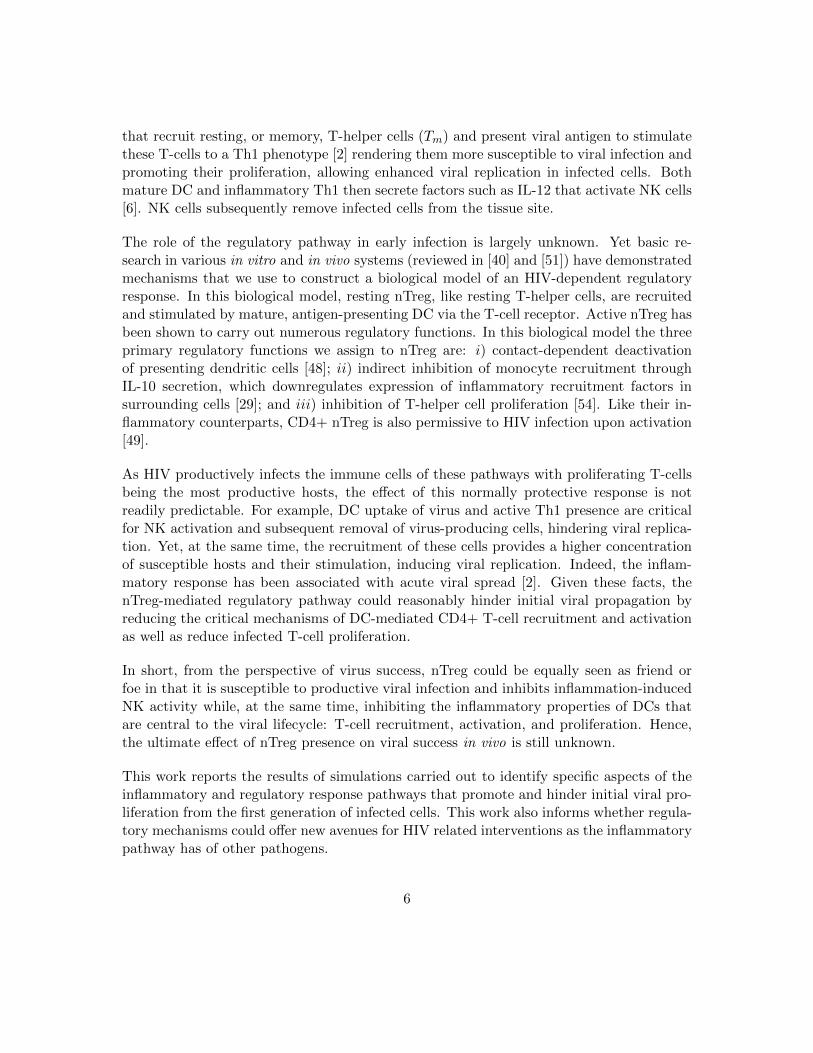
that recruit resting, or memory, T-helper cells (Tm) and present viral antigen to stimulatethese T-cells to a Th1 phenotype [2] rendering them more susceptible to viral infection andpromoting their proliferation, allowing enhanced viral replication in infected cells. Bothmature DC and inflammatory Th1 then secrete factors such as IL-12 that activate NK cells[6]. NK cells subsequently remove infected cells from the tissue site.
The role of the regulatory pathway in early infection is largely unknown. Yet basic re-search in various in vitro and in vivo systems (reviewed in [40] and [51]) have demonstratedmechanisms that we use to construct a biological model of an HIV-dependent regulatoryresponse. In this biological model, resting nTreg, like resting T-helper cells, are recruitedand stimulated by mature, antigen-presenting DC via the T-cell receptor. Active nTreg hasbeen shown to carry out numerous regulatory functions. In this biological model the threeprimary regulatory functions we assign to nTreg are: i) contact-dependent deactivationof presenting dendritic cells [48]; ii) indirect inhibition of monocyte recruitment throughIL-10 secretion, which downregulates expression of inflammatory recruitment factors insurrounding cells [29]; and iii) inhibition of T-helper cell proliferation [54]. Like their in-flammatory counterparts, CD4+ nTreg is also permissive to HIV infection upon activation[49].
As HIV productively infects the immune cells of these pathways with proliferating T-cellsbeing the most productive hosts, the effect of this normally protective response is notreadily predictable. For example, DC uptake of virus and active Th1 presence are criticalfor NK activation and subsequent removal of virus-producing cells, hindering viral replica-tion. Yet, at the same time, the recruitment of these cells provides a higher concentrationof susceptible hosts and their stimulation, inducing viral replication. Indeed, the inflam-matory response has been associated with acute viral spread [2]. Given these facts, thenTreg-mediated regulatory pathway could reasonably hinder initial viral propagation byreducing the critical mechanisms of DC-mediated CD4+ T-cell recruitment and activationas well as reduce infected T-cell proliferation.
In short, from the perspective of virus success, nTreg could be equally seen as friend orfoe in that it is susceptible to productive viral infection and inhibits inflammation-inducedNK activity while, at the same time, inhibiting the inflammatory properties of DCs thatare central to the viral lifecycle: T-cell recruitment, activation, and proliferation. Hence,the ultimate effect of nTreg presence on viral success in vivo is still unknown.
This work reports the results of simulations carried out to identify specific aspects of theinflammatory and regulatory response pathways that promote and hinder initial viral pro-liferation from the first generation of infected cells. This work also informs whether regula-tory mechanisms could offer new avenues for HIV related interventions as the inflammatorypathway has of other pathogens.
6

Realization of these goals requires a model that captures the dynamics of the true system.This eventually requires rigorous validation using time-course (longitudinal) tissue datathat is yet to be found in the literature for the tissue sites of interest, the vaginal mucosa andgenital lymph node. An initial step toward this goal is reported here in the form of a modelthat captures the dynamics of the system that is proposed in current literature and is basedon the available tissue data. It is worthwhile to note that in developing a mathematicalmodel for any complex biological system there is a balance between complexity and utility(in the context of underlying modeling philosophy, below we shall discuss further thisbalance between more complex models for which validating data may not currently beavailable and those which are simple and can be based on only already established acceptedmechanisms and data sets). In this paper, we do not try to formulate a model that capturesall the features of the mucosal immune response as well as all host and viral factors, butrather a model that can capture many salient features of the system and for which someparameters can be plausibly estimated based on the sparse data available. The modelwill however involve mechanisms that are still speculative and for which validating datais not yet available. The interested readers can refer to Appendix B for those simplifyingassumptions that we made during the modeling reduction processes.
1.2 Some Remarks on Modeling Philosophy
Before proceeding with our efforts in developing a model below, we make some remarks toput our efforts in context of an overall philosophy for the use of mathematical and statisticalmodels in scientific investigations. More detailed discussions on this topic can be found in[15, Chapter 1]. In subsequent developments we will arrive at a fairly complex model forwhich only a sparse amount of experimental data is available for model validation. (Indeedwe are currently able to offer only a partial qualitative validation of our proposed model!)When developing such models it is natural to raise questions of how complex/simple a modelone should employ in such investigations. To at least partially answer this, one shouldconsider the underlying reasons that one might give for modeling in science and engineering.The ultimate goal of modeling is not the model itself. Rather modeling is simply a meansfor providing a conceptual framework in which real systems may be investigated. Themodeling process itself is, when properly done, most often an iterative process and ofteninvolves efforts over time (and possibly by different research groups). Numerous rationalesmay be given (to aid in simplification, preciseness, formulation of hypotheses, design ofcritical experiments) but perhaps the most fundamental rationale is that modeling leadsto an organization of inquiry. Properly done, it tends to polarize one’s thinking and aid inposing basic questions concerning what one does and does not know for certain about thereal system. Whatever the reasons that have been advanced to justify modeling attempts,it is sufficient perhaps to note that the primary goal must be enlightenment, that is, to gain
7

a better understanding of the real system, and the success or lack thereof of any modelingattempt should be judged with this in mind. Thus, it is not the model itself that is the goalbut rather increased understanding of the physical or biological system under investigation.In any modeling attempt, one can seek a simple model that can be validated with existingdata and justified in terms of accepted mechanisms. This would result in the simplestmodel that can explain current theory and data. An alternative approach is to seek amore complex model that stretches our current understanding and poses new questions tobe pursued with new conceptual and new experimental investigations. As the reader willsee in our subsequent developments below, this latter approach is our choice here. Butthis will lead to large complex models with a large number of parameters, many of whichhave not been discussed in the literature. The analysis and attempted validation of suchmodels leads to difficult and ill-posed inverse or parameter estimation problems. We haveencountered such difficulties previously, even in earlier HIV infection models (see [4, 9])and have successfully used an iterative process to alleviate certain aspects of the modelanalaysis/validation and ill-posedness aspects of the parameter estimation procedures. Asexplained below, we do that again here.
In related and potentially important research, new methods (illustrated on one of ourearlier HIV models in [8]) are currently being developed to formulate and solve such pa-rameter estimation problems. These selection methods involve use of sensitivity functionsand information matrices effectively with data sets and complex dynamic models to rankparameters in a model in roughly the order of their importance in the ability of the modelto describe (fit) a given data set. As development of these methods matures, they willundoubtedly be of significant value in modeling investigations such as that presented inthis paper.
1.3 Model Components
The model describes HIV progression among CD4+ cell populations of conventional T-cells, CD4+ natural T-regulatory cells (CD4+ nTreg), and dendritic cells (DC) as theytransition between location and phenotype compartments in response to virus. As such,the only active CD4+ T-helper cells represented are of an inflammatory Th1 phenotypebased on cytokine profiles indicating a type 1 response elicited in SIV models [2]. Modelvariables (compartments) are listed in Table 1 below, and all variables are in units of cellsper mL.
Cell populations are compartmentalized by four phenotypes; i) resting, generally memoryor immature immune cells, denoted with the subscripts ‘m’ or ‘i’; ii) active, no subscript;iii) infected, denoted with the superscript ‘*’; iv) not infected. These are then further
8

Table 1: Populations represented in the model.Di Immature dendritic cells
DI Non-infected active dendritic cells in the GLN
DI∗ Infected active dendritic cells in the GLN
DE Non-infected active dendritic cells in the LP
DE∗ Infected active dendritic cells in the LPTm Non-infected CD4+ Memory T-cellsT ∗m Latently infected CD4+ Memory T-cells
T I Non-infected active CD4+ T helper 1 cells in the GLN
T I∗ Infected active CD4+ T helper 1 cells in the GLN
TE Non-infected active CD4+ T helper 1 cells in the LP
TE∗ Infected active CD4+ T helper 1 cells in the LPRm Non-infected memory CD4+ natural T regulatory cellsR∗m Latently infected memory CD4+ natural T regulatory cells
RI Non-infected active CD4+ natural T regulatory cells in the GLN
RI∗ Infected active CD4+ natural T regulatory cells in the GLN
RE Non-infected active CD4+ natural T regulatory cells in the LP
RE∗ Infected active CD4+ natural T regulatory cells in the LP
compartmentalized into two tissue sites: i) The vaginal lamina propria (LP), more generallytermed the effector site of the immune response and denoted by the superscript ‘E’ ; ii)the genital lymph node (GLN), the inductive site of the immune response and denoted bythe superscript ‘I’.
2 Model Equations
2.1 Dendritic Cells
The scheme for the dynamics of dendritic cells is illustrated in Figure 2. The corresponding
9

Di
DE DE*
DIDI*
!mµdi
!EI !EI
"2#mDi"2(1-#m)DikT(RE+RE*) kT(RE+RE*)+ µNK
kT(RI+RI*)+ µdkT(RI+RI*)+ µd
Figure 2: Scheme for dynamics of dendritic cell populations represented.
compartment model for describing its dynamics is given by
Di = εm − µdi(Di − d0), (1)
DI = εEIDE − (kT (RI∗ +RI) + µd)D
I , (2)
DI∗ = εEIDE∗ − (µd + kT (RI +RI∗))DI∗, (3)
DE = (1− αm)ω2Di − (εEI + kT (RE +RE∗))DE , (4)
DE∗ = αmω2Di − (εEI + µNK + kT (RE +RE∗))DE∗. (5)
where Di is the concentration of immature dendritic cells, DI and DI∗ are, respectively,the concentrations of non-infected and infected activated dendritic cells in the inductivesite (GLN), and DE and DE∗ are the concentrations of non-infected and infected activateddendritic cells in the effector site (LP). Immature dendritic cells are present in the lam-ina propria (Di, Equation (1)) at a constant value of d0 representing that each Di thattransfers to one of the activated dendritic cell compartments is replaced from an unlimitedmonocyte pool in the blood [55]. The constant parameter µdi denotes the death rate of theimmature dendritic cells. The functional parameter εm represents the rate of recruitmentof monocytes by inflammatory factors secreted by active immune cells [29] and is a function
10

of productively infected cells, TE∗ and DE∗, given by
εm = cmTE∗ +DE∗
TE∗ +DE∗ +RE, (6)
where cm is a positive constant. This function is based on the rationale that virus presenceinduces various inflammatory responses of cells not explicitly represented that promote se-cretion of recruitment factors and that active CD4+ nTreg secretes IL-10, which can inhibitthe expression of these recruitment factors [29]. It is assumed that the IL-10 secretion byproductively infected CD4+ nTreg (RE∗) cancels out its ability to induce monocyte recruitand is not included in the equation.
Dendritic cells contact and phagocytose free virus at the rate of ω2 = kvE . This is the rateof contact with free virus in the effector site where k is the rate of contact between anytwo cells or cells and virions in both tissue sites and vE is the amount of free virus in theeffector site. Specifically, vE is a function of productively infected cells given by
vE = NE(TE∗ +RE∗) +NDDE∗, (7)
where NE is the burst size from T-cells and ND is the burst size from dendritic cells. Uponphagocytosis all virus is successfully degraded in the presentation process, with a probabil-ity of 1−αm, and the cell becomes an active, presenting dendritic cell (DE , Equation (4))that is capable of stimulating resting T-cells, promoting NK cytolytic activity, and recruit-ing resting T-cells from the blood to the tissue. After a period in the LP, corresponding tothe migration rate εEI , the presenting dendritic cells migrate to the GLN joining the DI
population (Equation (2)). Here they can stimulate resting T-cells until they die at a rateof µd.
In the case that virions are able to escape degradation and establish infection in a dendriticcell, with a probability of αm, the cell enters the DE∗ population (Equation (5)). As withnon-infected dendritic cells, those that are infected will migrate to the GLN in the samemanner joining the DI∗ population (Equation (3)).
Active nTreg, that are either infected or not infected, deactivate dendritic cells upon contactrendering them incapable of cytokine secretion or stimulation of resting T-cells [48]. Werepresent this by removing them from the system upon contact with cells of the activeCD4+ nTreg population (RE , RE∗) with the terms kT (RE + RE∗) in Equations (4) and(5) and kT (RI∗ + RI) in Equations (2) and (3), respectively. Here kT is the contact ratebetween dendritic cells and nTreg, which was estimated as greater than that between allother cells, k, in agreement with experimental evidence that nTreg have a higher affinityfor dendritic cells than do T-helper cells [48].
Similar to all infected cells in the effector site, those of the DE∗ population may be elimi-
11

nated by cytolytic NK cells at a rate of µNK given by
µNK = cNK(1− e−λ(DE+δDE∗+TE+TE∗)), (8)
which is a functional parameter dependent on the concentration of active Th1 and DCbased on that fact that IL-12, IL-15, IL-18, IL-21, and interferons (IFN) induce NK cellsurvival and proliferation, and can promote cytotoxic function. These cytokines are pri-marily secreted by presenting dendritic cells [6], but IL-12 is also secreted by Th1 T-cells[29]. The constant parameter cNK determines the maximum value µNK may reach as theconcentrations of activated DC and Th1 increase and λ determines the rate at which µNKrises to this maximum value in proportion to the rise of DC and Th1 concentrations.
Studies have shown that when an immature dendritic cell is infected, its immune functionsof antigen presentation and cytokine production may be impaired [22]. Specifically, HIV-infected human DCs in vitro have been shown to secrete IL-10 instead of IL-12 and IL-18and have reduced CD80 expression. However, whether this effect of viral infection occursin vivo and in the acute phase is unknown. To accommodate this possibility the modelincludes the coefficient δ as seen in Equation (8). This parameter determines the extent towhich viral infection impairs the ability of DC to induce NK activation as well as recruitand stimulate T-cells (discussed below). In this context, a value of δ < 1 represents virus-induced inhibition of IL-12 and IL-18 expression reducing the ability of infected DC torecruit and activate NK cells.
NK cells in lymphoid tissue have not been shown to have cytolytic activity in vivo [6].Therefore, those of the DI∗ population are not considered susceptible to NK-mediatedelimination.
2.2 Conventional CD4+ T-cells
The scheme for the dynamics of conventional CD4+ T cells is depicted in Figure 3. The
12

Tm
Tm*
TE!IE
!"E
TE*
TITI*
k#TDI
k#TDE
µT$T
%2%3
k#T(DI+& DI*)
µNK
(1-$T)µT
µT$T
µT (1-$T)
pt#tk!t(DI+&DI*) &DI
%1
pt #tk!t(DI+&DI*) DI
0.6#'k&D"*
k#T &DE*
k#T (1-&)DE* + 0.6k#T (1-&)DI*
0.4k#T (1-&)DE* + 0.6k#T (1-&)DI*
k#T(DE+& DE*)
Figure 3: Scheme for dynamics of T-helper cell populations represented.
corresponding compartment model for describing its dynamics is given by
Tm = νTµTTE − (kαT (DE +DI +DE∗ +DI∗) + ω1)Tm, (9)
T ∗m = ω1Tm + νTµTTE∗ − (kαT (DE +DI +DE∗ +DI∗))T ∗m, (10)
T I = ptkαt(εt(DI + δDI∗))DI + 0.6ptkαTTmD
I − (εIE + ω3)TI , (11)
T I∗ = ptkαt(εt(DI + δDI∗))(δDI∗) + 0.6ptkαT δTmD
I∗
+ω3TI + 0.6ptkαTT
∗m(DI + δDI∗)− εIET I∗, (12)
TE = εIETI + 0.4pTkαTTmD
E − (µT + ω2)TE , (13)
TE∗ = εIETI∗ + 0.4pTkαT δTmD
E∗ + ω2TE
+0.4pTkαTT∗m(DE + δDE∗)− (µT + µNK)TE∗. (14)
The model includes a resting T-cell population that represents both effector memory T-cellsthat occupy the LP and central memory T-cells that occupy the GLN. This populationis compartmentalized into non-infected cells (Tm, (Equation (9)) and latently infected
13

memory T-cells (T ∗m, Equation (10)). All resting T-cells are non-infected at the time ofviral introduction.
Memory T-cells may be infected directly by virus at a rate of ω1 = kαv(vE + vI), enteringthe T ∗m population. The coefficient αv represents the reduced likelihood of resting T-cellinfection due to lower expression of the the CD4 surface receptor compared to active T-cells, vE is the amount of free virus in the LP (Equation (7)), and vI represents the amountof free virus in the GLN given by
vI = NE(T I∗ +RI∗) +NDDI∗. (15)
Infected cells of the T ∗m population may also be created from de-activated infected T-helpercells (discussed below), represented by the term νTµTT
E∗ in Equation (10). The modelassumes infected, presenting DC does not pass virus to resting T-cells upon transientassociation in the absence of T-cell receptor (TcR) stimulation.
Upon contact with antigen-presenting dendritic cells, a resting T-cell, infected or non-infected, is stimulated to an active Th1 in either the inductive site or the effector site. T I
(Equation (11)) and T I∗ (Equation (12)) are the respective concentrations of non-infectedand infected Th1 cells in the inductive site. TE (Equation (13)) and TE∗ (Equation (14))are the concentrations of non-infected and infected Th1 in the effector site. As an example,this stimulation is represented in Equation (11) by the term 0.6ptkαTTmD
I , where pt isthe number of daughter cells produced from one central memory T-cell upon stimulationand subsequent proliferation, αT is the probability of stimulation representing the antigenspecificity of the T-cell receptor, and 0.6 is the fraction of T-cells that are central memoryT-cells and, therefore, in contact with dendritic cells of the inductive site, DI . This fractionis based on a study in mice that showed 60% of CD8+ memory T-cells created in responseto lymphocytic choriomeningitis virus were CD62L+, a marker for central memory versuseffector memory T-cells [42]. Such in vivo data was not found for CD4+ T-cells specifically.Similarly, the term 0.4pTkαTTmD
E in Equation (13) represents T-cell stimulation in theeffector site, where the number of daughter cells produced from one stimulated effectormemory T-cell, pT , differs from that of central memory T-cells such that pT < pt [21].Both pT and pt are functions of nTreg concentrations representing the fact that activatednTreg inhibit conventional T-cell proliferation [51], and they are given by
pt =pt0
1 +m(RI +RI∗)and pT =
pT01 +m(RE +RE∗)
. (16)
Here m is a positive constant used to determine the effect of nTreg on Th1 proliferation, pt0and pT0 denote the number of daughter cells produced by one proliferating T-cell (withoutinhibition) in the GLN and LP, respectively.
14

The term εt(DI + δDI∗)DI in Equation (11) represents additional naive T-cells that may
be recruited by factors secreted by presenting dendritic cells, where the parameter εt is thenumber of T-cells recruited by one active dendritic cell. The parameter δ represents theextent to which HIV infection impairs secretion of recruitment factors by dendritic cells aswell as their ability to stimulate T-cells to inflammatory phenotype. These cells may thenbe stimulated with a probability of αt, generally less than the probability αT of memoryT-cell stimulation [29]. The rates at which resting T-cells infiltrate the tissue from theblood is assumed to be independent of the current tissue concentration. De-activation ofactive T-cells occurs at a rate of µT . Upon de-activation a fraction, νT , of T-cells re-enterthe memory T-cell population and the remainder are removed through apoptosis.
T-cells in either tissue site may enter the infected compartments, TE∗ or T I∗, through thefollowing pathways: i) Direct infection by virus. This occurs at a rate of ω2 = kve andω3 = kvI , the rate of contact with free virus in the effector and inductive sites, respectively.As described, vE and vI are functional parameters representing the amount of free virus inthe different tissue sites. ii) Stimulation of naive T-cells and cells of the Tm population byvirus-harboring individuals of the DI∗ and DE∗ populations represented by the first andsecond terms of Equation (12) and the second term in Equation (14). iii) Re-stimulation oflatently infected memory T-cells of the T ∗m (Equation (10)) population represented by thefourth term in Equation (12) and Equation (14). As mentioned above, the coefficient δ isincluded in the stimulation terms as the study conducted in [22] specifically demonstratedthat HIV infected dendritic cells isolated from chronically infected patients have a reducedability to stimulate T-cells to an inflammatory phenotype in vitro. The model does notinclude passage of virus directly from a presenting, infected DC to an active Th1 or nTreg.Exclusion of this mode of infection assumes that a presenting DC would not associate witha T-cell that is already stimulated and in association with another DC.
2.3 CD4+ Natural T-regulatory Cells
The scheme for the dynamics of CD4+ nTreg cells is depicted in Figure 4. The correspond-
15

Rm
Rm*
RE!IE
!"E
RE*
RIRI*
0.5k#TDI0.5k#TDE
µT$T
%2
%3
0.5k#T(DI+&rDI*)
(1-$T )µT +µNK
µT$T
µT(1-$T)
pr#tk!t(DI+&DI*) &rD
I
%1
pr #tk!t(DI+&DI*)
0.5#'k&rD"*
0.5k#T &rDE*
0.5k#T(DE+&rDE*)
Figure 4: Scheme for dynamics of CD4+ nTreg cell populations represented.
ing compartment model for describing its dynamics is given by
Rm = νTµTRE − (kαT (DE +DI + δr(D
E∗ +DI∗)) + ω1)Rm, (17)
R∗m = ω1Rm + νTµTRE∗ − kαT (DE +DI + δr(D
E∗ +DI∗))R∗m, (18)
RI = prkαt(εt(DI + δDI∗))DI + 0.5kαTRmD
I − (εIE + ω3)RI , (19)
RI∗ = prkαt(εt(DI + δDI∗))(δrD
I∗) + ω3RI
+0.5kαT (DI + δrDI∗)R∗m − εIERI∗, (20)
RE = εIERI + 0.5kαTRmD
E − (µT + ω2)RE , (21)
RE∗ = εIERI∗ + 0.5kαT (DE + δrD
E∗)R∗m
+0.5kαT δrDE∗Rm + ω2R
E − (µT + µNK)RE∗. (22)
The life cycle of non-infected and infected CD4+ nTreg is similar to that of T-helpercells, described above, where Rm represents the non-infected memory CD4+ nTreg popu-lation (Equation (17)), RI represents non-infected active CD4+ nTreg in the inductive site
16

(Equation (19)), and RE represents non-infected active CD4+ nTreg in the effector site(Equation (21)). Memory CD4+ nTreg (Rm) are assumed equally distributed into effectormemory cells and central memory cells in the LP and GLN respectively. This is reflected inthe terms 0.5kαTRmD
I in Equation (19) and 0.5kαTRmDE in Equation (21). The model
assumes the same µT and νT for CD4+ nTreg as for T-helper cells. However, there isevidence that CD4+ nTreg may not undergo activation-induced cell death (apoptosis) asreadily in cell culture [52]. Stimulation of each implied naive CD4+ nTreg results in prdaughter cells that may differ from that of conventional T-cells, pt, and memory CD4+nTreg do not proliferate upon re-stimulation by DC.
The model seeks to explore the net effect when CD4+ nTreg stimulation is coupled withthe inflammatory response to HIV presence. As such, the same number of CD4+ nTreg isrecruited by virus-presenting DC as T-helper cells (εt) and resting CD4+ nTreg are stim-ulated with the same probability (αT ). Though the mucosal site is believed to include aconstant level of active CD4+ nTreg stimulated by self antigen, this baseline populationis not included in the model. Including this constitutively active CD4+ nTreg popula-tion, independent of HIV presence, is assumed to have little impact on model predictionsaccording to lack of sensitivity of model variables to initial values for RE(0) and RI(0).
Infected DC that are less able to stimulate T-helper cells to an inflammatory phenotype,discussed above, may still be able to efficiently stimulate resting CD4+ nTreg cells. This isdue to the fact that impairment of DC activity includes lower levels of CD80 expression andsecretion IL-10, all of which have been implicated in inducing Treg phenotypes in restingT-cells [51]. A value of 1 assigned to the parameter δr allows infected DC to retain the fullcapacity to stimulate CD4+ nTreg cells even when the ability to induce a Th1 phenotypeis reduced, i.e., δ < 1.
3 Model Calibration and Analysis
The model contains 17 variables and 25 constant parameters. Equations (1)-(5), (9)-(14)and (17)-(22) were first written as a vector system
˙x = g(x; θ), x(0) = x0,
where x = (Di, DI , DI∗, DE , DE∗, Tm, T
∗m, T
I , T I∗, TE , TE∗, Rm, R∗m, R
I , RI∗, RE , RE∗)T ,θ is the vector for model parameters, and x0 is the set of initial conditions. We followedstandard practice (e.g., see [4, 9]) and solutions were determined for a log-transformedsystem as this resolves the problem of states becoming unrealistically negative due tocomputer round-off errors. As values of the model parameters are in dramatically differentscales, from 10−8 to 108, all of the parameter values are also transformed to the log scale.
17

Therefore, let xi = log10(xi) and x0i = log10(x0i), where i = 1, 2, 3, ..., 17 and θi = log10(θi)for i = 1, 2, 3, ..., 25. Then we have
x = f(x; θ), x(0) = x0, (23)
where f = (f1, f2, ..., f17)T is given by
fi(x; θ) =10−xi
ln(10)gi(x, θ), i = 1, 2, ..., 17.
3.1 Simulation Setup
Simulations were carried out by solving the log transformed versions of Equations (1)-(5),(9)-(14) and (17)-(22) in MATLAB with ODE solver 23 (ode23tb) over a time course of 60units, corresponding to two weeks where one time unit is 6 hours. Parameter values usedare listed in the third column of Table 7 of Appendix A. The values of these parameterswere either derived from published experimental studies (a process that is described inmore detail in the Appendix A) or arbitrarily assigned if there is no studies related tothem. For those parameters whose values can be found or derived from the literature, thereference numbers were given after their values, and the species from which in vivo thesemeasurements were taken or cells were isolated for measurements in vitro were indicatedafter the reference numbers with “M” for “mouse”, “H” for “human”, and “NS” for “notspecified”. Ideally, one would have parameter values based exclusively on in vivo, humandata. However, as previously mentioned such data is sparse in the current literature.Therefore, though our primary interest is to model the dynamics of early HIV infection inhumans, we found it necessary to use the values obtained from other mammalian species,and assume that humans and other mammalian species have the similar parameter values.
Simulations begin at the time of viral budding from the small first generation of infectedhost cells, approximately on day 3 post-infection, the time at which SIV DNA is detectedin cells of infected rhesus macaque tissue [47, 24]. Initial cell concentrations are given inTable 6 and are chosen so that only resting immune cells are present at the time of in-fection assuming no significant immune activation at the time of infection in an otherwisehealthy individual. The initial infected cell population is seeded in the LP and is evenlydivided among conventional T-helper cells, dendritic cells, and CD4+ nTreg cells as thedemographics of this first generation of hosts is not known. The initial infected cell con-centrations are based on experimental measurements taken from rhesus macaques infectedwith SIV reported in [47] in which the authors quantified vRNA levels, a marker of freevirus and productively infected cells, in vaginal mucosa and lymph nodes during the firstdays of infection. The infected cell population was weighted in the LP compartment basedon the observations in the same study that during the first 3 days of infection this is the
18

site where most productively infected cells were detected with only a very small numberin the vaginal lymphoid tissues.
3.2 Sensitivity Analysis
In practice, one may often be in the situation of estimating a large number of unknownparameters with a limited set of data (which is true for our case). To mitigate some ofthis difficulty, sensitivity analysis has been widely used in inverse problem investigations(e.g., [8, 10, 11, 12, 13, 15] and the references therein) to identify the model parametersand/or initial conditions to which the model outputs (observations) are most sensitive andfor which one can readily construct confidence intervals when they are estimated (i.e.,which are the most reliably estimated values). Moreover, recently developed methods [8]for parameter subset selection have proven quite useful in systematically identifying theparameters or subsets of parameters that one can reasonably expect to estimate with agiven data set. Some parts of this recently developed methodology [12, 13] also includenew methods to assist in design of experiments in the context of investigations such asthose initiated here.
To compute the sensitivities of model outputs to the model parameters and initial condi-tions, one need to know the sensitivity of each model state to each parameter and initial
condition. Sensitivities∂xi∂θj
of each variable xi to each parameter θj can be determined by
(see, for example, [10] and the references therein)
d
dt
∂xi∂θj
=
17∑l=1
∂fi∂xl
∂xl∂θj
+∂fi∂θj
,∂xi∂θj
(0) = 0, i = 1, 2, ..., 17, j = 1, 2, ..., 25. (24)
Corresponding sensitivities of each variable, xi, to each initial condition, x0j (the jthcomponent of x0) can be determined by
d
dt
∂xi∂x0j
=17∑l=1
∂fi∂xl
∂xl∂x0j
,∂xi∂x0j
(0) = δij , (25)
where δij =
{1, if i = j0, if i 6= j
, i = 1, 2, ..., 17 and j = 1, 2, ..., 17. These sensitivities were
calculated by solving Equations (23), (24), and (25) simultaneously in MATLAB withODE solver 15s using initial concentrations and parameter values listed in Table 6 andthe third column of Table 7, respectively. Results of the sensitivity analysis informedwhich parameters were estimated as well as the confidence intervals for these estimatedparameters are described in the section below.
19

3.3 Parameter Estimation
Proper calibration and validation of this model for the use of predicting HIV dynamicsrequires longitudinal data of infected and non-infected immune cells in vaginal and guttissue during acute infection. As mentioned earlier such data was not found in the liter-ature. Rather, we use aggregate vRNA levels obtained by euthanizing monkeys infectedwith SIV on different days post-infection [47]. The generally accepted biological modelfor acute viremia assumes a continual time course on which these averaged measurementslie and is described in Haase [24]. Following this biological model, we fit a general curvethrough three data points for vRNA concentration in the LP and GLN at days 3, 7, 15and days 3, 10, 15 post-infection, respectively. These data points are estimated averages ofmultiple, divergent samples taken from different monkeys and are reported in Miller et al.[47]. The vRNA concentrations reported in [47] were in units of (µg vRNA)/ (1µg totaltissue RNA). To map these concentrations to model variables, we make the approximationthat (1µg vRNA) / (1µg total tissue RNA) = (1 infected cell or virion)/ (1µg tissue), anduse the conversion that 1µg of tissue = 10−6mL assuming that 1g of tissue = 1mL [23].
The mathematical model was calibrated using two synthetic data sets composed of pointson these curves, which conform to the trajectory proposed by Haase[24] and Miller et al.[47] for total amount of free virus and productively infected cells in the vaginal LP andGLN during the acute phase of infection. Synthetic data set 1 (depicted by ‘+’ in Figure5) contains values of vRNA in the vaginal LP at various time points over a 2 week period,and synthetic data set 2 (depicted by diamonds in Figure 5) contains values of vRNAin the GLN over the same time period. As shown in Figure 5, the trajectory specifiesan exponential growth from an initial value of approximately 104mL−1 on day 3 post-infection to a peak value of 109mL−1 on day 8 post-infection in the LP and a similar riseto 1010mL−1 in the GLN.
Note that the synthetic data include the total amount of free virus and productively in-fected cells (i.e., total amount of vRNA) in the LP and the total amount of free virus andproductively infected cells in the GLN. For system (1)-(5), (9)-(14) and (17)-(22), the totalamount of free virus and productively infected cells in the LP is given by
z1(t) = NE(TE∗(t) +RE∗(t)) +NDDE∗(t) + TE∗(t) +RE∗(t) +DE∗(t), (26)
and the total amount of free virus and productively infected cells in the GLN is
z2(t) = NE(T I∗(t) +RI∗(t)) +NDDI∗(t) + T I∗(t) +RI∗(t) +DI∗(t). (27)
Specifically, the sum of the first two terms in (26) an (27) are used to account for the totalamount of free virus in the LP and GLN, respectively, and the sum of the last three termsare the total amount of productively infected cells in the LP and GLN, respectively. Note
20

that all the equations in the system (1)-(5), (9)-(14) and (17)-(22) are coupled together.Hence, the values of z1 and z2 depend on all the model parameters and initial conditions,either strongly or weakly.
Let zi = log10(zi), where i = 1, 2. Then the norm of sensitivities of each zi to eachparameter, θj , and each initial condition x0j was calculated with
zi(θj) =
√√√√ 60∑l=1
[∂zi∂θj
(tl)
]2, j = 1, 2, ..., 25,
and
zi(x0j) =
√√√√ 60∑l=1
[∂zi∂x0j
(tl)
]2, j = 1, 2, ..., 17,
respectively, where i = 1, 2. Based on the values of z1 and z2, the 11 parameters to whichz1 and z2 are most sensitive are k, NE , αT , cNK , pT0, αm, δ, εIE , εEI , λ and kT (inthe descending order), and these parameters will be estimated during the first iteration ofparameter estimation process (see details below).
Let t1i , i = 1, 2, . . . , n1 and t2i , i = 1, 2, . . . , n2 denote the measurement time points forsynthetic data sets 1 and 2, respectively, y1i be the observed total amount of vRNA inLP at time point t1i , i = 1, 2, . . . , n1, and y2i be the observed total amount of vRNA inGLN at time point t2i , i = 1, 2, . . . , n2. We define y1i = log10(y
1i ), i = 1, 2, . . . , n1, and
y2i = log10(y2i ), i = 1, 2, . . . , n2. The statistical model is assumed to have the form
Y 1i = z1(t
1i ; q) + ε1i , i = 1, 2, . . . , n1,
Y 2i = z2(t
2i ; q) + ε2i , i = 1, 2, . . . , n2,
(28)
where q ∈ Rκ denotes vector of the estimated parameters (κ is a positive integer, anddenotes the number of estimated parameters), and the observation errors ε1i , i = 1, 2, . . . , n1and ε2i , i = 1, 2, . . . , n2 are independent and identically distributed with zero mean andvariance σ20 (log transforms are commonly used in the literature to provide nearly uniformvariance, for example, they have been used in [4, 9] for other HIV models). With thisassumption, q can be estimated by using an ordinary least squares (OLS) technique
q = arg minq∈Q
[n1∑i=1
∣∣z1(t1i ; q)− y1i )∣∣2 +
n2∑i=1
∣∣z2(t2i ; q)− y2i )∣∣2], (29)
where Q is some compact set in Rk. Then the bias adjusted estimate for σ20 (e.g., see [10])is given by
σ2 =1
n1 + n2 − κ
[n1∑i=1
(z1(t
1i ; q)− y1i
)2+
n2∑i=1
(z2(t
2i ; q)− y2i
)2].
21

As expected, we have a large parameter set with little experimental data. Hence, to haveinitial estimates, the parameter estimation was implemented in an iterative process similarto that used in [4, 9] (this approach was also required for those modeling efforts even thoughsubstantially more longitudinal data was available to support those modeling efforts). Wefirst estimate those 11 parameters deemed most influential (by sensitivity analysis) on z1and z2 with all the other parameters remained with the values assigned in the third columnof Table 7. We then fix 3 of these 11 parameters at their OLS estimates and re-estimate theremaining 8 parameters, and the OLS estimates for these 3 fixed parameters (δ, εIE andεEI) are illustrated in the first three rows of Table 2. Lastly, we fix 3 of these 8 parameters
Table 2: The OLS estimates for those estimated parameters.Parameter Symbol OLS Estimate
Coefficient determining effect of infectionδ 0.74
on DC functions
Rate of cell migration from GLN to the LP εIE 0.155/6hr
Rate of cell migration from LP to the GLN εEI 0.11/6hr
Number of daughter cells producedpT0 299
by one T-cell in the LP, uninhibited
Probability of infection of DC αm 0.04
The rate at which µNK rises to its maximum λ 1.31 · 10−8 mL/cells
General contact rate k 1.08 · 10−8 mL/(cells·6hr)
Number of free virus produced by one T-cell NE 300
Probability of memory T-cell stimulated by DC αT 10−3
The maximum value of µNK cNK 51.2/6hr
Contact rate between active DCkT 2.38 · 10−5 mL/(cells·6hr)
and CD4+ nTreg
at their new OLS estimates and re-estimate the remaining 5 parameters, and the OLSestimates for these 3 newly fixed parameters (pT0, αm and λ) and these 5 re-estimatedones (k, NE , αT , cNK and kT ) are given respectively in the middle three rows of Table 2and the last five rows of this table. The choice of the parameters to be fixed during the lasttwo iterations is based on the combination of sensitivity analysis, the confidence we had inthe estimated value as well as the knowledge we had on these parameters. The values forthese 11 parameters illustrated in Table 2 will be used in the subsequent simulations whereall the other parameters remain with the values assigned in the third column of Table 7.
22

Even though the data we have are not from experiments, we provide a way (which canbe employed once the experimental observations are available) to quantify the uncertaintyin our parameter estimation. There are two methods that have been widely used in theliterature to quantify uncertainty in parameter estimates, one is bootstrapping and theother is asymptotic theory. These two methods have been investigated and computation-ally compared in [14] for problems with different form and level of noise. It was found thatasymptotic theory is always faster computationally than bootstrapping, and there is noclear advantage in using the bootstrapping and asymptotic theory when the constant vari-ance data using OLS is assumed. Based on these findings, we will use asymptotic theoryin this paper to quantify the uncertainty in parameter estimation.
Let Z(q) = (z1(t11; q), z1(t
12; q), . . . , z1(t
1n1
; q), z2(t21; q), z2(t
22; q), . . . , z2(t
2n2
; q))T . Then thesensitivity matrix χ(q) is (n1 + n2) × κ matrix with its (i, j)th element being defined by∂Zi(q)∂qj
, i = 1, 2, . . . , n1 +n2 and j = 1, 2, . . . , κ, where Zi is the ith element of Z, and qj is
the jth element of q. Then by the asymptotic theory (e.g., see [10, 50] and the referencestherein), we know that the OLS estimator Q is asymptotically normally distributed
Q ∼ N (q0,Σ0). (30)
Here q0 denotes the true value of the estimated parameter vector q, and Σ0 is given by
Σ0 = σ20[(χ(q0))
Tχ(q0)]−1
.
Since the true value q0 and the variance σ20 are unknown, we follow the standard statisticalpractice by using the OLS estimates q and σ2 for q0 and σ20, respectively. Hence, theasymptotic properties of the least squares estimator Q can be approximated by
Q ∼ N(q, Σ
), (31)
whereΣ = σ2
[(χ(q))Tχ(q)
]−1.
Then the standard error Std(Qj) for the jth element of Q is calculated by Std(Qj) ≈√Σjj , where Σjj is the (j, j)th entry of covariance matrix Σ. Hence, the endpoints of the
confidence intervals for Qj (the jth element of Q), j = 1, 2, . . . , κ, are given by
qj ± t1−α/2 Std(Qj),
where t1−α/2 is a distribution value that is determined from a statistical table for Student’st-distribution based on the level of significance α.
For the results we report in the following, we choose α = 0.05, which corresponds tot1−α/2 = 1.96 when the number of degrees of freedom is greater than or equal to 30 (e.g.,
23

see [11] and the references therein), which is true for our case (n1 = 31, n2 = 24 and κ = 5).Table 3 illustrates the endpoints of the 95% confidence intervals (i.e., α = 0.05) for those 5estimated parameters illustrated in last five rows of Table 2 (i.e., those 5 parameters thatare estimated during the last iteration of parameter estimation process). From this table,
Table 3: The endpoints of the 95% confidence intervals for q.
Parameters qj ± 1.96 Std(Qj) Parameters qj ± 1.96 Std(Qj)
log10(NE) 2.477 ± 0.078 log10(cNK) 1.709 ± 0.025log10(αT ) -3.000 ± 0.069 log10(k) -7.966 ± 0.027log10(kT ) -4.623 ± 0.455
we see that the confidence intervals for all these estimated parameters are reasonably smallin comparison to their corresponding estimated values.
Figure 5 illustrates the fits to the data. From this figure, we see that we have pretty goodfits to the data. Hence, by this figure and Table 3 we may infer that the goodness-to-fit is
0 10 20 30 40 50 60102
103
104
105
106
107
108
109
1010
1011
Est
imat
edvR
NA
leve
l
Time
LPGLN
Figure 5: vRNA levels. Solid and dashed lines indicate vRNA levels predicted by themathematical model in the LP and GLN, respectively. The marker ‘+’ indicates syntheticdata set 1, and diamonds represent synthetic data set 2. Circled points indicate thoseestimated by Haase et al. [24] directly from experimental data where vRNA values wereaveraged over widely varied samples reported in Miller et al [47].
reasonably well.
24

3.4 Partial Qualitative Validation
As we have already mentioned, sufficient experimental data is not available to fully vali-date our proposed model. Nonetheless, we make a first attempt to partially support andqualitatively validate this initial modeling effort with synthetic data produced from limitedexperimental data in the literature. The model was fit to log vRNA levels. The partialqualitative validation is carried out by comparing the underlying cell dynamics. Specifi-cally, those for T-cells in the lymphoid tissue (Figure 6) were compared to those observedin SIV models of acute infection. In agreement with Li et al., [39] and Estes et al., [20], the
0 10 20 30 40 50 600
1
2
3
4
5
6
7
8 x 10⁷
Num
ber
ofce
lls
Time
nTregTotal CD4+
Figure 6: Simulated timecourse of total CD4+ T-cells (solid line) and CD4+ nTreg (dashedline) in lymphoid tissue following infection of first host generation.
model predicts an initial influx of CD4+ T-cells, both helper and regulatory, to the siteof infection. This influx is followed by a decrease in the total CD4+ T-cell population ofthe lymph node as observed by Karlsson et al., [33]. This study reported an average 20%reduction in total CD4+ T-cells in non-specific lymphoid tissue by day 14 and 50% on day28 post-infection. Our model predicts a reduction of 22% by day 14 post-infection thatcontinues to a 46% reduction in lymphoid T-cells by day 21 post-infection, the last timepoint of the simulation. In addition, non-human primate infection referenced in Hogue etal. [26] measured 1.7 · 106mL−1 infected cells in the lymph node on day 6 post-infection.Our model predicts 8.64 ·105mL−1 productively infected CD4+ T-cells in the GLN on thisday.
To further test the validity of our model we observed the effect of CD4+ nTreg depletion,
25

represented in the model as reduced resting CD4+ nTreg at the time of infection (Rm(0)),on the course of viral proliferation. Though it has been observed that Treg cells from hostsinfected with HIV and FIV (feline immunodeficiency virus) suppress antiviral responsesduring the chronic stage of infection [1, 34, 46], a recent study in FIV shows that Tregcell depletion of approximately 78% prior to infection does not significantly impact viralload or CD4+ T cell levels in tissues [45]. When simulations were carried out with reducedRm(0) values from 107mL−1 to 105mL−1 and then to 10−10mL−1, there was no change inthe time of viral peak in either tissue site and < 8% increase in peak vRNA values in theGLN and ≤ 13.5% increase in peak vRNA value in the LP, in accordance with these FIVresults.
4 Simulations and Results
For each experimental condition described in the following sections, four measurementswere made to determine the rate and extent of viral proliferation: i) The maximum vRNAlevels z1max in the LP, that is, z1max = max
t∈[0,60]z1(t), where z1 is given by Equation (26);
ii) the maximum vRNA levels z2max in the GLN, given by z2max = maxt∈[0,60]
z2(t) with z2
defined by Equation (27); iii) the time tpeakLP at which the vRNA level peaks in the LP,that is, tpeakLP = arg max
t∈[0,60]z1(t); and iv) the time tpeakGLN at which estimated vRNA
peaks in the GLN, that is, tpeakGLN = arg maxt∈[0,60]
z2(t). The latter two measurements can
be interpreted as the estimated “window period” between the start of simulation and thetime at which peak viremia is reached in each tissue.
As we noted earlier that all the equations in the system (1)-(5), (9)-(14) and (17)-(22) arecoupled together. Hence, the values of the peak vRNA levels in LP and GLN as well asthe corresponding time at which their levels peak depend on all the model parameters andinitial conditions, either strongly or weakly. In this section, we will compare these fourvalues for the null model with those representing different immunological backgrounds andinterventions of interest. These include the effect of early inflammatory versus regulatoryresponse on initial viremia, the role of CD4+ nTreg on initial viral spread, as well as theimpact of inflammatory mechanisms.
26
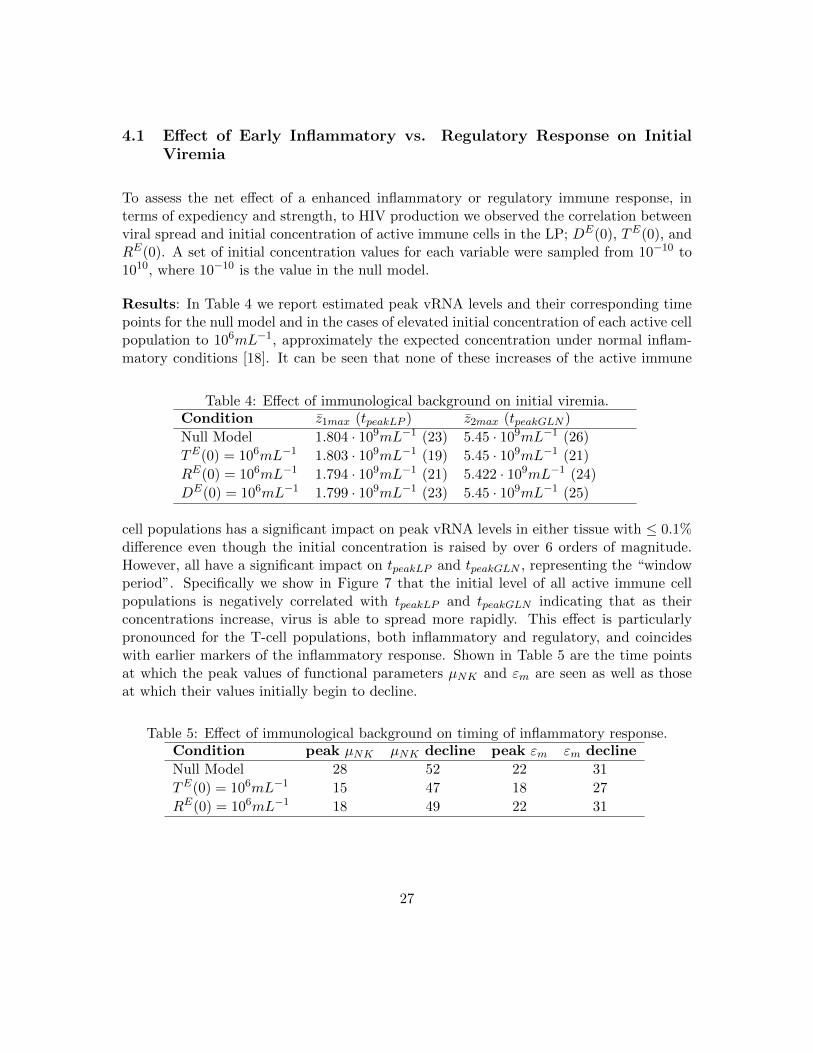
4.1 Effect of Early Inflammatory vs. Regulatory Response on InitialViremia
To assess the net effect of a enhanced inflammatory or regulatory immune response, interms of expediency and strength, to HIV production we observed the correlation betweenviral spread and initial concentration of active immune cells in the LP; DE(0), TE(0), andRE(0). A set of initial concentration values for each variable were sampled from 10−10 to1010, where 10−10 is the value in the null model.
Results: In Table 4 we report estimated peak vRNA levels and their corresponding timepoints for the null model and in the cases of elevated initial concentration of each active cellpopulation to 106mL−1, approximately the expected concentration under normal inflam-matory conditions [18]. It can be seen that none of these increases of the active immune
Table 4: Effect of immunological background on initial viremia.Condition z1max (tpeakLP ) z2max (tpeakGLN )
Null Model 1.804 · 109mL−1 (23) 5.45 · 109mL−1 (26)
TE(0) = 106mL−1 1.803 · 109mL−1 (19) 5.45 · 109mL−1 (21)
RE(0) = 106mL−1 1.794 · 109mL−1 (21) 5.422 · 109mL−1 (24)
DE(0) = 106mL−1 1.799 · 109mL−1 (23) 5.45 · 109mL−1 (25)
cell populations has a significant impact on peak vRNA levels in either tissue with ≤ 0.1%difference even though the initial concentration is raised by over 6 orders of magnitude.However, all have a significant impact on tpeakLP and tpeakGLN , representing the “windowperiod”. Specifically we show in Figure 7 that the initial level of all active immune cellpopulations is negatively correlated with tpeakLP and tpeakGLN indicating that as theirconcentrations increase, virus is able to spread more rapidly. This effect is particularlypronounced for the T-cell populations, both inflammatory and regulatory, and coincideswith earlier markers of the inflammatory response. Shown in Table 5 are the time pointsat which the peak values of functional parameters µNK and εm are seen as well as thoseat which their values initially begin to decline.
Table 5: Effect of immunological background on timing of inflammatory response.Condition peak µNK µNK decline peak εm εm decline
Null Model 28 52 22 31
TE(0) = 106mL−1 15 47 18 27
RE(0) = 106mL−1 18 49 22 31
27

10−10 10−5 100 105 10100
5
10
15
20
25t p
ea
kL
P
Initial cell concentrations
A. Time of vRNA peak in LP
ThnTregDC
10−10 10−5 100 105 10100
5
10
15
20
25
t pea
kG
LN
Initial cell concentrations
B. Time of vRNA peak in GLN
ThnTregDC
Figure 7: Effect of enhanced immune response on the rate of viral spread: Herethe predicted values of tpeakLP (A) and tpeakGLN (B) are plotted against initial values ofactive immune cell concentrations in the LP.
Conclusions: These results have multiple implications.
An increased initial concentration of TE can represent a recent immune response fromwhich residual Th1 cells are still present or a very rapid inflammatory response that al-lows entrance of Th1 prior to viral replication in the initial host population; a possibleconsequence of vaccine exposure.
In 2005 the notorious STEP vaccine trial was carried out, in which high-risk participantswere administered HIV protein within an adenovirus vector. This trial failed returningresults indicating that vaccinated individuals were more likely to be infected with HIV[56]. The prevailing hypothesis for this surprising result was that the immune responseelicited, by either the adenovirus vector or the HIV antigen itself, created an inflamma-tory environment predisposing individuals to infection upon exposure of viable HIV. Theeffect of enhanced TE(0) in our simulations supports this hypothesis. A vaccine-elicitedinflammatory response would facilitate viral spread predisposing the host to infection if ex-posure occurs while it is still active. This is a probable scenario for individuals in high-riskpositions such as those who received the vaccine during the trial.
The results also indicate that inducing the CD4+ nTreg response at the time of infectionwill likely expedite infection. The decrease in tpeakGLN and tpeakLP seen with elevatedRE(0) indicates that, indeed, active CD4+ nTreg has a net effect of aiding viral proliferationand dissemination, not necessarily by increasing viral production, but by expediting it.Furthermore, that this increase is not due to nTreg-mediated dampening of NK activation,
28

but rather its ability to replicate virus.
The indication is that a more rapid CD4+ nTreg response would likely not be protectiveagainst viral proliferation. This is relevant as CD4+ nTreg has been shown to promote andinhibit a successful antiviral response in different species. Specifically, SIV pathogenesisis greatly reduced in African green monkeys compared to that in rhesus macaques. Ithas been suggested that this may be due to the fact that the CD4+ nTreg response inAfrican green monkeys is quicker, leading to reduced susceptible T-cell recruitment andstimulation by DC in the infection site [23, 37]. In our simulations, increasing the initialconcentration of RE(0) represents an immediate CD4+ nTreg response elicited prior toviral production by the first generation of infected cells. These simulation results suggestthis is not a plausible explanation for reduced viremia in green monkeys as an earlier CD4+nTreg response has little effect on dampening the extent of viral proliferation. Rather, thesooner active CD4+ nTreg is present, even prior to the inflammatory response, the quickervirus will propagate.
4.2 The Role of CD4+ nTreg Functions in Initial Viral Spread
It was seen that active CD4+ nTreg has the effect of increasing the rate of viral dis-semination. We then sought to identify the net effect of specific CD4+ nTreg functions:contact-dependent deactivation of presenting dendritic cells, governed by the parameterkT , and inhibition of Th1 proliferation, governed by the parameter m. This was done byplotting peak vRNA levels, z1max and z2max (Figure 8 (A) and (B)) as well as their cor-responding time points tpeakLP and tpeakGLN (Figure 8 (C) and (D)) by increasing valuesfor these parameters. Specifically, values for m, the coefficient for functional parameterspt and pT (defined in Equation (16)), that determines the extent to which CD4+ nTreginhibits T-helper cell proliferation, were sampled from the range [10−10, 10−1]. Values forkT , the rate of contact and de-activation of DC by CD4+ nTreg were taken from the range[2.3821 · 10−10, 2.3821 · 10−1].
Results: Plots in Figure 8 clearly show a negative correlation between both functions andpeak vRNA levels indicating that enhancement of either has a net effect of reducing viralproliferation, with kT having a tighter correlation. In relation to the “window period” , thenegative effect of kT is also clearly demonstrated. In Figure 8 (C) and (D) it can be seenthat as kT increases from its default value, the values of tpeakLP and tpeakGLN increasesindicating that CD4+ nTreg-mediated DC de-activation has a net effect of prolonging thewindow period. Though these values are also higher than that in the null model when kTis severely reduced, this corresponds with very high viral load that likely continues to riseuninhibited. The relationship between the window period and m appears more complex.
29

10−10 10−8 10−6 10−4 10−2 100105
106
107
108
109
1010
1011
1012
m and kT values
z 1m
ax
A. Peak vRNA estimates in LP
mkT
10−10 10−8 10−6 10−4 10−2 100105
106
107
108
109
1010
1011
1012
1013
1014
1015
z2m
ax
m and kT values
B. Peak vRNA estimates in GLN
mkT
10−10 10−8 10−6 10−4 10−2 10015
20
25
30
35
40
45
50
55
60
65
70
t pea
kL
P
m and kT values
C. Length of window period in LP
mkT
10−10 10−8 10−6 10−4 10−2 10015
20
25
30
35
40
45
50
55
60
65
70
tp
ea
kG
LN
m and kT values
D. Length of window period in GLN
mkT
Figure 8: Effect of CD4+ nTreg regulatory functions on viral spread: Here the fourmeasurements of viral spread are plotted by increasing values of the parameter m (circles)and kT (+ sign); (A) peak level of vRNA in the LP, z1max, (B) peak level of vRNA reachedin the GLN, z2max, (C) time of peak vRNA level reached in the LP, tpeakLP , (D) time ofpeak vRNA level reached in the GLN, tpeakGLN . Circled points represent parameter valuesin the null model.
Like kT , as m increases from the default value the window period is increased. However,there is a range for m, 10−3-10−2, in which the beneficial effect is much less significant, evennon-existent in the LP. This highlights the complex, non-linear relationship between m andthe response of the over all system. For example, RE is, itself, an indirect function of mas an increased m leads to decreased TE and TE∗, which affects the functional parametersµNK and εm that directly influence the levels of RE∗ and RE .
30

We next sought to determine whether such enhancement of CD4+ nTreg functions couldchange its relationship to increased viral proliferation, i.e., whether enhancement of thesespecific functions could render the net effect of CD4+ nTreg activation to be protective.Specifically, we sought a value for these parameters at which one could clearly observe anegative correlation between peak vRNA levels, z1max and z2max, and the initial activeCD4+ nTreg concentration, RE(0), as well as a positive correlation with the window pe-riods, tpeakLP and tpeakGLN . To this end, we observed the four measurements for viralproliferation against increasing values for initial active nTeg concentration, sampled fromthe range [10−10, 1010] with different values for m and kT .
Results: For all values assigned to m, from the range [10−10, 10−1], the estimated peakvRNA levels remained positively correlated with initial active CD4+ nTreg concentration,if affected at all, and the estimated window periods remained negatively correlated (asobserved from Figure 9). In the case of enhanced ability to deactivate DC, the effectis largely just as insignificant. For most values of kT the relationship between activeCD4+ nTreg and vRNA levels remains positive and that with the window period remainsnegative. However, it can be see in Figure 10 that for higher values of kT , there is aspecific range of initial CD4+ nTreg concentrations (about 102 -104mL−1) that inhibit thepropagation of the first generation of free virus produced by the initial host population. Inother words, viremia does rise above the concentration of approximately 104mL−1. Thiseffect on viremia in the GLN, specifically, is observed over a wider range of CD4+ nTregconcentrations than those in the LP.
Conclusions: CD4+ nTreg-mediated inhibition of DC is a useful aspect of the regulatoryresponse that one wants to maintain offering the most promising avenue for intervention.Furthermore, with an enhanced capacity to de-activate DC, there is a range of CD4+ nTregactivation that could be protective at the time of infection.
However, manipulation of CD4+ nTreg-mediated inhibition of Th1 proliferation could haveunpredictable, unintended consequences. Hence, this function is not a strong candidate forexploitation in reducing viral spread as simulations indicate that enhancing the capacityto inhibit Th1 proliferation, does not change the net effect of CD4+ nTreg activation as itcontinues to expedite viral proliferation due to its ability to replicate virus.
With these findings we recommend conducting carefully designed experiments to determinepotential beneficial effect of promoting CD4+ nTreg-mediated DC inhibition in an in vivosetting of acute infection. In a similar vein, it would be interesting to experimentallyobserve the net effect of enhancing CD4+ nTreg-mediated inhibition of Th1 proliferationgiven the anti-intuitive dynamics reported here.
31

10−10 10−5 100 105 1010105
106
107
108
109
1010
z1m
ax
Initial nTreg concentration
A. peak vRNA estimates in the LP
1e−101e−091e−081e−071e−061e−051e−041e−031e−021e−01
10−10 10−5 100 105 1010105
106
107
108
109
1010
z2m
ax
Initial nTreg concentration
B. Peak vRNA estimates in the GLN
1e−101e−091e−081e−071e−061e−051e−041e−031e−021e−01
10−10 10−5 100 105 10100
10
20
30
40
50
60
70
t pea
kL
P
Initial nTreg concentration
C. Time of vRNA peak in the LP
1e−101e−091e−081e−071e−061e−051e−041e−031e−021e−01
10−10 10−5 100 105 10100
10
20
30
40
50
60
70
t pea
kG
LN
Initial nTreg concentration
D. Time of vRNA peak in the GLN
1e−101e−091e−081e−071e−061e−051e−041e−031e−021e−01
Figure 9: Relationship between initial active nTreg concentration and viral pro-liferation given enhanced capacity to inhibit Th proliferation: Here the followingfactors are plotted by increasing values of RE(0) given different values of m as indicatedin the legend; (A) peak level of vRNA in the LP, z1max, (B) peak level of vRNA reachedin the GLN, z2max, (C) time of peak vRNA level reached in the LP, tpeakLP , (D) time ofpeak vRNA level reached in the GLN, tpeakGLN . The thicker line represents the value ofm used in the null model.
32

10−10 10−5 100 105 1010103
104
105
106
107
108
109
1010
1011
1012
1013
z 1m
ax
Initial nTreg concentration
A. peak vRNA estimates in the LP
2.3821e−102.3821e−092.3821e−082.3821e−072.3821e−062.3821e−052.3821e−042.3821e−032.3821e−022.3821e−01
10−10 10−5 100 105 1010102
104
106
108
1010
1012
1014
1016
z2m
ax
Initial nTreg concentration
B. peak vRNA estimates in the GLN
2.3821e−102.3821e−092.3821e−082.3821e−072.3821e−062.3821e−052.3821e−042.3821e−032.3821e−022.3821e−01
10−10 10−5 100 105 10100
10
20
30
40
50
60
70
t pea
kL
P
Initial nTreg concentration
C. Time of peak vRNA in LP
2.3821e−102.3821e−092.3821e−082.3821e−072.3821e−062.3821e−052.3821e−042.3821e−032.3821e−022.3821e−01
10−10 10−5 100 105 10100
10
20
30
40
50
60
70
Initial nTreg concentration
D. Time of peak vRNA in GLN
2.3821e−102.3821e−092.3821e−082.3821e−072.3821e−062.3821e−052.3821e−042.3821e−032.3821e−022.3821e−01
Figure 10: Relationship between initial active CD4+ nTreg concentration andviral proliferation given enhanced DC-deactivation capacity: Here the followingfactors are plotted by increasing values of RE(0) given different values of kT as indicatedin the legend; (A) peak level of vRNA in the LP, z1max, (B) peak level of vRNA reachedin the GLN, z2max, (C) time of peak vRNA level reached in the LP, tpeakLP , (D) time ofpeak vRNA level reached in the GLN, tpeakGLN . The thicker dotted line represents thevalue of kT used in the null model. Solid lines indicate kT values for which initial viremiais successfully controlled and does not rise significantly above concentration of the firstgeneration of budded virus.
33

4.3 Impact of Inflammatory Mechanisms
The model includes an inflammatory response to viral production that is comprised of fourmain mechanisms: i) stimulation of both resting conventional T-cells and CD4+ nTreg atthe rate of αT , ii) recruitment of both resting conventional T-cells and CD4+ nTreg tothe inductive site at the rate εt, iii) the recruitment of monocytes, immature dendritic cellprecursors, at the rate εm (Equation (6)), mediated by the parameter cm, and iv) removalof infected cells by NK cells at the rate µNK (Equation (8)), mediated by the parameterscNK , the maximum value of the removal rate, and λ, the rate of increased removal as DCand Th1 concentrations rise. In order to clarify those mechanisms that most influencedthe net positive impact of the inflammatory response on HIV spread we sought to correlatethe peak vRNA levels with each the parameters governing these four mechanisms. To dothis we plotted estimated peak vRNA levels in the LP (z1max) and in the GLN (z2max) byvalues for each parameter. Values for εt were sampled from the range [10−10, 1000], thosefor cm from the range [10−10, 1000], those for αT from the range [10−10, 1], those cNK fromthe range [5.12 · 10−10, 5.12 · 103], and those for λ from the range [10−10, 10−1].
Results: Plots in Figure 11 show that monocyte recruitment has little effect on viremiclevels, with T-cell recruitment having a slightly anti-intuitive, negative effect on viral pro-liferation. NK activity and Th1 stimulation are the processes that play the most criticalrole in determining the rate of viral proliferation. Specifically, enhanced NK activity isintuitively beneficial. DC-mediated stimulation of regulatory and inflammatory T-cells,however, has a significant impact in aiding viral proliferation.
Conclusion: The positive correlation between the inflammatory response (shown in sec-tion 4.1) and expedited viremia is largely attributed to DC-mediated stimulation of T-cells,both Th1 and CD4+ nTreg. However, NK cells can be a very effective fighter against viralspread, which is significant as their activity may be elicited prior to the CD8 responsethrough DC activation and potentially independent of CD4+ Th1 activation.
These results suggest that one would want to be specific in choosing the inflammatoryfunction to be targeted for enhancement as an intervention strategy. T-cell recruitmentby DCs may be slightly protective, but if this is coupled with Th1 stimulation, the impactcan be quite negative for the host. In terms of determining inflammatory mechanisms toinhibit in order to quell viral spread, targeting DC-mediated recruitment of T-cells is notrecommended as it appears to be a necessary component of the antiviral response. A betterstrategy would be targeted disruption of DC contact with and/or stimulation of T-cells(helper and regulatory). Indeed, simulations with reduced αT to 10−10 leads to much lowerviremia with no noticeable T-cell loss (results not shown).
34

10−10 10−8 10−6 10−4 10−2 100 102 104103
104
105
106
107
108
109
1010
1011
1012
1013z 1
ma
x
parameter value
A. Peak vRNA estimates in LP
αTεtcmcNK
λ
10−10 10−8 10−6 10−4 10−2 100 102 104102
103
104
105
106
107
108
109
1010
1011
1012
z 2m
ax
parameter value
B. Peak vRNA estimates in GLN
αTεtcmcNK
λ
10−10 10−8 10−6 10−4 10−2 100 102 1040
10
20
30
40
50
60
t pea
kL
P
parameter value
C. Time of vRNA peak in LP
αTεtcmcNK
λ
10−10 10−8 10−6 10−4 10−2 100 102 1040
10
20
30
40
50
60
tp
ea
kG
LN
parameter value
D. Time of vRNA peak in GLN
αTεtcmcNK
λ
Figure 11: Relationship between inflammatory mechanisms and acute viralspread: Here the following factors are plotted by increasing values of cm (red stars),εt (blue + sign), αT (blue circles), cNK (green diamonds), and λ (black stars). (A) peaklevel of vRNA in the LP, z1max, (B) peak level of vRNA reached in the GLN, z2max, (C)time of peak vRNA level reached in the LP, tpeakLP , (D) time of peak vRNA level reachedin the GLN, tpeakGLN .
5 Discussion
Here we present a model of the HIV-specific inflammatory pathway leading to Th1 acti-vation and the nTreg-mediated regulatory pathway that suppresses it. Simulations basedon this model and its component mechanisms suggest that a global activation of either theadaptive regulatory or inflammatory response would expedite viral dissemination, over-
35

coming the innate antiviral response, as both lead to activation of HIV-permissive Th1and nTreg. This result holds even over a wide range of conditions that would enhanceor weaken the influence of nTreg on DC-deactivation and Th1 proliferation. Analysis ofthe most effective regulatory functions and harmful inflammatory mechanisms specify DC-mediated stimulation of CD4+ T-cells as the key mechanism driving viral proliferation.The indication is that once DC carries HIV to the lymph node to present to T-cells, theinfection has little chance of being stopped as the virus is now in an environment with aplentitude of highly permissive hosts, has access to the blood stream, and is largely pro-tected from NK mediated removal. Hence, any vaccine-primed responses that require thispresentation upon viral challenge will occur too late and be ineffective, if not harmful. Thisincludes a typical CD8 response which relies on the activation and proliferation of CD4+T-cells for cytotoxic T-lymphocyte (CTL) activation. Indeed such obstacles are what havemade finding an effective and protective vaccine so difficult.
This work suggests that such strategies will continually fail to control systemic spread andviremia. Rather, there should be a focus on responses that may lead to viral removal priorto interaction between a presenting infected DC and resting T-cell takes place. This mayinclude neutralizing antibody that could, theoretically, eliminate virus prior to contactwith DC by preventing transcytosis from vaginal lumen to LP or antibody-dependent cellcytotoxicity that would enhance the ability of NK cells to eliminate the initial host cellpopulation at site of infection prior to spread.
Ideal intervention strategies would be those that enhance the innate response without aneed for T-cell expansion. As an example, this could involve NK activation through selec-tive recruitment of plasmacytoid DCs (pDCs) from the blood to the infection site as thisDC subset does not play a significant role in T-cell expansion, but is effective in inducingNK response through secretion of IFN-α [5]. Though pDC has been associated with im-mune dysregulation, this association is seen with established viral infection in the chronicdisease phase. Other strategies to enhance the effective NK response is to target viralproteins that inhibit innate immune response such as nef, which leads to downregulationof NKG2D ligands on the surface of infected cells [5].
In terms of prevention treatments that seek to exploit the innate immune response, ourconclusions recommend those that could disrupt DC: T-cell interactions upon HIV entry,allowing NK activity to occur through DC stimulation alone. Such strategies may involvetreatment with tolerogenic commensal bacterial strains in the vaginal lumen, inhibition ofantigen presentation by DC, and targeted inhibition of DC-TcR interactions.
Knowledge of the mechanisms involved in this model is evolving. Specifically, those govern-ing DC-mediated delivery of virus, HIV-specific NK activation, and HIV-specific activationand suppressive functions of nTreg continue to be a source of controversy in the experi-
36

mental HIV immunology field.
As stated in Section 2.2, it may be possible for infected DC to deliver viable virus toresting T-cells upon transient association in the absence of TcR recognition and subsequentstimulation. By not including this mechanism of contact-dependent infection of resting T-cells our model may underestimate the number of latently infected memory T-cells thatmay be established by a single infected DC in the early stage of infection. The possibleerror in size of this reservoir population presumably has little impact on the dynamics ofearly infection and the initial viremic spike, but will be relevant in future models that seekto encompass the chronic disease stage following the acute phase.
This model assumes that HIV-specific nTreg suppressor functions are dependent uponTcR stimulation indicated by in vitro observations [51] and focus on the theoretical conse-quences of HIV-solicited regulatory response coupled to the inflammatory response. Thetrue mucosal system likely includes HIV-nonspecific nTreg activation pathways that maybe relevant. As mentioned, the mucosal site is believed to include a constant level of ac-tive CD4+ nTreg stimulated by self antigen and commensal bacteria. This constitutivelyactive CD4+ nTreg population could be represented as a constant in-flow into the RE
population. In addition, there may be a polyclonal nTreg population present that can beactivated by TGF-β secreted from neighboring nTreg [51]. This could be represented byan influx into the RE population proportional to the current RE population, enhancingthe effect of nTreg cell concentration on viral proliferation and NK suppression. Hence,we presume that exclusion of these mechanisms leads to simulation results that underes-timate the contribution of nTreg presence to viral proliferation. The significance of suchHIV-independent, polyclonal populations and circumstances governing their activation invivo is largely unknown and may be incorporated into later versions of the model as moreinformation is gathered.
Studies have indicated nTreg may have a direct cytolytic effect on NK cells. This modeof suppression was not included as it was demonstrated in a minority of nTreg in specificin vivo conditions of a tumor microenvironment and has not been reproducible in othersituations [51, 17]. Including this mechanism would likely enhance the positive effect ofnTreg activation on viral dissemination and, therefore, is not presumed to change the neteffect of the regulatory response reported here. Specifically, it ultimately promotes viralproliferation.
The assumptions made here regarding mechanisms represented and excluded in the modelare a subset of those currently in the literature making this model a foundation for studyingvarious hypothesized details of each mechanism in future versions.
Given the lack of data in the current literature, this modeling effort constitutes a prelim-
37

inary exploration into the role of the regulatory pathway and how it may be exploited toprevent HIV proliferation. The current model is capable of addressing conceptual ques-tions relevant to devising intervention to quell HIV spread such as those addressed here:Should one promote the regulatory response?, Should one inhibit the regulatory response?and What specific mechanisms of inflammation would be best to suppress in a targetedmanner?
However, the model is not adequate for making quantitative predictions as this requirescalibration to specific experimental data. Future work involves using this preliminarymodel to suggest specific experiments with which such data can be collected. A modelcalibrated to adequate data could then be used to make quantitative predictions of viralload and timing of systemic spread within a satisfactory level of confidence.
Acknowledgements
This research was supported in part by Grant Number R01A I071915-07 from the Na-tional Institute of Allergy and Infectious Diseases and in part by grants NSF HSD GrantSES-0729441, NIH MIDAS project 2U01GM070694-7, NSF PetaApps Grant OCI-0904844,DTRA CNIMS Grant HDTRA1-07-C-0113, NIH MIEP HHSN272201000056C, NIH Grant1R56AI089313-01A1, NIH/NIAID 5R01AI47707 and grant UNC CFAR P30 AI50410.
References
[1] E. M. Aandahl, J. Michaelsson, W. J. Moretto, F. M. Hecht, and D. F. Nixon. HumanCD4+ CD25+ regulatory T cells control T-cell responses to human immunodeficiencyvirus and cytomegalovirus antigens. J Virol, 78(5):2454–9, 2004.
[2] K. Abel, D. M. Rocke, B. Chohan, L. Fritts, and C. J. Miller. Temporal andanatomic relationship between virus replication and cytokine gene expression aftervaginal simian immunodeficiency virus infection. J Virol, 79(19):12164–72, 2005.
[3] L.J. Abu-Raddad, P. Patnaik, and J.G. Kublin. Dual infection with HIV and Malariafuels the spread of both diseases in sub-Saharan Africa. Science, 314:1603–1606, 2006.
[4] B.M. Adams, H.T. Banks, M. Davidian, and E.S. Rosenberg. Model fitting and predic-tion with HIV treatment interruption data. Bulletin of Mathematical Biology, 69:563–584, 2005.
38

[5] M. Altfeld, L. Fadda, D. Frleta, and N. Bhardwaj. Dcs and nk cells: critical effectorsin the immune response to hiv-1. Nature Reviews Immunology, 11(3):176–186, 2011.
[6] C. E. Andoniou, D. M. Andrews, and M. A. Degli-Esposti. Natural killer cells in viralinfection: more than just killers. Immunol Rev, 214:239–50, 2006.
[7] M. Asano, M. Toda, N. Sakaguchi, and S. Sakaguchi. Autoimmune disease as a con-sequence of developmental abnormality of a T cell subpopulation. Journal of Experi-mental Medicine, 184(2):387–396, 1996.
[8] H.T. Banks, A. Cintron-Arias, and F. Kappel. Parameter selection methods in in-verse problem formulation. Proceedings Biomedical Modeling and Cardiovascular-Respiratory Control: Theory and Practice Summer School and Workshop: A MarieCurie Training Event, Springer Lecture Notes, 2011, to appear. Center for Researchin Scientific Computation Report, CRSC-TR10-03, November, 2010, NCSU, Raleigh.
[9] H.T. Banks, M. Davidian, Shuhua Hu, G.M. Kepler, and E.S. Rosenberg. ModellingHIV immune response and validation with clinical data. J. Biological Dynamics,2:357–385, 2008.
[10] H.T. Banks, M. Davidian, J.R. Samuels Jr., and K. L. Sutton. An inverse problemstatistical methodology summary. In Gerardo Chowell, Mac Hyman, Nick Hengartner,Luis M.A Bettencourt, and Carlos Castillo-Chavez, editors, Statistical Estimation Ap-proaches in Epidemiology, pages 249–302, Berlin Heidelberg New York, 2009. Springer.Center for Research in Scientific Computation Report, CRSC-TR08-01, January, 2008,NCSU, Raleigh.
[11] H.T. Banks and J.L. Davis. Quantifying uncertainty in the estimation of probabilitydistributions. Math. Biosci. Eng., 5:647–667, 2008. Center for Research in ScientificComputation Report, CRSC-TR07-21, December, 2007, NCSU, Raleigh.
[12] H.T. Banks, Sava Dediu, Stacey L. Ernstberger, and Franz Kappel. Generalized sensi-tivities and optimal experimental design. J. Inverse and Ill-posed Problems, 18:25–83,2010. Center for Research in Scientific Computation Report, CRSC-TR08-12, (Re-vised) November, 2009, NCSU, Raleigh.
[13] H.T. Banks, K.J. Holm, and F. Kappel. Comparison of optimal design methods ininverse problems. Inverse Problems, 27:075002, 2011. Center for Research in ScientificComputation Report, CRSC-TR10-11, July, 2010, NCSU, Raleigh.
[14] H.T. Banks, K.J. Holm, and D. Robbins. Standard error computations for uncertaintyquantification in inverse problems: asymptotic theory vs. bootstrapping. Mathemat-ical and Computer Modelling, 52:1610–1625, 2009. Center for Research in ScientificComputation Report, CRSC-TR09-13, Revised, May, 2010, NCSU, Raleigh.
39

[15] H.T. Banks and H.T. Tran. Mathematical and Experimental Modeling of Physical andBiological Processes. CRC Press, Boca Raton, FL, 2009.
[16] R.J. De Boer and A.S. Perelson. Target cell limited and immune control models ofHIV infection: a comparison. J. Theor. Biol., 190:201–214, 1998.
[17] X. F. Cao, S. F. Cai, T. A. Fehniger, J. L. Song, L. I. Collins, D. R. Piwnica-Worms,and T. J. Ley. Granzyme b and perforin are important for regulatory t cell-mediatedsuppression of tumor clearance. Immunity, 27(4):635–646, 2007.
[18] D. M. Catron, A. A. Itano, K. A. Pape, D. L. Mueller, and M. K. Jenkins. Visualizingthe first 50 hr of the primary immune response to a soluble antigen. Immunity,21(3):341–347, 2004.
[19] D. S. Dimitrov, R. L. Willey, H. Sato, L. J. Chang, R. Blumenthal, and M. A. Martin.Quantitation of human immunodeficiency virus type 1 infection kinetics. J Virol,67(4):2182–90, 1993.
[20] J. D. Estes, Q. Li, M. R. Reynolds, S. Wietgrefe, L. Duan, T. Schacker, L. J. Picker,D. I. Watkins, J. D. Lifson, C. Reilly, J. Carlis, and A. T. Haase. Premature inductionof an immunosuppressive regulatory T cell response during acute simian immunodefi-ciency virus infection. J Infect Dis, 193(5):703–12, 2006.
[21] J. Geginat, A. Lanzavecchia, and F. Sallusto. Proliferation and differentiation po-tential of human CD8+ memory T-cell subsets in response to antigen or homeostaticcytokines. Blood, 101(11):4260–6, 2003.
[22] A. Granelli-Piperno, A. Golebiowska, C. Trumpfheller, F. P. Siegal, and R. M. Stein-man. HIV-1-infected monocyte-derived dendritic cells do not undergo maturation butcan elicit IL-10 production and T cell regulation. Proceedings of the National Academyof Sciences of the United States of America, 101(20):7669–7674, 2004.
[23] A. T. Haase. Population biology of HIV-1 infection: Viral and CD4(+) T cell demo-graphics and dynamics in lymphatic tissues. Annual Review of Immunology, 17:625–656, 1999.
[24] A. T. Haase. Perils at mucosal front lines for HIV and SIV and their hosts. Nat RevImmunol, 5(10):783–92, 2005.
[25] A. T. Haase, K. Henry, M. Zupancic, G. Sedgewick, R. A. Faust, H. Melroe, W. Cavert,K. Gebhard, K. Staskus, Z. Q. Zhang, P. J. Dailey, Jr. Balfour, H. H., A. Erice, andA. S. Perelson. Quantitative image analysis of HIV-1 infection in lymphoid tissue.Science, 274(5289):985–9, 1996.
40

[26] I. B. Hogue, S. H. Bajaria, B. A. Fallert, S. Qin, T. A. Reinhart, and D. E. Kirschner.The dual role of dendritic cells in the immune response to human immunodeficiencyvirus type 1 infection. J Gen Virol, 89(Pt 9):2228–39, 2008.
[27] T. Igarashi, C. R. Brown, Y. Endo, A. Buckler-White, R. Plishka, N. Bischofberger,V. Hirsch, and M. A. Martin. Macrophage are the principal reservoir and sustainhigh virus loads in rhesus macaques after the depletion of CD4+ T cells by a highlypathogenic simian immunodeficiency virus/HIV type 1 chimera (SHIV): Implicationsfor HIV-1 infections of humans. Proc Natl Acad Sci U S A, 98(2):658–63, 2001.
[28] A. Iwasaki. Mucosal dendritic cells. Annual Review of Immunology, 25:381–418, 2007.
[29] C.A Janeway, P. Travers, M. Walport, and M. Shlomchik. Immunobiology: The im-mune system in health and disease. Garland Publishing, 5 edition, 2001.
[30] L.E. Jones and A.S. Perelson. Modeling the effects of vaccination on chronicallyinfected HIV-positive patients. Journal of Acquired Immune Deficiency, 6:369–377,2002.
[31] S. M. Kaech and R. Ahmed. Immunology: CD8 T cells remember with a little help.Science, 300(5617):263–5, 2003.
[32] A. T. Kamath, S. Henri, F. Battye, D. F. Tough, and K. Shortman. Developmentalkinetics and lifespan of dendritic cells in mouse lymphoid organs. Blood, 100(5):1734–1741, 2002.
[33] I. Karlsson, B. Malleret, P. Brochard, B. Delache, J. Calvo, R. Le Grand, and B. Vaslin.Dynamics of T-cell responses and memory T cells during primary simian immunode-ficiency virus infection in cynomolgus macaques. J Virol, 81(24):13456–68, 2007.
[34] A. L. Kinter, R. Horak, M. Sion, L. Riggin, J. McNally, Y. Lin, R. Jackson, A. O’Shea,G. Roby, C. Kovacs, M. Connors, S. A. Migueles, and A. S. Fauci. CD25+ regulatoryT cells isolated from HIV-infected individuals suppress the cytolytic and nonlyticantiviral activity of HIV-specific CD8+ T cells in vitro. AIDS Res Hum Retroviruses,23(3):438–50, 2007.
[35] D. Kirschner. Dynamics of co-infection with M. tuberculosis and HIV-1. TheoreticalPopulation Biology, 55:94–109, 1999.
[36] D.E. Kirschner and G.F. Webb. Immunotherapy on HIV-1 infection. Journal ofBiological Systems, 6:71–83, 1998.
[37] C. Kornfeld, M. J. Ploquin, I. Pandrea, A. Faye, R. Onanga, C. Apetrei, V. Poaty-Mavoungou, P. Rouquet, J. Estaquier, L. Mortara, J. F. Desoutter, C. Butor,
41

R. Le Grand, P. Roques, F. Simon, F. Barre-Sinoussi, O. M. Diop, and M. C. Muller-Trutwin. Antiinflammatory profiles during primary SIV infection in African greenmonkeys are associated with protection against AIDS. J Clin Invest, 115(4):1082–91,2005.
[38] A. Lanzavecchia and F. Sallusto. Regulation of T cell immunity by dendritic cells.Cell, 106(3):263–6, 2001.
[39] Q. Li, J. D. Estes, P. M. Schlievert, L. Duan, A. J. Brosnahan, P. J. Southern, C. S.Reilly, M. L. Peterson, N. Schultz-Darken, K. G. Brunner, K. R. Nephew, S. Pam-buccian, J. D. Lifson, J. V. Carlis, and A. T. Haase. Glycerol monolaurate preventsmucosal SIV transmission. Nature, 2009.
[40] S. Li, E. J. Gowans, C. Chougnet, M. Plebanski, and U. Dittmer. Natural regulatoryt cells and persistent viral infection. J Virol, 82(1):21–30, 2008.
[41] V. Marechal, M. C. Prevost, C. Petit, E. Perret, J. M. Heard, and O. Schwartz. Humanimmunodeficiency virus type 1 entry into macrophages mediated by macropinocytosis.J Virol, 75(22):11166–77, 2001.
[42] A. L. Marzo, K. D. Klonowski, A. Le Bon, P. Borrow, D. F. Tough, and L. Lefran-cois. Initial T cell frequency dictates memory CD8+ T cell lineage commitment. NatImmunol, 6(8):793–9, 2005.
[43] A.R. McLean and T.B.L. Kirkwood. A model of human immunodeficiency virus in-fection in T helper cell clones. J. Theor. Biol., 147:177–203, 1990.
[44] A.R. McLean and M.A. Nowak. Models of interactions between HIV and otherpathogens. J. Theor. Biol., 155:69–102, 1992.
[45] S. R. Mikkelsen, J. M. Long, L. Zhang, E. R. Galemore, S. VandeWoude, and G. Dean.Regulatory T cell depletion prior to acute feline immunodeficiency virus infection doesnot alter disease pathogenesis. PLoS ONE, Submitted.
[46] S. R. Mikkelsen, S. K. Reckling, E. A. Egan, and G. A. Dean. In vivo depletion ofCD4(+)CD25(hi) regulatory T cells is associated with improved antiviral responses incats chronically infected with feline immunodeficiency virus. Virology, 403(2):163–72,2010.
[47] C. J. Miller, Q. Li, K. Abel, E. Y. Kim, Z. M. Ma, S. Wietgrefe, L. La Franco-Scheuch,L. Compton, L. Duan, M. D. Shore, M. Zupancic, M. Busch, J. Carlis, S. Wolinsky,and A. T. Haase. Propagation and dissemination of infection after vaginal transmissionof simian immunodeficiency virus. J Virol, 79(14):9217–27, 2005.
42

[48] Y. Onishi, Z. Fehervari, T. Yamaguchi, and S. Sakaguchi. Foxp3(+) natural regulatoryT cells preferentially form aggregates on dendritic cells in vitro and actively inhibittheir maturation. Proceedings of the National Academy of Sciences of the United Statesof America, 105(29):10113–10118, 2008.
[49] K. Oswald-Richter, S. M. Grill, N. Shariat, M. Leelawong, M. S. Sundrud, D. W. Haas,and D. Unutmaz. Hiv infection of naturally occurring and genetically reprogrammedhuman regulatory t-cells. PLoS Biol, 2(7):E198, 2004.
[50] G.A.F. Seber and C.J. Wild. Nonlinear Regression. Wiley, 1989.
[51] E. M. Shevach. Mechanisms of foxp3+ t regulatory cell-mediated suppression. Immu-nity, 30(5):636–45, 2009.
[52] N. Singh, M. Yamamoto, M. Takami, Y. Seki, M. Takezaki, A. L. Mellor, andM. Iwashima. CD4(+)CD25(+) regulatory T cells resist a novel form of CD28- andFas-dependent p53-induced T cell apoptosis. J Immunol, 184(1):94–104, 2010.
[53] S. Stoll, J. Delon, T. M. Brotz, and R. N. Germain. Dynamic imaging of T cell-dendritic cell interactions in lymph nodes. Science, 296(5574):1873–6, 2002.
[54] A. M. Thornton and E. M. Shevach. Suppressor effector function of cd4(+)cd25(+)immunoregulatory t cells is antigen nonspecific. Journal of Immunology, 164(1):183–190, 2000.
[55] U. H. von Andrian and T. R. Mempel. Homing and cellular traffic in lymph nodes.Nature Reviews Immunology, 3(11):867–878, 2003.
[56] B. D. Walker and D. R. Burton. Toward an AIDS vaccine. Science, 320(5877):760–4,2008.
[57] L. S. Walker, A. Chodos, M. Eggena, H. Dooms, and A. K. Abbas. Antigen-dependentproliferation of CD4+ CD25+ regulatory T cells in vivo. J Exp Med, 198(2):249–58,2003.
[58] D. Xiao and W.H. Bossert. An intra-host mathematical model on interaction betweenHIV and Malaria. Bulletin of Mathematical Biology, 72:1892–1911, 2010.
43

A Initial Conditions, Parameters and Rate Functions
Initial variable concentrations are given in Table 6. In general, subscripts denote phenotype.
Table 6: Initial conditions.Di Immature dendritic cells 108 cells/mL [26]
DI Non-infected active dendritic cells in the GLN 10−10 cells/mL
DI∗ Infected active dendritic cells in the GLN 1 cells/mL
DE Non-infected active dendritic cells in the LP 10−10 cells/mL
DE∗ Infected active dendritic cells in the LP 10 cells/mL
Tm Non-infected CD4+ memory T-cells 108 cells/mL [23]
T ∗m Latently infected CD4+ Memory T-cells 10−10 cells/mL
T I Non-infected active CD4+ Th1 cells in the GLN 10−10 cells/mL
T I∗ Infected active CD4+ Th1 cells in the GLN 1 cells/mL
TE Non-infected active CD4+ Th1 cells in the LP 10−10 cells/mL
TE∗ Infected active CD4+ Th1 cells in the LP 10 cells/mL
Rm Non-infected memory CD4+ nTreg cells 107 cells/mL [7]
R∗m Latently infected memory CD4+ nTreg cells 10−10 cells/mL
RI Non-infected active CD4+ nTreg cells in the GLN 10−10 cells/mL
RI∗ Infected active CD4+ nTreg cells in the GLN 1 cells/mL
RE Non-infected active CD4+ nTreg cells in the LP 10−10 cells/mL
RE∗ Infected active CD4+ nTreg cells in the LP 10 cells/mL
The alphanumeric superscript denotes location and the superscript ‘*’ indicates infectiouscounterpart.
Parameters required by the model are listed in Table 7 and fall roughly into three categories:i) birth/death processes, ii) migration, and iii) contact/interaction processes. Units forrates are per 6 hours as this is approximately the length of time a T-cell takes to proliferatein association with the stimulating DC [53]. When possible, constant values were assignedaccording to published experimental data. For example, pt0, the uninhibited rate of T-cellproliferation in the GLN, is based on an in vitro study of CD8+ T-cells and their capacityto proliferate in response to TCR stimulation [21]. This study reported that a stimulatednaive CD8+ T-cell or central memory T-cell undergoes a maximum of 9 doublings. Hence1 T-cell will end-up giving birth to 29 = 512 T-cells. The parameter pT0, the uninhibitedrate of T-cell proliferation in the LP comes from observations in the same study that, uponstimulation, effector memory T-cells proliferate to a lower extent than do central memoryT-cells resulting in a concentration ratio of roughly 1:4. Proliferation of naive nTreg maybe reduced compared to T-helper cells as the express lower levels of IL2R [57]. For thisreason, pr was included as a separate parameter assigned the range 128-512. By default,
44

Table 7: Parameters used in the model. The third column is for the values of the parametersused in the simulations, and the fourth column is for the ranges of those parameters whoseranges can be found in the literature. For those parameters whose values can not be foundin the literature an arbitrary value was assigned. While for those parameters whose valuesor ranges can be found in the literature, the reference numbers were given after the valuesor ranges, and the species from which in vivo these measurements were taken or cells wereisolated for measurements in vitro were indicated after the reference numbers with “M”for “mouse”, “H” for “human”, and “NS” for “not specified”.
Birth/death
µT rate of active T-cell deactivation 0.05/6hr [42, M]
pt0number of daughter cells from one proliferating
512 [21, H]T-cell in the GLN, uninhibited
pT0number of daughter cells from one proliferating
128 [21, H]T-cell in the LP, uninhibited
µdi death rate of immature dendritic cells 0.0006/6hr [32, M]µd death rate of dendritic cells 0.12/6hr [38, NS]
d0 baseline number of immature dendritic cells 108 cells/mL [26, NS]
prnumber of daughter cells from one proliferating
512naive CD4+ nTreg
NE number of free virus produced by one T-cell 200 100 − 300 [25, 29, 19, H]ND number of free virus produced by one DC 5cNK the maximum value of µNK 75/6hr
λ the rate at which µNK rises to its maximum 10−8 mL/cells
mcoefficient to determine effect of CD4+ nTreg
10−10 mL/cellson Th1 proliferation
Migration
εIE rate of cell migration from GLN to LP 0.125/6hr [29, NS]εEI rate of cell migration from LP to GLN 0.25/6hr
εtNumber of naive T-cells recruited
100 100 − 300 [53, M]by one active DC
cm constant in εm function 1 cells/(mL·6hr)
Contact / interactions
αt probability of naive T-cell stimulation by DC 10−4 10−4 − 10−7 [29, NS]
αT probability of memory T-cell stimulation 10−4 10−5 − 10−3 [29, NS]νT fraction of T-cells that become memory T-cells 0.02 0.02 − 0.1 [31, M]δ fraction of D∗ able to stimulate resting T-cells 1δr fraction of D∗ able to stimulate resting nTreg 1
αvprobability of memory T-cell infection
0.1by virus on contact
αmprobability of viral infection of Di 0.01 0.01 − 0.5 [41, H]upon uptake of virion
k rate of contact between individuals 10−7 mL/(cells·6hr)kT rate of contact between CD4+ nTreg and DC 10−6 mL/(cells·6hr) (10−9 − 10−3) [48, M]
45

we assumed that naive nTreg proliferate to the same extent as naive T-helper cells.
The range for εt was derived based on the observation of Stoll et al., [53] that there are3.35 times more naive T-cells in the lymph nodes with presenting dendritic cells comparedto lymph nodes where they are absent. As the concentration of naive T-cells in lymphoidtissue in non-inflammatory conditions is on the order of 108 [23] this would require anincrease of approximately 2 · 108 naive T-cells under inflammatory conditions for a total ofapproximately 3 · 108. Given that the expected number of activated dendritic cells underinflammatory conditions is approximately 106 in the LN [18], one dendritic cell is estimatedto recruit approximately 2 · 102 T-cells, giving εt a range of 102 to 3 · 102.
The parameter d0 represents the number of immature DC in the naive system. The valueassigned was borrowed from a previously published model [26], though an experimentalmeasurement was not cited.
For transition rates such as death, de-activation, and migration rates: µT , µdi, µd, εIE ,and εEI , measurements from the literature were in the form of an average lifespan or dwelltime for an individual cell type in a particular location. In order to avoid introducing thecomplication of delay-differential equations, we used the common strategy of modeling celldeath and movement as affecting a fixed proportion of cells in each time interval, resultingin an exponential distribution of lifetimes with the experimentally observed mean, x, or ahalf-life of x ln 2.
For other parameters such direct data was not found and a range was estimated based onless direct biological measurements and knowledge. In the case of αm, it is not known withwhat frequency viable virions are able to escape the intra-cellular phagosomal degradationand enter the cytoplasm to effectively infect the dendritic cell. Therefore, we assigned arange based on the ratio of viral protein p24 in the cytoplasm to that in the phagosome afteruptake by macrophages [41]. However, p24 is a marker of the virion capsule, not necessarilyan intact, viable virion. In the case of αv, the probability that a resting memory T-cell ininfected upon contact with virus, a value was assigned based on the knowledge that theviral receptor protein CD4 is upregulated only in active T-cells and present at lower levelson the surface of resting cells [29]. However, a quantitative comparison of CD4 densitybetween resting and active T-cells was not found in the literature.
The parameter NE represents the amount of viable virus budded from T-cells. Viral burstsize in T-cells is approximately 1100 virions/cell per day in vitro [29]. However, only 10%of virus produced is estimated to be viable in vivo [19]. Hence, the amount of viable virusproduced by a single T-cell is estimated to be on the order to 102 per day. ND representsthe amount of virus budded from each dendritic cell. This is known to be less than thatof T-cells and the value is assigned based on data that the burst size in macrophages, cells
46

of the same lineage as dendritic cells, is roughly 0.1 that of the burst size in T-cells [27].
In the case where the quantitative value of a parameter does not have a direct correlationwith experimental data, as in the cases of cNK , λ, m, k, kT , and cm, a value was arbitrarilychosen.
The parameter dependent rate functions are summarized in Table 8.
Table 8: Parameter dependent rate functions.Birth/death
Death rate of infected cells by NK: µNK = cNK(1 − e−λ(DE+δDE∗+TE+TE∗))
Daughter cells produced from one proliferating T-cell in the GLN, inhibited: pt =pt0
1 +m(RI +RI∗)
Daughter cells produced from one proliferating T-cell in the LP, inhibited: pT =pT0
1 +m(RE +RE∗)
Migration
Recruitment rate of Di by inflammatory factors: εm = cmTE∗ +DE∗
TE∗ +DE∗ +RE
Contact / interactions
Rate of infection of memory T-cells: ω1 = kαv(vE + vI)
Rate of contact with virus in the LP: ω2 = kvE
Rate of contact with virus in the GLN: ω3 = kvI
The concentration of free virus in the LP: vE = NE(TE∗ +RE∗) +NDDE∗
The concentration of free virus in the GLN: vI = NE(T I∗ +RI∗) +NDDI∗
47

B Simplifying Assumptions
B.1 Changes From Earlier Model and Rationale
This model is a result of iterative attempts at reducing an earlier, more comprehensivemodel. That model was more biologically accurate at the expense of being intractablycomplex. In this section we list the simplifying assumptions made in the reduction process.
• No non-HIV antigen, L: In order to observe potential effects of a co-infecting orprevious infection with an inflammatory or tolerance-inducing immunogen previousversions of the model included a variable L representing non-HIV antigen. An explicitvariable was not deemed necessary as these effects may be represented, instead, bymodification of the initial values of active immune cell populations. In the case ofa constant supply of a tolerance-inducing antigen, it may be necessary to include a‘source’ parameter for DE and then reflect the likelihood of it being of a tolerogenicphenotype in the αT and αt parameters.
• Do not consider pre-integrated virus in the latently infected memory T-cell population:In earlier versions, the latently infected T-cell population was divided into those withintegrated virus (T ∗m) and those with pre-integrated virus (I∗). This model does notdistinguish the I∗ and T ∗m populations. This assumption is made given the shorttime frame of interest (2 weeks) and fact that the cell takes approximately 1 week todegrade pre-integrated virus. We assume that all memory cells that are infected willbe stimulated before virus is degraded.
Hence, the current model allows T-cells an extra week to be stimulated which mayoverestimate the prevalence of infected T-cells. To incorporate the fact that somemay not be stimulated within a week, and revert back to a non-infected memoryT-cell, one could replace αv with (αv−νT∗), where νT∗ is the probability of reversionback to an uninfected Tm upon viral degradation.
The insignificance of this effect is supported by the relatively low sensitivity of viralproliferation to the parameter αv in the sensitivity analysis.
• No macrophages: In earlier versions macrophages were included as variables andspecifically played a role in: i) stimulation and infection of resting T-cells, ii) virusproduction, and iii) recruitment of Di. Excluding macrophages follows the biologi-cal model that T-cell stimulation occurs primarily through dendritic cells and viralproduction by macrophages is only significant in their role as a reservoir in chronicinfection, not acute infection.
The mechanism in which they might have a significant impact is in recruitment:nTreg mediated regulation may occur through promoting the differentiation of M1
48

to M2 where M1 can recruit and lead to higher Di levels and M2 does not. Thismacrophage-mediated recruitment is included as εm in Equation (1) to promote anet increase in Di under inflammatory conditions. The lack of induced T-regulatorycells may skew recruitment dynamics, however sensitivity analysis did not show cmto be highly influential.
• Only effector, inflammatory T-cells are included: This version does not include in-duced T-regulatory cells (iTreg), but rather only inflammatory Th1 cells. To distin-guish iTreg and Th1 is not necessary as CD4+ T-cells are merely included as virusproducers. Representing only T-cells of the Th1 phenotype allows us to model theresponse to the virus, specifically, which is generally Th1 response [29]. It also al-lows us to make IFN-γ-dependent functions (NK activity and viral production rate)dependent directly on T-cell concentration.
The assumption that virus induces a Th1 response is supported by SIV studies thatshow elevated tissue levels of IFN-γ and IL-12 following infection [2] and the paradigmthat this is the response to intracellular pathogens in general [29].
A potentially important aspect this simplification may exclude is that infected den-dritic cells may induce conventional T-cells to an iTreg phenotype [22], thereby, cre-ating a virus-producing population that does not promote an antiviral response. Anattempt to include this dynamic is the option to allow infected dendritic cells to stillstimulate members of the Rm population, by setting δr > 0, but not conventionalT-cells, δ = 0. As δ represents inflammatory function of DCs including stimulationof T-cells to a Th1 phenotype as well as recruitment of T-cells to the lymph node,this is also a coefficient for recruitment of resting nTreg by infected DI∗ in equations(19) and (20).
B.2 The Assumptions That May Need to Be Re-visited
Below is a list of simplifying assumptions that violate the currently accepted biologicalunderstanding of the system and its response.
1. Homeostatic turnover of memory T-cells: The effect of homeostatic cytokine-mediatedstimulation of effector and central memory T-cells are not included in the model atthis point as it does not appear to play a role in sequence of events in acute infection.
2. Memory T-cells are not currently infected upon transient association with virus-harboring dendritic cells in the absence of antigen recognition.
3. The model assumes that effector functions (cytokine secretion and signalling) is notaffected by infection state of a cell.
49

4. Though the viral life cycle requires approximately 24 hours between infection andbudding of nascent virions, the model assumes budding to occur immediately uponinfection. Given that this is roughly the time it takes for dendritic cells to migratefrom the LP to the GLN upon viral uptake, one could argue that this assumptioncould lead to a pre-mature spike in free virus concentration in the LP. However, aspike in the LP prior to a spike seen in the GLN actually would agree with viral loadcurves taken from these tissue areas in an SIV model [47]. Future versions of themodel may include a delay term for viral budding from T-cells and DC to captureany possible impact of this 24 hour delay on infection dynamics.
5. The model does not include CTL-mediated removal as a function of T-cells becausethis would not take place within the scope of two weeks. The time-frame places focuson innate immune aspects.
6. NK cell cytotoxic behavior is promoted by IL-12, IL-15, IL-18, IL-21, IFN-α, andIFN-β in vitro. Though in vivo studies have linked NK activity specifically withDC-mediated activation, we assume it is dependent on DE and TE as Th1 is also asource of IL-12 and IFN.
7. Upon activation T-cells are assumed to proliferate within the first 6 hours, whenthey actually proliferate after a few days. This may lead to a pre-mature spike inthe T-cell population in response to pathogen. Future versions may include a delayterm for proliferation to account for any potential impact this may have on T-celland, therefore, viral dynamics.
8. Through removal of dendritic cells by nTreg the model assumes that anergic dendriticcells do not secrete IL-12, 15, 18, 21, nor IFN-ab that induce NK activity.
9. We assume dendritic cell function is only affected by its infection state and not thecytokine environment.
10. We do not take HIV-induced apoptosis of bystander cells into account under the asso-ciation of this function with CXCR4 strains and we are modeling CCR5 strains, themost common infecting phenotype. Inclusion of this may have an effect on dynamicsplacing less emphasis on µNK for cell depletion.
11. It has been observed that the majority of stimulated mucosal dendritic cells secreteanti-inflammatory IL-10 and TGFβ cytokines [28] upon stimulation by antigen com-pared to peripheral dendritic cells and, therefore, would not induce a Th1 response.This may warrant modification of the parameters αT and αt, the probabilities ofconventional T-cell stimulation to an inflammatory Th1 phenotype to incorporatethe probability that the presenting dendritic cell is secreting IL-12 as opposed toIL-10/TGF-β.
50

12. The model assumes that each infected T-cell buds virus at a constant rate over a 1week activation period as opposed to shedding most virus during its brief proliferationstage.
51

C Additional Research Questions Explored
Here are the results from other “low-hanging fruit” experiments that we do not considerhighly relevant to the biological community and do not think need to be reported in thisstudy.
C.1 Significance of Infected nTreg Proliferation
It is generally accepted that unlike conventional CD4+ T-cells, memory nTreg do notundergo significant proliferation upon reactivation. However, virus-induced proliferationof latently infected nTreg has been observed in vitro in the lab of Dr. Shila Nordone.To test the effect of this proposed proliferation in vivo the parameter pR was included inEquation (20). Simulations were then carried out with a value of pR = 512, representingproliferation of latently infected nTreg upon stimulation.
Preliminary Result Memory nTreg do not proliferate upon re-stimulation by dendriticcells. However, virally-induced proliferation of latently infected nTreg has been observedin vitro (unpublished). This hypothesized mechanism is included as the coefficient pRin Equations (20) and (22). Proliferation is permitted by assigning a value to pR thatis greater than 1. For this reason proliferation of infected memory nTreg, R∗m, may beincluded by adding the coefficient pR to the terms 0.5kαTR
∗mD
I and 0.5kαTR∗mD
E inEquation (20) and (22). Table 9 shows that whether latently infected nTreg can proliferateupon re-stimulation has a significant impact on the window period for intervention. It maybe useful to identify whether this phenomenon occurs in vitro, as a potential avenue forintervention.
Table 9: Effect of latently infected nTreg proliferation.Condition z1max(tpeakLP ) z2max(tpeakGLN )
pR = 1 1.804 · 109(23) 5.45 · 109 (26)
pR = 512 1.1875 · 108(15) 6.7232 · 109(15)
C.2 Effect of Virus-Induced Inhibition of DC-Mediated nTreg Stimula-tion
The characteristics of dysfunctional, infected DC described in [22], IL-10 secretion andreduced CD80 expression, may not affect its ability to continue to stimulate nTreg even
52

when it is unable to induce a Th1 phenotype. One hypothesis states that the evolution-ary advantage is found in the inability of DC-mediated NK activity, while at the sametime, maintaining DCs ability to stimulate nTreg, which are significant viral producers.To explore this possibility, the model includes δr for nTreg stimulation. This is a separateparameter from δ as IL-10 secretion and decreased CD80 levels is sufficient for nTreg stim-ulation in vitro [22]. A δ = 0 and δr = 1 represents a scenario in which only inflammatoryactivity of dendritic cells is compromised where as it is still able to stimulate nTreg. Sim-ulations were run sampling values for these parameter from the set {0, 0.74, 1} for δ and{0, 1} for δr.
Results: Neither affected vRNA levels significantly, with changes being within a factorof 2. The parameter δ did have an impact on the window period, however, as completeinhibition, δ = 0, significantly delays viral propagation of initial viremia and the immuneresponse such that the ‘window period’ is extended by 3 days in the LP and the GLN,occurring at time points 35 and 37 as opposed to 23 and 26. This is coupled with nosignificant change in viral load (Table 10).
Table 10: Effect of virus-induced tolerance in DC.Condition z1max(tpeakLP ) z2max(tpeakGLN )
δ = 0.74 1.804 · 109(23) 5.45 · 109 (26)
δ = 0 1.7824 · 109(35) 5.4317 · 109(37)
Further analysis: It is possible that allowing infected dendritic cells to stimulate T-cells to proliferating iTreg phenotype would show that these conditions do, indeed, lead toincreased viremia. It is possible that allowing infected DC to induce T-cells to proliferatingiTreg could have a positive effect on vRNA levels and may be worth exploring in futuremodels in order to contextualize this curious effect on DCs.
Conclusion: This does not support the hypothesis that virus would gain a net benefit ininhibiting DC-mediated inflammation as the decreased µNK is also coupled with reducedT-cell recruitment and conventional T-cell stimulation. This is true even in the case ofcontinued nTreg stimulation.
C.3 Role of Different Cells in Initial Dissemination
This was tested by reducing the parameters governing infection of resting dendritic cells(αm) and resting T-cells (αv) upon contact with virus.
53

Preliminary results: Reduction of αv to 10−12 had an impact on delaying viral prop-agation by 1.5 days where as a reduction of αm to 10−12 had a more significant effect inextending the window period by four days, compared to the null model, in both tissuesleading with peak levels being reached at time point 44 in the LP and at time point 47 inthe GLN, as opposed to time points 23 and 26 (Table 11).
Table 11: Effect of DC and Tm infectionCondition z1max(tpeakLP ) z2max(tpeakGLN )
wildtype 1.804 · 109(23) 5.45 · 109 (26)
αv = 10−12 1.1549 · 109(29) 4.2097 · 109(32)
αm = 10−12 1.9056 · 109(44) 5.6509 · 109(47)
Conclusions: Infection of dendritic cells is a worthy target of intervention, over inhibitingdirect infection of resting T-cells.
54


