Hospitality and Tourism Operations Research
28
0 Hospitality and Tourism Operations Research Westview High School DECA Chapter Westview High School 4200 NW 185th Avenue Akaash Chikarmane & Junik Kim 1/23/15
-
Upload
akaash-chikarmane -
Category
Documents
-
view
600 -
download
0
Transcript of Hospitality and Tourism Operations Research

0
Hospitality and Tourism Operations Research
Westview High School DECA Chapter
Westview High School
4200 NW 185th Avenue
Akaash Chikarmane & Junik Kim
1/23/15

1
Table of Contents
I. Executive Summary 1
One page description of the project 1
II. INTRODUCTION 2
A. Description of the business or organization 2
B. Description of the community (economic, geographic, demographic and socioeconomic
factors) 4
C. Overview of the business or organization’s current target market 6
III. RESEARCH METHODS USED IN THE STUDY 7
A. Description and rationale of research methodologies selected to conducted the research
study 7
B. Process used to conduct the selected research methods 12
IV. FINDINGS AND CONCLUSIONS OF THE STUDY 14
A. Findings of the research study 14
B. Conclusions based on the findings 21
V. PROPOSED STRATEGIC PLAN 23
A. Objectives and rationale of the proposed plan 23
B. Proposed activities and timelines 24
C. Proposed metrics or key performance indicators to measure plan effectiveness 26
VI. PROPOSED BUDGET 27
Costs associated with proposed strategies 27
VII. BIBLIOGRAPHY 28
I. Executive Summary

2
One-page description of the project
Bubble Crunch - residing in a suburban cluster of businesses - stands as an interesting and unique
restaurant, far from being a normal one. With fantastic creations such as Kimchi Steak Fries, mixing
western and eastern cultural foods, Bubble Crunch captivates a vast number of people to come in and try
its special foods, unobtainable from anywhere else. Starting with the target market, we performed a deep
research on Bubble Crunch. Through secondary research online as well as primary research, where we
met with the manager of Bubble Crunch, many pros and cons of Bubble Crunch were discovered.
Findings show that the Baby Boomers appear as the most underserved generational group. On
questions with the higher dissatisfaction rates, Baby Boomers never ceased to show up as the most
prominent voters. They showed the most dissatisfaction on the questions on the questionnaire, especially
with the food and drink selection, and the speed of service of Bubble Crunch. Therefore, the plans to
better serve the customers of Bubble Crunch revolved around fixing or modifying either the customer
service speed or the selection of the menu.
With the goals of increasing the number of customers from the Baby Boomers and making the
customer service faster, such plans came up with a budget of $5200:
- Suggestion of traditional foods promotion
- Special training with the manager
The traditional foods promotion will ask customers to suggest a specific type of traditional food that may
fit well with the current menu of Bubble Crunch. The special training with Nga Myers, the manager of
Bubble Crunch, will greatly increase the speed at which the employees serve the customers.
With these activities working to fix specific problems, Bubble Crunch can attract more Baby
Boomers, hopefully increasing overall sales and creating a bigger target market. With such tremendous
potential, Bubble Crunch will rank up as one of the best after the implementation of these plans.

3
II. Introduction
A. Description of the Business or Organization
Nga Myers, the manager of Bubble Crunch, opened the restaurant in 2013. Located on
NW 185th Avenue near Highway 26 in Beaverton, Bubble Crunch serves people with a taste for
fusion food. The owner runs the store along with a couple of teenage employees. The store,
being quite petite, holds one four-person table and four two-person tables. The sofa sits in the
entrance to give it more of a relaxed atmosphere. On the outside, Bubble Crunch displays its
name written in neon bubble letters, to evoke a welcoming impression.
Nga wanted to create a restaurant that embodied both Western and Eastern cultures,
creating a fusion restaurant. Seeming that there were no stores that exhibit both styles of cuisine
nearby, Nga decided to set up the unique shop to show the town that such cuisine exists. The
menu consists of Asian-Western
fusion foods, ranging from
strawberry bubble tea to kimchi-steak
fries. The average customer spends
about $7 per visit on the bubble tea
($3.25 for a small and $4.25 for a
large) and the kimchi steak-fries with
4
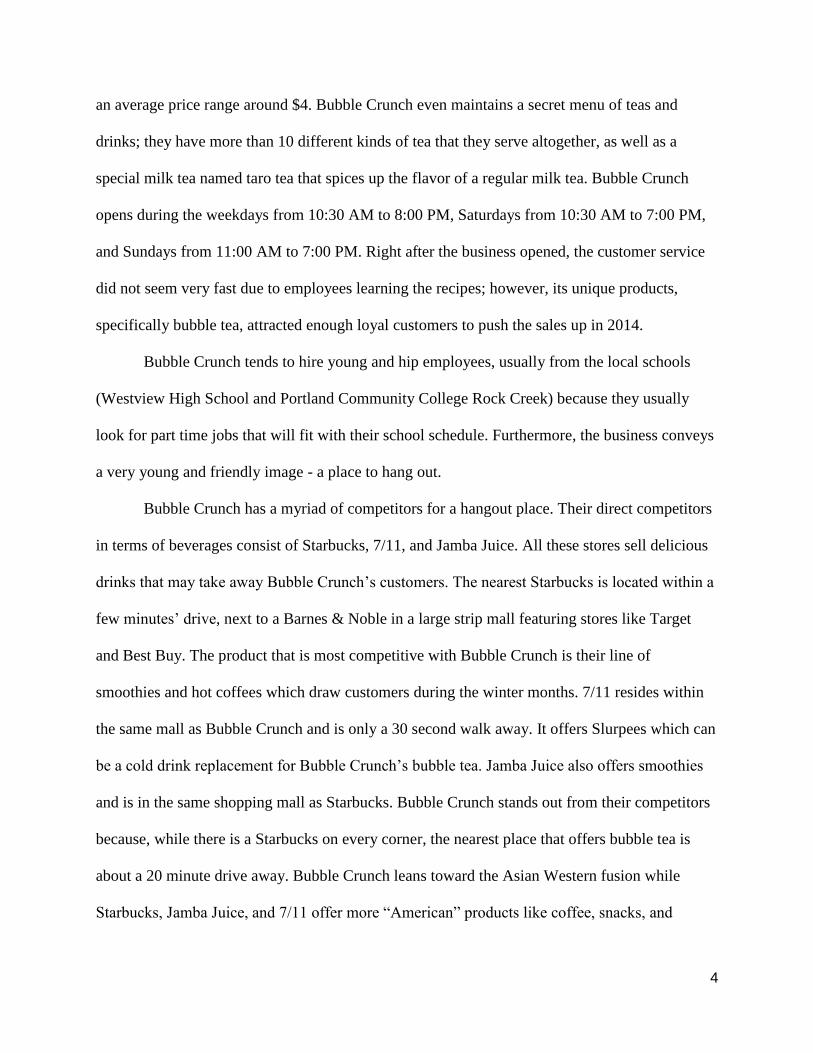
an average price range around $4. Bubble Crunch even maintains a secret menu of teas and
drinks; they have more than 10 different kinds of tea that they serve altogether, as well as a
special milk tea named taro tea that spices up the flavor of a regular milk tea. Bubble Crunch
opens during the weekdays from 10:30 AM to 8:00 PM, Saturdays from 10:30 AM to 7:00 PM,
and Sundays from 11:00 AM to 7:00 PM. Right after the business opened, the customer service
did not seem very fast due to employees learning the recipes; however, its unique products,
specifically bubble tea, attracted enough loyal customers to push the sales up in 2014.
Bubble Crunch tends to hire young and hip employees, usually from the local schools
(Westview High School and Portland Community College Rock Creek) because they usually
look for part time jobs that will fit with their school schedule. Furthermore, the business conveys
a very young and friendly image - a place to hang out.
Bubble Crunch has a myriad of competitors for a hangout place. Their direct competitors
in terms of beverages consist of Starbucks, 7/11, and Jamba Juice. All these stores sell delicious
drinks that may take away Bubble Crunch’s customers. The nearest Starbucks is located within a
few minutes’ drive, next to a Barnes & Noble in a large strip mall featuring stores like Target
and Best Buy. The product that is most competitive with Bubble Crunch is their line of
smoothies and hot coffees which draw customers during the winter months. 7/11 resides within
the same mall as Bubble Crunch and is only a 30 second walk away. It offers Slurpees which can
be a cold drink replacement for Bubble Crunch’s bubble tea. Jamba Juice also offers smoothies
and is in the same shopping mall as Starbucks. Bubble Crunch stands out from their competitors
because, while there is a Starbucks on every corner, the nearest place that offers bubble tea is
about a 20 minute drive away. Bubble Crunch leans toward the Asian Western fusion while
Starbucks, Jamba Juice, and 7/11 offer more “American” products like coffee, snacks, and

5
Slurpees.
B. Description of the Community (economic, geographic, demographic, and
socioeconomic factors)
Bubble Crunch resides in Beaverton, Oregon, near Westview High School and Portland
Community College Rock Creek, with a busy highway within proximity. Bubble Crunch sits in a
location with many other competing restaurants, such as Jamba Juice, Starbucks and BlackRock.
The median income of people who live near the store reaches $56,123. The median income is a
better measure of income than the mean income due to outliers as a result of the nearby Silicon
Forest, a group of companies that employ well-paid engineers who create technologies ranging
from test-and-measurement equipment to computer chips or electronic displays. The
unemployment rate in Beaverton is 5.8%, a number comparable to the national unemployment
rate of 5.9%. Beaverton sports the Nike and Columbia headquarters, and has integrated the Intel
and Vernier headquarters into its community. Beaverton houses a fairly wealthy community;
residents indulge in expensive electronic gadgets and spend money and time practicing their
leisurely activities. The law in Oregon requires all children under the age of 18 to attend school,
which has improved literacy rates in the past few decades.
The residents around Bubble Crunch also have certain psychographic characteristics
unique to their location. Since the Nike headquarters is in Beaverton, people often buy Nike
clothing and can be seen working out. On hot, summer days these people might stop in for a cold
drink at Bubble Crunch. Seeming that it’s rainy in Oregon, many indoor gyms can be found in
the surrounding area for those who abhor the rain. Overall there is a very outdoorsy spirit in
Beaverton which is in sync with its beautiful geographic location.
With tons of trees, people in Beaverton involve themselves with the environment,
6
because Oregon in general is very green. Beaverton, a suburban area, stands as one of the
greenest cities in the United States. Oregon law requires cities to keep a certain square mile of
green space within the city to preserve the nature friendly image. This suits the natural rainy state
of Beaverton (39.95 inches per year) as there is an unlimited source of water for the plants from
the nearby Cascade Mountain Range.
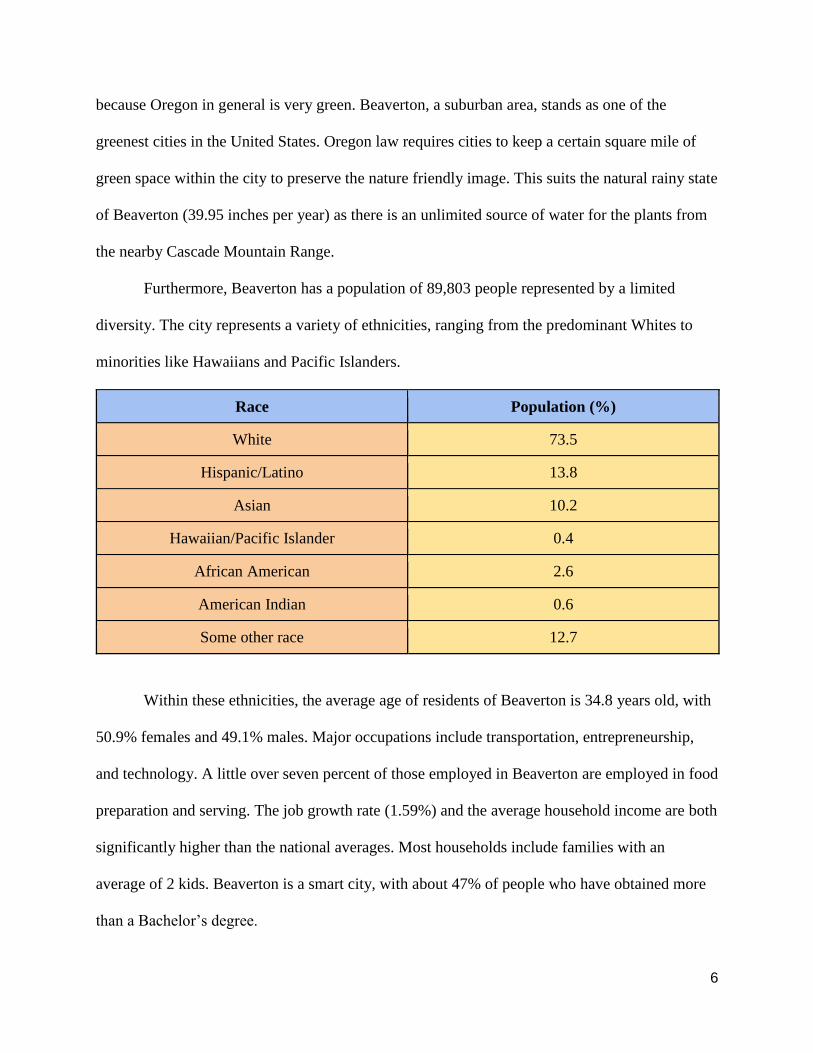
Furthermore, Beaverton has a population of 89,803 people represented by a limited
diversity. The city represents a variety of ethnicities, ranging from the predominant Whites to
minorities like Hawaiians and Pacific Islanders.
Race Population (%)
White 73.5
Hispanic/Latino 13.8
Asian 10.2
Hawaiian/Pacific Islander 0.4
African American 2.6
American Indian 0.6
Some other race 12.7
Within these ethnicities, the average age of residents of Beaverton is 34.8 years old, with
50.9% females and 49.1% males. Major occupations include transportation, entrepreneurship,
and technology. A little over seven percent of those employed in Beaverton are employed in food
preparation and serving. The job growth rate (1.59%) and the average household income are both
significantly higher than the national averages. Most households include families with an
average of 2 kids. Beaverton is a smart city, with about 47% of people who have obtained more
than a Bachelor’s degree.

7
C. Overview of the Business or Organization’s Current Target Market
Bubble Crunch sits near the border of the 97229 zip code so it also draws customers from
the surrounding 97006 and 97124 zip code. People in the area enjoy the suburban lifestyle and
family-friendly neighborhoods with tons of trees decorating the streets. The temperature of
Beaverton averages 52.6℉ due to the constant drizzle that supports to the plethora of trees.
Bubble Crunch’s target market lives in either an apartment or a house although there are more
apartments nearby.
The typical customer is an Asian or Caucasian student (14-22 years old, mostly from
Westview and PCC) looking for a quick snack after school. These customers are attracted to the
Asian-Western fusion of flavors. Most customers do not have very large incomes because they
are students who work minimum wage part-time jobs while keeping up with their schoolwork.
Their household income is around $56,123 (the median income of the Beaverton area).
The target market tends to have less personal spending money than adults, so they look
for free activities such as playing sports or simply hanging out with their peers. They also like to
visit nearby locales such as the George W. Otten Park to relax after a tough day at school. At this
age, they also start to become more independent from their guardians, pushing towards activities
that require greater responsibility such as driving which gives them greater mobility to get to
places like Bubble Crunch where they can hang out with friends.
Furthermore, the target market likes to follow the latest trends in clothing and
technology; wherever the majority goes, the target market follows. Ranging from Silly Bands to
Elite Socks, the trend-setting fads attract the target market of Bubble Crunch. The parents of the
target market fund them, causing a reduction in good purchasing decisions that result in impulse
buys and frivolous purchases. The average customer usually spends about $7 per visit for a drink

8
and meal.
III. Research Methods Used in the Study
A. Description and rationale of research methodologies selected to conduct the
research study
Marketing research is conducted by marketing professionals in order to determine how
the activities of a business can be optimized to better suit the customer thereby helping the
company to expand. All businesses have space to improve from their current situation because
there is always a market that they are not quite reaching. Marketing research begins with
identifying the problem and setting goals that will be reached by the end of the research. After
identifying the goals, the marketer must collect data that applies to each goal. The data then
needs to be analyzed so that solutions can be drawn from the conclusions. The marketers then
generate recommended solutions to the research question, present those solutions, and decide
which solutions to actually implement.
It’s important for businesses to conduct research on the various generational groups
because, since they are the actual customers of the business. A missing or underserved
generational group can mean a large chunk of missing revenue for the business. Research into
Bubble Crunch’s current relations with various generational groups will uncover which groups
are currently unsatisfied and how they can be better served. Before starting the Bubble Crunch
research, a central question was established: What can Bubble Crunch improve to increase sales
to an underserved generational group? The objectives include: designing a research study,
conducting a research study (through customer questionnaire), analyzing the results of the

9
research study, preparing a detailed plan to better serve the customers from a generation group,
and preparing a proposed budget for the plan.
In order to answer the research question, step two involved gathering secondary data with
general statistics about the target market of Bubble Crunch, ranging from the target market’s
demographics to psychographics. This data prevailed as important for the research because it
provided characteristics of the target market, which aided in figuring out the needs of the primary
customer base. The psychographic information was especially fruitful because it will help
identify potential solutions. For example, if the missing generational group is more inclined to
run outside or invest in healthy products, they will probably be more drawn in by a special
Vietnamese salad than a more unhealthy option. The secondary data collection began in October
2014, and continued with current data on the community and competitors throughout the month.
Most information came from government websites as well as restaurant websites that compete
with Bubble Crunch.
Additional secondary research helped establish the common characteristics and
purchasing decisions of each generation. This information provided insight into the traits and
motives of each group in order to better plan improvements to Bubble Crunch that will serve
them. The generations are split as follows:
Year of Birth Generational Cohorts Approximate Age
2001-present New Silent Generation or Generation Z 0-13
1980-2000 Millennial or Generation Y 14-34
1965-1979 Generation X 35-49
1946-1964 Baby Boomers 50-68
1925-1945 Silent Generation 69-89
1900-1924 G. I. Generation 90-114
10
The G.I. Generation is the oldest generation that may still have members alive today.
Although only the oldest would have been able to fight in World War I, if even that, they still
lived through that period of history. They tend to have more conservative values. For example,
they have the lowest percentage of agreement with the statement “immigrants strengthen
society.” They also have the lowest percent of people unaffiliated with religion (5% compared to
the Silent Generation’s 10%). They became young adults during the Roaring Twenties but they
raised their families during the Great Depression so their spending habits are typically more
conservative.
The Silent Generation were children during the Great Depression so they tend to be
stingier than even the G.I. Generation. However, they are all retired now so they have more
money to spend and time to go places. They are hard workers which is why they are called the
Silent Generation. They just put their heads down and worked. When being advertised to (only
5% of ad budgets are allocated for the Silent Generation), they don’t want to be made to feel old.
These people also lived through World War II, the Korean War, the Red Scare, and the Atomic
Bombing of Japan. They are loyal to a brand so they will continue to buy food from a restaurant
that they know and love.
Baby Boomers probably went to Vietnam either by choice or by draft. As a result they
are involved in their communities and pay close attention to their health and wellness. Baby
Boomers account for about 55% of consumer goods package sales in the U.S. They tend to
outspend the average consumer in almost all categories (food away from home, entertainment,
household furnishings, personal care, and gifts). 96% of Baby Boomers participate in word-of-
mouth advertising so attracting Baby Boomer customers will become easier over time as they
11
share information with their friends. Baby Boomers were children during the prime of the anti-
segregation movements.
Generation X is the generation after the Baby Boomers. They marked a period of birth
decline compared to the rapid population decline during the birth of the Baby Boomers. While
they were thought of as slackers during the 90’s they are now in the prime of their adult lives and
hold a lot of power in the world. They are the current senators of the United States and make up
a big amount of purchasing decisions for their family. They buy based on affordability, quality,
and trendiness (they use Yelp, Ebay, and Craigslist to help make these decisions). They are more
active than the Baby Boomers and many of them are married with kids. The women of the family
usually work to generate a second income.
The Millennials are the up-and-coming generation. They are currently either teenagers
still in high school or young adults finishing college/joining the workforce. They do not have as
much money as their Generation X counterparts, but they are doing better in school than past
generations and are more open-minded to change. They are primed and ready to start taking over
the economy of the world with new technology and ideas. They have lived through the Great
Recession which made them stingy and always look for the best deal.
As the newest generation, Generation Z convey completely different ideas and customs
from that of the older ones such as Baby Boomers and the Silent Generation. They are
completely modernized, surrounded with a myriad of technologic devices. With such fast
connection and information, they tend to be impatient and take things for granted. For example,
they like to keep everything short, whether it is a message to a person (thus coming up with
abbreviations such as LOL and OMG) or commercials. Furthermore, they are less willing to
work for minimum wage, because they feel that they deserve more than the lowest amount - a

12
strong contrast to the ideas of the Silent Generation, who are willing to work for anything. The
cost of items do not affect their decision to buy; since they mostly borrow their parents’ money
to purchase, thus they do not feel the need to consider the actual value of the item.
The primary research process began with an interview on 10/16/14. To collect
information that could not be answered from secondary research, interviewing the manager was
the best choice for the research because she could answer questions specific to Bubble Crunch
which is very necessary information before identifying solutions to increase sales. She discussed
the range of ethnicity among customers, its true competitors, its future plans to develop, and
Bubble Crunch’s target market. The information identified the strengths and weaknesses of the
business, which ultimately aided in developing the final suggestions. The manager of the
business, Nga Myers, also the founder of Bubble Crunch, has the most knowledge about her own
business. She gave us one of her best bubble teas for free, to show that it was one of her many
great flavors and that she was confident in her products to compete against her rivals. Nga said
that her most frequent visitors were Asian students mostly from Westview High School and
P.C.C. - Rock Creek.
Additional primary research from the customers would also be needed to answer the
research question. The survey method via a questionnaire is an appropriate method for gathering
information because it will provide information directly from the customer. This method will
reduce any errors due to variations in who is asking the questions (for example, none of the
participants will be intimidated into saying that the restaurant was great because they were being
asked about their experience by somebody intimidating). The information gathered from the
survey will be important because it will give a real account of who comes to the store (which
generational cohort they belong in) and what their experience was like. The information

13
collected will then be analyzed to create a plan. The survey questions address the 4 P’s of
Marketing (Product, Price, Place, Promotion) in relation to the research objectives. The
questionnaire included questions such as “What additional food option(s) would you like to see
added to the menu of Bubble Crunch?” (product decision) to get a better idea of whether the
customer is satisfied with the menu. Before handing out the questionnaire, and in order to
preserve reliability and validity, peers reviewed and pre-tested the questionnaire. The manager,
Nga Myers, also reviewed the questions on the questionnaire and gave the all clear to put it in the
store. In general, the questions focused on the relationship between the customer and the
restaurant. The planning of the questionnaire took place from November 7th to December 16th.
The next step in the research process requires the primary research data to be collected and
analyzed before generating solutions to the problem.
B. Process used to conduct the selected research methods
A pretest of the questionnaire revealed some useless questions that did not benefit the
research goal, such as asking, “What kind of drinks do you order at competitors’ stores?”
Furthermore, it contained some redundant questions - it asked their grade, as well as age. General
questions, instead of specific, further decreased the effectiveness of the questionnaire. Therefore,
the questionnaire went through a major revision in terms of content - by cutting out all the petty
questions that did not help at all, and adding in some that specifically pinpointed information
such as items that the respondents wanted on the menu as well as target market descriptors.
However, all these specific questions lead to a very long questionnaire, unable to fit on two
pages. Thus it became necessary to make a table to bundle questions with the same answers
(rating from 1-4 or yes/no). Out of the 5 people who pretested the questionnaire in Mrs. Clark’s

14
marketing class, all of them seemed satisfied with the content of the questions after a few
corrections on wording and punctuation.
After revising the questionnaire, a meeting was scheduled with Nga Myers to confirm the
validity and the reliability of the questions. Being a marketer herself, Nga pointed out some of
the poorly written questions that lowered the validity and suggested a more diverse type of
questions to increase our reliability. After finalizing the questions, the questionnaires were
distributed inside Bubble Crunch. The data collection started December 22nd and ended January
9th. The questionnaires simply sat on top of the cashier counter, for visibility. Nga also asked
customers if they would like to fill out a survey as they paid for their food. No particular factor
hindered the survey process, except the fact that the questionnaires started during a holiday week
when fewer customers visited Bubble Crunch. Out of the 100 questionnaires printed only 75
were completed.
IV. FINDINGS AND CONCLUSIONS OF THE STUDY
A. Findings of the research study
The following information
conveys the results of the survey
conducted from December 22nd to
January 9th. The answers to the
question, “How did you first hear
about Bubble Crunch?” are equally
divided between signage and

15
friends. 33.3% of people voted for both of those answers. Yelp and Other (driving past, etc.)
have the lowest amount of responses with 10.7% and 2.7%, respectively.
The top two answers to
“How often do you visit
Bubble Crunch?” are
also close to each other
with 38.7% of
customers visiting
Bubble Crunch weekly
and 32% visiting
monthly. There are no customers visiting daily and only 12% visiting several times per week.
Customers visited Starbucks, Jamba Juice, and similar businesses for various reasons.
The most significant
reasons are that they have
higher food quality and
better service (35.3%
each). 2.5% visited
Starbucks for their variety
of coffees and Jamba
Juice because it was a
healthy option. 22.9% of the customers surveyed said that they visited the competitors because
they had a better location.

16
The next question asked “What time of the day do you usually visit Bubble Crunch?”
Almost 50% (46.7%) of the
customers visited Bubble
Crunch during lunch time.
Another 25.3% go in the
Afternoon (2-4) and the rest go
in either the morning (10:30-
12) or the evening (4-7).
The question “How long is the drive from your house to Bubble Crunch?” was meant to
gauge the distance between the customer’s residence and the business. Most people were either
within a 5-10 minute
drive of Bubble
Crunch or walking
distance. 30.7% of the
customers were in
each of those groups
with the smallest
group being 20+ minutes at only
5.3%.
Over 50% of the customers agreed
that their customer service
experience on the day they filled out
the questionnaire was satisfactory

17
with 18.7% strongly agreeing with the statement. However, an additional 18.7% of customers
disagreed with the statement with only 4% strongly disagreeing.
58.2% of customers agreed with the statement that the quality of the drinks was good and
68.5% said that the food quality
was good. Meanwhile, 38.4%
strongly agreed with the
statement about the drink quality and 20.5%
strongly agreed about the food.
60.3% of the customers agreed with the statement that the atmosphere of Bubble Crunch
was welcoming. However, 6.8% disagreed and 2.3% strongly disagreed. The other 30.1%
strongly agreed with the statement. The majority of people responded to the statement “the
exterior design was appealing” and “the
interior design was appealing” with more agreement than disagreement.

18
With 81.1%
agreed/strongly agreed
about the exterior and
94.6% agreed/strongly
agreed for the interior
design.
The prices of items at
Bubble Crunch also satisfies the
customer’s expectations. Majority
of the customers responded to the
statement “The price for each item
you ordered was reasonable” with
mostly agreement. 86.7%
agreed/strongly agreed, a highly significant number compared to the disagree/strongly disagree
of 13.3%.
The statements “the selection of food is satisfactory” and “the selection of drinks is
satisfactory” were marked mostly with agreement; both questions had about the same
19
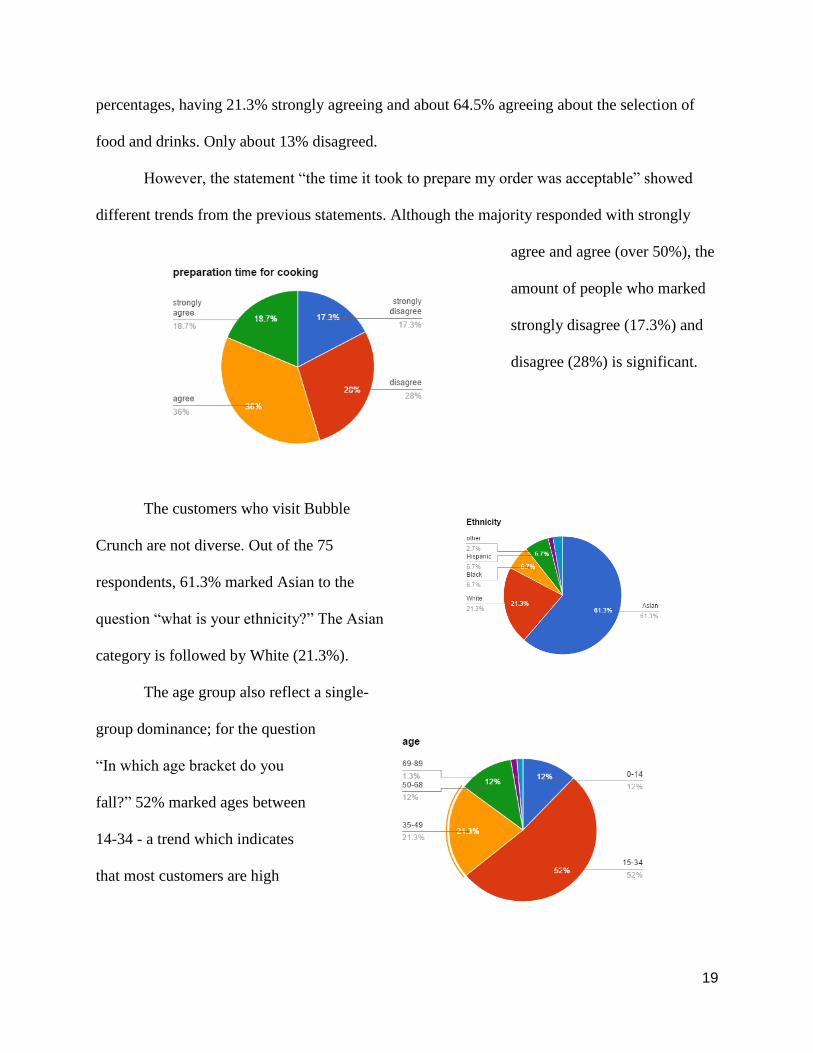
percentages, having 21.3% strongly agreeing and about 64.5% agreeing about the selection of
food and drinks. Only about 13% disagreed.
However, the statement “the time it took to prepare my order was acceptable” showed
different trends from the previous statements. Although the majority responded with strongly
agree and agree (over 50%), the
amount of people who marked
strongly disagree (17.3%) and
disagree (28%) is significant.
The customers who visit Bubble
Crunch are not diverse. Out of the 75
respondents, 61.3% marked Asian to the
question “what is your ethnicity?” The Asian
category is followed by White (21.3%).
The age group also reflect a single-
group dominance; for the question
“In which age bracket do you
fall?” 52% marked ages between
14-34 - a trend which indicates
that most customers are high

20
school or college students. The rest are almost evenly distributed, with the next largest group
ages 35-49.
Few customers responded to the question “Which additional food option(s) would you
like to see added to the menu at Bubble Crunch?” However, the majority of those respondents
replied with the food item Pho, a traditional Vietnamese noodle dish. The rest are small
suggestions that fit individual needs, such as gluten free bread sandwiches and Vietnamese salad
rolls.
B. Conclusions based on the findings
Although 33% of customers first heard about Bubble Crunch through their friends, that’s
not an advertising method that’s really in the control of the business. However, another 33% of
the customers first discovered Bubble Crunch through the signs. The street that Bubble Crunch
looks onto gets lots of traffic since it is located near the entrance to a highway and a large group
of stores. As a result, the sign gets a lot of views and therefore, draws lots of customers. Many of
the customers also say that they live or work around the area of Bubble Crunch (61.4% said they
were walking distance or a 5-10 minute drive away from Bubble Crunch). Furthermore, the
research indicated that Millennials and Baby Boomers learned about Bubble Crunch for the first
time for the signs and their friends. Bubble Crunch’s large sign attracts local customers to the
business, along with positive word-of-mouth.
People visit Bubble Crunch’s competitors for the better quality of products and their
better customer service. Just over 20% also said that they went for the better location however,
that is not something that can be addressed without opening another store which is not very
realistic. However, the quality of products and quality of customer service are two areas that can
definitely be improved upon. The biggest issue among Baby Boomers and Generation Z was the
21
better quality. Generation X’s biggest reason to buy from competitors was because they found
the customer service to be better. Bubble Crunch will draw more customers from their
competitors if they place a greater emphasis on customer service and food quality.
Most customers leaned towards the agreement side, averaging 80% agreement (strongly
agree or agree), regarding their assessment of Bubble Crunch’s store design, atmosphere, pricing
and selection. Customers enjoy the interior and exterior design of the rest as well as the
atmosphere. Very few customers are unsatisfied with the value and selection of the food. Bubble
Crunch knows how to please the customers and should continue their current strategies in
these areas.
However, one statement defied the trend of satisfaction among customers: “The time it
took to prepare my order was acceptable.” With a 45.3% disagreement rate, this statement proves
the dissatisfaction with the speed of service at Bubble Crunch. As the majority of customers visit
during lunch, they are likely to have less time to wait for food before returning to work With
such a high rate of disapproval on food preparation time, Bubble Crunch should work on
increasing the speed of service.
The age breakdown reflects a greater proportion of 15-34 year olds (52%), also known as
Millennials. The age group 35-49, known as Generation X made up 21.3% of respondents.
Currently, Bubble Crunch attracts few customers from Generation Z, Baby Boomers and the
Silent Generation (excluding the G.I. Generation, assuming that not many are alive nearby).
The information below summarizes each generation’s level of satisfaction with Bubble
Crunch: For Generation Z, their most problematic factor at Bubble Crunch was the wait time for
the food preparation. Impatience stands as a main characteristic of Generation Z; living in such a
privileged world, Generation Z tend to have short waiting span. Generation Z also tend to come

22
in during the afternoon hours of 2 PM to 4 PM which could mean they come in right after school
ends. The Millennials were the largest generational group that came into Bubble Crunch. They
mostly came in during their lunch hours (12PM - 2PM) so they were probably either coming in
during their lunch break from work or their lunch time during school (from Westview High
School). Most of Generation X is in the workforce right now so their peak time of 12PM to 2PM
was similar to that of Generation Y. They both most likely come in during their lunch break.
From the information collected from the questionnaires, Baby Boomers seemed to have the
potential to be both satisfied and help the business grow through their patronage. They seemed to
be dissatisfied with multiple factors, such as the selection of food and drinks, along with the
preparation time and the atmosphere. Having lived longer, they have seen many types of
different foods and drinks while growing up; the spreadsheet of the generation group shows that
Baby Boomers require a greater variety of items. Also, the Baby Boomers are as almost as
impatient as Generation Z; with such a population increase back in their times, they have had
many cases of waiting for what they wanted, whether it was food or clothes - they expect faster
operations from modern restaurants and companies.
V. PROPOSED STRATEGIC PLAN
A. Objectives and rationale of the proposed plan
Based on all of the secondary and primary data, it is evident that Bubble Crunch has a
great opportunity to increase its customer base by better serving the Baby Boomers. The plan to
satisfy the Baby Boomers will result in an 1) increase of customers within the Baby Boomer
generation by 10% within a year, 2) increase in overall sales by 5% within a year, and 3) increase
in satisfaction among Bubble Crunch customers so that no customers give a rating of 1 or 2 (on a

23
4 point scale) regarding the preparation time for food/drink, overall customer service, and overall
quality.
Bubble Crunch does not attract as many Baby Boomers as they do Millennials and
Generation X. The immediate advantageous effect of attracting more Baby Boomers will be that
their sales will boost so Bubble Crunch will make more money. Baby Boomers have the time
and money to visit regularly and purchase a full meal. They outspend all other generations,
including food away from home. They also like to try new things like the Asian-Western Fusion
that Bubble Crunch offers. Addressing the concerns of the Baby Boomer generation associated
with preparation time, selection of food, and overall food quality will also improve Bubble
Crunch for other customers thereby increasing overall sales.
B. Proposed activities and timeline
In order to fulfill the objectives, a few activities should be implemented. Staff training
and hiring is by far the biggest and most important activity. The staff training will decrease the
time that all customers including Baby Boomers have to wait for their order. Increasing the
number of employees will also allow each employee to concentrate on the customer more thus
allowing them to provide better customer service instead of rushing around because they are
understaffed. Training of the staff with Nga is also important because it will give them a better
knowledge of how to deal with the customers including Baby Boomers. On top of hiring more
employees this will further enhance their quality of customer service.
Bubble Crunch can launch a promotion by opening up a contest for customers. This
contest will ask customers to write down a traditional food that they want to see added to the
menu this process will be open from February 1st to the 7th. The suggestions will then be placed
on a list of other suggestions and the customers who come in from February 8th to the 28th will

24
be able to vote on which food type they would like added. The winner’s choice of food will be
added to the menu and they will earn a free meal as a prize. Increasing the number of traditional
foods on the menu will attract Baby Boomers thereby increasing the percentage of Baby
Boomers who visit Bubble Crunch.
Another important objective that we had to accomplish was to increase the number of
customers that come into Bubble Crunch by 10%. Completing this objective would also lead to
the completion or partial completion of Objectives 2 and 3. One of the key elements in
accomplishing this goal is to make Bubble Crunch more welcoming to the Baby Boomers while
also not taking drastic enough steps that it scares the younger generations away. In order to
achieve this goal, Bubble Crunch will have to hire a web designer to add an “About Us” tab to
their existing page. Since the code is already written, the web designer will only have to add
pictures and text provided by Bubble Crunch. The pictures will be of customers at Bubble
Crunch and will include Baby Boomers. This will show them that Bubble Crunch is also a good
place for Baby Boomers to bring their business. Along with that on the About Us page will be
the story of Bubble Crunch and its staff, primarily Nga, and the purpose of Bubble Crunch (why
Nga decided to set up her restaurant). All of these will project an air of openness to their Baby
Boomer customers who are thinking about coming into Bubble Crunch.
Timeline:
January 26th ~ February 2nd: Web Designer adds tab to existing webpage (7 days)
January 25th ~ February 28th: Job openings (35 days)
January 25th ~ March 10th: Special training with Nga Myers (45 days)
February 1st ~ February 7th: Traditional food suggestions (7 days)
February 7th ~ February 28th: Voting open for the food suggestions (21 days)

25
C. Proposed metrics or key performance indicators to measure plan
Effectiveness
In order to determine whether Bubble Crunch successfully increased the level of
satisfaction among Baby Boomers, each objective must be measured. Increasing the number of
customers that are Baby Boomers by 10%, can be measured by conducting a follow-up
questionnaire that includes the same generational age option. The questionnaires should be
collected over a similar span of 2 weeks to compare the percent increase in the number of Baby
Boomers. After achievement, Bubble Crunch can expect over 23% of Baby Boomers to complete
the follow-up survey.
The second objective is to increase overall sales by 5% over the year. This will be
measured by looking at sales after the implementation of the plan and comparing them to the
previous year’s sales. If this objective is achieved, sales will increase by $15,000 or 5% overall.
The last objective, to increase satisfaction among Bubble Crunch so that no customers
give a rating of 1 or 2 (on a 4 point scale) regarding the preparation time for food, selection of
food and drinks, and the customer service, will be measured in the same way as the first
objective.
The Return on Investment of these activities will define the effectiveness. Annual sales of
Bubble Crunch are approximately $300,000. A 5% increase results in $15,000 in new sales. The
total cost of the plan for the year is estimated to be $5200 (see section VI). Thus, the ROI equals
(15000-5200)/5200 = 1.88 which translates to 188%.

26
VI. PROPOSED BUDGET
Costs associated with proposed strategies
Activity Unit Description Units Unit Cost Total Cost
Traditional food
suggestion
Promotion
asking customers for
menu suggestion free free
Addition to Web
Page Hire Web Designer
to add tab on
webpage
$700 $700
Take pictures of
customers at Bubble
Crunch
To be added to web
page free free
Job application Hiring New
Employees 3 $1500 $4500
Employee training One on one training
with Nga free free
Total Budget $5200
Spending $5200 in a year translates to (5200/12) $433.33 per month. This number has no
significance compared to Bubble Crunch’s 5% increase from monthly sales (300,000/12 x .05),
$1,250 - the money spent to promote Bubble Crunch seems justified.
Overall, the research suggests that the underserved generation, the Baby Boomers, seem
to be dissatisfied with some components of the business, but a few minor improvements to
Bubble Crunch can draw this large customer base to the store more frequently. By addressing a
few of the concerns expressed by the Baby Boomers while keeping other areas constant to
continue to satisfy the younger generations, Bubble Crunch can definitely increase its sales and
store traffic over the long term.
VII. Bibliography

27
"Answers | How Much Does It Cost to Hire a Web Designer?" Answers | How Much Does It
Cost to Hire a Web Designer? Delta Creations, n.d. Web. 23 Jan. 2015.
<http://www.deltacreations.com/cost-to-hire-a-web-designer.html>.
"Beaverton, OR - Official Website." Beaverton, OR. Beaverton City Council, n.d. Web. 17 Oct.
2014. <http://www.beavertonoregon.gov/index.aspx?nid=90>.
"Bubble Crunch | Banh Mi and Bubble Tea." Bubble Crunch. Bubble Crunch, n.d. Web. 23 Jan.
2015. <http://bubble-crunch.com/>.
"Bubble Crunch." Yelp, n.d. Web. 17 Oct. 2014. <http://www.yelp.com/biz/bubble-crunch-
portland>.
"Economy in Beaverton, Oregon." Economy in Beaverton, Oregon. Sperling's Best Places, n.d.
Web. 17 Oct. 2014. <http://www.bestplaces.net/economy/city/oregon/beaverton>.
"Resources - 50+ Facts & Fiction." Facts and Fiction. Immersion Active, n.d. Web. 7 Jan. 2015.
<http://www.immersionactive.com/resources/50-plus-facts-and-fiction/>.
"Section 1: How Generations Have Changed." Pew Research Center for the People and the
Press RSS. Pew Research, 03 Nov. 2011. Web. 7 Jan. 2015. <http://www.people-
press.org/2011/11/03/section-1-how-generations-have-changed/>.
"United States Census Bureau." Beaverton (city) QuickFacts from the US Census Bureau. US
Department of Commerce, 4 Oct. 2014. Web. 23 Oct. 2014.
<http://quickfacts.census.gov/qfd/states/41/4105350.html>.