Horace Mann Educators Corporation 2020 Annual Report on ...
160
horacemann.com 2020 Annual Report on Form 10-K Horace Mann Educators Corporation
Transcript of Horace Mann Educators Corporation 2020 Annual Report on ...

horacemann.com
2020 Annual Report on Form 10-K
Horace Mann Educators Corporation

Longevity
• FoundedbyEducatorsforEducatorsin1945
• Offering403(b)taxqualifiedannuitiessince1961
• NYSElisted(HMN)since1991
Financial strength
• $13.5Binassets(1)
• $1.4Binpremiumandcontractdepositsfor2020
• $1.7Bmarketcapitalization(1)
• Highlyratedbyallfourmajorratingagencies
Niche market
• Educatorshavepreferredriskprofile
• Homogeneouscustomerset
• Servingabouthalfofschoollocations(2)inourmarketfootprint
Multiline model
• Businessmixbalancedbetweensegments
• Abilitytoprovidetotalhouseholdsolutions
• Providesearningsdiversification
Proud to be the largest multiline financial services company focused on America’s educators
(1)AsofDecember31,2020(2)Includesschoolbuildingsandadministrationlocations
Afinanciallysoundcompanywithastrongstrategyforprofitablegrowth

Filed with the SEC on February 26, 2021
UNITED STATESSECURITIES AND EXCHANGE COMMISSION
WASHINGTON, D.C. 20549
FORM 10-K ☒ ANNUAL REPORT PURSUANT TO SECTION 13 OR 15(d) OF THE SECURITIES EXCHANGE ACT OF 1934
For the fiscal year ended December 31, 2020 or
☐ TRANSITION REPORT PURSUANT TO SECTION 13 OR 15(d) OF THE SECURITIES EXCHANGE ACT OF 1934For the transition period from ______ to ______
Commission file number 1-10890
HORACE MANN EDUCATORS CORPORATION (Exact name of registrant as specified in its charter)
Delaware 37-0911756(State or other jurisdiction of incorporation or organization) (I.R.S. Employer Identification No.)
1 Horace Mann Plaza, Springfield, Illinois 62715-0001 (Address of principal executive offices) (Zip Code)
Registrant's Telephone Number, Including Area Code: 217-789-2500
Securities Registered Pursuant to Section 12(b) of the Act:
Name of each exchange onTitle of each class Trading Symbol(s) which registered
Common Stock, par value $0.001 per share HMN New York Stock Exchange
Securities Registered Pursuant to Section 12(g) of the Act: None
Indicate by check mark if the registrant is a well-known seasoned issuer, as defined in Rule 405 of the Securities Act. Yes ☑ No ☐Indicate by check mark if the registrant is not required to file reports pursuant to Section 13 or Section 15(d) of the Act. Yes ☐ No ☑Indicate by check mark whether the registrant (1) has filed all reports required to be filed by Section 13 or 15(d) of the Securities Exchange Act of 1934 during the preceding 12 months (or for such shorter period that the registrant was required to file such reports), and (2) has been subject to such filing requirements for the past 90 days. Yes ☑ No ☐Indicate by check mark whether the registrant has submitted electronically every Interactive Data File required to be submitted pursuant to Rule 405 of Regulation S-T (§232.405 of this chapter) during the preceding 12 months (or for such shorter period that the registrant was required to submit such files). Yes ☑ No ☐Indicate by check mark whether the registrant is a large accelerated filer, an accelerated filer, a non-accelerated filer, a smaller reporting company, or an emerging growth company. See the definitions of "large accelerated filer," "accelerated filer," "smaller reporting company," and "emerging growth company" in Rule 12b-2 of the Exchange Act.
Large accelerated filer ☑ Accelerated filer ☐Non-accelerated filer ☐ Smaller reporting company ☐
Emerging growth company ☐If an emerging growth company, indicate by check mark if the registrant has elected not to use the extended transition period for complying with any new or revised financial accounting standards provided pursuant to Section 13(a) of the Exchange Act. ☐ Indicate by check mark whether the registrant has filed a report on and attestation to its management's assessment of the effectiveness of its internal control over financial reporting under Section 404(b) of the Sarbanes-Oxley Act (15 U.S.C. 7262(b)) by the registered public accounting firm that prepared or issued its audit report. ☑
Indicate by check mark whether the registrant is a shell company (as defined in Rule 12b-2 of the Exchange Act). Yes ☐ No ☑
The aggregate market value of the registrant's Common Stock held by non-affiliates of the registrant based on the closing price of the registrant's Common Stock on the New York Stock Exchange and the shares outstanding on June 30, 2020, was $1,481.4 million.
As of February 16, 2021, the registrant had 41,422,460 shares of Common Stock, par value $0.001 per share, outstanding.
Documents Incorporated by ReferenceCertain portions of the registrant's Proxy Statement for the 2021 Annual Meeting of Shareholders are incorporated by reference into Part III Items 10, 11, 12, 13 and 14 of this Form 10-K as specified in those Items and will be filed with the Securities and Exchange Commission within 120 days after December 31, 2020.

HORACE MANN EDUCATORS CORPORATIONFORM 10-K
YEAR ENDED DECEMBER 31, 2020INDEX
Part Item PageI 1. Business 1
Introduction 1Forward-looking Information 1Overview, History and Available Information 1Corporate Strategy 2Human Capital Resources 4Reporting Segments 52020 Geographic Composition of Business 13Competition 14Investments 14Cash Flow 16Regulation 17Enterprise Risk Management 18
1A. Risk Factors 191B. Unresolved Staff Comments 322. Properties 323. Legal Proceedings 324. Mine Safety Disclosures 32
II 5. Market for Registrant's Common Equity, Related Stockholder Mattersand Issuer Purchases of Equity Securities 33
6. Selected Financial Data 367. Management's Discussion and Analysis of Financial Condition and Results of Operations 37
Forward-looking Information 37Introduction 37Consolidated Financial Highlights 39Consolidated Results of Operations 39Outlook for 2021 42Critical Accounting Estimates 43Results of Operations by Segment for the Three Years Ended December 31, 2020 49Investment Results 58Liquidity and Financial Resources 62Future Adoption of New Accounting Standards 68Effects of Inflation and Changes in Interest Rates 69
7A. Quantitative and Qualitative Disclosures about Market Risk 698. Financial Statements and Supplementary Data 719. Changes in and Disagreements with Accountants on Accounting and Financial Disclosure 1389A. Controls and Procedures 1389B. Other Information 140
III 10. Directors, Executive Officers and Corporate Governance 14111. Executive Compensation 14112. Security Ownership of Certain Beneficial Owners and Management
and Related Shareholder Matters 14113. Certain Relationships and Related Transactions and Director Independence 14114. Principal Accountant Fees and Services 141
IV 15. Exhibits and Financial Statement Schedules 14216. Form 10-K Summary 153Signatures 154

PART I
ITEM 1. I Business
Introduction
Measures within this Annual Report on Form 10-K that are not based on accounting principles generally accepted in the United States of America (non-GAAP) are marked with an asterisk (*) the first time they are presented within Part I of this report. An explanation of these measures is contained in the Glossary of Selected Terms included as Exhibit 99.1 to this Annual Report on Form 10-K and are reconciled to the most directly comparable measures prepared in accordance with accounting principles generally accepted in the United States of America (GAAP) in the Appendix to the Company's Fourth Quarter 2020 Investor Supplement.
Forward-looking Information
Horace Mann Educators Corporation (referred to in this report as "we", "our", "us", the "Company", "Horace Mann" or "HMEC") is an insurance holding company. Our actual results could differ materially from those projected in forward-looking statements. Additional information concerning factors that could cause actual results to differ materially from those in forward-looking statements is contained in Part I - Item 1A and in Part II - Item 7 of this report.
Overview, History and Available Information
We are an insurance holding company incorporated in Delaware. Through our subsidiaries, we market and underwrite:
• personal lines of property and casualty insurance, primarily automobile and property coverages
• supplemental insurance products, including cancer, heart, hospital, supplemental disability and accident
• retirement products, primarily tax-qualified fixed and variable annuities
• life insurance, primarily whole life, term and indexed universal life (IUL)
We conduct and manage our business through a total of five reporting segments. The four operating segments, representing the major lines of insurance business, are: Property and Casualty, Supplemental, Retirement and Life. We do not allocate the impact of corporate-level transactions to the four operating segments, consistent with the basis for management's evaluation of the results of those segments, but classify those items in the fifth reporting segment, Corporate and Other.
Founded by Educators for Educators®, our business began in Springfield, Illinois in 1945 when two school teachers started selling automobile insurance to other teachers within Illinois. We expanded our business to other states and broadened our product line to include life insurance in 1949, 403(b) tax-qualified retirement annuities in 1961 and property insurance in 1965. On July 1, 2019, we added our newest segment - Supplemental - and increased our market share when we acquired all of the equity interests in NTA Life Enterprises, LLC (NTA).
2020 Insurance Written Premiums andContract Deposits* of $1.4 Billion
Property andCasualty46%
Supplemental10%Life
8%
Retirement36%
Horace Mann Educators Corporation Annual Report on Form 10-K 1

Our common stock has traded on the New York Stock Exchange (NYSE) under the symbol HMN since our initial public offering in November 1991.
Today, we market primarily to K-12 teachers, administrators and other employees of public schools and their families. Our more than one million customers typically have moderate annual incomes, with many belonging to two-income households. Their financial planning tends to focus on retirement, security, savings and primary insurance needs. We believe that we are the largest national multi-line insurance company focused on the nation's educators as its primary market.
We market primarily through a dedicated sales force of full-time Exclusive Agents supported by our Customer Contact Center. These agents sell our products and limited third-party vendor products made available through the Horace Mann General Agency. Some of these agents are former educators or individuals with close ties to the educational community who utilize their contacts within, and knowledge of, the target market.
While educators generally have more job security compared to other professions in light of the novel coronavirus pandemic (COVID-19), their workload has become more complex and more time-consuming. This is largely a product of changes in worksite, with almost all educators moving to a remote learning environment at the end of the 2019 - 2020 school year. Classroom models were varied going into the 2020 - 2021 school year. In a November 2020 Horace Mann survey, 41% of educators were working in-person, 27% were working remotely and 32% were working in a hybrid model with elements of both. More than 75% of educators said they were working more than the preceding year. Because of the disruptions due to the pandemic, Horace Mann accelerated improvements in capabilities that augment customers' virtual experiences with our products as well as provided additional support for educators.
Our insurance premiums and contract charges earned for the year ended December 31, 2020 were $930.7 million and insurance premiums written and contract deposits* for the year ended December 31, 2020 were $1.4 billion. Net income was $133.3 million. Our total assets were $13.5 billion at December 31, 2020. Total investments were $7.3 billion at December 31, 2020 and consisted primarily of investment grade fixed maturity securities.
Our annual reports on Form 10-K, quarterly reports on Form 10-Q, current reports on Form 8-K, proxy statements, and all amendments to those reports, are available free of charge through the Investors section of our website, www.horacemann.com, as soon as reasonably practicable after such reports are filed with or furnished to the Securities and Exchange Commission (SEC). The EDGAR filings of such reports are also available at the SEC's website, www.sec.gov.
Also available in the Investors section of our website are our corporate governance principles, code of conduct, code of ethics, and corporate social responsibility reports, as well as the charters of the HMEC Board of Directors (Board) Audit Committee, Compensation Committee, Executive Committee, Investment and Finance Committee, and Nominating and Governance Committee. Copies also may be obtained by writing to Investor Relations, Horace Mann Educators Corporation, 1 Horace Mann Plaza, Springfield, Illinois 62715-0001.
On June 10, 2020, our Chief Executive Officer (CEO) submitted the Annual Section 12(a) CEO Certification to the NYSE without any qualifications. We filed with the SEC, as exhibits to the Annual Report on Form 10-K for the year ended December 31, 2019, the CEO and Chief Financial Officer (CFO) certifications required under Section 302 of the Sarbanes-Oxley Act.
Corporate Strategy
Our vision is to be the company of choice to provide financial solutions for educators and others who serve their communities. We believe the unique value of Horace Mann is providing solutions tailored for educators at each stage of their lives, empowering them to achieve lifelong financial success.
Education Market
Today, we serve approximately 470,000 educator households (approximately 600,000 total households) in roughly half of the K-12 public school buildings in our market footprint in the United States of America (U.S.), with significant opportunity to grow in this niche market. The U.S. Department of Education estimates that there are approximately 6.5 million K-12 public school teachers, administrators and support staff nationwide, a number that is steadily growing. Adjacent markets such as private education staff may offer further opportunity
2 Annual Report on Form 10-K Horace Mann Educators Corporation

over time. In addition, approximately 20% of the households added from the NTA acquisition are other public sector employees, such as firefighters.
Because of the primary focus on this niche market, we have a largely homogeneous customer set with similar characteristics and preferred risk profiles. This allows for more precise underwriting processes and more targeted marketing operations, amplifying the benefit of successful approaches. In addition, we have taken steps to increase our value to administrators and business officials who make decisions on financial solution providers at the school district level.
Growth StrategyOver the past several years, we have established our solutions orientation for the education market through a focus on products, distribution and infrastructure (PDI):
• Products designed to meet educators’ needs and protect their unique risks;
• Knowledgeable, trusted distribution tailored to educator preferences; and,
• Modern, scalable infrastructure that is easy to do business with.
In addition, we completed three transactions in 2019 that supported the PDI strategy: acquiring NTA and Benefit Consultants Group, Inc. (BCG) as well as reinsuring a $2.9 billion block of legacy annuity business. The annuity reinsurance transaction reduced interest rate risk while releasing capital that was redeployed into higher-margin products through the acquisition of NTA.
As a result, we have become a larger, more diverse company that expects to continue our transformation by leveraging our market leadership to increase our share of the education market.
In 2020, the COVID-19 pandemic did not change this business strategy, but we accelerated efforts to better build and maintain educator customer relationships in an online environment and prepare for a post-pandemic environment.
Relevant ProductsAt the core of our value proposition is the commitment to providing relevant products and solutions to address the issues that educators face at each stage of their career and life. Our comprehensive suite of property and casualty and life and retirement products provide solutions tailored to meet the insurance and financial services needs of educators. Over the past few years, we have strengthened those offerings with the introduction of our Retirement Advantage® open architecture platform for 403(b)(7) and other defined contribution plans, modernized our traditional life insurance products, and made significant improvements in our automobile and property offerings.
We also offer other solutions relevant for educators. One example is Student Loan Solutions, relevant for most educators and particularly those new to the profession for whom student loan debt may preclude saving for retirement at the point when those savings would have the most time to grow and make a significant impact at retirement age. In 2020, Horace Mann expanded this successful program to offer complimentary online student loan management accounts for all educators nationwide. The program includes guidance on how to successfully qualify for federal student loan forgiveness available to educators.
Other solutions are valuable to educators across all career stages. Many educators are concerned about the rising out-of-pocket expenses stemming from unexpected medical events. Added via the NTA acquisition in 2019, supplemental insurance products, including cancer, heart, hospital, supplemental disability and accident coverages, offer a defined dollar benefit that can be used for medical or non-medical expenses of an accident or health emergency. This can help customers address unexpected issues without needing to draw down retirement or other savings.
Trusted DistributionWe aim to provide multiple complementary distribution channels to meet individual educator preferences. The largest component of this strategy is our local agency force, which builds strong relationships at the school and district level. Our more than 1,000 exclusive agents and licensed producers serve as partners to educational institutions, providing financial wellness workshops, consulting with educators and administrators, and supporting school events and activities. Our trusted adviser model builds particularly strong brand loyalty and
Horace Mann Educators Corporation Annual Report on Form 10-K 3

affinity. Additionally, we continue to test and develop other channels of communication and distribution to serve educators including web, social media, inside sales and direct marketing. This “omni-channel” approach strives to integrate with and leverage the strong foundation provided by the field agency force. The objective is to “meet the customer where they are” and make Horace Mann as easy to do business with as possible.
In the operating environment of 2020, with most schools across the country educating students remotely, we accelerated the integration of the agents who joined the company in the NTA transaction, who were primarily selling in a worksite model, under the Horace Mann umbrella. These agents can now market a variety of property and casualty and life and retirement products to their existing customers. In addition, we introduced a number of new virtual educator engagement events, including social media-based teacher appreciation campaigns, special back-to-school promotions to encourage digital engagement, and a weekly financial wellness webinar series.
Horace Mann also took steps to enhance its Section 125 Employer Services platform offering. School districts can use a Section 125 platform to provide many different types of benefits to all employees in their district, such as retirement savings, supplemental insurance products or pretax withholdings for medical premiums, unreimbursed medical expenses and dependent care expenses. Most of the school districts served by Horace Mann have not yet made our supplemental products available to educators using their Section 125 platform or do not have a Section 125 option. In 2020, we moved to a unified Section 125 enrollment technology platform for Horace Mann offerings and are migrating existing school districts to the new platform. As part of the migration process, we are making our supplemental products available.
To build brand awareness, engage with the educator community, and stay abreast of developments and challenges faced by educators, we partner with multiple national, state and local associations. Through strategic alliances with a diverse group of educator associations (e.g., the American Association of School Administrators, The School Superintendents Association and the Association of School Business Officials), we build relationships with administrators. Through partnerships with some state and local National Education Association (NEA) teacher associations and sponsoring the teacher of the year award with the NEA Foundation, we have the opportunity to build our brand awareness and discuss issues and challenges faced by individual educators.
To meet the preferences of customers who prefer "on demand" services, our direct sales team is available by phone or electronically to respond to questions or bind coverages. Customers can also secure automobile, property, supplemental and life quotes and coverage comparisons online.
Modern InfrastructureWe are implementing a multi-year effort to upgrade our infrastructure to provide an enhanced customer experience. One example is the Guidewire property and casualty platform, which increases customer convenience through improved digital capabilities, e-signatures, real-time policy issuance and changes, coverage comparison features and consolidated billing. The first phase of the Guidewire implementation focused on the claims system and was completed in 2017. It resulted in reduced cycle times and more insight into customer and loss trends. The second phase (which is focused on policy administration and billing) is currently underway with three states launched in 2020 and additional states planned for 2021 and beyond. Similar to the claims system implementation, it will offer substantial benefits in terms of data segmentation and analysis, digital capabilities and ease of use.
With the pandemic forcing most educators to work from home at least part time, we accelerated planned technology solutions, including video meetings software, enhanced e-signature capabilities, and dynamic online appointment setting tools. These upgrades made it easier for both agents and customers to conduct business online, including annual policy reviews where our agents address any new or additional coverage needs. These upgrades will serve us well in the future, allowing us to easily pivot between in-person and virtual customer engagement, depending on individual situations.
Human Capital Resources
Horace Mann's mission of helping educators achieve lifelong financial success resonates strongly with our 1,490 employees. Almost 90% of employees and agents said serving educators is an important reason why they work at Horace Mann in a 2019 survey. In interactions with customers, each other and all stakeholders, we aim to reflect the core values at the heart of who we are: compassionate, trustworthy, straightforward, approachable, respectful and knowledgeable.
4 Annual Report on Form 10-K Horace Mann Educators Corporation

We believe that an engaged employee base is critical to deliver on our commitment to educators and achieve our business objectives. Our strategy to attract and retain talented employees is based on offering a competitive Total Rewards package and incentivizing high performers. This includes an annual bonus program based on our performance for which all employees are eligible.
During 2020, we adjusted our practices and processes to best support employees in a pandemic environment. In March, we rapidly transitioned the vast majority of our workforce to working from home and implemented strict safety protocols for those still working in offices. These include contactless temperature kiosks and daily health screenings at each location; mask requirements; and encouraging social distancing through signage and capacity limits.
At Horace Mann, we have long strived to foster an inclusive culture in which individual differences are recognized, respected and appreciated. In 2020, we established an employee Diversity, Equity and Inclusion (DEI) Council to help guide our initiatives and identify areas for improvement. In addition, we began a roll out of refreshed unconscious bias training to all our leaders, starting with the Board, senior staff and DEI Council members. For the third year in a row, Horace Mann was named to the Bloomberg Gender-Equality Index, which recognizes corporate commitment to transparency in gender reporting and advancing women’s equality.
We have no collective bargaining agreements with any employees.
Reporting Segments
We conduct and manage our business through five reporting segments: Property and Casualty, Supplemental, Retirement, Life and Corporate and Other.
These segments are defined based on the way management organizes the segments for making operating decisions and assessing performance. Management maintains discrete financial information for these segments to evaluate performance and allocate resources.
The calculations of segment data are described in more detail in Part II - Item 8, Note 18 of the Consolidated Financial Statements in this report. Additionally, the business operations of each segment are explained in this section. The financial performance of each segment is discussed in Part II - Item 7 of this report.
Property and Casualty
Our primary property and casualty insurance products include private passenger automobile insurance and residential home insurance.
We offer standard automobile coverages, including liability, collision and comprehensive. Property coverage includes both homeowners and renters policies. For both automobile and property coverage, we offer educators a discounted rate and the Educator Advantage® package of features. This includes value-added benefits specifically for educators, such as liability coverage for transporting students in an insured vehicle and reimbursement for stolen school fundraising items.
2020 Property and CasualtyEarned Premiums of $650 Million
Automobile66%
Property andother liability34%
398,498 automobile risks in force and184,286 property risks in force at December 31, 2020.
Horace Mann Educators Corporation Annual Report on Form 10-K 5

We have programs in a majority of states to provide higher-risk automobile and property coverages. We also have a number of other insurance coverages with third-party vendors that underwrite and bear the risk of such insurance. We receive commissions on these risks.
Similarly, we have increased our offering of third-party vendor products in many areas to meet additional educator needs such as coverage for small business owners or classic/collector automobiles.
Catastrophe Losses (Pretax) (1)
The number of catastrophe events and the level of catastrophe losses can fluctuate significantly from year to year. Our catastrophe losses for the last five years are shown in the following table ($ in millions).
Year Month Event Description States/Region Total
2020 $ 84.4
August Derecho IA, IL, IN, KS, MI, MN, MO, NE, OH, SD, WI 6.5
August Hurricane Laura AR, LA, MS, TN, TX 9.5
October Hurricane Delta AL, AR, GA, LA, MS, NC, SC, TX 3.3
October Hurricane Zeta AL, GA, LA, MS, NC, SC 2.7
Other single events less than $5.0 million 62.4
2019 $ 52.0
May Wind and Hail CO, IA, IL, IN, KS, MO, NE, OH, OK, PA, WY 5.5
Other single events less than $5.0 million 46.5
2018 $ 114.1
June Wind and Hail CO, UT 8.2
July Carr Fire CA 5.9
September Hurricane Florence Southeast and Mid-Atlantic 11.4
October Hurricane Michael Southeastern U.S. 4.5
November Camp Fire (2) CA 31.2
Other single events less than $5.0 million 52.9
2017 $ 61.8
May Wind, Hail, Tornado CO 10.0
June Wind and Hail MN (primarily) 10.0
August Hurricane Harvey Southeastern U.S. 4.8
August Hurricane Irma Eastern U.S. 3.0
Other single events less than $5.0 million 34.0
2016 $ 60.0
April Wind and Hail FL, TX 9.3
September Hurricane Matthew Southeastern U.S. 10.0
Other single events less than $5.0 million 40.7
(1) Net of reinsurance and before income tax benefits. Includes allocated loss adjustment expenses.(2) As recognized in 2018 and excludes subrogation recoveries of $4.8 million pretax received in 2020.
6 Annual Report on Form 10-K Horace Mann Educators Corporation

Fluctuations in catastrophe losses impact a property and casualty insurance company's claims and claim adjustment expenses incurred and paid.
Claims and Claim Expenses Incurred (1)(2), 2018 - 2020 ($ in millions)
$547$547
$476$476
$431$431
$440
$424
$347
$107
$52
$84
Non-catastrophe
Catastrophe
2018
2019
2020
(1) Claims and claim expenses incurred include the impact of prior years' reserve development as quantified in Property and Casualty reserves. Catastrophe totals are net of reinsurance and before income tax benefits.
(2) Excludes 2018 reinsurance reinstatement premiums.
Property and Casualty ReservesProperty and Casualty unpaid claims and claim expenses (loss reserves) represent management's estimate of ultimate unpaid costs of losses and settlement expenses for reported claims and claims that have been incurred but not yet reported (IBNR). We calculate and record a single best estimate of the reserve as of each reporting date in conformity with generally accepted actuarial standards. For additional information regarding the process used to estimate Property and Casualty reserves and the risk factors involved, as well as a summary reconciliation of the beginning and ending Property and Casualty insurance claims and claim expense reserves and prior years' reserve development recorded in each of the three years ended December 31, 2020, see Part II - Item 8, Note 7 of the Consolidated Financial Statements, and Part II - Item 7, Critical Accounting Estimates and Results of Operations for the Property and Casualty Segment for the Three Years Ended December 31, 2020 of this report.
All of our reserves for Property and Casualty unpaid claims and claim expenses are carried at the full value of estimated liabilities and are not discounted for interest expected to be earned on the reserves. Due to the nature of our personal lines business, we have no exposure to losses related to claims for toxic waste cleanup, other environmental remediation or asbestos-related illnesses other than claims under property insurance policies for environmental related items such as mold.
Property and Casualty ReinsuranceAll reinsurance is obtained through contracts which generally are entered into for each calendar year. Although reinsurance does not legally discharge us from primary liability for the full amount of our risks, it does allow for recovery from assuming reinsurers to the extent of the reinsurance ceded. Past due reinsurance recoverables as of December 31, 2020 were not material.
We maintain catastrophe excess of loss reinsurance coverage. For 2020, our catastrophe excess of loss reinsurance coverage consisted of one contract in addition to a minimal amount of coverage by the Florida Hurricane Catastrophe Fund. The catastrophe excess of loss reinsurance contract provided 95% coverage for catastrophe losses above a $25.0 million retention per occurrence up to $175.0 million per occurrence. This contract consisted of three layers, each of which provided for one mandatory reinstatement. The layers were $25.0 million excess of $25.0 million, $40.0 million excess of $50.0 million and $85.0 million excess of $90.0 million. Our 2021 catastrophe excess of loss reinsurance coverage is unchanged from 2020.
Horace Mann Educators Corporation Annual Report on Form 10-K 7

We have not joined the California Earthquake Authority (CEA). Our exposure to losses from earthquakes is managed through our underwriting standards, our earthquake policy coverage limits and deductible levels, and the geographic distribution of our business, as well as our reinsurance program. After reviewing the exposure to earthquake losses from our own risks and from what it would be with participation in the CEA, including estimated start-up and ongoing costs related to CEA participation, we believe it is in our best economic interest to offer earthquake coverage directly to our property policyholders.
For liability coverages, in 2020 we reinsured each loss above a retention of $1.0 million up to $5.0 million per occurrence and $20.0 million in a clash event. A clash cover is a reinsurance casualty excess contract requiring two or more casualty coverages or risks issued by us to be involved in the same loss occurrence for coverage to apply. Our 2021 liability contract provides 85% coverage for losses of $1.0 million up to $5.0 million.
We market personal lines excess liability risks. The limits of these risks are $1.0 million to $5.0 million in excess of $0.5 million of underlying automobile and homeowners liability coverage. We reinsure these risks on a quota share basis with General Reinsurance Corporation who assumes 95% of losses, including allocated loss adjustment expenses and premiums for all states except Massachusetts. For business written in Massachusetts, the quota share portion is 75%.
For automobile insurance sold in Michigan, Personal Injury Protection (PIP) unlimited coverage is offered in compliance with Michigan state law. For these risks with unlimited coverage, we participate in the Michigan Catastrophic Claims Association (MCCA). For risks issued in 2020, MCCA reimburses PIP losses including allocated loss adjustment expenses in excess of $0.6 million.
For property coverages, in 2020 we reinsured each loss above a retention of $1.0 million up to $5.0 million per risk, including catastrophe losses. Also, we could submit to the reinsurers two per risk losses from the same occurrence for a total of $8.0 million of property recovery in any one event. Our 2021 property contract provides 85% coverage for losses of $1.0 million up to $5.0 million.
The following table identifies our most significant reinsurers under the catastrophe first event excess of loss reinsurance program, their percentage participation in this program and their ratings by A.M. Best Company (A.M. Best) and Standard & Poor's Global Inc. (S&P) as of January 1, 2021. No other single reinsurer's percentage participation in 2021 or 2020 exceeds 5%. We monitor reinsurers' financial strength by reviewing A.M. Best and S&P ratings.
Property Catastrophe First Event Excess of Loss Reinsurance Participants In Excess of 5%
A.M. Best
RatingS&P
Rating Reinsurer Parent 2021 2020
A A+ Lloyd's of London Syndicates 19.4 % 21.5 %
A+ AA- Swiss Re Underwriters Agency, Inc. Swiss Re Ltd. 9.6 % 9.6 %
NR AA- R+V Versicherung AG DZ BANK AG 8.7 % 8.7 %
A+ AA- SCOR Global P&C SE SCOR SE 6.7 % 6.7 %
NR - Not rated.
8 Annual Report on Form 10-K Horace Mann Educators Corporation

Supplemental
We entered the supplemental market in July 2019 when we acquired NTA. Our supplemental insurance products include cancer, heart, hospital, supplemental disability and accident. A typical supplemental policy offers "HIPAA Excepted" benefits with simplified issuance. Our supplemental products are limited benefit products that offer defined benefit amounts paid directly to the insured, and are payable in addition to any other insurance coverages. An insured can use the supplemental payments to cover medical or non-medical costs.
Supplemental products continue to gain popularity in the changing healthcare landscape with higher deductible health care plans and expanded voluntary offerings along with an increasing focus on health and wellness. Our supplemental products are well designed, offering indemnity benefits only rather than reimbursement of actual costs. The benefit risk is well controlled with no coverage for pre-existing conditions and specified benefit maximums per occurrence or time period. Diagnosis or treatment is required for benefit payment.
Our supplemental disability products have elimination and short-term benefit periods. Sound underwriting techniques and significant underwriting expertise help ensure loss experience is commensurate with pricing expectations.
2020 Supplemental EarnedPremiums of $131 Million
Cancer32%
Heart24%
Accident16%
Supplementaldisability24%
Other4%
287,079 total Supplemental policies in force at December 31, 2020.
Supplemental ReservesSupplemental policy reserves represent our best estimate of the present value of future ultimate benefits, net of future premiums, to be provided for cancer, heart, supplemental disability and accident claims. Unpaid claims and claim expenses provide provisions for claims reported to us plus an estimated accrual for IBNR claims.
Supplemental ReinsuranceWe retain all of the risk on our supplemental health product lines, including accidental death risk embedded within certain products. However, our other accidental death and dismemberment risks issued through all other policies and riders are ceded 100%. The maximum life insurance risk retained on any individual life by our Supplemental segment is $100,000. The excess risk on the life insurance products issued by our Supplemental segment is ceded to and reinsured by a third party that is rated A (Excellent) by A.M. Best.
Retirement
Our Retirement segment primarily markets 403(b) tax-qualified fixed, fixed indexed and variable annuities; the Horace Mann Retirement Advantage® open architecture platform for 403(b)(7) and other defined contribution plans; and other retirement products to educators. Educators in our target market continue to benefit from the provisions of Section 403(b) of the Internal Revenue Code (Code) which allows public school employees and employees of other tax-exempt organizations, such as not-for-profit private schools, to utilize pretax income to make periodic contributions to a qualified retirement plan (also see Regulation — Regulation at Federal Level).
Horace Mann Educators Corporation Annual Report on Form 10-K 9

We entered the educator retirement annuity market in 1961 and are one of the largest participants in the K-12 educator portion of the 403(b) tax-qualified annuity market, measured by 403(b) net written premium on a statutory accounting basis. Our 403(b) tax-qualified annuities are voluntarily purchased by individuals employed by public school systems or other tax-exempt organizations through employee benefit plans of those entities.
In 2020, 49.2% of annuity contract deposits* were for 403(b) tax-qualified annuities. At year-end 2020, 62.2% of accumulated annuity value on deposit were 403(b) tax-qualified. To further assist registered representatives in delivering our value proposition, we have entered into third-party vendor agreements to market 529 college savings programs and provide brokerage clearing arrangements.
Assets under ManagementWe market both fixed and variable annuity contracts, primarily on a tax-qualified basis. Total accumulated fixed and variable annuity cash value on deposit at December 31, 2020 was $4.8 billion, net of reinsurance.
Fixed-only annuities provide a guarantee of principal and a guaranteed minimum rate of return. These contracts are backed by our general account investments. We bear the investment risk associated with the investments and may change the declared interest rate on these contracts subject to contract guarantees.
We also offer fixed indexed annuity (FIA) products with interest crediting strategies linked to the S&P 500 Index and the Dow Jones Industrial Average (DJIA).
Retirement Assets UnderManagement of $4.8 Billion
Fixed annuities46%
Fixedindexedannuities10%
Variableannuities44%
229,966 annuity contracts in force at December 31, 2020.
Variable annuities combine a fixed account option with equity-linked and bond-linked sub-account options. By utilizing tools that provide assistance in determining needs and making asset allocation decisions, contractholders are able to choose the investment mix that matches their personal risk tolerance and retirement goals. As of December 31, 2020, we had 120 variable sub-account options including funds managed by some of the larger participants in the mutual fund industry.
In 2017, we introduced the Personal Retirement Planner annuity series, which includes a flexible premium deferred variable annuity, a flexible premium deferred fixed indexed annuity, a single premium deferred fixed annuity and a single premium immediate annuity. Consistent across all of these products is the elimination of any surrender charges for early withdrawal.
Assets under AdministrationIn addition to annuities, we market the Horace Mann Retirement Advantage® open architecture platform for 403(b)(7) and other defined contribution plans. This platform combines a wide array of mutual funds integrated with a group unallocated fixed annuity stable value fund. This platform provides us with greater flexibility to offer customized 403(b)(7) and other qualified plan solutions to better meet the needs of school districts and other non-for-profit plan sponsors. After the acquisition of BCG, we migrated the administration of our Horace Mann Retirement Advantage® platform from a third-party vendor to the BCG platform. We offer our group unallocated fixed annuity, Horace Mann Stable Value Solution, as an option within a number of the 401(k) plans BCG administers. BCG had $1.5 billion of recordkeeping assets and $1.8 billion of advisory assets as of December 31, 2020.
Annuity ReinsuranceEffective April 1, 2019, we reinsured a block of approximately $2.9 billion of policy liabilities related to legacy individual annuities written in 2002 or earlier. The block includes $2.2 billion of fixed annuities with a minimum guaranteed crediting rate of 4.5% that represented approximately 50% of our fixed annuity assets under management at March 31, 2019, and $700 million of variable annuities. The reinsurance is structured as coinsurance for the fixed annuities and modified coinsurance for the variable annuities with RGA Reinsurance Company, a subsidiary of Reinsurance Group of America, Incorporated (RGA). We determined that the
10 Annual Report on Form 10-K Horace Mann Educators Corporation

reinsurance agreement did not expose RGA to a reasonable possibility of significant loss from insurance risk. Therefore, we recognize the reinsurance agreement using the deposit method of accounting.
Retirement Assets Under Administration, 2018 - 2020 ($ in billions)
$7.0$7.0
$11.3$11.3
$11.8$11.8
$6.7
$4.4
$4.8
$2.4
$2.4
$1.5
$1.5
$3.0
$3.1
Annuity AUM
Brokerage and advisory AUA
Recordkeeping AUA
Reinsured annuity block
2018
2019
2020
Life
We entered the individual life insurance business in 1949. We primarily offer traditional term and whole life insurance products as well as IUL products and, from time to time, revise products and product features or develop new products. Additionally, we offer educator rates for our customers.
During 2020, the average face amount of individual life insurance policies issued by us was approximately $192,000 and the average face amount of all life insurance policies in force at December 31, 2020 was approximately $98,000.
We offer a lineup of several product portfolios. Life by Design® is a portfolio of our manufactured and branded life insurance products that specifically address the financial planning needs of educators. The Life by Design® portfolio features individual whole life and individual term products, including 10, 15, 20 and 30-year level term policies. The Life by Design® policies have premiums that are guaranteed for the duration of the contract.
2020 Life Earned Premiums of$120 Million
Whole life,term andgroup; 54%
ExperienceLife and IUL;46%
151,886 whole life, term and group policies in force; 49,479 Experience Life and IUL policies in force at December 31, 2020.
Horace Mann Educators Corporation Annual Report on Form 10-K 11

We offer a combination product called Life Select® that mixes a base of either traditional whole life, 20-pay life or life paid-up at age 65 with a variety of term riders to allow for more flexibility in tailoring the coverage to customers' varying life insurance needs. Additional products include single premium whole life products and Cash Value Term — a term policy that builds cash value while providing the income protection of traditional level term life insurance.
We offer an IUL product with interest crediting strategies linked to the S&P 500 Index and the DJIA, offering a contingent return based on equity market performance. Along with expanded product offerings, new marketing support tools continue to be introduced to aid the agency force.
Life ReinsuranceThe maximum individual life insurance risk retained by our Life segment is $500,000 on any individual life, while either $100,000 or $125,000 is retained on each group life policy depending on the type of coverage. The excess of the amounts retained are reinsured with life reinsurers that are rated A (Excellent) or above by A.M. Best. We also maintain a life catastrophe reinsurance program. In 2020, we reinsured 100% of the catastrophe risk in excess of $1.0 million up to $35.0 million per occurrence, with one reinstatement. For 2021, our catastrophe risk coverage is unchanged. Our life catastrophe risk reinsurance program covers acts of terrorism and includes nuclear, biological and chemical explosions but excludes other acts of war.
Corporate and Other
Corporate and Other includes capital raising activities (including debt financing and related interest expense), net investment gains (losses), certain public company expenses and other corporate-level transactions including expenses related to business acquisition activity. We do not allocate the impact of corporate-level transactions to the operating segments, consistent with the basis for management's evaluation of the results of those segments.
12 Annual Report on Form 10-K Horace Mann Educators Corporation

2020 Geographic Composition of Business
Our business is geographically diversified. For the year ended December 31, 2020, based on direct premiums and contract deposits for all product lines, the top five states and their portion of total direct insurance premiums and contract deposits were California, 10.2%; Texas, 7.6%; North Carolina, 6.7%; Minnesota, 5.4%; and Pennsylvania, 5.1%.
$650.3 million in direct premiums, defined as earned premiums before reinsurance as determined under statutory accounting
principles. Our property and casualty subsidiaries are licensed to write business in 49 states and the District of Columbia.
$599.4 million in direct premiums and contract deposits, defined as collected premiums before reinsurance as determined under statutory accounting principles. Our principal life subsidiary is
licensed to write business in 49 states and the District of Columbia.
$131.3 million in insurance premiums and contract charges earned. Our principal supplemental insurance subsidiaries are licensed to write business in all 50 states,
the U.S. Virgin Islands and the District of Columbia.
Horace Mann Educators Corporation Annual Report on Form 10-K 13

Competition
We have over 75 years of experience serving the education market and are uniquely positioned to tailor financial solutions for educators at each stage of their lives, empowering them to achieve lifelong financial success. We believe this helps us succeed in a highly competitive environment. The insurance industry consists of a large number of insurance companies, some of which have substantially greater financial resources, widespread advertising campaigns, more diversified product lines, greater economies of scale and/or lower-cost marketing approaches compared to us. In our target market, we believe that our principal competitive advantages in the sale of property and casualty and supplemental insurance products are overall service, worksite sales and service, price, and name recognition. We believe that our principal competitive advantages in the sale of retirement products and life insurance are worksite sales and service, product features, perceived stability of the insurer, price, overall service and name recognition.
With our focus on the educator market, we can benefit from a homogeneous customer set that permits more precise underwriting processes and more targeted marketing operations, amplifying the benefit of successful approaches. We seek to provide:
• Products designed to meet educators’ needs and protect their unique risks;
• Knowledgeable, trusted distribution tailored to educator preferences; and
• Modern, scalable infrastructure that is easy to do business with.
Competition in this market for personal protection products is from a number of national providers of personal automobile, property, supplemental and life insurance including State Farm, Allstate, Farmers, Liberty Mutual, Aflac, Unum and Nationwide, as well as a number of regional companies. We also compete for automobile business with other companies such as GEICO, Progressive and USAA, many of which feature direct marketing distribution. A number of technology start-ups have also entered the market.
National providers of annuities and other financial service platforms that serve the retirement needs of educators and others that serve the community, include The Variable Annuity Life Insurance Company, a subsidiary of American International Group; AXA, Voya Financial, Inc., Life Insurance Company of the Southwest, a subsidiary of National Life Insurance Company; Security Benefit, and Teachers Insurance and Annuity Association – College Retirement Equities Fund. Select mutual fund families and financial planners also compete in this marketplace.
The market for tax-deferred retirement products in our target market has been impacted by the revised Code Section 403(b) regulations, which made the 403(b) market more comparable to the 401(k) market than it was in the past. This change has made the 403(b) market more attractive to some of the larger companies experienced in 401(k) plans, including both insurance and mutual fund companies, that had not previously been active competitors in this business.
Investments
Our investment strategy is primarily focused on generating income to support product liabilities and balances principal protection and risk. Our investment objectives are implemented through portfolios that primarily emphasize investment grade fixed maturity securities that are selected to match the anticipated duration of our liabilities. In addition to these securities, we also invest in limited partnership interests, commercial mortgage loan funds and equity securities to help improve overall returns.
We have separate investment strategies and guidelines for our Property and Casualty, Supplemental, Retirement and Life portfolios, which recognize different characteristics of the associated insurance liabilities, as well as different tax and regulatory environments. We manage interest rate exposure for our portfolios through asset/liability management techniques that attempt to coordinate the duration of the assets with the duration of the insurance policy liabilities. Duration of assets and liabilities will generally differ only because of opportunities to increase yields or because policy values are not interest rate sensitive, as is the case in Property and Casualty and Supplemental.
The investments of each insurance subsidiary must comply with the insurance laws of such insurance subsidiary's domiciliary state. These laws prescribe the type and amount of investments that may be purchased and held by insurance companies. In general, these laws permit investments, within specified limits and subject
14 Annual Report on Form 10-K Horace Mann Educators Corporation

to certain qualifications, in federal, state and municipal obligations, corporate bonds, mortgage-backed securities, other asset-backed securities, preferred stocks, common stocks, real estate mortgages, real estate, and alternative investments.
Investment Portfolio at December 31, 2020
($ in millions)% of Total
CarryingValue
Carrying Value
TotalLife and
Retirement Supplemental
Property and
Casualty (7)
AmortizedCost or Cost (8)
Publicly Traded Fixed Maturity Securities, EquitySecurities and Short-term Investments:
U.S. Government and agency obligations: (1)
Mortgage-backed securities 9.4 % $ 684.8 $ 547.7 $ 116.1 $ 21.0 $ 605.5
Other, including U.S. Treasury securities 6.0 433.2 404.3 16.9 12.0 395.0
Investment grade corporate and public utilitybonds 20.8 1,509.6 1,106.0 193.9 209.7 1,320.6
Non-investment grade corporate and public utility bonds (2) 2.2 160.1 121.6 10.0 28.5 153.4
Investment grade municipal bonds 23.6 1,716.3 1,204.3 115.2 396.8 1,508.2
Non-investment grade municipal bonds (2) 0.8 55.3 29.5 3.7 22.1 52.8
Investment grade other asset-backed securities (3) 15.9 1,155.0 886.2 95.7 173.1 1,154.8
Non-investment grade other asset-backed securities (2)(3) 0.3 24.7 20.6 0.3 3.8 26.0
Foreign government bonds 0.6 45.1 45.1 — — 40.1
Redeemable preferred stock 0.3 24.9 23.9 1.0 — 22.1
Equity securities:
Non-redeemable preferred stocks, investment grade 1.1 76.5 70.4 4.9 1.2 76.5
Non-redeemable preferred stocks, non-investment grade 0.2 14.2 12.2 1.0 1.0 14.2
Common stocks 0.1 7.6 — — 7.6 7.6
Closed-end fund 0.3 23.1 — — 23.1 23.1
Short-term investments (4) 2.0 141.8 125.8 6.4 9.6 141.8
Total publicly traded securities 83.6 6,072.2 4,597.6 565.1 909.5 5,541.7
Other Invested Assets:
Investment grade private placements 6.3 457.4 434.9 22.5 — 429.7
Non-investment grade private placements (2) 1.1 79.1 72.8 6.3 — 80.6
Mortgage loans (5) 0.2 18.1 18.1 — — 18.1
Policy loans (5) 2.1 150.1 149.3 0.8 — 150.1
Limited partnership interests 6.2 449.0 276.6 36.3 136.1 449.0
Other 0.5 36.3 33.4 1.8 1.1 36.3
Total other invested assets 16.4 1,190.0 985.1 67.7 137.2 1,163.8
Total investments (6) 100.0 % $ 7,262.2 $ 5,582.7 $ 632.8 $ 1,046.7 $ 6,705.5 (1) All investment grade that includes $386.5 million fair value of investments guaranteed by the full faith and credit of the U.S. Government and
$731.5 million fair value of federally sponsored agency securities which are not backed by the full faith and credit of the U.S. Government.(2) A non-investment grade rating is assigned to a security when it is acquired or when it is downgraded from investment grade, primarily on the
basis of the S&P rating for such security, or if there is no S&P rating, the Moody's Investors Service, Inc. (Moody's) or Fitch Ratings, Inc. (Fitch) rating for such security, or if there is no S&P, Moody's or Fitch rating, the National Association of Insurance Commissioners' (NAIC) rating for such security. The rating agencies monitor securities and their issuers regularly, and make changes to the ratings as necessary. We incorporate rating changes on a monthly basis.
(3) Includes commercial mortgage-backed securities, asset-backed securities, other mortgage-backed securities and collateralized loan obligations.
(4) Short-term investments mature within one year of being acquired and are carried at cost, which approximates fair value. Short-term investments of $141.8 million are all money market funds and not rated.
(5) Mortgage and policy loans are carried at amortized cost or unpaid principal balance.(6) Approximately 7.7% of our investment portfolio, having a carrying value of $560.5 million as of December 31, 2020, consisted of securities
with some form of credit support, such as insurance. Of the securities with credit support as of December 31, 2020, municipal bonds represented $396.0 million carrying value.
(7) Includes $1.0 million of equity securities and $2.8 million of short-term investments held in Corporate and Other.(8) The values of limited partnership interests are carried using the equity method of accounting which approximates fair value.
Horace Mann Educators Corporation Annual Report on Form 10-K 15

Fixed Maturity Securities
For reporting purposes, we have classified the entire portfolio of fixed maturity securities as "available for sale" and the portfolio is carried at fair value. The adjustment for net unrealized investment gains (losses) on fixed maturity securities available for sale is recognized as a separate component of accumulated other comprehensive income (AOCI) within shareholders' equity, net of applicable deferred taxes and the related impact from deferred policy acquisition costs (DAC) associated with annuity contracts and life insurance products with account values. Fixed maturity securities held for indefinite periods of time include securities that we intend to use as part of our asset/liability management strategy and that may be sold in response to changes in interest rates, resultant prepayment risk and other related factors, other than securities that are in an unrealized loss position for which we have the stated intent to hold until recovery.
Fixed Maturity Securities Portfolio at December 31, 2020
% of Fixed MaturitySecurities Portfolio
% of TotalInvestment Portfolio
Investment grade 91.4 % 79.9 %
Non-investment grade 8.6 % 7.5 %
Average credit quality A+ A+
Average option-adjusted duration 6.4 6.4
Percent maturing in next 5 years 32.4 % 28.3 %
Cash Flow
Information regarding our sources and uses of cash, including payment of principal and interest with respect to our indebtedness, and payment of dividends to our shareholders, is contained in Part II - Item 8, Note 13 of the Consolidated Financial Statements and in Part II - Item 7, Liquidity and Financial Resources — Cash Flow and — Capital Resources of this report.
The ability of our insurance subsidiaries to pay cash dividends to us is subject to state insurance department regulations which generally permit dividends to be paid for any 12 month period in amounts equal to the greater of (i) net income for the preceding calendar year or (ii) 10% of surplus, determined in conformity with statutory accounting principles, as of the preceding December 31st. Any dividend in excess of these levels requires the prior approval of the Director or Commissioner of the state insurance department of the state in which the dividend paying insurance subsidiary is domiciled. The maximum amount of dividends that may be paid in 2021 from all of our insurance subsidiaries without prior regulatory approval is $248.7 million, excluding the impact and timing of prior year dividends.
Notwithstanding the foregoing, if insurance regulators otherwise determine that payment of a dividend or any other payment to an affiliate would be detrimental to an insurance subsidiary's policyholders or creditors, because of the financial condition of the insurance subsidiary or otherwise, the regulators may block dividends or other payments to affiliates that would otherwise be permitted without prior approval.
16 Annual Report on Form 10-K Horace Mann Educators Corporation

Regulation
General Regulation at State Level
As an insurance holding company, we are subject to extensive regulation by the states in which our insurance subsidiaries are domiciled or transact business. Some regulations, such as those addressing unclaimed property, generally apply to all corporations. In addition, the laws of the various states establish regulatory agencies with broad administrative powers, which relate to a wide variety of matters, including granting and revoking licenses to transact business, regulating trade practices and rate setting, licensing agents, requiring statutory financial statements, monitoring insurer solvency and reserve adequacy, and prescribing the type and amount of investments permitted and the manner in which they may be sold. On an ongoing basis, various state legislators and insurance regulators examine the nature and scope of state insurance regulation.
In addition to individual state monitoring and regulation, state regulators develop coordinated regulatory policies through the NAIC. States have adopted NAIC risk-based capital guidelines to evaluate the adequacy of statutory capital and surplus in relation to an insurance company's risks. Based on current guidelines, the risk-based capital statutory requirements are not expected to have a negative regulatory impact on our insurance subsidiaries. At December 31, 2020 and 2019, statutory capital and surplus of each of our insurance subsidiaries were above required levels. States have also adopted the NAIC's U.S. Own Risk and Solvency Assessment which requires insurance companies to submit their own assessment of their current and future risks and provide a consolidated group-level perspective on risk and capital formulated through an internal risk self-assessment process.
Regulation of insurance continues to evolve. Some changes arise as a result of economic developments, such as changes in investment laws made to recognize new investment products or to respond to perceived investment risks, while others reflect concerns about consumer privacy, insurance availability, prices, allegations of unfair-discriminatory pricing, underwriting practices, or solvency concerns. Over the past several years, legislation, regulatory measures, and voter initiatives have been introduced, and in some cases adopted, which deal with use of non-public consumer information, cybersecurity, use of credit information in underwriting and rating, insurance rate development, rate of return limitations, and the ability of insurers to cancel or non-renew insurance policies.
Assessments Against Insurers and Mandatory Insurance Facilities
Under insurance insolvency or guaranty laws in most states in which we operate, insurers doing business therein can be assessed for policyholder losses related to insolvencies of other insurance companies, and many assessments paid by us pursuant to these laws may be used as credits for a portion of our premium taxes in certain states. Also, we are required to participate in various mandatory insurance facilities in proportion to the amount of our direct writings in the applicable state. For the three years ended December 31, 2020, the impacts of the above industry items were not material to our results of operations.
Regulation at Federal Level
Although the federal government generally does not directly regulate the insurance industry, federal initiatives often impact the insurance business. Current and proposed federal measures which may significantly affect insurance and retirement business include employee benefits regulation, standards applied to employer sponsored retirement plans, standards applied to broker-dealers and investment advisers, controls on the costs of medical care, medical entitlement programs such as Medicare, structure of retirement plans and accounts, changes to the insurance industry antitrust exemption, and minimum solvency requirements. Also, see Part I - Item 1A of this report. Other federal regulation such as the Patient Protection and Affordable Care Act, Fair Credit Reporting Act, Gramm-Leach-Bliley Act and USA PATRIOT Act, including its anti-money laundering regulations, also impact our business.
The variable annuities underwritten by Horace Mann Life Insurance Company (HMLIC) are regulated by the SEC. Horace Mann Investors, Inc., and BCG Securities, Inc., our broker-dealer and Registered Investment Adviser subsidiaries, are also regulated by the SEC, the Financial Industry Regulatory Authority, Inc., the Municipal Securities Rule-making Board and various state securities regulators.
Changes in federal income taxation of the build-up of cash value within a life insurance policy or an annuity contract could have a materially adverse impact on our ability to market and sell such products. Various
Horace Mann Educators Corporation Annual Report on Form 10-K 17

legislation to this effect has been proposed in the past, but has not been enacted. Although no such legislative proposals are known to exist at this time, such proposals may be made again in the future. Changes in other federal and state laws and regulations could also affect the relative tax and other advantages of our annuity and life products.
Financial Regulation Legislation
In addition, from time to time, the United States Congress and certain federal agencies investigate the current condition of the insurance industry to determine whether federal regulation is necessary. For example, the Dodd-Frank Wall Street Reform and Consumer Protection Act (Dodd-Frank) created the Federal Insurance Office (FIO) within the U.S. Department of the Treasury. FIO studies the current insurance regulatory system and is charged with monitoring and providing specific reports on various aspects of the insurance industry, including the collection of information about the insurance industry and monitoring the industry for systemic risk. However, FIO does not have general supervisory or regulatory authority over the business of insurance.
Enterprise Risk Management
As a multi-line insurance company, we are exposed to many risks which are a function of the products we write and the environments within which we operate. Since certain risks can be correlated, an event or a series of events can impact multiple areas of our business simultaneously and have a material effect on our results of operations, financial position and liquidity. These exposures require an entity-wide view of risk and an understanding of the potential impact on all aspects of our operations. It also requires us to manage our risk-taking to be within our appetite in a prudent and balanced effort to create and preserve value for all our stakeholders. Our Enterprise Risk Management (ERM) activities involve both the identification and assessment of a broad range of risks and the execution of coordinated strategies to effectively manage them. ERM also includes an evaluation of our risk capital needs, which takes into account regulatory requirements and credit rating considerations, in addition to economic and other factors. ERM is an integral part of our business operations. All risk owners across all functions, all corporate leaders and the Board are engaged in ERM. ERM involves risk-based analytics, as well as reporting and feedback throughout the enterprise in support of our long-term financial strategies and objectives.
We use property and casualty catastrophe models that are run by our reinsurance intermediary that provides the information to us. Life and retirement asset cash flows are projected using third-party software for certain security types. We also utilize proprietary third-party computer modeling processes to evaluate capital adequacy. These analytical techniques are an integral component of our ERM process and further support our long-term financial strategies and objectives.
Within Horace Mann, ERM is an ongoing assessment process used to identify and manage or mitigate risk, which will continue to influence our strategy and direction. The ERM Committee objectives include the following:
• Apply appropriate consideration to risk in strategic and operational decision-making
• Define and communicate risk appetite and risk management policies
• Approve and oversee processes aimed at identifying, evaluating, and managing risk
• Monitor and discuss emerging risks and risk management capabilities
The ERM Committee is composed of senior executives from across Horace Mann and has ultimate oversight over the risk management process, with each leader having ownership and accountability over certain identified key risks. In 2020, a Chief Risk Officer (CRO) was appointed and, in conjunction with the ERM Committee, is responsible for working with the business leaders to ensure that they are actively monitoring and managing their key risks. The CRO is also responsible for developing and monitoring key corporate level risks that encompass more than one business/division. There is ongoing and regular communication within the ERM Committee.
Members of the ERM Committee are responsible for updates to the Board and various Board committees on key risks and emerging risk topics. The interaction of all the various individuals, committees, reports, and processes results in an on-going process, which we believe puts us in the best position to effectively and efficiently manage risk.
18 Annual Report on Form 10-K Horace Mann Educators Corporation

Our ERM efforts build upon the foundation of an effective internal control environment. However, we can provide only reasonable, not absolute, assurance that these objectives will be met. Further, the design of any risk management or control system must reflect the fact that there are resource constraints, and the benefits must be considered relative to their costs. As a result, the possibility of material financial loss remains despite our significant and comprehensive ERM efforts. An investor should carefully consider the risks and all of the other information set forth in this Annual Report on Form 10-K, including disclosures in Part I - Item 1A—Risk Factors, Part II - Item 7A—Quantitative and Qualitative Disclosures About Market Risk, and Part II - Item 8—Financial Statements and Supplementary Data.
ITEM 1A. I Risk Factors
The following are certain risk factors that could affect our business, financial position and results of operations. The risks that we have highlighted in the following section of this report are not the only ones that we face.
Our business involves various risks and uncertainties which are based on the lines of business we write as well as more global risks associated with the general business and insurance industry environments.
Further, to the effects of COVID-19 and resulting disruptions on our business and operations as discussed in Item 7 of this report and in the risk factors below, additional or unforeseen effects from COVID-19 and the global economic climate may give rise to or amplify many of the risk factors discussed below.
Risks Related to Economic Conditions, Market Conditions and Investments
Volatile financial markets and adverse economic environments can affect financial market risk as well as our financial condition and results of operations.
Financial markets in the U.S. and elsewhere can experience extreme volatility and disruption for uncertain periods of time. During such times, stresses affecting the global banking system can lead to economic volatility, which can exert significant downward pressure on prices of equity securities and many other investment asset classes and result in severely constrained credit and capital markets, particularly for financial institutions, and an overall loss of investor confidence. Many states and local governments can also be impacted by adverse economic conditions, which could have an impact on both our niche market and our investment portfolio. Like other financial institutions that face significant financial market risk in their operations, we have been adversely affected by these conditions and could be adversely impacted by similar circumstances in the future. Our ability to access the capital markets to refinance outstanding indebtedness or raise capital could be impaired during significant financial market disruptions.
As discussed further in subsequent risk factors, in addition to the effects of financial markets volatility, a prolonged economic recession may have other adverse impacts on our financial condition and results of operations.
If our investment strategy is not successful, we could suffer unexpected losses.
The success of our investment strategy is crucial to the success of our business. Specifically, our fixed maturity securities portfolio is subject to a number of risks including:
• interest rate risk, which is the risk that interest rates will decline and funds reinvested will earn less than expected;
• market value risk, which is the risk that invested assets will decrease in value due to changes in yields realized on the assets and prevailing market yields for similar assets, an unfavorable change in the liquidity of the asset or an unfavorable change in the financial prospects or a downgrade in the credit rating of the issuer of the asset;
• credit risk, which is the risk that the value of certain investments become impaired due to deterioration in the financial condition of one or more issuers of those instruments or the deterioration in performance or credit quality of the underlying collateral of certain structured securities and, ultimately, the risk of permanent loss in the event of default by an issuer or underlying credit;
Horace Mann Educators Corporation Annual Report on Form 10-K 19
• market fundamentals risk, which is the risk that there are changes in the market that can have an unfavorable impact on securities valuation such as availability of credit in the capital markets, re-pricing of credit risk, reduced market liquidity due to broker-dealers' unwillingness to hold inventory, and increased market volatility;
• concentration risk, which is the risk that the portfolio may be too heavily concentrated in the securities of one or more issuers, sectors or industries, which could result in a significant decrease in the value of the portfolio in the event of deterioration in the financial condition of those issuers or the market value of their securities;
• liquidity risk, which is the risk that liabilities are surrendered or mature sooner than anticipated requiring the sale of assets at an undesirable time to provide for policyholder surrenders, withdrawals or claims; and,
• regulatory risk, which is the risk that regulatory bodies or governments, in the U.S. or in other countries, may make substantial investments or take significant ownership positions in, or ultimately nationalize, financial institutions or other issuers of securities held in our investment portfolio, which could adversely impact the seniority or contractual terms of the securities. Regulatory risk could also come from changes in tax laws or bankruptcy laws that could adversely impact the valuation and/or after tax yields of certain invested assets.
Although our defined benefit pension plan has been frozen since 2002, declining financial markets could also cause, and in the past have caused, the value of the investments in this plan to decrease, resulting in additional pension expense, a reduction in other comprehensive income and an increase in required contributions to this plan, which could have an adverse effect on our financial condition and results of operations.
The determination of fair value of our fixed maturity securities portfolio includes methodologies, estimations and assumptions that are subject to differing interpretations and could result in changes to investment valuations that may materially affect our financial condition and results of operations.
The determination of fair value is made at a specific point in time, based on available market information and judgments about financial instruments, including estimates of the timing and amounts of expected future cash flows and the credit standing of the issuer or counterparty. The use of different methodologies and assumptions may have a material effect on the estimated fair value amounts. During periods of market disruption, including periods of rapidly widening credit spreads or illiquidity, it may be difficult to value certain securities if trading becomes less frequent and/or market data becomes less observable. There may be certain asset classes that were in active markets with significant observable data that become illiquid due to the financial environment. In such cases, fair value determination may require more subjectivity and management judgment and those fair values may differ materially from the value at which the investments could ultimately be sold. Further, rapidly changing and unprecedented credit and equity market conditions could materially impact the valuation of securities and the period-to-period changes in fair value could vary significantly. The difference between fair value and amortized cost, net of applicable deferred income taxes and the related impact on DAC associated with annuity contracts and life insurance products with account values is reflected as a component of AOCI within shareholders' equity. Decreases in the fair value of investments could have a material adverse effect on our financial condition and results of operations.
Equity method adjustments on certain investments in limited partnership interests as well as fair value accounting for equity securities and derivatives may reduce profitability and/or cause volatility in our results of operations.
We invest in limited partnership interests, which are accounted for using the equity method of accounting. This means that our proportionate share of the changes in fair value of the underlying net asset values are reported in net investment income in the Consolidated Statements of Operations. As a result, the amount of net investment income recognized from these investments can vary substantially from period to period. Equity and credit market volatility may reduce net investment income from these types of investments and negatively impact the results of operations. Changes in fair value from applying fair value accounting to equity securities, which are reported in net investment gains (losses) in the Consolidated Statements of Operations, may cause volatility in our results of operations.
20 Annual Report on Form 10-K Horace Mann Educators Corporation
The application of fair value accounting for derivatives and embedded derivatives in FIA and IUL products may cause volatility in our results of operations.
Risks Related to Property and Casualty Segment
Catastrophe events, as well as significant weather events not designated as catastrophes, can have a material adverse affect on our financial condition and results of operations.
Underwriting results of property and casualty insurers are subject to weather and other conditions prevailing in an accident year. While one year may be relatively free of major weather or other disasters — not all of which are designated by the insurance industry as a catastrophe, another year may have numerous such events causing results for such a year to be materially worse than for previous years.
Our Property and Casualty insurance subsidiaries have experienced, and we anticipate that in the future they will continue to experience, catastrophe losses. A catastrophe event, a series of multiple catastrophe events or a series of non-catastrophe severe weather events could have a material adverse effect on the financial condition and results of operations of our insurance subsidiaries.
Various events can cause catastrophes, including hurricanes, windstorms, hail, severe winter weather, wildfires, earthquakes, explosions and terrorism. The frequency and severity of these catastrophes are inherently unpredictable. The extent of losses from a catastrophe is a function of both the total amount of insured exposures in the area affected by the event and the severity of the event. Although catastrophes can cause losses in a variety of property and casualty lines, most of the catastrophe-related claims of our insurance subsidiaries are related to property coverages. Our ability to provide accurate estimates of ultimate catastrophe losses is based on several factors, including:
• the proximity of the catastrophe occurrence date to the date of our estimate;
• potential inflation of property repair costs in the affected area;
• the occurrence of multiple catastrophes in a geographic area over a relatively short period of time; and
• the outcome of litigation which may be filed against us by policyholders, state attorneys general and other parties relative to loss coverage disputes and loss settlement payments.
Based on 2020 direct premiums earned, 57.5% of the total annual premiums for our Property and Casualty business were for policies issued in the ten largest states in which the insurance subsidiaries write property and casualty coverage. Included in this top ten group are certain states which are considered to be more prone to catastrophe occurrences: California, Texas, North Carolina, Minnesota, South Carolina, Louisiana and Colorado.
Climate change may adversely affect our financial position, results of operations and cash flows.
Climate change presents risk to us and there are concerns that the increased frequency and severity of weather-related catastrophes and other losses is indicative of changing weather patterns, whether as a result of climate-warming trends (global climate change) caused by human activities or otherwise, which could cause such events to persist. Increased weather-related catastrophes could lead to higher overall losses, which we may not be able to recoup, particularly in a highly regulated and competitive environment, and higher reinsurance costs. Certain catastrophe models assume an increase in frequency and severity of certain weather or other events, which could result in a disproportionate impact on insurers with certain geographic concentrations of risk. This could also likely increase the risks of writing property insurance in coastal areas or areas susceptible to wildfires or flooding, particularly in jurisdictions that restrict pricing and underwriting flexibility. The threat of rising sea levels or other catastrophe losses as a result of global climate change may also cause property values in coastal or such other communities to decrease, reducing the total amount of insurance coverage that is required.
In addition, global climate change could have an impact on our fixed maturity security and limited partnership portfolios, resulting in realized and unrealized losses in future periods that could have a material adverse effect on our financial position, results of operations and cash flows. It is not possible to foresee which, if any, assets, industries or markets may be materially and adversely affected, nor is it possible to foresee the magnitude of such effect. Further, it is also possible that the legal, regulatory and social responses to climate change could have an adverse effect on our financial condition, results of operations and cash flows.
Horace Mann Educators Corporation Annual Report on Form 10-K 21

Our property and casualty loss reserves may not be adequate.
Our Property and Casualty insurance subsidiaries maintain loss reserves to provide for their estimated ultimate liability for losses and loss adjustment expenses with respect to reported and unreported claims incurred as of the end of each reporting date. If these loss reserves prove inadequate, a loss is recognized and measured by the amount of the shortfall and, as a result, the financial condition and results of operations of the insurance subsidiaries may be adversely affected, potentially affecting their ability to distribute cash to us.
Reserves do not represent an exact calculation of liability. Reserves represent estimates, generally involving actuarial projections at a given time, of what the insurance subsidiaries expect the ultimate settlement and adjustment of claims will cost, net of salvage and subrogation. Estimates are based on assessments of known facts and circumstances, assumptions related to the ultimate cost to settle such claims, estimates of future trends in claims severity and frequency, changing judicial theories of liability, and other factors. These variables are affected by both internal and external events, including changes in claims handling procedures, economic inflation, unpredictability of court decisions, plaintiffs' expanded theories of liability, risks inherent in major litigation and legislative changes. Many of these items are not directly quantifiable, particularly on a prospective basis. Significant reporting lags may exist between the occurrence of an insured event and the time it is actually reported. Our insurance subsidiaries adjust their reserve estimates regularly as experience develops and further claims are reported and settled.
Due to the inherent uncertainty in estimating reserves for losses and loss adjustment expenses, we cannot be certain that the ultimate liability will not exceed amounts reserved, with a resulting adverse effect on our financial condition and results of operations.
Risks Related to Supplemental Segment
Actual experience may differ from actuarial assumptions, which could adversely affect our results of operations and financial condition.
Historical results may not be indicative of future performance due to, among other things, changes in our mix of business, regulatory actions or changes in legal doctrine impacting our products or lines of business, or any number of economic cyclical effects. Reserves do not represent an exact calculation of future benefit liabilities but are instead actuarial and statistical-based estimates. Actual experience may differ from our reserve assumptions. There are no assurances that reserves will be sufficient to fund our future liabilities in all scenarios. Future loss development may require reserves to be increased, which could adversely affect earnings in current and future periods. Adjustments to reserve amounts may be required in the event of changes from the assumptions regarding future morbidity, mortality, persistency, and interest rates used in calculating the reserve amounts, which could have a material adverse affect on our financial condition and results of operations.
Risks Related to Life and Retirement Segments
A sustained period of low interest rates or interest rate fluctuations could negatively affect net interest margin derived from the difference between interest earned on investments and interest paid under fixed annuity and life insurance products with account values.
Significant changes in interest rates expose us to the risk of not earning the appropriate level of income or experiencing losses based on the differences between the interest earned on investments and the credited interest paid on outstanding fixed annuity and life insurance products with account values. Significant changes in interest rates may affect:
• the ability to maintain appropriate interest rate spreads over the rates guaranteed in fixed annuity and life products with account values;
• the book yield of the investment portfolio; and
• the net unrealized investment gains (losses) in the portfolio and the related after tax effect on shareholders' equity and total capital.
Both rising and declining interest rates can negatively affect the income derived from interest rate spreads on annuity and life insurance products with account values. During periods of falling interest rates or a sustained
22 Annual Report on Form 10-K Horace Mann Educators Corporation

period of low interest rates, investment earnings will be lower because new investments in fixed maturity securities likely will bear lower interest rates. We may not be able to fully offset the decline in investment earnings with lower crediting rates on fixed annuity products, particularly in a multi-year period of low interest rates. As of the time of issuance of this Annual Report on Form 10-K, yields on new investments remain at historically low levels. If interest rates do remain low over an extended period of time, it could pressure investment income by having to invest insurance cash flows and reinvest the cash flows from the investment portfolio in lower yielding securities.
During periods of rising interest rates, there may be competitive pressure to increase the crediting rates on fixed annuity products. We may not, however, immediately have the ability to acquire investments with interest rates sufficient to offset an increase in crediting rates under fixed annuity products. Therefore, changes in interest rates could affect interest rate spreads.
Changes in interest rates may also affect business in other ways. For example, a rapidly changing interest rate environment may result in less competitive crediting rates on certain fixed rate products which could make those products less attractive, leading to lower sales and/or increases in the level of life insurance and fixed annuity product surrenders and withdrawals. New business volume also could be negatively impacted by product or agent compensation changes which we might make to mitigate the income effect of spread compression. Interest rate fluctuations that impact future profits may also impact DAC amortization.
The Retirement business may be, and in the past has been, adversely affected by volatile or declining financial market conditions.
Conditions in the U.S. and international financial markets affect the sale and profitability of retirement products. In general, sales of fee-based products decrease when financial markets are declining or experiencing a higher than normal level of volatility over an extended period of time. Therefore, weak and/or volatile financial market performance may adversely affect sales of fee-based products to potential customers, may cause current customers to withdraw or reduce the amounts invested in fee-based products and may reduce the market value of existing customers' investments in fee-based products, in turn reducing the amount of fee-based product revenues generated. In addition, some variable annuity products offer guaranteed minimum death benefit features, which provide for a benefit if the contractholder dies and the contract value is less than a specified amount. A decline in the financial markets could cause the contract value to fall below this specified amount, increasing exposure to losses from variable annuity products featuring guaranteed minimum death benefits. Declining or volatile financial markets that impact future profits may also impact DAC amortization.
Deviations from assumptions regarding future market appreciation, interest spreads, business persistency, mortality and morbidity used in calculating life and annuity reserves and DAC amortization could have a material adverse effect on our financial condition and results of operations.
The processes of calculating reserves and DAC amortization for the life and annuity businesses involve the use of a number of assumptions, including those related to market appreciation (the rate of growth in market value of the underlying variable annuity sub-accounts due to price appreciation), interest spreads (the interest rates expected to be received on investments less the rate of interest credited to contractholders), business persistency (how long a contract stays with us), mortality (the relative incidence of death over a given period of time) and morbidity (the relative incidence of disability resulting from disease or physical impairment). We periodically review the adequacy of these reserves and DAC recoverability on an aggregate basis and, if future experience is estimated to differ significantly from previous assumptions, adjustments to reserves and DAC amortization may be required that could have a material adverse effect on our financial condition and results of operations.
A reduction or elimination of the tax advantages of retirement and life products and/or a change in the tax benefits of various government-authorized retirement programs, such as 403(b) products and individual retirement accounts (IRAs), could make our products less attractive to clients and adversely affect our results of operations.
A significant part of our retirement business involves fixed and variable 403(b) tax-qualified products, which are purchased voluntarily by individuals employed by public school systems or other tax-exempt organizations. Our financial condition and results of operations could be adversely affected by changes in federal and state laws and regulations that affect the relative tax and other advantages of our life and retirement products to clients or
Horace Mann Educators Corporation Annual Report on Form 10-K 23

the tax benefits of programs utilized by our customers. As a result of persisting economic conditions, revenue challenges exist at federal, state and local government levels. These challenges could increase the risk of future adverse impacts on current tax-advantaged products or result in notable reforms to educator pension programs. Also, see Part I - Item 1, Regulation of this report.
Current federal income tax laws generally permit the tax-deferred accumulation of earnings on the premiums paid by holders of retirement and life insurance products. Taxes, if any, are generally payable on income attributable to a distribution under the contract for the year in which the distribution is made. From time to time, Congress has considered legislation that would reduce or eliminate the benefit of such deferral of taxation on the accretion of value within life insurance and non-qualified annuity contracts. Enactment of this legislation, or other tax reform efforts could result in fewer sales of life insurance and retirement products.
Strategic Risks
Lack of successful execution on acquisition integration strategies could result in impairment of goodwill and intangible assets that could adversely affect our results of operations.
We accounted for the NTA and BCG acquisitions using the acquisition method of accounting, which requires that the assets acquired and liabilities assumed be recognized on our consolidated balance sheet at their respective fair values as of the acquisition date, including recognition of intangible assets. Any excess of the purchase consideration over the fair value of the acquired net tangible and intangible assets is recognized as goodwill.
As of December 31, 2020, the Company's Consolidated Balance Sheet reflected goodwill of $24.1 million and intangible assets of $158.5 million recognized in connection with the NTA and BCG acquisitions (see Part II - Item 8, Note 6 of the Consolidated Financial Statements for more information). To the extent the acquisitions do not provide the modeled returns, the value of goodwill or intangible assets could become impaired and thus, we may be required to recognize material non-cash charges relating to such impairment, which could adversely affect our results of operations.
The personal lines insurance and retirement markets are highly competitive and our financial condition and results of operations may be adversely affected by competitive forces.
We operate in a highly competitive environment and compete with numerous insurance companies, as well as mutual fund families, independent agent companies and financial planners. In some instances and geographic locations, competitors have specifically targeted the educator marketplace with specialized products and programs. We compete in our target market with a number of national providers of personal automobile and property insurance and life insurance and retirement products.
The insurance industry consists of a large number of insurance companies, some of which have substantially greater financial resources, more diversified product lines, more sophisticated product pricing, greater economies of scale and/or lower-cost marketing approaches compared to us. In our target market, we believe that the principal competitive factors in the sale of property and casualty insurance products and supplemental insurance products are overall service, worksite sales and service, price, and name recognition. We believe that for our market, the principal competitive factors in the sale of retirement products and life insurance products are worksite sales and service, product features, perceived stability of the insurer, price, overall service and name recognition.
Particularly in the Property and Casualty business, our insurance subsidiaries have experienced pricing and profitability cycles. During these periods of intense competition, they may be unable to add policyholders and increase revenues without adversely impacting profit margins. With respect to these cycles, the factors having the greatest impact include significant and/or rapid changes in loss costs, including changes in loss frequency and/or severity, prior approval and restrictions in certain states for price increases, intense price competition, less restrictive underwriting standards, aggressive marketing, and increased advertising, which have resulted in higher industry-wide combined loss and expense ratios. During the current cycle, and potentially beyond, competition from direct writers and large, mass market carriers has been particularly aggressive, evidenced in part by their significant national advertising expenditures. In addition, advancements in vehicle technology and safety features, such as accident prevention technologies or the development of autonomous or partially autonomous vehicles — once widely available and utilized, as well as expanded availability of usage-based insurance, could materially alter the way that automobile insurance is marketed, priced and underwritten. The
24 Annual Report on Form 10-K Horace Mann Educators Corporation

inability of our insurance subsidiaries to effectively anticipate the impact of these issues on our business and compete successfully in the property and casualty business could adversely affect their financial condition and results of operations and the resulting ability to distribute cash to us.
In the Retirement business, there are several factors driving increased competition. First, the current IRS Section 403(b) regulations have made the 403(b) market similar to the 401(k) market. These changes have increased and could continue to increase the number of competitors in the 403(b) market, as it has become more attractive to some of the larger companies experienced in 401(k) plans, including both insurance and mutual fund companies, that had not previously been active competitors in this business. Further, while not yet widespread, there has been continued pressure in some states to adopt state-sponsored or mandated 403(b) plans with single-provider or limited-provider options; this pressure has come from competitor lobbying efforts and state legislature pension reform initiatives. The inability of our insurance subsidiaries to compete successfully in these circumstances could adversely affect their financial condition and results of operations and the resulting ability to distribute cash to us.
If we are not able to effectively develop and expand our marketing operations, including agents and other points of distribution, our financial condition and results of operations could be adversely affected.
Our agencies are owned primarily by non-employee, independent contractor Exclusive Distributors with most agencies operating in outside offices with licensed producers. The economic viability of each agency is directly dependent on the productivity of the agency and the success at penetrating, serving and cross-selling our educator market.
Our success in marketing and selling our products is largely dependent upon the efforts of our agent sales force and the success of their agency operations. As we expand our business, we may need to expand the number of agencies marketing our products. If we are unable to appoint additional agents, fail to retain high-producing agents, are unable to maintain the productivity of those agency operations or are unable to maintain market penetration in existing territories, sales of our products could likely decline and our financial condition and results of operations could be adversely affected.
If we are not able to maintain secure access to educators, our financial condition and results of operations could be adversely affected.
Our ability to successfully increase new business in the educator market is largely dependent on our ability to effectively access educators either in their school buildings or through other approaches. While this is especially true for the sale of 403(b) tax-qualified retirement products via payroll deduction, any significant decrease in access, either through fewer payroll slots, increased security measures, impacts of state or federal level pension reform initiatives, requirements of national and state Do Not Call registries, or for other reasons, could adversely affect the sale of all lines of business and require us to change our traditional approach to worksite marketing and promotion, as well as contact with potential customers. With the current IRS regulations regarding Section 403(b) arrangements, including retirement products, our ability to maintain and increase our share of the 403(b) market, and the access it gives for other product lines, will depend on our ability to successfully compete in this market. Some school districts and benefit consultants have placed emphasis on the relative financial strength ratings of competing companies, as well as low cost product and distribution approaches, which may put us at a competitive disadvantage relative to other more highly-rated insurance companies.
Our ability to maintain and obtain product and corporate endorsements from, and/or marketing agreements with, local, state and national education-related associations is important to our marketing strategy. In addition to teacher organizations, we have established relationships with various other educator, principal, school administrator and school business official groups. These contacts and endorsements help to establish our brand name and presence in the educational community and to enhance access to educators.
Operational Risks
A large-scale pandemic, the occurrence of terrorism or military actions may have an adverse effect on our business.
A large-scale pandemic, the occurrence of terrorism or military and other actions, may result in loss of life, property damage, and disruptions to commerce and reduced economic activity. Some of the assets in our
Horace Mann Educators Corporation Annual Report on Form 10-K 25

investment portfolio may be adversely affected by declines in the equity markets, changes in interest rates, reduced liquidity and economic activity caused by a large-scale pandemic. Additionally, a large-scale pandemic or terrorist act could have a material effect on sales, liquidity and operating results.
Further, the global pandemic caused by COVID-19 that was initially reported in December 2019 has developed into a worldwide crisis over subsequent months and is causing significant human suffering as well as widespread economic damage. The effects of the outbreak on the U.S. economy, our customers, our agents, our employees, our investments and our communities, as well as any preventative or protective actions that we, our employees and agency force, our third-party service providers and suppliers, or governments may take to mitigate the impact of COVID-19 could have an adverse effect on our ability to conduct business and on our financial condition and results of operations. Impacts to our business have been and could continue to be widespread and may result in the following:
• employees contracting COVID-19;
• reductions in our operating effectiveness as our employees work from home;
• sustained lack of access to schools and educators that could materially impact our sales and premium volumes;
• public school systems facing budget constraints due to the economic impacts of the pandemic that could result in educator layoffs;
• unprecedented volatility in financial markets that could materially affect our investment portfolio valuations and returns as well as our ability to generate targeted spreads on indexed products;
• regulatory mandates and/or legislative changes, including premium grace periods and premium credits;
• changes in frequency and/or severity of claims;
• increased credit risk;
• business disruption for insurance agents who market and sell our insurance products; and
• business disruptions to third parties at which we outsource certain business functions to or on which we rely for technology.
The full extent to which COVID-19 could affect the global economy, the financial markets and our business, our financial condition and our results of operations will depend on future developments and factors that cannot be predicted.
Data security breaches or denial of service on our websites could have an adverse effect on our business and reputation.
Unauthorized access to and unintentional dissemination of our confidential, highly-sensitive customer, employee or company data or other breaches of data security in our facilities, networks or databases, or those of our agents or third-party vendors - including information technology and software vendors, could result in loss or theft of assets or sensitive information, data corruption or operational disruption that may expose us to liability and/or regulatory action and may have an adverse impact on our customers, employees, investors, reputation and business. In addition, any compromise of the security of company data or prolonged denial of service on our websites could harm our business and reputation. Additionally, we recognize the increased external threats of data breaches in the marketplace resulting in non-public data of customers becoming increasingly available in the public domain.
Successful execution of our business growth strategy is dependent on effective implementation of new or enhanced technology systems and applications.
Our ability to effectively execute our business growth strategy and leverage potential economies of scale is dependent on our ability to provide the requisite technology components for that strategy. While we have effectively upgraded our infrastructure technologies with improvements in our data center, a new communications platform and enhancements to our disaster recovery capabilities, our ability to replace or supplement dated, monolithic legacy business systems — such as our Life, Retirement and Property and
26 Annual Report on Form 10-K Horace Mann Educators Corporation

Casualty policy administrative systems — with more flexible, maintainable, and customer accessible solutions will be necessary to achieve our plans. The inherent difficulty in replacing and/or modernizing these older technologies, coupled with our limited experience in these endeavors, presents an increased risk of failing to deliver these technology solutions in a cost effective and timely manner. Our scale will require us to develop innovative solutions to address these challenges, including consideration of "software as a service" arrangements and other third-party based information technology capabilities. More modern approaches to software development and utilization of third-party vendors can augment our internal capacity for these implementations, but may not adequately reduce the operational risks of timely and cost effective delivery.
Loss of key vendor relationships could affect our operations.
We increasingly rely on services and products provided by a number of vendors in the U.S. and abroad. These include, for example, vendors of computer hardware and software, including on-demand software, and vendors of services such as investment management advisement, information technology services — such as those associated with the Life, Retirement and Property and Casualty policy administrative systems — and delivery services for customer policy-level communications. In the event that one or more of our vendors suffers a bankruptcy or otherwise becomes unable to continue to provide products or services, we may suffer operational difficulties and financial losses.
Our ability to attract, develop, and retain talent to maintain appropriate staffing levels, and establish a successful work culture is critical to our success.
Competition from within the insurance industry and from other industries, including the technology sector, for qualified employees with highly specialized knowledge in areas such as underwriting, data and analytics, technology and e-commerce, has often been intense and we have experienced increased competition in hiring and retaining employees.
Factors that affect our ability to attract and retain such employees include:
• Compensation and benefits
• Training and re-skilling programs
• Reputation as a successful business with a culture of fair hiring, and of training and promoting qualified employees
• Recognize and respond to changing trends and other circumstances that affect employees
The unexpected loss of key personnel could have a material adverse impact on our business because of the loss of their skills, knowledge of our products and offerings and years of industry experience and, in some cases, the difficulty of promptly finding qualified replacement personnel.
Financial Strength, Credit and Counterparty Risks
Losses due to defaults by others could reduce our profitability or negatively affect the value of our investments.
Third-party debtors may not pay or perform their obligations. These parties may include the issuers whose securities we hold, customers, reinsurers, borrowers under mortgage loans, trading counterparties, derivative counterparties, clearing agents, exchanges, clearing houses and other financial intermediaries. These parties may default on their obligations to us due to bankruptcy, lack of liquidity, downturns in the economy or real estate values, operational failure or other reasons.
During or following an economic downturn, our municipal bond portfolio could be subject to a higher risk of default or impairment due to declining municipal tax bases and revenue. States are currently barred from seeking protection in federal bankruptcy court. However, federal legislation could possibly be enacted to allow states to declare bankruptcy in connection with deficit reductions or mounting unfunded pension liabilities, which could adversely impact the value of our municipal bond portfolio.
The default of a major market participant could disrupt the securities markets or clearance and settlement systems in the U.S. or abroad. A failure of a major market participant could cause some clearance and
Horace Mann Educators Corporation Annual Report on Form 10-K 27

settlement systems to assess members of that system, including our broker-dealer and Registered Investment Adviser regulatory entities, or could lead to a chain of defaults that could adversely affect us. A default of a major market participant could disrupt various markets, which could in turn cause market declines or volatility and negatively impact our financial condition and results of operations.
Uncollectible reinsurance, as well as reinsurance availability and pricing, can have a material adverse effect on our business volume and profitability.
Reinsurance is a contract by which one insurer, called a reinsurer, agrees to cover a portion of the losses incurred by a second insurer in the event a claim is made under a policy issued by the second insurer. Although a reinsurer is liable to our insurance subsidiaries according to the terms of the reinsurance policy, the insurance subsidiaries remain primarily liable as the direct insurers on all risks reinsured. As a result, reinsurance does not eliminate the obligation of our insurance subsidiaries to pay all claims, and each insurance subsidiary is subject to the risk that one or more of its reinsurers will be unable or unwilling to honor its obligations.
Although we limit participation in our reinsurance programs to reinsurers with high financial strength ratings and also limit the amount of coverage from each reinsurer, our insurance subsidiaries cannot guarantee that their reinsurers will pay in a timely fashion, if at all. Reinsurers may become financially unsound by the time that they are called upon to pay amounts due, which may not occur for many years.
Additionally, the availability and cost of reinsurance are subject to prevailing market conditions beyond our control. For example, significant losses from hurricanes or terrorist attacks, an increase in capital requirements, or a future lapse of the provisions of the Terrorism Risk Insurance Act could have a significant adverse effect on the reinsurance market.
If one of our insurance subsidiaries is unable to obtain adequate reinsurance at reasonable rates, that insurance subsidiary would have to increase its risk exposure and/or reduce the level of its underwriting commitments, which could have a material adverse effect upon the business volume and profitability of the subsidiary. Alternatively, the insurance subsidiary could elect to pay the higher than reasonable rates for reinsurance coverage, which could have a material adverse effect upon its profitability until policy premium rates could be raised, in some cases subject to approval by state regulators, to incorporate this additional cost.
We are subject to the credit risk of our counterparties, including reinsurers who reinsure business from our insurance companies.
Our insurance subsidiaries may cede certain risks to third-party insurance companies through reinsurance. HMLIC entered into a reinsurance agreement with RGA to effectuate the reinsurance of a block of in force fixed and variable annuities on a coinsurance and modified coinsurance basis. The variable portion of the reinsured annuities is reinsured on a modified coinsurance basis and assets supporting the variable account liabilities are still held in separate accounts. Because the reinsurance agreement covers a large volume of our in force annuity business, the transaction exposes us to a concentration of credit risk with respect to this counterparty. RGA's financial obligations for the general account liabilities of the reinsured annuity contracts are secured by its assets placed in a comfort trust for our sole use and benefit. Upon RGA's material breach of the reinsurance agreement, deterioration of its risk-based capital ratio to a certain level, or certain other events, we may recapture the reinsured business. However, in the event of RGA's insolvency, our right to use the assets in the trust account may be delayed. Also, if at the time of its insolvency the trust account is not funded at a level to fully discharge all its obligations, our claims to the extent not covered by the assets in the trust would be those of a general creditor.
Any downgrade in or adverse change in outlook for our claims-paying ratings, financial strength ratings or credit ratings could adversely affect our financial condition and results of operations.
Claims-paying ratings and financial strength ratings have become an increasingly important factor in establishing the competitive position of insurance companies. In the evolving 403(b) retirement market, school districts and benefit consultants have placed an emphasis on the relative financial strength ratings of competing companies. Each rating agency reviews its ratings periodically and from time to time may modify its rating criteria including, among other factors, its expectations regarding capital adequacy, profitability and revenue growth. A downgrade in the ratings or adverse change in the ratings outlook of any of our insurance subsidiaries by a major rating agency could result in substantial loss of business for that subsidiary if school districts, policyholders or independent agents move their business to other companies having higher claims-paying ratings and financial
28 Annual Report on Form 10-K Horace Mann Educators Corporation

strength ratings than we have. This loss of business could have a material adverse effect on the results of operations and financial condition of that subsidiary.
A downgrade of our debt rating also could adversely affect our cost and flexibility of borrowing, which could have an adverse effect on our liquidity, financial condition and results of operations.
An inability to access Federal Home Loan Bank (FHLB) funding could adversely affect our results of operations.
Any changes in requirements to retain membership in the FHLB, or changes in regulation, could impact our eligibility for continued FHLB membership or our FHLB funding capacity. Any event that adversely affects amounts received from FHLB could have an adverse effect on our results of operations. See Part II - Item 7, Financing Activities of this report for more information about FHLB activities.
Regulatory and Legal Risks
The results of the recent U.S. Presidential and Congressional elections may create significant changes in tax rates, laws or regulations which could adversely impact our financial results.
With the change in administration, there are initiatives at the federal level to reverse the corporate tax cuts in the favorable Tax Cuts and Jobs Act of 2017 (TCJA), increasing the federal corporate income tax from the current rate of 21%. Any future legislative action could increase our costs, the impact of which could be significant. We are unable to predict the outcome or effects of any of these potential actions or any other legislative or regulatory proposals as they relate to our businesses. For example, any proposals to make changes related to U.S. tax law, such as those involving a reduction or elimination of the tax advantages of retirement and life products as noted in Part I - Item 1A – Risk Factors, Risks Related to Life and Retirement Segments of this report, may have a material adverse effect on our future business, financial condition, results of operations, and growth prospects.
The insurance industry is highly regulated.
We are subject to extensive regulation and supervision in the jurisdictions in which we do business. Each jurisdiction has a unique and complex set of laws and regulations. Furthermore, certain federal laws impose additional requirements on businesses, including insurers. Regulation generally is designed to protect the interests of policyholders, as opposed to stockholders and non-policyholder creditors. Such regulations, among other things, impose restrictions on the amount and type of investments our insurance subsidiaries may hold. Certain states also regulate the rates insurers may charge for certain property and casualty products. Legislation and voter initiatives have expanded, in some instances, the states' regulation of rates and have increased data reporting requirements. Consumer-related pressures to roll back rates, even if not enacted by legislation or upheld upon judicial appeal, may affect our ability to obtain timely rate increases or operate at desired levels of profitability. Changes in insurance regulations, including those affecting the ability of our insurance subsidiaries to distribute cash to us and those affecting the ability of our insurance subsidiaries to write profitable property and casualty insurance policies in one or more states, may adversely affect the financial condition and results of operations of the insurance subsidiaries. In addition, consumer privacy requirements may increase our cost of processing business. Our ability to comply with laws and regulations, at a reasonable cost, and to obtain necessary regulatory action in a timely manner, is and will continue to be critical to our success.
The NAIC has adopted a system of assessing minimum capital adequacy that is applicable to our insurance subsidiaries. This system, known as risk-based capital, is used to identify companies that may merit further regulatory action by analyzing the adequacy of the insurer's surplus in relation to statutory requirements. Our insurance subsidiaries could be adversely affected by regulations that change statutory surplus and risk-based capital requirements. Insurance companies write business based, in part, upon guidelines including capital ratios considered by the NAIC and various rating agencies. Some of these ratios include risk-based capital ratios for property and casualty insurance companies, supplemental insurance companies and life insurance companies, as well as a ratio of premiums to surplus for property and casualty insurance companies. Risk-based capital ratios measure an insurer's capital adequacy and consider various risks such as underwriting, investment, credit, asset concentration and interest rate. If our insurance subsidiaries cannot maintain profitability in the future or if significant investment valuation losses are incurred, they may be required to draw on their surplus, thereby reducing capital adequacy, in order to pay dividends to us to enable us to meet our financial obligations. As their
Horace Mann Educators Corporation Annual Report on Form 10-K 29

surplus is reduced by the payment of dividends, continuing losses or both, our insurance subsidiaries' ability to write business and maintain acceptable financial strength ratings could also be reduced. This could have a material adverse effect upon the business volume and profitability of the insurance subsidiaries as well as result in increased regulatory scrutiny or action by state regulatory authorities.
Because state legislatures remain concerned about the availability and affordability of property and casualty insurance and the protection of policyholders, our insurance subsidiaries expect that they will continue to face efforts by those legislatures to expand regulations to address these concerns. Resulting new legislation could adversely affect the financial condition and results of operations of our insurance subsidiaries.
In the event of insolvency, liquidation or other reorganization of any of our insurance subsidiaries, our creditors and stockholders would have no right to proceed against any such insurance subsidiary or cause the liquidation or bankruptcy of any such insurance subsidiary under federal or state bankruptcy laws. The insurance laws of the domiciliary state would govern such proceedings and the relevant insurance commissioner would act as liquidator or rehabilitator for the insurance subsidiary. Creditors and policyholders of any such insurance subsidiary would be entitled to full payment from the assets of the insurance subsidiary before us, as a stockholder, would be entitled to receive any distribution.
The financial position of our insurance subsidiaries also may be affected by court decisions that expand insurance coverage beyond the intention of the insurer at the time it originally issued an insurance policy.
Dodd-Frank created FIO within the U.S. Department of the Treasury. FIO studies the current insurance regulatory system and is charged with monitoring and providing specific reports on various aspects of the insurance industry. However, FIO does not have general supervisory or regulatory authority over the business of insurance. FIO has suggested an expanded federal role in some circumstances. Additional regulations could adversely affect the efficiency and effectiveness of business processes, financial condition and results of operations of us, insurers of similar size and/or the insurance industry as a whole.
Regulatory initiatives, including the enactment of Dodd-Frank, could adversely affect liquidity and volatility of financial markets in which we participate.
In response to the credit and financial crisis, U.S. and overseas governmental and regulatory authorities are considering or implementing enhanced or new regulatory requirements intended to prevent future crises or stabilize the institutions under their supervision. Such measures are leading to stricter regulation of financial institutions. Changes from Dodd-Frank and other U.S. and overseas governmental initiatives have created uncertainty and could continue to adversely impact liquidity and increase volatility of the financial markets in which we participate and, in turn, negatively affect our financial condition or results of operations. The executive branch has requested a review of financial regulations including Dodd-Frank, which may eliminate or mitigate this risk.
Statutory and regulatory developments could adversely impact our business by increasing costs or making our business less profitable.
The costs of running our business and its profitability could be adversely impacted by laws, rules and regulations that affect the business and financial communities, including changes to the interpretation or enforcement of laws governing standards of care applicable to broker-dealers and investment advisors. New laws, rules and regulations, or changes to the interpretation or enforcement of existing laws, rules or regulations, could also result in limitations on the products and services we offer or plan to offer to clients, modifications to our current or future business practices, compressed margins, increased capital requirements, and additional costs. For example, in June 2019, the SEC adopted new Regulation Best Interest, which imposes an overarching of conduct that requires broker-dealers and their associated persons to act in the best interest of their retail customers when making securities recommendations and imposes a number of new compliance and disclosure obligations on broker-dealers. Other state legislatures (including Nevada, New Jersey and Massachusetts) have or are considering, statutes that impose fiduciary standards and other obligations on broker-dealers and investment advisers operating in their states. The DOL also recently adopted its final rule regarding ERISA fiduciary investment advice, which focuses on, among other things, the fiduciary status of rollover recommendations made by financial professionals to retirement investors. We expect that these laws, regulations and proposals could negatively impact our business, including by increasing our legal, compliance and information technology costs, and potentially other costs, including greater risks of client lawsuits and enforcement activity by regulators. These changes may also affect the products and services we choose to offer
30 Annual Report on Form 10-K Horace Mann Educators Corporation

to clients, as well as the compensation that we and our financial professionals receive in connection with such products and services, which could adversely impact our ability to recruit and retain key personnel.
It is also unclear how and whether other regulators, such as other state securities and insurance regulators may respond to, or enforce elements of, these new laws and regulations, or develop their own similar laws and regulations. The impacts, degree and timing of the effect of these laws and regulations on our business cannot now be anticipated or planned for, and may have further adverse impacts on our products and services, and the results of our operations.
Further, the Dodd-Frank Act enacted wide-ranging changes in the supervision and regulation of the financial industry providing greater oversight of financial industry participants, enhanced public company corporate governance practices and executive compensation disclosures, and greater protections to individual consumers and investors. Certain elements of the Dodd-Frank Act remain subject to implementing regulations that are yet to be adopted by the applicable regulatory agencies. Compliance with adopted regulations could affect the products and services we choose to offer and would likely result in increased compliance costs.
Our business costs and profitability may be adversely impacted by current and future rule making and enforcement activity by the various federal, state and other regulatory organizations to which we are subject.
Litigation may harm our financial strength or reduce our profitability.
Companies in the insurance industry have been subject to substantial litigation resulting from claims, disputes and other matters. Most recently, they have faced expensive claims, including class action lawsuits, alleging, among other things, improper sales practices and improper claims settlement procedures. Negotiated settlements of certain such actions have had a material adverse effect on many insurance companies. The resolution of similar future claims against any of our insurance subsidiaries, including the potential adverse effect on our reputation and charges against the earnings of our insurance subsidiaries as a result of legal defense costs, a settlement agreement or an adverse finding or findings against our insurance subsidiaries in such a claim, could have a material adverse effect on the financial condition and results of operations of our insurance subsidiaries.
Events, including those external to our operations, could damage our reputation.
There are many events which may harm our reputation, including, but not limited to, those discussed in this Item 1A regarding regulatory investigations, legal proceedings, and cyber or other information security incidents. Any negative public perception, founded or otherwise, can be widely and rapidly shared over social media or other means, and could cause damage to our reputation. Damage to our reputation could reduce demand for our insurance products, reduce our ability to recruit and retain employees, or lead to greater regulatory scrutiny of our operations.
As an insurance company, we are paid to accept certain risks. Those who conduct our business, including executive officers and members of management, employees and independent agents, do so in part by making decisions that involve exposing us to risk. These include decisions such as maintaining effective underwriting and pricing discipline, maintaining effective claims management and customer service performance, managing our investment portfolio, delivering effective technology solutions, complying with established sales practices, executing our capital management strategy, exiting a line of business and/or pursuing strategic growth initiatives, and other decisions. Although we employ controls and procedures designed to monitor business decisions and prevent us from taking excessive risks or unintentionally failing to comply with internal policies and practices, there can be no assurance that these controls and procedures will be effective. If our employees and independent agents take excessive risks and/or fail to comply with internal policies and practices, the impact of those events may damage our market position and reputation.
Individual states may impose additional cybersecurity regulations, increasing the complexity of compliance.
Our businesses must comply with regulations to control the privacy of customer, employee and third party data. State and federal regulations regarding data privacy, including the California Consumer Privacy Act, are becoming increasingly more onerous. A misuse or mishandling of confidential or proprietary information could result in legal liability, regulatory action and reputational harm. Third parties, including third party administrators and cloud-based systems, are also subject to cyber-breaches of confidential information, along with the other risks outlined above, any one of which may result in us incurring substantial remediation costs and other
Horace Mann Educators Corporation Annual Report on Form 10-K 31

negative consequences, including a material adverse effect on our business, reputation, financial condition, results of operations and liquidity.
ITEM 1B. I Unresolved Staff Comments
None.
ITEM 2. I Properties
As of December 31, 2020, we owned our headquarters of approximately 225,000 square feet located at 1 Horace Mann Plaza in Springfield, Illinois. In addition, we lease office space in suburban Dallas, Texas (approximately 114,000 of rentable square feet), suburban Raleigh, North Carolina, and Cherry Hill, New Jersey which are utilized by one or more of all five reporting segments, depending on the location. For more information on reporting segments, see Part I - Item 1, Reporting Segments of this report. We believe our properties and facilities are suitable and adequate for current operations.
ITEM 3. I Legal Proceedings
At the time of issuance of this Annual Report on Form 10-K, we do not have pending litigation from which there is a reasonable possibility of material loss.
ITEM 4. I Mine Safety Disclosures
Not applicable.
32 Annual Report on Form 10-K Horace Mann Educators Corporation
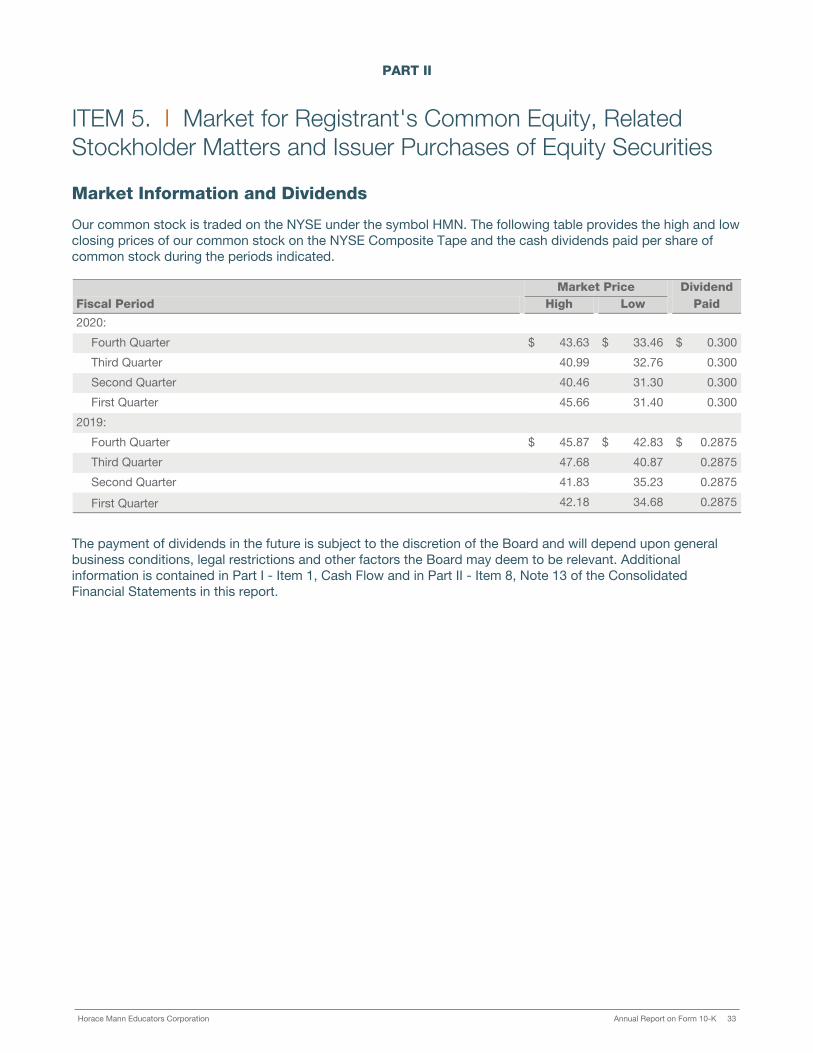
PART II
ITEM 5. I Market for Registrant's Common Equity, Related Stockholder Matters and Issuer Purchases of Equity Securities
Market Information and Dividends
Our common stock is traded on the NYSE under the symbol HMN. The following table provides the high and low closing prices of our common stock on the NYSE Composite Tape and the cash dividends paid per share of common stock during the periods indicated.
Market Price Dividend
Fiscal Period High Low Paid
2020:
Fourth Quarter $ 43.63 $ 33.46 $ 0.300
Third Quarter 40.99 32.76 0.300
Second Quarter 40.46 31.30 0.300
First Quarter 45.66 31.40 0.300
2019:
Fourth Quarter $ 45.87 $ 42.83 $ 0.2875
Third Quarter 47.68 40.87 0.2875
Second Quarter 41.83 35.23 0.2875
First Quarter 42.18 34.68 0.2875
The payment of dividends in the future is subject to the discretion of the Board and will depend upon general business conditions, legal restrictions and other factors the Board may deem to be relevant. Additional information is contained in Part I - Item 1, Cash Flow and in Part II - Item 8, Note 13 of the Consolidated Financial Statements in this report.
Horace Mann Educators Corporation Annual Report on Form 10-K 33

Shareholder Return Performance Graph
The graph below sets forth the total five-year shareholder return on our common stock. The graph assumes a $100 investment at December 31, 2015. The S&P 500 Index and the S&P 500 Insurance Index assume an annual reinvestment of dividends in calculating total return. We assume reinvestment of quarterly dividends when paid.
Comparison of Cumulative Five Year Total Return to Shareholders
HMEC S&P 500 Insurance Index S&P 500 Index
Dec. 2015 Dec. 2016 Dec. 2017 Dec. 2018 Dec. 2019 Dec. 2020$75
$100
$125
$150
$175
$200
$225
Dec. 2015 Dec. 2016 Dec. 2017 Dec. 2018 Dec. 2019 Dec. 2020
HMEC $ 100 $ 133 $ 141 $ 123 $ 147 $ 146
S&P 500 Insurance Index 100 118 137 121 157 156
S&P 500 Index 100 112 136 130 171 203
Holders and Shares Issued
As of February 16, 2021, the number of holders of our common stock was approximately 33,000.
During 2020, stock options were exercised for the issuance of 77,291 shares or 0.2% of our common stock issued and outstanding at December 31, 2019. We received $2.4 million in proceeds from the exercise of stock options, which was used for general corporate purposes.
For information required by Item 201(d) of Regulation S-K regarding the equity compensation plan, see Part III - Item 12, of this report.
34 Annual Report on Form 10-K Horace Mann Educators Corporation

Issuer Purchases of Equity Securities
On September 30, 2015, the Board authorized a share repurchase program allowing repurchases of up to $50.0 million of our common stock, par value $0.001 (Program). The Program authorizes the repurchase of common stock in open market or privately negotiated transactions, from time to time, depending on market conditions. The Program does not have an expiration date and may be limited or terminated at any time without notice.
For the quarterly periods ended 2020 and 2019, we repurchased shares of our common stock under the Program as follows:
Period
Total Numberof SharesPurchased
Average PricePaid per Share
Total Number ofShares
Purchasedunder the Program
Approximate DollarValue of Sharesthat may yet be
Purchased under the Program
Fourth Quarter 2020 — — — $20.6 million
Third Quarter 2020 — — — $20.6 million
Second Quarter 2020 — — — $20.6 million
First Quarter 2020 52,095 $ 41.17 52,095 $20.6 million
Fourth Quarter 2019 — — — $22.8 million
Third Quarter 2019 — — — $22.8 million
Second Quarter 2019 — — — $22.8 million
First Quarter 2019 — — — $22.8 million
Horace Mann Educators Corporation Annual Report on Form 10-K 35

ITEM 6. I Selected Financial Data
The following consolidated statement of operations and balance sheet data have been derived from our consolidated financial statements, which have been prepared in accordance with GAAP. The selected financial data should be read in conjunction with Management's Discussion and Analysis of Financial Condition and Results of Operations in Part II - Item 7 of this report and the Consolidated Financial Statements of the Company and its subsidiaries presented in Part II - Item 8 of this report.
($ in millions, except per share data) Year Ended December 31,
2020 2019 (1) 2018 2017 2016Consolidated Statement of Operations Data:
Insurance premiums and contract charges earned $ 930.7 $ 898.0 $ 817.3 $ 794.7 $ 759.1 Net investment income 357.6 365.1 376.5 373.6 361.2 Net investment gains (losses) (2.3) 153.3 (12.5) (3.4) 4.1 Other income 24.4 14.1 10.3 6.6 4.5 Total revenues 1,310.4 1,430.5 1,191.6 1,171.5 1,128.9 Interest expense 15.2 15.6 13.0 11.9 11.8 Income before income taxes 159.6 236.4 19.5 88.7 114.2
Net income (2) 133.3 184.4 18.3 169.4 83.8
Per Share Data:Net income per share
Basic $ 3.18 $ 4.42 $ 0.44 $ 4.10 $ 2.04 Diluted 3.17 4.40 0.44 4.08 2.02
Shares of Common Stock (in millions)Weighted average - basic 41.9 41.7 41.6 41.4 41.2 Weighted average - diluted 42.0 41.9 41.9 41.6 41.5 Ending outstanding 41.4 41.2 41.0 40.7 40.2
Cash dividends per share $ 1.20 $ 1.15 $ 1.14 $ 1.10 $ 1.06 Book value per share 43.22 38.01 31.50 36.88 32.15
Balance Sheet Data, at Year End:Total investments $ 7,262.2 $ 6,639.2 $ 8,250.7 $ 8,352.3 $ 7,999.3 Total assets 13,471.8 12,478.7 11,031.9 11,198.3 10,576.8 Total policy liabilities 7,148.6 6,956.5 6,384.1 6,182.0 6,024.1 Short-term debt 135.0 135.0 — — — Long-term debt 302.3 298.0 297.7 297.5 247.2 Total shareholders' equity 1,790.1 1,567.3 1,290.6 1,501.6 1,294.0
Segment Information: (3)
Insurance premiums written and contract deposits (4)
Property and Casualty $ 635.5 $ 683.1 $ 681.5 $ 662.8 $ 634.3 Supplemental 130.3 65.7 — — — Retirement 483.4 462.5 439.1 453.1 520.2 Life 110.1 113.2 114.4 111.2 108.0
Total $ 1,359.3 $ 1,324.5 $ 1,235.0 $ 1,227.1 $ 1,262.5 Net income (loss)
Property and Casualty $ 76.5 $ 54.3 $ (14.3) $ 17.8 $ 25.6 Supplemental 43.1 18.0 — — — Retirement 20.1 (4.8) 41.7 88.4 50.7 Life 10.4 17.6 18.8 77.6 16.6 Corporate and Other (5) (16.8) 99.3 (27.9) (14.4) (9.1)
Total $ 133.3 $ 184.4 $ 18.3 $ 169.4 $ 83.8
(1) The acquisition of NTA (Supplemental segment) closed on July 1, 2019.(2) Net income in 2019 reflects an after tax realized investment gain of $106.9 million associated with an annuity reinsurance transaction. 2018
reflects after tax impacts of $90.1 million from catastrophes. 2017 reflects a one-time income tax benefit of $99.0 million from TCJA.(3) Information regarding assets by segment at December 31, 2020, 2019 and 2018 is contained in Part II - Item 8, Note 18 of the Consolidated
Financial Statements in this report.(4) This measure is not based on accounting principles generally accepted in the U.S. (non-GAAP). An explanation of this non-GAAP measure is
contained in the Glossary of Selected Terms included as an exhibit in the Company's reports filed with the SEC.(5) The Corporate and Other segment primarily includes interest expense on debt, the impact of net investment gains (losses), corporate debt
retirement costs, and certain public company expenses.
36 Annual Report on Form 10-K Horace Mann Educators Corporation

ITEM 7. I Management's Discussion and Analysis of Financial Condition and Results of Operations (MD&A)
($ in millions, except per share data)
Measures within this MD&A that are not based on accounting principles generally accepted in the United States of America (non-GAAP) are marked with an asterisk (*) the first time they are presented within this Part II - Item 7. An explanation of these measures is contained in the Glossary of Selected Terms included as Exhibit 99.1 to this Annual Report on Form 10-K and are reconciled to the most directly comparable measures prepared in accordance with accounting principles generally accepted in the United States of America (GAAP) in the Appendix to the Company's Fourth Quarter 2020 Investor Supplement.
Increases or decreases in this MD&A that are not meaningful are marked "N.M.".
Forward-looking Information
Statements made in the following discussion that are not historical in nature are forward-looking within the meaning of the Private Securities Litigation Reform Act of 1995 and are subject to known and unknown risks, uncertainties and other factors. Horace Mann Educators Corporation (referred to in this report as "we", "our", "us", the "Company", "Horace Mann" or "HMEC") is an insurance holding company. We are not under any obligation to (and expressly disclaim any such obligation to) update or revise any forward-looking statements, whether as a result of new information, future events or otherwise. It is important to note that our actual results could differ materially from those projected in forward-looking statements due to a number of risks and uncertainties inherent in our business. See Part I - Item 1A of this Annual Report on Form 10-K for additional information regarding risks and uncertainties.
Introduction
The purpose of this MD&A is to provide an understanding of our consolidated results of operations and financial condition. This MD&A should be read in conjunction with the Consolidated Financial Statements and Notes thereto contained in Part II - Item 8 of this report.
HMEC is an insurance holding company and through its subsidiaries, we market and underwrite personal lines of property and casualty insurance products, supplemental insurance products, retirement products and life insurance products in the United States of America (U.S.). We market our products primarily to K-12 teachers, administrators and other employees of public schools and their families.
This MD&A covers our consolidated financial highlights followed by consolidated results of operations, an outlook for future performance, details about critical accounting estimates, results of operations by segment, investment results, liquidity and financial resources, future adoption of new accounting standards and effects of inflation and changes in interest rates.
COVID-19 Considerations
Beginning in March 2020, the global pandemic associated with the novel coronavirus COVID-19 and related economic conditions introduced unprecedented challenges for our country. Those challenges are ongoing. We relied on our previously developed Corporate Pandemic Plan to address preparation, prevention and response measures specific to COVID-19 while allowing flexibility to quickly react to evolving circumstances and implement varying actions accordingly.
As discussed in our Quarterly Report on Form 10-Q for the quarterly period ended September 30, 2020, we successfully transitioned the organization, through our employees and agents, from one that relied on in-person experience to one that has become primarily virtual. While the current environment continues to present challenges, our operations are being conducted successfully and we continue to support our agents and serve our customers in an effective manner.
As of the end of December 2020, the majority of our employees continue to work remotely. The return to office plans are being guided by data from the Center for Disease Control. We presently limit office occupancy to
Horace Mann Educators Corporation Annual Report on Form 10-K 37

approximately half of pre-COVID-19 levels to enable effective social distancing for some time. We have also implemented other prevention strategies to reduce the potential transmission of COVID-19, such as requiring face masks in common office areas.
Taking into account the virtual work environment, we have implemented additional cybersecurity measures including increasing security and network monitoring to proactively identify and prevent potential security threats and vulnerabilities. We also are identifying and assessing critical third-party vendors and ensuring their ability to continue to perform as anticipated.
Horace Mann markets primarily to K-12 teachers, administrators and other employees of public schools and their families and we estimate that 80% of our customer base are educators or other individuals employed by public school systems. In our experience, educators generally remain employed during periods of economic disruption. As the country entered the 2020 - 2021 school year facing continued pandemic-related challenges, educators have largely remained employed, although they may be even busier than before, as many are being asked to devote time to both in-person teaching as well as remote learning to minimize the spread of COVID-19 in their communities.
We continue to work with our network of exclusive agents to make sure they are using virtual tools that can allow them to reach current and potential educator customers when face-to-face interactions are not possible. We are implementing a variety of new and modified forums to provide access to the financial solutions we offer educators. However, growth in new sales has slowed since the pandemic began, particularly sales generated from in-person events at schools. This may be exacerbated if public school systems face budget constraints due to the economic impacts of the pandemic and/or access to "in school" events remains restricted.
For further discussion regarding the current period and potential future impacts of COVID-19 and related economic conditions on us, see Outlook for 2021 and other content within this MD&A as well as Part I - Item 1A of this report.
In addition, over the past several years, we proactively de-risked our portfolio in anticipation of an economic downturn and believe we are well positioned for any potential market dislocation. Although we have experienced the impacts of market volatility on our fixed maturity security and limited partnership interest valuations during 2020, the investment portfolio is well diversified. It is 90.9% investment grade-rated and has an average credit quality rating of A+. Because of the annuity reinsurance transaction, the spread in our retained annuity business is achieving our targeted returns and new business is priced to do so as well. We believe our capital and reserves are adequate to address any unusual loss patterns resulting from COVID-19.
Amid rapidly changing dynamics, we are continuing to evaluate all aspects of our operations and making necessary adjustments to manage our business. Ultimately, the extent of the impact will depend on how long it takes for the economy to return to some degree of normality. To date, these steps have been effective and have maintained business continuity. Based on assumptions that we will return to a normal operating environment within 12 months, our capital and liquidity situations are expected to remain at or above target levels. We believe we are financially strong despite the potential impact of COVID-19 and continued to produce solid operating results throughout 2020.
38 Annual Report on Form 10-K Horace Mann Educators Corporation

Consolidated Financial Highlights
($ in millions) Year Ended December 31, 2020-2019 2019-2018
2020 2019 2018 Change Change
Total revenues $ 1,310.4 $ 1,430.5 $ 1,191.6 $ (120.1) $ 238.9 Net income 133.3 184.4 18.3 (51.1) 166.1 Per diluted share:
Net income 3.17 4.40 0.44 (1.23) 3.96 Net investment gains (losses), after tax (0.04) 2.87 (0.24) (2.91) 3.11
Book value per share 43.22 38.01 31.50 5.21 6.51 Net income return on equity - last twelve months 8.1 % 12.5 % 1.3 % -4.4pts 11.2pts
For 2020, our net income decreased $51.1 million compared to 2019. The favorable automobile loss experience and full year net income contribution from Supplemental in 2020 partially offset the recognition of a $106.9 million after tax realized investment gain in the second quarter of 2019 associated with the annuity reinsurance transaction. Net income for both years was impacted by goodwill and intangible asset impairment charges in Retirement. See Part II - Item 8, Notes 1, 5 and 6 of the Consolidated Financial Statements in this report for more information regarding Supplemental, the annuity reinsurance transaction and the goodwill and intangible asset impairment charges.
For 2019, our net income increased $166.1 million compared to 2018, primarily due to the realized investment gain arising from the annuity reinsurance transaction previously noted. Lower catastrophe losses of $49.0 million after tax in Property and Casualty as well as the addition of $18.0 million of net income from the Supplemental segment also contributed to the increase in consolidated net income.
See Results of Operations by Segment for further details.
Consolidated Results of Operations
($ in millions) Year Ended December 31, 2020-2019 2019-2018
2020 2019 2018 Change % Change %
Insurance premiums and contract charges earned $ 930.7 $ 898.0 $ 817.3 3.6 % 9.9 %
Net investment income 357.6 365.1 376.5 -2.1 % -3.0 %
Net investment gains (losses) (2.3) 153.3 (12.5) N.M. N.M.
Other income 24.4 14.1 10.3 73.0 % 36.9 %
Total revenues 1,310.4 1,430.5 1,191.6 -8.4 % 20.0 %
Benefits, claims and settlement expenses 568.9 585.1 637.6 -2.8 % -8.2 %
Interest credited 204.6 212.8 206.2 -3.9 % 3.2 %
Operating expenses 237.8 234.6 205.4 1.4 % 14.2 %
DAC unlocking and amortization expense 99.9 109.2 109.9 -8.5 % -0.6 %
Intangible asset amortization expense 14.4 8.8 — 63.6 % N.M.
Interest expense 15.2 15.6 13.0 -2.6 % 20.0 %
Other expense - goodwill and intangible asset impairments 10.0 28.0 — N.M. N.M.
Total benefits, losses and expenses 1,150.8 1,194.1 1,172.1 -3.6 % 1.9 %
Income before income taxes 159.6 236.4 19.5 -32.5 % N.M.
Income tax expense 26.3 52.0 1.2 -49.4 % N.M.
Net income $ 133.3 $ 184.4 $ 18.3 -27.7 % N.M.
Horace Mann Educators Corporation Annual Report on Form 10-K 39

Insurance Premiums and Contract Charges EarnedFor 2020, insurance premiums and contract charges earned increased $32.7 million compared to 2019, primarily due to the addition of a full year of reported earned premiums from Supplemental partially offset by lower premiums earned by Property and Casualty, including recognition of $10.2 million of automobile premium credits to our policyholders related to reduced driving activity due to COVID-19. For 2019, insurance premiums and contract charges earned increased $80.7 million compared to 2018, primarily due to the addition of Supplemental and increases in average premium per risk for both automobile and property.
Net Investment IncomeExcluding accreted investment income on the deposit asset on reinsurance, 2020 net investment income decreased $34.0 million compared to 2019 for two reasons. First, we had a smaller invested asset base for full-year 2020. In 2019, the invested asset base was higher in the first quarter, prior to the transfer of $2.1 billion of invested assets as part of the annuity reinsurance transaction. Second, market weakness in early 2020 resulted in lower full-year returns from limited partnership interests.
2019 net investment income excluding accreted investment income on the deposit asset on reinsurance was $82.2 million below 2018 because of the transfer of invested assets. In addition, interest rates declined significantly in 2019 and our yield on new investments also reflected a strategic decision to further improve the quality of the portfolio. This was partially offset by stronger returns on alternative investments and increased prepayment activity.
The annualized yield on the total investment portfolio for the past three years was as follows:
2020 2019 2018
Investment yield, excluding limited partnership interests, pretax - annualized* 4.3% 4.6% 5.1%
Investment yield, excluding limited partnership interests, after tax - annualized* 3.5% 3.7% 4.0%
During 2020, management continued to identify and purchase investments, including alternative investments, with attractive risk-adjusted yields relative to market conditions without venturing into asset classes or individual securities that would be inconsistent with our overall investment guidelines.
Net Investment Gains (Losses)For 2020, net investment gains decreased primarily due to recognition of a pretax realized investment gain of $135.3 million in the second quarter of 2019 in connection with the transfer of investments related to the aforementioned annuity reinsurance transaction. The aforementioned transaction is what drove the increase in net investment gains in 2019 compared to 2018.
The break down of net investment gains (losses) by transaction type is shown in the following table:
($ in millions) Year Ended December 31,
2020 2019 2018
Net other-than-temporary impairments losses on securities recognized in net income $ (5.3) $ (1.4) $ (1.5)
Sales and other, net 15.0 151.5 3.5 Change in fair value - equity securities (0.2) 7.3 (18.3)
Change in fair value and gains (losses) realized on settlements - derivatives (11.8) (4.1) 3.8
Net investment gains (losses) $ (2.3) $ 153.3 $ (12.5)
From time to time, we may sell securities subsequent to a reporting date that were considered temporarily impaired at the reporting date. Such sales are due to issuer specific events occurring subsequent to the reporting date that result in a change in our intent to hold an invested asset.
40 Annual Report on Form 10-K Horace Mann Educators Corporation

Other IncomeFor 2020, other income increased $10.3 million due, in part, to a full year contribution from Supplemental. For 2019, other income increased $3.8 million compared to 2018, due, in part, to a six month contribution from Supplemental.
Benefits, Claims and Settlement ExpensesFor 2020, benefits, claims and settlement expenses were lower due to favorable loss experience as a result of lower frequency of losses related to reduced driving activity due to COVID-19, partially offset by higher catastrophe losses and a full year of reported benefits and settlement expenses from the Supplemental segment. For 2019, benefits, claims and settlement expenses were lower compared to 2018, due to reduced catastrophe losses and improved automobile experience, partially offset by the inclusion of losses from the new Supplemental segment.
Interest CreditedFor 2020, interest credited decreased $8.2 million compared to 2019, driven primarily by lower interest rates and a lower level of Federal Home Loan Bank (FHLB) funding agreements. Under the deposit method of accounting, the interest credited on the reinsured annuity block continues to be reported. The average deferred annuity credited rate, excluding the reinsured block was 2.4% and 2.5% for 2020 and 2019, respectively. For 2019, interest credited increased $6.6 million compared to 2018 primarily due to higher interest costs on FHLB funding agreements.
Operating ExpensesFor 2020, operating expenses increased $3.2 million compared to 2019, primarily due to the inclusion of $42.7 million of operating expenses from Supplemental operations compared to $22.3 million in 2019, offset by expense reduction initiatives as well as lower levels of spending on travel and other expenses because of COVID-19. For 2019, operating expenses increased $29.2 million compared to 2018, driven by the inclusion of NTA and BCG operations as well as $5.5 million of severance charges incurred in 2019 pertaining to expense reduction initiatives.
DAC Unlocking and Amortization ExpenseFor 2020, DAC unlocking and amortization expense decreased $9.3 million compared to 2019, primarily due to accelerated amortization of the DAC asset associated with the reinsured annuity block that occurred in Retirement in 2019 and a lower level of amortization of Property and Casualty DAC in 2020 attributed to lower levels of production. For 2019, DAC unlocking and amortization expense was comparable to 2018. For Life, DAC unlocking resulted in immaterial changes to amortization for the three years ended 2020, 2019 and 2018.
Intangible Asset Amortization ExpenseFor 2020, intangible asset amortization expense increased $5.6 million compared to 2019, primarily due a full year of reported intangible asset amortization expense for NTA. For 2019, the increase in intangible asset amortization expense compared to 2018 was due to the acquisitions of NTA and BCG.
Interest ExpenseFor 2020, interest expense decreased slightly compared to 2019 due to lower interest rates. For 2019, interest expense increased $2.6 million compared to 2018, primarily due to utilizing our senior revolving credit facility in the third quarter of 2019 to partially fund the acquisition of NTA.
Other Expense - Goodwill and Intangible Asset ImpairmentsFor 2020, other expense represents goodwill and intangible asset impairment charges with regards to BCG. For 2019, other expense represents an annuity goodwill impairment charge in Retirement resulting from the annuity reinsurance transaction. See Part II - Item 8, Note 6 of the Consolidated Financial Statements in this report for further information.
Income Tax ExpenseThe effective income tax rate on our pretax income, including net investment gains (losses) was 16.5%, 22.0% and 6.2% for the years ended December 31, 2020, 2019 and 2018, respectively. Income from investments in tax-advantaged securities reduced the effective income tax rates by 3.6, 2.3 and 21.2 percentage points for 2020, 2019 and 2018, respectively. The goodwill and intangible asset impairment charges in the Retirement
Horace Mann Educators Corporation Annual Report on Form 10-K 41

segment decreased the effective income tax rate by 0.1 percentage points at December 31, 2020 and increased the effective income tax rate by 2.3 percentage points at December 31, 2019.
On March 27, 2020, H.R. 748, the Coronavirus Aid, Relief, and Economic Security Act, “the CARES Act”, was signed into legislation. The CARES Act includes tax provisions relevant to businesses, and some of the significant changes include allowance of a five-year carryback of net operating losses for 2018-2020 and the suspension of the 80% limitation of taxable income for net operating loss carryforwards for 2018-2020. The effects of the CARES Act are reflected in our income tax expense calculations for the year ended December 31, 2020. Accounting Standards Codification Topic 740: Income Taxes requires that the impact of the CARES Act be recognized in the period in which the law was enacted. As a result, total income tax expense for the year ended December 31, 2020, includes a benefit of $2.8 million (that reduced the effective income tax rate by 2.8 percentage points) to reflect a net operating loss carryback to taxable years for which the corporate rate was 35% as compared to the current corporate rate of 21%.
We record liabilities for uncertain tax filing positions where it is more likely than not that the position will not be sustainable upon audit by taxing authorities. These liabilities are reevaluated routinely and are adjusted appropriately based on changes in facts or law. We have no unrecorded liabilities from uncertain tax filing positions.
At December 31, 2020, our federal income tax returns for years prior to 2014 are no longer subject to examination by the Internal Revenue Service. We do not anticipate any assessments for tax years that remain subject to examination to have a material effect on our financial position or results of operations. See Part II - Item 8, Note 10 of the Consolidated Financial Statements in this report for further information.
Outlook for 2021
The following discussion provides outlook information for our results of operations and capital position.
The impacts of the COVID-19 pandemic and related economic conditions on the Company's results continue to be highly uncertain and outside the Company's control. The scope, duration and magnitude of the direct and indirect effects of the pandemic continue to evolve in ways that are difficult or impossible to anticipate. For additional information on the risks posed by the pandemic, see “A large-scale pandemic, the occurrence of terrorism or military actions may have an adverse effect on our business” included in Part I - Item 1A—Risk Factors in this Annual Report on Form 10-K.
At the time of issuance of this Annual Report on Form 10-K, we estimate that 2021 full year net income will be within a range of $3.00 to $3.20 per diluted share, generating a core return on equity* of over 9%. The outlook assumes a federal statutory corporate tax rate of 21%.
Property and Casualty Segment
Net written premiums* for 2021 are anticipated to be below 2020 levels. We expect new sales* will remain under pressure while COVID-19 vaccines are being rolled out across the country, with a return to pre-pandemic sales levels likely to begin in the fourth quarter.
We expect the pandemic's impact on automobile loss costs will continue in 2021, reflecting continued lower frequency related to new driving patterns, as well as a partial offset because of the anticipated uptick in uninsured/underinsured motorist claims. Over the course of 2021, we anticipate loss ratios gradually rising toward our long-term target levels. Our outlook presumes that some changes to driving patterns will become more permanent, but those would be offset by some of the factors that increased severity in 2020. We anticipate fairly stable automobile rates in 2021. We estimate that a 10% drop in automobile frequency represents approximately $2 million in pretax earnings per month, excluding the potential for higher severity.
We expect the underlying property loss ratio* will be stable in 2021 with rates expected to rise in the low-single digits.
As a result, the Property and Casualty full-year combined ratio is expected to be 95% - 96%, assuming catastrophe losses add approximately 9.5 points. Net income for Property and Casualty is anticipated to be in the range of $54 million to $58 million.
42 Annual Report on Form 10-K Horace Mann Educators Corporation

Supplemental Segment
In 2021, we expect Supplemental's pretax profit margin will move closer to our long-term mid 20% target range, as the favorable trends in benefits paid from changes in policyholder behavior due to COVID-19 significantly decline in 2021 while sales* gradually return to pre-pandemic levels. Net investment income should continue to benefit from the portfolio repositioning. Including these factors, net income for Supplemental is anticipated to be in the range of $33 million to $35 million.
Retirement Segment
We expect Retirement to generate net income in the range of $38 million to $40 million in 2021, reflecting higher net investment income from the alternatives portfolio as well as an increase in fees on our annuity business.
Life Segment
We expect Life to generate net income between $17 million and $19 million in 2021, reflecting modeled mortality costs and increased net investment income from the alternatives portfolio. Sales* are expected to gradually return to pre-pandemic levels.
Investments
For 2021, we expect total net investment income between $370 million and $390 million, including approximately $100 million of accreted investment income on the deposit asset on reinsurance in the Retirement segment. The return on the alternatives portfolio is expected to be in the mid to high single digits in 2021, compared with a below-target 5% in 2020 due to market volatility early in the year.
As described in Critical Accounting Estimates, certain of our significant accounting measurements require the use of estimates and assumptions. As additional information becomes available, adjustments may be required. Those adjustments are charged or credited to net income for the period in which the adjustments are made and may impact actual results compared to our estimates above. Additionally, see forward-looking information in Part I - Items 1 and 1A of this Annual Report on Form 10-K concerning other important factors that could impact actual results. We believe that a projection of net income is not appropriate on a forward-looking basis because it is not possible to provide a valid forecast of net investment gains (losses), which can vary substantially from one period to another and may have a significant impact on net income.
Critical Accounting Estimates
The preparation of consolidated financial statements in conformity with GAAP requires us to make estimates and assumptions based on information available at the time the consolidated financial statements are prepared. These estimates and assumptions affect the reported amounts of our consolidated assets, liabilities, shareholders' equity and net income. Certain accounting estimates are particularly sensitive because of their significance to our consolidated financial statements and because of the possibility that subsequent events and available information may differ markedly from management's judgments at the time the consolidated financial statements were prepared. We have discussed with our Audit Committee the quality, not just the acceptability, of our accounting principles as applied in our financial reporting. The discussions generally included such matters as to the consistency of our accounting policies and their application, and the clarity and completeness of our consolidated financial statements, which include related disclosures. Information regarding our accounting policies pertaining to these topics is located in the Notes to Consolidated Financial Statements as listed in Part II - Item 8 of this report.
We have identified the following accounting estimates as critical in that they involve a higher degree of judgment and are subject to a significant degree of variability:
• Valuation of hard-to-value fixed maturity securities, including evaluation of other-than-temporary impairments
• Evaluation of goodwill and intangible assets for impairment
• Valuation of annuity and life deferred policy acquisition costs
• Valuation of liabilities for property and casualty unpaid claims and claim expenses
Horace Mann Educators Corporation Annual Report on Form 10-K 43

• Valuation of certain investment contracts and policy reserves
Although variability is inherent in these accounting estimates, we believe the amounts provided are appropriate based upon the facts available during preparation of the consolidated financial statements.
Valuation of Hard-to-Value Fixed Maturity SecuritiesThe fair value of a fixed maturity security is the estimated amount at which the security could be exchanged in an orderly transaction between knowledgeable, unrelated and willing parties. We utilize investment managers and our custodian bank to obtain fair value prices from independent third-party valuation service providers, broker-dealer quotes, and model prices. Each month, we obtain fair value prices from our investment managers and custodian bank, each of which use a variety of independent, nationally recognized pricing sources to determine market valuations for fixed maturity securities. Differences in prices between the sources that we consider significant are researched and we utilize the price that we consider most representative of an exit price. Typical inputs used by these pricing sources include, but are not limited to, reported trades, bids, offers, benchmark yield curves, benchmarking of like securities, rating designations, sector groupings, issuer spreads and/or estimated cash flows, prepayment and default speeds, among others. Our fixed maturity securities portfolio is primarily publicly traded, which allows for a high percentage of the portfolio to be priced through pricing services. Approximately 91.9% of the portfolio, based on fair value, was priced through pricing services or index priced using observable inputs as of December 31, 2020.
The valuation of hard-to-value fixed maturity securities (generally 100 -150 securities) is more subjective because the markets are less liquid and there is a lack of observable market-based inputs. This may increase the potential that the estimated fair value of an investment is not reflective of the price at which an actual transaction would occur. When the pricing sources cannot provide fair value determinations, the investment managers and custodian bank obtain non-binding price quotes from broker-dealers. For those securities where the investment manager cannot obtain broker-dealer quotes, they will model the security, generally using anticipated cash flows of the underlying collateral. Broker-dealers' valuation methodologies as well as investment managers’ modeling methodologies are sometimes matrix-based, using indicative evaluation measures and adjustments for specific security characteristics and market sentiment. The selection of the market inputs and assumptions used to estimate the fair value of hard-to-value fixed maturity securities requires judgment and includes: benchmark yield, liquidity premium, estimated cash flows, prepayment and default speeds, spreads, weighted average life, and credit rating. The extent of the use of each market input depends on the market sector and market conditions. Depending on the security, the priority of the use of inputs may change or some market inputs may not be relevant. For some securities, additional inputs may be necessary.
We gain assurance that our portfolio of fixed maturity securities including hard-to-value fixed maturity securities is appropriately valued through the execution of various processes and controls designed to ensure the overall reasonableness and consistent application of valuation methodologies, including inputs and assumptions, and compliance with accounting standards. Our processes and controls are designed to ensure (1) the valuation methodologies are appropriate and consistently applied, (2) the inputs and assumptions are reasonable and consistent with the objective of determining fair value, and (3) the fair values are accurately recorded. For example, on a continuing basis, we assess the reasonableness of individual fair values that have stale security prices or that exceed certain thresholds as compared to previous fair values received from valuation service providers. We perform procedures to understand and assess the methodologies, processes and controls of valuation service providers. In addition, we may validate the reasonableness of fair values by comparing information obtained from valuation service providers or broker-dealers to other third-party valuation sources for selected securities.
At December 31, 2020, Level 3 invested assets comprised 5.3% of our total investment portfolio based on fair value. Invested assets are classified as Level 3 when fair value is determined based on unobservable inputs that are supported by little or no market activity and those inputs are significant to the determination of fair value.
Evaluation of Other-than-Temporary ImpairmentsOur methodology of assessing other-than-temporary impairment (OTTI) for fixed maturity securities is based on security-specific facts and circumstances as of the reporting date. We have a policy and process to evaluate fixed maturity securities (at the cusip/issuer level) on a quarterly basis to assess whether there has been OTTI. These reviews, in conjunction with our investment managers' monthly credit reports and relevant factors such as (1) the financial condition and near-term prospects of the issuer, (2) the length of time and extent to which the fair value has been less than amortized cost, (3) our intent to sell a security or whether it is more likely than not
44 Annual Report on Form 10-K Horace Mann Educators Corporation

that we will be required to sell the security before the anticipated recovery of value, (4) the market leadership position of the issuer, (5) the debt ratings of the issuer, and (6) the cash flows and liquidity of the issuer or the underlying cash flows for asset-backed securities, are all considered in the impairment assessment.
For fixed maturity securities that we do not intend to sell or for which it is more likely than not that we would not be required to sell before an anticipated recovery in value, we separate the credit loss component of the impairment from the amount related to all other factors and report the credit loss component in net investment gains (losses). The impairment related to all other factors (non-credit factors) is reported in other comprehensive income (OCI). The allowance is adjusted for any additional credit losses and subsequent recoveries. Upon recognizing a credit loss, the cost basis is not adjusted. Also, see Part II - Item 8, Note 1 of the Consolidated Financial Statements in this report.
Evaluation of Goodwill and Intangible Assets for ImpairmentGoodwill represents the excess of the amounts paid to acquire a business over the fair value of its net assets at the date of acquisition. Goodwill is not amortized, but is tested for impairment at the reporting unit level at least annually or more frequently if events occur or circumstances change that would more likely than not reduce the fair value of a reporting unit below its carrying value. Goodwill impairment is the amount by which a reporting unit’s carrying value exceeds its fair value, not to exceed the carrying amount of goodwill. A goodwill impairment charge could have a material adverse effect on our results of operations. Our reporting units, for which goodwill has been allocated, are equivalent to our operating segments. As of December 31, 2020, our allocation of goodwill by reporting unit was as follows: $9.5 million, Property and Casualty; $19.6 million, Supplemental; $4.5 million, Retirement; and $9.9 million, Life. Also see Part II - Item 8, Notes 1 and 6 of the Consolidated Financial Statements in this report.
The goodwill impairment test, as defined in GAAP, allows an entity the option to first assess qualitative factors to determine whether the existence of events or circumstances leads to a determination that it is more likely than not that the fair value of a reporting unit is less than its carrying value. If an entity determines it is more likely than not that the fair value of a reporting unit is less than its carrying value, then the entity performs a quantitative goodwill impairment test by comparing the fair value of a reporting unit to its carrying value for purposes of confirming and measuring an impairment.
The process of evaluating goodwill for impairment requires management to make multiple judgments and assumptions to determine the fair value of each reporting unit, including discounted cash flow calculations, the level of our own share price and assumptions that market participants would make in valuing each reporting unit. Fair value estimates are based primarily on an in-depth analysis of historical experience, projected future cash flows and relevant discount rates, which consider market participant inputs and the relative risk associated with the projected cash flows. Other assumptions include levels of economic capital, future business growth, earnings projections and assets under management for each reporting unit. Estimates of fair value are subject to assumptions that are sensitive to change and represent our reasonable expectation regarding future developments. We also consider other valuation techniques such as peer company price-to-earnings and price-to-book multiples.
The assessment of goodwill recoverability requires significant judgment and is subject to inherent uncertainty. The use of different assumptions, within a reasonable range, could cause the fair value of a reporting unit to be below carrying value. Subsequent goodwill assessments could result in impairment, particularly for each reporting unit with at-risk goodwill, due to the impact of a volatile financial markets on earnings, discount rate assumptions, liquidity and market capitalization. For 2020, lower than anticipated BCG wealth management sales outside of the education markets triggered a requirement to evaluate the goodwill associated with the BCG business of the Retirement reporting unit resulting in a write-down of a certain amount of goodwill in the fourth quarter of 2020. For 2019, the annuity reinsurance transaction triggered an assessment resulting in a write-down of a certain amount of goodwill for impairment during the second quarter of 2019 (see Part II - Item 8, Note 6 of the Consolidated Financial Statements in this report for more information). There were no other events or material changes in circumstances during 2020 that indicated that an adverse material change in the fair value of our reporting units had occurred.
The value of business acquired (VOBA) represents the difference between the fair value of insurance contracts and insurance policy reserves measured in accordance with our accounting policies for insurance contracts acquired. VOBA was based on an actuarial estimate of the present value of future distributable earnings for insurance in force on the acquisition date. VOBA was $83.6 million as of December 31, 2020 and is being amortized by product based on the present value of future premiums to be received. We estimate that we will
Horace Mann Educators Corporation Annual Report on Form 10-K 45

recognize VOBA amortization of $6.6 million in 2021, $6.2 million in 2022, $5.8 million in 2023, $5.4 million in 2024 and $5.1 million in 2025.
We account for the value of distribution acquired (VODA) associated with the acquisition of NTA based on an actuarial estimate of the present value of future business to be written by the existing distribution channel. VODA was $44.7 million as of December 31, 2020 and is being amortized on a straight-line basis. We estimate that we will recognize VODA amortization of $2.9 million in each of the years 2021 through 2025, respectively.
We account for VODA associated with the acquisition of BCG based on our estimate of the present value of future business to be written by the existing distribution channel. VODA was $0.7 million as of December 31, 2020 and is being amortized based on the present value of future profits to be received. We estimate that we will recognize cumulative VODA amortization of $0.3 million for the years 2021 through 2025.
We account for the value of agency relationships based on the present value of commission overrides retained by NTA. Agency relationships was $12.9 million as of December 31, 2020 and is being amortized based on the present value of future premiums to be received. We estimate that we will recognize agency relationships amortization of $2.2 million in 2021, $1.9 million in 2022, $1.6 million in 2023, $1.4 million in 2024 and $1.2 million in 2025.
We account for the value of customer relationships based on the present value of expected profits from existing BCG customers in force at the date of acquisition. Customer relationships was $5.9 million as of December 31, 2020 and is being amortized based on the present value of future profits to be received. We estimate that we will recognize customer relationships amortization of $1.2 million in 2021, $1.1 million in 2022, $0.9 million in 2023, $0.7 million in 2024 and $0.6 million in 2025.
Trade names represent the present value of future savings accruing to NTA and BCG by virtue of not having to pay royalties for the use of the trade names, valued using the relief from royalty method. State licenses represents the regulatory licenses held by NTA that were valued using the cost approach. Both trade names and state licenses are indefinite-lived intangibles that are not subject to amortization.
VOBA is reviewed for recoverability from future income, including net investment income, and costs which are deemed unrecoverable are expensed in the period in which the determination is made. No such costs were deemed unrecoverable during the year ended December 31, 2020.
Amortizing intangible assets (i.e., VODA, agency relationships and customer relationships) are tested for recoverability whenever events or changes in circumstances indicate that its carrying value may not be recoverable. The carrying amount of an amortizing intangible asset is not recoverable if it exceeds the sum of undiscounted cash flows expected to result from the use and eventual disposition of the asset. If the carrying amount is not recoverable from undiscounted cash flows, the impairment is measured as the difference between the carrying amount and fair value. The results from our annual impairment assessment for VODA at October 1, 2020 resulted in the write-down of a certain amount for impairment related to the 2019 acquisition of BCG. See Part II - Item 8, Note 6 of the Consolidated Financial Statements in this report for more information.
Intangible assets that are not subject to amortization (i.e., trade names and state licenses) are tested for impairment annually or more frequently if events or changes in circumstances indicate that the asset might be impaired. The impairment test consists of a comparison of the fair value of an intangible asset with its carrying amount. If the carrying amount of an intangible asset that is not subject to amortization exceeds its fair value, an impairment loss is to be recognized in an amount equal to that excess. The test results from our annual impairment assessment for trade names at October 1, 2020 resulted in the write-down of a certain amount for impairment. See Part II - Item 8, Note 6 of the Consolidated Financial Statements in this report for more information.
Valuation of Annuity and Life Deferred Policy Acquisition CostsDAC, consisting of commissions, policy issuance and other costs which are incremental and directly related to the successful acquisition of new or renewal business, are deferred and amortized on a basis consistent with the type of insurance coverage. For all annuity contracts, DAC is amortized over 20 years in proportion to estimated gross profits. DAC is amortized in proportion to estimated gross profits over 20 years for certain life insurance products with account values and over 30 years for IUL. For further information, see Part II - Item 8, Note 1 of the Consolidated Financial Statements in this report.
46 Annual Report on Form 10-K Horace Mann Educators Corporation

The most significant assumptions that are involved in the estimation of annuity gross profits include interest rate spreads, future financial market performance, business surrender/lapse rates, expenses and the impact of net investment gains (losses). For the variable deposit portion of Retirement, we amortize DAC utilizing a future financial market performance assumption of an 8.0% reversion to the mean approach with a 200 basis point corridor around the mean during the reversion period, representing a cap and a floor on our long-term assumption. Our practice with regard to future financial market performance assumes that long-term appreciation in the financial markets is not changed by short-term market fluctuations, but is only changed when sustained annual deviations are experienced. We monitor these fluctuations and only change the assumption when the long-term expectation changes. The potential effect of an increase by 100 basis points in the assumed future rate of return is reasonably likely to result in an estimated decrease in DAC amortization expense of approximately $3.5 million. The potential effect of an decrease by 100 basis points in the assumed future rate of return is reasonably likely to result in an estimated increase in DAC amortization expense of approximately $2.0 million. Although this evaluation reflects likely outcomes, it is possible an actual outcome may fall below or above these estimates. At December 31, 2020, the ratio of DAC to the total annuity accumulated cash value was 1.7%.
In the event actual experience differs significantly from assumptions or assumptions are significantly revised, we may be required to record a material charge or credit to current period amortization expense for the period in which the adjustment is made. As noted above, there are key assumptions involved in the evaluation of DAC. In terms of the sensitivity of this amortization to three of the more significant assumptions, based on DAC as of December 31, 2020 and assuming all other assumptions are met, (1) a 10 basis point deviation in the annual targeted interest rate spread assumption would impact amortization between $0.3 million and $0.4 million, (2) a 1.0% deviation from the targeted financial market performance for the underlying mutual funds of our variable annuities would impact amortization between $0.3 million and $0.4 million and (3) a $1.0 million net investment gain (loss) would impact amortization by approximately $0.2 million. These results may change depending on the magnitude and direction of any actual deviations but represent a range of reasonably likely experience for the noted assumptions. Detailed discussion of the impact of adjustments to DAC amortization expense is included in Results of Operations by Segment for the Three Years Ended December 31, 2020.
The most significant assumptions that are involved in the estimation of life insurance gross profits include interest rates expected to be received on investments, business persistency, and mortality. Conversions from term to permanent insurance cause an immediate write down of the associated DAC. The impact on amortization due to assumption changes has an immaterial impact on the results of operations.
Annually, we perform a gross premium valuation on life insurance policies to assess whether a loss recognition event has occurred. This involves discounting expected future benefits and expenses less expected future premiums. To the extent that this amount is greater than the liability for future benefits less the DAC asset, in aggregate for the life insurance block, a loss would be recognized by first writing off the DAC and then increasing the liability.
Valuation of Liabilities for Property and Casualty Unpaid Claims and Claim ExpensesUnderwriting results of Property and Casualty are significantly influenced by estimates of our ultimate liability for insured events. There is a high degree of uncertainty inherent in the estimates of ultimate losses underlying the liabilities for unpaid claims and claim expenses. This inherent uncertainty is particularly significant for liability-related exposures due to the extended period, often many years that transpire between a loss event, receipt of related claims data from policyholders and ultimate settlement of the claim. Reserves for Property and Casualty claims include provisions for payments to be made on reported claims (case reserves), IBNR claims and associated settlement expenses (together, loss reserves).
The process by which these reserves are established requires reliance upon estimates based on known facts and on interpretations of circumstances, including our experience with similar cases and historical trends involving claim payments and related patterns, pending levels of unpaid claims and product mix, as well as other factors including court decisions, economic conditions, public attitudes and medical costs. We calculate and record a single best estimate of the reserve (which is equal to the actuarial point estimate) as of each reporting date.
Reserves are re-estimated quarterly. Changes to reserves are recorded in the period in which development factor changes result in reserve re-estimates. A detailed discussion of the process utilized to estimate loss reserves, risk factors considered and the impact of adjustments recorded during recent years is included in Part II - Item 8, Note 7 of the Consolidated Financial Statements in this report. Due to the nature of our personal lines
Horace Mann Educators Corporation Annual Report on Form 10-K 47

business, we have no exposure to losses related to claims for toxic waste cleanup, other environmental remediation or asbestos-related illnesses other than claims under property insurance policies for environmentally related items such as mold.
Based on our products and coverages, historical experience, and modeling of various actuarial methodologies used to develop reserve estimates, we estimate that the potential variability of the Property and Casualty loss reserves within a reasonable probability of other possible outcomes may be approximately plus or minus 6.0%, which equates to plus or minus approximately $12.0 million of net income based on net reserves as of December 31, 2020. Although this evaluation reflects the most likely outcomes, it is possible the final outcome may fall below or above these estimates.
There are a number of assumptions involved in the determination of our Property and Casualty loss reserves. Among the key factors affecting recorded loss reserves for both long-tail and short-tail related coverages, claim severity and claim frequency are of particular significance. We estimate that a 2.0% change in claim severity or claim frequency for the most recent 36 month period is a reasonably likely scenario based on recent experience and would result in a change in the estimated net reserves of between $5.0 million and $9.0 million for long-tail liability related exposures (automobile liability coverages) and between $1.0 million and $3.0 million for short-tail liability related exposures (property and automobile physical damage coverages). Actual results may differ, depending on the magnitude and direction of the deviation.
Our actuaries discuss their loss and loss adjustment expense actuarial analysis with management. As part of this discussion, the indicated point estimate of the IBNR loss reserve by line of business (coverage) is reviewed. Our actuaries also discuss any indicated changes to the underlying assumptions used to calculate the indicated point estimate. Any variance between the indicated reserves from these changes in assumptions and the previously carried reserves is reviewed. After discussion of these analyses and all relevant risk factors, management determines whether the reserve balances require adjustment. Our best estimate of loss reserves may change depending on a revision in the underlying assumptions.
Our liabilities for unpaid claims and claim expenses for Property and Casualty were as follows:
($ in millions) December 31, 2020 December 31, 2019
CaseReserves
IBNRReserves Total (1)
CaseReserves
IBNRReserves Total (1)
Automobile liability $ 100.2 $ 190.4 $ 290.6 $ 97.9 $ 219.2 $ 317.1 Automobile other 8.5 (3.9) 4.6 12.3 (5.4) 6.9 Property 20.8 45.7 66.5 12.8 39.5 52.3 All other 0.5 9.9 10.4 2.3 8.4 10.7
Total $ 130.0 $ 242.1 $ 372.1 $ 125.3 $ 261.7 $ 387.0 (1) These amounts are gross, before reduction for ceded reinsurance reserves.
The facts and circumstances leading to our re-estimate of reserves relate to revisions of the development factors used to predict how losses are likely to develop from the end of a reporting period until all claims have been paid. Re-estimates occur because actual loss amounts are different than those predicted by the estimated development factors used in prior reserve estimates. At December 31, 2020, the impact of a reserve re-estimation resulting in a 1.0% increase in net reserves would be a decrease of approximately $2.0 million in net income. A reserve re-estimation resulting in a 1.0% decrease in net reserves would increase net income by approximately $2.0 million.
Favorable prior years' reserve re-estimates increased net income in 2020 by approximately $10.2 million pretax, primarily the result of favorable loss trends in automobile and property for accident years 2019 and prior which includes the recognition of $4.8 million pretax of subrogation received on the 2018 Camp Fire event. The lower than expected claims emergence and resultant lower expected loss ratios caused us to lower our reserve estimate at December 31, 2020.
Valuation of Certain Investment Contracts and Policy ReservesLiabilities for future benefits on annuity and life policies are established in amounts adequate to meet the estimated future obligations on policies in force.
48 Annual Report on Form 10-K Horace Mann Educators Corporation

Liabilities for future benefits on deferred annuity contracts, excluding fixed indexed annuity (FIA) products, are carried at accumulated policyholder values without reduction for potential surrender or withdrawal charges. Liabilities for FIA products are bifurcated into an embedded derivative and a host contract. The embedded derivative is recognized at fair value and is reported in Other policyholder funds on the Consolidated Balance Sheets, and is determined using the option budget method. The host contract is accounted for as a debt instrument with the initial amount determined as the consideration amount less the initial embedded derivative, as described above. Any discount to the minimum account value is accreted over the life of the products using the effective yield method. Key assumptions used in the estimation of the liabilities for FIA products include the risk free interest rate, the value of options currently in force, the future expected option budget based on product pricing targets, mortality and lapses.
Liabilities for future benefits on payout annuity contracts are determined as the present value of expected future benefit payments. Key assumptions used in the calculation include the future investment yield and mortality, for those contracts with life contingencies.
Liabilities for future policy benefits on supplemental insurance policies are computed using the net level premium method and are based on assumptions as to future investment yields, morbidity, mortality, persistency, expenses and other assumptions based on our experience, including provisions for adverse deviation. Mortality, morbidity and lapse assumptions for all policies have been based on standard actuarial tables which are modified as appropriate to reflect our own experience. In the event actual experience is worse than the assumptions, additional reserves may be required. This would result in recognition of a loss in the period for which the increase in reserves occurred.
Liabilities for future policy benefits on life insurance policies, excluding indexed universal life (IUL) products, are computed using the net level premium method and are based on assumptions as to future investment yield, mortality and lapses. Mortality and lapse assumptions for all policies have been based on actuarial tables which are consistent with our own experience. In the event actual experience is worse than the assumptions, additional reserves may be required. This would result in recognition of a loss in the period for which the increase in reserves occurred. Also, see Part II - Item 8, Note 1 of the Consolidated Financial Statements in this report. Liabilities for IUL products are bifurcated into an embedded derivative and a host contract. The embedded derivative is recognized at fair value and is set equal to the fair value of the current call options purchased to hedge the liability. The host contract is measured using the retrospective deposit method which is equal to the account balance.
Results of Operations by Segment for the Three Years Ended December 31, 2020
Consolidated financial results primarily reflect the results of four operating segments as well as the corporate and other line. These segments are defined based on financial information management uses to evaluate performance and to determine the allocation of resources (see Part II - Item 8, Note 1 of this report for a description of changes to our reporting segments).
• Property and Casualty
• Supplemental
• Retirement
• Life
• Corporate and Other
The determination of segment data is described in more detail in Part II - Item 8, Note 18 of the Consolidated Financial Statements in this report. The following sections provide analysis and discussion of results of operations for each of the reporting segments as well as investment results.
Horace Mann Educators Corporation Annual Report on Form 10-K 49

Property and Casualty
2020 net income reflected the following factors:
• Written premiums* and earned premiums reduced by lower new business and $10.2 million of COVID-19 related premium credits
• 8.2 points of improvement in the Property and Casualty underlying loss ratio* driven by lower automobile loss frequency
• 3.3 points of improvement in the reported loss ratio as the lower automobile loss frequency and a $5.2 million property subrogation recovery more than offset a 5.4 point increase from catastrophe losses
• 0.5 point improvement in the expense ratio due to expense reduction initiatives as well as lower levels of spending on travel and other expenses because of COVID-19
• A one-time tax benefit of $2.8 million as a result of the CARES Act
2019 core earnings reflected 12.8 points of improvement in the Property and Casualty combined ratio for the year due to lower catastrophe losses, favorable prior years' reserve development and improved automobile underwriting results compared to 2018. 2018 results included losses from the Camp Fire in California, which was our largest single catastrophe event since Hurricane Katrina in 2005. The Camp Fire generated gross losses of $150.0 million, and, net costs after reinsurance of $37.9 million pretax in 2018.
Written Premiums* andUnderlying Combined Ratio*
($ in millions)
$635.5$683.1 $681.5
81.3%
90.0%92.2%
2020 2019 2018
50 Annual Report on Form 10-K Horace Mann Educators Corporation

The following table provides certain financial information for the Property and Casualty segment for the periods indicated.
($ in millions, unless otherwise indicated) Year Ended December 31, 2020-2019 2019-2018
2020 2019 2018 Change Change
Financial Data:
Written premiums*:
Automobile $ 416.8 $ 461.7 $ 469.9 -9.7% -1.7%
Property and other 218.7 221.4 211.6 -1.2% 4.6%
Total premiums written 635.5 683.1 681.5 -7.0% 0.2%
Change in unearned insurance premiums (14.6) (0.4) 15.8 N.M. -102.5%
Total insurance premiums earned 650.1 683.5 665.7 -4.9% 2.7%
Incurred claims and claims expenses:
Claims occurring in the current year 441.2 483.1 548.0 -8.7% -11.8%
Prior years' reserve development (10.2) (7.5) (0.3) 36.0% N.M.
Total claims and claim expenses incurred 431.0 475.6 547.7 -9.4% -13.2%
Operating expenses, including DAC amortization 171.7 183.6 179.8 -6.5% 2.1%
Underwriting gain (loss) 47.4 24.3 (61.8) 95.1% -139.3%
Net investment income 42.6 41.7 40.1 2.2% 4.0%
Income (loss) before income taxes 91.9 66.7 (20.9) 37.8% N.M.
Net income (loss) 76.5 54.3 (14.3) 40.9% N.M.
Core earnings (loss)* 76.5 54.3 (14.3) 40.9% N.M.
Operating Statistics:
Total Property and Casualty
Loss and loss adjustment expense ratio 66.3 % 69.6 % 82.3 % -3.3 pts -12.7 pts
Expense ratio 26.4 % 26.9 % 27.0 % -0.5 pts -0.1 pts
Combined ratio: 92.7 % 96.5 % 109.3 % -3.8 pts -12.8 pts
Prior years' reserve development -1.6 % -1.1 % — % -0.5 pts -1.1 pts
Catastrophes 13.0 % 7.6 % 17.1 % 5.4 pts -9.5 pts
Underlying combined ratio* 81.3 % 90.0 % 92.2 % -8.7 pts -2.2 pts
Automobile
Loss and loss adjustment expense ratio 61.2 % 70.6 % 76.3 % -9.4 pts -5.7 pts
Expense ratio 26.8 % 27.0 % 26.8 % -0.2 pts 0.2 pts
Combined ratio: 88.0 % 97.6 % 103.1 % -9.6 pts -5.5 pts
Prior years' reserve development -0.5 % -1.2 % — % 0.7 pts -1.2 pts
Catastrophes 1.3 % 1.2 % 1.7 % 0.1 pts -0.5 pts
Underlying combined ratio* 87.2 % 97.6 % 101.4 % -10.4pts -3.8pts
Property
Loss and loss adjustment expense ratio 76.1 % 67.4 % 95.4 % 8.7 pts -28.0 pts
Expense ratio 25.9 % 26.8 % 27.7 % -0.9 pts -0.9 pts
Combined ratio: 102.0 % 94.2 % 123.1 % 7.8 pts -28.9 pts
Prior years' reserve development -3.7 % -0.9 % -0.1 % -2.8 pts -0.8 pts
Catastrophes 35.5 % 21.1 % 50.2 % 14.4 pts -29.1 pts
Underlying combined ratio* 70.2 % 74.0 % 73.0 % -3.8 pts 1.0 pts
Risks in force (in thousands)
Automobile 399 433 463 -7.9% -6.5%
Property 184 194 201 -5.2% -3.5%
Total 583 627 664 -7.0% -5.6%
Horace Mann Educators Corporation Annual Report on Form 10-K 51

Catastrophe costs incurred were as follows:
($ in millions) Year Ended December 31,
2020 2019 2018
Three months ended March 31 $ 8.8 $ 10.8 $ 9.8 June 30 34.7 22.1 26.8 September 30 34.8 14.7 32.2 December 31 6.1 4.4 45.3
Total full year $ 84.4 $ 52.0 $ 114.1
As a result of the emergence of PG&E Corporation and Pacific Gas and Electric Company (together, PG&E) from bankruptcy on July 1, 2020, we recognized favorable prior years' reserve development of $5.2 million pretax, net of reinsurance, as well as return of reinsurance reinstatement premiums of $3.7 million, for a total of $8.9 million, largely related to the 2018 Camp Fire in California.
On a reported basis, the 9.6 points of improvement in the automobile combined ratio in 2020 was mainly attributable to a 10.2 point reduction in the automobile underlying loss ratio*, reflecting lower automobile loss frequency as well as the ongoing benefit of profitability initiatives. We experienced a lower level of automobile loss frequency resulting from temporary changes in policyholder driving patterns due to COVID-19. The average decline in automobile loss frequency experienced in 2020 was approximately 20% lower than in 2019. The reported property combined ratio increased 7.8 points in 2020 due to a 14.4 point increase in catastrophe losses. In 2020, the underlying property loss ratio* improved 2.9 points, primarily due to the return of reinsurance reinstatement premiums of $3.7 million.
In 2020, total written premiums* decreased $47.6 million compared to 2019, primarily due to a reduction in automobile written premiums*. In 2020, average approved rate changes were 0.5% for automobile and 1.0% for property. Growth in sales* slowed in 2020 due to COVID-19.
Automobile written premiums* decreased $44.9 million compared to 2019, primarily due to lower automobile risks in force and a lower level of rate increases implemented as well as $10.2 million of COVID-19 related premium credits. In 2020, the number of automobile risks in force declined and the average written premium per risk and average earned premium per risk declined 2.5% and 1.0%, respectively, compared to 2019. In 2019, automobile premiums written decreased $8.2 million compared to 2018. In 2019, the average written premium per risk and average earned premium per risk increased 4.1% and 5.3%, respectively, compared to 2018. Based on risks in force, the automobile 12 month retention rate for new and renewal risks was 81.2%, 81.1% and 81.9% at December 31, 2020, 2019 and 2018, respectively, with the decrease due to recent rate and underwriting actions. The number of educator risks has been stable relative to overall automobile risks over the past three years as educators represented 85.2%, 85.5% and 85.5% of the automobile risks in force as of December 31, 2020, 2019 and 2018, respectively.
Property and other written premiums* decreased slightly compared to 2019. While the number of property risks in force has declined, the average written premium per risk and average earned premium per risk increased 2.3% and 4.3%, respectively, compared to 2019. In 2019, the average written premium per risk and average earned premium per risk increased 6.2% and 5.4%, respectively, compared to 2018. Based on risks in force, the 12 month retention rate for new and renewal risks was 86.8%, 87.1% and 88.0% at December 31, 2020, 2019 and 2018, respectively. The number of educator risks has been stable relative to overall property risks over the past three years as educators represented 82.6%, 82.5% and 82.6% of the property risks in force as of December 31, 2020, 2019 and 2018, respectively.
The Property and Casualty expense ratio was 26.4%, 26.9% and 27.0% for 2020, 2019 and 2018, respectively.
We continue to evaluate and implement actions to further mitigate our risk exposure. Such actions could include, but are not limited to, non-renewal of property risks, restricted agent geographic placement, limitations on agent new business sales, further tightening of underwriting standards and increased utilization of third-party vendor products.
52 Annual Report on Form 10-K Horace Mann Educators Corporation

Supplemental
The Supplemental segment was formed when we acquired NTA in July 2019.
2020 net income reflected the following factors:
• 12 month contribution to net income compared to a six month contribution in 2019
• Favorable trends in benefits from temporary changes in policyholder behavior due to COVID-19
• Improved investment yield resulting from portfolio repositioning
Insurance Premiums andContract Deposits* and
Benefits Ratio ($ in millions)
$130.3
$65.7
32.8%37.5%
2020 2019
The following table provides certain information for the Supplemental segment for the periods indicated.
($ in millions, unless otherwise indicated) Year Ended December 31, 2020-2019 2019-2018
2020 2019 (1) 2018 (1) Change (1) Change (1)
Financial Data:
Insurance premiums and contract deposits* $ 130.3 $ 65.7 N/A N/A N/AInsurance premiums and contract charges
earned 130.7 65.8 N/A N/A N/A
Net investment income 17.8 7.5 N/A N/A N/A
Benefits and settlement expenses 38.2 21.7 N/A N/A N/A
Operating expenses (includes DAC unlockingand amortization expense) 40.4 20.4 N/A N/A N/A
Intangible asset amortization expense 12.6 6.6 N/A N/A N/A
Income before income taxes 55.1 23.0 N/A N/A N/A
Net income 43.1 18.0 N/A N/A N/A
Core earnings* 43.1 18.0 N/A N/A N/A
Operating Statistics:
Supplemental insurance in force (thousands) 287 297 N/A N/A N/A
Benefits ratio (2) 32.8 % 37.5 % N/A N/A N/A
Operating expense ratio (3) 26.7 % 27.3 % N/A N/A N/A
Pretax profit margin (3) 36.4 % 30.8 % N/A N/A N/A
Persistency 90.5 % 89.3 % N/A N/A N/A(1) The acquisition of NTA closed on July 1, 2019. Twelve month comparisons are not applicable.(2) Benefits ratio measured to earned premium.(3) Operating expense ratio and pretax profit margin measured to total revenues.
In 2020, Supplemental sales* were $7.2 million compared to $8.2 million in 2019, reflecting significantly lower sales volume, primarily due to limited school access because of COVID-19. Persistency was slightly up at 90.5%.
In 2020, Supplemental contributed $43.1 million to net income, reflecting favorable trends in reserves and some short-term benefit from changes in policyholder behavior due to COVID-19. The non-cash impact from
Horace Mann Educators Corporation Annual Report on Form 10-K 53

amortization of intangible assets recognized in connection with the purchase accounting of NTA reduced pretax net income by $12.6 million and $6.6 million in 2020 and 2019, respectively. The pretax profit margin remains above our longer-term expectations because of pandemic-related changes in policyholder behavior.
Retirement
2020 net income reflected the following factors:
• Lower levels of net investment income in 2020, reflecting lower invested asset levels resulting from the prior year annuity reinsurance transaction and subsequent use of capital to purchase NTA, as well as lower returns on limited partnership interests
• $1.8 million pretax of favorable DAC unlocking in 2020 compared to $3.5 million of unfavorable DAC unlocking in 2019 due to accelerated amortization of the DAC asset associated with the reinsured annuity block
• Goodwill and intangible asset impairment charges of $10.0 million in 2020 associated with the BCG acquisition compared to a $28.0 million goodwill impairment charge in 2019 associated with the annuity business due to the reinsurance of the legacy annuity block
Compared to 2018, 2019 net income decreased $46.5 million due to the impacts of the annuity reinsurance transaction coupled with a $28.0 million goodwill impairment charge triggered by the transaction. 2019 core earnings* decreased $18.5 million compared to 2018, reflecting the impact of the annuity reinsurance transaction, which ceded $2.9 billion of fixed and variable reserves (see Part II - Item 8, Note 5 of the Consolidated Financial Statements for further details). 2019 results also include higher operating expenses from the inclusion of BCG.
Annuity Assets Under Management andAnnualized Net Interest Spread on Fixed
Annuities ($ in millions)
$4,841.8$4,379.6
$6,713.3
212
194
171
2020 2019 2018
54 Annual Report on Form 10-K Horace Mann Educators Corporation

The following table provides certain information for the Retirement segment for the periods indicated.
($ in millions, unless otherwise indicated) Year Ended December 31, 2020-2019 2019-2018
2020 2019 2018 Change Change
Financial Data:
Contract charges earned $ 29.7 $ 29.1 $ 31.2 2.1% -6.7% Net investment income 132.5 174.7 262.6 -24.2% -33.5%
Interest credited 58.6 93.6 161.1 -37.4% -41.9%
Net interest margin without netinvestment gains (losses) 73.9 81.1 101.5 -8.9% -20.1%
Net interest margin - Reinsured block (3.6) (3.4) — -5.9% N.M.Mortality loss and other reserve charges (5.3) (5.3) (7.6) —% 30.3%
Operating expenses 60.3 60.5 57.3 -0.3% 5.6%
DAC and intangible asset amortization expense,excluding DAC unlocking 18.5 18.0 19.2 2.8% -6.3%
DAC unlocking (1.8) 3.5 3.9 N.M. -10.3%
Other expenses - goodwill and intangible asset impairments 10.0 28.0 — N.M. N.M.
Income (loss) before income taxes 22.2 (1.8) 51.7 N.M. -103.5% Net income (loss) 20.1 (4.8) 41.7 N.M. -111.5% Core earnings* 28.2 23.2 41.7 21.6% -44.4%
Operating Statistics:
Annuity contract deposits*Variable $ 226.2 $ 217.3 $ 205.8 4.1% 5.6% Fixed 257.2 245.2 233.3 4.9% 5.1%
Total 483.4 462.5 439.1 4.5% 5.3% Single 260.9 256.6 234.2 1.7% 9.6% Recurring 222.5 205.9 204.9 8.1% 0.5%
Total 483.4 462.5 439.1 4.5% 5.3% Assets under administration (AUA)
Annuity assets under management (1) $ 4,841.8 4,379.6 6,713.3 10.6% -34.8%
Broker and advisory assetsunder administration (2) 2,324.1 2,391.8 330.3 -2.8% N.M.
Recordkeeping assets under administration (2) 1,518.1 1,499.2 — 1.3% N.M.Total 8,684.0 8,270.6 7,043.6 5.0% 17.4%
PersistencyVariable annuities 95.0 % 94.7 % 94.4 % 0.3 pts 0.3pts Fixed annuities 94.7 % 94.0 % 94.0 % 0.7 pts —pts
Total 94.8 % 94.3 % 94.1 % 0.5pts 0.2pts Annuity contracts in force (thousands) 230 229 226 0.4% 1.3%
Fixed spread - YTD annualized (basis points) 212 194 171 18 bps 23 bps(1) Amount reported as of December 31, 2020 excludes $752.1 million of assets under management held under modified coinsurance
reinsurance.(2) 2019 includes the results of BCG acquired on January 2, 2019.
For 2020, Retirement segment net income reflected an after-tax impairment charge of $8.1 million for goodwill and intangible assets associated with BCG due to lower than anticipated BCG wealth management sales outside of the education markets. Operational benefits from the BCG acquisition remain on track. In 2019, we impaired $28.0 million of goodwill that had been associated with the annuity business due to the reinsurance of the legacy annuity block.
For 2020, annuity contract deposits* increased $20.9 million compared to 2019. Variable and fixed annuity deposits increased $8.9 million and $12.0 million, respectively, as educators continue to find value in our retirement savings products, including our competitively priced annuity products. Compared to 2018, variable and fixed annuity deposits increased $11.5 million and $11.9, respectively.
Horace Mann Educators Corporation Annual Report on Form 10-K 55

At December 31, 2020, annuity assets under management were $462.2 million above a year ago, driven primarily by positive net inflows and market appreciation. Assets under administration, which includes broker and advisory as well as recordkeeping assets added through the acquisition of BCG in 2019, were up 5.0% from December 31, 2019. The full-year 2020 annualized net interest spread on fixed annuities, excluding reinsurance, increased 18 basis points, reflecting the benefits of the 2019 annuity reinsurance transaction.
We actively manage our interest rate risk exposure, considering a variety of factors, including earned interest rates, credited interest rates and the relationship between the expected durations of assets and liabilities. We estimate that over the next 12 months approximately $562.4 million of the combined Retirement and Life investment portfolio and related investable cash flows will be reinvested at current market rates. As interest rates remain at low levels, borrowers may prepay or redeem the securities with greater frequency in order to borrow at lower market rates, which could increase investable cash flows and exacerbate the reinvestment risk.
As a general guideline, for a 100 basis point decline in the average reinvestment rate and based on our existing policies and investment portfolio, the impact from investing in that lower interest rate environment could further reduce Retirement net investment income by approximately $2.1 million in year one and $6.4 million in year two, further reducing the annualized net interest spread by approximately 7 basis points and 21 basis points in the respective periods, compared to the current period annualized net interest spread. We could also consider potential changes in rates credited to policyholders, tempered by any restrictions on the ability to adjust policyholder rates due to minimum guaranteed crediting rates.
The expectation for future annualized net interest spreads is also an important component in the amortization of DAC. In terms of the sensitivity of this amortization to the annualized net interest spread, based on DAC as of December 31, 2020 and assuming all other assumptions are met, a 10 basis point deviation in the current year targeted annualized net interest rate spread assumption would impact amortization between $0.3 million and $0.4 million. This result may change depending on the magnitude and direction of any actual deviations but represents a range of reasonably likely experience for the noted assumption.
Because of the annuity reinsurance transaction, the spread in our retained annuity business is achieving our targeted returns and new business is priced to do so as well. Information regarding the interest crediting rates and balances equal to the minimum guaranteed rate for deferred annuity account values is shown below.
($ in millions) December 31, 2020
Deferred Annuities at
Total Deferred Annuities Minimum Guaranteed Rate
Percentof Total
AccumulatedValue (AV)
Percent ofTotal DeferredAnnuities AV
Percentof Total
AccumulatedValue
Minimum guaranteed interest rates:
Less than 2% 54.5 % $ 1,356.0 54.6 % 40.6 % $ 740.9
Equal to 2% but less than 3% 11.6 288.8 83.2 13.2 240.4
Equal to 3% but less than 4% 25.0 622.0 99.9 34.1 621.5
Equal to 4% but less than 5% 6.9 170.7 100.0 9.4 170.7
5% or higher 2.0 49.9 100.0 2.7 49.9
Total 100.0 % $ 2,487.4 73.3 % 100.0 % $ 1,823.4
We will continue to be disciplined in executing strategies to mitigate the negative impact on profitability of a sustained low interest rate environment. However, the success of these strategies may be affected by the factors discussed in Part I - Item 1A and other factors of this report.
56 Annual Report on Form 10-K Horace Mann Educators Corporation

Life
For 2020, net income decreased $7.2 million compared to 2019, reflecting higher mortality costs and lower net investment income. For 2019, net income decreased $1.2 million compared to 2018, reflecting lower net investment income and higher expenses partially offset by lower mortality costs.
The ordinary life insurance in force lapse ratio was 4.2%, 4.6% and 4.6% for 2020, 2019 and 2018, respectively.
The following table provides certain information for the Life segment for the periods indicated.
Insurance Premiums andContract Deposits* and
Mortality Costs ($ in millions)
$110.1 $113.2 $114.4
$38.8 $33.5 $35.1
Premiums & contract deposits
Mortality costs
2020 2019 2018
($ in millions, unless otherwise indicated) Year Ended December 31, 2020-2019 2019-2018
2020 2019 2018 Change Change
Financial Data:
Insurance premiums and contract deposits* $ 110.1 $ 113.2 $ 114.4 -2.7% -1.0% Insurance premiums and contract charges earned 120.2 119.6 120.4 0.5% -0.7% Net investment income 69.8 72.0 74.4 -3.1% -3.2% Benefits and settlement expenses 89.7 79.5 82.3 12.8% -3.4% Interest credited 44.9 45.0 45.1 -0.2% -0.2% DAC amortization expense, excluding unlocking 7.7 8.1 7.3 -4.9% 11.0% DAC unlocking (0.3) (0.3) 0.3 —% N.M.Operating expenses 35.3 37.9 36.4 -6.9% 4.1% Income before income taxes 12.9 21.8 23.7 -40.8% -8.0% Net income 10.4 17.6 18.8 -40.9% -6.4% Core earnings* 10.4 17.6 18.8 -40.9% -6.4%
Operating Statistics:
Life insurance in force $ 19,821 $ 19,180 $ 18,278 3.3% 4.9% Number of policies in force* (in thousands) 202 201 199 0.5% 1.0% Average face amount in force (in dollars) $ 98,434 $ 95,488 $ 92,073 3.1% 3.7% Lapse ratio (ordinary life insurance in force) 4.2 % 4.6 % 4.6 % -0.4pts —pts
Mortality costs $ 38.8 $ 33.5 $ 35.1 15.8% -4.6%
Horace Mann Educators Corporation Annual Report on Form 10-K 57

Corporate and Other
The following table provides certain financial information for Corporate and Other for the periods indicated.
($ in millions) Year Ended December 31, 2020-2019 2019-2018
2020 2019 2018 Change % Change %
Interest expense $ 14.8 $ 14.3 $ 11.9 3.5% 20.2%
Net investment gains (losses) pretax (2.3) 153.3 (12.5) N.M. N.M.
Tax on net investment gains (losses) (0.6) 33.1 (2.4) N.M. N.M.
Net investment gains (losses) after tax (1.7) 120.2 (10.1) N.M. N.M.
Net income (loss) (16.8) 99.3 (27.9) -116.9% N.M.
Core earnings (loss)* (15.1) (20.9) (17.8) 27.8% -17.4%
Net income in 2020 decreased from the prior year primarily due to recognition of a $106.9 million after tax realized investment gain in 2019 with respect to the transfer of investments as consideration with the annuity reinsurance transaction. In 2019, core earnings* decreased $3.1 million compared to 2018, driven by increased interest expense as we utilized our senior revolving credit facility on July 1, 2019 to partially fund the acquisition of NTA.
Investment Results
Our investment strategy is primarily focused on generating income to support product liabilities and balances principal protection and risk. Total net investment income includes net investment income from our investment portfolio as well as accreted investment income from the deposit asset on reinsurance related to our reinsured block of approximately $2.9 billion of policy liabilities related to legacy individual annuities written in 2002 or earlier that was effective April 1, 2019.
($ in millions)Year Ended December 31, 2020-2019 2019-2018
2020 2019 2018 Change % Change %
Net investment income - investment portfolio $ 260.3 $ 294.3 $ 376.5 -11.6 % -21.8 %
Investment income - deposit asset on reinsurance 97.3 70.8 — 37.4 % N.M.
Total net investment income 357.6 365.1 376.5 -2.1 % -3.0 %
Pretax net investment gains (losses) (2.3) 153.3 (12.5) N.M. N.M.
Pretax net unrealized investment gains on securities 556.7 334.7 141.4 66.3 % 136.7 %
For 2020, net investment income from our investment portfolio decreased $34.0 million compared to 2019 for two reasons. First, we had a smaller invested asset base for full-year 2020. In 2019, the invested asset base was higher in the first quarter, prior to the transfer of $2.1 billion of invested assets as part of the annuity reinsurance transaction. Second, market weakness in early 2020 resulted in lower full-year returns from limited partnership interests.
For 2019, net investment income from our investment portfolio was $82.2 million below 2018 because of the transfer of invested assets. In addition, interest rates declined significantly in 2019 and our yield on new investments also reflected a strategic decision to further improve the quality of our investment portfolio. This was partially offset by stronger returns on alternative investments and increased prepayment activity.
For 2020, pretax net unrealized investment gains on fixed maturity securities were up $222.0 million compared to 2019, reflecting U.S. Treasury rates that declined 101 basis points with mostly flat investment grade credit spreads. For 2019, pretax net unrealized investment gains on fixed maturity securities were up $193.3 million compared to 2018, reflecting U.S. Treasury rates that declined 76 basis points and tighter credit spreads across most asset classes.
58 Annual Report on Form 10-K Horace Mann Educators Corporation

Fixed Maturity and Equity Securities PortfoliosThe table below presents our fixed maturity securities portfolio by major asset class, including the ten largest sectors of our corporate bond holdings (based on fair value) as well as our equity securities portfolio.
($ in millions) December 31, 2020
Number ofIssuers
FairValue
AmortizedCost or
Cost
Pretax NetUnrealizedGain (Loss)
Fixed maturity securities
Corporate bonds
Banking and Finance 144 $ 487.9 $ 437.5 $ 50.4
Insurance 49 190.0 164.0 26.0
Energy (1) 74 181.9 163.3 18.6
Healthcare,Pharmacy 79 155.0 137.7 17.3
Real Estate 35 118.5 110.5 8.0
Transportation 46 104.8 95.7 9.1
Miscellaneous 25 99.0 98.0 1.0
Technology 42 96.0 87.6 8.4
Utilities 59 93.2 79.9 13.3
Food and Beverage 34 82.2 69.0 13.2
All other corporates (2) 337 514.4 462.0 52.4
Total corporate bonds 924 2,122.9 1,905.2 217.7
Mortgage-backed securities
U.S. Government and federally sponsored agencies 267 468.4 419.2 49.2
Commercial (3) 125 343.4 309.7 33.7
Other 40 53.6 53.7 (0.1)
Municipal bonds (4) 594 1,827.5 1,612.3 215.2
Government bonds
U.S. 37 433.2 395.1 38.1
Foreign 7 45.1 40.2 4.9
Collateralized loan obligations (5) 153 689.7 693.1 (3.4)
Asset-backed securities 110 361.5 360.1 1.4
Total fixed maturity securities 2,257 $ 6,345.3 $ 5,788.6 $ 556.7
Equity securities
Non-redeemable preferred stocks 23 $ 90.7
Common stocks 91 7.9
Closed-end fund 1 23.0
Total equity securities 115 $ 121.6
Total 2,372 $ 6,466.9 (1) At December 31, 2020, the fair value amount included $15.6 million which were non-investment grade.(2) The All Other Corporates category contains 19 additional industry classifications. Broadcasting and media, telecommunications, consumer
products, metal and mining, and industry manufacturing represented $243.2 million of fair value at December 31, 2020, with the remaining 14 classifications each representing less than $218.7 million.
(3) At December 31, 2020, 100% were investment grade, with an overall credit rating of AA+, and the positions were well diversified by property type, geography and sponsor.
(4) Holdings are geographically diversified, 51.9% are tax-exempt and 76.9% are revenue bonds tied to essential services, such as mass transit, water and sewer. The overall credit quality of the municipal bond portfolio was AA- at December 31, 2020.
(5) Based on fair value, 94.1% of the collateralized loan obligation securities were rated investment grade by Standard & Poor's Global Inc. (S&P), Moody's Investors Service, Inc. (Moody's) and/or Fitch Ratings, Inc. (Fitch) at December 31, 2020.
Horace Mann Educators Corporation Annual Report on Form 10-K 59

At December 31, 2020, our diversified fixed maturity securities portfolio consisted of 3,558 investment positions, issued by 2,257 entities, and totaled approximately $6.3 billion in fair value. This portfolio was 91.4% investment grade, based on fair value, with an average credit quality rating of A+. Our investment guidelines generally limit single corporate issuer concentrations to 0.5% of invested assets for AA or AAA rated securities, 0.35% of invested assets for A or BBB rated securities, and 0.2% of invested assets for non-investment grade securities.
Fixed Maturity Securities - COVID-19 Related ImpactsIn late 2016, we determined the economy was approaching later stages of the credit cycle and began to upgrade portfolio quality. Over the past three years, recessionary expectations were extended due to the fiscal stimulus, which lengthened the credit cycle. In 2019, we determined that we had achieved our investment initiatives and the portfolio was well positioned for any dislocation in the markets.
That proactive effort to improve portfolio quality resulted in a significant reduction in BBB-rated corporate credit, high yield and below-investment-grade structured securities. During this same period, purchases focused on government agency and agency mortgage-backed securities and high quality corporate bonds and municipal securities. Today, that proactive flight to quality has our investment portfolio in all insurance subsidiaries well positioned for market disruptions with ample liquidity.
Further, we believe our investment portfolio is well positioned to withstand an extended period of elevated investment market volatility, and have relatively modest exposure to asset sectors that we expect to be most impacted by the public health response to COVID-19. While we expect other segments of the economy may be disrupted, we believe these effects could be most acute in the sectors listed below. These sectors have experienced more pronounced price dislocation due to their perceived exposure to COVID-19 related impacts. Exposure to these sectors totals 7.4% of our investment portfolio, and as of December 31, 2020, informed by extensive stress testing and portfolio review, we continue to hold the following securities:
($ in millions) December 31, 2020
Number of Issuers Fair Value
AmortizedCost or
Cost
Pretax Net UnrealizedInvestment
Gains (Losses)
Average CreditQuality
Fixed maturity securities (1)
Travel and leisure 61 $ 132.5 $ 127.9 $ 4.6 A-
Energy-related 88 180.3 158.8 21.5 BBB+
Retail 30 74.8 69.7 5.1 A-
Aircraft 61 151.3 163.8 (12.5) BBB+
Total fixed maturity securities 240 $ 538.9 $ 520.2 $ 18.7 BBB+(1) Below investment grade and non-rated securities included in this population account for $40.2 million of amortized cost, $40.5 million of fair
value, and $0.3 million of net unrealized investment gains. There are 97 issuers with an average rating of BB-. The majority of these securities are concentrated in the travel and leisure and retail sectors.
60 Annual Report on Form 10-K Horace Mann Educators Corporation

Rating of Fixed Maturity Securities and Equity Securities (1)
The following table presents the composition and fair value of our fixed maturity and equity securities portfolios by rating category. At December 31, 2020, 90.9% of these combined portfolios were investment grade, based on fair value, with an overall average credit quality rating of A+. We have classified the entire fixed maturity securities portfolio as available for sale, which is carried at fair value.
($ in millions) December 31, 2020
Percentof Total
FairValue
FairValue
AmortizedCost or Cost
Fixed maturity securities
AAA 11.6 % $ 733.3 $ 706.4
AA (2) 40.0 2,538.9 2,282.7 A 18.7 1,186.0 1,062.4 BBB 21.2 1,343.8 1,209.3 BB 2.4 153.3 146.4 B 1.1 73.1 71.6 CCC or lower 0.1 5.1 5.5
Not rated (3) 4.9 311.8 304.3 Total fixed maturity securities 100.0 % $ 6,345.3 $ 5,788.6
Equity securities
AAA — — AA — — A 0.7 % $ 0.8 BBB 62.2 75.7 BB 10.9 13.2 B — — CCC or lower — — Not rated 26.2 31.9
Total equity securities 100.0 % $ 121.6
Total $ 6,466.9 (1) Ratings are as assigned primarily by S&P when available, with remaining ratings as assigned on an equivalent basis by Moody's or Fitch.
Ratings for publicly traded securities are determined when the securities are acquired and are updated monthly to reflect any changes in ratings.
(2) At December 31, 2020, the AA rated fair value amount included $429.3 million of U.S. Government and federally sponsored agency securities and $669.0 million of mortgage-backed and asset-backed securities issued by U.S. Government and federally sponsored agencies.
(3) This category primarily represents private placement and municipal securities not rated by either S&P, Moody's or Fitch.
At December 31, 2020, the fixed maturity securities portfolio had $28.4 million of pretax gross unrealized investment losses on $985.2 million of fair value related to 431 positions. Of the investment positions with gross unrealized investment losses, there were 21 securities trading below 80.0% of the carrying value at December 31, 2020.
We view the unrealized investment losses of all of the securities at December 31, 2020 as temporary. Future changes in circumstances related to these and other securities could require subsequent recognition of OTTI.
Horace Mann Educators Corporation Annual Report on Form 10-K 61

Liquidity and Financial Resources
Off-Balance Sheet Arrangements
At December 31, 2020, 2019 and 2018, we did not have any relationships with unconsolidated entities or financial partnerships, such as entities often referred to as structured finance or special purpose entities, which would have been established for the purpose of facilitating off-balance sheet arrangements or for other contractually narrow or limited purposes. As such, we are not exposed to any financing, liquidity, market or credit risk that could arise if we had engaged in such relationships as of December 31, 2020.
Investments
Information regarding our investment portfolio, which is comprised primarily of investment grade, fixed maturity securities, is presented in Part II - Item 7, Results of Operations by Segment for the Three Years Ended December 31, 2020, Part I - Item 1, Investments and in Part II - Item 8, Note 2 of the Consolidated Financial Statements in this report.
Cash Flow
Our short-term liquidity requirements, within a 12 month operating cycle, are for the timely payment of claims and benefits to policyholders, operating expenses, interest payments and federal income taxes. Cash flow generated from operations has been, and is expected to be, adequate to meet our operating cash needs in the next 12 months. Cash flow in excess of operational needs has been used to fund business growth, pay dividends to shareholders and repurchase shares of our common stock. Long-term liquidity requirements, beyond one year, are principally for the payment of future insurance and annuity policy claims and benefits, as well as retirement of debt. The following table summarizes our consolidated cash flows activity for the periods indicated.
($ in millions) Year Ended December 31, 2020-2019 2019-2018
2020 2019 2018 Change % Change %
Net cash provided by operating activities $ 259.8 $ 127.6 $ 200.9 103.6% -36.5%
Net cash (used in) provided by investing activities (406.8) 55.9 (186.5) N.M. 130.0%
Net cash provided by (used in) financing activities 143.8 (169.9) (10.1) N.M. N.M.
Net (decrease) increase in cash (3.2) 13.6 4.3 N.M. N.M.
Cash at beginning of period 25.5 11.9 7.6 114.3% 56.6%
Cash at end of period $ 22.3 $ 25.5 $ 11.9 -12.5% 114.3%
Operating ActivitiesAs a holding company, we conduct our principal operations in the personal lines portion of the property and casualty, supplemental and life insurance industries through our subsidiaries. Our insurance subsidiaries generate cash flow from premium and investment income, generally well in excess of their immediate needs for policy obligations, operating expenses and other cash requirements. Cash provided by operating activities primarily reflects net cash flows generated by the insurance subsidiaries.
For 2020, net cash provided by operating activities increased $132.2 million compared to 2019, primarily due to lower claims paid on insurance policies in the current year partially offset by lower investment income collected as a result of a $2.1 billion reduction of invested assets from investments transferred under the annuity reinsurance transaction in the second quarter of 2019.
Investing ActivitiesOur insurance subsidiaries maintain significant investments in fixed maturity securities to meet future contractual obligations to policyholders. In conjunction with our management of liquidity and other asset/liability management objectives, we, from time to time, will sell fixed maturity securities prior to maturity, and reinvest the proceeds into other investments with different interest rates, maturities or credit characteristics. Accordingly, we have classified the entire fixed maturity securities portfolio as available for sale.
62 Annual Report on Form 10-K Horace Mann Educators Corporation

Financing ActivitiesFinancing activities include primarily payment of dividends, receipt and withdrawal of funds by annuity contractholders, issuances and repurchases of our common stock, fluctuations in book overdraft balances, and borrowings, repayments and repurchases related to debt facilities.
For 2020, net cash provided by financing activities increased $313.7 million compared to 2019, primarily due to cash inflows of $95.5 million from advances received under FHLB funding agreements in 2020 compared to net cash outflows of $130.0 million from advances received and principal repayments made under FHLB funding agreements in 2019.
The following table shows activity from FHLB funding agreements for the periods indicated.
($ in millions) Year Ended December 31,
2020 2019 Change $ Change %
Balance at beginning of the year $ 495.0 $ 625.0
Advances received from FHLB funding agreements 95.5 175.0
Principal repayment on FHLB funding agreements — (305.0)
Balance at end of the year $ 590.5 $ 495.0 $ 95.5 19.3%
Contractual Obligations
The following table reflects our contractual obligations, as well as the projected timing of payments.
($ in millions) Payments Due By Period as of December 31, 2020
Total
Less Than1 Year(2021)
1 - 3 Years(2022 and
2023)
3 - 5 Years(2024 and
2025)
More Than5 Years
(2026 andbeyond)
Fixed annuities and fixed optionof variable annuities (1) $ 3,384.8 $ 170.3 $ 349.7 $ 344.9 $ 2,519.9
Payout annuity contracts (1)(2) 921.0 103.5 157.4 220.1 440.0
Supplemental and life insurance policies (1) 3,668.9 158.0 328.1 323.6 2,859.2
Property and Casualty claims and claimadjustment expenses (1) 259.3 167.5 84.8 7.0 —
Short-term debt obligations,Bank Credit Facility(expires June 21, 2024) (3) 141.6 1.9 3.8 135.9 —
Long-term debt obligations,FHLB borrowings due May 2021 and October and December 2022 (4) 54.4 4.2 50.2 — —
Long-term debt obligationsSenior Notes due December 1, 2025 (3) 306.3 11.3 22.5 272.5 —
Operating lease obligations (5) 14.6 4.3 7.6 2.7 —
Total $ 8,750.9 $ 621.0 $ 1,004.1 $ 1,306.7 $ 5,819.1 (1) This information represents estimates of both the amounts to be paid to policyholders and the timing of such payments and is net of
anticipated reinsurance recoveries.(2) Includes $590.5 million obligation for FHLB funding agreements plus interest.(3) Includes principal and interest.(4) Includes $54.0 million obligation for FHLB borrowings plus interest.(5) We have entered into various operating lease agreements, primarily for real estate offices.
Estimated Future Policy Benefit and Claim Payments - Supplemental, Retirement and LifeThis discussion addresses the following contractual obligations disclosed above: fixed annuities and fixed option of variable annuities, payout annuity contracts and supplemental and life insurance policies. Payment amounts reflect our estimate of undiscounted future cash flows related to these obligations and commitments. Balance sheet amounts were determined in accordance with GAAP, including the effect of discounting, and consequently in many cases differ significantly from the summation of undiscounted cash flows.
Horace Mann Educators Corporation Annual Report on Form 10-K 63

For the majority of our Retirement and Life insurance operations, the estimated contractual obligations for future policyholder benefits as presented in the table above were derived from the annual cash flow testing analysis used to develop actuarial opinions of statutory reserve adequacy for state regulatory purposes. These cash flows are materially representative of the future cash flows under GAAP. Actual amounts may vary, potentially in a significant manner, from the amounts indicated due to deviations between assumptions and actual results and the addition of new business in future periods.
For the majority of our Supplemental insurance operations, the estimated contractual obligations for future policyholder benefits as presented in the table above were derived from future projections of the business developed as part of the purchase accounting associated with the acquisition of NTA.
Amounts presented in the table above represent the estimated cash payments to be made to policyholders undiscounted by interest and including assumptions related to the receipt of future premiums and deposits, future interest credited, full and partial withdrawals, policy lapses, surrender charges, annuitization, mortality, morbidity, and other contingent events as appropriate to the respective product types. Additionally, coverage levels are assumed to remain unchanged from those provided under contracts in force at December 31, 2020. Separate Account (variable annuity) payments are not reflected due to the matched nature of these obligations and the fact that the contract owners maintain the investment risk on such deposits.
See Part II - Item 8, Note 1 of the Consolidated Financial Statements in this report for a description of our methods for establishing supplemental, life and annuity reserves in accordance with GAAP.
Estimated Claims and Claim Adjustment Expenses - Property and CasualtyThis discussion addresses claims and claim adjustment expenses as disclosed above. The amounts reported in the table are presented on a nominal basis, have not been discounted and represent the estimated timing of future payments for both reported and unreported claims incurred and related claim adjustment expenses. Both the total liability and the estimated payments are based on actuarial projection techniques, at a given reporting date. These estimates include assumptions of the ultimate settlement and administrative costs based on our assessment of facts and circumstances then known, review of historical settlement patterns, estimates of trends in claims severity, frequency and other factors. Variables in the reserve estimation process can be affected by both internal and external events, such as changes in claims handling procedures, economic inflation, legal trends and legislative changes. Many of these items are not directly quantifiable, particularly on a prospective basis. Additionally, there may be significant reporting lags between the occurrence of a claim and the time it is actually reported to us. The future cash flows related to the items contained in the table above required estimation of both amount (including severity considerations) and timing. Amount and timing are frequently estimated separately. An estimation of both amount and timing of future cash flows related to claims and claim adjustment expenses is generally reliable only in the aggregate with some unavoidable estimation uncertainty.
64 Annual Report on Form 10-K Horace Mann Educators Corporation

Liquidity Sources and Uses
Our potential sources and uses of funds principally include the following activities:
Property and Casualty Supplemental Retirement Life
Corporate and Other
Activities for potential sources of funds
Receipt of insurance premiums, contractholder charges and fees ☑ ☑ ☑ ☑
Recurring service fees, commissions and overrides ☑ ☑ ☑ ☑ ☑
Contractholder fund deposits ☑ ☑ ☑Reinsurance and indemnification program recoveries
☑ ☑ ☑ ☑Receipts of principal, interest and dividends on investments
☑ ☑ ☑ ☑ ☑Sales of investments ☑ ☑ ☑ ☑ ☑Funds from FHLB and line of credit agreements ☑ ☑ ☑ ☑ ☑
Intercompany loans ☑ ☑ ☑ ☑ ☑Capital contributions from parent ☑ ☑ ☑ ☑Dividends or return of capital from subsidiaries
☑Tax refunds/settlements ☑ ☑ ☑ ☑ ☑Funds from periodic issuance of additional securities
☑Proceeds from debt issuances ☑Receipt of intercompany settlements related to employee benefit plans
☑
Activities for potential uses of funds
Payment of claims and related expenses
☑ ☑ ☑ ☑Payment of contract benefits, surrenders and withdrawals
☑ ☑ ☑Reinsurance cessions and indemnification program payments
☑ ☑ ☑ ☑Operating costs and expenses ☑ ☑ ☑ ☑ ☑Purchase of investments ☑ ☑ ☑ ☑ ☑Repayment of FHLB and line of credit agreements
☑ ☑ ☑ ☑ ☑Payment or repayment of intercompany loans
☑ ☑ ☑ ☑ ☑Capital contributions to subsidiaries ☑Dividends or return of capital to shareholders/parent company
☑ ☑ ☑ ☑ ☑Tax payments/settlements ☑ ☑ ☑ ☑ ☑Common share repurchases ☑Debt service expenses and repayment
☑Payments related to employee benefit plans
☑Payments for acquisitions ☑
Horace Mann Educators Corporation Annual Report on Form 10-K 65

We actively manage our financial position and liquidity levels in light of changing market, economic and business conditions. Liquidity is managed at both the entity and enterprise level across HMEC and is assessed on both base and stressed level liquidity needs. We believe we have sufficient liquidity to meet these needs. Additionally, we have existing intercompany agreements in place that facilitate liquidity management across HMEC to enhance flexibility.
As of December 31, 2020, we held $1.1 billion of cash, U.S. government and agency fixed maturity securities and public equity securities (excluding non-redeemable preferred stocks and foreign equity securities) which, under normal market conditions, could be rapidly liquidated.
Certain remote events and circumstances could constrain our liquidity. Those events and circumstances include, for example, a catastrophe resulting in extraordinary losses, a downgrade of our Senior Notes rating to non-investment grade status or a downgrade in our insurance subsidiaries' financial strength ratings. The rating agencies also consider the interdependence of our individually rated entities; therefore, a rating change in one entity could potentially affect the ratings of other related entities.
Capital Resources
We have determined the amount of capital which is needed to adequately fund and support business growth, primarily based on risk-based capital formulas including those developed by the NAIC. Historically, our insurance subsidiaries have generated capital in excess of such needed levels. These excess amounts have been paid to us through dividends. We have then utilized these dividends and our access to the capital markets to service and retire debt, pay dividends to our shareholders, fund growth initiatives, repurchase shares of our common stock and for other corporate purposes. If necessary, we also have other potential sources of liquidity that could provide for additional funding to meet corporate obligations or pay shareholder dividends, which include a revolving line of credit, as well as issuances of various securities. The insurance subsidiaries are subject to various regulatory restrictions which limit the amount of annual dividends or other distributions, including loans or cash advances, available to us without prior approval of the insurance regulatory authorities. The aggregate amount of dividends that may be paid in 2021 from all of our insurance subsidiaries without prior regulatory approval is $248.7 million, excluding the impact and timing of prior year dividends, of which $155.0 million was paid during the year ended December 31, 2020. We anticipate that our sources of capital will continue to generate sufficient capital to meet the needs for business growth, debt interest payments, shareholder dividends and our share repurchase program. Additional information is contained in Part II - Item 8, Note 13 of the Consolidated Financial Statements in this report.
Total capital was $2,227.4 million at December 31, 2020, including $437.3 million of short-term and long-term debt. Total debt represented 19.6% of total capital including net unrealized investment gains on fixed maturity securities (23.5% of total capital excluding net unrealized investment gains on fixed maturity securities*) at December 31, 2020, which was below our long-term target of 25.0%.
Shareholders' equity was $1,790.1 million at December 31, 2020, including net unrealized investment gains on fixed maturity securities of $366.3 million after taxes and the related impact of DAC associated with annuity contracts and life insurance products with account values. The market value of our common stock and the market value per share were $1,741.1 million and $42.04, respectively, at December 31, 2020. Book value per share was $43.22 at December 31, 2020 ($34.38 excluding net unrealized investment gains on fixed maturity securities*).
Additional information regarding net unrealized investment gains on fixed maturity securities at December 31, 2020 is included in Part II - Item 7, Results of Operations by Segment for the Three Years Ended December 31, 2020 and Part II - Item 8, Note 2 of the Consolidated Financial Statements in this report.
66 Annual Report on Form 10-K Horace Mann Educators Corporation

Total shareholder dividends paid were $49.6 million for the year ended December 31, 2020. In March, May, September and December 2020, the Board declared regular quarterly dividends of $0.30 per share. Compared to the full year per share dividends paid in 2019 of $1.15, the total 2020 dividends paid per share of $1.20 represented an increase of 4.3%.
On September 30, 2015, the Board authorized a share repurchase program allowing repurchases of up to $50.0 million of HMEC's common stock, par value $0.001 (Program). The Program authorizes the repurchase of common shares in open market or privately negotiated transactions, from time to time, depending on market conditions. The Program does not have an expiration date and may be limited or terminated at any time without notice. During 2020, we repurchased 52,095 shares our common stock at an average price per share of $41.17 under the Program. In total and through December 31, 2020, 899,468 shares have been repurchased under the Program at an average price of $32.68 per share. The repurchase of shares was funded through use of cash. As of December 31, 2020, $20.6 million remained authorized for future share repurchases under the Program.
The following table summarizes our debt obligations.
($ in millions) EffectiveInterestRates
FinalMaturity
December 31,
2020 2019
Short-term debtBank Credit Facility Variable 2024 $ 135.0 $ 135.0
Long-term debt (1)
4.50% Senior Notes, Aggregate principal amount of$250.0 less unaccrued discount of $0.4 and $0.4 and unamortized debt issuance costsof $1.3 and $1.5 4.50% 2025 248.3 248.0
Federal Home Loan Bank borrowing 0.44% 2022 54.0 50.0 Total $ 437.3 $ 433.0
(1) We designate our debt obligations as "long-term" based on maturity date at issuance.
As of December 31, 2020, we had outstanding $250.0 million aggregate principal amount of 4.50% Senior Notes (Senior Notes), which mature on December 1, 2025, issued at a discount resulting in an effective yield of 4.53%. Interest on the Senior Notes is payable semi-annually at a rate of 4.50%. Detailed information regarding the redemption terms of the Senior Notes is contained in Part II - Item 8, Note 9 of the Consolidated Financial Statements in this report. The Senior Notes are traded in the open market (HMN 4.50).
As of December 31, 2020, we had $54.0 million of borrowings outstanding with FHLB. The Board has authorized a maximum amount equal to 15% of net aggregate admitted assets less separate account assets of the insurance subsidiaries for FHLB borrowing and funding agreements which is below our maximum FHLB borrowing capacity. For the total $54.0 million received, $4.0 million matures on May 17, 2021, $25.0 million matures on October 5, 2022 and $25.0 million matures on December 2, 2022. Interest on the borrowings accrue at an annual weighted average rate of 0.44% as of December 31, 2020. The $54.0 million of FHLB borrowings is reported as Long-term debt in the Consolidated Balance Sheets.
On June 21, 2019, we, as borrower, replaced our current line of credit with a new five-year Credit Agreement (Bank Credit Facility). The new Bank Credit Facility increased the amount available on this senior revolving credit facility to $225.0 million from $150.0 million. PNC Capital Markets, LLC and JPMorgan Chase Bank, N.A. served as joint leads on the new agreement, with The Northern Trust Company, U.S. Bank National Association, KeyBank National Association, Comerica Bank and Illinois National Bank participating in the syndicate. Terms and conditions of the new Bank Credit Facility are substantially consistent with the prior agreement, with an interest rate based on LIBOR plus 115 basis points.
On July 1, 2019, we utilized our senior revolving credit facility to partially fund the acquisition of NTA. As of December 31, 2020, the amount outstanding on the senior revolving credit facility was $135.0 million. The unused portion of the Bank Credit Facility is subject to a variable commitment fee, which was 0.15% on an annual basis at December 31, 2020.
To provide additional capital management flexibility, we filed a "universal shelf" registration statement on Form S-3 with the SEC on March 13, 2018. The registration statement, which registered the offer and sale from time to time of an indeterminate amount of various securities, which may include debt securities, common stock,
Horace Mann Educators Corporation Annual Report on Form 10-K 67

preferred stock, depositary shares, warrants, delayed delivery contracts and/or units that include any of these securities, was automatically effective on March 13, 2018. Unless withdrawn by us earlier, this registration statement will remain effective through March 13, 2021 and no securities associated with such registration statement have been issued. At the time of issuance of this Annual Report on Form 10-K, we expect to file another "universal shelf" registration statement on Form S-3 with the SEC in March 2021.
On March 13, 2018, we filed a "shelf" registration statement on Form S-4 with the SEC which became effective on May 2, 2018. Under this registration statement, we may from time to time offer and issue up to 5,000,000 shares of our common stock in connection with future acquisitions of other businesses, assets or securities. Unless withdrawn by us, this registration statement remains effective indefinitely. No securities associated with the registration statement have been issued at the time of issuance of this Annual Report on Form 10-K.
COVID-19 Liquidity and Capital Resources ConsiderationsThe various impacts of COVID-19 on the U.S. economy, our operations and our investment portfolio have been material. Nonetheless, we believe that the liquidity available to our holding company and its operating subsidiaries remains adequate and we do not foresee a need to suspend ordinary dividends or seek additional sources of capital at this time. Our current forecast assumes a return to a normal operating environment within 12 months, and as such, capital and liquidity are expected to remain at or near target levels during that period.
Financial RatingsOur principal insurance subsidiaries are rated by A.M. Best Company, Inc. (A.M. Best), Fitch, Moody's and S&P. These rating agencies have also assigned ratings to our Senior Notes. The ratings that are assigned by these agencies, which are subject to change, can impact, among other things, our access to sources of capital, cost of capital, and competitive position. These ratings are not a recommendation to buy or hold any of our securities.
All four agencies currently have assigned the same insurance financial strength ratings to our Property and Casualty and Life insurance subsidiaries. Only A.M Best currently rates our Supplemental segment's subsidiaries. Assigned ratings and respective affirmation/review dates as of February 18, 2021 were as follows:
Insurance FinancialStrength Ratings (Outlook) Debt Ratings (Outlook)
Affirmed/Reviewed
A.M. Best 7/2/2020HMEC (parent company) N.A. bbb (stable)HMEC's Life A (stable) N.A.HMEC's Property and Casualty subsidiaries A (stable) N.A.HMEC's Supplemental subsidiaries A- (stable) N.A.
Fitch A (stable) BBB (stable) 9/22/2020Moody's A2 (stable) Baa2 (stable) 10/8/2020
S&P A (stable) BBB (stable) 2/18/2021
Reinsurance Programs
Information regarding the reinsurance programs for our Property and Casualty, Supplemental, Retirement and Life segments are located in Part I - Item 1, Reporting Segments of this report.
Future Adoption of New Accounting Standards
There is one new accounting standard that we have not adopted because the adoption date has not yet occurred. For a discussion of this new standard, see Part II - Item 8, Note 1 of the Consolidated Financial Statements in this report. The effect of implementing certain accounting standards on our financial results and financial condition is often based in part on market conditions at the time of implementation of the standard and other factors that we are unable to determine prior to implementation. For this reason, we are sometimes unable to estimate the effect of certain pending accounting standards until the relevant authoritative body finalizes these standards or until we implement them.
68 Annual Report on Form 10-K Horace Mann Educators Corporation

Effects of Inflation and Changes in Interest Rates
Our operating results are affected significantly in at least three ways by changes in interest rates and inflation. First, inflation directly affects Property and Casualty claims costs. Second, the investment income earned on our investment portfolio and the fair value of the investment portfolio are related to the yields available in the fixed income markets. An increase in interest rates will decrease the fair value of the investment portfolio, but will increase investment income as investments mature and proceeds are reinvested at higher rates. Third, as interest rates increase, competitors will typically increase crediting rates on annuity contracts and life insurance products with account values, and may lower premium rates on property and casualty lines to reflect the higher yields available in the market. The risk of interest rate fluctuation is managed through asset/liability management techniques, including cash flow analysis. In addition, an annuity reinsurance agreement entered into in the second quarter of 2019, which reinsured a $2.2 billion block of in force fixed annuities with a minimum crediting rate of 4.5%, helps mitigate the risk of not being able to generate appropriate spreads on the annuity business.
ITEM 7A. I Quantitative and Qualitative Disclosures about Market Risk
Market value risk, our primary market risk exposure, is the risk that our invested assets will decrease in value. This decrease in value may be due to (1) a change in the yields realized on our assets and prevailing market yields for similar assets, (2) an unfavorable change in the liquidity of an investment, (3) an unfavorable change in the financial prospects of the issuer of an investment, or (4) a downgrade in the credit rating of the issuer of an investment. Also, see Part II - Item 7, Results of Operations by Segment for the Three Years Ended December 31, 2020 of this report regarding net investment gains (losses).
Significant changes in interest rates expose us to the risk of experiencing losses or earning a reduced level of investment income based on the difference between the interest rates earned on our investments and the credited interest rates on our insurance liabilities. Also, see Part II - Item 7, Results of Operations by Segment for the Three Years Ended December 31, 2020 of this report regarding interest credited to policyholders.
We seek to manage our market value risk by coordinating the projected cash inflows of assets with the projected cash outflows of liabilities. For all our assets and liabilities, we seek to maintain reasonable durations, consistent with the maximization of income without sacrificing investment quality, while providing for liquidity and diversification. The investment risk associated with variable annuity deposits and the underlying mutual funds is assumed by our contractholders, and not by us. Certain fees that we earn from variable annuity deposits are based on the market value of the funds deposited.
Through active investment management, we invest available funds with the objective of funding future obligations to policyholders, subject to appropriate risk considerations, and maximizing shareholder value. This objective is met through investments that (1) have similar characteristics to the liabilities they support, (2) are diversified among industries, issuers and geographic locations, and (3) are predominantly investment-grade fixed maturity securities classified as available for sale. As of the time of issuance of this Annual Report on Form 10-K, derivatives are only used to manage the interest crediting rate risk within our FIA and IUL products. At December 31, 2020, approximately 13.7% of the fixed maturity securities portfolio supported Property and Casualty, 9.2% supported Supplemental, and 77.2% supported Retirement and Life. For discussions regarding our investments see Part II - Item 7, Results of Operations by Segment for the Three Years Ended December 31, 2020 of this report regarding net investment gains (losses) and Part I - Item 1, Investments of this report.
Our Retirement and Life earnings are affected by the spreads between investment yields and rates credited or accruing on fixed annuity and life insurance liabilities with account values. Although credited rates on fixed annuities may be changed annually (subject to minimum guaranteed rates), competitive pricing and other factors, including the impact on the level of surrenders and withdrawals, may limit our ability to adjust or maintain crediting rates at levels necessary to avoid narrowing of spreads under certain market conditions. However, because of the annuity reinsurance transaction, the spread in our retained annuity business is achieving our targeted returns and new business is priced to do so as well. Also, see Part II - Item 7, Results of
Horace Mann Educators Corporation Annual Report on Form 10-K 69

Operations by Segment for the Three Years Ended December 31, 2020 of this report regarding interest credited to policyholders.
Using financial modeling and other techniques, we regularly evaluate the appropriateness of investments relative to the characteristics of the liabilities that they support. Simulations of cash flows generated from existing business under various interest rate scenarios measure the potential gain or loss in fair value of interest rate sensitive assets and liabilities. Such estimates are used to closely match the duration of assets to the duration of liabilities. The overall duration of liabilities of our multiline insurance operations combines the characteristics of our long duration annuity and interest rate sensitive life liabilities with our short duration non-interest rate sensitive Property and Casualty liabilities. Overall, at December 31, 2020, the duration of the fixed maturity securities portfolio was estimated to be approximately 6.4 years and the duration of our insurance liabilities and debt was estimated to be approximately 5.7 years.
Retirement and Life operations participate in the cash flow testing procedures imposed by statutory insurance regulations, the purpose of which is to ensure that such liabilities are adequate to meet our obligations under a variety of interest rate scenarios. Based on these procedures, our assets and the investment income expected to be received on such assets are adequate to meet the insurance policy obligations and expenses of our insurance activities in all but the most extreme circumstances.
We periodically evaluate our sensitivity to interest rate risk. Based on commonly used models, we project the impact of interest rate changes, assuming a wide range of factors, including duration and prepayment, on the fair value of assets and liabilities. Fair value is estimated based on the net present value of cash flows or duration estimates. Based on the most recent study, assuming an immediate decrease of 100 basis points in interest rates, the fair value of our assets and liabilities would both increase, the net of which would result in an increase in shareholders' equity of approximately $30.0 million after tax, or 1.7%. Assuming an immediate increase of 100 basis points in interest rates, the fair value of our assets and liabilities would both decrease, the net of which would result in a decrease in shareholders' equity of approximately $70.3 million after tax, or 3.9%. In each case, these changes in interest rates assume a parallel shift in the yield curve. While we believe that these assumed market rate changes are reasonably possible, actual results may differ, particularly as a result of any actions that we would take to attempt to mitigate such hypothetical losses in fair value of shareholders' equity.
Interest rates continue to be at historically low levels. If interest rates remain low over an extended period of time, we recognize it could pressure investment income by having to invest insurance cash flows and reinvest the cash flows from the investment portfolio in lower yielding securities. Moreover, issuers of securities in our investment portfolio may prepay or redeem fixed maturity securities, as well as asset-backed and commercial and mortgage-backed securities, with greater frequency to borrow at lower market rates. As a general guideline, we estimate that pretax net income in 2021 and 2022 would decrease by approximately $2.6 million for each 100 basis point decline in reinvestment rates, before assuming any reduction in annuity crediting rates on in force contracts. In addition, declining interest rates also could negatively impact the amortization of DAC, as well as the recoverability of goodwill and certain intangible assets, due to the impacts on the estimated fair value of our operating segments.
We have been and continue to be proactive in our investment strategies, product designs and crediting rate strategies to mitigate the risk of unfavorable consequences in this type of interest rate environment without venturing into asset classes or individual securities that would be inconsistent with our investment guidelines. Lowering interest crediting rates on annuity contracts and cap and participation rates on fixed indexed annuity contracts can help offset decreases in investment margins on some products. Our ability to lower interest crediting rates could be limited by competition, regulatory approval or contractual guarantees of minimum rates and may not match the timing or magnitude of changes in investment yields.
Based on our overall exposure to interest rate risk, we believe that these changes in interest rates would not materially affect our consolidated near-term financial position, results of operations or cash flows.
70 Annual Report on Form 10-K Horace Mann Educators Corporation

ITEM 8. I Financial Statements and Supplementary Data
HORACE MANN EDUCATORS CORPORATIONINDEX TO FINANCIAL INFORMATION
Page
Report of Independent Registered Public Accounting Firm 72
Consolidated Balance Sheets 75
Consolidated Statements of Operations 76
Consolidated Statements of Comprehensive Income (Loss) 77
Consolidated Statements of Changes in Shareholders' Equity 78
Consolidated Statements of Cash Flows 79
Notes to Consolidated Financial Statements 80
Note 1 - Basis of Presentation and Significant Accounting Policies 80
Note 2 - Investments 93
Note 3 - Fair Value of Financial Instruments 98
Note 4 - Derivatives 105
Note 5 - Deposit Asset on Reinsurance 107
Note 6 - Goodwill and Intangible Assets 108
Note 7 - Unpaid Claims and Claim Expenses 110
Note 8 - Reinsurance and Catastrophes 116
Note 9 - Debt 118
Note 10 - Income Taxes 119
Note 11 - Operating Leases 122
Note 12 - Shareholders' Equity and Share-Based Compensation 123
Note 13 - Statutory Information and Dividend Restrictions 126
Note 14 - Retirement Plans and Other Postretirement Benefits 126
Note 15 - Contingencies and Commitments 131
Note 16 - Comprehensive Income (Loss) and Accumulated Other Comprehensive Income (Loss) 132
Note 17 - Supplemental Consolidated Cash and Cash Flow Information 134
Note 18 - Segment Information 134
Note 19 - Unaudited Selected Quarterly Financial Data 137
Horace Mann Educators Corporation Annual Report on Form 10-K 71

Report of Independent Registered Public Accounting Firm
To the Shareholders and Board of Directors
Horace Mann Educators Corporation:
Opinion on the Consolidated Financial Statements
We have audited the accompanying consolidated balance sheets of Horace Mann Educators Corporation and subsidiaries (the Company) as of December 31, 2020 and 2019, the related consolidated statements of operations, comprehensive income (loss), changes in shareholders’ equity, and cash flows for each of the years in the three-year period ended December 31, 2020, and the related notes and financial statement schedules I to IV and VI (collectively, the consolidated financial statements). In our opinion, the consolidated financial statements present fairly, in all material respects, the financial position of the Company as of December 31, 2020 and 2019, and the results of its operations and its cash flows for each of the years in the three-year period ended December 31, 2020, in conformity with U.S. generally accepted accounting principles.
We also have audited, in accordance with the standards of the Public Company Accounting Oversight Board (United States) (PCAOB), the Company’s internal control over financial reporting as of December 31, 2020, based on criteria established in Internal Control – Integrated Framework (2013) issued by the Committee of Sponsoring Organizations of the Treadway Commission, and our report dated February 26, 2021 expressed an unqualified opinion on the effectiveness of the Company’s internal control over financial reporting.
Basis for Opinion
These consolidated financial statements are the responsibility of the Company’s management. Our responsibility is to express an opinion on these consolidated financial statements based on our audits. We are a public accounting firm registered with the PCAOB and are required to be independent with respect to the Company in accordance with the U.S. federal securities laws and the applicable rules and regulations of the Securities and Exchange Commission and the PCAOB.
We conducted our audits in accordance with the standards of the PCAOB. Those standards require that we plan and perform the audit to obtain reasonable assurance about whether the consolidated financial statements are free of material misstatement, whether due to error or fraud. Our audits included performing procedures to assess the risks of material misstatement of the consolidated financial statements, whether due to error or fraud, and performing procedures that respond to those risks. Such procedures included examining, on a test basis, evidence regarding the amounts and disclosures in the consolidated financial statements. Our audits also included evaluating the accounting principles used and significant estimates made by management, as well as evaluating the overall presentation of the consolidated financial statements. We believe that our audits provide a reasonable basis for our opinion.
Critical Audit Matters
The critical audit matters communicated below are matters arising from the current period audit of the consolidated financial statements that were communicated or required to be communicated to the audit committee and that: (1) relate to accounts or disclosures that are material to the consolidated financial statements and (2) involved our especially challenging, subjective, or complex judgments. The communication of critical audit matters does not alter in any way our opinion on the consolidated financial statements, taken as a whole, and we are not, by communicating the critical audit matters below, providing separate opinions on the critical audit matters or on the accounts or disclosures to which they relate.
72 Annual Report on Form 10-K Horace Mann Educators Corporation

Fair value for hard-to-value fixed maturity securities
As discussed in Note 3 to the consolidated financial statements, as of December 31, 2020, the Company has recorded an estimated fair value for fixed maturity securities, of which a portion represents securities that are hard-to-value, which are primarily securities that use Level 3 (unobservable) inputs. The Company estimates the fair value of hard-to-value fixed maturity securities, which includes securities that do not have observable market-based inputs or prices or that trade in markets that are less liquid. The Company uses judgment to determine the appropriate inputs and assumptions used to estimate the fair value of these hard-to-value securities. As of December 31, 2020, the estimated fair value of fixed maturity securities was $6,345.3 million.
We identified the assessment of the Company’s estimate of the fair value of hard-to-value fixed maturity securities as a critical audit matter. Significant measurement uncertainty associated with the fair value of such securities existed because the markets for the hard-to-value securities are less liquid and there is a lack of observable market-based inputs. As such, there was a high degree of subjectivity and judgment in evaluating the fair value and, specifically, the benchmark yield used in the valuation. Additionally, evaluation of the benchmark yield used in the estimation of fair value required specialized skills and knowledge.
The following are the primary procedures we performed to address this critical audit matter. We, with involvement of valuation professionals with specialized skills and knowledge, evaluated the design and tested the operating effectiveness of certain internal controls over the Company’s process to measure fair value of hard-to-value securities. This included controls related to the Company’s selection of pricing assumptions, including the benchmark yield used to value, for hard-to-value fixed maturity securities. We involved valuation professionals with specialized skills and knowledge, who assisted in:
• developing an independent range of fair value estimates using information from the Company, market data sources, models, and key assumptions derived by the valuation professional for a selection of securities
• comparing the Company’s fair value estimates of hard-to-value securities to our independent range of fair value estimates for the same selection of securities
Valuation of the liability for property and casualty unpaid claims and claim expenses
As discussed in Notes 1 and 7 of the consolidated financial statements, the Company employs actuarial techniques to estimate the liability for property and casualty unpaid claims and claims expenses (reserves). The Company develops reserves based on the application of actuarial methods and best estimate assumptions to historical claim experience. The reserves are continually updated by the Company as experience develops and new information becomes known. The Company recorded an estimated liability of $259.3 million for property and casualty unpaid claims and claim expenses as of December 31, 2020.
We identified the assessment of the estimate of reserves as a critical audit matter because it involved estimation uncertainty. Complex auditor judgment and specialized skills and knowledge were required in evaluating the selected methods and certain assumptions used to develop the estimate of reserves, including the selection of development factors and changes in claim frequency and severity trends. Additionally, subjective auditor judgment was required to assess the selected assumptions as there exists a range of potential inputs and the assumptions are sensitive to variation, such that minor changes in the assumptions could affect the reserves recorded by the Company.
Horace Mann Educators Corporation Annual Report on Form 10-K 73

The following are the primary procedures we performed to address this critical audit matter. We, with involvement of actuarial professionals with specialized skills and knowledge, evaluated the design and tested the operating effectiveness of certain internal controls over the Company’s process for the development of the estimate of reserves. This included controls related to the methods and assumptions used for the Company’s best estimate. We also involved actuarial professionals with specialized skills and knowledge, who assisted in:
• evaluating the Company’s reserving methods, procedures, key assumptions, and judgments by comparing to generally accepted actuarial standards
• developing an independent estimate for certain lines of business based on actuarial methodologies and assumptions in order to evaluate the Company’s recorded reserves
• examining the methods and certain assumptions used in and results of the Company’s internal actuarial analyses for certain remaining lines of business
• developing a range of reserves based on actuarial methodologies and assumptions in order to evaluate the Company’s consolidated reserves
• assessing movement of the Company’s consolidated reserves within the range of reserves
/s/ KPMG LLP
KPMG LLP
We have served as the Company’s auditor since 1989.
Chicago, Illinois
February 26, 2021
74 Annual Report on Form 10-K Horace Mann Educators Corporation

HORACE MANN EDUCATORS CORPORATIONCONSOLIDATED BALANCE SHEETSAs of December 31, 2020 and 2019($ in thousands, except share data)
December 31,
2020 2019
ASSETSInvestments
Fixed maturity securities, available for sale, at fair value(amortized cost 2020, $5,788,551; 2019, $5,456,980) $ 6,345,290 $ 5,791,676
Equity securities at fair value 121,653 101,864 Limited partnership interests 448,996 383,717 Short-term and other investments 346,295 361,976
Total investments 7,262,234 6,639,233 Cash 22,323 25,508 Deferred policy acquisition costs 229,828 276,668 Deposit asset on reinsurance 2,420,926 2,346,166 Intangible assets 158,460 177,217 Goodwill 43,454 49,079 Other assets 443,165 474,364 Separate Account (variable annuity) assets 2,891,423 2,490,469
Total assets $ 13,471,813 $ 12,478,704
LIABILITIES AND SHAREHOLDERS' EQUITYPolicy liabilities
Investment contract and policy reserves $ 6,445,323 $ 6,234,452 Unpaid claims and claim expenses 438,754 442,854 Unearned premiums 264,489 279,163
Total policy liabilities 7,148,566 6,956,469 Other policyholder funds 751,296 647,283 Other liabilities 453,126 384,173 Short-term debt 135,000 135,000 Long-term debt 302,323 298,025 Separate Account (variable annuity) liabilities 2,891,423 2,490,469
Total liabilities 11,681,734 10,911,419
Preferred stock, $0.001 par value, authorized1,000,000 shares; none issued — —
Common stock, $0.001 par value, authorized 75,000,000 shares;issued, 2020, 66,316,797; 2019, 66,088,808 66 66
Additional paid-in capital 488,367 480,962 Retained earnings 1,434,634 1,352,539 Accumulated other comprehensive income (loss), net of tax:
Net unrealized investment gains on fixed maturity securities 366,285 230,448 Net funded status of benefit plans (11,165) (10,767)
Treasury stock, at cost, 2020, 24,902,579 shares;2019, 24,850,484 shares (488,108) (485,963)
Total shareholders' equity 1,790,079 1,567,285 Total liabilities and shareholders' equity $ 13,471,813 $ 12,478,704
See accompanying Notes to Consolidated Financial Statements.
Horace Mann Educators Corporation Annual Report on Form 10-K 75

HORACE MANN EDUCATORS CORPORATIONCONSOLIDATED STATEMENTS OF OPERATIONS
($ in thousands, except per share data)
Year Ended December 31,
2020 2019 2018
Revenues Insurance premiums and contract charges earned $ 930,697 $ 897,954 $ 817,333 Net investment income 357,596 365,064 376,507 Net investment gains (losses) (2,289) 153,340 (12,543) Other income 24,437 14,127 10,302
Total revenues 1,310,441 1,430,485 1,191,599
Benefits, losses and expenses Benefits, claims and settlement expenses 568,891 585,068 637,560 Interest credited 204,635 212,786 206,199 Operating expenses 237,827 234,609 205,413 DAC unlocking and amortization expense 99,909 109,181 109,889 Intangible asset amortization expense 14,381 8,790 — Interest expense 15,215 15,577 13,001 Other expense - goodwill and intangible asset impairments 10,000 28,025 —
Total benefits, losses and expenses 1,150,858 1,194,036 1,172,062
Income before income taxes 159,583 236,449 19,537 Income tax expense 26,268 52,006 1,194
Net income $ 133,315 $ 184,443 $ 18,343
Net income per share Basic $ 3.18 $ 4.42 $ 0.44 Diluted $ 3.17 $ 4.40 $ 0.44
Weighted average number of shares and equivalent shares Basic 41,881,289 41,737,876 41,570,492 Diluted 42,040,892 41,948,531 41,894,232
Net investment gains (losses)Total other-than-temporary impairment losses on securities $ (5,283) $ (1,380) $ (1,530) Portion of losses recognized in other comprehensive income (loss) — — —
Net other-than-temporary impairment losseson securities recognized in net income (5,283) (1,380) (1,530)
Sales and other, net 14,968 151,495 3,491 Change in fair value - equity securities (167) 7,308 (18,323) Change in fair value and gains realized on settlements - derivatives (11,807) (4,083) 3,819
Total $ (2,289) $ 153,340 $ (12,543)
See accompanying Notes to Consolidated Financial Statements.
76 Annual Report on Form 10-K Horace Mann Educators Corporation

HORACE MANN EDUCATORS CORPORATIONCONSOLIDATED STATEMENTS OF COMPREHENSIVE INCOME (LOSS)
($ in thousands)
Year Ended December 31,
2020 2019 2018
Comprehensive income (loss) Net income $ 133,315 $ 184,443 $ 18,343 Other comprehensive income (loss), net of tax:
Change in net unrealized investment gains(losses) on fixed maturity securities 135,837 133,507 (188,195)
Change in net funded status of benefit plans (398) 1,418 1,032 Cumulative effect of change in accounting principle — — (15,041)
Other comprehensive income (loss) 135,439 134,925 (202,204) Total $ 268,754 $ 319,368 $ (183,861)
See accompanying Notes to Consolidated Financial Statements.
Horace Mann Educators Corporation Annual Report on Form 10-K 77
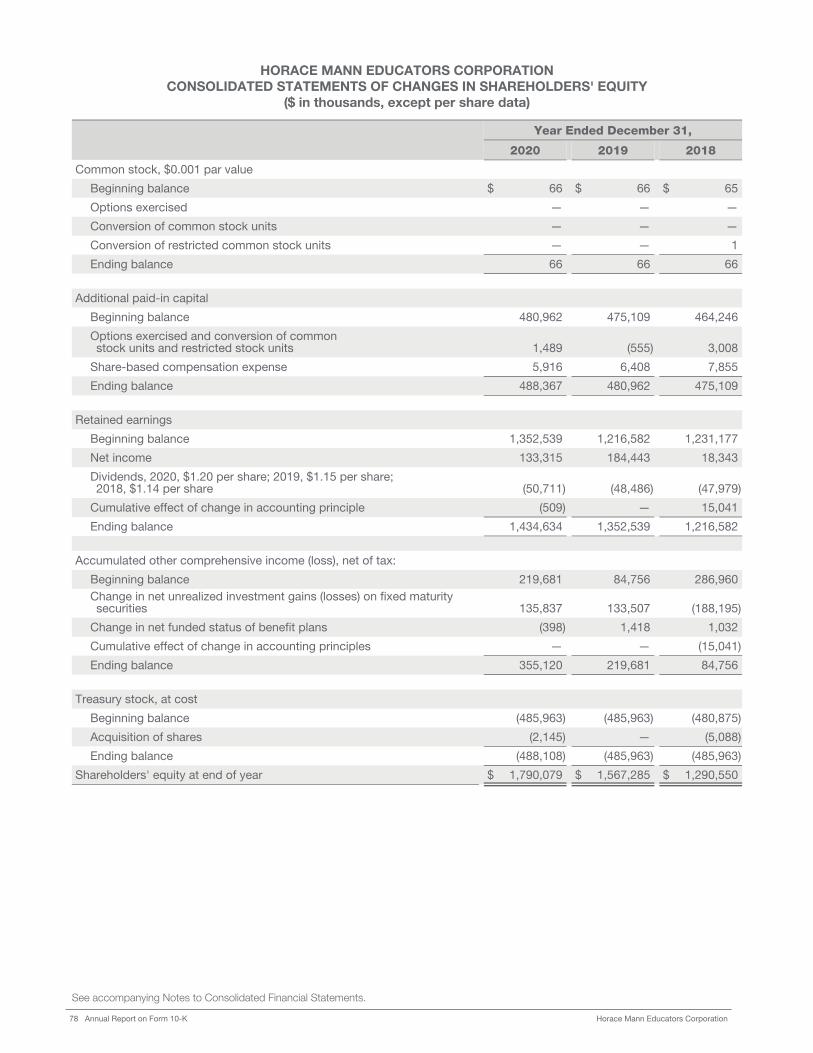
HORACE MANN EDUCATORS CORPORATIONCONSOLIDATED STATEMENTS OF CHANGES IN SHAREHOLDERS' EQUITY
($ in thousands, except per share data)
Year Ended December 31,
2020 2019 2018
Common stock, $0.001 par value
Beginning balance $ 66 $ 66 $ 65
Options exercised — — —
Conversion of common stock units — — —
Conversion of restricted common stock units — — 1
Ending balance 66 66 66
Additional paid-in capital
Beginning balance 480,962 475,109 464,246
Options exercised and conversion of commonstock units and restricted stock units 1,489 (555) 3,008
Share-based compensation expense 5,916 6,408 7,855
Ending balance 488,367 480,962 475,109
Retained earnings
Beginning balance 1,352,539 1,216,582 1,231,177
Net income 133,315 184,443 18,343
Dividends, 2020, $1.20 per share; 2019, $1.15 per share; 2018, $1.14 per share (50,711) (48,486) (47,979)
Cumulative effect of change in accounting principle (509) — 15,041
Ending balance 1,434,634 1,352,539 1,216,582
Accumulated other comprehensive income (loss), net of tax:
Beginning balance 219,681 84,756 286,960 Change in net unrealized investment gains (losses) on fixed maturity securities 135,837 133,507 (188,195)
Change in net funded status of benefit plans (398) 1,418 1,032
Cumulative effect of change in accounting principles — — (15,041)
Ending balance 355,120 219,681 84,756
Treasury stock, at cost
Beginning balance (485,963) (485,963) (480,875)
Acquisition of shares (2,145) — (5,088)
Ending balance (488,108) (485,963) (485,963)
Shareholders' equity at end of year $ 1,790,079 $ 1,567,285 $ 1,290,550
See accompanying Notes to Consolidated Financial Statements.
78 Annual Report on Form 10-K Horace Mann Educators Corporation

HORACE MANN EDUCATORS CORPORATIONCONSOLIDATED STATEMENTS OF CASH FLOWS
($ in thousands)
Year Ended December 31,
2020 2019 2018
Cash flows from operating activities Net income $ 133,315 $ 184,443 $ 18,343
Adjustments to reconcile net income to net cash providedby operating activities:
Net investment (gains) losses 2,289 (153,340) 12,543
Amortization of premiums and accretion of discounts onfixed maturity securities, net 6,651 3,806 (10,095)
Depreciation and intangible asset amortization 23,417 15,629 7,357 Share-based compensation expense 6,660 7,338 8,346 Other expense - goodwill and intangible asset impairments 10,000 28,025 — Changes in:
Accrued investment income (1,553) 46,858 4,449 Insurance liabilities 69,889 (96,802) 203,370 Premium receivables 7,450 (5,031) (10,026) Deferred policy acquisition costs (2,488) (1,274) (783) Reinsurance recoverables 1,615 22,006 (21,317) Income tax liabilities 8,346 28,726 (3,383) Other operating assets and liabilities (4,539) 53,406 (2,048) Other (1,258) (6,217) (5,868)
Net cash provided by operating activities 259,794 127,573 200,888 Cash flows from investing activities
Fixed maturity securities Purchases (1,439,648) (1,058,747) (1,428,889) Sales 472,913 805,887 625,527 Maturities, paydowns, calls and redemptions 640,270 799,526 737,535
Equity securitiesPurchases (37,353) (15,583) (13,430) Sales and repayments 12,717 33,502 25,498
Limited partnership interestsPurchases (98,594) (129,389) (93,545) Sales 30,877 91,587 16,997
Change in short-term and other investments, net 12,061 (49,325) (56,192) Acquisition of businesses, net of cash acquired — (421,516) —
Net cash (used in) provided by investing activities (406,757) 55,942 (186,499) Cash flows from financing activities
Dividends paid to shareholders (49,620) (47,333) (46,689) Principal borrowings on Bank Credit Facility — 135,000 — FHLB borrowings 4,000 — — Acquisition of treasury stock (2,145) — (5,088) Proceeds from exercise of stock options 2,402 1,730 3,627 Withholding tax payments on RSUs tendered (2,299) (3,680) (3,165) Annuity contracts: variable, fixed and FHLB funding agreements
Deposits 578,940 637,538 489,097 Benefits, withdrawals and net transfers to Separate Account
(variable annuity) assets (378,603) (419,001) (473,003) Principal repayment on FHLB funding agreements — (305,005) —
Life policy accounts Deposits 8,999 9,391 8,149 Withdrawals and surrenders (3,910) (3,558) (4,910)
Change in deposit asset on reinsurance (21,230) (150,434) — Change in book overdrafts 7,244 (24,561) 21,872
Net cash provided by (used in) financing activities 143,778 (169,913) (10,110) Net (decrease) increase in cash (3,185) 13,602 4,279 Cash at beginning of year 25,508 11,906 7,627 Cash at end of year $ 22,323 $ 25,508 $ 11,906
See accompanying Notes to Consolidated Financial Statements.
Horace Mann Educators Corporation Annual Report on Form 10-K 79
HORACE MANN EDUCATORS CORPORATIONNOTES TO CONSOLIDATED FINANCIAL STATEMENTS
December 31, 2020, 2019 and 2018
NOTE 1 - Basis of Presentation and Significant Accounting Policies
Business
Horace Mann Educators Corporation is a holding company for insurance subsidiaries that market and underwrite personal lines of property and casualty insurance products (primarily personal lines automobile and property insurance), supplemental insurance products (primarily cancer, heart, hospital, supplemental disability and accident coverages), retirement products (primarily tax-qualified fixed and variable annuities) and life insurance products, primarily to K-12 teachers, administrators and other employees of public schools and their families (collectively, HMEC, the Company or Horace Mann).
The Company acquired NTA Life Enterprises, LLC (NTA) on July 1, 2019. As a result, the Company’s reporting segments changed in the third quarter of 2019. A new reporting segment titled "Supplemental" was added to report on the personal lines of supplemental insurance products that are marketed and underwritten by NTA.
Basis of Presentation
The accompanying audited consolidated financial statements have been prepared in accordance with accounting principles generally accepted in the United States of America (GAAP) and with the rules and regulations of the Securities and Exchange Commission (SEC).
Effective for the year ended December 31, 2019, the Company decided to change the approach it uses for presentation in its Consolidated Statements of Cash Flows from the direct method to the indirect method as management considers presentation under the indirect method as more comparable to the method used by others in the insurance industry. Accordingly, the Company has recast all prior periods presented in the Consolidated Statements of Cash Flows to conform to the current year’s presentation.
The Company has reclassified the presentation of certain prior period information to conform to the current year's presentation.
Consolidation
All intercompany transactions and balances between HMEC and its subsidiaries and affiliates have been eliminated.
Use of Estimates
The preparation of consolidated financial statements in conformity with GAAP requires management to make estimates and assumptions that affect the reported amounts of assets and liabilities, disclosure of contingent assets and liabilities at the date of the consolidated financial statements, and the reported amounts of revenues and expenses during the reporting period. Actual results could differ from these estimates.
The most significant critical accounting estimates include valuation of hard-to-value fixed maturity securities (including evaluation of other-than-temporary impairments), evaluation of goodwill and intangible assets for impairment, valuation of annuity and life deferred policy acquisition costs, valuation of liabilities for property and casualty unpaid claims and claim expenses and valuation of certain investment contracts and policy reserves.
80 Annual Report on Form 10-K Horace Mann Educators Corporation

Investments
The Company invests predominantly in fixed maturity securities. This category includes primarily bonds and notes, but also includes redeemable preferred stocks. These securities are classified as available for sale and carried at fair value, of which a portion represent securities that are hard-to-value. See Note 3 - Fair Value of Financial Instruments - Investments for a detailed description of how the Company estimates fair value for its fixed maturity securities portfolio including hard-to-value securities.
An adjustment for net unrealized investment gains (losses) on all fixed maturity securities available for sale and carried at fair value, is recognized as a separate component of accumulated other comprehensive income (AOCI) within shareholders' equity, net of applicable deferred taxes and the related impact on deferred policy acquisition costs (DAC) associated with annuity contracts and life insurance products with account values that would have occurred if the securities had been sold at their aggregate fair value and the proceeds reinvested at current yields.
Beginning January 1, 2018, equity securities are carried at fair value with changes in fair value recognized as Net investment gains (losses). This category includes nonredeemable preferred stocks and common stocks.
Limited partnership interests include investments in commercial mortgage loans, infrastructure, corporate credit, private equity, real estate and other funds. All investments in limited partnership interests are accounted for using the equity method of accounting.
Short-term and other investments are comprised of short-term fixed maturity securities, generally carried at cost which approximates fair value; derivatives, carried at fair value; policy loans, carried at unpaid principal balances; mortgage loans, carried at unpaid principal balances; and restricted Federal Home Loan Bank (FHLB) membership and activity stocks, carried at redemption value which approximates fair value.
The Company invests in fixed maturity securities and alternative investment funds that could qualify as variable interests in variable interest entities (VIEs), including corporate securities, mortgage-backed securities and asset-backed securities. Such variable interests in VIEs have been reviewed and the Company determined that those VIEs are not subject to consolidation as the Company is not the primary beneficiary because it does not have the power to direct the activities that most significantly impact those VIEs' economic performance.
Investment income is recognized as earned. Investment income reflects amortization of premiums and accretion of discounts on an effective-yield basis.
Realized gains and losses arising from the disposal (recorded on a trade date basis) or impairment of securities are determined based upon specific identification of securities. The Company evaluates all investments in its portfolio for other-than-temporary declines in fair value as described in the following section.
Other-than-temporary Impairment
The Company's methodology of assessing other-than-temporary impairments (OTTI) for fixed maturity securities is based on security-specific facts and circumstances as of the reporting date. Based on these facts, if (1) the Company has the intent to sell the security, (2) it is more likely than not the Company will be required to sell the security before the anticipated recovery of the amortized cost basis, or (3) management does not expect to recover the entire amortized cost basis of the security, OTTI is considered to have occurred. Additionally, if events become known that call into question whether the security issuer has the ability to honor its contractual commitments, such security will be evaluated to determine whether or not such security has suffered an other-than-temporary decline in fair value.
The Company has a policy and process to evaluate fixed maturity securities (at the cusip/issuer level) on a quarterly basis to assess whether there has been OTTI. These reviews, in conjunction with the Company's investment managers' monthly credit reports and relevant factors such as (1) the financial condition and near-term prospects of the issuer, (2) the length of time and extent to which the fair value has been less than the amortized cost basis (3) the Company's intent to sell a security or whether it is more likely than not the Company will be required to sell the security before the anticipated recovery of the amortized cost basis, (4) the market leadership position of the issuer, (5) the debt ratings of the issuer, and (6) the cash flows and liquidity of the issuer or the underlying cash flows for asset-backed securities, are all considered in the impairment assessment.
For fixed maturity securities that the Company does not intend to sell or for which it is more likely than not that the Company would not be required to sell before an anticipated recovery in value, the Company separates the
NOTE 1 - Basis of Presentation and Significant Accounting Policies (continued)
Horace Mann Educators Corporation Annual Report on Form 10-K 81

credit loss component of the impairment from the amount related to all other factors and reports the credit loss component in net investment gains (losses). The impairment related to all other factors (non-credit factors) is reported in other comprehensive income (OCI). The allowance is adjusted for any additional credit losses and subsequent recoveries. Upon recognizing a credit loss, the cost basis is not adjusted. Prior to the adoption of ASU 2016-13 - Measurement of Credit Losses on Financial Instruments on January 1, 2020, when OTTI was deemed to have occurred, the investment would be written-down to fair value which became the new cost basis of the investment.
For fixed maturity securities where the Company records a credit loss, a determination is made as to the cause of the impairment and whether the Company expects a recovery in value. For fixed maturity securities where the Company expects a recovery in value, the constant effective yield method is utilized, and the investment is amortized to par.
For fixed maturity securities the Company intends to sell or for which it is more likely than not that the Company will be required to sell before an anticipated recovery in value, the full amount of the impairment is included in net investment gains (losses). The new cost basis of the investment is the previous amortized cost basis less the impairment recognized in net investment gains (losses). The new cost basis is not adjusted for any subsequent recoveries in fair value.
The Company reports accrued investment income separately from fixed maturity securities, available for sale, and has elected not to measure an allowance for credit losses for accrued investment income. Accrued investment income is written off and recognized as a net investment loss at the time the issuer of the fixed maturity security defaults or is expected to default on payments.
Uncollectible available for sale fixed maturity securities are written off when the Company determines that no additional cash flows will be collected.
With respect to fixed maturity securities involving securitized financial assets — primarily asset-backed and commercial mortgage-backed securities in the Company's portfolio — the underlying collateral cash flows are stress tested to determine if there has been any adverse change in the present value of cash flows below the amortized cost basis.
A decline in fair value below the amortized cost basis is not assumed to be other-than-temporary for fixed maturity securities with unrealized losses due to spread widening, market illiquidity or changes in interest rates where there exists a reasonable expectation based on the Company's consideration of all objective information available that the Company will recover the entire amortized cost basis of the security and the Company does not have the intent to sell the security before maturity or a market recovery is realized and it is more likely than not the Company will not be required to sell the security. OTTI will be recognized based upon all relevant facts and circumstances for each investment, as appropriate.
Additional considerations for certain types of securities include the following:
Corporate Fixed Maturity Securities
Judgment regarding whether a corporate fixed maturity security is other-than-temporarily impaired includes analyzing the issuer's financial condition and whether there has been a decline in the issuer's ability to service the specific security. The analysis of the security issuer is based on asset coverage, cash flow multiples or other industry standards. Several factors assessed include, but are not limited to, credit quality ratings, cash flow sustainability, liquidity, financial strength, industry and market position. Sources of information include, but are not limited to, management projections, independent consultants, external analysts' research, peer analysis and the Company's internal analysis.
If the Company has concerns regarding the viability of the issuer or its ability to service the specific security after this assessment, a cash flow analysis is prepared to determine if the present value of future cash flows has declined below the amortized cost basis of the fixed maturity security. This analysis to determine an estimate of ultimate recovery value is combined with the estimated timing to recovery and any other applicable cash flows that are expected to be collected. If a cash flow analysis estimate is not feasible, then the market's view of cash flows implied by the period end fair value, market discount rates and effective yield are the primary factors used to estimate an ultimate recovery value.
NOTE 1 - Basis of Presentation and Significant Accounting Policies (continued)
82 Annual Report on Form 10-K Horace Mann Educators Corporation

Mortgage-Backed Securities Not Issued By the U.S. Government or Federally Sponsored Agencies
The Company uses an estimate of future cash flows expected to be collected to evaluate its mortgage-backed securities for OTTI. The determination of cash flow estimates is inherently subjective and methodologies may vary depending on facts and circumstances specific to the security. All reasonably available information relevant to the collectability of the security, including past events, current conditions, and reasonable and supportable assumptions and forecasts, are considered when developing the estimate of future cash flows expected to be collected. Information includes, but is not limited to, debt-servicing, missed refinancing opportunities and geography.
Loan level characteristics such as issuer, FICO score, payment terms, level of documentation, property or residency type, and economic outlook are also utilized in financial models, along with historical performance, to estimate or measure the loan's propensity to default. Additionally, financial models take into account loan age, lease rollovers, rent volatilities, vacancy rates and exposure to refinancing as additional drivers of default. For transactions where loan level data is not available, financial models use a proxy that is based on the collateral characteristics. Loss severity is a function of multiple factors including, but not limited to, the unpaid balance, interest rate, mortgage insurance ratios, assessed property value at origination, change in property valuation and loan-to-value ratio at origination. Prepayment speeds, both actual and estimated, cost of capital rates and debt service ratios are also considered. The cash flows generated by the collateral securing these securities are then estimated with these default, loss severity and prepayment assumptions. These collateral cash flows are then utilized, along with consideration for the Company's position in the overall structure, to estimate the future cash flows associated with the residential or commercial mortgage-backed security held by the Company.
Municipal Bonds
The Company's municipal bond portfolio consists primarily of revenue bonds, which present unique considerations in evaluating OTTI, but also includes general obligation bonds. The Company evaluates a revenue bond for OTTI based on guarantees associated with the repayment from revenues generated by the specified revenue-generating activity associated with the purpose of the bond. Judgment regarding whether a municipal bond is other-than-temporarily impaired includes analyzing the issuer's financial condition and whether there has been a decline in the overall financial condition of the issuer or its ability to service the specific security. Security credit ratings are reviewed with emphasis on the economy, finances, debt and management of the municipal issuer. Certain securities may be guaranteed by monoline credit insurers or other forms of guarantee.
While not relied upon in the initial security purchase decision, insurance benefits are considered in the assessments for OTTI, including the credit-worthiness of the guarantor. Municipalities possess unique powers, along with a special legal standing and protections, that enable them to act quickly to restore budgetary balance and fiscal integrity. These powers include the sovereign power to tax, access to one-time revenue sources, capacity to issue or restructure debt, and ability to shift spending to other authorities. State governments often provide secondary support to local governments in times of financial stress and the federal government has provided assistance to state governments during recessions.
If the Company has concerns regarding the viability of the municipal issuer or its ability to service the specific security after this analysis, a cash flow analysis is prepared to determine a present value and whether it has declined below the amortized cost basis of the security. If a cash flow analysis is not feasible, then the market's view of the period end fair value, market discount rates and effective yield are the primary factors used to estimate the present value.
Credit Losses
The Company estimates the amount of the credit loss component of a fixed maturity security impairment as the difference between the amortized cost basis and the present value of the expected future cash flows of the security. Present value is determined using a best estimate of cash flows discounted at the effective interest rate implicit to the security at the date of purchase or the current yield to accrete an asset-backed or floating rate security. The methodology and assumptions for establishing a best estimate of cash flows vary depending on the type of security. Corporate fixed maturity security and municipal bond cash flow estimates are derived from scenario-based outcomes of expected restructurings or the disposition of assets using specific facts and other circumstances, including timing, security interests and loss severity and when not reasonably estimable, such securities are impaired to fair value based on management's best estimate of the present value of future cash flows. The cash flow estimates for mortgage-backed and other structured securities are based on security
NOTE 1 - Basis of Presentation and Significant Accounting Policies (continued)
Horace Mann Educators Corporation Annual Report on Form 10-K 83

specific facts and circumstances that may include collateral characteristics, expectations of delinquency and default rates, loss severity and prepayment speeds, and structural support, including subordination and guarantees.
Deferred Policy Acquisition Costs
The Company's deferred policy acquisition costs (DAC) by reporting segment were as follows:
($ in thousands) December 31,
2020 2019
Property and Casualty $ 26,153 $ 28,616 Supplemental 4,270 1,967 Retirement 137,735 185,294 Life 61,670 60,791
Total $ 229,828 $ 276,668
DAC consists of commissions, policy issuance and other costs which are incremental and directly related to the successful acquisition of new or renewal business, which are deferred and amortized on a basis consistent with the type of insurance coverage. For property and casualty risks, DAC is amortized over the terms of the insurance policies (6 or 12 months). For supplemental policies, DAC is amortized in proportion to anticipated premiums over the terms of the insurance policies (approximately 6 years, based on an estimated average duration across all supplemental products). For all annuity contracts, DAC is amortized over 20 years in proportion to estimated gross profits. DAC is amortized in proportion to estimated gross profits over 20 years for certain life insurance products with account values and over 30 years for indexed universal life (IUL) products. For other individual life contracts, DAC is amortized in proportion to anticipated premiums over the terms of the insurance policies (10, 15, 20, 30 years).
The Company periodically reviews the assumptions and estimates used in DAC and also periodically reviews its estimations of gross profits, a process sometimes referred to as "unlocking". The most significant assumptions that are involved in the estimation of annuity gross profits include interest rate spreads, future financial market performance, business surrender/lapse rates, expenses and the impact of net investment gains (losses) on fixed maturity and equity securities. For the variable deposit portion of Retirement, the Company amortizes DAC utilizing a future financial market performance assumption of an 8% reversion to the mean approach with a 200 basis point corridor around the mean during the reversion period, representing a cap and a floor on the Company's long-term assumption. The Company's practice with regard to future financial market performance assumes that long-term appreciation in the financial markets is not changed by short-term market fluctuations, but is only changed when sustained deviations are experienced. The Company monitors these fluctuations and only changes the assumption when long-term expectations change.
The most significant assumptions that are involved in the estimation of life insurance gross profits include interest rates expected to be received on investments, business persistency, and mortality. Conversions from term to permanent insurance cause an immediate write down of the associated DAC.
The most significant assumptions that are involved in the estimation of supplemental gross profits include morbidity, persistency, expenses and interest rates expected to be received on investments. When a supplemental policy lapses, there is an immediate write down of the associated DAC.
Annually, the Company performs a gross premium valuation (GPV) on life insurance policies to assess whether a loss recognition event has occurred. This involves discounting expected future benefits and expenses less expected future premiums. To the extent that this amount is greater than the liability for future benefits less the DAC asset, in aggregate for the life insurance block, a loss would be recognized by first writing off the DAC asset and then increasing the liability.
In the event actual experience differs significantly from assumptions or assumptions are significantly revised, the Company may be required to recognize a material charge or credit to current period DAC amortization expense for the period in which the adjustment is made. The Company recognized the following adjustments to DAC amortization expense as a result of evaluating actual experience and prospective assumptions (i.e., the impact of unlocking):
NOTE 1 - Basis of Presentation and Significant Accounting Policies (continued)
84 Annual Report on Form 10-K Horace Mann Educators Corporation

($ in thousands) Year Ended December 31,
2020 2019 2018
Increase (decrease) to DAC amortization expense:Retirement $ (1,766) $ 3,480 $ 3,948 Life (337) (267) 283 Total $ (2,103) $ 3,213 $ 4,231
DAC for annuity contracts and life insurance products with account values are adjusted for the impact on estimated future gross profits as if net unrealized investment gains (losses) on fixed maturity securities had been realized at the reporting date. This adjustment reduced DAC by $90.5 million, $41.2 million and $17.9 million at December 31, 2020, 2019 and 2018, respectively. The after tax impact of this adjustment is included in AOCI (along with net unrealized investment gains (losses) on fixed maturity securities) within shareholders' equity.
DAC is reviewed for recoverability from future income, including net investment income, and costs that are deemed unrecoverable are expensed in the period in which the determination is made. No such costs were deemed unrecoverable during the years ended December 31, 2020, 2019 and 2018.
Intangible Assets
The value of business acquired (VOBA) represents the difference between the fair value of insurance contracts and insurance policy reserves measured in accordance with the Company's accounting policies for insurance contracts acquired. VOBA was based on an actuarial estimate of the present value of future distributable earnings for insurance in force on the acquisition date. VOBA was $83.6 million as of December 31, 2020 and is being amortized by product based on the present value of future premiums to be received. The Company estimates that it will recognize VOBA amortization of $6.6 million in 2021, $6.2 million in 2022, $5.8 million in 2023, $5.4 million in 2024 and $5.1 million in 2025.
The Company accounts for the value of distribution acquired (VODA) associated with the acquisition of NTA based on an actuarial estimate of the present value of future business to be written by the existing distribution channel. VODA was $44.7 million as of December 31, 2020 and is being amortized on a straight-line basis. The Company estimates that it will recognize VODA amortization of $2.9 million in each of the years 2021 through 2025, respectively.
The Company accounts for VODA associated with the acquisition of Benefit Consultants Group, Inc. (BCG) based on management's estimate of the present value of future business to be written by the existing distribution channel. VODA was $0.7 million as of December 31, 2020 and is being amortized based on the present value of future profits to be received. The Company estimates that it will recognize cumulative VODA amortization of $0.3 million for the years 2021 through 2025.
The Company accounts for the value of agency relationships based on the present value of commission overrides retained by NTA. Agency relationships was $12.9 million as of December 31, 2020 and is being amortized based on the present value of future premiums to be received. The Company estimates that it will recognize agency relationships amortization of $2.2 million in 2021, $1.9 million in 2022, $1.6 million in 2023, $1.4 million in 2024 and $1.2 million in 2025.
The Company accounts for the value of customer relationships based on the present value of expected profits from existing BCG customers in force at the date of acquisition. Customer relationships was $5.9 million as of December 31, 2020 and is being amortized based on the present value of future profits to be received. The Company estimates that it will recognize customer relationships amortization of $1.2 million in 2021, $1.1 million in 2022, $0.9 million in 2023, $0.7 million in 2024 and $0.6 million in 2025.
Trade names represents the present value of future savings accruing to NTA and BCG by virtue of not having to pay royalties for the use of the trade names, valued using the relief from royalty method. State licenses represents the regulatory licenses held by NTA that were valued using the cost approach. Both trade names and state licenses are indefinite-lived intangible assets that are not subject to amortization.
Annually, the Company performs a VOBA analysis on supplemental insurance policies to assess whether a loss recognition event has occurred. This initially involves comparing the historical and expected future experience on the block to the assumptions embedded in the original VOBA intangible asset. If both the experience to date and
NOTE 1 - Basis of Presentation and Significant Accounting Policies (continued)
Horace Mann Educators Corporation Annual Report on Form 10-K 85

current expected experience are consistently better than the initial VOBA assumptions, the remaining value in the block is sufficient to support the VOBA intangible asset and no loss recognition is necessary. If the historical and current expected assumptions are not uniformly better than the initial VOBA assumptions, a GPV is performed to assess whether a loss recognition event has occurred. This involves discounting expected future benefits and expenses less expected future premiums. To the extent that this amount is greater than the liability for future benefits less the VOBA intangible asset, in aggregate for the supplemental insurance block, a loss would be recognized by first writing off the VOBA and then increasing the liability. Currently, a GPV is not required for the acquired supplemental block. No such costs were deemed unrecoverable during the year ended December 31, 2020.
Amortizing intangible assets (i.e., VODA, agency relationships and customer relationships) are tested for recoverability whenever events or changes in circumstances indicate that its carrying amount may not be recoverable. The carrying amount of an amortizing intangible asset is not recoverable if it exceeds the sum of undiscounted cash flows expected to result from the use and eventual disposition of the asset. If the carrying amount is not recoverable from undiscounted cash flows, the impairment is measured as the difference between the carrying amount and fair value.
Intangible assets that are not subject to amortization (i.e., trade names and state licenses) are tested for impairment annually or more frequently if events or changes in circumstances indicate that the asset might be impaired. The impairment test consists of a comparison of the fair value of an intangible asset with its carrying amount. If the carrying amount of an intangible asset that is not subject to amortization exceeds its fair value, an impairment loss is recognized in an amount equal to the excess.
At October 1, 2020, the Company performed qualitative assessments to determine whether it was necessary to perform quantitative intangible asset impairment tests. Based on the assessments of qualitative factors, there were no events or circumstances that led to a determination that it is more likely than not that the fair value of an intangible asset is less than its carrying amount with exception to VODA and trade names intangible assets assigned to BCG, for which quantitative intangible asset impairment tests were performed that resulted in intangible asset impairment charges of $4.4 million in aggregate.
Goodwill
When the Company was acquired from CIGNA Corporation by HME Holdings, Inc. in 1989, intangible assets were recognized as goodwill in the application of purchase accounting. In addition, goodwill was recognized in 1994 related to the acquisition of Horace Mann Property & Casualty Insurance Company and in 2019 related to the acquisitions of BCG and NTA.
Goodwill represents the excess of the amounts paid to acquire a business over the fair value of its net assets at the date of acquisition. Goodwill is not amortized, but is tested for impairment at the reporting unit level at least annually or more frequently if events occur or circumstances change that would more likely than not reduce the fair value of a reporting unit below its carrying amount. A reporting unit is defined as an operating segment or a business unit one level below an operating segment, if separate financial information is prepared and regularly reviewed by management at that level. The Company's reporting units, for which goodwill has been allocated, are equivalent to the Company's operating segments. Refer to Note 6 for the allocation of goodwill by reporting unit as of December 31, 2020.
The goodwill impairment test, as defined in GAAP, allows an entity the option to first assess qualitative factors to determine whether the existence of events or circumstances leads to a determination that it is more likely than not that the fair value of a reporting unit is less than its carrying amount. If an entity determines it is more likely than not that the fair value of a reporting unit is less than its carrying amount, then the entity performs a quantitative goodwill impairment test by comparing the fair value of a reporting unit to its carrying amount for purposes of confirming and measuring an impairment. In the second quarter of 2019, the Company adopted guidance to eliminate Step 2 of the goodwill impairment test. Goodwill impairment is now the amount by which a reporting unit’s carrying amount exceeds its fair value, not to exceed the carrying amount of goodwill. Any amount of goodwill determined to be impaired is recognized as an expense in the period in which the impairment determination is made.
At October 1, 2020, the Company performed a quantitative goodwill impairment test. Based on the assessment, there were no events or circumstances that led to a determination that it is more likely than not that the fair value of a reporting unit is less than its carrying amount with exception to lower than anticipated BCG wealth
NOTE 1 - Basis of Presentation and Significant Accounting Policies (continued)
86 Annual Report on Form 10-K Horace Mann Educators Corporation
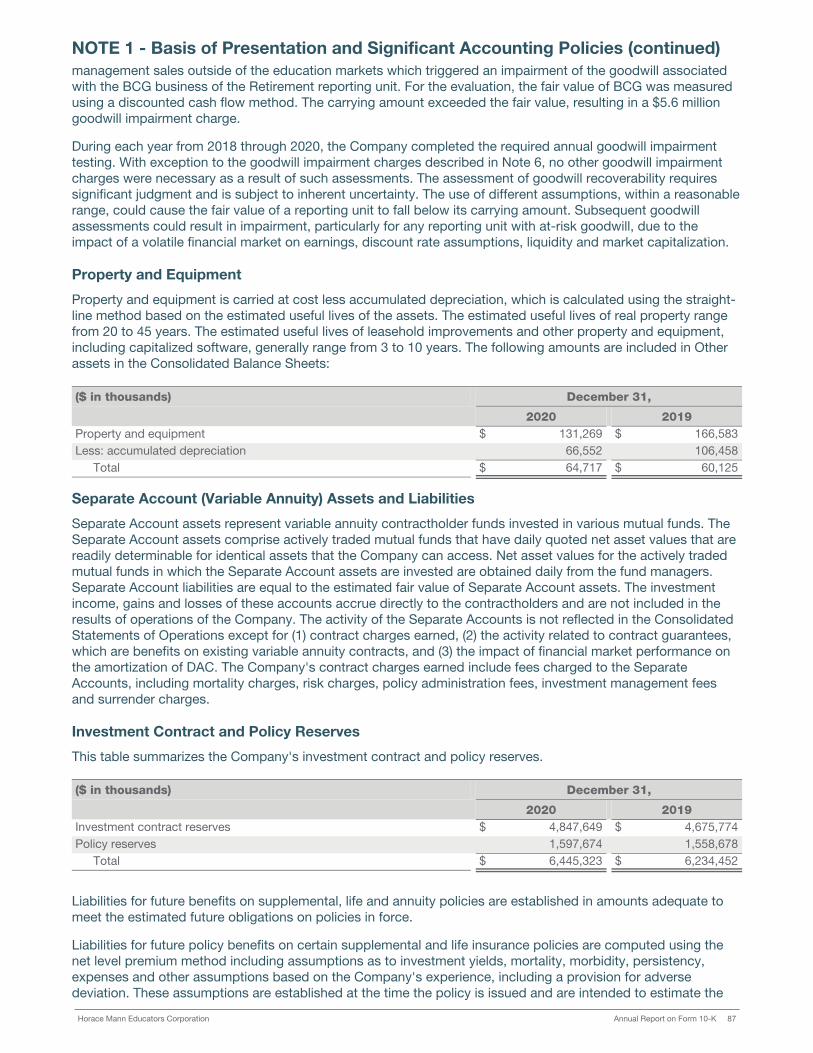
management sales outside of the education markets which triggered an impairment of the goodwill associated with the BCG business of the Retirement reporting unit. For the evaluation, the fair value of BCG was measured using a discounted cash flow method. The carrying amount exceeded the fair value, resulting in a $5.6 million goodwill impairment charge.
During each year from 2018 through 2020, the Company completed the required annual goodwill impairment testing. With exception to the goodwill impairment charges described in Note 6, no other goodwill impairment charges were necessary as a result of such assessments. The assessment of goodwill recoverability requires significant judgment and is subject to inherent uncertainty. The use of different assumptions, within a reasonable range, could cause the fair value of a reporting unit to fall below its carrying amount. Subsequent goodwill assessments could result in impairment, particularly for any reporting unit with at-risk goodwill, due to the impact of a volatile financial market on earnings, discount rate assumptions, liquidity and market capitalization.
Property and Equipment
Property and equipment is carried at cost less accumulated depreciation, which is calculated using the straight-line method based on the estimated useful lives of the assets. The estimated useful lives of real property range from 20 to 45 years. The estimated useful lives of leasehold improvements and other property and equipment, including capitalized software, generally range from 3 to 10 years. The following amounts are included in Other assets in the Consolidated Balance Sheets:
($ in thousands) December 31,
2020 2019
Property and equipment $ 131,269 $ 166,583 Less: accumulated depreciation 66,552 106,458
Total $ 64,717 $ 60,125
Separate Account (Variable Annuity) Assets and Liabilities
Separate Account assets represent variable annuity contractholder funds invested in various mutual funds. The Separate Account assets comprise actively traded mutual funds that have daily quoted net asset values that are readily determinable for identical assets that the Company can access. Net asset values for the actively traded mutual funds in which the Separate Account assets are invested are obtained daily from the fund managers. Separate Account liabilities are equal to the estimated fair value of Separate Account assets. The investment income, gains and losses of these accounts accrue directly to the contractholders and are not included in the results of operations of the Company. The activity of the Separate Accounts is not reflected in the Consolidated Statements of Operations except for (1) contract charges earned, (2) the activity related to contract guarantees, which are benefits on existing variable annuity contracts, and (3) the impact of financial market performance on the amortization of DAC. The Company's contract charges earned include fees charged to the Separate Accounts, including mortality charges, risk charges, policy administration fees, investment management fees and surrender charges.
Investment Contract and Policy Reserves
This table summarizes the Company's investment contract and policy reserves.
($ in thousands) December 31,
2020 2019
Investment contract reserves $ 4,847,649 $ 4,675,774 Policy reserves 1,597,674 1,558,678
Total $ 6,445,323 $ 6,234,452
Liabilities for future benefits on supplemental, life and annuity policies are established in amounts adequate to meet the estimated future obligations on policies in force.
Liabilities for future policy benefits on certain supplemental and life insurance policies are computed using the net level premium method including assumptions as to investment yields, mortality, morbidity, persistency, expenses and other assumptions based on the Company's experience, including a provision for adverse deviation. These assumptions are established at the time the policy is issued and are intended to estimate the
NOTE 1 - Basis of Presentation and Significant Accounting Policies (continued)
Horace Mann Educators Corporation Annual Report on Form 10-K 87
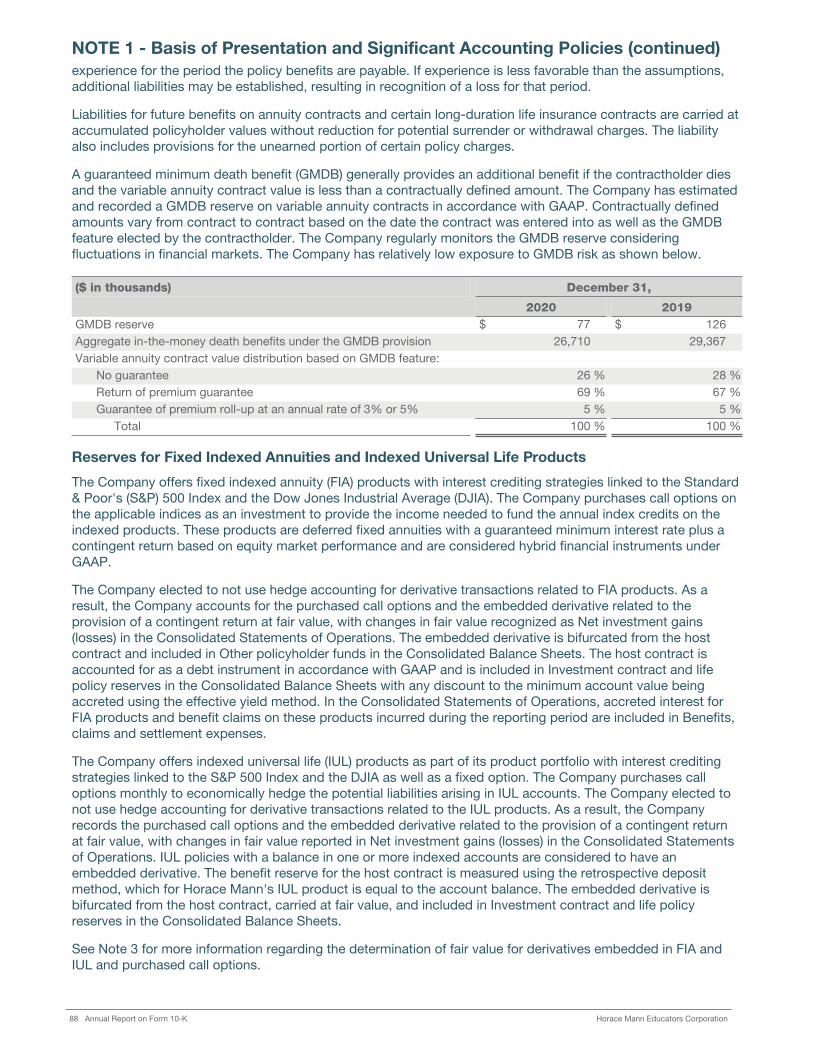
experience for the period the policy benefits are payable. If experience is less favorable than the assumptions, additional liabilities may be established, resulting in recognition of a loss for that period.
Liabilities for future benefits on annuity contracts and certain long-duration life insurance contracts are carried at accumulated policyholder values without reduction for potential surrender or withdrawal charges. The liability also includes provisions for the unearned portion of certain policy charges.
A guaranteed minimum death benefit (GMDB) generally provides an additional benefit if the contractholder dies and the variable annuity contract value is less than a contractually defined amount. The Company has estimated and recorded a GMDB reserve on variable annuity contracts in accordance with GAAP. Contractually defined amounts vary from contract to contract based on the date the contract was entered into as well as the GMDB feature elected by the contractholder. The Company regularly monitors the GMDB reserve considering fluctuations in financial markets. The Company has relatively low exposure to GMDB risk as shown below.
($ in thousands) December 31,
2020 2019
GMDB reserve $ 77 $ 126 Aggregate in-the-money death benefits under the GMDB provision 26,710 29,367 Variable annuity contract value distribution based on GMDB feature:
No guarantee 26 % 28 %Return of premium guarantee 69 % 67 %Guarantee of premium roll-up at an annual rate of 3% or 5% 5 % 5 %
Total 100 % 100 %
Reserves for Fixed Indexed Annuities and Indexed Universal Life Products
The Company offers fixed indexed annuity (FIA) products with interest crediting strategies linked to the Standard & Poor's (S&P) 500 Index and the Dow Jones Industrial Average (DJIA). The Company purchases call options on the applicable indices as an investment to provide the income needed to fund the annual index credits on the indexed products. These products are deferred fixed annuities with a guaranteed minimum interest rate plus a contingent return based on equity market performance and are considered hybrid financial instruments under GAAP.
The Company elected to not use hedge accounting for derivative transactions related to FIA products. As a result, the Company accounts for the purchased call options and the embedded derivative related to the provision of a contingent return at fair value, with changes in fair value recognized as Net investment gains (losses) in the Consolidated Statements of Operations. The embedded derivative is bifurcated from the host contract and included in Other policyholder funds in the Consolidated Balance Sheets. The host contract is accounted for as a debt instrument in accordance with GAAP and is included in Investment contract and life policy reserves in the Consolidated Balance Sheets with any discount to the minimum account value being accreted using the effective yield method. In the Consolidated Statements of Operations, accreted interest for FIA products and benefit claims on these products incurred during the reporting period are included in Benefits, claims and settlement expenses.
The Company offers indexed universal life (IUL) products as part of its product portfolio with interest crediting strategies linked to the S&P 500 Index and the DJIA as well as a fixed option. The Company purchases call options monthly to economically hedge the potential liabilities arising in IUL accounts. The Company elected to not use hedge accounting for derivative transactions related to the IUL products. As a result, the Company records the purchased call options and the embedded derivative related to the provision of a contingent return at fair value, with changes in fair value reported in Net investment gains (losses) in the Consolidated Statements of Operations. IUL policies with a balance in one or more indexed accounts are considered to have an embedded derivative. The benefit reserve for the host contract is measured using the retrospective deposit method, which for Horace Mann's IUL product is equal to the account balance. The embedded derivative is bifurcated from the host contract, carried at fair value, and included in Investment contract and life policy reserves in the Consolidated Balance Sheets.
See Note 3 for more information regarding the determination of fair value for derivatives embedded in FIA and IUL and purchased call options.
NOTE 1 - Basis of Presentation and Significant Accounting Policies (continued)
88 Annual Report on Form 10-K Horace Mann Educators Corporation

Unpaid Claims and Claim Expenses
Liabilities for Property and Casualty unpaid claims and claim expenses include provisions for payments to be made on reported claims, claims incurred but not yet reported (IBNR) and associated settlement expenses. All of the Company's reserves for Property and Casualty unpaid claims and claim expenses are carried at the full value of estimated liabilities and are not discounted for interest expected to be earned on the reserves. Estimated amounts of salvage and subrogation on unpaid Property and Casualty claims are deducted from the liability for unpaid claims. Due to the nature of the Company's personal lines business, the Company has no exposure to losses related to claims for toxic waste cleanup, other environmental remediation or asbestos-related illnesses other than claims under property insurance policies for environmentally related items such as mold.
Other Policyholder Funds
Other policyholder funds includes payout annuity contracts without life contingencies and dividend accumulations, as well as balances outstanding under funding agreements with FHLB and embedded derivatives related to FIA products. Except for embedded derivatives, each of these components is carried at cost. Embedded derivatives are carried at fair value. Amounts received and repaid under FHLB funding agreements are classified as financing activities in the Company's Consolidated Statements of Cash Flows.
FHLB Funding Agreements
In 2013, Horace Mann Life Insurance Company (HMLIC), and in 2019, NTA became members of FHLB, which provides both subsidiaries with access to collateralized borrowings and other FHLB products. Any borrowing from FHLB requires the purchase of FHLB activity-based common stock in an amount equal to 4.5% of the borrowing, or a lower percentage — such as 2.0% based on the Reduced Capitalization Advance Program. In 2019, HMEC's Board of Directors (Board) authorized a maximum amount equal to 15% of net aggregate admitted assets less separate account assets of the insurance subsidiaries for FHLB advances and funding agreements combined. In 2020, HMLIC and NTA collectively received an additional $95.5 million from FHLB under funding agreements. Outstanding advances under FHLB funding agreements are reported as Other policyholder funds in the Consolidated Balance Sheets and totaled $590.5 million as of December 31, 2020. Interest on the funding agreements accrues at their effective interest rates.
As of December 31, 2020, scheduled maturity dates for outstanding FHLB funding agreements were as follows:
($ in thousands)
Amount Effective Interest Rate Maturity Date
$50,000 0.324% January 15, 2021
25,000 0.297% February 12, 2021
8,000 0.000% May 17, 2021
20,000 0.486% November 15, 2023
100,000 0.306% December 15, 2023
50,000 0.514% January 12, 2024
125,000 0.570% September 11, 2025
12,500 0.670% June 26, 2025
200,000 0.270% January 16, 2026
Total $590,500
Reinsurance
The Company enters into reinsurance arrangements pursuant to which it cedes certain insurance risks to unaffiliated reinsurers. Cessions under reinsurance agreements do not discharge the Company's obligations as the primary insurer. The accounting for reinsurance arrangements depends on whether the arrangement provides indemnification against loss or liability relating to insurance risk in accordance with GAAP.
If the Company determines that a reinsurance agreement exposes the reinsurer to a reasonable possibility of a significant loss from insurance risk, the ceded unearned premiums and reinsurance balances recoverable on paid and unpaid losses and settlement expenses are reported separately as assets, instead of being netted with the related liabilities, since reinsurance does not relieve the Company of its legal liability to its policyholders. See Note 8 for further details.
NOTE 1 - Basis of Presentation and Significant Accounting Policies (continued)
Horace Mann Educators Corporation Annual Report on Form 10-K 89

If the Company determines that a reinsurance agreement does not expose the reinsurer to a reasonable possibility of a significant loss from insurance risk, the Company recognizes the reinsurance agreement using the deposit method of accounting. The assets transferred to the reinsurer as consideration paid is reported as a Deposit asset on reinsurance on the Company's Consolidated Balance Sheets. As amounts are received or paid or received, consistent with the underlying reinsured contracts, the Deposit asset on reinsurance is adjusted. The Deposit asset on reinsurance is accreted to the estimated ultimate cash flows using the interest method and the adjustment is reported as Net investment income. See Note 5 for further details.
Insurance Premiums and Contract Charges Earned
Property and Casualty insurance premiums are recognized as revenue ratably over the related contract periods in proportion to the risks insured. The unexpired portions of these Property and Casualty premiums are recorded as unearned premiums, using the monthly pro rata method.
Premiums and contract charges for life insurance contracts with account values and annuity contracts consist of charges for the cost of insurance, policy administration and withdrawals. Premiums for long-term traditional life and supplemental policies are recognized as revenues when due over the premium-paying period. Contract deposits to annuity contracts and life insurance contracts with account values represent funds deposited by policyholders and are not included in the Company's premiums or contract charges earned.
Share-Based Compensation
The Company grants stock options and both service-based and performance-based restricted common stock units (RSUs) to executive officers, other employees and Directors in an effort to attract and retain individuals while also aligning compensation with the interests of the Company's shareholders. Additional information regarding the Company's share-based compensation plans is contained in Note 12.
Stock options are accounted for under the fair value method of accounting using a Black-Scholes valuation model to measure stock option expense at the date of grant. The fair value of RSUs is measured at the market price of the Company's common stock on the date of grant, with the exception of market-based performance awards, for which the Company uses a Monte Carlo simulation model to determine fair value for purposes of measuring RSU expense. For the years ended December 31, 2020, 2019 and 2018, the Company recognized $1.1 million, $1.2 million, and $1.2 million, respectively, of stock option expense as a result of stock options that vested during the respective periods. For the years ended December 31, 2020, 2019 and 2018, the Company recognized $4.8 million, $5.2 million and $6.6 million, respectively, in RSU expense as a result of the performance and/or vesting of RSUs during the respective periods.
In 2020, 2019 and 2018, the Company granted stock options as quantified in the table below, which also provides the weighted average grant date fair value for stock options granted in each year. The fair value of stock options granted was estimated on the respective dates of grant using the Black-Scholes option pricing model with the weighted average assumptions shown in the following table.
Year Ended December 31,
2020 2019 2018
Number of stock options granted 234,248 282,040 223,208 Weighted average grant date fair value of stock options granted $ 6.02 $ 6.26 $ 7.16 Weighted average assumptions:
Risk-free interest rate 0.8 % 2.5 % 2.6 %Expected dividend yield 2.7 % 2.9 % 2.6 %Expected life, in years 5.1 5.0 4.8Expected volatility (based on historical volatility) 22.8 % 21.9 % 21.5 %
The weighted average fair value of nonvested stock options outstanding on December 31, 2020 was $6.31. Total unrecognized compensation expense relating to the nonvested stock options outstanding as of December 31, 2020 was approximately $2.1 million. This amount will be recognized as expense over the remainder of the vesting period, which is scheduled to be 2021 through 2024. Expense is recognized on a straight-line basis over the vesting period for the entire award. Forfeitures of unvested amounts due to terminations and/or early retirements are recognized as a reduction to the related expenses.
NOTE 1 - Basis of Presentation and Significant Accounting Policies (continued)
90 Annual Report on Form 10-K Horace Mann Educators Corporation

Total unrecognized compensation expense relating to RSUs outstanding as of December 31, 2020 was approximately $6.5 million. This amount will be recognized as expense over the remainder of the performance and/or vesting period, which is scheduled to be 2021 through 2023. Expense is recognized on a straight-line basis from the date of grant through the end of the performance and/or vesting period for the entire award. Forfeitures of unvested amounts due to terminations are recognized as a reduction to the related expenses.
Income Taxes
The Company uses the asset and liability method for calculating deferred federal income taxes. Income tax provisions are generally based on income reported for financial statement purposes. The provisions for federal income taxes for the years ended December 31, 2020, 2019 and 2018 included amounts currently payable and deferred income taxes resulting from the cumulative differences in the Company's assets and liabilities, determined on a tax return versus financial statement basis.
Deferred tax assets and liabilities include provisions for net unrealized investment gains (losses) on fixed maturity securities as well as the net funded status of benefit plans with the changes for each period included in the respective components of AOCI within shareholders' equity.
Earnings Per Share
Basic earnings per share is computed based on the weighted average number of common shares outstanding plus the weighted average number of fully vested RSUs and common stock units (CSUs) payable as shares of HMEC common stock. Diluted earnings per share is computed based on the weighted average number of common shares and common stock equivalents outstanding, to the extent dilutive. The Company's common stock equivalents relate to outstanding common stock options, deferred compensation CSUs and incentive compensation RSUs, which are described in Note 12.
The computations of net income per share on both basic and diluted bases, including reconciliations of the numerators and denominators, were as follows:
($ in thousands) Year Ended December 31,
2020 2019 2018
Basic:Net income for the period $ 133,315 $ 184,443 $ 18,343
Weighted average number of common sharesduring the period (in thousands) 41,881 41,738 41,570
Net income per share - basic $ 3.18 $ 4.42 $ 0.44
Diluted:Net income for the period $ 133,315 $ 184,443 $ 18,343
Weighted average number of common sharesduring the period (in thousands) 41,881 41,738 41,570
Weighted average number of common equivalent shares to reflect the dilutive effect of common stock equivalent securities (in thousands):
Stock options 44 79 100 CSUs related to deferred compensation for employees — — 25 RSUs related to incentive compensation 116 132 199
Total common and common equivalent shares adjustedto calculate diluted earnings per share (in thousands) 42,041 41,949 41,894
Net income per share - diluted $ 3.17 $ 4.40 $ 0.44
Options to purchase 713,080 shares of common stock at $38.05 to $42.95 per share were granted in 2017, 2018, 2019 and 2020 but were not included in the computation of 2020 diluted earnings per share because of their anti-dilutive effect. These options, which expire in 2027, 2028, 2029 and 2030, were still outstanding at December 31, 2020.
NOTE 1 - Basis of Presentation and Significant Accounting Policies (continued)
Horace Mann Educators Corporation Annual Report on Form 10-K 91

Consolidated Statements of Cash Flows
For purposes of the Consolidated Statements of Cash Flows, cash constitutes cash on deposit at banks as well as restricted cash. See Note 17 for further information.
Adoption of New Accounting Standards
Measurement of Credit Losses on Financial InstrumentsIn June 2016 , the FASB issued guidance which revised the credit loss recognition criteria for certain financial assets measured at amortized cost, including reinsurance recoverables. The new guidance replaced the existing incurred loss recognition model with an expected loss recognition model. The objective of the expected credit loss model is for a reporting entity to recognize its estimate of expected credit losses for affected financial assets in a valuation allowance that when deducted from the amortized cost basis of the related financial assets results in a net carrying value at the amount expected to be collected. A reporting entity must consider all relevant information available when estimating expected credit losses, including details about past events, current conditions, and reasonable and supportable forecasts over the life of an asset. Financial assets may be evaluated individually or on a pooled basis when they share similar risk characteristics. The measurement of credit losses for available-for-sale debt securities measured at fair value is not affected except that credit losses recognized are limited to the amount by which fair value is below amortized cost and the carrying value adjustment is recognized through a valuation allowance which may change over time but once recorded cannot subsequently be reduced to an amount below zero. The guidance was effective for reporting periods beginning after December 15, 2019, and for most affected instruments was adopted using a modified retrospective approach, with a cumulative effect adjustment recorded to beginning retained earnings.
The Company’s implementation activities are complete and the impacts relate to the Company’s commercial mortgage loan portfolio, agent advances, reinsurance recoverables and off-balance-sheet credit exposures for unfunded commercial mortgage loan commitments. The Company adopted the new guidance on January 1, 2020 and recognized a cumulative effect adjustment that decreased retained earnings by $0.5 million.
Future Adoption of New Accounting Standards
Accounting for Long-Duration Insurance ContractsIn August 2018, the FASB issued accounting and disclosure guidance that contains targeted improvements to the accounting for long-duration insurance contracts. Under the new guidance, the cash flow assumptions used to measure the liability for future policy benefits for traditional insurance contracts will be required to be updated at least annually with changes recognized as a benefit expense (i.e., assumptions will no longer be locked-in). Insurance entities will be required to use a standard discount rate to measure the liabilities that will be equivalent to the yield from a high-quality bond. The new guidance also changes the amortization of DAC to be on a constant-level basis over the expected term of the related contracts with no interest accruing on the DAC balance. The new guidance also introduces a new category of contract features associated with deposit type contracts referred to as market risk benefits (MRBs). Contract features meeting the definition of a MRB will be measured at fair value. New disclosures will be required for long-duration insurance contracts in order to provide better transparency into the exposure of insurance entities and the drivers of their results. For public business entities, the guidance is effective for annual reporting periods beginning after December 15, 2022, including interim periods within those years. With regards to the liability for future policy benefits and DAC, the guidance applies to contracts in force as of the beginning of the earliest period presented and may be applied retrospectively. With regards to MRBs, the guidance is to be applied retrospectively at the beginning of the earliest period presented. Early adoption is permitted. Management is evaluating the impact this guidance will have on the results of operations and financial position of the Company.
NOTE 1 - Basis of Presentation and Significant Accounting Policies (continued)
92 Annual Report on Form 10-K Horace Mann Educators Corporation

Net Investment Income
The components of net investment income for the following periods were as follows:
($ in thousands) Year Ended December 31,
2020 2019 2018
Fixed maturity securities $ 232,917 $ 283,228 $ 353,303 Equity securities 4,665 4,923 6,017 Limited partnership interests 20,863 25,694 15,406 Short-term and other investments 11,409 (10,122) 11,981 Investment expenses (9,542) (9,484) (10,200)
Net investment income - investment portfolio 260,312 294,239 376,507 Investment income - deposit asset on reinsurance 97,284 70,825 —
Total net investment income $ 357,596 $ 365,064 $ 376,507
Net Investment Gains (Losses)
Net investment gains (losses) for the following periods were as follows:
($ in thousands) Year Ended December 31,
2020 2019 2018
Fixed maturity securities (1) $ 9,392 $ 141,448 $ (5,713) Equity securities 1,843 15,975 (10,649) Short-term investments and other (13,524) (4,083) 3,819
Net investment gains (losses) $ (2,289) $ 153,340 $ (12,543) (1) Net investment gains on fixed maturity securities include a $135.3 million realized investment gain associated with a transfer of investments to
a reinsurer as consideration paid during the second quarter of 2019 in connection with the reinsurance of a $2.9 billion block of in force fixed and variable annuity business. See Notes 5 and 17 for further information.
The Company, from time to time, sells invested assets subsequent to the reporting date that were considered temporarily impaired at such reporting date. Such sales are due to issuer specific events occurring subsequent to the reporting date that result in a change in the Company's intent or ability to hold an invested asset. The types of events that may result in a sale include significant changes in the economic facts and circumstances related to the invested asset, significant unforeseen changes in liquidity needs, or changes in the Company's investment strategy.
Net Investment Gains (Losses) by Transaction Type
The following table reconciles net investment gains (losses) pretax by transaction type:
($ in thousands) Year Ended December 31,
2020 2019 2018
Credit impairment write-downs $ — $ (1,105) $ — Change in intent write-downs (5,283) (275) (1,530)
Net other-than-temporary impairment losses on securitiesrecognized in net income (5,283) (1,380) (1,530)
Sales and other, net 14,968 151,495 3,491
Change in fair value - equity securities (1) (167) 7,308 (18,323)
Change in fair value and gains (losses) realizedon settlements - derivatives (11,807) (4,083) 3,819
Net investment gains (losses) $ (2,289) $ 153,340 $ (12,543) (1) Effective January 1, 2018, with the adoption of new accounting guidance for recognition and measurement of financial instruments, equity
securities are reported at fair value with changes in fair value recognized in Net investment gains (losses) and are no longer included in impairment write-downs or change in intent write-downs.
NOTE 2 - Investments
Horace Mann Educators Corporation Annual Report on Form 10-K 93

Fixed Maturity Securities
The Company's investment portfolio is comprised primarily of fixed maturity securities. Amortized cost, net unrealized investment gains (losses) and fair values of all fixed maturity securities in the portfolio were as follows:
($ in thousands) AmortizedCost
UnrealizedGains
UnrealizedLosses
FairValue
December 31, 2020Fixed maturity securities
U.S. Government and federallysponsored agency obligations: (1)
Mortgage-backed securities $ 605,468 $ 79,601 $ 231 $ 684,838 Other, including U.S. Treasury securities 395,042 39,144 1,033 433,153
Municipal bonds 1,612,290 215,711 504 1,827,497 Foreign government bonds 40,145 4,908 — 45,053 Corporate bonds 1,905,207 221,634 3,942 2,122,899 Other asset-backed securities 1,230,399 24,123 22,672 1,231,850
Totals $ 5,788,551 $ 585,121 $ 28,382 $ 6,345,290
December 31, 2019Fixed maturity securities
U.S. Government and federallysponsored agency obligations: (1)
Mortgage-backed securities $ 684,543 $ 41,263 $ 1,487 $ 724,319 Other, including U.S. Treasury securities 436,665 22,824 621 458,868
Municipal bonds 1,545,787 141,996 1,580 1,686,203 Foreign government bonds 42,801 2,569 — 45,370 Corporate bonds 1,464,444 118,775 1,795 1,581,424 Other asset-backed securities 1,282,740 20,883 8,131 1,295,492
Totals $ 5,456,980 $ 348,310 $ 13,614 $ 5,791,676 (1) Fair value includes securities issued by Federal National Mortgage Association (FNMA) of $387.1 million and $405.1 million; Federal Home
Loan Mortgage Corporation (FHLMC) of $344.3 million and $283.1 million; and Government National Mortgage Association (GNMA) of $132.3 million and $147.4 million as of December 31, 2020 and 2019, respectively.
NOTE 2 - Investments (continued)
94 Annual Report on Form 10-K Horace Mann Educators Corporation

The following table presents the fair value and gross unrealized losses for fixed maturity securities in an unrealized loss position at December 31, 2020 and 2019, respectively. The Company views the decrease in fair value of all of the fixed maturity securities with unrealized losses at December 31, 2020 — which was driven largely by increasing interest rates, spread widening, financial market illiquidity and/or market volatility from the date of acquisition — as temporary. As of December 31, 2020, the Company has not made the decision to sell and it is not more likely than not the Company will be required to sell the fixed maturity securities with unrealized losses before recovery in value. Therefore, it was determined that the unrealized losses on the fixed maturity securities presented in the table below were not other-than-temporarily impaired as of December 31, 2020.
($ in thousands) 12 months or less More than 12 months Total
Fair Value
GrossUnrealized
Losses Fair Value
GrossUnrealized
Losses Fair Value
GrossUnrealized
Losses
December 31, 2020
Fixed maturity securities
U.S. Government and federallysponsored agency obligations:
Mortgage-backed securities $ 4,842 $ 75 $ 2,644 $ 156 $ 7,486 $ 231
Other 95,919 1,033 — — 95,919 1,033
Municipal bonds 18,097 504 — — 18,097 504
Foreign government bonds — — — — — —
Corporate bonds 126,619 3,768 10,879 174 137,498 3,942
Other asset-backed securities 316,973 17,153 409,274 5,519 726,247 22,672
Total $ 562,450 $ 22,533 $ 422,797 $ 5,849 $ 985,247 $ 28,382
Number of positions with agross unrealized loss 308 123 431
Fair value as a percentage of total fixedmaturities securities fair value 8.9 % 6.7 % 15.6 %
December 31, 2019
Fixed maturity securities
U.S. Government and federallysponsored agency obligations:
Mortgage-backed securities $ 72,422 $ 1,282 $ 2,620 $ 205 $ 75,042 $ 1,487
Other 38,341 619 1,527 2 39,868 621
Municipal bonds 91,195 977 9,160 603 100,355 1,580
Foreign government bonds — — — — — —
Corporate bonds 58,198 886 16,622 909 74,820 1,795
Other asset-backed securities 218,710 1,970 442,791 6,161 661,501 8,131
Total $ 478,866 $ 5,734 $ 472,720 $ 7,880 $ 951,586 $ 13,614
Number of positions with a gross unrealized loss 330 137 467
Fair value as a percentage of total fixedmaturities securities fair value 8.3 % 8.2 % 16.5 %
Fixed maturity securities with an investment grade rating represented 81.2% of the gross unrealized losses as of December 31, 2020. With respect to fixed maturity securities involving securitized financial assets, the underlying collateral cash flows were stress tested to determine there was no adverse change in the present value of cash flows below the amortized cost basis.
NOTE 2 - Investments (continued)
Horace Mann Educators Corporation Annual Report on Form 10-K 95

Credit LossesThe following table summarizes the cumulative amounts related to the Company's credit loss component of OTTI losses on fixed maturity securities held as of December 31, 2020 and 2019 that the Company did not intend to sell as of those dates, and it was not more likely than not that the Company would be required to sell the securities before an anticipated recovery in value, for which the non-credit portions of OTTI losses were recognized in OCI:
($ in thousands) Year Ended December 31,
2020 2019
Cumulative credit loss (1)
Beginning of period $ 1,529 $ 1,529 New credit losses 184 — Increases to previously recognized credit losses — — Losses related to securities sold or paid down during the period (184) —
End of period $ 1,529 $ 1,529 (1) The cumulative credit loss amounts exclude OTTI losses on fixed maturity securities held as of the periods indicated that the Company
intended to sell or it was more likely than not that the Company would be required to sell the security before an anticipated recovery in value.
For the year ended December 31, 2020, there was no allowance recognized for current expected credit losses with respect to fixed maturity securities classified as available for sale.
Maturities of Fixed Maturity SecuritiesThe following table presents the distribution of the Company's fixed maturity securities portfolio by estimated expected maturity. Estimated expected maturities differ from contractual maturities, reflecting assumptions regarding borrowers' utilization of the right to call or prepay obligations with or without call or prepayment penalties. For structured securities, estimated expected maturities consider broker-dealer survey prepayment assumptions and are verified for consistency with the interest rate and economic environments.
($ in thousands) December 31, 2020
AmortizedCost
FairValue
Percent ofTotal Fair
Value
Estimated expected maturity:Due in 1 year or less $ 255,416 $ 261,387 4.0 %Due after 1 year through 5 years 1,712,114 1,793,111 28.3 %Due after 5 years through 10 years 1,608,614 1,775,766 28.0 %Due after 10 years through 20 years 1,358,865 1,559,501 24.6 %Due after 20 years 853,542 955,525 15.1 %
Total $ 5,788,551 $ 6,345,290 100.0 %
Average option-adjusted duration, in years 6.4
NOTE 2 - Investments (continued)
96 Annual Report on Form 10-K Horace Mann Educators Corporation

Sales of Fixed Maturity and Equity SecuritiesProceeds received from sales of fixed maturity and equity securities, each determined using the specific identification method, and gross gains and gross losses realized as a result of those sales for each year were as follows:
($ in thousands) Year Ended December 31,
2020 2019 (1) 2018
Fixed maturity securitiesProceeds received $ 472,913 $ 805,887 $ 625,527 Gross gains realized 20,470 150,852 10,536 Gross losses realized (6,072) (7,807) (14,932)
Equity securitiesProceeds received $ 12,717 $ 29,863 $ 25,498 Gross gains realized 2,197 9,193 8,592 Gross losses realized (1,885) (788) (917)
(1) Gross gains realized presented above include a $135.3 million realized investment gain associated with a transfer of investments to a reinsurer as consideration paid during the second quarter of 2019 in connection with the reinsurance of a $2.9 billion block of in force fixed and variable annuity business. See Notes 5 and 17 for further information.
Net Unrealized Investment Gains (Losses) on Fixed Maturity SecuritiesThe following table reconciles the net unrealized investment gains (losses) on fixed maturity securities, net of tax, included in AOCI, before the impact on DAC:
($ in thousands) Year Ended December 31,
2020 2019 2018
Net unrealized investment gains (losses) on fixed maturity securities, net of tax
Beginning of period $ 264,410 $ 111,712 $ 286,176
Change in net unrealized investment gains (losses) on fixed maturity securities 184,290 277,062 (172,350)
Reclassification of net investment (gains) losses on securities to net income (8,876) (124,364) 12,927
Cumulative effect of change in accounting principle (1) — — (15,041) End of period $ 439,824 $ 264,410 $ 111,712
(1) Effective January 1, 2018, with the adoption of new accounting guidance for recognition and measurement of financial instruments, available for sale equity securities were reclassified to equity securities at fair value and the related net unrealized gains were reclassified from AOCI to Retained earnings.
Limited Partnership Interests
As of December 31, 2020 and 2019, the carrying amount of equity method limited partnership interests totaled $449.0 million and $383.7 million, respectively. Principal factors influencing carrying amount appreciation or decline include operating performance, comparable public company earnings multiples, capitalization rates and the economic environment. The Company recognizes an impairment loss for equity method limited partnerships when evidence demonstrates that the loss is other than temporary. Evidence of a loss in value that is other than temporary may include the absence of an ability to recover the carrying amount of the investment or the inability of the investee to sustain a level of earnings that would justify the carrying amount of the investment.
Investment in Entities Exceeding 10% of Shareholders' Equity
At December 31, 2020 and 2019, there were no investments which exceeded 10% of total shareholders' equity in entities other than obligations of the U.S. Government and federally sponsored government agencies and authorities.
NOTE 2 - Investments (continued)
Horace Mann Educators Corporation Annual Report on Form 10-K 97

Offsetting of Assets and Liabilities
The Company's derivatives are subject to enforceable master netting arrangements. Collateral support agreements associated with each master netting arrangement provide that the Company will receive or pledge financial collateral in the event minimum thresholds have been reached.
The following table presents the instruments that were subject to a master netting arrangement for the Company.
($ in thousands)
GrossAmounts
Offset in the Consolidated
BalanceSheets
Net Amountsof Assets/LiabilitiesPresented
in the Consolidated
BalanceSheets
Gross Amounts Not Offsetin the Consolidated
Balance Sheets
GrossAmounts
FinancialInstruments
CashCollateralReceived
NetAmount
December 31, 2020Asset derivatives
Free-standing derivatives $ 16,805 $ — $ 16,805 $ 13,671 $ 2,620 $ 514
December 31, 2019Asset derivatives
Free-standing derivatives 13,239 — 13,239 7,687 6,640 (1,088)
Deposits
At December 31, 2020 and 2019, fixed maturity securities with a fair value of $26.9 million and $26.0 million, respectively, were on deposit with governmental agencies as required by law in various states for which the insurance subsidiaries of HMEC conduct business. In addition, at December 31, 2020 and 2019, fixed maturity securities with a fair value of $707.3 million and $594.2 million, respectively, were on deposit with FHLB as collateral for amounts subject to funding agreements, advances and borrowings which were equal to $644.5 million and $545.0 million at the respective dates. The deposited securities are reported as Fixed maturity securities on the Company's Consolidated Balance Sheets.
NOTE 3 - Fair Value of Financial Instruments
The Company is required to disclose estimated fair values for certain financial and nonfinancial assets and liabilities. Fair values of the Company's insurance contracts other than annuity contracts (which are investment contracts) are not required to be disclosed. However, the estimated fair values of liabilities under all insurance contracts are taken into consideration in the Company's overall management of interest rate risk through the matching of investment maturities with amounts due under insurance contracts.
Fair value is defined as the exchange price that would be received for an asset or paid to transfer a liability (an exit price) in the principal or most advantageous market for the asset or liability in an orderly transaction between knowledgeable, unrelated and willing market participants on the measurement date. In determining fair value, the Company utilizes valuation techniques that maximize the use of observable inputs and minimize the use of unobservable inputs. The Company categorizes its financial and nonfinancial assets and liabilities into a three-level hierarchy based on the priority of the inputs to the valuation technique. The three levels of inputs that may be used to measure fair value are:
Level 1 Unadjusted quoted prices in active markets for identical assets or liabilities. Level 1 assets and liabilities include fixed maturity and equity securities (both common stock and preferred stock) that are traded in an active exchange market, as well as U.S. Treasury securities.
Level 2 Unadjusted observable inputs other than Level 1 prices such as quoted prices for similar assets or liabilities; quoted prices in markets that are not active; or other inputs that are observable or can be corroborated by observable market data for the assets or liabilities. Level 2 assets and liabilities include fixed maturity securities (1) with quoted prices that are traded less frequently than exchange-traded instruments or (2) values based on discounted cash flows with observable inputs. This category generally includes certain U.S. Government and agency mortgage-backed securities, non-agency structured securities, corporate fixed maturity securities, preferred stocks, derivatives and embedded derivatives.
NOTE 2 - Investments (continued)
98 Annual Report on Form 10-K Horace Mann Educators Corporation

Level 3 Unobservable inputs that are supported by little or no market activity and that are significant to the fair value of the assets or liabilities. Level 3 assets and liabilities include financial instruments whose value is determined using pricing models, certain discounted cash flow methodologies, or similar techniques, as well as instruments for which the determination of fair value requires significant management judgment or estimation and for which the significant inputs are unobservable. This category generally includes certain private debt and equity investments, as well as embedded derivatives.
When the inputs used to measure fair value fall within different levels of the hierarchy, the level within which the fair value measurement is categorized is based on the lowest level input that is significant to the fair value measurement in its entirety. As a result, a Level 3 fair value measurement may include inputs that are observable (Level 1 or Level 2) and unobservable (Level 3). Net transfers into or out of each of the three levels are reported as having occurred at the end of the reporting period in which the transfers were determined.
The following discussion describes the valuation methodologies used for financial assets and financial liabilities measured at fair value. The techniques utilized in estimating the fair values are affected by the assumptions used, including discount rates and estimates of the amount and timing of expected future cash flows. The use of different methodologies, assumptions and inputs may have a material effect on the estimated fair values of the Company's investment holdings. Care is exercised in deriving conclusions about the Company's business, its value or financial position based on the fair value information of financial assets and liabilities presented below.
Fair value estimates are made at a specific point in time, based on available market information and judgments about the financial asset or financial liability, including estimates of both the timing and amount of expected future cash flows and the credit standing of the issuer. In some cases, fair value estimates cannot be substantiated by comparison to independent markets. In addition, the disclosed fair value may not be realized in the immediate settlement of the financial asset or financial liability. The disclosed fair values do not reflect any premium or discount that could result from offering for sale at one time an entire holding of a particular financial asset or financial liability. In periods of market disruption, the ability to observe prices and inputs may be reduced for many instruments. This condition could cause an instrument to be reclassified from Level 1 to Level 2 or from Level 2 to Level 3. Potential taxes and other expenses that would be incurred in an actual sale or settlement are not reflected in amounts disclosed.
Investments
The fair value of a fixed maturity security is the estimated amount at which the security could be exchanged in an orderly transaction between knowledgeable, unrelated and willing parties. The Company utilizes its investment managers and its custodian bank to obtain fair value prices from independent third-party valuation service providers, broker-dealer quotes, and model prices. Each month, the Company obtains fair value prices from its investment managers and custodian bank, each of which use a variety of independent, nationally recognized pricing sources to determine market valuations for fixed maturity securities. Differences in prices between the sources that the Company considers significant are researched and the Company utilizes the price that it considers most representative of an exit price. Typical inputs used by these pricing sources include, but are not limited to, reported trades, bids, offers, benchmark yield curves, benchmarking of like securities, rating designations, sector groupings, issuer spreads and/or estimated cash flows, prepayment and default speeds, among others. The Company's fixed maturity securities portfolio is primarily publicly traded, which allows for a high percentage of the portfolio to be priced through pricing services. Approximately 91.9% and 94.1% of the portfolio, based on fair value, was priced through pricing services or index priced as of December 31, 2020 and 2019, respectively. The remainder of the portfolio was priced by broker-dealers or pricing models. When non-binding broker-dealer quotes can be corroborated by comparison to other vendor quotes, pricing models or analyses, the securities are generally classified as Level 2, otherwise they are classified as Level 3. There were no significant changes to the valuation process during 2020.
The valuation of hard-to-value fixed maturity securities (generally 100 -150 securities) is more subjective because the markets are less liquid and there is a lack of observable market-based inputs. This may increase the potential that the estimated fair value of an investment is not reflective of the price at which an actual transaction would occur. When the pricing sources cannot provide fair value determinations, the investment managers and custodian bank obtain non-binding price quotes from broker-dealers. For those securities where the investment manager cannot obtain broker-dealer quotes, they will model the security, generally using anticipated cash flows of the underlying collateral. Broker-dealers' valuation methodologies as well as investment managers’ modeling
NOTE 3 - Fair Value of Financial Instruments (continued)
Horace Mann Educators Corporation Annual Report on Form 10-K 99

methodologies are sometimes matrix-based, using indicative evaluation measures and adjustments for specific security characteristics and market sentiment. The selection of the market inputs and assumptions used to estimate the fair value of hard-to-value fixed maturity securities requires judgment and includes: benchmark yield, liquidity premium, estimated cash flows, prepayment and default speeds, spreads, weighted average life, and credit rating. The extent of the use of each market input depends on the market sector and market conditions. Depending on the security, the priority of the use of inputs may change or some market inputs may not be relevant. For some securities, additional inputs may be necessary.
The Company gains assurance that its portfolio of fixed maturity securities including hard-to-value fixed maturity securities is appropriately valued through the execution of various processes and controls designed to ensure the overall reasonableness and consistent application of valuation methodologies, including inputs and assumptions, and compliance with accounting standards. The Company’s processes and controls are designed to ensure (1) the valuation methodologies are appropriate and consistently applied, (2) the inputs and assumptions are reasonable and consistent with the objective of determining fair value, and (3) the fair values are accurately recorded. For example, on a continuing basis, the Company assesses the reasonableness of individual fair values that have stale security prices or that exceed certain thresholds as compared to previous fair values received from valuation service providers. The Company performs procedures to understand and assess the methodologies, processes and controls of valuation service providers. In addition, the Company may validate the reasonableness of fair values by comparing information obtained from valuation service providers or broker-dealers to other third-party valuation sources for selected securities.
To determine the fair value of equity securities, the Company utilizes its investment managers and its custodian bank to obtain fair value prices from independent third-party valuation service providers. Each month, the Company obtains fair value prices from its investment managers and custodian bank, each of which use a variety of independent, nationally recognized pricing sources to determine market valuations for equity securities.
Policy loans and mortgage loans as well as certain alternative investments which are accounted for using the equity method of accounting are excluded from the fair value hierarchy.
In summary, the following financial assets and financial liabilities are carried at fair value:
Financial assets
• Fixed maturity securities including hard-to-value fixed maturity securities, as described above.
• Equity securities, as described above.
• Short-term fixed maturity securities — Because of the nature of these assets, carrying amounts generally approximate fair values.
• Derivatives, all call options — Fair values are based on the amount of cash expected to be received to settle each derivative on the reporting date. These amounts are obtained from each of the counterparties using industry accepted valuation models and observable inputs. Significant inputs include contractual terms, underlying index prices, market volatilities, interest rates and dividend yields.
• FHLB membership and activity stocks — Fair value is based on redemption value, which is equal to par value.
Financial liabilities
• The fair value of derivatives embedded in IUL contracts is set equal to the fair value of the outstanding call options.
• The fair value of derivatives embedded in FIA contracts is determined using the option budget method for each premium received (i.e., the option budget method is used as the future account growth rate). With this method, future excess cash flows (defined as benefits in excess of required non-forfeiture benefits) are discounted at the risk-free rate and adjusted for non-performance, to determine the fair value of the embedded derivatives.
NOTE 3 - Fair Value of Financial Instruments (continued)
100 Annual Report on Form 10-K Horace Mann Educators Corporation
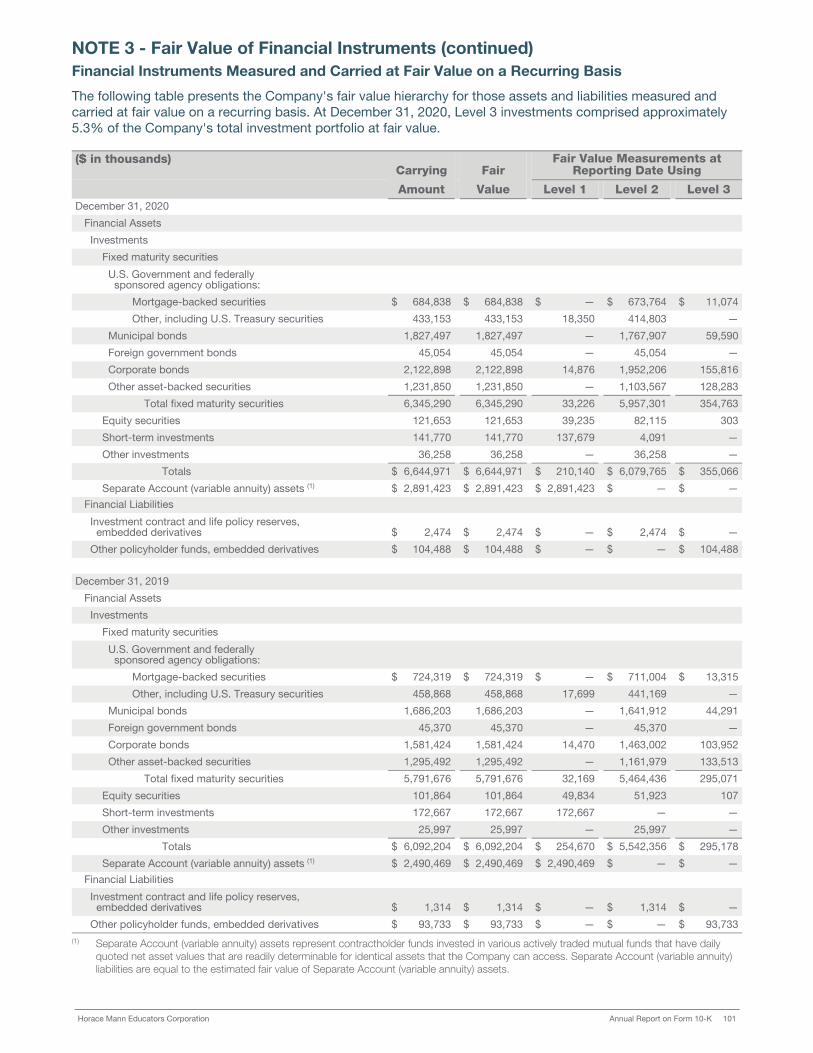
Financial Instruments Measured and Carried at Fair Value on a Recurring Basis
The following table presents the Company's fair value hierarchy for those assets and liabilities measured and carried at fair value on a recurring basis. At December 31, 2020, Level 3 investments comprised approximately 5.3% of the Company's total investment portfolio at fair value.
($ in thousands)Carrying Fair
Fair Value Measurements atReporting Date Using
Amount Value Level 1 Level 2 Level 3
December 31, 2020
Financial Assets
Investments
Fixed maturity securities
U.S. Government and federallysponsored agency obligations:
Mortgage-backed securities $ 684,838 $ 684,838 $ — $ 673,764 $ 11,074
Other, including U.S. Treasury securities 433,153 433,153 18,350 414,803 —
Municipal bonds 1,827,497 1,827,497 — 1,767,907 59,590
Foreign government bonds 45,054 45,054 — 45,054 —
Corporate bonds 2,122,898 2,122,898 14,876 1,952,206 155,816
Other asset-backed securities 1,231,850 1,231,850 — 1,103,567 128,283
Total fixed maturity securities 6,345,290 6,345,290 33,226 5,957,301 354,763
Equity securities 121,653 121,653 39,235 82,115 303
Short-term investments 141,770 141,770 137,679 4,091 —
Other investments 36,258 36,258 — 36,258 —
Totals $ 6,644,971 $ 6,644,971 $ 210,140 $ 6,079,765 $ 355,066
Separate Account (variable annuity) assets (1) $ 2,891,423 $ 2,891,423 $ 2,891,423 $ — $ — Financial Liabilities
Investment contract and life policy reserves,embedded derivatives $ 2,474 $ 2,474 $ — $ 2,474 $ —
Other policyholder funds, embedded derivatives $ 104,488 $ 104,488 $ — $ — $ 104,488
December 31, 2019
Financial Assets
Investments
Fixed maturity securities
U.S. Government and federallysponsored agency obligations:
Mortgage-backed securities $ 724,319 $ 724,319 $ — $ 711,004 $ 13,315
Other, including U.S. Treasury securities 458,868 458,868 17,699 441,169 —
Municipal bonds 1,686,203 1,686,203 — 1,641,912 44,291
Foreign government bonds 45,370 45,370 — 45,370 —
Corporate bonds 1,581,424 1,581,424 14,470 1,463,002 103,952
Other asset-backed securities 1,295,492 1,295,492 — 1,161,979 133,513
Total fixed maturity securities 5,791,676 5,791,676 32,169 5,464,436 295,071
Equity securities 101,864 101,864 49,834 51,923 107
Short-term investments 172,667 172,667 172,667 — —
Other investments 25,997 25,997 — 25,997 —
Totals $ 6,092,204 $ 6,092,204 $ 254,670 $ 5,542,356 $ 295,178
Separate Account (variable annuity) assets (1) $ 2,490,469 $ 2,490,469 $ 2,490,469 $ — $ — Financial Liabilities
Investment contract and life policy reserves,embedded derivatives $ 1,314 $ 1,314 $ — $ 1,314 $ —
Other policyholder funds, embedded derivatives $ 93,733 $ 93,733 $ — $ — $ 93,733 (1) Separate Account (variable annuity) assets represent contractholder funds invested in various actively traded mutual funds that have daily
quoted net asset values that are readily determinable for identical assets that the Company can access. Separate Account (variable annuity) liabilities are equal to the estimated fair value of Separate Account (variable annuity) assets.
NOTE 3 - Fair Value of Financial Instruments (continued)
Horace Mann Educators Corporation Annual Report on Form 10-K 101

Changes in Level 3 Fair Value Measurements
The Company did not have any transfers between Levels 1 and 2 during 2020 and 2019. The following tables present reconciliations for the periods indicated for all Level 3 assets and liabilities measured at fair value on a recurring basis.
($ in thousands)Financial Assets
FinancialLiabilities (1)
MunicipalBonds
Corporate Bonds
Mortgageand Asset-
BackedSecurities (2)
TotalFixed
MaturitySecurities
EquitySecurities Total
Beginning balance, January 1, 2020 $ 44,291 $ 103,952 $ 146,828 $ 295,071 $ 107 $ 295,178 $ 93,733
Transfers into Level 3 (3) 80,686 83,621 104,263 268,570 234 268,804 —
Transfers out of Level 3 (3) (69,074) (36,620) (84,679) (190,373) — (190,373) —
Total gains or losses
Net investment gains (losses) included in net income related to financial assets — — (239) (239) (38) (277) —
Net investment (gains) losses included in net income related to financial liabilities — — — — — — 11,499
Net unrealized investment gains(losses) included in OCI 4,252 1,427 (10,471) (4,792) — (4,792) —
Purchases — 6,875 1,890 8,765 — 8,765 —
Issuances — — — — — — 8,373
Sales — — 1,214 1,214 — 1,214 —
Settlements — — — — — — —
Paydowns, maturities and distributions (565) (3,439) (19,449) (23,453) — (23,453) (9,117)
Ending balance, December 31, 2020 $ 59,590 $ 155,816 $ 139,357 $ 354,763 $ 303 $ 355,066 $ 104,488
Beginning balance, January 1, 2019 $ 47,531 $ 80,742 $ 120,211 $ 248,484 $ 5 $ 248,489 $ 78,700
Transfers into Level 3 (3) — 33,475 56,766 90,241 65 90,306 —
Transfers out of Level 3 (3) — (7,698) (2,568) (10,266) — (10,266) —
Total gains or losses
Net investment gains (losses) included in net income related to financial assets — — (1,105) (1,105) 38 (1,067) —
Net investment (gains) losses included in net income related to financial liabilities — — — — — — 12,636
Net unrealized investment gains(losses) included in OCI 474 4,461 6,100 11,035 — 11,035 —
Purchases — 2,483 — 2,483 — 2,483 —
Issuances — — — — — — 10,039
Sales — — (607) (607) (1) (608) —
Settlements — — — — — — —
Paydowns, maturities and distributions (3,714) (9,511) (31,969) (45,194) — (45,194) (7,642)
Ending balance, December 31, 2019 $ 44,291 $ 103,952 $ 146,828 $ 295,071 $ 107 $ 295,178 $ 93,733 (1) Represents embedded derivatives, all related to the Company's FIA products, reported in Other policyholder funds in the Company's
Consolidated Balance Sheets.(2) Includes U.S. Government and federally sponsored agency obligations for mortgage-backed securities and other asset-backed securities.(3) Transfers into and out of Level 3 during the years ended December 31, 2020 and 2019 were attributable to changes in the availability of
observable market information for individual fixed maturity securities and short-term investments. The Company's policy is to recognize transfers into and out of the levels as having occurred at the end of the reporting period in which the transfers were determined.
NOTE 3 - Fair Value of Financial Instruments (continued)
102 Annual Report on Form 10-K Horace Mann Educators Corporation

At December 31, 2020, the Company had a $0.3 million net investment loss on Level 3 financial assets. At December 31, 2019 the Company had a $1.1 million net investment loss on Level 3 financial assets. For the years ended December 31, 2020 and 2019, net investment losses of $11.5 million and $12.6 million, respectively, were included in net income that were attributable to the changes in the fair value of Level 3 financial liabilities still held.
Quantitative Information about Level 3 Fair Value Measurements
The following table provides quantitative information about the significant unobservable inputs for recurring fair value measurements categorized within Level 3.
($ in thousands)
Financial Assets
Fair Value at December 31,
2020Valuation
Technique(s) Unobservable Inputs
Range (Weighted Average)
and Single Point Best Estimate (1)
Municipal bonds $ 59,590 discounted cash flow I spread (2) 307 - 391 bps
Corporate bonds 155,816 discounted cash flow N spread (3) 272 - 553 bps
market comparable option adjusted spread 12.54%
Other asset-backed securities 128,283 vendor price haircut 3.00% - 5.00%
discounted cash flow constant prepayment rate 20.00%
discounted cash flow T spread (4) 235 - 800 bps
discounted cash flow PDI interest margin (5) 7.13%
discounted cash flow SBL interest margin (6) 4.50%Government mortgage-backed securities 11,074 vendor price haircut 3.00% - 5.00%
Equity securities 303 Black-Scholes equity value low - 31.00%; high - 41.00%
($ in thousands)
Financial Liabilities
Fair Value at December 31,
2020Valuation
Technique(s) Unobservable Inputs
Range (Weighted Average)
and Single Point Best Estimate (1)
Derivativesembedded in fixed indexed annuity products $ 104,488 discounted cash flow lapse rate 5.30%
mortality multiplier (7) 63.00%
option budget 0.90% - 2.50%
non-performance adjustment (8) 5.00%(1) When a range of unobservable inputs is not readily available, the Company uses a single point best estimate.(2) "I spread" is the interpolated weighted average life point on the "on the run" (OTR) point of the curve.(3) "N spread" is the interpolated weighted average life point on the swap curve.(4) "T spread" is a specific point on the OTR curve.(5) "PDI" stands for private debt investment.(6) "SBL" stands for broadly syndicated loans.(7) Mortality multiplier is applied to the Annuity 2000 table.(8) Determined as a percentage of a risk-free rate.
The valuation techniques and significant unobservable inputs used in the fair value measurement for financial assets and liabilities classified as Level 3 are subject to the control processes as previously described in this Note. Generally, valuation techniques for fixed maturity securities include spread pricing, matrix pricing and discounted cash flow methodologies; include inputs such as quoted prices for identical or similar securities that are less liquid; and are based on lower levels of trading activity than securities classified as Level 2. The valuation techniques and significant unobservable inputs used in the fair value measurement for equity securities classified as Level 3 use similar valuation techniques and significant unobservable inputs as those used for fixed maturity securities.
NOTE 3 - Fair Value of Financial Instruments (continued)
Horace Mann Educators Corporation Annual Report on Form 10-K 103

The sensitivity of the estimated fair values to changes in the significant unobservable inputs for fixed maturity and equity securities included in Level 3 include: benchmark yield, liquidity premium, estimated cash flows, prepayment and default speeds, spreads, weighted average life, and credit rating. Significant spread widening in isolation will adversely impact the overall valuation, while significant tightening will lead to substantial valuation increases. Significant increases (decreases) in illiquidity premiums in isolation will result in substantially lower (higher) valuations. Significant increases (decreases) in expected default rates in isolation will result in substantially lower (higher) valuations.
Financial Instruments Not Carried at Fair Value; Disclosure Required
The Company has various other financial assets and financial liabilities used in the normal course of business that are not carried at fair value, but for which fair value disclosure is required. The following table presents the carrying amount, fair value and fair value hierarchy of these financial assets and financial liabilities.
($ in thousands)Carrying Fair
Fair Value Measurements atReporting Date Using
Amount Value Level 1 Level 2 Level 3
December 31, 2020Financial AssetsInvestmentsOther investments $ 168,296 $ 172,073 $ — $ — $ 172,073
Deposit asset on reinsurance 2,420,926 3,030,589 — — 3,030,589 Financial LiabilitiesInvestment contract and policy reserves,fixed annuity contracts 4,847,648 4,963,318 — — 4,963,318
Investment contract and life policy reserves,account values on life contracts 98,719 108,360 — — 108,360
Other policyholder funds 646,809 646,809 — 590,692 56,117 Short-term debt 135,000 135,000 — — 135,000 Long-term debt 302,323 331,136 — 331,136 —
December 31, 2019Financial AssetsInvestmentsOther investments $ 163,312 $ 167,185 $ — $ — $ 167,185
Deposit asset on reinsurance 2,346,166 2,634,012 — — 2,634,012 Financial LiabilitiesInvestment contract and policy reserves,fixed annuity contracts 4,675,774 4,609,880 — — 4,609,880
Investment contract and life policy reserves,account values on life contracts 93,465 98,332 — — 98,332
Other policyholder funds 553,550 553,550 — 495,812 57,738 Short-term debt 135,000 135,000 — — 135,000 Long-term debt 298,025 322,678 — 322,678 —
NOTE 3 - Fair Value of Financial Instruments (continued)
104 Annual Report on Form 10-K Horace Mann Educators Corporation

Other InvestmentsOther investments includes policy loans and mortgage loans. For policy loans, fair value is based on estimates using discounted cash flow analysis and current interest rates being offered for new loans. For mortgage loans, fair value is estimated by discounting the future cash flows using current rates at which similar loans would be made to borrowers with similar credit ratings and similar remaining maturities.
Deposit Asset on ReinsuranceThe fair value of the deposit asset on reinsurance is estimated by discounting the future cash flows that are expected to arise out of the annuity reinsurance transaction. The treasury yield curve, plus an assumed credit spread, is used to determine the appropriate discount rate.
Investment Contract and Policy ReservesThe fair values of fixed annuity contract liabilities and policyholder account balances on life contracts are equal to the discounted estimated future cash flows (using the Company's current interest rates for similar products including consideration of minimum guaranteed interest rates). The Company carries these financial liabilities at cost.
Also, included in investment contract and policy reserves are embedded derivatives related to the Company's IUL products which are carried at fair value. See Note 4 for further information.
Other Policyholder FundsOther policyholder funds are liabilities related to supplementary contracts without life contingencies and dividend accumulations, as well as balances outstanding under funding agreements with the FHLB and embedded derivatives related to the FIA products. Except for embedded derivatives, each of these components is carried at cost, which management believes is a reasonable estimate of fair value due to the relatively short duration of these items, based on the Company's past experience.
The fair value of the embedded derivatives related to FIA products is estimated at each reporting date by (1) projecting policy contract values and minimum guaranteed contract values over the expected lives of the contracts and (2) discounting the excess of the projected contract value amounts at the applicable risk free interest rates adjusted for the Company's nonperformance risk related to those liabilities. The projections of policy contract values are based on the Company's best estimate assumptions for future contract growth and decrements. The assumptions for future contract growth include the expected index credits which are derived from the fair values of the underlying call options purchased to fund such index credits and the expected costs of annual call options that will be purchased in the future to fund index credits beyond the next contract anniversary. Projections of minimum guaranteed contract values include the same best estimate assumptions for contract decrements used to project policy contract values.
Short-term DebtThe Company carries short-term debt at amortized cost which approximates fair value.
Long-term DebtThe Company carries long-term debt at amortized cost. The fair value of long-term debt is estimated based on unadjusted quoted market prices of the Company's securities or unadjusted market prices based on similar publicly traded issues when trading activity for the Company's securities is not sufficient to provide a market price.
NOTE 4 - Derivatives
The Company offers FIA products, which are deferred fixed annuities that guarantee the return of principal to the contractholder and credit interest based on a percentage of the gain in a specified market index. The Company also offers IUL products which credit interest based on a percentage of the gain in a specified market index. When deposits are received for FIA and IUL contracts, a portion is used to purchase derivatives consisting of call options on the applicable market indices to fund the index credits due to FIA and IUL policyholders. For the Company, substantially all such call options are one-year options purchased to match the funding requirements of the underlying contracts. The call options are carried at fair value with changes in fair value included in Net investment gains (losses), a component of revenues, in the Consolidated Statements of Operations.
NOTE 3 - Fair Value of Financial Instruments (continued)
Horace Mann Educators Corporation Annual Report on Form 10-K 105

The change in fair value of derivatives includes the gains or losses recognized at the expiration of the option term or early termination and the changes in fair value for open positions. Call options are not purchased to fund the index liabilities that may arise after the next deposit anniversary date. On the respective anniversary dates of the indexed deposits, the index used to compute the annual index credit is reset and new one-year call options are purchased to fund the next annual index credit. The cost of these purchases is managed through the terms of the FIA and IUL contracts, which permit changes to index return caps, participation rates and/or asset fees, subject to guaranteed minimums on each contract's anniversary date. By adjusting the index return caps, participation rates or asset fees, crediting rates generally can be managed except in cases where the contractual features would prevent further modifications.
The future annual index credits on FIA are accounted for as a "series of embedded derivatives" over the expected life of the applicable contract with a corresponding reserve recognized. For IUL, the embedded derivative represents a single year liability for the index return.
The Company carries all derivatives at fair value in the Consolidated Balance Sheets. The Company elected to not use hedge accounting for derivative transactions related to the FIA and IUL products. As a result, the Company recognizes the purchased call options and the embedded derivatives related to the provision of a contingent return at fair value, with changes in the fair value of the derivatives recognized immediately as Net investment gains (losses) in the Consolidated Statements of Operations. The fair values of derivatives, including derivatives embedded in FIA and IUL contracts, are presented in the Consolidated Balance Sheets as follows:
($ in thousands) December 31,
2020 2019
AssetsDerivatives, reported in Short-term and other investments $ 16,805 $ 13,239
Liabilities
FIA - embedded derivatives, reported in Other policyholder funds 104,488 93,733
IUL - embedded derivatives, reported in Investment contract and policy reserves 2,474 1,314
In general, the change in the fair value of the embedded derivatives related to FIA will not correspond to the change in fair value of the purchased call options because the purchased call options are one-year options while the options valued in the embedded derivatives represent the rights of the policyholder to receive index credits over the entire period the FIA contracts are expected to be in force, which typically exceeds 10 years. The changes in fair value of derivatives included in the Consolidated Statements of Operations were as follows:
($ in thousands) Years Ended December 31,
2020 2019 2018
Change in fair value of derivatives: (1)
RevenuesNet investment gains (losses) $ 248 $ 9,493 $ (4,112)
Change in fair value of embedded derivatives:Revenues
Net investment gains (losses) (12,055) (13,576) 7,931 (1) Includes gains or losses recognized at option expiration or early termination and changes in fair value for open positions.
NOTE 4 - Derivatives (continued)
106 Annual Report on Form 10-K Horace Mann Educators Corporation

The Company's strategy attempts to mitigate potential risk of loss under these agreements through a regular monitoring process, which evaluates the program's effectiveness. The Company is exposed to risk of loss in the event of nonperformance by the counterparties and, accordingly, option contracts are purchased from multiple counterparties, which are evaluated for creditworthiness prior to purchase of the contracts. All of these options have been purchased from nationally recognized financial institutions with a S&P/Moody's Investors Service, Inc. (Moody's) long-term credit rating of "BBB+/A3" or higher at the time of purchase and the maximum credit exposure to any single counterparty is subject to concentration limits. The Company also obtains credit support agreements that allow it to request the counterparty to provide cash collateral when the fair value of the exposure to the counterparty exceeds specified amounts.
The notional amount and fair value of call options by counterparty and each counterparty's long-term credit ratings were as follows:
($ in thousands) December 31, 2020 December 31, 2019
Credit Rating Notional Fair Notional Fair
Counterparty S&P Moody's Amount Value Amount Value
Bank of America, N.A. A+ Aa2 $ 205,200 $ 14,006 $ 174,900 $ 8,523 Barclays Bank PLC A A1 81,900 2,799 115,300 3,347 Citigroup Inc. BBB+ A3 — — — — Credit Suisse International A+ Aa3 — — — — Societe Generale A A1 — — 27,800 1,369
Total $ 287,100 $ 16,805 $ 318,000 $ 13,239
As of December 31, 2020 and 2019, the Company held $16.3 million and $14.3 million, respectively, of cash and financial instruments received from counterparties for derivative collateral, which is included in Other liabilities on the Consolidated Balance Sheets. This derivative collateral limits the Company's maximum amount of economic loss due to credit risk that would be incurred if parties to the call options failed completely to perform according to the terms of the contracts to $0.3 million per counterparty.
NOTE 5 - Deposit Asset on Reinsurance
During the second quarter of 2019, the Company reinsured a $2.9 billion block of in force fixed and variable annuity business with a minimum crediting rate of 4.5%. This represented approximately 50% of the Company’s in force fixed annuity account balances. The arrangement contains investment guidelines and a trust to help meet the Company’s risk management objectives.
The annuity reinsurance transaction was effective April 1, 2019. Under the agreement, approximately $2.2 billion of fixed annuity reserves were reinsured on a coinsurance basis for consideration of approximately $2.3 billion which resulted in recognition of an after tax realized investment gain of $106.9 million in the second quarter of 2019. The separate account assets and liabilities of approximately $0.7 billion were reinsured on a modified coinsurance basis and thus, remain on the Company's consolidated financial statements, but the related results of operations are fully reinsured.
The Company determined that the reinsurance agreement does not expose the reinsurer to a reasonable possibility of a significant loss from insurance risk. Therefore, the Company recognizes the reinsurance agreement using the deposit method of accounting. The assets transferred to the reinsurer as consideration paid is reported as a Deposit asset on reinsurance on the Company's Consolidated Balance Sheets. As amounts are received or paid, consistent with the underlying reinsured contracts, the Deposit asset on reinsurance is adjusted. The Deposit asset on reinsurance is accreted to the estimated ultimate cash flows using the interest method and the adjustment is reported as Net investment income. Interest accreted on the Deposit asset on reinsurance was $97.3 million and $70.8 million for the years ended December 31, 2020 and 2019, respectively.
NOTE 4 - Derivatives (continued)
Horace Mann Educators Corporation Annual Report on Form 10-K 107

The Company conducts goodwill impairment testing at least annually, or more often if events, changes or circumstances indicate that the carrying amount may not be recoverable. See Note 1 for further description of impairment testing.
At October 1, 2020, the Company performed a quantitative goodwill impairment test. Based on the assessment, there were no events or circumstances that led to a determination that it is more likely than not that the fair value of a reporting unit is less than its carrying amount with exception to lower than anticipated BCG wealth management sales outside of the education markets which triggered an impairment of the goodwill associated with the BCG business of the Retirement reporting unit. For the evaluation, the fair value of BCG was measured using a discounted cash flow method. The carrying amount exceeded the fair value, resulting in a $5.6 million goodwill impairment charge.
In 2019, the annuity reinsurance transaction described in Note 5 triggered a requirement to evaluate the goodwill associated with the annuity business of the Retirement reporting unit. For the evaluation, the fair value of the Retirement reporting unit was measured using a discounted cash flow method. The carrying amount exceeded the fair value, resulting in a $28.0 million goodwill impairment charge during the second quarter of 2019. In the second quarter of 2019, the Company adopted guidance to eliminate Step 2 of the goodwill impairment test and as such, the goodwill impairment charge represented the entire balance of the goodwill associated with the annuity business of the Retirement reporting unit.
Goodwill impairment charges are reported as Other expense - goodwill and intangible asset impairments in the Consolidated Statements of Operations.
The changes in the carrying amount of goodwill by reportable segment for the year ended December 31, 2020 were as follows:
($ in thousands) December 31,2019 Impairments Acquisitions
December 31,2020
Property and Casualty $ 9,460 $ — $ — $ 9,460
Supplemental 19,621 — — 19,621
Retirement 10,087 (5,625) — 4,462
Life 9,911 — — 9,911
Total $ 49,079 $ (5,625) $ — $ 43,454
As of December 31, 2020, the outstanding amounts of definite-lived intangible assets subject to amortization are attributable to the acquisitions of BCG and NTA during 2019. The acquisition of BCG resulted in initial recognition of definite-lived intangible assets subject to amortization in the amount of $14.1 million and the acquisition of NTA resulted in initial recognition of definite-lived intangible assets subject to amortization in the amount of $160.4 million. As of December 31, 2020 the outstanding amounts of definite-lived intangible assets subject to amortization were as follows:
($ in thousands) Weighted Average
Useful Life (in Years)
At inception:Value of business acquired 30 $ 94,419 Value of distribution acquired 17 53,996 Value of agency relationships 14 16,981 Value of customer relationships 10 9,080
Total 23 174,476 Accumulated amortization and impairments:
Value of business acquired (10,835) Value of distribution acquired (8,684) Value of agency relationships (4,059) Value of customer relationships (3,202)
Total (26,780) Net intangible assets subject to amortization: $ 147,696
NOTE 6 - Goodwill and Intangible Assets
108 Annual Report on Form 10-K Horace Mann Educators Corporation

In regard to the definite-lived intangible assets in the table above, the VOBA intangible asset represents the difference between the fair value of insurance contracts and insurance policy reserves measured in accordance with the Company's accounting policies for insurance contracts acquired. VOBA was based on an actuarial estimate of the present value of future distributable earnings for insurance in force as of the acquisition date. The VODA intangible asset represents the present value of future business to be written by the existing distribution channel. The value of agency relationships intangible asset represents the present value of the commission overrides retained by NTA. The value of customer relationships intangible asset represents the present value of the expected profits from existing BCG customers in force at the date of acquisition. All of the aforementioned definite-lived intangible assets were valued using the income approach.
Estimated future amortization of the Company's definite-lived intangible assets were as follows:
($ in thousands)
Year Ending December 31,
2021 $ 13,067 2022 12,070 2023 11,232 2024 10,480 2025 9,811 Thereafter 91,036
Total $ 147,696
The VOBA intangible asset is being amortized by product based on the present value of future premiums to be received. The VODA intangible asset in respect to the acquisition of NTA is being amortized on a straight-line basis. The VODA intangible asset in respect to the acquisition of BCG is being amortized based on the present value of future profits to be received. The value of agency relationships intangible asset is being amortized based on the present value of future premiums to be received. The value of customer relationships intangible asset is being amortized based on the present value of future profits to be received.
Indefinite-lived intangible assets (not subject to amortization) as of December 31, 2020 were as follows:
($ in thousands) December 31,2019 Impairments Acquisitions
December 31,2020
Trade names $ 8,645 $ (767) $ — $ 7,878 State licenses 2,886 — — 2,886
Total $ 11,531 $ (767) $ — $ 10,764
The trade names intangible asset represents the present value of future savings accruing NTA and BCG by virtue of not having to pay royalties for the use of the trade names, valued using the relief from royalty method. The state licenses intangible asset represents the regulatory licenses held by NTA that were valued using the cost approach.
The Company conducts intangible asset impairment testing at least annually, or more often if events, changes or circumstances indicate that the carrying amounts may not be recoverable. See Note 1 for further description of impairment testing.
At October 1, 2020, the Company performed a qualitative assessment to determine whether it was necessary to perform quantitative intangible asset impairment tests. Based on the assessment of qualitative factors, there were no events or circumstances that led to a determination that it is more likely than not that the fair value of an intangible asset is less than its carrying amount with exception to lower than anticipated BCG wealth management sales outside of the education markets which triggered a requirement to evaluate the intangible assets associated with BCG. For the evaluation, the fair value of BCG's intangible assets were measured using discounted cash flow methods. The carrying amounts for VODA and trade names exceeded the fair values resulting in a $3.6 million intangible asset impairment charge for VODA and a $0.8 million intangible asset impairment charge for trade names.
Intangible asset impairment charges are reported as Other expense - goodwill and intangible asset impairments in the Consolidated Statements of Operations.
NOTE 6 - Goodwill and Intangible Assets (continued)
Horace Mann Educators Corporation Annual Report on Form 10-K 109

The following table is a summary reconciliation of the beginning and ending Property and Casualty unpaid claims and claim expense reserves for the periods indicated. The table presents reserves on both a gross and net (after reinsurance) basis. The total net Property and Casualty insurance claims and claim expense incurred amounts are reflected in the Consolidated Statements of Operations. The end of the year gross reserve (before reinsurance) balances and the reinsurance recoverable balances are reflected on a gross basis in the Consolidated Balance Sheets.
($ in thousands) Years Ended December 31,
2020 2019 2018
Property and Casualty segmentGross reserves, beginning of year (1) $ 386,976 $ 367,180 $ 319,182
Less: reinsurance recoverables 120,506 89,725 57,409 Net reserves, beginning of year (2) 266,470 277,455 261,773 Incurred claims and claim expenses:
Claims occurring in the current year 441,191 483,062 547,959 Decrease in estimated reserves for claims occurring in prior years (3) (10,200) (7,500) (300)
Total claims and claim expenses incurred (4) 430,991 475,562 547,659 Claims and claim expense payments for claims occurring during:
Current year 291,393 329,475 369,194 Prior years 146,796 157,072 162,783
Total claims and claim expense payments 438,189 486,547 531,977 Net reserves, end of year (2) 259,272 266,470 277,455
Plus: reinsurance recoverables 112,881 120,506 89,725 Gross reserves, end of year (1) $ 372,153 $ 386,976 $ 367,180
(1) Unpaid claims and claim expenses as reported in the Consolidated Balance Sheets also include reserves for Supplemental, Retirement and Life of $66.6 million, $55.9 million and $29.5 million as of December 31, 2020, 2019 and 2018, respectively, in addition to Property and Casualty reserves.
(2) Reserves are net of anticipated reinsurance recoverables.(3) Shows the amounts by which the Company decreased its reserves in each of the periods indicated for claims occurring in previous periods to
reflect subsequent information on such claims and changes in their projected final settlement costs. Also refer to the paragraphs below for additional information regarding prior years' reserve development recognized in 2020, 2019 and 2018.
(4) Benefits, claims and settlement expenses as reported in the Consolidated Statements of Operations also include amounts for Supplemental, Retirement and Life of $137.9 million, $109.5 million, and $89.9 million for the years ended December 31, 2020, 2019 and 2018, respectively, in addition to Property and Casualty amounts.
Underwriting results for Property and Casualty are significantly influenced by estimates of the Company's ultimate liability for insured events. There is a high degree of uncertainty inherent in the estimates of ultimate losses underlying the liability for unpaid claims and claim settlement expenses. This inherent uncertainty is particularly significant for liability-related exposures due to the extended period, often many years, which transpires between a loss event, receipt of related claims data from policyholders and ultimate settlement of the claim. Reserves for Property and Casualty claims include provisions for payments to be made on reported claims (case reserves), IBNR claims and associated settlement expenses (together, loss reserves). The process by which these reserves are established requires reliance upon estimates based on known facts and on interpretations of circumstances, including the Company's experience with similar cases and historical trends involving claim payments and related patterns, pending levels of unpaid claims and product mix, as well as other factors including court decisions, economic conditions, public attitudes and medical costs.
The Company believes the Property and Casualty loss reserves are appropriately established based on available facts, laws, and regulations. The Company calculates and recognizes a single best estimate of the reserve (which is equal to the actuarial point estimate) as of each reporting date, for each line of business and its coverages for reported losses and for IBNR losses and as a result, the Company believes no other estimate is better than the recognized amount. Due to uncertainties involved, the ultimate cost of losses may vary materially from recognized amounts.
The Company continually updates loss estimates using both quantitative and qualitative information from its reserving actuaries and information derived from other sources. Adjustments may be required as information develops which varies from experience, or, in some cases, augments data which previously was not considered sufficient for use in determining liabilities. The effects of these adjustments may be significant and are charged or credited to income in the period in which the adjustments are made.
NOTE 7 - Unpaid Claims and Claim Expenses
110 Annual Report on Form 10-K Horace Mann Educators Corporation

Numerous risk factors will affect more than one product line. One of these factors is changes in claim department practices, including claim closure rates, number of claims closed without payment, the use of third-party claim adjusters and the level of needed case reserve estimated by the adjuster. Other risk factors include changes in claim frequency, changes in claim severity, regulatory and legislative actions, court actions, changes in economic conditions and trends (e.g., medical costs, labor rates and the cost of materials), the occurrence of unusually large or frequent catastrophic loss events, timeliness of claim reporting, the state in which the claim occurred and degree of claimant fraud. The extent of the impact of a risk factor will also vary by coverages within a product line. Individual risk factors are also subject to interactions with other risk factors within product line coverages.
While all product lines are exposed to these risks, there are some loss types or product lines for which the financial effect will be more significant. For instance, given the relatively large proportion (approximately 74.0% as of December 31, 2020) of the Company's reserves that are in the longer-tail automobile liability coverages, regulatory and court actions, changes in economic conditions and trends, and medical costs could be expected to impact this product line more extensively than others.
Reserves are established for claims as they occur for each line of business based on estimates of the ultimate cost to settle the claims. The actual loss results are compared to prior estimates and differences are recorded as re-estimates. The primary actuarial techniques (development of paid loss dollars, development of reported loss dollars, methods based on expected loss ratios and methods utilizing frequency and severity of claims) used to estimate reserves and provide for losses are applied to actual paid losses and reported losses (paid losses plus individual case reserves set by claim adjusters) for an accident year to create an estimate of how losses are likely to develop over time.
An accident year refers to classifying claims based on the year in which the claims occurred. For estimating short-tail coverage reserves (e.g., homeowners and automobile physical damage), which comprise approximately 26.0% of the Company's total loss reserves as of December 31, 2020, the primary actuarial technique utilized is the development of paid loss dollars due to the relatively quick claim settlement period. As it relates to estimating long-tail coverage reserves (primarily related to automobile liability), which comprise approximately 74.0% of the Company's total loss reserves as of December 31, 2020, the primary actuarial technique utilized is the development of reported loss dollars due to the relatively long claim settlement period.
In all of the loss estimation techniques referred to above, a ratio (development factor) is calculated which compares current results to results in the prior period for each accident year. Various development factors, based on historical results, are multiplied by the current experience to estimate the development of losses of each accident year from the current time period into the next time period. The development factors for the next time period for each accident year are compounded over the remaining calendar years to calculate an estimate of ultimate losses for each accident year. Occasionally, unusual aberrations in loss patterns are caused by factors such as changes in claim reporting, settlement patterns, unusually large losses, process changes, legal or regulatory environment changes, and other influences. In these instances, analyses of alternate development factor selections are performed to evaluate the effect of these factors and judgment is applied to make appropriate development factor assumptions needed to develop a best estimate of ultimate losses. Paid losses are then subtracted from estimated ultimate losses to determine the indicated loss reserves. The difference between indicated reserves and recorded reserves is the amount of reserve re-estimate.
Reserves are re-estimated quarterly. When new development factors are calculated from actual losses that differ from estimated development factors used in previous reserve estimates, assumptions about losses and required reserves are revised based on the new development factors. Changes to reserves are recognized in the period in which development factor changes result in reserve re-estimates.
Claim count estimates are also established for claims as they occur for each line of business based on estimates of the ultimate claim counts. These counts are derived by counting the number of claimants by insurance coverage. The primary actuarial techniques (development of paid claim counts and development of reported claim counts) used to estimate ultimate claim counts are applied to actual paid claim counts and reported claim counts (paid claims plus individual unpaid claims set by claim adjusters) for an accident year to create an estimate of how claims are likely to develop over time. An accident year refers to classifying claims based on the year in which the claim occurred. The ultimate claim count generally gives equal consideration to the results of the two actuarial techniques described.
NOTE 7 - Unpaid Claims and Claim Expenses (continued)
Horace Mann Educators Corporation Annual Report on Form 10-K 111

Occasionally, unusual aberrations in claim reporting patterns or claim payment patterns may occur. In these instances, analyses of alternate development factor selections are performed to evaluate the effect of these factors and judgment is applied to make appropriate development factor assumptions needed to develop a best estimate of ultimate claims.
See tables on the following pages of Note 7 for details of the average annual percentage payout of incurred claims by age, also referred to as a history of claims duration and tables illustrating the incurred and paid claims development information by accident year on a net basis for the lines of homeowners, automobile Liability, and automobile physical damage, which represents 99.0% of the Company's incurred losses for 2020.
Numerous actuarial estimates of the types described above are prepared each quarter to monitor losses for each line of business, including the line's individual coverages, for reported losses and IBNR. Often, several different estimates are prepared for each detailed component, incorporating alternative analyses of changing claim settlement patterns and other influences on losses, from which the Company selects the best estimate for each component, occasionally incorporating additional analyses and judgment, as described above. These estimates also incorporate the historical impact of inflation into reserve estimates, the implicit assumption being that a multi-year average development factor represents an adequate provision. Based on the Company's review of these estimates, as well as the review of independent reserve studies, the best estimate of required reserves for each line of business, including the line's individual coverages, is determined by management and is recognized for each accident year, then the required reserves for each component are summed to create the reserve balances carried on the Company's Consolidated Balance Sheets.
Based on the Company's products and coverages, historical experience, and various actuarial methodologies used to develop reserve estimates, the Company estimates that the potential variability of the Property and Casualty loss reserves within a reasonable probability of other possible outcomes may be approximately plus or minus 6.0% of reserves, which equates to plus or minus approximately $12.0 million of net income as of December 31, 2020. Although this evaluation reflects the most likely outcomes, it is possible the final outcome may fall below or above these estimates.
Net favorable development of total reserves for Property and Casualty claims occurring in prior years was $10.2 million in 2020, $7.5 million in 2019 and $0.3 million in 2018. In 2020, the favorable development was predominantly the result of favorable loss trends in property for accident years 2019 and prior including the recognition of $4.8 million of subrogation received on the 2018 Camp Fire event. In 2019, the favorable development was predominantly the result of favorable loss trends in automobile for accident years 2018 and prior. In 2018, the favorable development was predominantly the result of favorable loss trends in property for accident years 2017 and prior.
The Company completes a detailed study of Property and Casualty reserves based on information available at the end of each quarter and year. Trends of reported losses (paid amounts and case reserves on claims reported to the Company) for each accident year are reviewed and ultimate loss costs for those accident years are estimated. The Company engages an independent property and casualty actuarial consulting firm to prepare an independent study of the Company's Property and Casualty reserves at December 31st of each year. The result of the independent actuarial study at December 31, 2020 was consistent with management's analysis and selected estimates and did not result in any adjustments to the Company's Property and Casualty reserves recognized.
At the time each of the reserve analyses was performed, the Company believed that each estimate was based upon sound methodology and such methodologies were appropriately applied and that there were no trends which indicated the likelihood of future loss reserve development. The financial impact of the net reserve development was therefore accounted for in the period that the development was determined.
No other adjustments were made in the determination of the liabilities during the periods covered by these consolidated financial statements. Management believes that, based on data currently available, it has reasonably estimated the Company's ultimate losses.
Below is the average annual percentage payout of incurred claims by age, also referred to as a history of claims duration:
NOTE 7 - Unpaid Claims and Claim Expenses (continued)
112 Annual Report on Form 10-K Horace Mann Educators Corporation

Average Annual Percentage Payout of Incurred Claims by Age, Net of Reinsurance
Years 1 2 3 4 5 6 7 8 9 10
Homeowners 80.4 % 16.2 % 2.0 % 0.7 % 0.5 % 0.2 % — — — — Automobile liability 40.9 % 34.4 % 13.8 % 6.3 % 3.1 % 1.1 % 0.3 % 0.1 % — — Automobile physical damage 95.5 % 4.5 % — — — — — — — —
The following tables illustrate the incurred and paid claims development by accident year on a net basis for the lines of homeowners, automobile liability and automobile physical damage. Conditions and trends that have affected the development of these reserves in the past will not necessarily reoccur in the future. It may not be appropriate to use this cumulative history in the projection of future performance.
The information about incurred and paid claims development for the years ended December 31, 2011 to 2019 is presented as unaudited supplementary information.
($ in thousands)
Homeowners
Incurred Claims and Allocated Claim Adjustment Expense, Net of Reinsurance
Years Ended December 31, As of December 31, 2020
Total of Incurred-But-Not-Reported
Liabilities PlusExpected
Developmenton Reported
Claims
CumulativeNumber ofReported Claims
Accident Unaudited Unaudited Unaudited Unaudited Unaudited Unaudited Unaudited Unaudited Unaudited
Year 2011 2012 2013 2014 2015 2016 2017 2018 2019 2020
2011 $ 150,141 $ 150,334 $ 150,791 $ 148,860 $ 148,755 $ 148,414 $ 148,370 $ 148,079 $ 148,067 $ 148,067 $ — 29,532
2012 108,754 109,156 109,360 106,486 106,308 106,348 106,000 106,028 106,032 — 21,578
2013 105,584 107,489 103,982 102,407 102,345 101,769 101,709 101,711 — 19,222
2014 111,647 113,505 109,059 106,844 106,554 106,458 106,414 — 20,084
2015 111,706 115,134 114,404 114,053 115,050 114,942 67 18,716
2016 115,931 118,604 117,009 117,933 117,940 241 19,860
2017 126,285 129,818 132,666 130,693 585 19,850
2018 166,793 157,404 158,861 1,352 21,037
2019 130,391 129,901 1,949 17,463
2020 155,721 32,267 18,229
Total $ 1,270,282
($ in thousands)
Homeowners
Cumulative Paid Claims and Allocated Claim Adjustment Expense, Net of Reinsurance
Years Ended December 31, Accident Unaudited Unaudited Unaudited Unaudited Unaudited Unaudited Unaudited Unaudited Unaudited
Year 2011 2012 2013 2014 2015 2016 2017 2018 2019 2020
2011 $ 123,046 $ 142,846 $ 145,852 $ 146,908 $ 147,451 $ 148,026 $ 148,014 $ 148,069 $ 148,067 $ 148,067 2012 84,260 101,566 104,203 105,156 105,561 105,909 105,993 106,021 106,025 2013 76,890 96,599 99,361 100,968 101,527 101,677 101,709 101,711 2014 83,314 103,030 105,704 106,081 106,258 106,388 106,419 2015 90,704 109,303 111,882 113,321 114,648 114,861 2016 95,772 113,186 115,053 117,537 117,688 2017 106,800 128,518 129,767 130,017 2018 130,548 152,356 157,004 2019 103,790 126,208 2020 106,781
Total 1,214,781
Outstanding prior to 2011 32
Prior years paid Liabilities for claims and claim adjustment expenses, net of reinsurance $ 55,533
NOTE 7 - Unpaid Claims and Claim Expenses (continued)
Horace Mann Educators Corporation Annual Report on Form 10-K 113
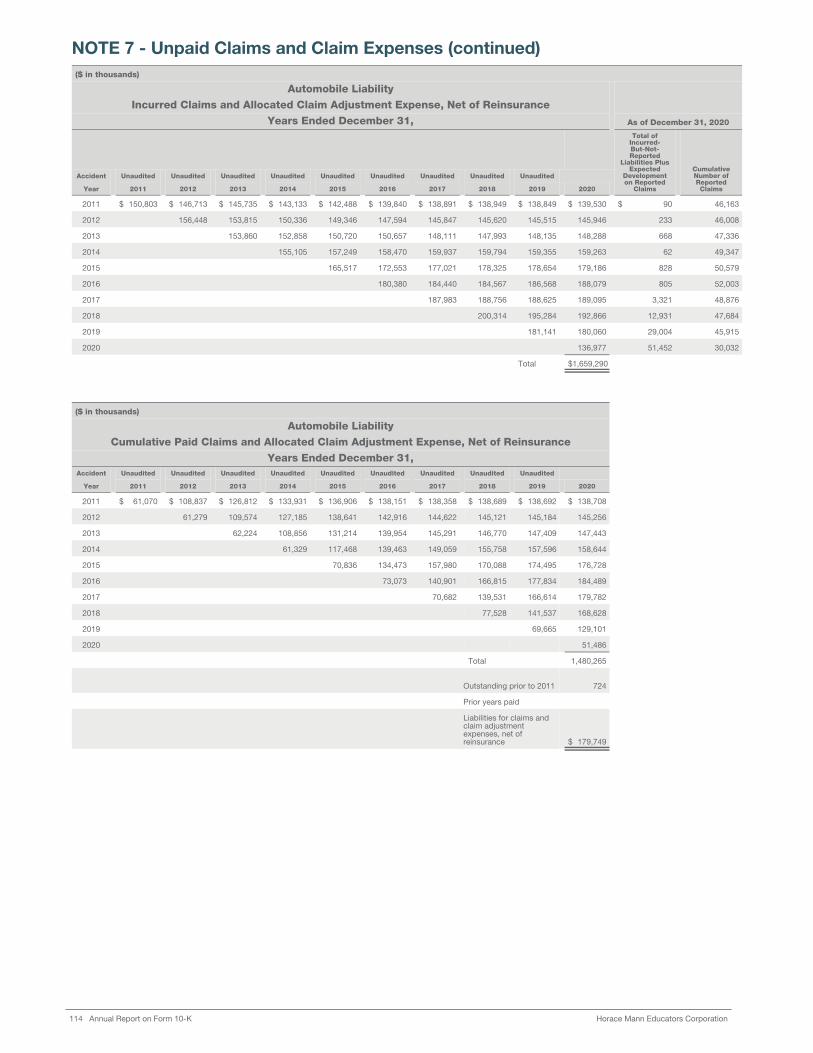
($ in thousands)
Automobile Liability
Incurred Claims and Allocated Claim Adjustment Expense, Net of Reinsurance
Years Ended December 31, As of December 31, 2020
Total of Incurred-But-Not-Reported
Liabilities PlusExpected
Developmenton Reported
Claims
CumulativeNumber ofReported Claims
Accident Unaudited Unaudited Unaudited Unaudited Unaudited Unaudited Unaudited Unaudited Unaudited
Year 2011 2012 2013 2014 2015 2016 2017 2018 2019 2020
2011 $ 150,803 $ 146,713 $ 145,735 $ 143,133 $ 142,488 $ 139,840 $ 138,891 $ 138,949 $ 138,849 $ 139,530 $ 90 46,163
2012 156,448 153,815 150,336 149,346 147,594 145,847 145,620 145,515 145,946 233 46,008
2013 153,860 152,858 150,720 150,657 148,111 147,993 148,135 148,288 668 47,336
2014 155,105 157,249 158,470 159,937 159,794 159,355 159,263 62 49,347
2015 165,517 172,553 177,021 178,325 178,654 179,186 828 50,579
2016 180,380 184,440 184,567 186,568 188,079 805 52,003
2017 187,983 188,756 188,625 189,095 3,321 48,876
2018 200,314 195,284 192,866 12,931 47,684
2019 181,141 180,060 29,004 45,915
2020 136,977 51,452 30,032
Total $ 1,659,290
($ in thousands)
Automobile Liability
Cumulative Paid Claims and Allocated Claim Adjustment Expense, Net of Reinsurance
Years Ended December 31, Accident Unaudited Unaudited Unaudited Unaudited Unaudited Unaudited Unaudited Unaudited Unaudited
Year 2011 2012 2013 2014 2015 2016 2017 2018 2019 2020
2011 $ 61,070 $ 108,837 $ 126,812 $ 133,931 $ 136,906 $ 138,151 $ 138,358 $ 138,689 $ 138,692 $ 138,708 2012 61,279 109,574 127,185 138,641 142,916 144,622 145,121 145,184 145,256 2013 62,224 108,856 131,214 139,954 145,291 146,770 147,409 147,443 2014 61,329 117,468 139,463 149,059 155,758 157,596 158,644 2015 70,836 134,473 157,980 170,088 174,495 176,728 2016 73,073 140,901 166,815 177,834 184,489 2017 70,682 139,531 166,614 179,782 2018 77,528 141,537 168,628 2019 69,665 129,101 2020 51,486
Total 1,480,265
Outstanding prior to 2011 724
Prior years paid Liabilities for claims and claim adjustment expenses, net of reinsurance $ 179,749
NOTE 7 - Unpaid Claims and Claim Expenses (continued)
114 Annual Report on Form 10-K Horace Mann Educators Corporation

($ in thousands)
Automobile Physical Damage
Incurred Claims and Allocated Claim Adjustment Expense, Net of Reinsurance
Years Ended December 31, As of December 31, 2020
Total of Incurred-But-Not-Reported
Liabilities PlusExpected
Developmenton Reported
Claims
CumulativeNumber ofReported Claims
Accident Unaudited Unaudited Unaudited Unaudited Unaudited Unaudited Unaudited Unaudited Unaudited
Year 2011 2012 2013 2014 2015 2016 2017 2018 2019 2020
2011 $ 86,205 $ 85,507 $ 86,023 $ 85,120 $ 85,143 $ 85,116 $ 85,108 $ 85,102 $ 85,090 $ 85,089 $ — 80,804
2012 83,770 82,337 83,402 83,431 83,354 83,342 83,334 83,322 83,323 — 78,166
2013 91,448 88,856 88,672 88,627 88,455 88,525 88,457 88,452 — 80,920
2014 95,572 95,634 95,422 95,239 95,232 95,241 95,242 — 87,901
2015 99,291 97,994 97,624 97,455 97,612 97,608 — 87,502
2016 112,430 109,515 109,348 109,603 109,597 (18) 93,229
2017 115,483 111,798 110,520 110,569 (17) 91,290
2018 109,040 108,886 108,333 (161) 94,458
2019 111,577 110,495 (326) 92,068
2020 86,959 (6,829) 66,650
Total $ 975,667
($ in thousands)
Automobile Physical Damage
Cumulative Paid Claims and Allocated Claim Adjustment Expense, Net of Reinsurance
Years Ended December 31, Accident Unaudited Unaudited Unaudited Unaudited Unaudited Unaudited Unaudited Unaudited Unaudited
Year 2011 2012 2013 2014 2015 2016 2017 2018 2019 2020
2011 $ 83,227 $ 85,254 $ 85,181 $ 85,148 $ 85,127 $ 85,116 $ 85,108 $ 85,095 $ 85,090 $ 85,082 2012 80,519 83,418 83,372 83,355 83,347 83,342 83,326 83,322 83,318 2013 85,110 88,688 88,580 88,532 88,484 88,471 88,452 88,442 2014 88,939 95,444 95,266 95,256 95,258 95,243 95,228 2015 92,138 97,850 97,685 97,638 97,625 97,608 2016 106,459 109,686 109,536 109,611 109,589 2017 105,156 110,817 110,674 110,630 2018 103,559 109,103 108,272 2019 106,243 110,692 2020 84,105
Total 972,966
Outstanding prior to 2011 10
Prior years paid
Liabilities for claims and claim adjustment expenses, net of reinsurance $ 2,711
NOTE 7 - Unpaid Claims and Claim Expenses (continued)
Horace Mann Educators Corporation Annual Report on Form 10-K 115

The reconciliation of the net incurred and paid claims development tables to the liability for claims and claim adjustment expenses in the Consolidated Balance Sheet is as follows:
($ in thousands) Year Ended December 31,
2020
Property and Casualty segmentNet reserves
Homeowners $ 55,533 Automobile liability 179,749 Automobile physical damage 2,711 Other short duration lines 3,189
Total net reserves for unpaid claims and claim adjustment expense,net of reinsurance 241,182
Reinsurance recoverable on unpaid claimsHomeowners 6,386 Automobile liability 99,717 Other short duration lines 6,778
Total reinsurance recoverable on unpaid claims 112,881
Insurance lines other than short duration (1) 66,601 Unallocated claims adjustment expenses 18,090
Total other than short duration and unallocated claims adjustment expenses 84,691
Gross reserves, end of year (1) $ 438,754 (1) This line includes Supplemental, Retirement and Life reserves included in the Consolidated Balance Sheet.
NOTE 8 - Reinsurance and Catastrophes
In the normal course of business, the Company's insurance subsidiaries assume and cede reinsurance with other insurers. Reinsurance is ceded primarily to limit losses from large events and to permit recovery of a portion of direct losses; however, such a transfer does not relieve the originating insurance company of primary liability.
The Company is a national underwriter and therefore has exposure to catastrophic losses in certain coastal states and other regions throughout the U.S. Catastrophes can be caused by various events including hurricanes, windstorms, hail, severe winter weather, wildfires and earthquakes, and the frequency and severity of catastrophes are inherently unpredictable. The financial impact from catastrophic losses results from both the total amount of insured exposure in the area affected by the catastrophe as well as the severity of the event. The Company seeks to reduce its exposure to catastrophe losses through the geographic diversification of its insurance coverage, deductibles, maximum coverage limits and the purchase of catastrophe reinsurance.
The Company's catastrophe losses incurred of approximately $84.4 million, $52.0 million and $107.3 million for the years ended December 31, 2020, 2019 and 2018, respectively. For 2020, catastrophe losses were impacted by winter storm events, wind/hail/tornado and derecho events, as well as tropical storms and hurricanes.
NOTE 7 - Unpaid Claims and Claim Expenses (continued)
116 Annual Report on Form 10-K Horace Mann Educators Corporation

The total amounts of reinsurance recoverable on unpaid insurance reserves classified as assets and reported in Other assets in the Consolidated Balance Sheets were as follows:
($ in thousands) December 31,
2020 2019
Reinsurance recoverables on reserves and unpaid claimsProperty and Casualty
Reinsurance companies $ 13,164 $ 19,640 State insurance facilities 99,718 100,866
Life and health 9,568 8,707 Total $ 122,450 $ 129,213
The Company recognizes the cost of reinsurance premiums over the contract periods for such premiums in proportion to the insurance protection provided. Amounts recoverable from reinsurers for unpaid claims and claim settlement expenses, including estimated amounts for unsettled claims, IBNR claims and policy benefits, are estimated in a manner consistent with the insurance liability associated with the policy. The effects of reinsurance on premiums written and contract deposits; premiums and contract charges earned; and benefits, claims and settlement expenses were as follows:
($ in thousands)
GrossAmount
Ceded toOther
Companies (1)
Assumedfrom OtherCompanies
NetAmount
Year Ended December 31, 2020
Premiums written and contract deposits (2) $ 1,369,897 $ 20,388 $ 9,830 $ 1,359,339 Premiums and contract charges earned 949,525 28,757 9,929 930,697 Benefits, claims and settlement expenses 475,746 (86,184) 6,961 568,891
Year Ended December 31, 2019
Premiums written and contract deposits (2) 1,337,847 23,872 10,567 1,324,542 Premiums and contract charges earned 917,610 30,412 10,756 897,954 Benefits, claims and settlement expenses 633,874 56,325 7,519 585,068
Year Ended December 31, 2018
Premiums written and contract deposits (2) 1,255,557 28,773 8,259 1,235,043 Premiums and contract charges earned 841,147 28,837 5,023 817,333 Benefits, claims and settlement expenses 769,664 136,601 4,497 637,560
(1) Excludes the annuity reinsurance agreement accounted for using the deposit method that is discussed in Note 5.(2) This measure is not based on accounting principles generally accepted in the U.S. (non-GAAP). An explanation of this non-GAAP measure is
contained in the Glossary of Selected Terms included as an exhibit in the Company's reports filed with the SEC.
There were no losses from uncollectible reinsurance recoverables in the three years ended December 31, 2020. Past due reinsurance recoverables as of December 31, 2020 were not material.
The Company maintains catastrophe excess of loss reinsurance coverage. For 2020, the Company's catastrophe excess of loss coverage consisted of one contract in addition to a minimal amount of coverage by the Florida Hurricane Catastrophe Fund (FHCF). The catastrophe excess of loss contract provided 95% coverage for catastrophe losses above a retention of $25.0 million per occurrence up to $175.0 million per occurrence. This contract consisted of three layers, each of which provided for one mandatory reinstatement. The layers were $25.0 million excess of $25.0 million, $40.0 million excess of $50.0 million and $85.0 million excess of $90.0 million.
For liability coverages, in 2020, the Company reinsured each loss above a retention of $1.0 million with coverage up to $5.0 million on a per occurrence basis and $20.0 million in a clash event. (A clash cover is a reinsurance casualty excess contract requiring two or more casualty coverages or policies issued by the Company to be involved in the same loss occurrence for coverage to apply.) For property coverages, in 2020, the Company reinsured each loss above a retention of $1.0 million up to $5.0 million on a per risk basis, including catastrophe
NOTE 8 - Reinsurance and Catastrophes (continued)
Horace Mann Educators Corporation Annual Report on Form 10-K 117

losses. Also, the Company could submit to the reinsurers two per risk losses from the same occurrence for a total of $8.0 million of property recovery in any one event.
The maximum individual life insurance risk retained by the Company is $0.5 million on any individual life, while either $0.1 million or $0.125 million is retained on each group life policy depending on the type of coverage. Excess amounts are reinsured. The Company also maintains a life catastrophe reinsurance program. For 2020, the Company reinsured 100% of the catastrophe risk in excess of $1.0 million up to $35.0 million per occurrence, with one reinstatement. The Company's life catastrophe risk reinsurance program covers acts of terrorism and includes nuclear, biological and chemical explosions but excludes other acts of war.
The Company retains all of the risk on its supplemental health product lines, including accidental death risk embedded within certain products. However, the Company’s other accidental death and dismemberment risk issued through all other policies and riders are ceded 100%.
NOTE 9 - Debt
Indebtedness and scheduled maturities consisted of the following:
($ in thousands) EffectiveInterestRates
FinalMaturity
December 31,
2020 2019
Short-term debtBank Credit Facility Variable 2024 $ 135,000 $ 135,000
Long-term debt (1)
4.50% Senior Notes, Aggregate principal amount of$250,000 less unaccrued discount of $362 and $426 and unamortized debt issuance costsof $1,315 and $1,549 4.50% 2025 248,323 248,025
Federal Home Loan Bank borrowing 0.44% 2022 54,000 50,000 Total $ 437,323 $ 433,025
(1) The Company designates debt obligations as "long-term" based on maturity date at issuance.
Credit Agreement with Financial Institutions (Bank Credit Facility)
On June 21, 2019, the Company, as borrower, replaced its current line of credit with a new five-year Credit Agreement (Bank Credit Facility). The new Bank Credit Facility increased the amount available on this senior revolving credit facility to $225.0 million from $150.0 million. PNC Capital Markets, LLC and JPMorgan Chase Bank, N.A. served as joint leads on the new agreement, with The Northern Trust Company, U.S. Bank National Association, KeyBank National Association, Comerica Bank and Illinois National Bank participating in the syndicate. Terms and conditions of the new Bank Credit Facility are substantially consistent with the prior agreement, with an interest rate based on LIBOR plus 115 basis points.
On July 1, 2019, the Company utilized the senior revolving credit facility to partially fund the acquisition of NTA. As of December 31, 2020, the amount outstanding on the senior revolving credit facility was $135.0 million. The unused portion of the Bank Credit Facility is subject to a variable commitment fee, which was 0.15% on an annual basis at December 31, 2020.
Senior Notes
On November 23, 2015, the Company issued $250.0 million aggregate principal amount of 4.50% senior notes, which will mature on December 1, 2025, issued at a discount of 0.265% resulting in an effective yield of 4.53% (Senior Notes). Interest on the Senior Notes is payable semi-annually at a rate of 4.50%. The Senior Notes are redeemable in whole or in part, at any time, at the Company's option, at a redemption price equal to the greater of (1) 100% of the principal amount of the notes being redeemed or (2) the sum of the present values of the remaining scheduled payments of principal and interest thereon discounted, on a semi-annual basis, at the Treasury yield (as defined in the indenture) plus 35 basis points, plus, in either of the above cases, accrued interest to the date of redemption.
NOTE 8 - Reinsurance and Catastrophes (continued)
118 Annual Report on Form 10-K Horace Mann Educators Corporation

Federal Home Loan Bank Borrowings
In 2017, Horace Mann Insurance Company (HMIC) became a member of the FHLB, which provides HMIC with access to collateralized borrowings and other FHLB products. As membership requires the ownership of membership stock, in June 2017, HMIC purchased common stock to meet the membership requirement. Any borrowing from the FHLB requires the purchase of FHLB activity-based common stock in an amount equal to 4.5% of the borrowing, or a lower percentage - such as 2.0% based on the Reduced Capitalization Advance Program. In the fourth quarter of 2017, HMIC purchased common stock to meet the activity-based requirement. In 2019, the Board authorized a maximum amount equal to 15% of net aggregate admitted assets less separate account assets of the insurance subsidiaries for FHLB borrowings. During the fourth quarter of 2017, the Company received $50.0 million in executed borrowings for HMIC. Of the total $50.0 million received, $25.0 million matures on October 5, 2022 and $25.0 million matures on December 2, 2022. Interest on the borrowings accrues at an annual weighted average rate of 0.44% as of December 31, 2020. In May 2020, the Company received a $4.0 million COVID relief advance for HMIC that matures May 17, 2021. There is no interest on this borrowing. HMIC's FHLB borrowings of $54.0 million are included in Long-term debt in the Consolidated Balance Sheets.
Covenants
The Company is in compliance with all of the financial covenants contained in the Senior Notes indenture and the Bank Credit Facility agreement, consisting primarily of relationships of (1) debt to capital, (2) net worth, as defined in the financial covenants, (3) insurance subsidiaries' risk-based capital and (4) securities subject to funding agreements and repurchase agreements.
NOTE 10 - Income Taxes
The income tax assets and liabilities included in Other assets and Other liabilities, respectively, in the Consolidated Balance Sheets were as follows:
($ in thousands) December 31,
2020 2019
Income tax (asset) liabilityCurrent $ (12,631) $ (12,184) Deferred 206,650 160,624
NOTE 9 - Debt (continued)
Horace Mann Educators Corporation Annual Report on Form 10-K 119

Deferred tax assets and liabilities are recognized for all future tax consequences attributable to "temporary differences" between the financial statement carrying value of existing assets and liabilities and their respective tax bases. There are no deferred tax liabilities that have not been recognized. The "temporary differences" that gave rise to the deferred tax balances were as follows:
($ in thousands) December 31,
2020 2019
Deferred tax assets Unearned premium reserve reduction $ 11,488 $ 12,103 Compensation accruals 9,487 8,866 Reinsurance commissions — 6,804 Impaired securities 2,127 1,245 Other comprehensive income - net funded status of benefit plans 2,981 2,875 Discounting of unpaid claims and claim expense tax reserves 2,548 2,530 Net operating loss carryforwards — 3,803 Postretirement benefits other than pensions 270 285
Total gross deferred tax assets 28,901 38,511 Deferred tax liabilities
Other comprehensive income - net unrealized gains on securities 124,715 74,645 Deferred policy acquisition costs 36,347 49,326 Life insurance future policy benefit reserve 26,725 38,210 Life insurance future policy benefit reserve (transitional rule) 10,651 12,786 Discounting of unpaid claims and claim expense tax reserves(transitional rule) 789 947
Investment related adjustments 34,155 15,718 Intangibles 210 2,021 Other, net 1,959 5,482
Total gross deferred tax liabilities 235,551 199,135 Net deferred tax liability $ 206,650 $ 160,624
The Company evaluated sources and character of income, including historical earnings, loss carryback potential, taxable income from future reversals of existing taxable temporary differences, future taxable income exclusive of reversing temporary differences, and taxable income from prudent and feasible tax planning strategies. Although realization of deferred tax assets is not assured, the Company believes it is more likely than not that gross deferred tax assets will be fully realized and that a valuation allowance with respect to the realization of the total gross deferred tax assets was not necessary as of December 31, 2020 and 2019.
The components of the provision for income tax expense (benefit) were as follows:
($ in thousands) Years Ended December 31,
2020 2019 2018
Current $ 16,880 $ 31,518 $ 4,152 Deferred 9,388 20,488 (2,958)
Total income tax expense $ 26,268 $ 52,006 $ 1,194
NOTE 10 - Income Taxes (continued)
120 Annual Report on Form 10-K Horace Mann Educators Corporation

Income tax expense for the following periods differed from the expected tax computed by applying the federal corporate tax rate of 21% for 2020, 2019 and 2018 to income before income taxes as follows:
($ in thousands) Years Ended December 31,
2020 2019 2018
Expected federal tax on income $ 33,512 $ 49,654 $ 4,103 Add (deduct) tax effects of:
Tax-exempt interest (4,203) (4,159) (3,726) Dividend received deduction (1,475) (1,392) (412) Goodwill impairment 187 5,885 — CARES Act net operating loss carryback (2,792) — — Employee share-based compensation (541) 272 (1,134) Compensation deduction limitation 663 680 1,754 Prior year adjustments (219) (716) 300 Other, net 1,136 1,782 309
Income tax expense provided on income $ 26,268 $ 52,006 $ 1,194
The Company's federal income tax returns for years prior to 2014 are no longer subject to examination by the Internal Revenue Service (IRS).
The Company recognizes tax benefits from tax return positions only if it is more likely than not the position will be sustainable, upon examination, on its technical merits and any relevant administrative practices or precedents. As a result, the Company applies a more likely than not recognition threshold for all tax uncertainties.
The Company records liabilities for uncertain tax filing positions where it is more likely than not that the position will not be sustainable upon audit by taxing authorities. These liabilities are reevaluated routinely and are adjusted appropriately based upon changes in facts or law. The Company has no unrecorded liabilities from uncertain tax filing positions.
HMEC and its subsidiaries file a consolidated federal income tax return. The federal income tax sharing agreements between HMEC and its subsidiaries, as approved by the Board, provide that tax on income is charged to each subsidiary as if it were filing a separate tax return with the limitation that each subsidiary will receive the benefit of any losses or tax credits to the extent utilized in the consolidated tax return. Intercompany balances are settled quarterly with a final settlement after filing the consolidated federal income tax return with the IRS. National Teachers Associates Life Insurance Company and NTA Life Insurance Company of New York are not included in the consolidated federal income tax return and will file separate federal income tax returns until they are eligible to participate in the consolidated federal income tax return. This is expected to occur in 2025.
NOTE 10 - Income Taxes (continued)
Horace Mann Educators Corporation Annual Report on Form 10-K 121

A reconciliation of the beginning and ending amounts of unrecognized tax benefits, excluding interest and penalties, is as follows:
($ in thousands) Years Ended December 31,
2020 2019 2018
Balance as of the beginning of the year $ 1,966 $ 1,734 $ 1,790 Increases related to prior year tax positions 205 109 — Decreases related to prior year tax positions — — (152) Increases related to current year tax positions 151 123 96 Settlements — — — Lapse of statute — — —
Balance as of the end of the year $ 2,322 $ 1,966 $ 1,734
The Company's effective tax rate would be affected to the extent there were unrecognized tax benefits that could be recognized. There are no positions for which it is reasonably possible that the total amount of unrecognized tax benefit will significantly change within the next 12 months.
The Company classifies all tax related interest and penalties as income tax expense.
Interest and penalties were both immaterial in each of the years ended December 31, 2020, 2019 and 2018.
NOTE 11 - Operating Leases
The Company has various operating lease agreements, primarily for real estate offices. Such leases have remaining lease terms of 1 year to 5 years, some of which may include options to extend certain leases for up to an additional 25 years.
The components of lease expense were as follows:
($ in thousands) Years Ended December 31,
2020 2019
Operating lease cost $ 4,454 $ 3,841 Short-term lease cost 119 208
Total lease cost $ 4,573 $ 4,049
Supplemental cash flow information related to operating leases was as follows:
($ in thousands) Years Ended December 31,
2020 2019
Cash paid for amounts included in the measurement of lease liabilities $ 4,453 $ 3,447
Supplemental balance sheet information related to operating leases were as follows:
($ in thousands, except lease term and discount rate) December 31,
2020 2019
AssetsRight of use assets, included in Other assets $ 12,551 $ 16,483
LiabilitiesOperating lease liabilities, included in Other liabilities $ 13,559 $ 17,499
Weighted average remaining lease term 3.63 4.51Weighted average discount rate 3.75 % 3.78 %
NOTE 10 - Income Taxes (continued)
122 Annual Report on Form 10-K Horace Mann Educators Corporation

Future minimum lease payments under non-cancellable operating leases as of December 31, 2020 are as follows:
($ in thousands)
Year Ending December 31,
2021 $ 4,236 2022 4,128 2023 3,438 2024 1,929 2025 787 Thereafter —
Total future minimum lease payments 14,518 Less imputed interest (959)
Total $ 13,559
As of December 31, 2020, the Company had one additional operating lease that has not yet commenced.
NOTE 12 - Shareholders' Equity and Share-Based Compensation
Share Repurchase Program and Treasury Shares
On September 30, 2015, the Board authorized a share repurchase program allowing repurchases of up to $50.0 million of HMEC's common stock, par value $0.001 (Program). The Program authorizes the repurchase of common shares in open market or privately negotiated transactions, from time to time, depending on market conditions. The Program does not have an expiration date and may be limited or terminated at any time without notice.
During 2018, the Company repurchased 129,112 shares of its common stock, or 0.3% of the shares outstanding as of December 31, 2017, at an aggregate cost of $5.1 million, or an average price of $39.41 per share. During 2019, the Company did not repurchase any shares of its common stock. During 2020, the Company repurchased 52,095 shares of its common stock, or 0.1% of the shares outstanding as of December 31, 2019, at an aggregate cost of $2.2 million, or an average price of $41.17 per share. In total and through December 31, 2020, 899,468 shares were repurchased under the Program at an average price of $32.68 per share. The repurchase of shares was funded through use of cash. As of December 31, 2020, $20.6 million remained authorized for future share repurchases under the Program.
At December 31, 2020, the Company held 24,902,579 shares in treasury.
Authorization of Preferred Stock
In 1996, the shareholders of HMEC approved authorization of 1,000,000 shares of 0.001 par value preferred stock. The Board is authorized to (1) direct the issuance of the preferred stock in one or more series, (2) fix the dividend rate, conversion or exchange rights, redemption price and liquidation preference, of any series of the preferred stock, (3) fix the number of shares for any series and (4) increase or decrease the number of shares of any series. No shares of preferred stock were issued or outstanding at December 31, 2020 and 2019.
2010 Comprehensive Executive Compensation Plan
In 2010, the shareholders of HMEC approved the 2010 Comprehensive Executive Compensation Plan (the Comprehensive Plan). The purpose of the Comprehensive Plan is to aid the Company in attracting, retaining, motivating and rewarding employees and non-employee Directors; to provide for equitable and competitive compensation opportunities, including deferral opportunities; to encourage long-term service; to recognize individual contributions and reward achievement of Company goals; and to promote the creation of long-term value for the Company's shareholders by closely aligning the interests of plan participants with those of shareholders. The Comprehensive Plan authorizes share-based and cash-based incentives for plan participants. In 2012, the shareholders of HMEC approved the implementation of a fungible share pool under which grants of full value shares will count against the share limit as two and one half shares for every share subject to a full value award. In 2015, the shareholders of HMEC approved an amendment and restatement of the
NOTE 11 - Operating Leases (continued)
Horace Mann Educators Corporation Annual Report on Form 10-K 123

Comprehensive Plan which included an increase of 3,250,000 in the number of shares of common stock reserved for issuance under the Comprehensive Plan. As of December 31, 2020, approximately 751,661 shares were available for grant under the Comprehensive Plan. Shares of common stock issued under the Comprehensive Plan may be either authorized and unissued shares of HMEC or shares that have been reacquired by HMEC; however, new shares have been issued historically.
As further described in the paragraphs below, CSUs, stock options and RSUs under the Comprehensive Plan were as follows:
December 31,
2020 2019 2018
CSUs related to deferred compensation for Directors 23,609 28,526 32,288 CSUs related to deferred compensation for employees 20,467 25,194 24,498 Stock options 916,287 908,557 774,821 RSUs related to incentive compensation 823,393 889,438 1,008,249
Total 1,783,756 1,851,715 1,839,856
Director Common Stock Units
Deferred compensation for Directors is in the form of CSUs, which represent an equal number of common shares to be issued in the future. The outstanding units of Directors serving on the Board accrue dividends at the same rate as dividends paid to HMEC's shareholders. These dividends are reinvested into additional CSUs.
Employee Common Stock Units
Deferred compensation for employees is in the form of CSUs, which represent an equal number of common shares to be issued in the future. Distributions of employee deferred compensation are allowed to be either in common shares or cash. Through December 31, 2020, all distributions have been in cash. The outstanding units accrue dividends at the same rate as dividends paid to HMEC's shareholders. These dividends are reinvested into additional CSUs.
Stock Options
Options to purchase shares of HMEC common stock may be granted to executive officers, other employees and Directors. The options become exercisable in installments based on service generally beginning in the first year from the date of grant and generally become fully vested 4 years from the date of grant. The options generally expire 7 to 10 years from the date of grant. The exercise price of the option is equal to the market price of HMEC's common stock on the date of grant resulting in a grant date intrinsic value of $0.
Changes in outstanding options were as follows:
Weighted Average
Option Priceper Share
Range ofOption Prices
per Share
Options
OutstandingVested andExercisable
December 31, 2019 $37.82 $20.60-$44.75 908,557 368,700
Granted $41.83 $41.83-$41.83 234,248 — Vested $38.59 $28.88-$42.95 — 145,788 Exercised $31.08 $20.60-$42.95 (77,291) (77,291) Forfeited $40.64 $31.01-$42.95 (106,362) — Expired $39.99 $20.60-$42.95 (42,865) —
December 31, 2020 $38.99 $28.88-$42.95 916,287 437,197
NOTE 12 - Shareholders' Equity and Share-Based Compensation (continued)
124 Annual Report on Form 10-K Horace Mann Educators Corporation

Option information segregated by ranges of exercise prices were as follows:
December 31, 2020
Total Outstanding Options Vested and Exercisable Options
Range ofOption Prices
per Share Options
WeightedAverage
Option Priceper Share
WeightedAverage
RemainingTerm Options
WeightedAverage
Option Priceper Share
WeightedAverage
RemainingTerm
$28.88-$33.41 203,207 $30.84 4.61 203,207 $30.84 4.61
$36.04-$41.95 546,108 $40.81 8.05 154,902 $40.90 6.81
$42.73-$42.95 166,972 $42.93 7.33 79,088 $42.94 7.26
Total 916,287 $38.99 7.15 437,197 $36.59 5.86
The weighted average exercise prices of vested and exercisable options as of December 31, 2019 and 2018 were $34.81 and $31.42, respectively.
As of December 31, 2020, based on a closing stock price of $42.04 per share, the aggregate intrinsic (in-the-money) values of vested options and all options outstanding were $2.5 million and $2.9 million, respectively.
Restricted Stock Units
RSUs may be granted to executive officers, other employees and Directors and represent an equal number of common shares to be issued in the future. The RSUs vest in installments based on service or attainment of performance criteria generally beginning in the first year from the date of grant and generally become fully vested 1 to 5 years from the date of grant. The outstanding units accrue dividends at the same rate as dividends paid to HMEC's shareholders. These dividends are reinvested into additional RSUs.
Changes in outstanding RSUs were as follows:
Total Outstanding Units Vested Units
Units
Weighted AverageGrant Date FairValue per Unit Units
Weighted AverageGrant Date FairValue per Unit
December 31, 2019 889,438 $31.94 543,794 $24.77
Granted (1) 197,207 $42.07 — —
Adjustment for performance achievement 419 $46.32 — —
Vested — — 143,836 $42.56Forfeited (61,025) $43.60 — —Distributed (2) (202,646) $34.51 (202,646) $34.51
December 31, 2020 823,393 $33.88 484,984 $27.48(1) Includes dividends reinvested into additional RSUs.(2) Includes distributed units which were utilized to satisfy withholding taxes due on the distribution.
NOTE 12 - Shareholders' Equity and Share-Based Compensation (continued)
Horace Mann Educators Corporation Annual Report on Form 10-K 125

The insurance departments of various states in which the insurance subsidiaries of HMEC are domiciled recognize as net income and surplus those amounts determined in conformity with statutory accounting principles prescribed or permitted by the insurance departments, which differ in certain respects from GAAP.
HMEC has principal insurance subsidiaries domiciled in Illinois, New York and Texas. The statutory financial statements of these subsidiaries are prepared in accordance with accounting principles prescribed or permitted by the Illinois Department of Insurance, the New York Department of Insurance and the Texas Department of Insurance, as applicable. Prescribed statutory accounting principles include a variety of publications of the National Association of Insurance Commissioners (NAIC), as well as state laws, regulations and general administrative rules.
In converting from statutory to GAAP, typical adjustments include DAC, certain reinsurance transactions, the inclusion of statutory non-admitted assets and the inclusion of net unrealized investment gains or losses in shareholders' equity relating to fixed maturity securities.
The following table includes selected information for HMEC's insurance subsidiaries:
($ in thousands) Year Ended December 31,
2020 2019 2018
Consolidated net income, statutory basis $ 141,904 $ 62,316 $ 45,977
Consolidated capital and surplus, statutory basis (1) $ 937,274 $ 868,839 $ 903,564 (1) Subject to regulatory restrictions.
The NAIC has risk-based capital guidelines to evaluate the adequacy of statutory capital and surplus in relation to risks assumed in investments, reserving policies, and volume and types of insurance business written. At December 31, 2020 and 2019, the minimum statutory-basis capital and surplus required to be maintained by HMEC's insurance subsidiaries was $113.2 million and $108.1 million, respectively. At December 31, 2020 and 2019, statutory capital and surplus of each of the Company's insurance subsidiaries was above required levels. The restricted net assets of HMEC's insurance subsidiaries were $26.9 million and $26.0 million as of December 31, 2020 and 2019, respectively. The minimum statutory basis capital and surplus amount at each date is the total estimated authorized control level risk-based capital for all of HMEC's insurance subsidiaries combined. Authorized control level risk-based capital represents the minimum level of statutory basis capital and surplus necessary before the insurance commissioner in the respective state of domicile is authorized to take whatever regulatory actions considered necessary to protect the best interests of the policyholders and creditors of the insurer. The amount of restricted net assets represents the combined fair value of securities on deposit with governmental agencies for the insurance subsidiaries as required by law in various states in which the insurance subsidiaries of HMEC conduct business.
HMEC relies largely on dividends from its insurance subsidiaries to meet its obligations for payment of principal and interest on debt, dividends to shareholders and parent company operating expenses, including tax payments pursuant to tax sharing agreements. Payments for share repurchase programs also have this dependency. HMEC's insurance subsidiaries are subject to various regulatory restrictions which limit the amount of annual dividends or other distributions, including loans or cash advances, available to HMEC without prior approval of the insurance regulatory authorities. As a result, HMEC may not be able to receive dividends from such subsidiaries at times and in amounts necessary to pay desired dividends to shareholders. The maximum amount of dividends that may be paid in 2021 from all of HMEC's insurance subsidiaries without prior regulatory approval is $248.7 million, excluding the impact and timing of prior year dividends.
NOTE 14 - Retirement Plans and Other Postretirement Benefits
The Company sponsors two qualified and three non-qualified retirement plans. Substantially all employees participate in the 401(k) plan. Both the qualified defined benefit plan and the two non-qualified supplemental defined benefit plans have been frozen since 2002. All participants in the frozen plans are 100% vested in their accrued benefit and all non-qualified supplemental defined benefit plan participants are receiving payments. Certain employees participate in a non-qualified defined contribution plan.
NOTE 13 - Statutory Information and Dividend Restrictions
126 Annual Report on Form 10-K Horace Mann Educators Corporation

Qualified Plans
All employees participate in the 401(k) plan and receive a 100% vested 3% "safe harbor" company contribution based on employees' eligible earnings. The Company matches each dollar of employee contributions up to a 5% maximum — in addition to maintaining the automatic 3% "safe harbor" contribution. The matching company contribution vests after 5 years of service. The 401(k) plan is fully funded.
The Company's policy for the frozen defined benefit plan is to contribute to the plan amounts which are actuarially determined to provide sufficient funding to meet future benefit payments as defined by federal laws and regulations.
For the two qualified plans, all assets are held in their respective plan trusts.
Non-qualified Plans
The non-qualified plans were established for specific employees whose otherwise eligible earnings exceeded the statutory limits under the qualified plans. Benefit accruals under the non-qualified supplemental defined benefit plans were frozen in 2002 and all participants are currently in payment status. Both the non-qualified frozen supplemental defined benefit plans and the non-qualified contribution plan are unfunded plans with the Company's contributions made at the time payments are made to participants.
Total Expense and Contribution Plans' Information
Total expense recognized for the non-qualified defined contribution, 401(k), defined benefit and supplemental retirement plans was $10.0 million, $9.3 million and $8.9 million for the years ended December 31, 2020, 2019 and 2018, respectively.
Contributions to employees' accounts under the 401(k) plan and the non-qualified defined contribution plan, as well as total assets of the plans, were as follows:
($ in thousands) Year Ended December 31,
2020 2019 2018
401(k) planContributions to employees' accounts $ 8,187 $ 8,233 $ 7,655 Total assets at the end of the year 228,449 206,247 167,767
Non-qualified defined contribution planContributions to employees' accounts 68 58 70 Total assets at the end of the year — — —
NOTE 14 - Retirement Plans and Other Postretirement Benefits (continued)
Horace Mann Educators Corporation Annual Report on Form 10-K 127

Defined Benefit Plan and Supplemental Retirement Plans
The following tables summarize the funded status of the defined benefit and supplemental retirement pension plans as of December 31, 2020, 2019 and 2018 (the measurement dates) and identify (1) the assumptions used to determine the projected benefit obligation and (2) the components of net pension cost for the defined benefit plan and supplemental retirement plans for the following periods:
($ in thousands)
Defined Benefit PlanSupplemental
Defined Benefit Plans
December 31, December 31,
2020 2019 2018 2020 2019 2018
Change in benefit obligation:
Projected benefit obligationat beginning of year $ 24,820 $ 25,075 $ 28,432 $ 15,228 $ 15,404 $ 16,832
Service cost 650 650 650 — — — Interest cost 731 997 947 453 620 566 Plan amendments — — — — — — Actuarial loss (gain) 1,021 101 (2,208) 1,318 516 (789) Benefits paid (1,538) (2,003) (2,746) (1,312) (1,312) (1,205) Settlements (1,392) — — — — —
Projected benefit obligation at end of year $ 24,292 $ 24,820 $ 25,075 $ 15,687 $ 15,228 $ 15,404
Change in plan assets:
Fair value of plan assetsat beginning of year $ 23,164 $ 22,090 $ 25,843 $ — $ — $ —
Actual return on plan assets 2,253 3,471 (640) — — — Employer contributions — — — 1,312 1,312 1,205 Benefits paid (1,538) (2,003) (2,746) (1,312) (1,312) (1,205) Expenses paid (542) (394) (367) — — — Settlements (1,392) — — — — — Fair value of plan assets at end of year $ 21,945 $ 23,164 $ 22,090 $ — $ — $ —
Funded status $ (2,347) $ (1,656) $ (2,985) $ (15,687) $ (15,228) $ (15,404)
Prepaid (accrued) benefit expense $ 5,485 $ 6,690 $ 7,425 $ (9,327) $ (9,884) $ (10,320)
Total amount recognized in ConsolidatedBalance Sheets, all in Other liabilities $ (2,347) $ (1,656) $ (2,985) $ (15,687) $ (15,228) $ (15,404)
Amounts recognized in accumulated othercomprehensive income (loss) (AOCI):
Prior service cost $ — $ — $ — $ — $ — $ — Net actuarial loss (7,833) (8,345) 10,410 (6,360) (5,345) 5,084 Total amount recognized in AOCI $ (7,833) $ (8,345) $ 10,410 $ (6,360) $ (5,345) $ 5,084
Information for pension plans with anaccumulated benefit obligation greaterthan plan assets:
Projected benefit obligation $ 24,292 $ 24,820 $ 25,075 $ 15,687 $ 15,228 $ 15,404 Accumulated benefit obligation 24,292 24,820 25,075 15,687 15,228 15,404 Fair value of plan assets 21,945 23,164 22,090 — — —
NOTE 14 - Retirement Plans and Other Postretirement Benefits (continued)
128 Annual Report on Form 10-K Horace Mann Educators Corporation

The change in the Company's AOCI for the defined benefit plans for the year ended December 31, 2020 was primarily attributable to better than expected asset returns, updates to mortality assumptions and updated census dates partially offset by a decrease in the discount rate and an updated mortality projection scale. The change in the Company's AOCI for the defined benefit plans for the year ended December 31, 2019 was primarily attributable to better than expected asset returns, updates to mortality assumptions and updated census dates offset by a decrease in the discount rate. The change in the Company's AOCI for the defined benefit plans for the year ended December 31, 2018 was primarily attributable to lower than expected asset returns and updates to mortality assumptions and an increase in the discount rate.
($ in thousands)Defined Benefit Plan
SupplementalDefined Benefit Plans
Year Ended December 31, Year Ended December 31,
2020 2019 2018 2020 2019 2018
Components of net periodic pension(income) expense:
Service cost:Benefit accrual $ — $ — $ — $ — $ — $ — Other expenses 650 650 650 — — —
Interest cost 731 997 947 453 620 566 Expected return on plan assets (966) (1,222) (1,377) — — — Settlement loss 447 — — — — — Amortization of:
Prior service cost — — — — — — Actuarial loss 342 310 371 302 256 310
Net periodic pension expense $ 1,204 $ 735 $ 591 $ 755 $ 876 $ 876
Changes in plan assets and benefitobligations included in othercomprehensive income (loss):
Prior service cost $ — $ — $ — $ — $ — $ — Net actuarial loss (gain) 277 (1,755) 177 1,318 516 (789) Amortization of:
Prior service cost — — — — — — Actuarial loss (790) (310) (371) (302) (256) (310)
Total recognized inother comprehensiveincome (loss) $ (513) $ (2,065) $ (194) $ 1,016 $ 260 $ (1,099)
Weighted average assumptions used todetermine expense:
Discount rate 3.10 % 4.20 % 3.50 % 3.10 % 4.20 % 3.50 %Expected return on plan assets 4.80 % 5.75 % 5.90 % * * *Annual rate of salary increase * * * * * *
Weighted average assumptionsused to determine benefit obligationsas of December 31:
Discount rate 2.08 % 3.10 % 4.20 % 2.08 % 3.10 % 4.20 %Expected return on plan assets 4.80 % 5.75 % 5.90 % * * *Annual rate of salary increase * * * * * *
* Not applicable.
NOTE 14 - Retirement Plans and Other Postretirement Benefits (continued)
Horace Mann Educators Corporation Annual Report on Form 10-K 129
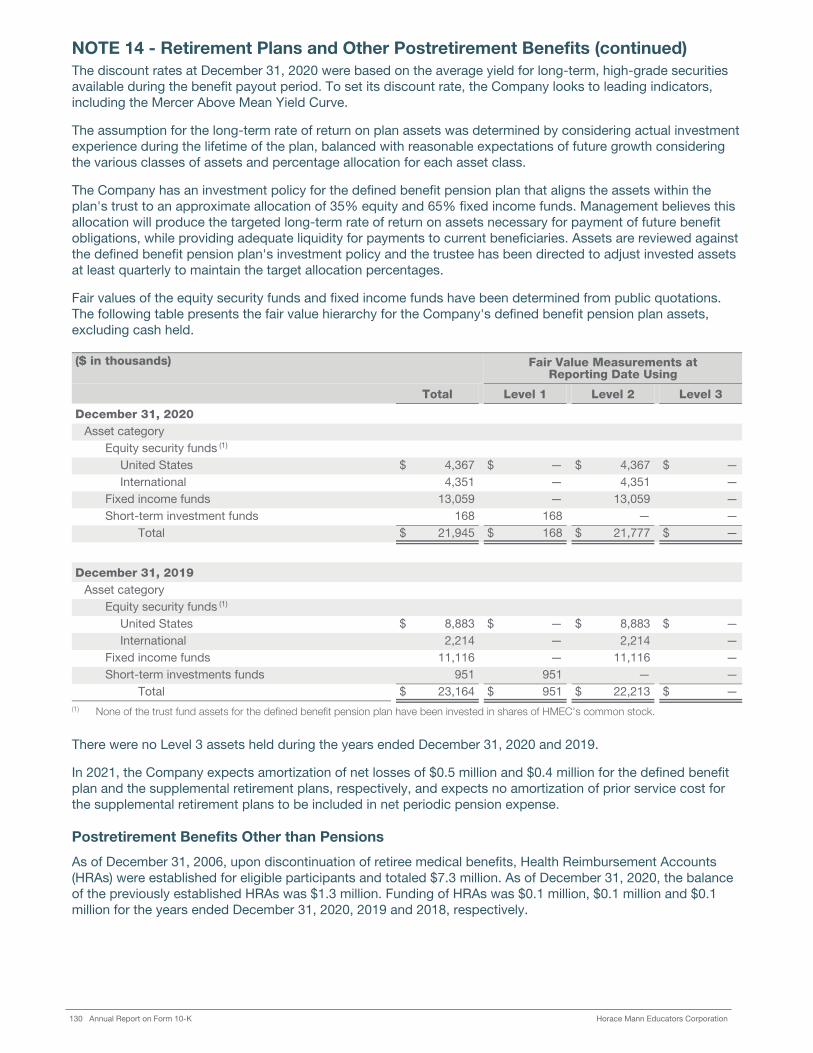
The discount rates at December 31, 2020 were based on the average yield for long-term, high-grade securities available during the benefit payout period. To set its discount rate, the Company looks to leading indicators, including the Mercer Above Mean Yield Curve.
The assumption for the long-term rate of return on plan assets was determined by considering actual investment experience during the lifetime of the plan, balanced with reasonable expectations of future growth considering the various classes of assets and percentage allocation for each asset class.
The Company has an investment policy for the defined benefit pension plan that aligns the assets within the plan's trust to an approximate allocation of 35% equity and 65% fixed income funds. Management believes this allocation will produce the targeted long-term rate of return on assets necessary for payment of future benefit obligations, while providing adequate liquidity for payments to current beneficiaries. Assets are reviewed against the defined benefit pension plan's investment policy and the trustee has been directed to adjust invested assets at least quarterly to maintain the target allocation percentages.
Fair values of the equity security funds and fixed income funds have been determined from public quotations. The following table presents the fair value hierarchy for the Company's defined benefit pension plan assets, excluding cash held.
($ in thousands) Fair Value Measurements atReporting Date Using
Total Level 1 Level 2 Level 3
December 31, 2020
Asset categoryEquity security funds (1)
United States $ 4,367 $ — $ 4,367 $ — International 4,351 — 4,351 —
Fixed income funds 13,059 — 13,059 — Short-term investment funds 168 168 — —
Total $ 21,945 $ 168 $ 21,777 $ —
December 31, 2019
Asset categoryEquity security funds (1)
United States $ 8,883 $ — $ 8,883 $ — International 2,214 — 2,214 —
Fixed income funds 11,116 — 11,116 — Short-term investments funds 951 951 — —
Total $ 23,164 $ 951 $ 22,213 $ — (1) None of the trust fund assets for the defined benefit pension plan have been invested in shares of HMEC's common stock.
There were no Level 3 assets held during the years ended December 31, 2020 and 2019.
In 2021, the Company expects amortization of net losses of $0.5 million and $0.4 million for the defined benefit plan and the supplemental retirement plans, respectively, and expects no amortization of prior service cost for the supplemental retirement plans to be included in net periodic pension expense.
Postretirement Benefits Other than Pensions
As of December 31, 2006, upon discontinuation of retiree medical benefits, Health Reimbursement Accounts (HRAs) were established for eligible participants and totaled $7.3 million. As of December 31, 2020, the balance of the previously established HRAs was $1.3 million. Funding of HRAs was $0.1 million, $0.1 million and $0.1 million for the years ended December 31, 2020, 2019 and 2018, respectively.
NOTE 14 - Retirement Plans and Other Postretirement Benefits (continued)
130 Annual Report on Form 10-K Horace Mann Educators Corporation

2021 Contributions
In 2021, there is no minimum funding requirement for the Company's defined benefit plan. The following table discloses that minimum funding requirement and the expected full year contributions for the Company's plans.
($ in thousands) Defined Benefit Pension Plans
DefinedBenefit Plan
SupplementalDefined Benefit
Plans
Minimum funding requirement for 2020 $ — $ —
Expected contributions (approximations) for the year endedDecember 31, 2021 at the time of issuance of this Form 10-K (1) $ — $ 1,282
N/A - Not applicable.(1) HMEC's Annual Report on Form 10-K for the year ended December 31, 2020.
Estimated Future Benefit Payments
The Company's defined benefit plan may be subject to settlement accounting. Assumptions for both the number of individuals retiring in a calendar year and their elections regarding lump sum distributions are significant factors impacting the payout patterns for each of the plans below. Therefore, actual results could vary from the estimates shown. Estimated future benefit payments as of December 31, 2020 were as follows:
($ in thousands) 2021 2022 2023 2024 2025 2026-2030
Pension plansDefined benefit plan $ 2,131 $ 2,185 $ 1,979 $ 2,013 $ 1,942 $ 7,099 Supplemental retirement plans 1,282 1,263 1,240 1,213 1,182 5,269
NOTE 15 - Contingencies and Commitments
Lawsuits and Legal Proceedings
Companies in the insurance industry have been subject to substantial litigation resulting from claims, disputes and other matters. For instance, they have faced expensive claims, including class action lawsuits, alleging, among other things, improper sales practices and improper claims settlement procedures. Negotiated settlements of certain such actions have had a material adverse effect on many insurance companies.
At the time of issuance of this Annual Report on Form 10-K, the Company does not have pending litigation from which there is a reasonable possibility of material loss.
Assessments for Insolvencies of Unaffiliated Insurance Companies
The Company is contingently liable for possible assessments under regulatory requirements pertaining to potential insolvencies of unaffiliated insurance companies. Liabilities, which are established based upon regulatory guidance, have generally been insignificant.
Investment Commitments
From time to time, the Company has outstanding commitments to fund investments in limited partnership interests, commercial mortgage loans and bank loans. Such unfunded commitments were $571.9 million and $306.2 million for the years ended December 31, 2020 and 2019, respectively.
NOTE 14 - Retirement Plans and Other Postretirement Benefits (continued)
Horace Mann Educators Corporation Annual Report on Form 10-K 131

Comprehensive income (loss) represents the change in shareholders' equity during a reporting period from transactions and other events and circumstances from non-shareholder sources. For the Company, comprehensive income (loss) is equal to net income plus or minus the after tax change in net unrealized investment gains (losses) on fixed maturity securities and the after tax change in net funded status of benefit plans for the periods as shown in the Consolidated Statements of Changes in Shareholders' Equity. AOCI represents the accumulated change in shareholders' equity from these transactions and other events and circumstances from non-shareholder sources as shown in the Consolidated Balance Sheets.
In the Consolidated Balance Sheets, the Company recognizes the net funded status of benefit plans as a component of AOCI, net of tax.
Comprehensive Income (Loss)
The components of comprehensive income (loss) were as follows:
($ in thousands) Year Ended December 31,
2020 2019 2018
Net income $ 133,315 $ 184,443 $ 18,343 Other comprehensive income (loss):
Change in net unrealized investment gains (losses) on fixed maturity securities:
Net unrealized investment gains (losses) on securities arising during the period 183,950 327,363 (275,094)
Less: reclassification adjustment for net investment gains (losses)included in income before income tax 11,235 157,423 (16,363)
Total, before tax 172,715 169,940 (258,731) Income tax expense (benefit) 36,878 36,433 (55,495)
Total, net of tax 135,837 133,507 (203,236) Change in net funded status of benefit plans:
Before tax (503) 1,805 1,294 Income tax expense (benefit) (105) 387 262
Total, net of tax (398) 1,418 1,032 Total comprehensive income (loss) $ 268,754 $ 319,368 $ (183,861)
NOTE 16 - Comprehensive Income (Loss) and Accumulated Other Comprehensive Income (Loss)
132 Annual Report on Form 10-K Horace Mann Educators Corporation

Accumulated Other Comprehensive Income (Loss)
The following table reconciles the components of AOCI for the periods indicated.
($ in thousands) Net UnrealizedInvestment
Gains (Losses) on
Securities (1)(2)
Net FundedStatus of
Benefit Plans (1) Total (1)
Beginning balance, January 1, 2020 $ 230,448 $ (10,767) $ 219,681 Other comprehensive income (loss) before reclassifications 144,713 (398) 144,315
Amounts reclassified from AOCI (8,876) — (8,876)
Net current period other comprehensive income (loss) 135,837 (398) 135,439 Ending balance, December 31, 2020 $ 366,285 $ (11,165) $ 355,120
Beginning balance, January 1, 2019 $ 96,941 $ (12,185) $ 84,756 Other comprehensive income (loss) before reclassifications 257,871 1,418 259,289
Amounts reclassified from AOCI (124,364) — (124,364)
Net current period other comprehensive income (loss) 133,507 1,418 134,925 Ending balance, December 31, 2019 $ 230,448 $ (10,767) $ 219,681
Beginning balance, January 1, 2018 $ 300,177 $ (13,217) $ 286,960 Other comprehensive income (loss) before reclassifications (201,122) 1,032 (200,090)
Amounts reclassified from AOCI 12,927 — 12,927
Cumulative effect of change in accounting principle (3) (15,041) — (15,041)
Net current period other comprehensive income (loss) (203,236) 1,032 (202,204) Ending balance, December 31, 2018 $ 96,941 $ (12,185) $ 84,756
(1) All amounts are net of tax.(2) The pretax amounts reclassified from AOCI, $11.2 million, $157.4 million and $(16.4) million, are included in net investment gains (losses) and
the related tax expenses, $2.4 million, $33.1 million and $(3.4) million, are included in income tax expense in the Consolidated Statements of Operations for the years ended December 31, 2020, 2019 and 2018, respectively.
(3) The Company adopted guidance on January 1, 2018 that resulted in reclassifying $15.0 million of after tax net unrealized gains on equity securities from AOCI to Retained earnings.
Comparative information for elements that are not required to be reclassified in their entirety to net income in the same reporting period is located in Note 2.
NOTE 16 - Comprehensive Income (Loss) and Accumulated Other Comprehensive Income (Loss) (continued)
Horace Mann Educators Corporation Annual Report on Form 10-K 133

($ in thousands) Years Ended December 31,
2020 2019 2018
Cash $ 21,774 $ 25,206 $ 11,906
Restricted cash 549 302 —
Total cash and restricted cash shown in the Consolidated Statements ofCash Flows $ 22,323 $ 25,508 $ 11,906
Cash paid during the year for:
Interest $ 15,476 $ 14,104 $ 12,532
Income taxes 17,301 22,946 8,679
Non-cash investing activities include $2.1 billion of investments transferred to a reinsurer as consideration paid during the second quarter of 2019 in connection with the Company's reinsurance of a $2.9 billion block of in force fixed and variable annuity business. See Note 5 for further information.
Non-cash investing activities in respect to modifications or exchanges of fixed maturity securities as well as paid-in-kind activity for policy loans were insignificant for the years ended December 31, 2020, 2019 and 2018, respectively.
NOTE 18 - Segment Information
The Company conducts and manages its business through five reporting segments. See Note 1 for a description of the Company's reporting segments that changed effective in the third quarter of 2019. The four operating segments, representing the major lines of insurance business, are: Property and Casualty (primarily personal lines of automobile and property insurance products), the newly created Supplemental (primarily cancer, heart, hospital, supplemental disability and accident coverages), Retirement (primarily tax-qualified fixed and variable annuities) and Life (life insurance). The Company does not allocate the impact of corporate-level transactions to these operating segments, consistent with the basis for management's evaluation of the results of those segments, but classifies those items in the fifth segment, Corporate and Other. In addition to ongoing transactions such as corporate debt service, net investment gains (losses) and certain public company expenses, such items also have included corporate debt retirement costs, when applicable.
The accounting policies of the segments are the same as those described in Note 1. The Company accounts for intersegment transactions, primarily the allocation of operating and agency costs from Corporate and Other to Property and Casualty, Supplemental, Retirement and Life, on a direct cost basis.
NOTE 17 - Supplemental Consolidated Cash and Cash Flow Information
134 Annual Report on Form 10-K Horace Mann Educators Corporation

Summarized financial information for these segments is as follows:
($ in thousands) Years Ended December 31,
2020 2019 2018
Insurance premiums and contract charges earnedProperty and Casualty $ 650,168 $ 683,454 $ 665,734 Supplemental (1) 130,694 65,815 N/ARetirement 29,649 29,083 31,269 Life 120,186 119,602 120,330
Total $ 930,697 $ 897,954 $ 817,333
Net investment incomeProperty and Casualty $ 42,556 $ 41,740 $ 40,104 Supplemental (1) 17,818 7,480 N/ARetirement 229,853 245,475 262,634 Life 69,799 71,957 74,399 Corporate and Other (171) (85) 142 Intersegment eliminations (2,259) (1,503) (772)
Total $ 357,596 $ 365,064 $ 376,507
Net income (loss)Property and Casualty $ 76,516 $ 54,359 $ (14,243) Supplemental (1) 43,089 17,989 N/ARetirement 20,038 (4,867) 41,736 Life 10,461 17,574 18,754 Corporate and Other (16,789) 99,388 (27,904)
Total $ 133,315 $ 184,443 $ 18,343
($ in thousands) December 31,
2020 2019 2018
AssetsProperty and Casualty $ 1,324,923 $ 1,327,099 $ 1,236,362 Supplemental 811,457 747,602 N/ARetirement 9,198,723 8,330,127 7,866,969 Life 2,044,503 1,964,993 1,821,351 Corporate and Other 182,342 172,955 149,014 Intersegment eliminations (90,135) (64,072) (41,800)
Total $ 13,471,813 $ 12,478,704 $ 11,031,896 (1) Acquired on July 1, 2019. The twelve month comparison is not meaningful.
NOTE 18 - Segment Information (continued)
Horace Mann Educators Corporation Annual Report on Form 10-K 135

Additional significant financial information for these segments is as follows:
($ in thousands) Years Ended December 31,
2020 2019 2018
DAC amortization expenseProperty and Casualty $ 74,452 $ 79,453 $ 79,073 Supplemental (1) 1,287 438 N/ARetirement 16,718 21,446 23,186 Life 7,452 7,844 7,630
Total $ 99,909 $ 109,181 $ 109,889
Income tax expense (benefit)Property and Casualty $ 15,380 $ 13,954 $ (6,622) Supplemental (1) 11,972 5,105 N/ARetirement 2,105 33,772 10,000 Life 2,428 4,907 4,979 Corporate and Other (5,617) (5,732) (7,163)
Total $ 26,268 $ 52,006 $ 1,194 (1) Acquired on July 1, 2019. The twelve month comparison is not meaningful.
NOTE 18 - Segment Information (continued)
136 Annual Report on Form 10-K Horace Mann Educators Corporation

Selected quarterly financial data is presented below.
($ in thousands, except per share data) Three Months Ended
December 31, September 30, June 30, March 31,
2020
Insurance premiums and contract charges earned $ 233,648 $ 235,353 $ 225,431 $ 236,265
Insurance premiums written and contract deposits (2)(3) 332,559 368,853 329,169 328,758
Total revenues 352,344 337,080 314,459 306,558
Net income 47,791 36,474 30,578 18,472
Per share information
Basic
Net income $ 1.14 $ 0.87 $ 0.73 $ 0.44
Shares of common stock - weighted average (4) 41,962 41,916 41,879 41,827
Diluted
Net income $ 1.13 $ 0.87 $ 0.73 $ 0.44
Shares of common stock and equivalent shares - weighted average (4) 42,156 42,058 41,996 42,019
2019
Insurance premiums and contract charges earned (1) $ 240,392 $ 239,681 $ 208,096 $ 209,785
Insurance premiums written and contract deposits (1)(2)(3) 346,242 371,216 311,691 295,394
Total revenues (1) 331,376 334,418 451,478 313,213
Net income (1) 33,001 25,454 93,822 32,166
Per share information
Basic
Net income (1) $ 0.79 $ 0.61 $ 2.25 $ 0.77
Shares of common stock - weighted average (4) 41,814 41,785 41,762 41,610
Diluted
Net income (1) $ 0.78 $ 0.60 $ 2.24 $ 0.77
Shares of common stock and equivalent shares - weighted average (4) 42,093 42,030 41,921 41,785
2018
Insurance premiums and contract charges earned $ 201,905 $ 206,820 $ 205,610 $ 202,998
Insurance premiums written and contract deposits (2) 311,216 338,097 301,722 284,008
Total revenues 278,535 311,318 306,257 295,489
Net income (20,257) 12,528 5,917 20,155
Per share information
Basic
Net income (loss) $ (0.49) $ 0.30 $ 0.14 $ 0.49
Shares of common stock - weighted average (4) 41,596 41,683 41,600 41,497
Diluted
Net income (loss) $ (0.49) $ 0.30 $ 0.14 $ 0.48
Shares of common stock and equivalent shares - weighted average (4) 41,911 41,850 41,735 41,653
(1) NTA was acquired on July 1, 2019.(2) This measure is not based on accounting principles generally accepted in the United States of America (non-GAAP). An explanation of this
measure is contained in the Glossary of Selected Terms included as an exhibit in the Company's reports filed with the SEC.(3) Excludes the annuity reinsurance transaction accounted for under the deposit method that is discussed in Note 5.(4) Rounded to thousands.
NOTE 19 - Unaudited Selected Quarterly Financial Data
Horace Mann Educators Corporation Annual Report on Form 10-K 137
ITEM 9. I Changes in and Disagreements with Accountants on Accounting and Financial Disclosure
None.
ITEM 9A. I Controls and Procedures
Management's Conclusion Regarding the Effectiveness of Disclosure Controls and Procedures
Under the supervision and with the participation of our management, including our chief executive officer and chief financial officer, we conducted an evaluation of the effectiveness of the design and operation of our disclosure controls and procedures, as such term is defined under Rule 13a-15(e) of the Securities and Exchange Act of 1934 as amended (Exchange Act) as of December 31, 2020. Based on this evaluation, the chief executive officer and chief financial officer concluded that our disclosure controls and procedures were effective as of December 31, 2020, the end of the period covered by this Annual Report on Form 10-K.
Changes in Internal Control Over Financial Reporting
There were no changes in our internal control over financial reporting that occurred during the quarter ended December 31, 2020 that have materially affected, or are reasonably likely to materially affect, our internal control over financial reporting.
Management's Annual Report on Internal Control Over Financial Reporting
We are responsible for establishing and maintaining adequate internal control over financial reporting. Our internal control over financial reporting is designed to provide reasonable assurance regarding the reliability of financial reporting and the preparation of the consolidated financial statements in accordance with accounting principles generally accepted in the United States of America. Our accounting policies and internal controls over financial reporting, established and maintained by management, are under the general oversight of our Audit Committee.
Our internal control over financial reporting includes those policies and procedures that:
• pertain to the maintenance of records that, in reasonable detail, accurately and fairly reflect the transactions and dispositions of our assets;
• provide reasonable assurance that transactions are recorded as necessary to permit preparation of financial statements in accordance with accounting principles generally accepted in the United States of America, and that receipts and expenditures are being made only in accordance with authorizations of our management and directors; and
• provide reasonable assurance regarding prevention or timely detection of unauthorized acquisition, use, or disposition of assets that could have a material effect on the financial statements.
Because of its inherent limitations, internal control over financial reporting may not prevent or detect misstatements. Also, projections of any evaluation of effectiveness to future periods are subject to the risk that controls may become inadequate because of changes in conditions, or that the degree of compliance with the policies or procedures may deteriorate.
We have assessed our internal control over financial reporting as of December 31, 2020. The standard measures adopted by management in making its evaluation are the measures in the Internal Control - Integrated Framework (2013) issued by the Committee of Sponsoring Organizations of the Treadway Commission.
Consistent with guidance issued by the Securities and Exchange Commission that an assessment of a recently acquired business may be omitted from management's report on internal control over financial reporting in the
138 Annual Report on Form 10-K Horace Mann Educators Corporation

year of acquisition, management excluded an assessment of the effectiveness of our internal control over financial reporting for one year after the acquisition related to NTA for the time period of July 1, 2019 through June 30, 2020. For the six month period ended June 30, 2020, NTA represented $75.2 million of consolidated revenues which are included in our consolidated financial statements for the year ended December 31, 2020.
Based on our assessment, we concluded that our internal control over financial reporting was effective at December 31, 2020, and that there were no material weaknesses in our internal control over financial reporting as of that date.
KPMG LLP, an independent registered public accounting firm, which has audited and reported on the Consolidated Financial Statements contained in this Annual Report on Form 10-K, has issued its report on the effectiveness of our internal control over financial reporting which follows this report.
Report of Independent Registered Public Accounting Firm
To the Shareholders and Board of Directors
Horace Mann Educators Corporation:
Opinion on Internal Control Over Financial Reporting
We have audited Horace Mann Educators Corporation and subsidiaries’ (the “Company”) internal control over financial reporting as of December 31, 2020, based on criteria established in Internal Control – Integrated Framework (2013) issued by the Committee of Sponsoring Organizations of the Treadway Commission. In our opinion, the Company maintained, in all material respects, effective internal control over financial reporting as of December 31, 2020, based on criteria established in Internal Control – Integrated Framework (2013) issued by the Committee of Sponsoring Organizations of the Treadway Commission.
We also have audited, in accordance with the standards of the Public Company Accounting Oversight Board (United States) (PCAOB), the consolidated balance sheets of the Company as of December 31, 2020 and 2019, the related consolidated statements of operations, comprehensive income (loss), changes in shareholders’ equity, and cash flows for each of the years in the three-year period ended December 31, 2020, and the related notes and financial statement schedules I to IV and VI (collectively, the consolidated financial statements), and our report dated February 26, 2021 expressed an unqualified opinion on those consolidated financial statements.
The Company acquired all of the equity interests of NTA Life Enterprises, LLC (NTA) on July 1, 2019. Management excluded NTA from its assessment of the effectiveness of the Company’s internal control over financial reporting for the period July 1, 2019 to June 30, 2020. Our audit of internal control over financial reporting of the Company as of December 31, 2020 included the internal control over financial reporting of NTA from July 1, 2020 to December 31, 2020. For the six month period ended June 30, 2020, NTA represented $75.2 million of consolidated revenues which are included in the consolidated financial statements for the year ended December 31, 2020.
Basis for Opinion
The Company’s management is responsible for maintaining effective internal control over financial reporting and for its assessment of the effectiveness of internal control over financial reporting, included in the accompanying Management’s Annual Report on Internal Control Over Financial Reporting. Our responsibility is to express an opinion on the Company’s internal control over financial reporting based on our audit. We are a public accounting firm registered with the PCAOB and are required to be independent with respect to the Company in accordance with the U.S. federal securities laws and the applicable rules and regulations of the Securities and Exchange Commission and the PCAOB.
We conducted our audit in accordance with the standards of the PCAOB. Those standards require that we plan and perform the audit to obtain reasonable assurance about whether effective internal control over financial reporting was maintained in all material respects. Our audit of internal control over financial reporting included obtaining an understanding of internal control over financial reporting, assessing the risk that a material weakness exists, and testing and evaluating the design and operating effectiveness of internal control based on the assessed risk. Our audit also included performing such other procedures as we considered necessary in the circumstances. We believe that our audit provides a reasonable basis for our opinion.
Horace Mann Educators Corporation Annual Report on Form 10-K 139

Definition and Limitations of Internal Control Over Financial Reporting
A company’s internal control over financial reporting is a process designed to provide reasonable assurance regarding the reliability of financial reporting and the preparation of financial statements for external purposes in accordance with generally accepted accounting principles. A company’s internal control over financial reporting includes those policies and procedures that (1) pertain to the maintenance of records that, in reasonable detail, accurately and fairly reflect the transactions and dispositions of the assets of the company; (2) provide reasonable assurance that transactions are recorded as necessary to permit preparation of financial statements in accordance with generally accepted accounting principles, and that receipts and expenditures of the company are being made only in accordance with authorizations of management and directors of the company; and (3) provide reasonable assurance regarding prevention or timely detection of unauthorized acquisition, use, or disposition of the company’s assets that could have a material effect on the financial statements.
Because of its inherent limitations, internal control over financial reporting may not prevent or detect misstatements. Also, projections of any evaluation of effectiveness to future periods are subject to the risk that controls may become inadequate because of changes in conditions, or that the degree of compliance with the policies or procedures may deteriorate.
/s/ KPMG LLP
KPMG LLP
Chicago, Illinois
February 26, 2021
ITEM 9B. I Other Information
Not applicable.
PART III
Our Proxy Statement will be filed with the SEC no later than April 30, 2021 in preparation for our 2021 Annual Meeting of Shareholders. As permitted in Paragraph G(3) of the General Instructions for Form 10-K, we are incorporating by reference, to that Proxy Statement, portions of the information required by Part III as noted in Item 10 through Item 14 below.
140 Annual Report on Form 10-K Horace Mann Educators Corporation

ITEM 10. I Directors, Executive Officers and Corporate Governance
(a) The following sections of our Proxy Statement for our 2021 Annual Meeting of Shareholders, are incorporated herein by reference: "Board of Directors and Committees", "Executive Officers", "Section 16(a) Beneficial Ownership Reporting Compliance", and "Corporate Governance".
(b) We have adopted a code of ethics that applies to our principal executive officer, principal financial officer, principal accounting officer and all other employees. In addition, the Board has adopted the code of ethics for our Board members as it applies to each Board member's business conduct on behalf of us. The code of ethics is posted on our website, www.horacemann.com, under Investors — Governance — Governance Documents. In addition, amendments to the code of ethics requiring disclosure under applicable SEC rules will be posted on our website set forth within four days after such amendment or grant of waiver rather than by filing a Current Report on Form 8-K.
ITEM 11. I Executive Compensation
The "Proposal No. 3 - Advisory Resolution to Approve Named Executive Officers' Compensation" section of our Proxy Statement for our 2021 Annual Meeting of Shareholders, is incorporated herein by reference. It includes "Compensation Discussion and Analysis", and "Compensation Committee Report".
ITEM 12. I Security Ownership of Certain Beneficial Owners and Management and Related Shareholder Matters
(a) The "Security Ownership of Certain Beneficial Owners and Management" section of our Proxy Statement for our 2021 Annual Meeting of Shareholders, is incorporated herein by reference.
(b) The "Equity Compensation Plan Information" section of our Proxy Statement for our 2021 Annual Meeting of Shareholders, is incorporated herein by reference. Additional information on share-based compensation under our equity compensation plans is available in Part II - Item 8, Note 12 of the Consolidated Financial Statements.
ITEM 13. I Certain Relationships and Related Transactions and Director Independence
The following sections of our Proxy Statement for our 2021 Annual Meeting of Shareholders, are incorporated by reference: "Corporate Governance - Director Independence", and "Corporate Governance - Related Person Transactions".
ITEM 14. I Principal Accountant Fees and Services
Information required for this Item 14 is incorporated herein by reference, to our Proxy Statement for our 2021 Annual Meeting of Shareholders in the section "Proposal No. 4 - Ratification of Independent Registered Public Accounting Firm".
Horace Mann Educators Corporation Annual Report on Form 10-K 141

PART IV
ITEM 15. I Exhibits and Financial Statement Schedules
(a)(1) The following consolidated financial statements of the Company are contained in Part II - Item 8 of this report, Page 75 to Page 137
(a)(2) Financial statement schedules
Schedule I - Summary of Investments Other than Investments in Related Parties, Page 143
Schedule II - Condensed Financial Information of Registrant, Page 144
Schedules III and VI Combined - Supplementary Insurance Information and Supplemental Information Concerning Property and Casualty Insurance Operations, Page 148
Schedule IV - Reinsurance, Page 149
142 Annual Report on Form 10-K Horace Mann Educators Corporation

SCHEDULE I
HORACE MANN EDUCATORS CORPORATION SUMMARY OF INVESTMENTS-OTHER THAN INVESTMENTS IN RELATED PARTIES
December 31, 2020 ($ in thousands)
Type of Investments Cost (1)Fair
Value
AmountShown inBalanceSheet
Fixed maturity securities U.S. Government and federally sponsored agency obligations $ 814,204 $ 901,517 $ 901,517 States, municipalities and political subdivisions 1,612,290 1,827,497 1,827,497 Foreign government bonds 40,145 45,053 45,053 Public utilities 64,898 76,382 76,382 All other corporate bonds 1,811,755 2,015,192 2,015,192 Asset-backed securities 1,053,252 1,051,258 1,051,258 Residential mortgage-backed securities (non-agency) 53,727 53,627 53,627 Commercial mortgage-backed securities 309,726 343,439 343,439 Redeemable preferred stocks 28,554 31,325 31,325
Total fixed maturity securities 5,788,551 6,345,290 6,345,290
Equity securities Industrial, miscellaneous and all other 5,645 5,645 5,645 Banking & finance and insurance companies 1,852 1,852 1,852 Public utilities 388 388 388
Non-redeemable preferred stocks 90,709 90,709 90,709 Closed-end fund 23,059 23,059 23,059
Total equity securities 121,653 121,653 121,653
Limited partnership interests 448,996 XXX 448,996 Short-term investments 141,770 XXX 141,770 Policy loans 150,118 XXX 150,118 Derivatives 9,638 $ 16,805 16,805 Mortgage loans 18,150 XXX 18,150 Other 19,452 XXX 19,452
Total investments $ 6,698,328 XXX $ 7,262,234 (1) Bonds at original cost reduced by repayments and adjusted for amortization of premiums or accretion of discounts and impairment in value of
specifically identified investments.
See accompanying Report of Independent Registered Public Accounting Firm.
Horace Mann Educators Corporation Annual Report on Form 10-K 143

SCHEDULE II
HORACE MANN EDUCATORS CORPORATION(Parent Company Only)
CONDENSED FINANCIAL INFORMATION OF REGISTRANT BALANCE SHEETSAs of December 31, 2020 and 2019 ($ in thousands, except share data)
December 31,
2020 2019
ASSETS
Investments and cash $ 4,146 $ 1,453 Investment in subsidiaries 2,120,982 1,901,725 Other assets 58,852 62,442
Total assets $ 2,183,980 $ 1,965,620
LIABILITIES AND SHAREHOLDERS' EQUITY
Short-term debt $ 135,000 $ 135,000 Long-term debt 248,323 248,025 Other liabilities 10,578 15,310
Total liabilities 393,901 398,335
Preferred stock, $0.001 par value, authorized 1,000,000 shares;none issued — —
Common stock, $0.001 par value, authorized 75,000,000 shares;issued, 2020, 66,316,797; 2019, 66,088,808 66 66
Additional paid-in capital 488,367 480,962 Retained earnings 1,434,634 1,352,539 Accumulated other comprehensive income (loss), net of taxes:
Net unrealized investment gains on fixed maturity securities 366,285 230,448 Net funded status of benefit plans (11,165) (10,767)
Treasury stock, at cost, 2020, 24,902,579 shares;2019, 24,850,484 shares (488,108) (485,963)
Total shareholders' equity 1,790,079 1,567,285
Total liabilities and shareholders' equity $ 2,183,980 $ 1,965,620
See accompanying Note to Condensed Financial Statements.See accompanying Report of Independent Registered Public Accounting Firm.
144 Annual Report on Form 10-K Horace Mann Educators Corporation

SCHEDULE II (continued)
HORACE MANN EDUCATORS CORPORATION(Parent Company Only)
CONDENSED FINANCIAL INFORMATION OF REGISTRANT STATEMENTS OF OPERATIONS ($ in thousands)
Year Ended December 31,
2020 2019 2018
Revenues Net investment income $ (174) $ (135) $ 100 Realized investment gains — — —
Total revenues (174) (135) 100
ExpensesInterest expense 14,771 14,272 11,892 Other 5,750 12,632 10,898
Total expenses 20,521 26,904 22,790
Loss before income tax benefit and equity in net earnings of subsidiaries (20,695) (27,039) (22,690) Income tax benefit (5,307) (6,029) (4,723) Loss before equity in net earnings of subsidiaries (15,388) (21,010) (17,967) Equity in net earnings of subsidiaries 148,703 205,453 36,310
Net income $ 133,315 $ 184,443 $ 18,343
See accompanying Note to Condensed Financial Statements.See accompanying Report of Independent Registered Public Accounting Firm.
Horace Mann Educators Corporation Annual Report on Form 10-K 145

SCHEDULE II (continued)
HORACE MANN EDUCATORS CORPORATION(Parent Company Only)
CONDENSED FINANCIAL INFORMATION OF REGISTRANT STATEMENTS OF CASH FLOWS($ in thousands)
Year Ended December 31,
2020 2019 2018
Cash flows from operating activities Net Income $ 133,315 $ 184,443 $ 18,343 Equity in net income of subsidiaries (148,703) (205,453) (36,310) Dividends received from subsidiaries 167,000 363,250 61,000 Changes in:
Income taxes 1,956 3,369 (4,939) Operating assets and liabilities (5,894) 8,310 (1,792) Other 1,681 686 13,804
Net cash provided by operating activities 149,355 354,605 50,106
Cash flows from investing activitiesPurchase of equity securities 1,000 — — Net increase (decrease) in short-term investments (1,456) 3,336 1,621 Capital contributions to subsidiaries (97,000) — — Acquisition of businesses — (444,124) —
Net cash provided by (used in) investing activities (97,456) (440,788) 1,621
Cash flows from financing activitiesDividends paid to shareholders (49,620) (47,333) (46,689) Principal borrowings on senior revolving credit facility — 135,000 — Acquisition of treasury stock (2,145) — (5,088) Proceeds from exercise of stock options 2,402 1,730 3,627 Withholding tax payments on RSUs tendered (2,299) (3,680) (3,165)
Net cash (used in) provided by financing activities (51,662) 85,717 (51,315)
Net increase (decrease) in cash 237 (466) 412 Cash at beginning of period 72 538 126
Cash at end of period $ 309 $ 72 $ 538
See accompanying Note to Condensed Financial Statements.See accompanying Report of Independent Registered Public Accounting Firm.
146 Annual Report on Form 10-K Horace Mann Educators Corporation

SCHEDULE II (continued)
HORACE MANN EDUCATORS CORPORATION(Parent Company Only)
CONDENSED FINANCIAL INFORMATION OF REGISTRANT NOTE TO CONDENSED FINANCIAL STATEMENTS
The accompanying condensed financial statements should be read in conjunction with the Consolidated Financial Statements and the accompanying notes thereto.
Horace Mann Educators Corporation Annual Report on Form 10-K 147

SCHEDULE III & VI (COMBINED)
HORACE MANN EDUCATORS CORPORATION SCHEDULE III: SUPPLEMENTARY INSURANCE INFORMATION
SCHEDULE VI: SUPPLEMENTAL INFORMATION CONCERNING PROPERTY AND CASUALTY INSURANCE OPERATIONS($ in thousands)
Column identification for
Schedule III: A B C D E F G H I J K
Schedule VI: A B C D E F G H I J K
Deferredpolicy
acquisitioncosts
Future policy
benefits, claims and
claim expenses
Discount,if any,
deducted in
previouscolumn
Unearnedpremiums
Otherpolicyclaims
andbenefitspayable
Premiumrevenue/premiumearned
Net investment
income
Benefits,claims
andsettlementexpenses
Claims and claimadjustment expenses
incurred related toAmortizationof deferred
policyacquisition
costs
Otheroperatingexpenses
Paid claims and
claim adjustment expenses
Premiums writtenSegment
Currentyear
Prioryears
Year Ended December 31, 2020
Property and Casualty $ 26,153 $ 372,154 $ — $ 259,356 $ — $ 650,168 $ 42,556 $ 430,991 $ 441,191 $ (10,200) $ 74,452 $ 97,716 $ 438,189 $ 635,525
Supplemental 4,270 392,362 xxx 3,084 41,514 130,694 17,818 43,166 xxx xxx 1,287 51,686 xxx xxx
Retirement 137,735 4,874,167 xxx 716 706,297 29,649 229,853 164,807 xxx xxx 16,718 72,093 xxx xxx
Life 61,670 1,245,394 xxx 1,333 3,485 120,186 69,799 134,562 xxx xxx 7,452 35,292 xxx xxx
Other, including consolidatingeliminations N/A N/A xxx N/A N/A N/A (2,430) N/A xxx xxx N/A 20,636 xxx xxx
Total $ 229,828 $ 6,884,077 xxx $ 264,489 $ 751,296 $ 930,697 $ 357,596 $ 773,526 xxx xxx $ 99,909 $ 277,423 xxx xxx
Year Ended December 31, 2019
Property and Casualty $ 28,616 $ 386,976 $ — $ 273,998 $ — $ 683,454 $ 41,740 $ 475,563 $ 483,062 $ (7,500) $ 79,453 $ 105,489 $ 486,547 $ 683,101
Supplemental 1,967 390,276 xxx 3,218 — 65,815 7,480 24,723 xxx xxx 438 26,476 xxx xxx
Retirement 185,294 4,698,461 xxx 734 643,826 29,083 245,475 173,116 xxx xxx 21,446 90,782 xxx xxx
Life 60,791 1,201,593 xxx 1,213 3,457 119,602 71,957 124,452 xxx xxx 7,844 37,820 xxx xxx
Other, including consolidatingeliminations N/A N/A xxx N/A N/A N/A (1,588) N/A xxx xxx N/A 26,434 xxx xxx
Total $ 276,668 $ 6,677,306 xxx $ 279,163 $ 647,283 $ 897,954 $ 365,064 $ 797,854 xxx xxx $ 109,181 $ 287,001 xxx xxx
Year Ended December 31, 2018
Property and Casualty $ 30,033 $ 367,180 $ — $ 274,351 $ — $ 665,734 $ 40,104 $ 547,659 $ 547,959 $ (300) $ 79,073 $ 101,834 $ 531,977 $ 681,583
Retirement 209,232 4,573,170 xxx 704 764,607 31,269 262,634 168,732 xxx xxx 23,186 57,269 xxx xxx
Life 59,477 1,167,557 xxx 1,170 3,381 120,330 74,399 127,368 xxx xxx 7,630 36,314 xxx xxx
Other, including consolidatingeliminations N/A N/A xxx N/A N/A N/A (630) N/A xxx xxx N/A 22,997 xxx xxx
Total $ 298,742 $ 6,107,907 xxx $ 276,225 $ 767,988 $ 817,333 $ 376,507 $ 843,759 xxx xxx $ 109,889 $ 218,414 xxx xxx
N/A - Not applicable.
See accompanying Report of Independent Registered Public Accounting Firm.
148 Annual Report on Form 10-K Horace Mann Educators Corporation

SCHEDULE IV
HORACE MANN EDUCATORS CORPORATION REINSURANCE ($ in thousands)
Column A Column B Column C Column D Column E Column F
Gross
Amount
Ceded toOther
Companies
Assumedfrom OtherCompanies
NetAmount
Percentageof Amount
Assumed to Net
Year Ended December 31, 2020
Life insurance in force $ 19,821,228 $ 4,619,083 $ — $ 15,202,145 — Premiums
Property and Casualty $ 652,884 $ 12,635 $ 9,919 $ 650,168 1.5 %Supplemental 130,936 252 10 130,694 — Retirement 37,977 8,328 — 29,649 — Life 127,728 7,542 — 120,186 —
Total premiums $ 949,525 $ 28,757 $ 9,929 $ 930,697 1.1 %
Year Ended December 31, 2019
Life insurance in force $ 19,179,823 $ 4,813,185 $ — $ 14,366,638 — Premiums
Property and Casualty $ 689,156 $ 16,457 $ 10,755 $ 683,454 1.6 %Supplemental 65,918 104 1 65,815 — Retirement 35,602 6,519 — 29,083 — Life 126,934 7,332 — 119,602 —
Total premiums $ 917,610 $ 30,412 $ 10,756 $ 897,954 1.2 %
Year Ended December 31, 2018
Life insurance in force $ 18,277,691 $ 4,505,208 $ — $ 13,772,483 — Premiums
Property and Casualty $ 682,478 $ 21,767 $ 5,023 $ 665,734 0.8 %Retirement 31,269 — — 31,269 — Life 127,400 7,070 — 120,330 —
Total premiums $ 841,147 $ 28,837 $ 5,023 $ 817,333 0.6 %
Note: Premiums above include insurance premiums earned and contract charges earned.
See accompanying Report of Independent Registered Public Accounting Firm.
Horace Mann Educators Corporation Annual Report on Form 10-K 149

(a)(3) The following items are filed as Exhibits. Management contracts and compensatory plans are indicated by an asterisk (*).
ExhibitNo. Description
(3) Articles of incorporation and bylaws:
3.1 Restated Certificate of Incorporation of HMEC, filed with the Delaware Secretary of State on June 24, 2003, incorporated by reference to Exhibit 3.1 to HMEC's Quarterly Report on Form 10-Q for the quarter ended June 30, 2003, filed with the Securities and Exchange Commission (the "SEC") on August 14, 2003.
3.2 Bylaws of HMEC, incorporated by reference to Exhibit 3.2 to HMEC's Quarterly Report on Form 10-Q for the quarter ended June 30, 2003, filed with the SEC on August 14, 2003.
(4) Instruments defining the rights of security holders, including indentures:
4.1 Indenture, dated as of November 23, 2015, by and between HMEC and The Bank of New York Mellon Trust Company, N.A., as trustee, incorporated by reference to Exhibit 4.1 to HMEC's Current Report on Form 8-K dated November 18, 2015, filed with the SEC on November 23, 2015.
4.1(a) Form of HMEC 4.500% Senior Notes due 2025, incorporated by reference to Exhibit 4.2 to HMEC's Current Report on Form 8-K dated November 18, 2015, filed with the SEC on November 23, 2015.
4.2 Certificate of Designations for HMEC Series A Cumulative Convertible Preferred Stock, incorporated by reference to Exhibit 4.3 to HMEC's Annual Report on Form 10-K for the year ended December 31, 2005, filed with the SEC on March 16, 2006.
4.3 Description of Securities, incorporated by reference to Exhibit 4.3 to HMEC's Annual Report on Form 10-K for the year ended December 31, 2019, filed with the SEC on March 2, 2020.
(10) Material contracts:
10.1 Credit Agreement dated as of June 21, 2019 among HMEC, certain financial institutions named therein and PNC Bank, N.A., as administrative agent, incorporated by reference to Exhibit 10.1 to HMEC’s Current Report on Form 8-K dated June 24, 2019, filed with the SEC on June 24, 2019.
10.1(a) First Amendment to Credit Agreement dated as of June 21, 2019 among HMEC, certain financial institutions named therein and PNC Bank, N.A., as administrative agent, incorporated by reference to Exhibit 10.1(a) to HMEC's Annual Report on Form 10-K for the year ended December 31, 2019, filed with the SEC on March 2, 2020.
10.2* Horace Mann Educators Corporation Amended and Restated 2002 Incentive Compensation Plan ("2002 Incentive Compensation Plan"), incorporated by reference to Exhibit 10.2 to HMEC's Quarterly Report on Form 10-Q for the quarter ended June 30, 2005, filed with the SEC on August 9, 2005.
10.2(a)* Revised Specimen Employee Stock Option Agreement under the 2002 Incentive Compensation Plan, incorporated by reference to Exhibit 10.6(b) to HMEC's Annual Report on Form 10-K for the year ended December 31, 2008, filed with the SEC on March 2, 2009.
150 Annual Report on Form 10-K Horace Mann Educators Corporation

10.2(b)* Specimen Employee Restricted Stock Unit Agreement under the 2002 Incentive Compensation Plan, incorporated by reference to Exhibit 10.6(d) to HMEC's Annual Report on Form 10-K for the year ended December 31, 2005, filed with the SEC on March 16, 2006.
10.2(c)* Revised Specimen Employee Restricted Stock Unit Agreement under the 2002 Incentive Compensation Plan, incorporated by reference to Exhibit 10.6(f) to HMEC's Annual Report on Form 10-K for the year ended December 31, 2008, filed with the SEC on March 2, 2009.
10.2(d)* Specimen Non-employee Director Restricted Stock Unit Agreement under the 2002 Incentive Compensation Plan, incorporated by reference to Exhibit 10.6(e) to HMEC's Annual Report on Form 10-K for the year ended December 31, 2005, filed with the SEC on March 16, 2006.
10.2(e)* Revised Specimen Non-employee Director Restricted Stock Unit Agreement under the 2002 Incentive Compensation Plan, incorporated by reference to Exhibit 10.6(h) to HMEC's Annual Report on Form 10-K for the year ended December 31, 2008, filed with the SEC on March 2, 2009.
10.3* First Amendment to the HMEC 2010 Comprehensive Executive Compensation Plan (As Amended and Restated Effective as of May 20, 2015), incorporated by reference to Exhibit 10.3 to HMEC's Quarterly Report on Form 10-Q for the quarter ended March 31, 2017, filed with the SEC on May 9, 2017.
10.3(a)* HMEC 2010 Comprehensive Executive Compensation Plan (As Amended and Restated Effective May 20, 2015) (Section 16 Officer) Non-Qualified Stock Option Agreement - Employee Grantee, incorporated by reference to Exhibit 10.3(a) to HMEC's Quarterly Report on Form 10-Q for the quarter ended March 31, 2017, filed with the SEC on May 9, 2017.
10.3(b)* HMEC 2010 Comprehensive Executive Compensation Plan (As Amended and Restated Effective May 20, 2015) (Non-Section 16) Non-Qualified Stock Option Agreement - Employee Grantee, incorporated by reference to Exhibit 10.3(b) to HMEC's Quarterly Report on Form 10-Q for the quarter ended March 31, 2017, filed with the SEC on May 9, 2017.
10.3(c)* HMEC 2010 Comprehensive Executive Compensation Plan (As Amended and Restated Effective May 20, 2015) Service-Vested Restricted Stock Units Agreement - Employee Grantee, incorporated by reference to Exhibit 10.3(c) to HMEC's Quarterly Report on Form 10-Q for the quarter ended March 31, 2017, filed with the SEC on May 9, 2017.
10.3(d)* HMEC 2010 Comprehensive Executive Compensation Plan (As Amended and Restated Effective May 20, 2015) Performance-Based Restricted Stock Units Agreement - Employee Grantee, incorporated by reference to Exhibit 10.3(d) to HMEC's Quarterly Report on Form 10-Q for the quarter ended March 31, 2017, filed with the SEC on May 9, 2017.
10.3(e)* HMEC 2010 Comprehensive Executive Compensation Plan (As Amended and Restated Effective May 20, 2015) Service-Vested Restricted Stock Units Agreement - Employee Grantee (One-Time Grant Service), incorporated by reference to Exhibit 10.3(e) to HMEC's Quarterly Report on Form 10-Q for the quarter ended March 31, 2017, filed with the SEC on May 9, 2017.
10.3(f)* Specimen Employee Performance-Based Restricted Stock Units Agreement - Key Strategic Grantee under the HMEC 2010 Comprehensive Executive Compensation Plan incorporated by reference to Exhibit 10.3(e) to HMEC's Quarterly Report on Form 10-Q for the quarter ended March 31, 2016, filed with the SEC on May 6, 2016.
Horace Mann Educators Corporation Annual Report on Form 10-K 151

10.3(g)* Specimen Non-employee Director Restricted Stock Units Award Agreement under the HMEC 2010 Comprehensive Executive Compensation Plan, incorporated by reference to Exhibit 10.17(a) to HMEC's Current Report on Form 8-K dated May 27, 2010, filed with the SEC on June 2, 2010.
10.4* Horace Mann Supplemental Employee Retirement Plan, 2002 Restatement, incorporated by reference to Exhibit 10.1 to HMEC's Quarterly Report on Form 10-Q for the quarter ended March 31, 2002, filed with the SEC on May 15, 2002.
10.5* Horace Mann Executive Supplemental Employee Retirement Plan, 2002 Restatement, incorporated by reference to Exhibit 10.2 to HMEC's Quarterly Report on Form 10-Q for the quarter ended March 31, 2002, filed with the SEC on May 15, 2002.
10.6* Amended and Restated Horace Mann Nonqualified Supplemental Money Purchase Pension Plan, incorporated by reference to Exhibit 10.9 to HMEC's Annual Report on Form 10-K for the year ended December 31, 2008, filed with the SEC on March 2, 2009.
10.7* Summary of HMEC Non-employee Director Compensation, incorporated by reference to Exhibit 10.7 to HMEC's Quarterly Report on Form 10-Q for the quarter ended June 30, 2020, filed with the SEC on August 7, 2020.
10.8* Summary of HMEC Named Executive Officer Annualized Salaries, incorporated by reference to Exhibit 10.8 to HMEC's Quarterly Report on Form 10-Q for the quarter ended June 30, 2020, filed with the SEC on August 7, 2020.
10.9* Form of Severance Agreement between HMEC, Horace Mann Service Corporation ("HMSC") and certain officers of HMEC and/or HMSC, incorporated by reference to Exhibit 10.13 to HMEC's Annual Report on Form 10-K for the year ended December 31, 2012, filed with the SEC on February 28, 2013.
10.10* HMSC Executive Change in Control Plan, incorporated by reference to Exhibit 10.15 to HMEC's Current Report on Form 8-K dated February 15, 2012, filed with the SEC on February 22, 2012.
10.10(a)* HMSC Executive Change in Control Plan Schedule A Plan Participants, incorporated by reference to Exhibit 10.10(a) to HMEC's Quarterly Report on Form 10-Q for the quarter ended June 30, 2020, filed with the SEC on August 7, 2020.
10.11* HMSC Executive Severance Plan, incorporated by reference to Exhibit 10.16 to HMEC's Current Report on Form 8-K dated March 7, 2012, filed with the SEC on March 13, 2012.
10.11(a)* First Amendment to the HMSC Executive Severance Plan, incorporated by reference to Exhibit 10.16(a) to HMEC's Quarterly Report on Form 10-Q for the quarter ended June 30, 2012, filed with the SEC on August 9, 2012.
10.11(b)* HMSC Executive Severance Plan Schedule A Participants, incorporated by reference to Exhibit 10.11(b) to HMEC's Quarterly Report on Form 10-Q for the quarter ended June 30, 2020, filed with the SEC on August 7, 2020.
10.12 Stock Purchase Agreement Among Horace Mann Educators Corporation, and Robert Paglione, Paglione Family Irrevocable Trust F/B/O Adam Paglione, Paglione Family Irrevocable Trust F/B/O Lisa and Jorge Arroyo, Beau Adams and Benefit Consultants Group, Inc. dated as of October 30, 2018, incorporated by reference to Exhibit 10.12 to HMEC's Annual Report on Form 10-K for the year ended December 31, 2018, filed with the SEC on March 1, 2019.
152 Annual Report on Form 10-K Horace Mann Educators Corporation

10.13 Purchase Agreement By and Among Ellard Family Holdings, Inc., Brian M. Ellard, The JCE Exempt Trust and Horace Mann Educators Corporation dated as of December 10, 2018, incorporated by reference to Exhibit 10.13 to HMEC's Annual Report on Form 10-K for the year ended December 31, 2018, filed with the SEC on March 1, 2019.
10.14 Executive Transition Agreement between HMSC and Wade A. Rugenstein as of December 5, 2018, incorporated by reference to Exhibit 10.14 to HMEC's Annual Report on Form 10-K for the year ended December 31, 2019, filed with the SEC on March 2, 2020.
(11) Statement regarding computation of per share earnings.
(21) Subsidiaries of HMEC.
(23) Consent of KPMG LLP.
(31) Certification pursuant to Section 302 of the Sarbanes-Oxley Act of 2002:
31.1 Certification by Marita Zuraitis, Chief Executive Officer of HMEC.
31.2 Certification by Bret A. Conklin, Chief Financial Officer of HMEC.
(32) Certification pursuant to Section 906 of the Sarbanes-Oxley Act of 2002:
32.1 Certification by Marita Zuraitis, Chief Executive Officer of HMEC.
32.2 Certification by Bret A. Conklin, Chief Financial Officer of HMEC.
(99) Additional exhibits:
99.1 Glossary of Selected Terms.
(101) Interactive Data File:
101.1 The following information from Horace Mann Educators Corporation’s Annual Report on Form 10-K for the year ended December 31, 2020 formatted in Inline XBRL: (i) Consolidated Balance Sheets at December 31, 2020 and 2019 (ii) Consolidated Statements of Operations for the years ended December 31, 2020, 2019 and 2018; (iii) Consolidated Statements of Comprehensive Income (Loss) for the years ended December 31, 2020, 2019 and 2018; (iv) Consolidated Statements of Changes in Shareholders' Equity for the years ended December 31, 2020, 2019 and 2018; (v) Consolidated Statements of Cash Flows for the years ended December 31, 2020, 2019 and 2018; (vi) Notes to Consolidated Financial Statements; (vii) Financial Statement Schedules; and (viii) the cover page.
104.1 Cover Page Interactive Data File (Embedded within the Inline XBRL document and included in Exhibit 101.1).
ITEM 16. I Form 10-K Summary
None.
Horace Mann Educators Corporation Annual Report on Form 10-K 153

SIGNATURES
Pursuant to the requirements of Section 13 or 15(d) of the Securities Exchange Act of 1934, Horace Mann Educators Corporation has duly caused this report to be signed on its behalf by the undersigned, thereunto duly authorized.
HORACE MANN EDUCATORS CORPORATION
By: /s/ Marita Zuraitis President and Chief Executive Officer February 26, 2021Marita Zuraitis
Pursuant to the requirements of the Securities Exchange Act of 1934, this report has been signed below by the following persons on behalf of Horace Mann Educators Corporation and in the capacities and on the date indicated.
Signature Title Date
By: /s/ Marita Zuraitis President, Chief Executive Officer and Director February 26, 2021Marita Zuraitis (Principal Executive Officer)
By: /s/ Bret A. Conklin Executive Vice President and Chief Financial Officer February 26, 2021Bret A. Conklin (Principal Financial Officer)
By: /s/ Kimberly A. Johnson Senior Vice President and Controller February 26, 2021
Kimberly A. Johnson (Principal Accounting Officer)
By: /s/ H. Wade Reece Chairman of the Board of Directors February 26, 2021H. Wade Reece
By: /s/ Mark S. Casady Director February 26, 2021Mark S. Casady
By: /s/ Daniel A. Domenech Director February 26, 2021Daniel A. Domenech
By: /s/ Perry G. Hines Director February 26, 2021Perry G. Hines
By: /s/ Mark E. Konen Director February 26, 2021Mark E. Konen
By: /s/ Beverley J. McClure Director February 26, 2021Beverley J. McClure
By: /s/ Robert Stricker Director February 26, 2021Robert Stricker
By: /s/ Steven O. Swyers Director February 26, 2021Steven O. Swyers
154 Annual Report on Form 10-K Horace Mann Educators Corporation

AsofDecember31,2019
Directors
H. Wade Reece, ChairmanChairmanoftheBoard&ChiefExecutiveOfficer(retired)BB&TInsuranceServices,Inc.andBB&TInsuranceHoldings,Inc.
Marita ZuraitisPresident&ChiefExecutiveOfficerHoraceMannEducatorsCorporation
Mark S. CasadyChairman&CEO(retired)LPLFinancialHoldings,Inc.
Daniel A. DomenechExecutiveDirectorAASA,TheSchoolSuperintendentsAssociation
Perry G. Hines*SeniorVicePresident,ChiefMarketingandCommunicationsOfficer(retired)IrwinMortgageCorporation
Mark E. Konen*President,InsuranceandRetirementSolutions(retired)LincolnFinancialGroup
Beverley J. McClureSeniorVicePresident,EnterpriseOperations(retired)UnitedServicesAutomobileAssociation(USAA)
Robert StrickerSeniorVicePresident&Principal(retired)ShenkmanCapitalManagement,Inc.
Steven O. Swyers*ManagingPartner(retired)PricewaterhouseCoopersLLP
*MemberoftheAuditCommittee,eachanindependentdirector
Officers
Marita ZuraitisPresident&ChiefExecutiveOfficer
Bret A. ConklinExecutiveVicePresident&ChiefFinancialOfficer
Matthew P. SharpeExecutiveVicePresident,Distribution&BusinessStrategy
Wade A. RugensteinExecutiveVicePresident,Supplemental&Operations
Donald M. CarleyExecutiveVicePresident,GeneralCounsel,CorporateSecretaryandChiefComplianceOfficer
Mark R. DesroschersSeniorVicePresident,Property&Casualty&ChiefCorporateActuary
Kimberly A. JohnsonSeniorVicePresident&Controller
Jenny ThayerVicePresident&ChiefHumanResourcesOfficer
Mike WeckenbrockSeniorVicePresident,Retirement&Life
Corporate data
Corporate Office1HoraceMannPlazaSpringfield,IL62715-0001horacemann.com
Annual MeetingMay26,2021,9a.m.InformationonhowtoattendthevirtualAnnualMeetingwillbeincludedintheproxymaterials.AllshareholdersofrecordasofthecloseofbusinessonMarch30,2021willbesentaformalnoticeofthemeetingandproxymaterials.
Independent Registered Public Accounting FirmKPMGLLP200EastRandolphStreetChicago,IL60601
Common StockHMNStockistradedontheNYSE
Senior NotesHMNseniornotesaretradedintheopenmarket(HMN4.50)
Transfer AgentAmericanStockTransfer&TrustCompany,LLC620115thAvenueBrooklyn,NY11219
Additional InformationAdditionalfinancialdataonHMNanditssubsidiariesisincludedinForm10-KfiledwiththeSecuritiesandExchangeCommission.ElectroniccopiesofHMN’sSECfilingsareavailableonhoracemann.com.PrintedcopiesofSECfilingsareavailableuponwrittenrequestfrom:
InvestorRelationsHoraceMann1HoraceMannPlazaSpringfield,[email protected]

HA-C00390(Mar.21)