Digital in-line holographic microscopy - Resolution Optics Inc

Holographic evaluation of fiberoptics image transfer characteristics
Item Type text; Thesis-Reproduction (electronic)
Authors Remijan, Paul W. (Paul Walter), 1945-
Publisher The University of Arizona.
Rights Copyright © is held by the author. Digital access to this materialis made possible by the University Libraries, University of Arizona.Further transmission, reproduction or presentation (such aspublic display or performance) of protected items is prohibitedexcept with permission of the author.
Download date 31/05/2018 20:07:53
Link to Item http://hdl.handle.net/10150/347758

HOLOGRAPHIC EVALUATION OF FIBER OPTICS
IMAGE TRANSFER CHARACTERISTICS
by
Paul W. Remijan
A Thesis Submitted to the Faculty of the
. ■ • COMMITTEE ON OPTICAL .SCIENCES
In Partial Fulfillment of the Requirements For the Degree of
MASTER OF SCIENCE
In the Graduate College
THE UNIVERSITY OF ARIZONA
1971

STATEMENT BY AUTHOR
This thesis has been submitted in partial fulfillment of requirements for an advanced degree at The University of Arizona and is deposited in the University Library to be made available to borrowers under rules of the Library.
Brief quotations from this thesis are allowable without special permission, provided that accurate acknowledgment of source is made. Requests for permission for extended quotation from or reproduction of this manuscript in whole or in part may be granted by the head of the major department or the Dean of the Graduate College when in his judgment the proposed use of the material is in the interests of scholarship. In all other instances, however, permission must be obtained from the author.
SIGNED:
APPROVAL BY THESIS DIRECTOR
This thesis has been approved on the date shown below:
n-r\ROLAND V. SHACK
Professor of Optical SciencesDate

ACKNOWLEDGMENTS
The author would like to thank ITEK Corporation for the use of
their facilities in performing the experiment. To Dr. James Wyant of
ITEK Corporation goes much appreciation for his suggestions concerning
the design of critical components of the holographic system.
I would also like to thank Mosaic Fabrications, Division of
Bendix Corporation for donating the fiber optics faceplates used in theJ■experiment and for providing edge response data on these faceplates.
Finally, I would like to express my gratitude to Dr. Roland
Shack, my advisor, whose pertinent comments and penetrating critiques
were vital to the completion of this thesis.
iii

TABLE OF CONTENTS
■ Page
LIST OF. ILLUSTRATIONS . . . . . . . . . . . . . . . . . . . . . . . v
ABSTRACT . . . . . . . . . . . . . . . . . . . . . . . . . . . vi
I. INTRODUCTION . . . . . . . . ' 1
Conventional Methods of Fiber Optics Image Evaluation . . . 1Holographic Method of Fiber Optics Image Evaluation . . . . 3
II. THE HOLOGRAPHIC SYSTEM . . . . . . .’. . . . . . . . . . . . 5
• Production of Holograms . . . . . . . . . . . . . . . . . . . 6Input Hologram •. ... ■ 8Output Hologram................... '................... 9
Fraunhofer Diffraction Patterns And Their Measurement . . . 11Fraunhofer Diffraction Patterns From Input Holograms . 12Fraunhofer Diffraction Patterns From Output Holograms . 13Measurement of Statistical MTF V a l u e s........... . . . 16
III. EXPERIMENTAL RESULTS AND DISCUSSION . . . . . . . . . . . . . . . 20
Data From The E x p e r i m e n t ........................... 20Errors of The Experiment . . . .......... 28Physical Limitations ........... 29
IV. COMPARISON OF THE HOLOGRAPHIC METHOD WITH CONVENTIONALMETHODS OF FIBER OPTICS EVALUATION . . . . ................. . 3 1
. .. Static T e s t s ................. . . . . . . . . . . . . . 31.. Dynamic Tests . . . . . . . . . . . . , . . . . . . . . . 33
Statistical MTF .. . . . . . . . . . . . . . . . . . . . . . 34
REFERENCES . 35
' iv • ;

LIST OF ILLUSTRATIONS
Figure . Page
1. Fiber Optics Faceplate With 6 Micron C o r e s ................... . . 2
2. System For Producing Holograms . . . . . . . . . . . . . . . . . 6
3. Subject A . . . . ......... . . . . . . . . . . . . . . . . . 7
4. Comparison of Input And Output Holograms ................. . 1 0
5. Fraunhofer Diffraction System ........... .11
6. Fraunhofer Diffraction Pattern of An Input Hologram . . . . -. 14
7. Transform of Fiber Optics Array . . . . . . . . . . . . . . . 15
8. Fraunhofer Diffraction Pattern of An Output Hologram .......... 17
' 9. 'Cdmpafison of "FhcepTate Surfaces . . . . . . . . . . . . . . . 21
10. Ealing Bar Target . . . . . . ........... .. . . . . . . . . 22
11. Images of 10-100 Ip/mm Target With Faceplate P .......... 23
12. Images of 100-1000 Ip/mm Target With Faceplate P ..........24
13. Images of Target With Faceplate G ........... 25
. 14. Statistical M T F ............... 26
15. Fraunhofer Diffraction Pattern of Faceplate POutput H o l o g r a m ....................................... 27
16. . Edge Response Transfer Function versus Statistical MTF . . .. . 32
v
ABSTRACT
A fiber optics image-transferring element is non-isoplanatic
over a surface region containing only a few fundamental resolution ele
ments and no consistent or meaningful evaluation of a fiber optics image
can.be made by examining such a small non-isoplanatic region. It is■ - -. i . ■ -
proposed that a fiber optics image be considered as an ergodic statisti
cal ensemble where each member of the statistical ensemble is one out
put from.one faceplate. Ergodicity of the ensemble image allows the
necessary statistical information about the image to be obtained from
the measurement of the average properties of one output. With image
formation considered as a stochastic process, the fiber optics element
can be described by a statistical transfer function.
A holographic system is used to create an input sinusoidal ir-
radiance distribution. Subsequent holographic evaluation of the ampli
tude of the sinusoidal input object and the average amplitude of the .
sinusoidal output component results in the direct calculation of a
statistical MTF. The design and operation of such a holographic sys
tem is presented and an experiment which demonstrates the advantages of
the holographic measurement is discussed. -

CHAPTER I
- ' . INTRODUCTION
An image-transferring fiber optics element consists of an or
dered array of small individual "light pipes". The ordered array of
"light pipes" maintains the spatial relationship between light and dark
regions of an object at the input surface and thus produces an image at
the output surface. Image-transferring fiber optics elements and eval
uation of the images they produce are the topic of this paper.
The evaluation of the image-forming process for a linear, iso-
planatic optical element is quite adequately expressed by an optical
transfer function, and with some difficulty, optical transfer functions
and modulation transfer functions for lenses can be obtained experimen
tally. Fiber optics image evaluation requires special consideration,
because a fiber optics element is non-isoplanatic over a surface region
of only a few single fibers. The existence of discontinuous and incon- '
sistent spread functions over the grossly non-isoplanatic fiber optics
surface means that a meaningful, consistent transfer function cannot .
be calculated by usual methods..
: . Conventional Methods of Fiber Optics Image Evaluation
Conventional methods of investigating the fiber optics image
transfer process utilize the spread function and edge response as a
basis for a transfer function calculation. An examination of Fig. 1

2
Pig. 1 Fiber OpticsFaceplate With 6 Micron CCores
, ■ . . .■ : , reveals how an edge, line or point response will depend on the orien
tation and location of an edge, line or point object with respect to
fiber striations and surface discontinuities. A transfer function cal
culated for such an obviously non-isoplanatic region does not have a
clear meaning. ;
Holographic.Method of Fiber Optics Image Evaluation
Holographic testing of fiber optics faceplates and the calcula
tion of statistical MTF requires a statistical consideration of the
fiber optics image, formation process. Consider the "image" formed by a
faceplate to be a collection of outputs where each output is associated
with a particular faceplate of an ensemble.' Each element of the face
plate ensemble is assumed to be consistent in physical size, material
composition, fiber size and location-orientation with respect to the
input. The elements of the faceplate ensemble are assumed to be random
in properties such as array distortions, blemishes, dead single fibers
and cross-talk. Next, it is assumed that ,the stochastic image-forming
process is ergodie and it is necessary to measure the average proper
ties of only one output in order to determine the average properties
of the more general "image".
The first step of the holographic evaluation process applies a
continuous, spatially periodic, sinusoidal irradiance distribution to
the input surface of a fiber optics element. It is desirable to apply
the input to a large fraction of the surface area of the faceplate so
that the average properties of an experimental output will closely ap
proximate the average properties of one output of the "image" ensemble.

. The second step of the holographic process measures the average
amplitude of the sinusoidal component in one output. The amplitude of
the sinusoidal input is also measured in an identical manner. A com
parison of the average output amplitude to the input amplitude yields a
transfer factor. Using well known techniques it is possible to apply
a summation of sinusoidal irradiance distributions of various spatial
frequencies as an input and to measure a transfer factor for each sinu
soidal irradiance distribution. Each transfer factor is a value of a
meaningful, consistent, statistical MTF.

CHAPTER II
v THE HOLOGRAPHIC SYSTEM
The basic holographic system used to evaluate fiber optics im
age transfer is quite simple. First, a summation of sinusoidal irradi-
ance variations are applied to the entire input surface of the fiber
optics. A photographic plate is used to record the summation of sinu
soidal fringes at the input surface and the output surface of the fiber
optics, thus producing an input hologram and output hologram. Next,
the Fraunhofer diffraction patterns of each of the two holograms are
produced. The irradiances of the narrow sine2 light distributions in
the respective Fraunhofer diffraction patterns are directly related to
the amplitude of the sinusoidal irradiance variations that are recorded
on each hologram. Since the amplitudes' of the sinusoidal patterns on
the output hologram are those on the input hologram modified by the fi
ber optics element, a comparison of sine? irradiances in the respective
Fraunhofer patterns yields a fiber optics transfer factor for each of
the input sinusoidal intensity variations.
The proper operation of such a holographic system is dependent
upon very closely approximating a pure amplitude hologram which is
linear in amplitude transmission versus exposure.
5

- Production of Holograms
Fig. 2 shows the basic system for producing input and output
holograms. . • .
s-fl fz
Laser
j-*6ar— A
oSpatial Filter ,V
• kLi - Collimating Lens (fl.= 24 inches) L2 - Transform Lens (fl = 38 inches) Laser - Spectra Physics Model 120 Spatial Filter - Jodon Engineerings
# LPSF-100 .
f2
VL2
A -
C -
Subject (Twelve Lenses fl = -6mm)Fiber Optics Faceplate Photographic Plate ("AGFA 10E70)___________
Fig. 2 System For Producing Holograms
The output hologram is made by pressing a photographic plate
against the output surface of the fiber optics faceplate. The face
plate is then removed and the input hologram is made by placing the
photographic plate at the position of the fiber optics input surface.
To keep the development process problems under control, both the input
and output holograms are recorded on the same plate.
The subject in the above diagram is the heart of the system for
producing holograms. Twelve commercially available double concave lens-?
es of 8mm diameter and -6mm focal length were ground into rectangular
shapes of varying widths. The rectangular lenses- were mounted in a
specially machined holder. A photograph of the holder with lenses ap
pears in Fig. 3. Eleven of the lenses are covered with a neutral density

a. Side Facing Lj
b. Side Facing L2

.. ■ ' _ - ■ : § filter, N. D. = 3.0, on the side of the subject exposed to collimated
light from . One lens is left uncovered to produce a reference wave.
Collimated monochromatic light passes through the negative lenses and
appears to diverge from the focal points of the negative lenses < The
next lens Lg is located so that its front focal plane contains the vir
tual point sources formed 6 mm to the left of the twelve negative lenses.
On the other side of Lg, plane waves from each of the eleven virtual ob
ject points interfere with the reference plane wave producing an irradi-
ance distribution containing eleven distinct sinusoidal components.
The spatial frequencies' of these sinusoidal components are readily tab
ulated from geometrical considerations. The spatial frequency of the
pattern associated with each lens is
■ ■ a ' : • ■ :e. = --------— cycles/unit length , (1)1
with EC denoting the center-to-center spacing between the reference
lens and any of the other eleven negative lenses. The f/number of the
twelve negative lenses is kept small enough to allow a common region of
interference for all twelve lenses.
Input Hologram ;
A photographic plate placed in the input plane of the fiber op-
- tics records the summation of sinusoidal intensity variations created by
the subject A and transform lens Lg. Upon normal exposure and develop
ment, a photographic plate is"non-linear in amplitude transmission ver
sus exposure, but at low exposure and low modulation the desired linear-
ity of amplitude transmission versus exposure is obtained (Kozma 1966;

9
Goodman 1968, pp. 230-241). The use of a 'very thin 7 micron emulsion
also helps to reduce the possibility of having excess index variations
and surface irregularities which cause a phase hologram.
Output Hologram
A photographic plate placed in the output plane of the fiber
optics records the input irradiance distribution after modification
by the fiber optics. Unique properties of the fiber optics allow sat
isfactory production of the output hologram (Potter 1961). Basically,
light incident on fibers at a small angle emerges at the same small an
gle. This fact coupled with the use of a very thin 7 micron emulsion
allows the photographic plate to record the energy transmitted by each
fiber separately, with no overlapping.‘ Exposure time for the output
hologram is-approximately 10% to 20% longer than for the input hologram
because of transmission losses in the fiber optics faceplate. Fig. 4
is a series of three photographs showing an input hologram, output holo
gram, and fiber optics faceplate , all at the same magnification. A! ■
comparison of the second and third photographs shows the independent
energy transfer for each single fiber that causes the output hologram
to be a recording of "intensity spots".
Here it is appropriate to point out the significance of the "in
tensity spots" recorded at the fiber, optics output surface. Upon closer
examination each output "intensity spot" has a very high frequency spec
kle appearance due to coherence within a single fiber, but this has no
effect upon resolving the lower spatial frequency input used.in the
experiment. With low. angles of illumination and the use of a very thin

10
: i E F *a
• - wNr » •'» -
a. Input Hologram
b. Output Hologram
c. Fiber Optics Faceplate
Fig. 4 Comparison of Input And Output Holograms

11
emulsion, a complete spatial separation of individual "intensity spots"
is achieved. For a given input, an output hologram would show a spa
tially identical collection of non-overlapping "intensity spots" for
both coherent and incoherent illumination. This means that the evalu
ation of the fiber optics imaging process and the calculation of a
statistical transfer function is essentially the evaluation of an in
coherent statistical.transfer function. .
hologram and the input hologram are examined in the second part of the
holographic scheme.
Fraunhofer Diffraction Patterns And Their Measurement
The Fraunhofer diffraction patterns produced by the output
Square HologramAperture
ObservationPlane
I(>2>y2)
SpatialFilter
Laser
Fig. 5 Fraunhofer Diffraction System

' ■ " • 12
Apart from a quadratic phase factor the complex amplitude dis
tribution in the X 2 > plane is just the Fourier transform of the
transmission function TCx^y^^). The calculations of the Fraunhofer dif
fraction patterns are also independent of the quadratic phase factor of
the complex amplitude distribution, and again are just straightforward
Fourier transform calculations. Other unimportant constants are not
shown explicitly in the final.expressions for the Fraunhofer diffrac
tion patterns.
Fraunhofer Diffraction Patterns From Input Holograms
The transmission function for the input hologram is written as
11 'Tj (xi,yi) = [K + E-_miIcos(2ireix 1)] [rect(p-)rect(P*)] , (2)
' . i=l
£ is the width of a square pupil which limits the input irradiance dis
tribution and K is a background which is approximately 1000 times nu,
the amplitude of a sinusoidal transmission variation. Subscript I refers
to the input hologram. The Fraunhofer diffraction pattern for T^Cx^y-L)
■ is given by
• IICx2>y2) = K2J>4sinc2 C - 2-) sine2 (|p) +
■' ■ • n „4m- 2. 2 ---il— [sine2 (x2 ± e. Xf2)}] [sine2 (^^-)] . (3)i=l 4 Xf2 . Xf2
There is a very narrow two-dimensional sine2 function at the
origin plus very narrow two-dimensional sine2 functions centered at

■ • ' . .. 13 ±e^X£2; Due to the low modulation levels used to make the hologram, the
magnitude jzAK2 of the central sine2 function is at least four thousand
times Jlhn. 2/4. Fig. 6 is a photograph of a diffraction pattern from an. . iinput hologram. The important observation in Fig. 6 is the absence of
any measurable higher order harmonics, and the absence of any patterns
which would be caused by a phase modulation term in T (xj^jyj), (Goodman
1968> pp. 69-70).
Fraunhofer Diffraction Patterns From Output Holograms
• As shown in Fig. 1, the fiber optics array is basically a hexa
gonal array of single fibers with the diameters of the single fibers
very nearly equal to their center-to-center spacing. It is the hexa
gonal array of circular light pipes of- radius a, which modulates the
sinusoidal patterns at the input surface. The amplitude transmissionl ' ' . ■ ■
for the output hologram is indicated with a subscript 0, and given by
T0 (xi,yi) = {[HEX ARRAY] * [circle -p-]}
ii ; '{K + £ m.ncos (2tt£. Xj) ] [rect (^1-)rect (̂ J-) ] } . (4)
i=l 1U 1 - £ £
The transform of the fiber optics array is a hexagonal array
of delta functions multiplied by the circle function transform. Except
for the convolution term from the fiber optics array transform, the
Fraunhofer diffraction pattern from the output hologram has the same
form as I j > and is written as

14
X
Fig. 6 Fraunhofer Diffraction Pattern of An Input Hologram
15
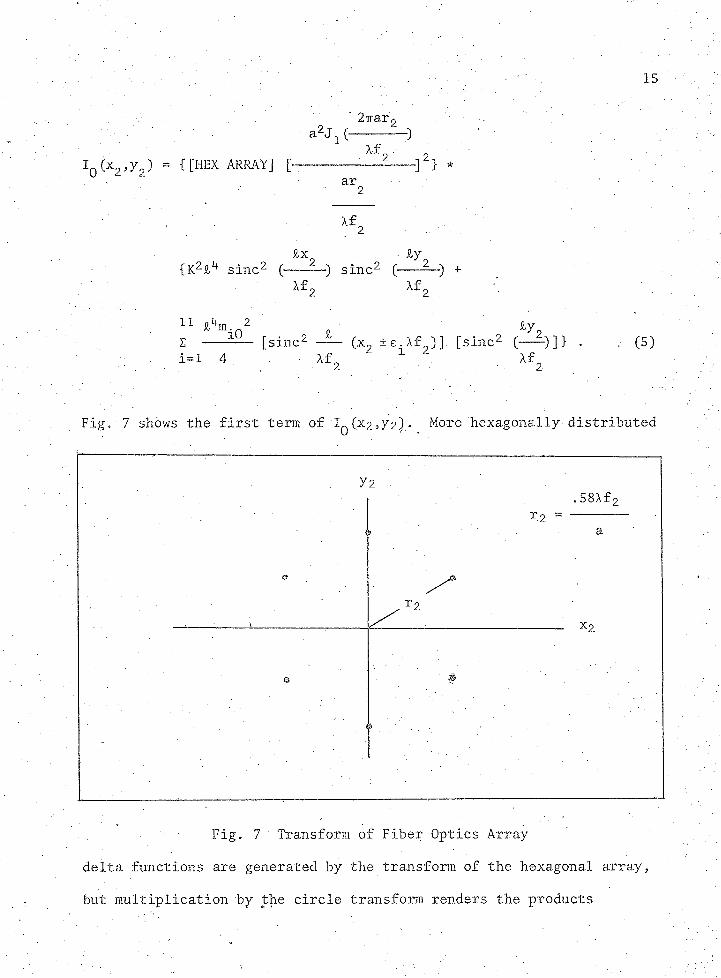
' 2trai\> a2Ji(_ _ _ £ _ )Xf2 2Ig (x2,y2) = { [HEX ARRAY] [— ----— -- ±--- ] } *
&x Hy{K2£tf sine2 (-----) sine2-(-----) +
Xf2 . xf2
11 2 ̂ &y2Z ------ [sine2 (x2 ± e. Xf )] [sine2 ( ) ] > . . (5)i=1 4 . ' > f2 . 1 Xf2
Fig. 7 shows the first term of 1^(x2,y2)> More hexagonally-distributed
y2. 58Xf
Fig. 7 ' Transform of Fiber Optics Array
delta functions are generated by the transform of the hexagonal array,
but multiplication by the circle transform renders the products

. :V •. . • , . - ; . is-.insignificant. Even the six outer dots shown in Fig. 7 are very weak
in comparison to the central irradiance because of the circle transform
cutoff at
.dixfp : r2 = _ _ _ _ _ . (6) a
The first term of has a dominant term at the origin
of the hexagonal array, while the second term of (X2 ,y2) has a domi
nant central intensity with much greater that y1+m^ 2/4 > With two
dominant terms at the origin, the convolution, Iq Cx^y^)» reduces to a
superposition of the function shown in Fig. 7 with a function of the
form of Fig. 6. Fig. 8 is a photograph of a Fraunhofer diffraction
pattern from an output hologram. As shown by the photograph, those
portions of the pattern associated with the hexagonal array are barely
visible and do not interfere with the narrow sine2 functions which are
associated with the sinusoidal amplitude transmission.variations of the
output hologram.
Further examination of Fig.. 8 reveals the absence of sine2 ir-
radiances ten and eleven. The input sinusoidal irradiance distributions
required to produce higher frequency sinusoidal amplitude transmissions
in the output hologram are not transmitted by the faceplate.
Measurement of ' Statistical MTF Values,
The most important features’of the Fraunhofer' diffraction pat
terns. produced by input and output holograms are the harrow sine2 irra-
diances caused by the sinusoidal amplitude transmission variations of

17
1
a F
Fig. 8 Fraunhofer Diffraction Pattern of An Output Hologram

"■ ' •• ; ;; , ' . : ̂ . 18 the' input and output holograms. Looking at the expressions for 1̂. (X2 ,y2)
and. Iq(X2 ,y2 )> Eqs. (3) and (5), the narrow sine2 irradiances of the
Fraunhofer diffraction patterns are proportional to nr j2 and nr q2, the
squared magnitude of the sinusoidal amplitude transmission variations.
The sine2 irradiances in the diffraction pattern from the input hologram
are measured with a PMT and the sinc2 irradiance corresponding"to the
lowest spatial frequency amplitude transmission variation of the input
hologram is normalized with 2/4 = 1.1 Similarly, the measured sine2
irradiances in the diffraction pattern caused by the sinusoidal ampli
tude transmission variations of the output hologram are normalized with
5,%!2̂ 2/4 = 1. The experimental statistical MTF values of the fiber op
tics faceplate are now just
!,\02normalized
4 . ■ ’normalized m._Statistical MTF Value = — ------------ :------= — . 1 (7)
--------------- — normalized m._il.
normalized4
The relative irradiance measurements were made by scanning a
Fraunhofer diffraction pattern with a PMT and slit on a transverse car
riage. The slit width was approximately equal to the width of the main
lobe of the sine2 functions. A slit length of approximately ten times
the width was chosen to allow for a non-critical vertical positioning
of the PMT slit assembly. The exact slit height was relatively

unimportant since the entire slit exposed to an area in between suc
cessive points revealed a signal-to-noise ratio of greater than one
hundred to one. .

CHAPTER III
EXPERIMENTAL RESULTS AND DISCUSSION
Generally speaking, the experiment produced repeatable statisti
cal MTF values.
Data From The Experiment
Two faceplates were tested with the holographic system. One
sample, faceplate G, was a good quality parallelepiped faceplate
3 cm x 2 cm x 0.5.cm. The other sample, faceplate P, was a poor qual
ity cylindrical faceplate with 1 cm radius and a length of 3 cm. Both
faceplates were constructed of the same type of glass and had N.A. =
1.00, 6y cores and approximately the same center-tp-center spacing be
tween single fibers.
Fig. 9- compares the surfaces of faceplate G and faceplate P.
Further examination of the two faceplates is accomplished with a high
contrast Ealing bar target which has three major groups of 1-10 Ip/mm,
10-100 Ip/mm and 100-1000 Ip/mm.’ Fig. 10.shows the high contrast Ealing
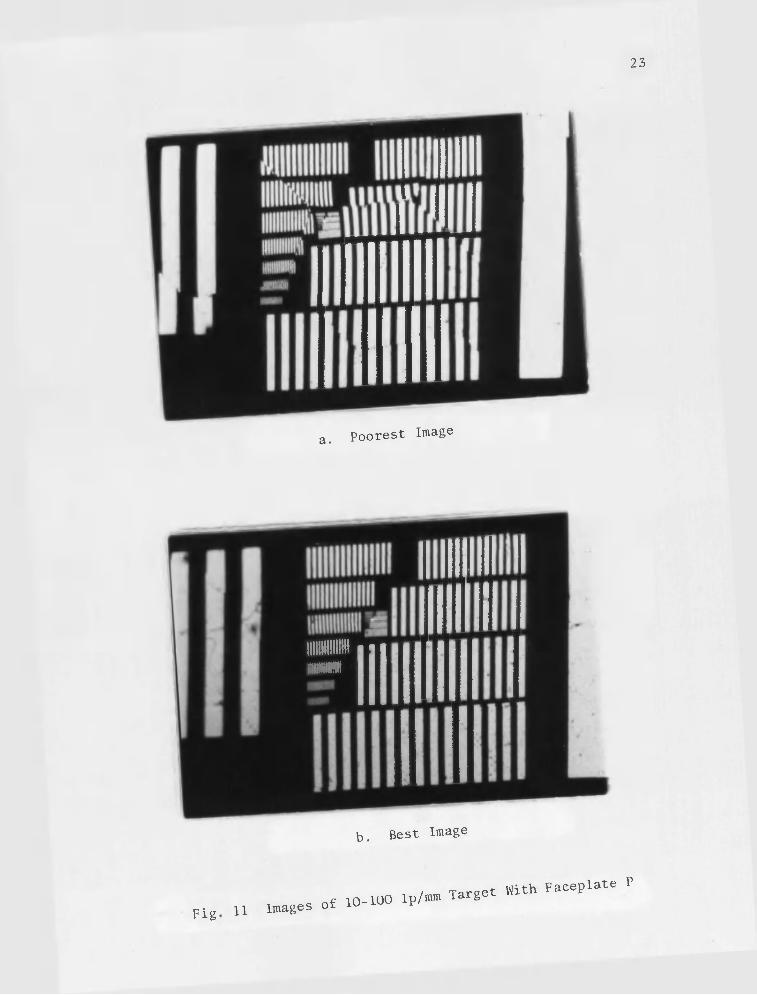
bar target, while Fig. 11 and Fig. 12 show how the performance of face
plate P depends upon its position with respect to the target. Fig. 13
shows that the good faceplate provides consistent performance except
for striation alignment with respect to «the resolution bars. It does
not suffer from large distortions between input and output surfaces.
Statistical MTF. values calculated from data obtained with the
- ' \ • 20 '

21
; ’ .
b. Faceplate P
Fig. 9 Comparison of Faceplate Surfaces

22
a. 10-100 Ip/mm
b . 100-1000 Ip/mm
Fig. 10 Ealing Bar Target
23
a. Poorest Image
iiiiif hi 1 1 1"III
b. Best Image
Figu Images of 10-100 Ip/- Target With Faceplate P
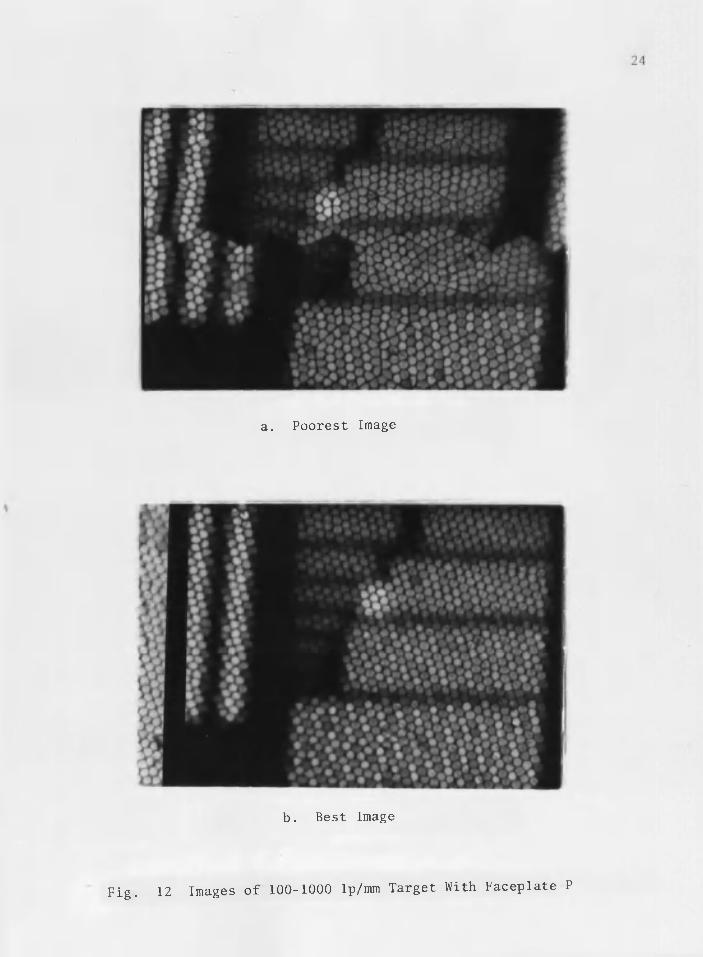
a. Poorest Image
b. Best Image
Fig. 12 Images of 100-1000 Ip/mm Target With Faceplate P
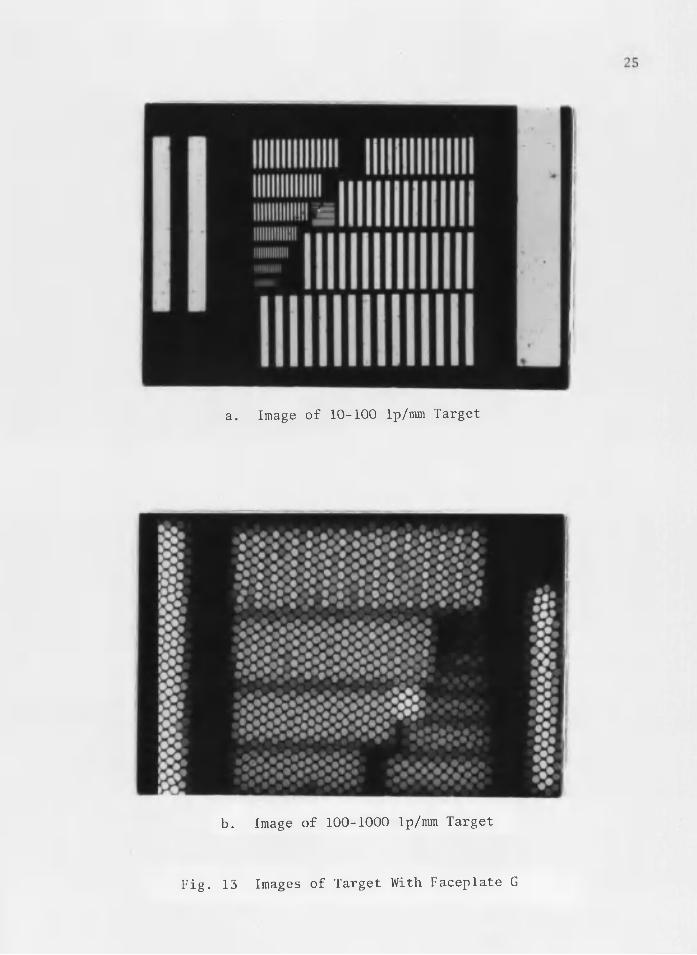
a. Image of 10-100 Ip/mm Target
b. Image of 100-1000 Ip/mm Target
Fig. 13 Images of Target With Faceplate G

26
holographic system are shown below in Fig. 14.
x Faceplate G o Faceplate P
1.
0.
0.
0.
0.
00 20 40 60 80 100 120 140 Ip/mm
Fig. 14 Statistical MTF
In addition to the statistical MTF, valuable qualitative infor
mation can be obtained from the Fraunhofer diffraction patterns. Fig.
15 shows the diffraction pattern from the poor faceplate output holo
gram. An inspection of the diffraction pattern shown in Fig. 15 re
veals the following features.

27
Fig. 15 Fraunhofer Diffraction Pattern of Faceplate P Output Hologram

; ' • . ; v • " ' • . 28
At a radius corresponding to a spatial frequency of about 20 Ip/mm, there is a hexagonal diffraction pattern corresponding to the
spatial frequency of smaller bundles within the faceplate. Hie face
plate suffers from poor packing of these smaller bundles.
, The six outer dots appearing at the radius corresponding to the
spatial frequency of the single fibers are "double dots". There is a
rotational distortion.of the single fiber arrays.
. The six outer dots are not all equidistant from the center, in
dicating that the individual fibers are not uniformly packed within the
bundles.
The sine2 irradiances to be measured go out to a region corres
ponding to a spatial frequency of approximately 66 Ip/mm and are rather
smeared. The lateral and rotational distortions, poor packing and pos
sibly dead or missing single fibers result in a poor statistical MTF
for the faceplate.
Errors of The Experiment
A comprehensive theoretical error analysis was not performed,
but. while components of the system were being designed for optimum per
formance, fifty statistical transfer functions for the same faceplate
. were generated and analyzed. Relative values of the statistical MTF
are repeatable to within ± 1%, but a second error factor due to normal
ization at 1.00 Ip/mm is a bit more difficult to analyze since it de
pends upon whether a good or poor faceplate is being used. A poor
faceplate will show a drop of less than .01 at 1 Ip/mm. Therefore, if
a poor faceplate is tested and the statistical MTF normalized to 1.00

: • . ‘ ■ 7 - 29
at. 1 Ip/iran, the absolute error is within +-,06. The corresponding
error for. a good faceplate is about + .02.
- Physical Limitations
The first problem is associated with normalization of the sta
tistical MTF at a spatial frequency which is not zero. With fiber op
tics it is not correct to assume an approximate statistical MTF value
of 1.00 at spatial frequencies of 2-4 Ip/mm, so the problem reduces to
the construction of a holographic subject to produce an input irradi-
ahce of the lowest possible spatial frequency.with the least amount of 7
noise in the center of the Fraunhofer diffraction pattern.. - . . . - '
Decreasing Si, the center-to-^center spacing between the refer
ence lens and lens #1 of the holographic subject, and increasing the
focal, length of Lg, the transform lens, lowers the spatial frequency
associated with the first sine2 irradiance in a diffraction pattern (see
Fig. 2). The minimum useful value of S% is governed by noise at the
center of the measured Fraunhofer diffraction patterns. With Si very
small, it also becomes much more difficult to build the holographic
subject and have the cone of light from the reference lens intersect
the cones of light from all of the other eleven lenses. The limitation
on increasing the focal length of the transform lens involves an in
crease in f/number of the system and a reduction of illumination at the
hologram plane to such a low level that exposure times for producing
the holograms becomes excessively high. Nevertheless, the problems as
sociated with the production of a low spatial frequency sinusoidal ir
radiance distribution at the fiber optics input plane are manageable
and the following technique is effective. 1 .

. . ; • . ■ 30
. As much as 50% of the noise near the first sine2 irradiance of
the Fraunhofer diffraction pattern is removed by situating a square
aperture at an angle of 45° with respect to the axis of the sinusoidal
patterns recorded on the holograms. This causes the larger secondary
irradiances of the sine distribution centered at the origin of the
diffraction pattern to lie along a line 45° away from the line of nar
row sine2 irradiances that are measured. As an example of this tech
nique , Fig. 11 is a diffraction pattern made with a circular aperture,
while Fig. 6 and Fig. 8 are diffraction patterns made with a rotated-i '- square aperture.

CHAPTER IV
COMPARISON OF THE HOLOGRAPHIC METHOD WITH CONVENTIONAL METHODS . OF FIBER OPTICS EVALUATION
Conventional methods used to evaluate fiber optics are classi
fied as either sfatic or dynamic tests. In the static tests an input
irradiance distribution is applied at the fiber optics input surface
and transferred to the output surface where the image appears. The fi
ber optics element does; not move with respect to the- input irradiance
distribution. In the dynamic test the fiber optics element is moved
rapidly in all directions allowing each fiber to cover uniformly an in
put plane area which has the dimensions of a few fiber diameters. The
image is recorded as a time, average. Integrated irradiance distribution
where the time duration for recording the image is chosen to enable the
scanning motion to cover uniformly the small input plane area.
Static Tests
Some quantitative tests of static fiber optics elements resort
to the evaluation of line spread functions and edge responses while less
quantitative static tests involve an examination of resolution target
images. These static evaluations include the calculation of transfer
functions from edge response and line spread data, but for a single .
faceplate these transfer functions are found to vary wildly depending
upon how the object is located with respect to fiber striations

(Yanagi and Jeskie 1969). Certainly, wildly varying results are ex
pected since the transfer functions are calculated from response data
secured in a small non-isoplanatic region. All of the conventional
quantitative tests of fiber optics suffer from the general problem of
looking at a small number of single fibers (Kapany 1967, pp. 397-410).
The faceplates G and P used in the holographic testing system
were subjected to an edge response test at Mosaic Fabrications, Divi
sion of Bendix Corporation. From edge response data, a static transfer
function was generated for each faceplate and compared to the holo
graphically determined statistical MTF as shown in Fig. 16.
1.0x Faceplate G o Faceplate P — Statistical MTF — Edge Response Transfer
Function
j 1------------- 1------------ 1-------------1_______ 1 - 1 . . . I i I i
0 20 40 60 80 100 120 140 Ip/mm
Fig. 16 Edge Response Transfer Function versus
Statistical MTF

The edge response transfer function indicates that both face
plates are of very high quality. In fact, faceplate P shows a higher
edge response transfer function than faceplate G, while the statistical
MTF of faceplate.P clearly shows its poorer performance. The failure
of the edge response test is explained by the concept of testing a
small non-isoplanatic region of the faceplate.
Dynamic Tests
The time-average integrated,image obtained with a dynamic test
of a fiber optics element does not show the honeycomb structure of the
output surface (Kapany 1967, pp. 88-100). A good dynamic scan allows
each resolution element to cover uniformly a small input plane area the
size of a few resolution elements and thus removes' the inherent non-
isoplanatic property of the fiber optics surface in this small area.
An average spread function can be recorded for this isoplanatic region
and the maximum theoretical MTF of a small isoplanatic region created
by dynamic scanning is just
MTF (c) = 2-----I— )— , (8)ired
where d i.s the fiber .diameter (Yanagi and Jeskie 1969; Drougard 1964).
The'dynamic test and associated dynamic MTF are theoretically accept
able, because of t6e existence of a small isoplanatic. .region but the
dynamic test does not correctly relate the performance of the whole
fiber optics element. Large scale distortions in the fiber optics

■ ' ' ■ . • V ■ ■ 34
such as those caused by poor packing of the smaller bundles or a poor '
pressing operation do not affect the dynamic MTF.
Statistical MTF. .The statistical MTF is a measure of the average performance of
a fiber optics, element over a large portion of its surface. With the
evaluation of a stochastic"image the non-isoplanatic property of the
fiber optics disappears: and the statistical MTF is a consistent and
meaningful function which, can be used to evaluate the performance of a
given faceplate. The statistical MTF measured experimentally by holo
graphic techniques is sensitive to. factors such, as fiber size, fiber
spacing, cross, talk, and distortions between input and output surfaces.
If a particular fiber optics element has a good statistical MTF then it
is, without question, a good image transferring element. On the other '
hand, if a faceplate exhibits a poor statistical MTF, an examination of
the diffraction pattern from the output hologram can yield information
as: to what is wrong with the particular element. Since the statistical
MTF is repeatable, sensitive to most fiber optics imperfections, and
relates the average performance of the entire fiber optics element, it
is an attractive method of evaluating the image forming capability of
a fiber optics element.

REFERENCES
Bracewell, Ron. The Fourier Transform and Its Applications. New York: McGraw Hill Book Company, 1965, pp. 381.
Drougard, Renee. "Optical Transfer Properties of Fiber Bundles,"J.O.S.A., Vol. 54, Number 7, July 1964, pp. 907-914.
Goodman, Joseph W. Introduction to Fourier Optics. San Francisco:McGraw Hill Book Company, 1968, pp. 287.
Kapany, N. S. Fiber Optics. New York: Academic Press, Inc., 1967,pp. 429.
Kozma, Adam. "Photographic Recording of Spatially Modulated Coherent Light," J.O.S.A., Vol. 56, Number 4, April 1966, pp. 428-432.
Potter, Robert J . "Transmission Properties of Optical Fibers," J.C.S.A., Vol. 51, Number 10, October 1961, pp. 1079-1089.
Smith, Howard M. Principles of Holography. New York: Wiley-Interscience,1969, pp. 239.
Yanagi, John, and Jeskie, Francis. "Applications of Fiber Optics," SPIE Journal, Vol. 7, September 1969, pp. 165-167.
35