HIV & AIDS/media/phi-reports/pdf/2015_12...HIV & AIDS in Greater Manchester 2014 Jane Harris Ann...
68
HIV & AIDS In Greater Manchester 2014 Jane Harris, Ann Lincoln, Mark Whitfield, Jim McVeigh Centre for Public Health Faculty of Education, Health and Community Liverpool John Moores University 2nd Floor Henry Cotton Campus 15-21 Webster Street Liverpool L3 2ET
Transcript of HIV & AIDS/media/phi-reports/pdf/2015_12...HIV & AIDS in Greater Manchester 2014 Jane Harris Ann...

HIV & AIDS In Greater Manchester 2014
Jane Harris, Ann Lincoln, Mark Whitfield, Jim McVeigh Centre for Public HealthFaculty of Education, Health and CommunityLiverpool John Moores University2nd Floor Henry Cotton Campus15-21 Webster StreetLiverpoolL3 2ET

HIV & AIDS
in Greater Manchester 2014 Jane Harris Ann Lincoln Mark Whitfield Jim McVeigh ©December 2015 Centre for Public Health Faculty of Education, Health & Community Liverpool John Moores University Henry Cotton Campus 15-21 Webster Street Liverpool L3 2ET Tel: +44(0)151 231 4506 Fax: +44(0)151 231 4552 Email: [email protected] Twitter : @cphsexualhealth Web: www.cph.org.uk/sexualhealth
Cover design: Laura Heeks
1
Executive Summary In 2014, 4,922 HIV positive Greater Manchester residents
accessed treatment and care from statutory treatment
centres in Greater Manchester, Cumbria, Lancashire and
Liverpool representing a 5% increase on the number reported
in 2013 (4,682 individuals). Overall prevalence in Greater
Manchester has also increased to 278 per 100,000 population.
Two local authorities in Greater Manchester (Manchester and
Salford) have an adult prevalence of over 2 per 1,000
population; the threshold at which the British HIV Association
recommend routine testing for all medical admissions and
new GP registrants.[1]
There were 531 new cases reported in 2014, representing a
13% increase from 2013 (468 new cases) and continuing the
fluctuating trend seen in recent years. New cases were classed
as people who were new to the database in 2014, were not
seen at a reporting statutory treatment centre in the north
west of England since 1994 and included transfers from
elsewhere in the country.
This is the nineteenth annual report of the North West HIV/
AIDS Monitoring Unit, presenting data on HIV positive
individuals accessing treatment and care in Greater
Manchester. A total of 26 statutory centres provided
treatment and care for HIV positive individuals. Information is
provided by local authority (LA) and treatment centre. Due to
limited space, not all analyses by LA can be included.
However, additional breakdowns can be found on the North
West HIV and AIDS Monitoring Unit website
(http://www.cph.org.uk/hiv/).
New cases represented 11% of all cases; a similar proportion
to that seen in 2013 (10%). The dominant mode of HIV
exposure is sex between men (MSM) at 57% of new cases,
followed by heterosexual sex representing 37% of new cases
(tables 2.1 and 2.2). The number infected through other
routes (injecting drug use, blood tissue and mother to child)
remained relatively low. The largest proportion of HIV positive
individuals presenting for care whose stage was known were
categorised as asymptomatic (41%). However, three of four
deaths among new cases in 2014 were due to an AIDS-related
illness and 23% of new cases whose stage was known were
diagnosed with AIDS by the end of 2014. This emphasises the
need to ensure that HIV positive individuals seek treatment at
an early stage of their disease so as to maximise the
effectiveness of treatment and improve prognosis.
Sex between men (MSM) continues to be the predominant
mode of exposure (52%) for all Greater Manchester residents
who access treatment. The proportion of people infected
through heterosexual sex has increased over the past 17
years, from 13% in 1996 to 42% in 2014.
The global HIV situation continues to influence Greater
Manchester with over one third (38%) of all HIV cases exposed
abroad and the majority of these cases (75%) contracted in
sub-Saharan Africa (figure 3.1 and table 3.8). A further seven
percent were infected in South and South-East Asia and the
same proportion were infected in Western Europe (7%). Of
those infected in Western Europe, the largest proportion
(29%) were infected in Spain. The majority (82%) of individuals
infected abroad were infected through heterosexual sex, with
the vast majority of these infected in sub-Saharan Africa
(85%). Amongst new cases, 32% were reported to have been
infected abroad, with 16% of these cases contracted in
Zimbabwe.
Amongst those for whom ethnicity was known, 60% of cases
presenting for treatment and care in 2014 were of white
ethnicity. Those from black and minority ethnic groups (BME)
made up 40% of HIV positive individuals accessing treatment
and care; a substantial over representation compared to the
proportion of BME groups in the Greater Manchester
population as a whole (16%). The characteristics of HIV
positive individuals from BME groups, especially those from
black African backgrounds, are distinctly different from those
from the white population. Those from BME groups are
younger, more likely to have been infected through
heterosexual sex and more likely to be female (tables 2.1, 3.1
and 3.7). Among new cases, 67% of those infected through
heterosexual sex were from BME/mixed background (table
2.1).
This report includes information on the residency status of
those in treatment and care for HIV in the north west of
England (table 2.9 and table 3.13). This level of information is
not routinely collected at a national level, notwithstanding
concern over the health of vulnerable population groups such
as asylum seekers. The number of individuals classed as non-
UK nationals represented 15% of all cases. Nearly two fifths of
non-UK nationals were classified as asylum seekers (38%) and
over three fifths (63%) were female. Two fifths (40%) of non-
UK nationals whose stage was known were asymptomatic
compared with 42% of UK nationals.
During 2014, the largest proportion of individuals accessing
treatment and care were using triple antiretroviral therapy
(ART; 57%). Amongst those who were asymptomatic, 81%
were using ART (table 3.6). During 2014, asymptomatic HIV
positive individuals accumulated 5,151 outpatient visits; an
average of 4.2 per person. People who died of an AIDS related

2
cause in 2014 had the highest mean number of outpatient
visits (5.8) and spent the greatest mean number of days as
inpatients (19.6 days; table 3.12).
During 2014, 2,537 HIV positive individuals were reported to
the North West HIV/AIDS Monitoring Unit by six community
sector organisations. The overall number of individuals seen
was 1% higher than in 2013. Of those accessing community
sector organisations in 2014, 44% did not attend a statutory
service during the same year and 26% had never been seen by
the statutory sector (table 4.3). This illustrates the continuing
contribution of community sector organisations to the care of
HIV positive individuals for whom these organisations may be
the sole provider of care. This has particular significance for
regional funding of HIV services, since individuals exclusively
accessing community sector organisations are not included in
national statistics, which determine the distribution of funds
for the care of HIV positive people.
In 2014, five social service departments in the north west of
England were able to contribute information on 122 HIV
positive individuals. The majority of individuals with HIV seen
by social service departments also accessed statutory sector
services in 2013 (table 5.1).
Information on trends for new and all cases of HIV in Greater
Manchester from 2000 to 2013 are presented in chapter 6 and
give an overall view of the changing pattern of HIV in Greater
Manchester.
It is hoped that the tables and figures presented in this report,
and the extra analysis available on the website
(http://www.cph.org.uk/hiv/) provide the relevant Greater
Manchester HIV/AIDS information needed. In recognition of
the evolving and dynamic nature of HIV, any comments and
suggestions for improving the usefulness of this report in
future years are welcomed.
Acknowledgements
We are extremely grateful to all the staff in the treatment
centres, community sector organisations and social services
who spend considerable time gathering the data for this
report. Without their hard work, this report would not be
possible.
In addition we would like to extend our thanks to the service
providers and commissioners who prepared the case studies
in this report, in particular; Sarah Lennox and Roberto
Vivancos
Thanks are also due to staff in the Centre for Public Health,
Liverpool John Moores University, in particular to Petra
Collins, Kevin Cuddy and James Marrin for assistance with
proofreading; Laura Heeks for cover design; Howard Reed for
his technical assistance and to Dave Seddon, Jen Lovelady and
Emma Todd for their ongoing support.
We would also like to acknowledge the continued support of
Kirsty Haines, Wendy Alam and Paul Hussey (Greater
Manchester Public Health Network) and Kathy Chandler and
Roberto Vivancos (Public Health England Regional
Epidemiology Unit).

3
Contents
Executive Summary.............................................................................................................................................. 1 Acknowledgements ............................................................................................................................................. 2 Figures and Tables ............................................................................................................................................... 4
1. Introduction .................................................................................................................................................. 6
Global Perspectives on HIV and AIDS[19] ........................................................................................................................ 6 HIV and AIDS in the United Kingdom ............................................................................................................................ 7
Men who have sex with men ..................................................................................................................................... 7 Heterosexual sex ...................................................................................................................................................... 11 Injecting drug use .................................................................................................................................................... 11 Blood or tissue ......................................................................................................................................................... 14 Mother to child ........................................................................................................................................................ 14 HIV in non-UK nationals ........................................................................................................................................... 15 Testing for HIV ......................................................................................................................................................... 16 New developments in treatment and prevention .................................................................................................... 16
HIV and AIDS in Greater Manchester, 2014 ................................................................................................................ 17 Sexual health in the north west of England ............................................................................................................. 18 Monitoring HIV and AIDS in the north west of England .......................................................................................... 18 Methodology of monitoring HIV and AIDS in the north west of England ................................................................ 18
2. New Cases 2014 ............................................................................................................................................. 21 Case Study: Late Diagnosis in Greater Manchester ........................................................................................... 24
3. All Cases 2014 ................................................................................................................................................ 31 4. Community Sector 2014 ................................................................................................................................. 42 Case Study: Banardo’s client story ................................................................................................................... 47 5. Social Care Providers 2014 .............................................................................................................................. 48 6. HIV Trends ..................................................................................................................................................... 50
Glossary of Service Providers.............................................................................................................................. 54 List of Abbreviations .......................................................................................................................................... 57 References ......................................................................................................................................................... 58

4
Figures and Tables
1. Introduction
Box 1: Ten Targets: UNAIDS Outcome Framework, 2011 – 2015 .................................................................................. 7 Table 1.1: Cumulative number of HIV diagnoses in the North West of England and the UK by infection route to December
2013 .................................................................................................................................................................... 9 Figure 1.1: Number of new HIV diagnoses in the north west of England and the UK, by year of diagnosis to December 2013
.......................................................................................................................................................................... 10 Figure 1.2: Infection route of HIV cases in the UK, by year of diagnosis to December 2013 ........................................... 10 Figure 1.3: Number of heterosexually acquired HIV cases in the UK by year of report to December 2011 ....................... 13 Figure 1.4: HIV prevalence amongst pregnant women in England, 2013 (newborn infant dried blood spots collected for
metabolic screening) ............................................................................................................................................ 13 Figure 1.5: Uptake of HIV testing in north west England by sex and male sexual orientation, 2010 - 2014 ....................... 19 Figure 1.6: Total number of Greater Manchester HIV and AIDS cases seen in north west statutory treatment centres in,
1996-2013 .......................................................................................................................................................... 20
2. New cases
Figure 2.1: Global region and country of infection for new HIV and AIDS cases in Liverpool who probably acquired their
infection outside the UK, 2014 .............................................................................................................................. 25 Table 2.1: Age distribution, stage of HIV disease and ethnic group of new HIV and AIDS cases by infection route and sex, 2014 .................................................................................................................................................................. 26 Table 2.2: Local authority of residence of new HIV and AIDS cases by infection route, 2014 .......................................... 27 Table 2.3: Local authority of residence of new HIV and AIDS cases by stage of HIV disease, 2014 .................................. 27 Table 2.4: New HIV and AIDS cases by stage of HIV disease, infection route and sex, 2014............................................ 27 Table 2.5: New HIV and AIDS cases by age category and ethnic group, 2014 ............................................................... 28 Table 2.6: Sex, stage of HIV disease and HIV exposure abroad of new HIV and AIDS cases by ethnic group, 2014 ............ 28 Table 2.7: Global region of exposure by infection route for new HIV and AIDS cases, 2014 ........................................... 29 Table 2.8: Distribution of treatment for new HIV and AIDS cases by infection route, 2014 ............................................ 29 Table 2.9: Residency status of new cases by sex, age group, infection route, ethnicity, stage of HIV disease and area of residence, 2014 ................................................................................................................................................... 30
3. All cases
Figure 3.1: Global region and country of infection for all HIV and AIDS cases in the North West who probably acquired
their infection outside the UK, 2014 ....................................................................................................................... 33 Table 3.1: Age distribution, stage of HIV disease and ethnicity of all HIV and AIDS cases by infection route and sex 2014 . 35 Table 3.2: Local authority of residence of all HIV and AIDS cases by infection route, 2014 ............................................ 35 Table 3.3: Local authority of residence of all HIV and AIDS cases by stage of HIV disease, 2014 ..................................... 36 Table 3.4: All HIV and AIDS cases by infection route, sex, county of residence and ethnicity, 2014 ................................. 36 Table 3.5: Age group of all HIV and AIDS cases by ethnicity, 2014 .............................................................................. 37 Table 3.6: All HIV and AIDS cases by stage of HIV disease, level of antiretroviral therapy and county of residence, 2014 .. 37 Table 3.7: Ethnic distribution of all HIV and AIDS cases by sex, stage of HIV disease and exposure abroad, 2014 ............. 38 Table 3.8: Global region of HIV exposure by infection route of all HIV and AIDS cases, 2014 ......................................... 38 Table 3.9: Distribution of treatment for all HIV and AIDS cases by infection route, 2014 ............................................... 39 Table 3.10: Distribution of treatment for all HIV and AIDS cases by level of antiretroviral therapy, 2014 ........................ 39 Table 3.11: Local authority of residence of all HIV and AIDS cases by number of treatment centres attended, 2014 ........ 39 Table 3.12: Distribution of total and mean number of outpatient visits, day cases, inpatient episodes, inpatient days and
home visits by treatment centre and stage of HIV disease, 2014 ................................................................................ 40 Table 3.13: Residency status of all cases of HIV and AIDS by sex, age group, infection route, ethnicity, stage of HIV disease
and area of residence, 2014 .................................................................................................................................. 41

5
4. Community Services
Table 4.1: Attendance by HIV positive individuals at community sector organisation in the North West, by statutory sector
attendance, sex, age group, infection route, ethnicity, residency status and North West residency, 2014 ....................... 44 Table 4.2: Distribution of statutory treatment for HIV and AIDS cases presenting to community sector organisations, 2014
.......................................................................................................................................................................... 45 Table 4.3: HIV and AIDS cases presenting to the community and statutory sector by sex, infection route, ethnicity and
residency status, 2014 .......................................................................................................................................... 46
5. Social Services
Table 5.1: HIV and AIDS cases presenting to five social service departments by sex, infection route, residency status and
statutory sector attendance, 2014 ......................................................................................................................... 49 Table 5.2: Distribution of social service care for HIV and AIDS cases presenting to community organisations, 2014 ......... 49
6. Trends
Figure 6.1: Percentage change in new cases of HIV by selected infection route of HIV, 2000-2014 ................................. 52 Figure 6.2: Percentage change in total cases of HIV by level of antiretroviral therapy, 2000-2014 .................................. 52 Table 6.1: Number of new HIV and AIDS cases by infection route of HIV and county of residence, 2004-2013 ................. 53 Table 6.2: Total number of HIV and AIDS cases by level of antiretroviral therapy and county of residence, 2005 2014 ..... 53 Table 6.3: New cases of HIV and AIDS by local authority of residence, 2009-2014 ........................................................ 53 Table 6.4: All cases of HIV and AIDS by local authority of residence, 2009-2014 .......................................................... 53

6
1. Introduction Over the past nineteen years the North West HIV/AIDS
Monitoring Unit has collected, collated, analysed and
disseminated data on the treatment and care of HIV positive
individuals in the region[2-18]
. This report aims to provide a
comprehensive and timely summary of the epidemiology of
HIV in Greater Manchester. It begins with a global and
national overview before focussing on Greater Manchester. In
chapter 2, we present analyses of new HIV cases in Greater
Manchester and in chapter 3, analyses of all HIV cases
presenting for treatment and care across the two counties.
Information on the community sector (previously known in
these reports as voluntary agencies) and social care are
presented in chapters 4 and 5, followed by trend data in
chapter 6.
Due to limited space, not all analyses by local authority (LA)
can be included here. However, additional tables can be found
on the North West HIV Monitoring website:
http://www.cph.org.uk/hiv/.
Global Perspectives on HIV and AIDS*[19]
Globally, continuing new diagnoses of HIV combined with
reduced numbers of deaths, due to greater access to
antiretroviral therapy (ART), means there are now more
people than ever living with HIV. The proportion of individuals
living with HIV has stabilised in the past decade and the
number of new cases is declining. There were an estimated
36.9 [34.3 – 41.4]† million people infected with HIV globally at
the end of 2014 and there were 2.0 [1.9—2.2] million new HIV
infections, a 35% decrease since 2000. An estimated 220,000
[190,000 – 260,000] of these new infections were in children
aged under 15 years; a 58% decline since 2000. This decline in
new infections among children is mainly due to the expansion
of services to prevent mother to child transmission of HIV,
with many low and middle income countries approaching the
same transmission rates seen in high income countries. There
are an estimated 2.6 [2.4—2.8] million children aged under 15
years now living with HIV worldwide (around 88% live in sub-
Saharan Africa). In 2014 coverage of antiretroviral regimens
for pregnant women reached 73% [68-79%] and has reduced
new infections among children by 58% between 2000 - 2014.
* Unless otherwise stated, global data and information have been sourced from UNAIDS Report on the Global AIDS Epidemic 2014 and accompanying factsheets and data annexes. † Figures in brackets indicate the reported range in estimated incidence from UNAIDS.
Sub-Saharan Africa remains the epicentre of the HIV pandemic
with 25.8 [24.0 -28.7] million people living with HIV in the
region. New infections in the region have declined by 39%
since 2000, with 1.4 [1.2-1.5] million new infections in 2014.
There has been a 43% decline in new infections among
children in 21 priority countries since 2009. However, the
region still accounts for 70% of the global total of new
infections. In line with global trends the number of AIDS
related deaths in the region has also declined; there were
790,000 [690,000-1 million] deaths due to AIDS related causes
in 2014; a 48% decline on the number seen in 2005.
However, not all regions and countries conform to these
global trends. The Middle East and North Africa and Eastern
Europe and Central Asia have a growing HIV burden with rises
in both the number of new HIV infections and AIDS related
deaths in recent years. For example, in the Middle East and
North Africa there has been a 66% increase in AIDS related
deaths since 2005. In addition, across all global regions there
are certain groups who do not have equitable access to HIV
prevention, treatment and care due to marginalization,
poverty, harmful gender norms and social and legal
inequalities. In their 2014 Gap Report, UNAIDS identified 12
population groups who have been left behind by the global
AIDS response, namely: people who are living with HIV;
adolescent girls and young women; prisoners; migrants;
people who inject drugs; sex workers; gay men and men who
have sex with men (MSM); transgender people; children and
pregnant women living with HIV; displaced persons; people
with disabilities and, people aged 50 years and older. UNAIDS
highlight that these groups continue to be disproportionately
affected by HIV, for example HIV prevalence among female
sex workers is 13.5 times higher than in the general female
population and among the 12.7 million people who inject
drugs globally, 13% are living with HIV. Despite this, these
groups are frequently omitted from national AIDS strategies
and often face significant barriers to accessing HIV services.
The 2011-2015 Joint UN Strategy for HIV and AIDS calls for
zero discrimination to achieve coverage for the most
vulnerable groups[20]
.
In response to the progress achieved over the past decades,
UNAIDS developed an outcome framework for 2011-2015
with ten targets (box 1)[21, 22]
. While UNAIDS celebrate the
progress made in achieving these targets and those set out in
the Millennium Development Goals (MDGs)[23, 24]
, they also
recognise that these advances cannot merely be maintained
and that gaps in the global response still exist [25]. In
particular, prevention coverage for key population groups
including sex workers, people who inject drugs (PWIDs) and
children remain inadequate and access to biomedical
prevention tools such as voluntary circumcision and pre-

7
exposure prophylaxis (PrEP) need expansion. This progress
cannot be made without sustainable programmes which
address social and structural barriers to accessing services,
mobilise communities, foster collaboration across the
development sector and, most vitally, make an absolute
commitment to the protection of human rights. UNAIDS has
set new fast track targets which aim to build on the
achievements of the 2011 Outcome Framework and achieve
their 95-95-95 target by 2030 with: 95% of those living with
HIV knowing their HIV status; 95% of those living with
diagnosed HIV receiving sustained ART; and, 95% of those
receiving ART achieving viral suppression. The Fast Track
Targets also commit to reducing new infections to 200,000
and achieving zero discrimination[25]
.
Box 1: Ten Targets: UNAIDS Outcome Framework, 2011 –
2015
Since the development of the 2011-2015 UNAIDS outcome
framework, low and middle incomes have been driving
increasing investment in HIV and appear to be on track to
achieve the US$ 22-24 billion investment target set in the
outcome framework by the end of 2015. Globally an
estimated US$ 20.2 billion was available for HIV spending in
low and middle income countries by the end of 2014 and
domestic spending surpassed international assistance;
accounting for 57% of HIV expenditure. Eighty four out of 121
low and middle income countries increased their domestic
spending between 2009-2014 with 35 countries reporting an
increase of more than 100%. However, despite these
advances, UNAIDS call on the international community not to
abandon HIV investment; 44 countries looked for financial
assistance for more than 75% of their HIV spending in 2014
and for countries with a heavy burden of HIV and few
resources, increased domestic spending will not be sufficient
to close the HIV resource gap[19]
.
HIV and AIDS in the United Kingdom
New diagnoses of HIV, AIDS and deaths of HIV positive
individuals in the UK are reported to Public Health England
(PHE, formerly the Health Protection Agency) and Health
Protection Scotland, who compile the data into six-monthly
surveillance tables[26]
. The data presented in this section is
reported to the end of December 2013.
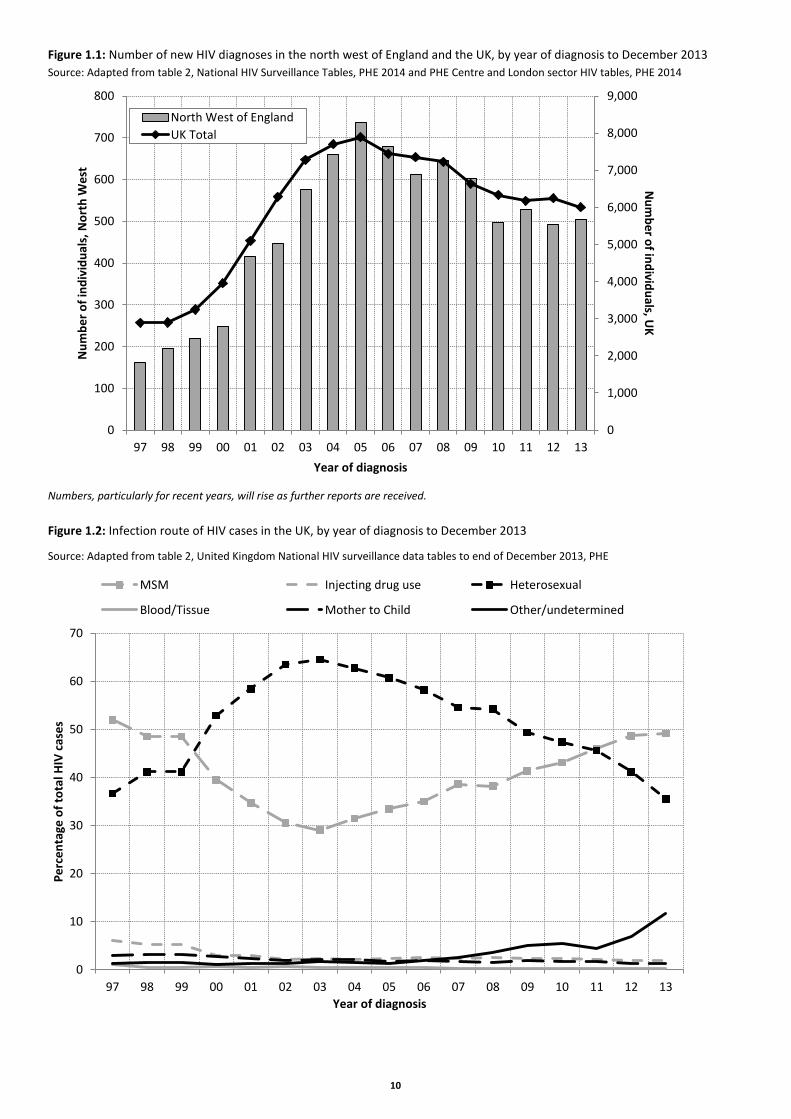
Public Health England (PHE) report the cumulative total of
reported new HIV infections for the UK reached 133,767 by
the end of 2013 (table 1.1). Of these, 6,000 were newly
diagnosed in 2013. Figures 1.1 and table 1.1 compare the
trend of new cases of HIV infection in the UK with those
specific to the north west of England[27]
. As with previous
years, close to half of all individuals newly diagnosed with HIV
reside in London (2,719 of 5,493 in England and of 6,000 in the
UK). Similarly, 45% of all individuals accessing treatment and
care for HIV reside in London (33,863 of 74,760 in England in
2013)[27]
. National policy will thus continue to be shaped by a
strong bias towards the needs of London and the South East,
with an under-representation of other regions[28-33]
. For the
epidemiology of HIV in Greater Manchester, see chapters 2
and 3 of this report, which are based on surveillance data of
treatment and care of HIV positive individuals in the region.
An additional tool for monitoring the HIV epidemic in the UK is
provided by the unlinked anonymous HIV seroprevalence
programme conducted by PHE and the Institute of Child
Health. Part of the programme involves the testing of blood
samples that have been taken for other purposes (for example
antenatal screening and syphilis serology) after having
irreversibly removed patient identifying details. This allows
estimations of the extent of undiagnosed HIV infection in high
risk groups as well as in the general population. The
monitoring programme has been operating throughout
England and Wales since 1990 and provides low cost
estimates of current HIV prevalence. Results of the
programme, combined with other PHE surveillance
programmes, suggest that by the end of 2013, there were an
estimated 107,800 [101,600 – 115,800] persons (diagnosed
and undiagnosed) living with HIV in the UK, of whom,
approximately one in four (24%, 26,100) were unaware of
their infection[34]
.
Men who have sex with men
PHE recorded a cumulative total of 59,728 estimated cases of
HIV (45% of all diagnoses)[35]
. The number of new diagnoses in
MSM continues to rise; reaching an all-time high of 3,250 in
2013. This represented a modest 1% increase on the number
seen in 2012. Newly diagnosed MSM in 2013 had a median
Reduce sexual transmission of HIV by 50%;
Reduce transmission of HIV amongst IDUs by 50%;
Eliminate new HIV infections among children and substantially reduce AIDS-related maternal deaths;
Reach 15 million receiving ART;
Reduce tuberculosis related deaths in those living with HIV by 50%;
Close the global AIDS resource gap and reach US$ 22-24 billion investment in low and middle income countries;
Eliminate gender inequalities and empower women and girls to protect themselves from HIV transmission;
Promote laws and policies that eliminate HIV-related
stigma and discrimination; Eliminate HIV related restrictions on entry, stay and
residency
Integrate and strengthen the global response to the AIDS pandemic and eliminate parallel systems.

8
age of 33 years with one in ten diagnosed aged 50 years or
over. However, the past decade has also seen an increase in
new diagnoses among younger MSM (aged 15-24 years) with
16% of MSM diagnoses among young men in 2013 compared
with 9% in 2004[34]
. In recent years, the shape of the UK
epidemic has changed; continuing the trend seen since 2011,
the number of new infections attributable to MSM surpassed
the number of heterosexual infections, representing 54% of
new infections in 2013 (figure 1.2).
The increase in new diagnoses seen in MSM may be explained
both by an increase in HIV testing amongst this group and on-
going high rates of transmission[36]
. The 1980s initially saw
substantial reductions in risky behaviours amongst MSM in
response to HIV/AIDS but by the end of the 1990s evidence
suggested that high risk sexual behaviour was increasing
among the MSM population. This is perhaps best illustrated by
Dougan et al.’s longitudinal study recruiting males in gyms in
London between 1998 and 2003, which found an increase in
the number of males reporting high-risk sexual behaviour with
a casual partner (from 6.7% to 16.1%). Dougan et al
recommended that sexual health promotion should target
high-risk practices with casual partners since these, and not
practices with steady partners, seemed to account for the
recent increase in high-risk behaviour[37]
. The levels of high
risk behaviour observed by Dougan et al appear to have been
maintained; a repeat cross-sectional survey of men attending
a London HIV clinic in 2000 and 2010 found that: while men in
the 2010 cohort were more likely to be on ART with an
undetectable viral load; levels of unprotected anal sex with a
boyfriend remained unchanged and levels of unprotected anal
sex with a casual partner has increased. One in five men
participating believed that being on ART with an undetectable
viral load eliminated the risk of onward transmission to a
sexual partner. Disclosure of HIV status and recreational drug
use were independently associated with casual unprotected
anal sex and men engaged in casual sex irrespective of their
viral load[38]
.
Findings from the National Survey of Sexual Attitudes and
Lifestyles found that relative to men who exclusively have sex
with women, MSM reported larger numbers of sexual
partners and were significantly more likely to report measures
of poor sexual and mental health including: treatment for
depression, health conditions which had a perceived effect on
their sexual activity, STI diagnoses and higher levels of
recreational drug use[39]
. Nationally, there are increasing
concerns about the impact of recreational drug use on the
transmission of HIV; studies have found high levels of lifetime
and recent recreational drug use among MSM[40, 41]
. Among
this cohort, drug use was found to be significantly associated
with non-adherence to ART and polydrug use was
independently associated with unprotected sex and
unprotected sex with HIV serodiscordant partners[41]
. There is
growing evidence that sexualised drug use, or Chemsex,
among MSM is significantly associated with higher sexual risk
taking behaviours[42]
The recent Chemsex Study published by
Sigma research found that a quarter of HIV positive MSM
surveyed had chosen to engage in UAI with men they
believed to be serodiscordant and while drug use influenced
the number of sexual partners, it was not the main driver for
this sexual risk taking. In addition, whilst knowledge of HIV
was high among the sample, around a third of HIV negative
men engaged in unprotected anal intercourse under the
influence of drugs and sometimes with a partner of unknown
HIV status[43]
.
The number of MSM testing for HIV in sexual health clinics
increased by 8% from 2012 (70,580) to 2013 (76,330);
however recent modelling by PHE suggests that HIV
transmission among MSM has also remained high[34]
. Late
diagnosis among MSM (34%) is considerably lower than
heterosexual men (65%) and women (57%)[36]
and there has
been a rise in the number new diagnoses which were recently
acquired (30% of new MSM diagnoses in 2013)[34]
. Recent
research suggests that expansion of HIV testing in MSM has
led to a decline in the mean-time to diagnosis; however,
neither HIV incidence or undiagnosed HIV infection have
changed despite this increase in testing and increased
antiretroviral uptake in MSM[44]
. A survey based study of MSM
in Glasgow in 2000 and 2010 found a significant increase in:
testing within the past 12 months (31%); and, in the perceived
benefits and normalisation of testing. However, other barriers
including fear of a positive result, HIV status of partner and
barriers relating to clinics remained unchanged between 2000
and 2010 with fear of a positive result remaining a key barrier
to testing[45]
. Further analysis from this study also suggests
that recent testing does not necessarily indicate risk, with
MSM who had tested recently and those who had tested
between six and 12 months reporting similar levels of
unprotected anal sex and knowledge of their partners’ HIV
status[46]
. A recent cross sectional study of London MSM found
HIV prevalence of 12.8% of which 34% were undiagnosed at
the time of the study; an estimated one in 20 MSM in the
study were identified as being at risk of HIV transmission due
to undiagnosed HIV and UAI without exclusive serosorting[47]
.
The most recently published Sigma Research Gay Men’s Sex
Survey was carried out in 2010 and was conducted in
partnership with health promotion organisations and websites
across the UK. Participating men were those who reported
having had sex with a man in the previous year and/or had a
non-heterosexual sexual identity. The survey found that 28%
of all males responding in England, and 36% of those in the
north west of England, had never been tested for HIV[48, 49]
.
The latest national survey found that living with diagnosed HIV
is most common amongst men in London and the north west
of England; men with lower educational qualifications; men
9
with many sexual partners (particularly those with 30 or more
partners per year) and men of black or non-British white
ethnicity[50]
. A recent survey of young MSM (aged 14-19 years)
found low levels of HIV knowledge in this age group with 27%
incorrectly identifying the ways in which HIV could be
transmitted, 71% unaware of post-exposure prophylaxis (PEP)
and 60% unaware that annual HIV tests were recommended
for MSM. Overall, 57% of those surveyed were either
unsatisfied or unsure about their level of HIV knowledge
suggesting the need for HIV specific information for this age
group[51]
.
High ART coverage has also had a limiting effect on HIV
incidence among MSM; modelling by Phillips et al[52]
suggests
that without the introduction of ART, incidence among MSM
from 2006-2010 would have been 68% higher. Global Pre-
Exposure Prophylaxis (PrEP) trials have led to growing interest
in the role that PrEP could play in HIV prevention for MSM in
the UK and survey data suggest that between 50-52% of MSM
would be willing to use PrEP[45, 53]
. Younger men and those
with higher risk sexual behaviours, including unprotected anal
intercourse, were more likely to report willingness to use PrEP
and these men were more likely to have attended a sexual
health clinic in the past year, suggesting this would be an
effective setting for PrEP distribution[53]
. However, ad hoc
prescribing of PrEP in the UK is not currently recommended,
with the British HIV Association (BHIVA) suggesting PrEP
should only currently be prescribed as part of a clinical trial[54]
.
The first PrEP RCT trial in the UK (PROUD) began recruitment
in 2012 with 545 high risk MSM from sexual health clinics
across England taking part in the trial. The trial was
unrandomised in October 2014 when it became clear that the
protection against HIV infection provided by PrEP was above
the pre-set threshold and all participants were subsequently
offered the daily treatment. The trial reported that daily PrEP
reduced the risk of HIV infection by 86%; the highest
reduction reported by any RCT to date [55, 56]
. The full results of
the trial are expected to be published in the next year and this
will have important implications for national prevention
guidance.
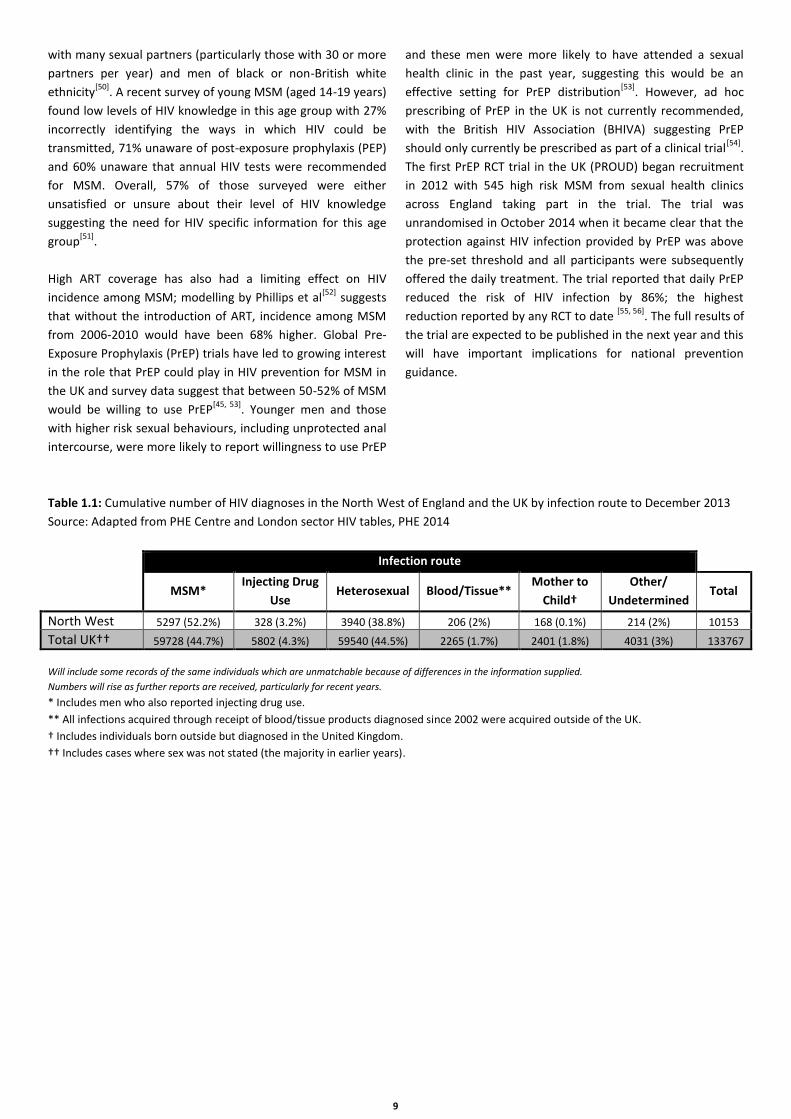
Table 1.1: Cumulative number of HIV diagnoses in the North West of England and the UK by infection route to December 2013
Source: Adapted from PHE Centre and London sector HIV tables, PHE 2014
Infection route
MSM* Injecting Drug
Use Heterosexual Blood/Tissue**
Mother to
Child†
Other/
Undetermined Total
North West 5297 (52.2%) 328 (3.2%) 3940 (38.8%) 206 (2%) 168 (0.1%) 214 (2%) 10153
Total UK†† 59728 (44.7%) 5802 (4.3%) 59540 (44.5%) 2265 (1.7%) 2401 (1.8%) 4031 (3%) 133767
Will include some records of the same individuals which are unmatchable because of differences in the information supplied.
Numbers will rise as further reports are received, particularly for recent years.
* Includes men who also reported injecting drug use.
** All infections acquired through receipt of blood/tissue products diagnosed since 2002 were acquired outside of the UK.
† Includes individuals born outside but diagnosed in the United Kingdom.
†† Includes cases where sex was not stated (the majority in earlier years).
10
Figure 1.1: Number of new HIV diagnoses in the north west of England and the UK, by year of diagnosis to December 2013
Source: Adapted from table 2, National HIV Surveillance Tables, PHE 2014 and PHE Centre and London sector HIV tables, PHE 2014
Numbers, particularly for recent years, will rise as further reports are received.
0
1,000
2,000
3,000
4,000
5,000
6,000
7,000
8,000
9,000
0
100
200
300
400
500
600
700
800
97 98 99 00 01 02 03 04 05 06 07 08 09 10 11 12 13
Nu
mb
er o
f ind
ividu
als, UK
Nu
mb
er
of
ind
ivid
ual
s, N
ort
h W
est
Year of diagnosis
North West of England
UK Total
0
10
20
30
40
50
60
70
97 98 99 00 01 02 03 04 05 06 07 08 09 10 11 12 13
Pe
rce
nta
ge o
f to
tal H
IV c
ase
s
Year of diagnosis
MSM Injecting drug use Heterosexual
Blood/Tissue Mother to Child Other/undetermined
Figure 1.2: Infection route of HIV cases in the UK, by year of diagnosis to December 2013
Source: Adapted from table 2, United Kingdom National HIV surveillance data tables to end of December 2013, PHE

11
Heterosexual sex
Over the past decade, there has been a year on year decline in
the overall numbers of new heterosexually acquired HIV
diagnoses in the UK. This decline is mainly due to a fall in the
number of new diagnoses amongst heterosexuals acquiring
HIV in high prevalence countries, whilst new diagnoses
acquired heterosexually within the UK have remained stable [34]
.
The majority (57%) of HIV positive individuals infected
through heterosexual sex in 2013 were female[34]
; however,
the decline in heterosexual cases over the past ten years has
been substantially steeper among women (from 3,100 in 2004
to 1,420 cases compared with 1,780 to 1,070 among men)[34]
.
The number of new diagnoses among older age groups are
increasing, with one in five aged 50 years or over in 2013
(compared with 1 in 14 in 2004). A higher proportion of newly
diagnosed men (26%) were aged 50 years and over when
compared with women (16%)[34]
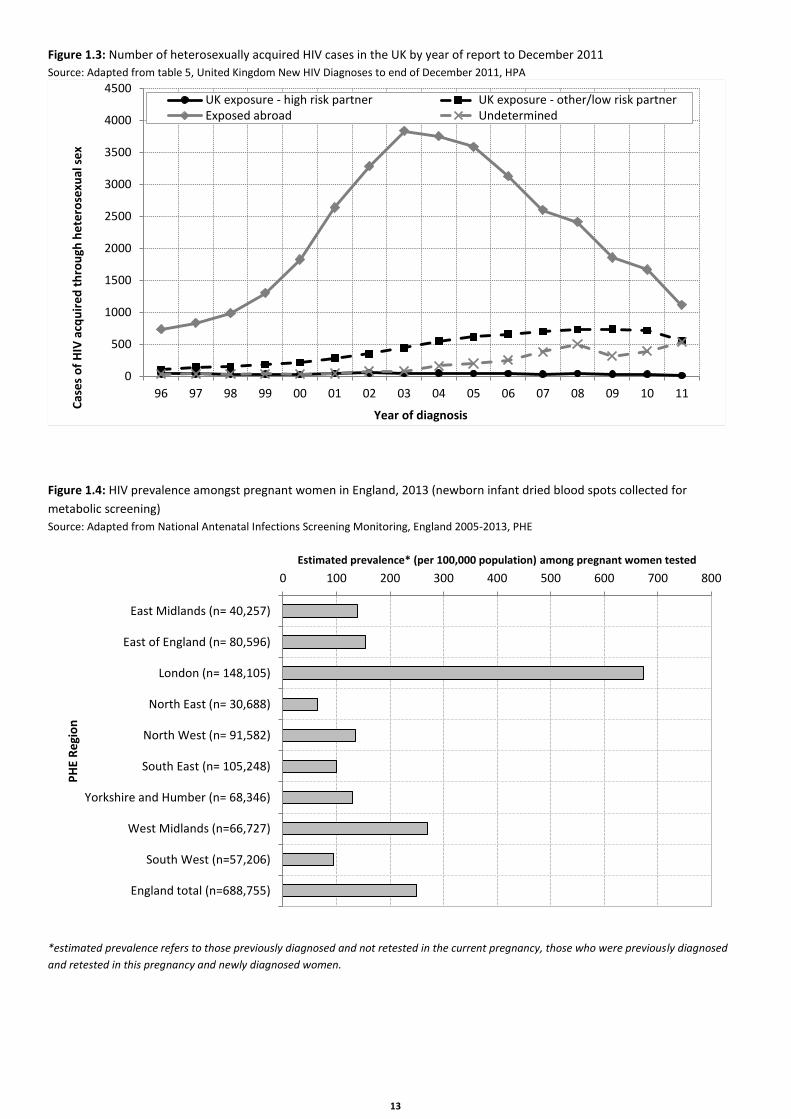
. Figure 1.3 shows the number
of cases acquired through heterosexual sex categorised by
whether they were exposed in the UK through sex with high
risk or lower risk partners or exposed abroad. The number of
individuals exposed abroad peaked in 2002 and has since
declined, accounting for 45% of new diagnoses in 2013.
Heterosexuals acquiring their HIV in the UK now accounts for
the majority of new heterosexual infections (57% in 2013)
while the number of infections acquired abroad has more
than halved over the past decade[34]
.
Anonymous testing of all pregnant women can be used as an
indicator of the prevalence of HIV in the general heterosexual
population. Data from 2013 reveal that the prevalence of HIV
amongst pregnant women in England was 250 per 100,000
population (figure 1.4), prevalence in the North West of
England was lower than the national average at 140 per
100,000[57]
.
Despite a steep decline in recent years, women still account
for the majority of heterosexually acquired infections, with
women representing 57% of new heterosexual diagnoses in
2013. Research suggests that women living with HIV
experience poorer psychological health than men[58]
and
international research has found significant associations
between women living with HIV and gender based violence. In
the UK, HIV positive women living with gender based violence
are faced with simultaneous, complex health and personal
issues and can often be prevented from seeking assistance as
a consequence of this abuse[59]
. A recent study at an East
London Hospital found that 52% of HIV positive women
participating had experienced intimate partner violence at
some point during their life with 14% of women reporting
intimate partner violence in the past year[60]
.
In 2013, 46% of heterosexual cases diagnosed were of black
African ethnicity[61]
. These communities will often have close
connections with high prevalence sub-Saharan countries; the
region which was home to 71% of people living with HIV
worldwide by the end of 2013[24]
This is also reflected in the
epidemiology of HIV in Greater Manchester; of those new
cases in 2014 that were infected abroad, just under two thirds
(64%) were exposed in sub-Saharan Africa (see chapter 2,
figure 2.2). However, HIV is often stigmatised within African
communities, and disclosure of HIV status is perceived as a
risk. A recent study found that the HIV status of 83% of black
African men and 55% of black African women surveyed had
been disclosed by a third party. The fear of disclosure can
prevent individuals from accessing services and disclosing
their status to friends and family for extra support[62]
.
The most recent African Health and Sex Survey published by
Sigma Research explored HIV testing, prevention need and
sexual risk behaviour with a sample of 1,026 men and women
identifying as black African or black African British. The survey
found that 28% of respondents with a regular partner were in
a HIV sero-discordant or potentially discordant relationship
and 12% reported that they did not always use a condom with
regular partners with a sero-discordant or unknown HIV
status[63]
. This concurs with recent research with married
African born women which suggests that low coverage of HIV
in health services and media (when compared to Africa)
means that condom use and asking husbands to test for HIV is
often seen as unnecessary[64]
. Approximately one third of
respondents in the African Health and Sex Survey reported
casual sex with at least one partner in the past 12 months of
which 26% reported condom breakage or failure in the past 12
months. Awareness of HIV was fairly low, with 73% unware of
the high HIV prevalence among black Africans living in the UK,
44% unaware of the impact of ART on reducing the risk of
onward HIV transmission and 36% unaware that HIV
medication was freely available to those in need. Over a third
of respondents (35%) had never tested for HIV and only half of
those who had never tested were very confident that they
could access testing when they needed it[63]
.
Injecting drug use
Injecting drug use (IDU) accounts for 4.3% of the total
diagnosed HIV infections in the UK to date[34]
(table 1.1). The
proportion of new infections acquired by this route in 2013
remained relatively stable at 1.8% (figure 1.2). The median age
at diagnosis for people who inject drugs (PWID) has increased
over the past decade from 33 years in 2004 to 47 years in
2013 and the proportion aged 50 years and over has also
increased (from 3% in 2004 to 15% in 2013)[34]
. Other blood
borne infections, such as hepatitis B and C, are more
infectious than HIV and can be transmitted during episodes of
indirect sharing (for example sharing of filters, spoons or

12
water when preparing drugs); thus co-infection is common
among injecting drug users.
Data on blood borne virus prevalence among PWIDs comes
from the Public Health England Unlinked Anonymous Survey
of People Who Inject Drugs. The survey recruits people who
inject drugs through specialist support agencies across
England, Northern Ireland and Wales. Participants provide an
anonymous biological specimen: which is tested for HIV,
hepatitis B and hepatitis C, and complete an accompanying
anonymous questionnaire. During 2009 and 2010, changes
were made to improve the sensitivity of testing in the survey
through the collection of dried blood spot samples (DBS)
rather than oral fluid. DBS sample sensitivity for HIV
antibodies and Hepatitis C and B core antigen are all close to
100%. Since 2011, only DBS samples have been collected.
Public Health England data suggests that nationally HIV
prevalence among people injecting psychoactive drugs has
remained stable at 1.1% in 2013 and data from the UAM
survey found that 5% of PWID participating were unaware of
their HIV infection[65]
. PHE in collaboration with the Centre for
Public Health at Liverpool John Moores University have
recently expanded the UAM survey to include a sub-survey of
people who inject image and performance enhancing drugs
(IPEDS). The 2012-13 survey found a slightly higher prevalence
of 2% among people who inject IPEDs and 13% of respondents
reported either direct or indirect equipment sharing. In
addition 54% reported sexual intercourse with two or more
partners in the past twelve months with just 13% of this group
reporting always using a condom[66]
. The level of sharing of
injecting-related equipment among those who inject
psychoactive drugs has declined over recent years coinciding
with the expansion of Needle Syringe Programmes; however
estimates suggest that around one in six (16%) people who
inject drugs in the United Kingdom still directly share needles
and syringes, with 31% of under 25 year olds reporting sharing,
suggesting that further expansion of these services is
needed[67]
.
Anonymous testing of injecting drug users attending specialist
agencies reveals that, in 2013, HIV prevalence in the north
west of England was among the lowest in the country with no
infections recorded by the UAMS (0% compared with 4.5% in
London)[67]
. Despite recent outbreaks of HIV among people
who inject drugs elsewhere in Europe[68]
prevalence amongst
drug users in the UK remains low compared with other
European countries. This has been attributed to harm
reduction strategies such as needle and syringe
programmes[69]
. A recent systematic review indicates that
Needle and Syringe Programmes and opiate substitution
treatment are the most successful interventions in reducing
injecting risk behaviour and HIV transmission[70]
and a second
review suggests that opiate substitution treatment is
associated with a 54% reduction in the risk of HIV among
people who inject drugs[71]
.
The north west of England has the highest prevalence of
hepatitis B (32% in 2013) and hepatitis C in the country
(68%)[67]
. Since HIV is less infectious than hepatitis C, those
individuals who have had sufficient high risk exposure via IDU
to acquire HIV are also likely to have been infected with
hepatitis C. Having both infections makes the treatment of
each more difficult to manage, increases the progression of
hepatic disease and, for women, increases the probability of
transmission of HIV to an infant during pregnancy or birth[72]
.
Research suggests acute hepatitis C infection is increasing
among the HIV positive population and this is particularly the
case among MSM where changing risk behaviours including
chemsex and club drug use are contributing to this increase[73,
74]. In 2013, 14% of people who inject drugs in the north west
of England, participating in the UAMS, reported direct sharing
of injecting equipment in the preceding four weeks[67]
. Public
Health England recommends diagnostic testing for HIV and
Hepatitis C (and Hepatitis B where appropriate) in Drug
Treatment Agencies and Primary Care services along with
appropriate advice, interventions and care pathways for
those infected[65]
.
National estimates of HIV and Hepatitis C co-infection suggest
an overall prevalence of 9% and this prevalence is
substantially higher among PWID at just under 39%[75]
.
Modelled estimates have used the prevalence of HIV and
Hepatitis C co-infection to estimate that, based on current
prevalence, 77% of HIV infections among PWIDs are due to
sexual HIV transmission[76]
indicating higher sexual risk taking
among this population[77]
. Studies suggest that sexual risk
behaviours are common among stimulant and PIED users[77, 78].
Women who inject drugs particularly experience a
disproportionate burden of sexual ill health with a recent UK
survey based study reported that 66% of responding women
had had unprotected sex in the past 4 weeks and 55%
reported that they had been forced to have sex against their
will in their lifetime[79]
.
13
Figure 1.3: Number of heterosexually acquired HIV cases in the UK by year of report to December 2011
Source: Adapted from table 5, United Kingdom New HIV Diagnoses to end of December 2011, HPA
Figure 1.4: HIV prevalence amongst pregnant women in England, 2013 (newborn infant dried blood spots collected for
metabolic screening)
Source: Adapted from National Antenatal Infections Screening Monitoring, England 2005-2013, PHE
*estimated prevalence refers to those previously diagnosed and not retested in the current pregnancy, those who were previously diagnosed
and retested in this pregnancy and newly diagnosed women.
0
500
1000
1500
2000
2500
3000
3500
4000
4500
96 97 98 99 00 01 02 03 04 05 06 07 08 09 10 11
Cas
es
of
HIV
acq
uir
ed
th
rou
gh h
ete
rose
xual
se
x
Year of diagnosis
UK exposure - high risk partner UK exposure - other/low risk partnerExposed abroad Undetermined
0 100 200 300 400 500 600 700 800
East Midlands (n= 40,257)
East of England (n= 80,596)
London (n= 148,105)
North East (n= 30,688)
North West (n= 91,582)
South East (n= 105,248)
Yorkshire and Humber (n= 68,346)
West Midlands (n=66,727)
South West (n=57,206)
England total (n=688,755)
Estimated prevalence* (per 100,000 population) among pregnant women tested
PH
E R
egi
on

14
Blood or tissue
HIV screening and heat treatment were introduced for
donated blood products in 1985 and since then HIV infection
by this route has been rare. This is illustrated by the abrupt
decline of HIV infection among blood and tissue product
recipients from 8% of all infections reported before and during
1991 to just 0.3% in 2013 (figure 1.2). The small number of
infections that have been diagnosed since 2002 were all
acquired outside the UK[27]
.
Between 1979 and 1985 about a fifth of patients with
haemophilia in the UK were infected with HIV after treatment
with contaminated clotting factor concentrates. Co-infection
with the hepatitis C virus was also common and has
contributed to high mortality amongst these individuals. A
small proportion of individuals with haemophilia infected with
HIV in the early 1980s are still alive and well, but there have
been an increasing number of deaths from liver disease in this
patient group as a consequence of co-infection with hepatitis
C[80]
.
After 1985, HIV infection via blood transfusions in the UK were
rare occurrences and either the result of donations collected
during the HIV infection window period (i.e. before antibodies
had developed in the donor’s blood) or people infected prior
to screening who have only recently developed HIV-related
disease[81]
. A study of 5,579 transfusion recipients in North
London published in 2000 found that at nine months none of
the recipients had been infected with HIV as a result,
suggesting that the current risk of transmission from a
transfusion in the UK is very low[82]
.
Mother to child
During 2013, 688,755 HIV tests in England were conducted in
antenatal settings. The proportion of pregnant women
accepting recommended routine antenatal HIV tests was high,
at just under 98%[57]
. The prevalence of newly diagnosed HIV
in women giving birth in 2013 was highest in London (340 per
100,000). The prevalence in the rest of England, despite
doubling in the past decade, is relatively low (160 per 100,000
nationally)[57]
. Between 2003 and 2013, 1,270 children have
been born to HIV positive mothers in the UK of which an
estimated 7% are known to be living with HIV[27]
. In 2013, 90
mother to child infections were reported with the majority of
these cases acquired abroad[34]
. These figures will inevitably
increase as the year progresses as the presence of maternal
antibodies up to 18 months after birth confounds diagnosis.
The latest data on HIV testing uptake among pregnant women
in the north west of England shows that, in 2011, the North
West uptake rate was 97%, well above the 90% government
target, and uptake has remained high since 2010 (also 97%).
The highest uptake was in Cumbria & Lancashire (99%) with
Cheshire & Merseyside achieving an uptake rate of 98%,
followed by Greater Manchester (95%); all above the
government target[83]
. In 2013, 91,582 women were tested for
HIV at antenatal screening in the North West of England of
which 124 were found to be positive. Overall, 30 in 100,000
antenatal tests among women were newly diagnosed with
HIV[57]
.
Interventions such as using antiretroviral therapy to keep
down viral load, elective caesarean section (where there is a
high detectable viral load) and avoidance of breast feeding
can reduce the risk of mother to child transmission to 1%. The
decrease in mother to child transmission nationally reflects
the increase in the number of mothers on ART at conception;
data from the National Study of HIV in Pregnancy shows that
the risk of mother to child transmission is significantly higher
among women with a higher viral load (50-399 copies/ml; 1%)
compared with women with a viral load <50 (0.09%). The
study also found that the probability of mother to child
transmission declined with each additional week of treatment
initiation, with the weekly decline most rapid up to 15
weeks[84]
. The current BHIVA guidelines recommend that
women should commence ART at 24 weeks (most frequently
zidovudine or lamivudine monotherapy) providing she is not
already taking or in need of combination therapy for her own
health[85]
. There has been some concern that zidovudine may
lead to the emergence of drug resistant virus which could
compromise the mother’s future care; however, evidence
from the UK suggests that using zidovudine monotherapy
according to the BHIVA guidelines does not present any
adverse outcomes for women’s health once treatment is
started[85, 86]
.
In 2012, the British HIV Association (BHIVA) updated their
guidelines for the treatment of pregnant women, and this
included a recommendation that women with a viral load of
<50 copies per mm at 36 weeks gestation should be offered a
vaginal birth rather than a caesarean section[87]
. A recent
European study found that rates of vaginal deliveries have
increased since the introduction of new guidelines, but that
the proportion of women delivering via caesarean section
with an undetectable viral load remained high at 55%
suggesting that there are missed opportunities for women to
have vaginal delivery[88]
.
For those children who are born with HIV in the UK, the
prognosis has improved due to the advent of triple therapy:
they are living longer, are less likely to require hospital
admission and are less likely to progress to AIDS, as is the case
in other developed countries[89]
. Consequently, services are
being developed to address the needs of this group as they
become young adults[90, 91]
. This is particularly important as
these young people transition from paediatric to adult

15
services where the difference in ethos and clientele can be
particularly notable for young people. Research suggests that
appropriate support is needed to ensure continued
attendance and adherence to treatment[92]
. Importantly,
young adults who acquired HIV perinatally are now also at the
age where they are having children of their own. These young
adults will face additional HIV related relationship and
parenting stressors including disclosure to both their partners
and to their children in the future[93]
. Currently around 6% of
young women with perinatally acquired HIV in the UK have
experienced one or more pregnancies[94]
.
HIV in non-UK nationals
Globally, migrants are at greater risk of HIV infection than
resident populations, irrespective of their country of origin[95]
.
Migrant’s risk of HIV is influenced by political, social, and
economic factors in both their destination country and their
country of origin. Both at their destination and in transit
migrants are of increased vulnerability to HIV; the resultant
stress and isolation many migrants experience can lead to
engagement in risky behaviours including unsafe sex and drug
use as well as being at risk of sexual violence and human
rights abuses[22]
. As Chimienti and Solomos[96]
argue, the
enforcement of international human rights to healthcare
largely depend on their political and social reception in the
destination country and this is generally framed around
national interest rather than the international rights view of
global citizenship.
In addition, migrant groups are often negatively portrayed in
the media and in recent years in particular there has been
increased political and media dialogue around HIV and the
concept of “health tourism”[97]
; those who are alleged to
travel to the UK to deliberately make use of free of charge
health services. Evidence suggests that the UK in fact exports
more health tourists than it imports[98]
and the number of HIV
positive visitors to the UK accessing treatment and services is
minimal[99, 100]
. However, misconceptions in the media can
have a significant effect on migrant communities who suffer
heightened stigma in relation to HIV[101]
which can prevent
them from accessing healthcare services. As a consequence
they are likely to have increased mortality and morbidity risks
resulting in greater costs to the individual and the NHS as a
whole, as well increasing the risk of onwards transmission
amongst those who are undiagnosed or not accessing
treatment[101, 102]
.
In the UK, asylum seekers suffer the highest levels of absolute
material deprivation, marginalisation and stigmatisation[99]
.
The prevalence of HIV amongst this group is likely to reflect
that of their country of origin. Asylum seekers in the UK
currently have access to free of charge HIV care whilst seeking
asylum. In 2012, the House of Lords Select committee
recommended an amendment to the Health and Social Care
Bill which would add HIV to the list of conditions included in
the NHS (Charges to Overseas Visitors) Regulations. This
amendment would mean that HIV treatment would be
provided free of charge to all those accessing care, regardless
of their residency status[69].
In February 2012, the UK
government indicated that it was willing to accept this
amendment and the change in regulations came into force in
October 2012; enabling asylum seekers to receive HIV
treatment free of charge[103]
.
Prior to 2009, dispersal policies in the UK meant that many
asylum seekers found themselves in areas where medical
services were unaware and unprepared for their health status
and sometimes lacked sufficient expertise[104]
. An inquiry by
the All-Party Parliamentary Group on AIDS concluded
dispersal was likely to impact on an asylum seeker’s ability to
comply with the 95% adherence to antiretroviral therapy
necessary to ensure that treatment of the virus has greatest
effect. Dispersal policies meant that while resident in the UK,
asylum seekers were at an increased risk of developing HIV
that is resistant to treatment if dispersed away from their
source of treatment and support[105]
. As a result of this, the
National Asylum Support Service (NASS) produced new
guidelines on the dispersal of HIV positive asylum seekers.
These guidelines now mean that the consent of the person's
consultant to dispersal is required and advance arrangements
must be made for continuity of care where the person is to be
relocated[106]
. Further guidelines on the detention and
removal of asylum seekers with HIV were published in June
2009 offering advice for healthcare and community sector
professionals on ensuring continuity of care and antiretroviral
therapy[107]
.
During 2014, the UK received 24,914 asylum applications
(including dependents), a 6% increase compared with 2013
(23,584, including dependents)[108]
. The most recent data
available show that between October and December 2014
7,100 asylum applicants resided in the north west of England
of which 6,777 received supported accommodation from
NASS. In Wigan, Stockport and Trafford there were 522, 100
and 66 individuals respectively living in supported
accommodation[108]
. At a national level, no data are collected
on how many asylum seekers seek treatment for HIV.
Information for Greater Manchester about those known to be
non-UK nationals is presented in tables 2.9 (chapter 2) and
3.13 (chapter 3).

16
Testing for HIV
An estimated 1,143,899 HIV tests were conducted in GUM
services in England in 2014[109]
. BHIVA Guidelines recommend
that a test should be considered: for all individuals from high
risk groups; for all those presenting with a HIV indicator
condition and, in local authorities where HIV prevalence
exceeds 2 in 1,000 population, for all men and women
registering in general practice and all general medical
admissions. A recent national audit of testing guidelines by
BHIVA found that only 31% of high prevalence areas currently
commission routine testing at registration in some general
practices and in these areas on average only 20-30% of
practices were participating[110]
. The guidelines also
recommend universal HIV testing in: GUM or sexual health
clinics; antenatal services; termination of pregnancy services;
drug dependency programmes; and, health care services for
those diagnosed with TB, hepatitis B, hepatitis C and
lymphoma[1]
.
In response to the BHIVA guidelines, the Department of
Health funded a number of pilot programmes to investigate
the feasibility and acceptability of testing programmes outside
traditional testing settings. The majority of the pilot sites
found a positivity rate of at least one per thousand tests,
which is the threshold for cost-effectiveness, with the highest
rates reported in community based projects and expanding
testing into all settings was viewed as both acceptable and
feasible by patients and staff[111]
. Home testing for HIV was
made legal in the UK in April 2014[112]
, with the first home
testing kit (BioSure) made available for sale in the UK in April
2015.
Of the 193,462 eligible new GUM attendees in the north west
of England in 2014, 84% (162,363) were offered an HIV test;
just below the England average of 86%. Public Health England
no longer publish figures at a county level for the north west
of England but data from 2013 suggested that the level of test
offer varies slightly across the north west of England with
Cumbria and Lancashire having a higher level than the
national average (91%) whilst Cheshire and Merseyside and
Greater Manchester were slightly lower than the national
average (83% and 82% respectively).
Figure 1.5 shows the uptake rate of HIV testing in north west
England in GUM clinics by sexual orientation and gender. The
uptake rate is the percentage of HIV tests offered to
attendees at GUM that were accepted by the attendee. In
total, 107,415 GUM clinic attendees were tested for HIV in the
north west of England in 2014, an uptake rate of 56%. Little
has changed in terms of uptake rates for each group between
2010 and 2014. Amongst men, the uptake rates were highest
for those who identified as MSM (87% in 2014). Amongst
heterosexuals the coverage for females (46% in 2014) was
lower than amongst men (70% in 2013). Uptake of testing in
the north west of England was highest amongst those of black
Caribbean ethnicity, with 79% accepting the offer of a test,
and black African ethnicity with 74% accepting a test. Uptake
was lowest among attendees of white and asian ethnicity
(55% and 54% respectively). HIV testing coverage in Trafford,
Stockport and Wigan was 52%, 51% and 43% respectively, all
below the national average (69%)[113]
. Amongst the prisoner
population in the north west of England, testing uptake was
79% in 2014, considerably higher than the England average
(59%). Amongst sex workers, the uptake was 83% in the north
west of England, slightly lower than the national average
(85%)[109]
.
New developments in treatment and prevention
The “Political Declaration on HIV and AIDS” which was set out
by the United Nations High Level Meeting on AIDS in 2011
included the commitment to achieve “universal access to HIV
prevention, treatment, care and support by 2015”. The
Declaration focused on three political directions;
revolutionising HIV prevention, moving to the next phase of
HIV treatment, care and support and advancing gender
equality and human rights for the HIV response[114]
. These
global commitments were developed in line with the health-
related United Nations Millennium Development Goals which
alongside commitments to eradicate global poverty,
established goals to halt and reverse the transmission of
HIV/AIDS alongside other diseases by 2015[23]
. In July 2014,
UNAIDS announced that this goal had been met with over 15
million people worldwide on ART representing 72% of all
those eligible[24]
.
A break through study by Cohen et al[115]
trialled early
initiation of ART among HIV serodiscordant couples in nine
African countries found that early initiation of ART led to a 96%
reduction in HIV transmission. As a consequence of this
emerging evidence, WHO produced new guidelines on ART
which made three key recommendations: that those with a
dual TB diagnosis should begin treatment immediately; that
pregnant women should be offered lifetime treatment and,
that all those living with HIV should initiate antiretroviral
therapy at a CD4 count below 500 cells/ mm3[116]
. Early release
guidance published by WHO in 2015 further expanded this
recommendation; advising that ART should be initiated in all
individuals living with HIV regardless of CD4 count[117]
. The
global focus has shifted to ensuring that people living with HIV
are provided with treatment as soon as possible with interim
findings recently released from the Strategic Timing of
Antiretroviral Treatment (START) study finding that starting
ART sooner (with a CD4 above 500 cells/mm3) significantly
reduces individuals risk of developing AIDS and other serious
illnesses[118]
. As a result, the latest British HIV Association

17
(BHIVA) guidelines recommend that adults living with HIV
should begin ART at any CD4 count; as soon as they are ready
to commit to taking therapy[119]
.
Globally, it has been estimated that achieving 80% coverage of
the new WHO guidelines could reduce the number of people
acquiring HIV from the 2.4 million seen in 2011 to 800,000.
However, these new guidelines mean that the 15 million
people who were receiving ART globally represented just 41%
(32-37%) of those eligible in 2014. Children and marginalised
groups are still less likely to receive antiretroviral therapy.
Without access to ART, one half of children living with HIV die
by their second birthday, whilst starting on ART by 12 weeks
old reduces HIV related mortality by 75%. Globally only 32%
of children eligible for ART were receiving it in 2014 and the
rate of increase is substantially slower than the rate for adults.
UNAIDS recognise that in order to meet their prevention goals
work will need to combine rapid global adoption of scientific
breakthroughs to ensure equitable access to cost-effective
and high quality prevention programmes. The development of
a HIV vaccine remains challenging; the RV144 trial conducted
in Thailand[120]
was the first to report modest protection
against the acquisition of HIV in low risk populations[121]
and
while there are no existing phase III trials, a small number of
phase II prime-boost trials are currently underway[122]
.
Research has also increasingly focused on the role of
treatment in prevention and has broadened the scientific
agenda beyond vaccine development. Early initiation trials
along with successful pre-exposure prophylaxis trials are
unifying prevention and treatment programmes. Pre-exposure
prophylaxis (PrEP) trials are gradually developing a body of
evidence demonstrating the effectiveness of PrEP in HIV
prevention with several trials demonstrating a significant
reduction in HIV transmission when compared with a
placebo[123, 124]
. The first PrEP trial among MSM in the United
Kingdom, which compared immediate versus deferred PrEP,
began in 2013 with the results finding that effectiveness was
86%; the highest effectiveness seen in any PrEP trial to
date[125]
. Additional findings from the Partners in PrEP study
have also found that PrEP appears to be safe in pregnancy and
further research could confirm the role of PrEP in reducing HIV
infection during conception[126]
. Small scale studies from the
UK suggest PrEP is a safe and effective option for
serodiscordant couples wishing to conceive[127]
. Early release
guidelines from WHO published in 2015 recommend daily use
of oral PrEP for people at substantial risk of HIV infection as
part of combination prevention approaches[117]
.
Research in recent years has also considered what is termed a
“functional cure” for HIV. Several studies have presented
evidence that initiating treatment at primary HIV infection can
result in maintained long term control of the virus and an
undetectable viral load on discontinuation of treatment[128-130]
.
Perhaps the most well-known of these is the case of the
“Mississippi baby”, in which a child who had commenced on
intensive ART from birth to 18 months appeared to have an
undetectable viral load after two years of ART
discontinuation[130]
. However, in a news conference on 14th
July 2014, it was announced that at four years old the child’s
HIV was once again detectable. Similarly, experimental
research has explored what has been termed the “kick and kill”
approach which involves the possibility of stimulating latent
cells in the HIV reservoir to become active and thus
controllable with antiretroviral drugs. This would then be
combined with the development of drugs to seek out and kill
any residual reservoir cells. The most publicised of this early
trial research is the use of HDAC inhibitors to stimulate latent
cells[131]
. However, results presented at the 20th
International
AIDS conference found that whilst HDAC inhibitors were
successful in activating latent HIV, this did not result in a
reduction of the viral reservoir[132]
. Discussions at the
conference concluded that vaccine and cure research should
not become opposed, rather that they represented “two sides
of the same coin” and that both were needed for an adequate
preventative response to HIV.
HIV and AIDS in Greater Manchester, 2014
Figure 1.1 and table 1.1 use data taken from the PHE New HIV
Diagnoses Surveillance Tables to illustrate the status of the
HIV/AIDS epidemic in the north west of England in comparison
with the rest of the UK. This information is useful for
monitoring trends both nationally and regionally. For the most
accurate and detailed information about people living with
HIV in Greater Manchester, see the comprehensive overview
in chapters 2 to 6 of this report.
By the end of 2013, a cumulative total of 10,153 HIV infections
in the north west of England had been reported to PHE (figure
1.1), including 505 new diagnoses during 2013[27].There were
33 newly diagnosed AIDS cases recorded in the north west of
England in 2013, bringing the cumulative total to 1,901, 7% of
the total number of AIDS cases reported in the UK[133]
.
The pattern of HIV exposure amongst people living with HIV in
Greater Manchester differs slightly from that of the UK.
Greater Manchester has a higher proportion of infections
amongst MSM (52%, compared with the UK figure of 45%),
and a lower proportion of people infected through
heterosexual sex (42% compared with 45%) (table 1.1).
The data in figure 1.4 are derived from the anonymous
seroprevalence survey conducted by PHE and use newborn
infant dried blood spots to show the level of HIV infection in
pregnant women. Annual figures for 2011, the most recent

18
year for which data are available, show an HIV prevalence of
222 per 100,000 population amongst women giving birth in
England. The prevalence amongst pregnant women in the
north west of England has remained stable at 159 per 100,000
population[134]
.
Sexual health in the north west of England
The epidemiology of HIV in the north west of England needs
to be set in the context of general sexual health in the region.
The total number of new STIs in the north west of England
remain high; most recent STI data from PHE show that there
were 59,219 new STI diagnoses in 2014. Between 2012 and
2014 the rate of all new STI diagnoses per 100,000 population
remained stable at just under 834 per 100,000 population[135]
.
High rates of STIs also place a significant burden on the
economy: it has been estimated that the direct medical cost of
newly acquired STIs in the north west of England was almost
£60 million in 2003[31]
. This estimate was based on the lifetime
cost of treating STIs and included the expense of treating
acute STIs and the sequelae of untreated or inadequately
treated acute STIs. The presence of STIs in the population not
only serves as an indicator of sexual risk-taking behaviour, but
also increases the probability of HIV transmission[136, 137]
.
Monitoring HIV and AIDS in the north west of England
Over the past 19 years, the North West HIV/AIDS Monitoring
Unit has collected, collated, analysed and disseminated data
on the treatment and care of HIV positive individuals in the
north west of England. This level of clinical and public health
monitoring is supported by the NHS Information Strategy
2012. The strategy recognises that transparent and open data
are essential to make informed and evidence-based decisions
on health services[138]
. In view of the sensitive nature of the
information collected, data are anonymised and the Caldicott
principles and recommendations (relating to data
confidentiality and security) applied[139]
.
Data were collected from 14 statutory treatment centres
including GUM clinics; haematology clinics, infectious disease
units and a specialist GP across Greater Manchester[2-17]
. Data
on Greater Manchester residents was also included from 12
other statutory treatment centres across Cumbria, Lancashire,
Liverpool and the Isle of Man. The data form part of the
Survey of Prevalent Diagnosed HIV infections (SOPHID)
national dataset. In addition data are used at Local Authority
(LA) and regional level to assist in service planning,
development and evaluation. Figure 1.6 shows the number of
Greater Manchester residents living with HIV who contacted
statutory treatment centres in the North West between 1996
and 2013. The data collected by the North West HIV/AIDS
Monitoring Unit from across the region over the last 19 years
illustrate the increasing number of people accessing HIV
services. The number of HIV positive individuals attending
treatment centres has increased (5%) from 2013 to 2014. The
continuing increase in size of the HIV positive population is in
part due to the decreased number of people dying from AIDS-
related illness, but is also due to continuing numbers of new
cases. A full account of the epidemiology of HIV and AIDS in
Greater Manchester is given in chapters 2 and 3 of this report.
The North West HIV/AIDS Monitoring Unit also collects data
from HIV/AIDS community sector organisations across the
region (chapter 4). Data are also included from social services
departments from across the north west of England, providing
data on HIV positive service users (chapter 5).
Methodology of monitoring HIV and AIDS in the north west
of England
Statutory treatment centres are prompted to report electronic
data on all HIV positive individuals seen at their clinic with up-
to-date details from the most recent reporting period
including all new cases either transferred from another clinic
or newly diagnosed. The names of HIV positive individuals are
not collected: a one-way encryption of the individual’s
surname, the soundex code, is used. This in combination with
sex and date of birth defines a unique individual.
Demographic data collected for each person include: hospital
number; soundex; date of birth; sex; postcode; ethnicity;
residency status; transmission route of HIV; vital status;
whether they were exposed abroad and country of exposure.
For the purposes of this report, men who acquired HIV though
sex with men (MSM) and who were also injecting drug users
(IDUs) were included in the MSM category. Male to female
transsexuals who acquired HIV through sex with men were
recorded as male and age groups refer to the age of
individuals at the end of December 2014, or at death. Ethnic
group classifications are those used by the HPA HIV and STI
Department, for SOPHID. Residency categories are adapted
from the National Asylum Support Service (NASS) categories.
The data requested on each individual include: number of
outpatient visits; inpatient stays; home visits; day cases; latest
CD4 counts and viral loads and dates taken; details of any
antiretroviral therapy (ART) they are being prescribed;
whether they are pregnant; clinical stage and the date they
were last seen. Individuals are categorised as receiving the
highest level of ART and as the most advanced stage of
disease reported from any treatment centre during the period.
Additionally, for those who died, information on cause and
date of death is requested.
Community sector organisations are prompted annually to
send basic data on the individuals attending their service. This
information includes: soundex code, date of birth, sex, route

19
of infection, ethnicity, residency status and pregnancy status.
Data are collected from social service departments in a similar
way to community organisations. Individuals reported to
community sector and social services are matched to the
statutory sector database by soundex, date of birth and sex,
and any unknown information is updated from the statutory
sector database.
New cases are classed as individuals who are new to the north
west of England database in 2014 and have not been seen at a
statutory treatment centre in the north west since 1994. New
cases include transfers from outside of the region so new
cases in the north west of England treatment and care
database are not necessarily new diagnoses. However, whilst
slightly overestimating the number of new diagnoses, new
cases remain an accurate proxy measure of new diagnoses in
the north west of England.
We encourage service providers to download a spreadsheet
with pre-defined data collection fields from our secure
document gateway and upload their completed data in the
same way. All the large north west centres provide data this
way and an increasing number of the smaller centres now
submit data electronically. The remainder send details on
paper forms. The vast majority of community sector
organisations and social services departments send electronic
data via the document gateway.
All service providers are asked to provide full postcodes to
enable mapping to LA of residence (using postcode data from
ONS). Partial postcodes are mapped to a particular LA if more
than 90% of individual partial postcodes sit within a single LA.
This method provides a good degree of accuracy when all but
the last digit of the postcode is available. However, if only the
first part of the postcode (e.g. M12) is provided this allows
only 85% to match, and some first part postcodes do not even
match to a single region. Partial postcodes that could not be
mapped to a LA were allocated to a county if possible, or
coded as unknown. Analyses are displayed by county, and LA.
For reasons of space, it is not possible to present all
breakdowns at LA level. However, additional tables are
available on the North West HIV and AIDS monitoring website
http://www.cph.org.uk/hiv/ .
Figure 1.5: Uptake of HIV testing in north west England by sex and male sexual orientation, 2010 - 2014
Source: adapted from table 5: HIV Testing Coverage and Uptake, 2010 – 2014, PHE
0%
10%
20%
30%
40%
50%
60%
70%
80%
90%
2010 2011 2012 2013 2014
Test
up
take
(%
)
Year
MSM Heterosexual Men Heterosexual Women

20
Figure 1.6: Total number of Greater Manchester HIV and AIDS cases seen in north west statutory treatment centres in, 1996-
2014
Source: HIV & AIDS in the North West of England annual reports[2-18]
*Prior to 2001, area of residence was by health authority and did not include Cumbria
0
1000
2000
3000
4000
5000
6000
96 97 98 99 00 01 02 03 04 05 06 07 08 09 10 11 12 13 14
Tota
l nu
mb
er
of
HIV
& A
IDS
case
s
Year

21
2. New Cases 2014 During 2014, 531 new HIV and AIDS cases presented to
statutory treatment centres in Greater Manchester; a 13%
increase from 2014 (468 cases) reflecting the fluctuating trend
seen in recent years. New cases are defined as individuals
seen resident in Greater Manchester and seen in one of the
reporting treatment centres for the north west of England in
2014 but not during the years 1995 to 2013 and include new
cases who died during the year.
Data on newly reported cases of HIV assist in the identification
of trends and represent the most up to date information on
the characteristics of HIV infection and transmission. Such
information is valuable not only for planning and evaluating
the success of prevention activities, but also for predicting
future cases of HIV and its impact on treatment and care
services in Greater Manchester. The aim of this chapter is to
present information relating to new cases and, where
appropriate, references are made to corresponding data from
previous north west reports. For reasons of confidentiality and
space, it is not possible to present all breakdowns at local
authority (LA). However, additional tables are available on the
North West HIV and AIDS Monitoring Unit website
(http://www.cph.org.uk/hiv/).
For the purposes of this report, men who acquired HIV
through sex between men (MSM) and who are also injecting
drug users (IDU) are included in the MSM category. Male to
female transsexuals who acquired HIV through sex with men
are recorded as males, and age groups refer to the age of
individuals at the end of December 2014, or at death.
The adult (aged 15-59 years) incidence‡ of HIV in Greater
Manchester in 2014 was 31 per 100,000 population. Amongst
the four local authorities commissioning this report, Trafford
had the highest incidence at 25 per 100,000 population
followed by Bury, 19 per 100,000; Stockport, 18 per 100,000
and Wigan 10 per 100,000.
Figure 2.1 shows the probable global region and country of
HIV infection for new cases of HIV probably acquired outside
the UK who presented for treatment and care in 2014. Thirty
two percent of new cases (170 individuals) contracted their
infection abroad, just under two thirds (64%) of which were
acquired in sub-Saharan Africa. A further 15% were exposed in
Western Europe, followed by South and South East Asia (8%)
and Eastern Europe and Central Asia (6%).Individuals reported
to have been infected in Zimbabwe continue to dominate the
statistics, accounting for 16% of newly reported infections
‡ Rate of new cases per 100,000 adult population (age 15-59 years)
calculations exclude those with unknown area of residence and those living outside the region.
thought to have been acquired abroad (27 cases). There were
also a high number of new cases acquired in Nigeria (23, 14%)
and Malawi (13, 8%). Overall, 108 new people in Greater
Manchester presented for treatment and care who were
thought to have been infected in 21 different countries across
sub-Saharan Africa. Infections from South and South-East Asia
were mostly acquired in Thailand, which accounts for the
largest number of non-UK acquired infections outside of sub-
Saharan Africa (12 cases; 7%). The largest number of
infections in Western Europe were acquired in Spain (eight
individuals; 5%).
Table 2.1 illustrates the age distribution, stage of HIV disease
and ethnicity of the new HIV and AIDS cases by infection route
and sex. Eleven percent of all reported cases in Greater
Manchester during 2014 were seen for the first time in the
region in this year. The majority of newly reported cases (53%)
occurred in people between the ages of 25 and 39 years, with
the greatest proportion amongst those aged between 35 and
39 years (19%). Exposure through sex between men accounts
for the highest proportion (57%) of new cases. Ninety eight
percent of young people aged 15-24 years, for whom route of
exposure is known, were infected with HIV during sex (either
sex between men or heterosexual sex) with 83% being
infected through MSM.
The number of new infections attributed to IDU remains
relatively low with 5 individuals in 2014 compared with 4
individuals in 2013. During 2014, 7 new cases of vertical
transmission (mother to child) were reported from Greater
Manchester; the same number as both 2013 and 2012. The
infection route for 16 new cases (3%) has not yet been
determined.
HIV positive individuals categorised as asymptomatic continue
to represent the largest proportion of new cases (41% of
those where the stage is known), maintaining the observation
that many HIV positive individuals are contacting services at a
relatively early stage of their HIV disease. However, three of
the four individuals classed as new cases who died during
2014 had an AIDS-defining illness and overall 23% of new
cases whose stage was known were diagnosed with AIDS by
the end of 2014 (including those who had died from an AIDS-
related illness). This was a slightly higher proportion than seen
in 2013 (14%); suggesting that despite continued efforts to
raise awareness, a minority of individuals continue to present
to services too late to benefit from life-prolonging treatment.
As in previous years, the majority of new HIV cases, for whom
ethnicity is known, were of white ethnicity (63%), with 37% of
cases occurring in a minority ethnic group. Black Africans

22
account for 73% of minority ethnic cases, with black Africans
exposed through heterosexual sex comprising 22% of all new
cases reported in 2014. Among females infected through
heterosexual sex, 17% were white, compared with 66% who
were of black African ethnicity. Of all the individuals infected
through MSM, 84% were of white ethnicity.
Table 2.2 shows the LA of residence and the infection route of
new Greater Manchester HIV cases presenting for treatment
and care in 2014. The table is broken down by commissioning
local authorities with the total presenting data on all Greater
Manchester residents reported to the monitoring system in
2014. The predominant route of infection for new cases was
MSM (57%) but this varied across local authorities with the
majority of new cases in Stockport, Bury and Trafford being
among MSM (71%, 62%, 62% respectively) whilst in Wigan a
higher proportion of new cases were acquired heterosexually
(56%).
Table 2.3 presents the breakdown of stage of HIV disease by
commissioning LA. Caution must be taken when examining
these figures as a large proportion of individuals had an
unknown stage of infection across all four local authorities;
ranging from 61% in Wigan to 42% in Stockport. Where stage
of disease is known, the vast majority of individuals in
Stockport (83%) were recorded as asymptomatic whilst all
individuals in Wigan were either symptomatic or diagnosed
with AIDS by the end of 2014.
Table 2.4 illustrates new Greater Manchester HIV and AIDS
cases by stage of HIV disease, infection route and sex
presenting in for treatment and care in 2014, The figures show
that, where stage of disease was known, 41% of new cases
residing in Greater Manchester were asymptomatic, 36% were
symptomatic, and 23% were diagnosed with AIDS (including
those who had died from an AIDS-related illness). The
predominant route of HIV exposure amongst female new
cases seen for treatment and care continues to be
heterosexual sex (91%).
Table 2.5 shows new Greater Manchester HIV and AIDS cases
presenting for treatment and care in 2014 by ethnicity and
age group. Those aged between 35 and 39 years represented
the largest group of new cases accessing treatment and care
(19%) and over half (53%) of those with HIV resident in
Greater Manchester were aged between 25 and 39 years.
New cases tend to be younger (median age of 36 years) than
all cases (median age 43 years), demonstrating the continuing
need to encourage younger people at risk of HIV exposure to
access services. The majority of new cases treated in the
region in 2014 whose ethnicity was known were white (63%),
just above the corresponding data for all cases (60%; chapter
3, table 3.5). Of those HIV positive individuals whose ethnicity
was known, 37% are from a black and minority ethnic (BME)
group. This indicates a substantial over-representation of new
HIV cases within BME communities, when compared to their
overall proportion within the Greater Manchester
population[146]
. The incidence of diagnosed HIV is 3.6 times
higher in BME communities than in the white population in
Greater Manchester. This illustrates the need for specialist
services and specialist projects within the voluntary sector to
provide care and support for communities that have already
been identified as having shorter life expectancies, together
with poorer physical and mental health[140]
.
Table 2.6 illustrates the sex, stage of HIV disease and infection
abroad by ethnicity of new HIV cases presenting from Greater
Manchester for treatment and care in 2014. The majority of
women from Greater Manchester for whom ethnicity was
known and who were treated in the region for the first time in
2014 were from a BME group (79%). Black Africans account
for 73% of all new cases in women for whom ethnicity is
known. Whilst in the white population the gender distribution
is highly biased towards males (92%), 50% of the new cases in
the BME group are female.
Considerable differences in presentation by stage of disease
amongst ethnic groups were reported across the north west
as a whole prior to 2002. For example, overall in 2001, 17% of
white and 28% of BME individuals in the north west
presented for the first time with AIDS, while in 2000 the
margin was wider with 16% of white individuals already
having AIDS compared with 34% of BME communities.
However, in Greater Manchester in 2014, as observed in more
recent years, individuals from black and minority ethnic
communities (for whom ethnicity and stage of disease were
known) were almost as likely to present while still
asymptomatic, with 28% of BME individuals in 2014 compared
with 49% of white individuals. The proportion of individuals
from BME groups (whose stage of disease was known) who
were symptomatic was slightly higher (42%) than white
individuals (33%). The proportion with AIDS (including those
who had died from an AIDS-related illness) was also slightly
higher in BME groups (29%) when compared with white
individuals (17%). However, the stage of disease for 280
individuals is still unknown and this could lead to an
underestimation of the figures at each stage of disease.
Thirty seven percent new cases of HIV and AIDS in 2014
(where area of exposure is known) were recorded as
contracted outside the UK. The area of exposure for 71 cases
is currently unknown, which could lead to an underestimation
of the figures contracted abroad. For those whose exposure
was known, 85% of those of white ethnicity were infected in
the UK, while 85% of black Africans with HIV were infected
outside the UK.
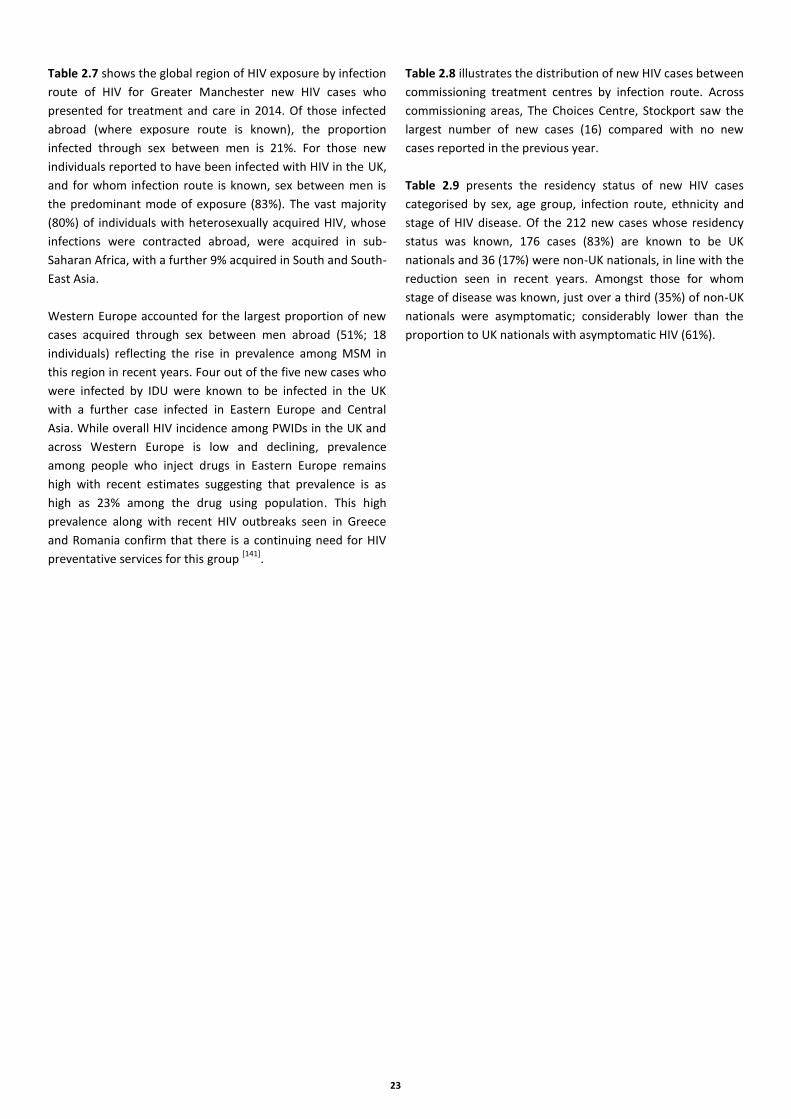
23
Table 2.7 shows the global region of HIV exposure by infection
route of HIV for Greater Manchester new HIV cases who
presented for treatment and care in 2014. Of those infected
abroad (where exposure route is known), the proportion
infected through sex between men is 21%. For those new
individuals reported to have been infected with HIV in the UK,
and for whom infection route is known, sex between men is
the predominant mode of exposure (83%). The vast majority
(80%) of individuals with heterosexually acquired HIV, whose
infections were contracted abroad, were acquired in sub-
Saharan Africa, with a further 9% acquired in South and South-
East Asia.
Western Europe accounted for the largest proportion of new
cases acquired through sex between men abroad (51%; 18
individuals) reflecting the rise in prevalence among MSM in
this region in recent years. Four out of the five new cases who
were infected by IDU were known to be infected in the UK
with a further case infected in Eastern Europe and Central
Asia. While overall HIV incidence among PWIDs in the UK and
across Western Europe is low and declining, prevalence
among people who inject drugs in Eastern Europe remains
high with recent estimates suggesting that prevalence is as
high as 23% among the drug using population. This high
prevalence along with recent HIV outbreaks seen in Greece
and Romania confirm that there is a continuing need for HIV
preventative services for this group [141]
.
Table 2.8 illustrates the distribution of new HIV cases between
commissioning treatment centres by infection route. Across
commissioning areas, The Choices Centre, Stockport saw the
largest number of new cases (16) compared with no new
cases reported in the previous year.
Table 2.9 presents the residency status of new HIV cases
categorised by sex, age group, infection route, ethnicity and
stage of HIV disease. Of the 212 new cases whose residency
status was known, 176 cases (83%) are known to be UK
nationals and 36 (17%) were non-UK nationals, in line with the
reduction seen in recent years. Amongst those for whom
stage of disease was known, just over a third (35%) of non-UK
nationals were asymptomatic; considerably lower than the
proportion to UK nationals with asymptomatic HIV (61%).

24
Case Study: Late Diagnosis in Greater Manchester
Work to reduce late diagnosis of HIV in the North West In the last 10 years the number of new HIV diagnosis has
continued to fall in the North West of England and this
reduction is consistent across all North West areas. This
encouraging trend should not detract attention from the fact
that there is great variation across the region in the proportion
of late diagnosis, which ranges from 66% to 31% of new
diagnoses made late. Therefore, efforts to reduce late
diagnosis of HIV need to continue, as early diagnosis is key for
more successful management of the illness. Here are some
examples of the ongoing work from public health organisations
around the North West:
Greater Manchester
RUClear have been providing home sampling for residents of
Greater Manchester since 2011. 5,201 HIV tests have been
undertaken, identifying 23 reactive cases who were then
referred to GUM services. In 2013, this service was developed
further to target men who have sex with men (MSM) in
conjunction with the Lesbian and Gay Foundation (LGF) and
Manchester Centre for Sexual Health. MSM aged over 18 years
in the region could order a fourth generation dried blood spot
test online via the RUClear website, or collect it from LGF.
The patient collected the sample and returned it by freepost to
the lab, where the results were processed and fed back.
Negative results were then texted back to the patient. Reactive
results were processed by RUClear and clinicians contacted the
GUM clinic closest to the patient to book an appointment that
day for confirmatory testing and linkage to care. The patient
was then informed of the result and directed to the GUM
department for further discussion and support. A text reminder
was sent at two weeks, and a follow-up phone call at four
weeks to increase return rates.
In total, 1,409 HIV sampling kits were ordered from November
2013 to December 2014, with 936 kits being returned to the
lab, providing a total return rate of 66.4%. The median time for
a patient to return the kit was 7 days (range 1-342 days). 31%
reported never having an HIV test before. There were 9 (1%)
positive tests and all were informed of the result and seen by
primary or secondary care. This service targets a high risk
population, yielding a significant proportion of positive tests. In
addition, it has shown to appeal to individuals who have not
previously engaged in HIV testing.
Written by Roberto Vivancos, Consultant Epidemiologist,
Field Epidemiology Services, Public Health England, with
contributions from the Consultants in Health Protection, PHE
North West Centre, and Cumbria & Lancashire
Commissioners.

25
Figure 2.1: Global region and country of infection for new HIV and AIDS cases in Greater Manchester who probably acquired
their infection outside the UK, 2014
Sub-Saharan Africa 108 (64%) East Asia & Pacific 1 (0.6%) Western Europe 26 (15.3%)
Angola 1 (0.6%) Fiji 1 (0.6%) Canary Islands 1 (0.6%)
Botswana 2 (1.2%) Eire 1 (0.6%)
Cameroon 4 (2.4%) Oceania 3 (1.8%) France 5 (2.9%)
Congo 1 (0.6%) Australia 3 (1.8%) Italy 3 (1.8%)
Cote d’lvoire 2 (1.2%) Netherlands 2 (1.2%)
Dem. Republic of Congo 1 (0.6%) South & South-East Asia 14 (8.2%) Portugal 6 (3.5%)
Eritrea 2 (1.2%) India 1 (0.6%) Spain 8 (4.7%)
Ethiopia 2 (1.2%) Thailand 12 (7%)
Gambia 1 (0.6%) Vietnam 1 (0.6%) Caribbean 2 (1.2%)
Ghana 5 (2.9%) Jamaica 1 (0.6%)
Kenya 4 (2.4%) Eastern Europe & Central Asia 10 (5.9%) Unknown 1 (0.6%)
Liberia 1 (0.6%) Hungary 1 (0.6%)
Malawi 13 (7.6%) Latvia 1 (0.6%) North Africa & Middle East 2 (1.2%)
Mauritius 1 (0.6%) Poland 6 (3.5%) Cyprus 1 (0.6%)
Nigeria 23 (13.5%) Romania 2 (1.2%) Egypt 1 (0.6%)
Sierra Leone 2 (1.2%)
Somalia 1 (0.6%) North America 1 (0.6%) Latin America 3 (1.8%)
South Africa 7 (4.1%) Canada 1 (0.6%) Brazil 2 (1.2%)
Uganda 2 (1.2%) Colombia 1 (0.6%)
Zambia 6 (3.5%)
Zimbabwe 27 (15.9%) Total 170
Eastern Europe & Central Asia
10 (5.9%)
North America
Caribbean
Sub - Saharan Africa
North Africa & Middle East
Western Europe
South & South - East Asia
East Asia & Pacific
Total: 170
1 (0.6%)
2 (1.2%) Latin America 3 1.8%)
26 (15.3%)
2 (1.2%)
108 (64%)
14 (8.2%)
1 (0.6%)
3 (1.8%)
Oceania
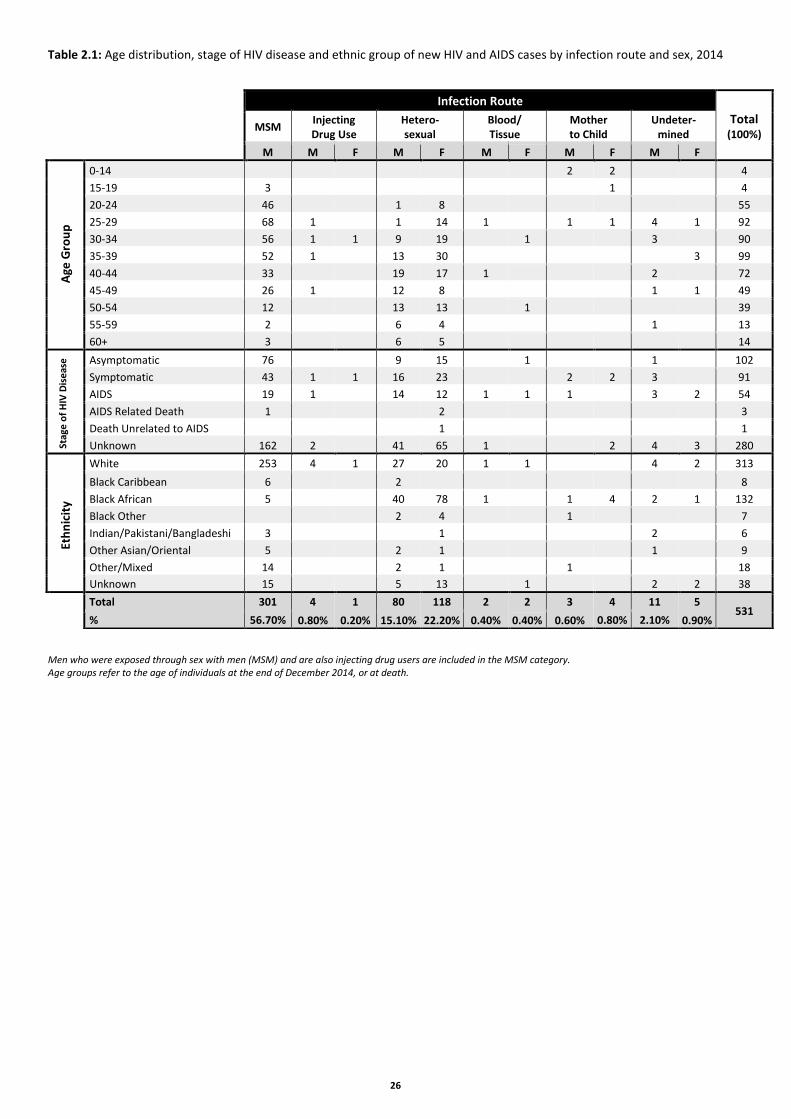
26
Table 2.1: Age distribution, stage of HIV disease and ethnic group of new HIV and AIDS cases by infection route and sex, 2014
Men who were exposed through sex with men (MSM) and are also injecting drug users are included in the MSM category. Age groups refer to the age of individuals at the end of December 2014, or at death.
Infection Route
Total (100%)
MSM Injecting Drug Use
Hetero- sexual
Blood/ Tissue
Mother to Child
Undeter- mined
M M F M F M F M F M F
Age
Gro
up
0-14 2 2 4
15-19 3 1 4
20-24 46 1 8 55
25-29 68 1 1 14 1 1 1 4 1 92
30-34 56 1 1 9 19 1 3 90
35-39 52 1 13 30 3 99
40-44 33 19 17 1 2 72
45-49 26 1 12 8 1 1 49
50-54 12 13 13 1 39
55-59 2 6 4 1 13
60+ 3 6 5 14
Stag
e o
f H
IV D
ise
ase
Asymptomatic 76 9 15 1 1 102
Symptomatic 43 1 1 16 23 2 2 3 91
AIDS 19 1 14 12 1 1 1 3 2 54
AIDS Related Death 1 2 3
Death Unrelated to AIDS 1 1
Unknown 162 2 41 65 1 2 4 3 280
Eth
nic
ity
White 253 4 1 27 20 1 1 4 2 313
Black Caribbean 6 2 8
Black African 5 40 78 1 1 4 2 1 132
Black Other 2 4 1 7
Indian/Pakistani/Bangladeshi 3 1 2 6
Other Asian/Oriental 5 2 1 1 9
Other/Mixed 14 2 1 1 18
Unknown 15 5 13 1 2 2 38
Total 301 4 1 80 118 2 2 3 4 11 5 531
% 56.70% 0.80% 0.20% 15.10% 22.20% 0.40% 0.40% 0.60% 0.80% 2.10% 0.90%

27
Table 2.2: Local authority of residence of new HIV and AIDS cases by infection route, 2014
Men who were exposed through sex with men (MSM) and are also injecting drug users are included in the MSM category.
Table 2.3: Local authority of residence of new HIV and AIDS cases by stage of HIV disease, 2014
Table 2.4: New HIV and AIDS cases by stage of HIV disease, infection route and sex, 2014
Stage of disease
Infection Route Total
(100%) MSM Injecting Drug
Use Heterosexual
Blood/ Tissue
Mother to Child Undetermined
M M F M F M F M F M F
Gre
ate
r M
anch
est
er
Re
sid
en
ts
Asymptomatic 76 9 15 1 1 102
Symptomatic 43 1 1 16 23 2 2 3 91
AIDS 19 1 14 12 1 1 1 3 2 54
AIDS Related Death 1 2 3
Death Unrelated to AIDS 1 1
Unknown 162 2 41 65 1 2 4 3 280
Total 301 4 1 80 118 2 2 3 4 11 5 531
100% %
56.7% 0.8% 0.2% 15.1% 22.2% 0.4%
0.4% 0.6% 0.8% 2.1% 0.9%
Men who were exposed through sex with men (MSM) and are also injecting drug users are included in the MSM category.
Local Authority of Residence
Infection Route Total
(100%) MSM Injecting Drug Use
Hetero- sexual
Blood/Tissue Mother to Child
Undeter-mined
Gre
ate
r
Man
che
ste
r Wigan 7 (38.9%) 1 (5.6%) 10 (55.6%) 18
Bury 13 (61.9%) 8 (38.1%) 21
Trafford 21 (61.8%) 11 (32.4%) 2 (5.9%) 34
Stockport 22 (71%) 8 (25.8%) 1 (3.2%) 31
Greater Manchester Total 301 (56.7%) 5 (0.9%) 198 (37.3%) 4 (0.8%) 7 (1.3%) 16 (3%) 531
Local Authority of Residence
Stage of Disease
Asymptomatic Symptomatic AIDS AIDS Related
Death
Death Unrelated to
AIDS Unknown
Total (100%)
Gre
ate
r M
anch
est
er Wigan 5 (27.8%) 2 (11.1%) 11 (61.1%) 18
Bury 2 (9.5%) 7 (33.3%) 2 (9.5%) 10 (47.6%) 21
Trafford 6 (17.6%) 6 (17.6%) 2 (5.9%) 1 (2.9%) 19 (55.9%) 34
Stockport 15 (48.4%) 1 (3.2%) 2 (6.5%) 13 (41.9%) 31
Greater Manchester Total 102 (19.2%) 91 (17.1%) 54 (10.2%) 3 (0.6%) 1 (0.2%) 280 (52.7%) 531

28
Table 2.5: New HIV and AIDS cases by age category and ethnic group, 2014
Age Group
Ethnicity Total
(100%) White Black
Caribbean Black
African Black Other
Indian/ Pakistani/
Bangladeshi
Other Asian/
Oriental
Other/ Mixed
Unknown
Tota
l Gre
ate
r M
anch
est
er
Re
sid
en
ts
0-14 3 1 4
15-19 3 1 4
20-24 47 1 3 1 3 55
25-29 59 3 13 1 3 6 7 92
30-34 61 1 17 1 3 4 3 90
35-39 47 2 36 1 2 6 5 99
40-44 38 1 22 2 1 1 7 72
45-49 27 15 1 1 5 49
50-54 18 12 2 1 6 39
55-59 4 6 1 1 1 13
60+ 9 4 1 14
Total 313 8 132 7 6 9 18 38 531 % 58.9% 1.5% 24.9% 1.3% 1.1% 1.7% 3.4% 7.2%
Age groups refer to the ages of individuals at the end of December 2014, or at death.
Table 2.6: Sex, stage of HIV disease and HIV exposure abroad of new HIV and AIDS cases by ethnic group, 2014
Ethnicity
Total (100%) White
Black Caribbean
Black African
Black Other
Indian/ Pakistani/
Bangladeshi
Other Asian/
Oriental
Other/ Mixed
Unknown
Sex Male 289 (72.1%) 8 (2%) 49 (12.2%) 3 (0.7%) 5 (1.2%) 8 (2%) 17 (4.2%) 22 (5.5%) 401
Female 24 (18.5) 83 (63.8%) 4 (3.1%) 1 (0.8%) 1 (0.8%) 1 (0.8%) 16 (12.3%) 130
Stag
e o
f D
ise
ase
Asymptomatic 77 (75.5%) 21 (20.6%) 4 (3.9%) 102
Symptomatic 52 (57.1%) 2 (2.2%) 29 (31.9%) 4 (4.4%) 2 (2.2%) 2 (2.2%) 91
AIDS 26 (48.1%) 17 (31.5%) 2 (3.7%) 2 (3.7%) 1 (1.9%) 2 (3.7%) 4 (7.4%) 54
AIDS Related Death 1 (33.3%) 2 (66.7%) 3
Death Unrelated to AIDS 1 (100%) 1
Unknown 157 (56.1%) 6 (2.1%) 62 (22.1%) 1 (0.4%) 4 (1.4%) 8 (2.9%) 10 (3.6%) 32 (11.4%) 280
HIV
Exp
osu
re
Ab
road
UK 240 (82.8%) 5 (1.7%) 17 (5.9%) 3 (1%) 4 (1.4%) 8 (2.8%) 13 (4.5%) 290
Abroad 43 (25.3%) 2 (1.2%) 94 (55.3%) 7 (4.1%) 2 (1.2%) 8 (4.7%) 14 (8.2%) 170
Unknown 30 (42.3%) 1 (1.4%) 21 (29.6%) 3 (4.2%) 3 (4.2%) 2 (2.8%) 11 (15.5%) 71
Total 313 (58.9%) 8 (1.5%) 132 (24.9%) 7 (1.3%) 6 (1.1%) 9 (1.7%) 18 (3.4%) 38 (7.2%) 531

29
Table 2.7: Global region of exposure by infection route for new HIV and AIDS cases, 2014
Men who were exposed through sex with men (MSM) and are also injecting drug users are included in the MSM category.
Table 2.8: Distribution of treatment for new HIV and AIDS cases by infection route, 2014
Treatment Centre
Infection Route Total
(100%) MSM Injecting Drug Use
Hetero-sexual
Blood/ Tissue
Mother to Child
Undeter-mined
BURY 3 (75%) 1 (25%) 4 STP 12 (75%) 3 (18.8%) 1 (6.2%) 16 TRAG 1 (50%) 1 (50%) 2
For a definition of the abbreviated statutory treatment centres please refer to the glossary at the back of the report. Columns cannot be totalled as some individuals may attend two or more treatment locations, thus exaggerating the totals. Men who were exposed through sex with men (MSM) and are also injecting drug users are included in the MSM category.
Region of HIV Exposure
Infection Route Total
(100%) MSM Injecting Drug Use
Hetero- sexual
Blood/ Tissue
Mother to Child
Undeter- mined
Abroad 35 (20.6%) 1 (0.6%) 125 (73.5%) 3 (1.8%) 5 (2.9%) 1 (0.6%) 170
Caribbean 1 1 2
East Asia & Pacific 1 1
Eastern Europe & Central Asia 5 1 3 1 10
Latin America 2 1 3
North Africa & Middle East 1 1 2
North America 1 1
Oceania 3 3
South & South-East Asia 2 11 1 14
Sub-Saharan Africa 3 100 1 3 1 108
Western Europe 18 8 26
UK 235 (81%) 4 (1.4%) 43 (14.8%) 1 (0.3%) 1 (0.3%) 6 (2.1%) 290
Unknown 31 (43.7%) 30 (42.3%) 1 (1.4%) 9 (12.7%) 71
Total 301 (56.7%) 5 (0.9%) 198 (37.3%) 4 (0.8%) 7 (1.3%) 16 (3%) 531

30
Table 2.9: Residency status of new cases by sex, age group, infection route, ethnicity, stage of HIV disease and area of residence,
2014
Men who were exposed through sex with men (MSM) and are also injecting drug users are included in the MSM category. Age groups refer to the age of individuals at the end of December 2014, or at death. * Includes residency status defined as ‘Migrant Worker’, ‘Dependent’, and ‘Other’.
Residency Status Total
UK National Asylum Seeker
Overseas Student
Temporary Visitor
Refugee Other* Unknown
Sex Male 152 (86.4%) 4 (44.4%) 3 (75%) 4 (57.1%) 10 (62.5%) 228 (71.5%) 401
Female 24 (13.6%) 5 (55.6%) 1 (25%) 3 (42.9%) 6 (37.5%) 91 (28.5%) 130
Age
Gro
up
0-14 1 (11.1%) 1 (14.3%) 2 (0.6%) 4
15-19 2 (1.1%) 2 (0.6%) 4
20-24 26 (14.8%) 2 (22.2%) 27 (8.5%) 55
25-29 33 (18.8%) 1 (11.1%) 4 (25%) 54 (16.9%) 92
30-34 28 (15.9%) 1 (11.1%) 1 (25%) 3 (18.8%) 57 (17.9%) 90
35-39 27 (15.3%) 1 (11.1%) 2 (50%) 1 (14.3%) 6 (37.5%) 62 (19.4%) 99
40-44 24 (13.6%) 1 (11.1%) 1 (25%) 1 (14.3%) 2 (12.5%) 43 (13.5%) 72
45-49 14 (8%) 2 (22.2%) 1 (14.3%) 32 (10%) 49
50-54 13 (7.4%) 2 (28.6%) 24 (7.5%) 39
55-59 4 (2.3%) 1 (14.3%) 1 (6.3%) 7 (2.2%) 13
60+ 5 (2.8%) 9 (2.8%) 14
Infe
ctio
n R
ou
te MSM 126 (71.6%) 2 (50%) 1 (14.3%) 6 (37.5%) 166 (52%) 301
Injecting Drug Use 3 (1.7%) 2 (0.6%) 5
Heterosexual 39 (22.2%) 8 (88.9%) 2 (50%) 5 (71.4%) 10 (62.5%) 134 (42%) 198
Blood/Tissue 1 (0.6%) 3 (0.9%) 4
Mother to Child 1 (1.11%) 1 (14.3%) 5 (1.6%) 7
Unknown 7 (4%) 9 (2.8%) 16
Eth
nic
ity
White 149 (84.7%) 1 (25%) 6 (37.5%) 157 (49.2%) 313
Black Caribbean 2 (1.1%) 1 (6.3%) 5 (1.6%) 8
Black African 19 (10.8%) 7 (77.8%) 2 (50%) 7 (100%) 7 (43.8%) 90 (28.2%) 132
Black Other 1 (6.2%) 6 (1.9%) 7
Indian/Pakistani/Bangladeshi
6 (1.9%) 6
Other Asian/Oriental 1 (0.6%) 1 (11.1%) 7 (2.2%) 9
Other/Mixed 2 (1.1%) 1 (11.1%) 1 (25%) 1 (6.3%) 13 (14.1%) 18
Unknown 3 (1.7%) 35 (11%) 38
Stag
e o
f H
IV
Dis
eas
e
Asymptomatic 83 (47.2%) 2 (22.2%) 2 (50%) 5 (31.2%) 10 (3.1%) 102
Symptomatic 35 (19.9%) 2 (22.2%) 2 (28.6%) 7 (43.8%) 45 (14.1%) 91
AIDS 16 (9.1%) 2 (22.2%) 3 (18.8%) 33 (10.3%) 54
AIDS Related Death 1 (0.6%) 2 (0.6%) 3
Death Unrelated to AIDS 1 (0.6%) 1
Unknown 40 (22.7%) 3 (33.3%) 2 (50%) 5 (71.4%) 1 (6.3%) 229 (71.8%) 280
Total (100%) 176 9 4 7 16 319 531

31
3. All Cases 2014 During 2014, a total of 4,922 individuals living with HIV in
Greater Manchester accessed treatment and care from
reporting statutory treatment centres in Greater Manchester,
Cumbria, Lancashire and Liverpool, representing a 5% increase
in the size of the HIV positive population (from 4,682
individuals in 2013); the same as the increase seen between
2012 and 2013 (5%). The aim of this chapter is to provide
information on the demographics and characteristics of these
4,922 individuals and, where appropriate, references are
made to corresponding data from previous reports[1-18]
. For
reasons of confidentiality and space, it is not possible to
present all breakdowns at local authority (LA). However,
additional tables are available on the North West HIV and
AIDS Monitoring Unit website :( http://www.cph.org.uk/hiv/).
Epidemiology of HIV in Greater Manchester
The crude adult population prevalence (aged 15 -59 years) of
HIV based on all cases residing in Greater Manchester and
attending reporting statutory treatment centres within in the
north west of England during 2014§ was 278 per 100,000. The
population sizes for each LA used in the prevalence
calculations are taken from the Office for National Statistics
and are mid-2014 estimates based on 2011 census data. Two
LAs in Greater Manchester (Manchester and Salford) had an
adult prevalence greater than the threshold beyond which
testing is recommended in general settings including all
medical admissions and all new registrations in general
practice (2 per 1,000, i.e. 200 per 100,000). This threshold
(based on analysis from the USA) is deemed to be that at
which it is cost effective to screen the whole population[1]
.
Across the four local authorities commissioning this report;
Bury had the highest prevalence (196 per 100,000 population)
followed by Trafford, (192 per 100,000 population); Stockport,
(123 per 100,000 population) and Wigan, (110 per 100,000
population).
Figure 3.1 illustrates the global region and country of infection
for those 1,879 individuals living with HIV in Greater
Manchester who presented for treatment in 2014 and who
probably acquired their HIV abroad. Of all the infections
contracted outside the United Kingdom, 75% were contracted
in sub-Saharan Africa. This high proportion reflects the impact
of the pandemic in sub-Saharan Africa where the prevalence
of HIV is extremely high[24]
. Seven percent of people who were
infected abroad were infected in South and South-East Asian
and Western Europe individually. The exact country of
infection is known for 1,793 individuals (95%). Infections
§ Prevalence per 100,000 adult population (aged 15-59 years)
calculations exclude those with unknown area of residence and those living outside the region.
acquired outside the UK were spread across 96 different
countries, with a third contracted in Zimbabwe (33%).
Exposure in sub-Saharan Africa was spread across 34
countries. Nigeria represents the second largest number of
infections acquired outside the UK (129 individuals, 7%)
followed by Thailand (80 individuals, 4%). Of those exposed in
Western Europe, the largest number were infected in Spain
(39 individuals), reflecting the extent of the Spanish
epidemic[142]
, the large number of people who travel between
the United Kingdom and Spain, and the increased propensity
to take risks when on holiday[143, 144]
.
Table 3.1 shows the infection route and sex of all Greater
Manchester HIV and AIDS cases presenting for treatment in
2014, categorised by age group, stage of HIV disease and
ethnicity. Sex between men (MSM) remains the most
common route of infection amongst people with HIV (52% of
all cases). However the proportion of people infected through
heterosexual sex has increased over the past 17 years, from
13% in 1996 to 42% in 2014. The percentage of individuals
exposed to HIV via injecting drug use (IDU), those infected by
contaminated blood or tissue and vertical transmission all
remain low at 2% or less for each transmission route.
On average, those who were infected through heterosexual
sex were slightly younger (median age 42 years) than those
infected through MSM (43 years). The overall age distribution
is concentrated in the 30-49 year age range, accounting for
two thirds of all cases (65%) and shows little deviation from
previous years. New cases were more likely to be under 25
years (12%, see chapter 2, table 2.1) compared to all cases
(5%). The proportion of HIV positive individuals in the older
age groups (50 years and over) has increased slightly each
year (from 18% in 2012 to 22% in 2013 and 24% in 2014) and
is a large increase from 6% in 1996. This ageing cohort effect is
likely to be due to the effectiveness of antiretroviral therapy
and subsequent improved prognosis and longevity of many
HIV positive individuals.
The proportion of individuals with HIV who died during the
year decreased from 8% in 1996 to less than 1% in 2014. Of
the 19 individuals who died in 2014, over half (58%) died of an
AIDS-related condition (slightly higher than the proportion in
2013; 53%) and eight (42%) died from other causes.
Amongst those for whom ethnicity was known (4,845 individuals), 60% were white. Those from black and minority ethnic (BME) communities make up 40% of the total Greater Manchester HIV positive population accessing care, with black Africans representing the greatest proportion within BME groups (82%).

32
Table 3.2 shows LA and county of residence by infection
route. MSM continues to be the dominant mode of HIV
transmission (52%) amongst those with HIV who are resident
in Greater Manchester. Across the four commissioning
Greater Manchester LAs MSM was the main mode of
exposure for all LAs except Wigan where a higher proportion
of cases (53%) were acquired through heterosexual sex. IDU is
the mode of transmission for 2% of Greater Manchester cases
accessing treatment and care in 2014 (96 individuals).
Table 3.3 illustrates the LA, county of residence and clinical
stage of HIV disease for all Greater Manchester HIV and AIDS
cases presenting for treatment in 2014. The data refer to the
clinical condition of individuals when last seen in 2014;
individuals who died are presented in separate categories. The
proportion of people at different stages of HIV disease will
impact on the funding of HIV treatment and care, since those
at a more advanced stage require more hospital care[145]
.
There is variation between stages of disease (where the stage
is known) across LAs, from 45% of Bury residents presenting
as asymptomatic to 29% for Wigan.
Table 3.4 gives a breakdown of ethnicity and county by
infection route and sex. Of those infected through
heterosexual sex 79% were from BME/mixed background,
compared with 20% who were of white ethnicity. In contrast,
of those infected via MSM, 92% were of white ethnicity and
only 7% were from BME/mixed ethnic backgrounds.
Individuals of BME/mixed ethnicity are substantially over-
represented amongst the HIV positive population when
compared to their proportion in the population as a whole
(39% of all cases, compared to 16% of the Greater Manchester
population)[146]
. Prevalence in BME communities is just over
three times higher than in the white population.
Table 3.5 shows a breakdown of age by ethnicity for all HIV
positive residents of Greater Manchester. White individuals
tended to be older (27% aged 50 years and over) than black
African individuals (18% aged 50 years and over).
Table 3.6 shows the distribution of total HIV and AIDS cases by
stage of HIV disease, county and level of antiretroviral therapy
(ART). The largest proportion of individuals (57%) were using
triple therapy, followed by 28% using quadruple or more. In
total, 86% of Greater Manchester residents were on ART.
Amongst those who were asymptomatic, 81% were on ART.
Table 3.7 gives a breakdown of ethnicity by sex, stage of HIV
disease and whether or not individuals acquired HIV abroad.
Although overall there were more males (72%) than females
living with HIV, two thirds (65%) of black Africans living with
HIV were female. The largest proportion of HIV positive
individuals, where the stage was recorded, were
asymptomatic (41%), followed by symptomatic individuals
(35%). A similar proportion of white HIV positive individuals
(41%) and black African individuals (40%) were asymptomatic
(where stage of HIV was known). In contrast to the 11% of
white individuals infected abroad, 79% of those classed as
from BME groups were exposed to HIV abroad.
Table 3.8 illustrates the global region of exposure and route of
infection of all HIV cases. Over one third (38%) of all cases
reported were exposed to HIV abroad. The majority (82%) of
those infected abroad were infected through heterosexual sex
and the vast majority of these cases were infected in sub-
Saharan Africa (85%). Heterosexual sex was the most common
route of infection in those infected in sub-Saharan Africa
(93%), the Caribbean (83%), South and South-East Asia (78%),
North Africa and Middle East (60%), East Asia and Pacific
(57%) and Eastern Europe and Central Asia (43%). In contrast,
those infected in Oceania (88%), North America (71%), Latin
America (65%) and Western Europe (60%) were more likely to
be infected via MSM.
Care of HIV positive people by statutory treatment centres
Table 3.9 presents the number of HIV positive people seeking
care by infection route and treatment centre within
commissioning local authorities (for a definition of the
abbreviated treatment centres, see the glossary). Across
commissioning centres, The Choices Centre, Stockport (STP)
saw the largest number of HIV positive individuals (143
individuals). There is some variation in the profile of HIV
positive individuals between different treatment centres with
the majority of individuals attending STP and TRAG exposed to
HIV through MSM whilst the majority of individuals at BURY
were exposed through heterosexual sex.
Table 3.10 refers to the highest level of ART prescribed by
specific treatment centres during 2014. The majority of
individuals at both centres which prescribe ART; STP and
BURY, were prescribed triple ART or more (89% and 86%
respectively). There are few individuals prescribed mono or
dual therapy in accordance with the latest British HIV
Association guidelines[119].
Table 3.11 illustrates the distribution of all HIV cases
presenting in Greater Manchester for treatment in 2014 by
commissioning LA of residence and the number of statutory
treatment centres attended. The majority (93%) attended only
one treatment centre. Attendance at multiple treatment
centres could be due to a change in residence or
simultaneously accessing treatment and care from more than
one treatment centre.
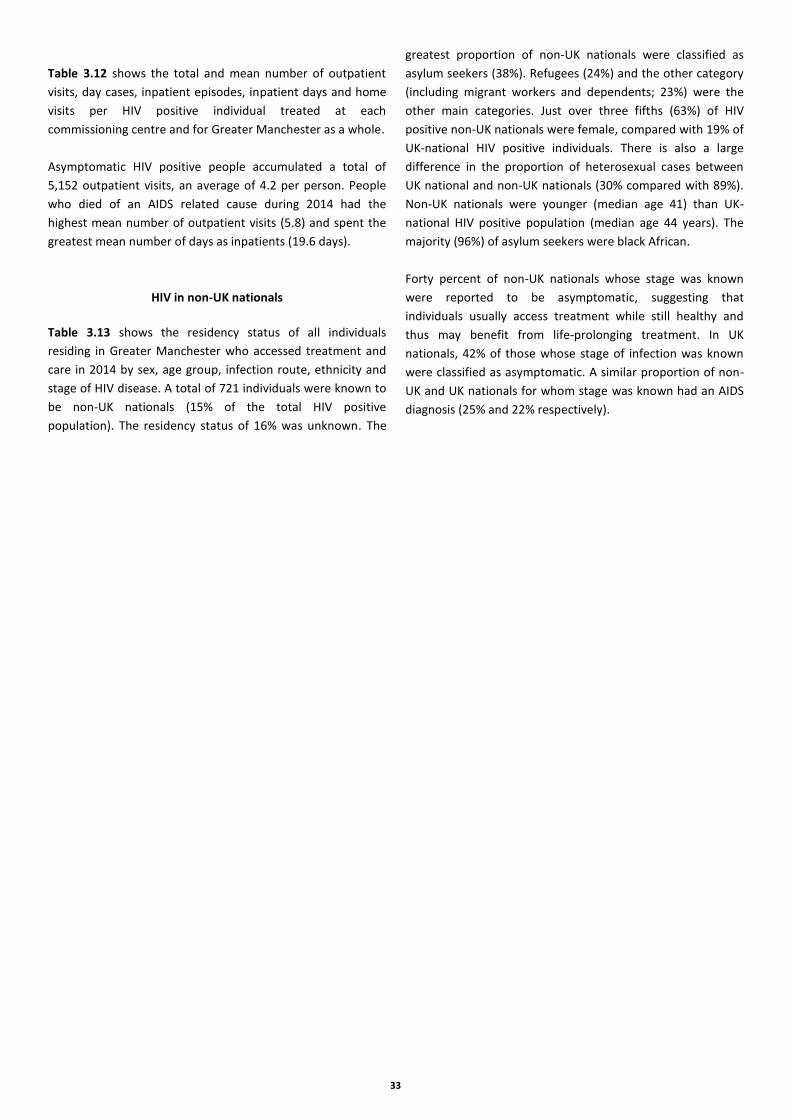
33
Table 3.12 shows the total and mean number of outpatient
visits, day cases, inpatient episodes, inpatient days and home
visits per HIV positive individual treated at each
commissioning centre and for Greater Manchester as a whole.
Asymptomatic HIV positive people accumulated a total of
5,152 outpatient visits, an average of 4.2 per person. People
who died of an AIDS related cause during 2014 had the
highest mean number of outpatient visits (5.8) and spent the
greatest mean number of days as inpatients (19.6 days).
HIV in non-UK nationals
Table 3.13 shows the residency status of all individuals
residing in Greater Manchester who accessed treatment and
care in 2014 by sex, age group, infection route, ethnicity and
stage of HIV disease. A total of 721 individuals were known to
be non-UK nationals (15% of the total HIV positive
population). The residency status of 16% was unknown. The
greatest proportion of non-UK nationals were classified as
asylum seekers (38%). Refugees (24%) and the other category
(including migrant workers and dependents; 23%) were the
other main categories. Just over three fifths (63%) of HIV
positive non-UK nationals were female, compared with 19% of
UK-national HIV positive individuals. There is also a large
difference in the proportion of heterosexual cases between
UK national and non-UK nationals (30% compared with 89%).
Non-UK nationals were younger (median age 41) than UK-
national HIV positive population (median age 44 years). The
majority (96%) of asylum seekers were black African.
Forty percent of non-UK nationals whose stage was known
were reported to be asymptomatic, suggesting that
individuals usually access treatment while still healthy and
thus may benefit from life-prolonging treatment. In UK
nationals, 42% of those whose stage of infection was known
were classified as asymptomatic. A similar proportion of non-
UK and UK nationals for whom stage was known had an AIDS
diagnosis (25% and 22% respectively).

34
Figure 3.1: Global region and country of infection for all HIV and AIDS cases in Greater Manchester who probably acquired their
infection outside the UK, 2014
Sub-Saharan Africa 1411 (75.1%) South & South-East Asia 124 (6.6%) Western Europe 136 (7.2%)
Angola 14 (0.7%) Bangladesh 2 (0.1%) Austria 1 (0.1%) Botswana 18 (1%) India 12 (0.6%) Balearics 1 (0.1%) Burundi 6 (0.3%) Indonesia 1 (0.1%) Belgium 4 (0.2%) Cameroon 38 (2%) Iran 5 (0.3%) Canary Islands 5 (0.3%) Cape Verde 1 (0.1%) Pakistan 14 (0.7%) Eire 6 (0.3%) Central African Republic 1 (0.1%) Philippines 3 (0.2%) Finland 1 (0.1%) Chad 1 (0.1%) Singapore 1 (0.1%) France 11 (0.6%) Congo 39 (2.1%) Thailand 80 (4.3%) Germany 9 (0.5%) Cote d’Ivoire 14 (0.7%) Vietnam 1 (0.1%) Gibraltar 1 (0.1%) Dem. Republic of Congo 22 (1.2%) Multiple 2 (0.1%) Greece 1 (0.1%) Equatorial Guinea 1 (0.1%) Unknown 3 (0.2%) Italy 11 (0.6%)
Eritrea 16 (0.9%) Malta 1 (0.1%)
Ethiopia 23 (1.2%) Eastern Europe & Central Asia 40 (2.1%) Netherlands 10 (0.5%)
Gambia 10 (0.5%) Belarus 1 (0.1%) Portugal 29 (1.5%) Ghana 24 (1.3%) Croatia 1 (0.1%) Slovenia 1 (0.1%) Guinea 2 (0.1%) Czech Republic 1 (0.1%) Spain 39 (2.1%) Kenya 36 (1.9%) Estonia 2 (0.1%) Multiple 3 (0.2%) Lesotho 1 (0.1%) Hungary 1 (0.1%) Unknown 2 (0.1%)
Liberia 2 (0.1%) Latvia 9 (0.5%)
Malawi 112 (6%) Lithuania 1 (0.1%) North Africa & Middle East 30 (1.6%) Mauritius 2 (0.1%) Poland 18 (1%) Cyprus 3 (0.2%) Mozambique 6 (0.3%) Romania 4 (0.2%) Egypt 4 (0.2%) 259 Namibia 1 (0.1%) Russian Federation 2 (0.1%) Iraq 2 (0.1%)
Nigeria 129 (6.9%) Jordan 1 (0.1%)
Rwanda 12 (0.6%) Oceania 9 (0.5%) Kuwait 1 (0.1%)
Sierra Leone 12 (0.6%) Australia 8 (0.4%) Libyan Arab Jamahiriya 3 (0.2%) Somalia 18 (1%) New Zealand 1 (0.1%) Morocco 4 (0.2%)
South Africa 72 (3.8%) Sudan 10 (0.5%)
Swaziland 1 (0.1%) North America 31 (1.6%) Yemen 1 (0.1%)
Tanzania 16 (0.9%) Canada 5 (0.3%) Unknown 1 (0.1%)
Togo 1 (0.1%) United States of America 26 (1.4%)
Uganda 35 (1.9%) Caribbean 30 (1.6%)
Zambia 80 (4.3%) Latin America 17 (0.9%) Barbados 2 (0.1%)
Zimbabwe 613 (32.6%) Argentina 1 (0.1%) Cuba 1 (0.1%) Unknown 32 (1.7%) Brazil 6 (0.3%) Jamaica 24 (1.3%)
Chile 1 (0.1%) Unknown 3 (0.2%)
East Asia & Pacific 7 (0.4%) Colombia 3 (0.2%)
China 3 (0.2%) Guyana 1 (0.1%) Multiple 33 (1.8%)
Fiji 2 (0.1%) Mexico 4 (0.2%) Unknown 11 (0.6%)
Hong Kong 1 (0.1%) Venezuela 1 (0.1%)
Taiwan 1 (0.1%) Total 1879
Total: 1879
North America 31 (1.6%)
Caribbean 30 (1.6%)
Latin America 17 (0.9%)
Western Europe 136 (7.2%)
North Africa & Middle East
30 (1.6%)
Sub-Saharan Africa 1411 (75.1%)
Eastern Europe & Central Asia
40 (2.1%) East Asia & Pacific
7 (0.4%)
South & South-East Asia 124 (6.6%) Oceania
9 (0.5%)
Multiple: 33 (1.8%) Unknown: 11 (0.6%)

35
Table 3.1: Age distribution, stage of HIV disease and ethnicity of all HIV and AIDS cases by infection route and sex 2014
Men who were exposed through sex with men (MSM) and are also injecting drug users are included in the MSM category. Age groups refer to the age of individuals at the end of December 2014, or at death.
Infection Route
Total (100%)
MSM Injecting Drug Use
Hetero- sexual
Blood/ Tissue
Mother to Child
Undeter- mined
M M F M F M F M F M F
Age
Gro
up
0-14 14 24 38
15-19 4 1 18 19 42
20-24 95 4 23 9 10 2 2 145
25-29 228 2 2 18 81 2 2 2 4 1 342
30-34 327 6 4 66 192 1 1 2 6 605
35-39 394 8 1 134 303 1 4 4 849
40-44 425 17 5 175 267 4 1 8 2 904
45-49 461 18 2 149 192 3 2 7 2 836
50-54 314 13 3 124 113 4 1 7 1 580
55-59 161 6 4 71 48 3 2 7 302
60+ 158 5 57 47 2 2 6 2 279
Stag
e o
f H
IV
Dis
eas
e
Asymptomatic 665 23 7 167 325 3 2 11 16 14 2 1235
Symptomatic 590 21 9 150 225 7 2 24 22 9 4 1063
AIDS 296 16 2 146 184 5 2 10 11 21 5 698
AIDS Related Death 4 1 5 1 11
Death Unrelated to AIDS 3 4 1 8
Unknown 1009 15 3 330 527 5 3 6 6 3 1907
Eth
nic
ity
White 2349 63 21 237 169 17 4 5 4 37 6 2912
Black Caribbean 24 1 19 28 1 73
Black African 31 5 477 981 1 2 33 48 6 4 1588
Black Other 6 1 3 10 2 22
Indian/Pakistani/Bangladeshi 33 25 15 2 2 1 78
Other Asian/Oriental 18 1 10 23 1 1 1 55
Other/Mixed 77 3 15 16 1 3 1 1 117
Unknown 29 1 12 25 1 2 4 3 77
Total 2567 75 21 798 1267 20 9 45 55 51 14 4922
% 52.2% 1.5% 0.4% 16.2% 25.7% 0.4% 0.2% 0.9% 1.1% 1.0% 0.3%

36
Table 3.2: Local authority of residence of all HIV and AIDS cases by infection route, 2014
Men who were exposed through sex with men (MSM) and are also injecting drug users are included in the MSM category.
Table 3.3: Local authority of residence of all HIV and AIDS cases by stage of HIV disease, 2014
Local Authority of Residence
Stage of HIV Disease Total
(100%) Asymptomatic Symptomatic AIDS
AIDS Related Death
Death Unrelated to AIDS
Unknown
Gre
ate
r
Man
che
ste
r
Wigan 28 (12.8%) 43 (19.6%) 26 (11.9%) 1 (0.5%) 121 (55.3%) 219
Bury 81 (34.8%) 59 (25.3%) 39 (16.7%) 54 (23.2%) 233
Trafford 63 (22.3%) 69 (24.4%) 43 (15.2%) 1 (0.4%) 107 (37.8%) 283
Stockport 71 (31.1%) 63 (27.6%) 33 (14.5%) 1 (0.4%) 60 (26.3%) 228
Unknown Greater Manchester 1 (100%) 1
Greater Manchester Total 1235 (25.1%) 1063 (21.6%) 698 (14.2%) 11 (0.2%) 8 (0.2%) 1907 (38.7%) 4922
Table 3.4: All HIV and AIDS cases by infection route, sex and ethnicity, 2014
Men who were exposed through sex with men (MSM) and are also injecting drug users are included in the MSM category.
Local Authority of Residence Infection Route
Total (100%) MSM
Injecting Drug Use
Hetero- sexual
Blood/ Tissue
Mother to Child
Undeter-mined
Gre
ate
r
Man
che
ste
r
Wigan 88 (40.2%) 4 (1.8%) 116 (53%) 3 (1.4%) 3 (1.4%) 5 (2.3%) 219
Bury 132 (56.7%) 3 (1.3%) 88 (37.8%) 1 (0.4%) 3 (1.3%) 6 (2.6%) 233
Trafford 153 (54.1%) 7 (2.5%) 109 (38.5%) 3 (1.1%) 8 (2.8%) 3 (1.1%) 283
Stockport 146 (64%) 3 (1.3%) 68 (29.8%) 3 (1.3%) 6 (2.6%) 2 (0.9%) 228
Unknown Greater Manchester 1 (100%) 1
Greater Manchester Total 2567 (52.2%) 96 (2%) 2065 (42%) 29 (0.6%) 100 (2%) 65 (1.3%) 4922
Ethnicity
Infection Route
Total (100%)
MSM Injecting Drug Use Hetero- sexual
Blood/ Tissue
Mother to Child
Undeter- mined
M M F M F M F M F M F
Gre
ate
r M
anch
est
er
White 2349 63 21 237 169 17 4 5 4 37 6 2912
BME/mixed 189 11 549 1073 3 4 38 51 10 5 1933
Unknown 29 1 12 25 1 2 4 3 77
Total 2567 75 21 798 1267 20 9 45 55 51 14 4922
% 52.2% 1.5% 0.4% 16.2% 25.7% 0.4% 0.2% 0.9% 1.1% 1.0% 0.3%
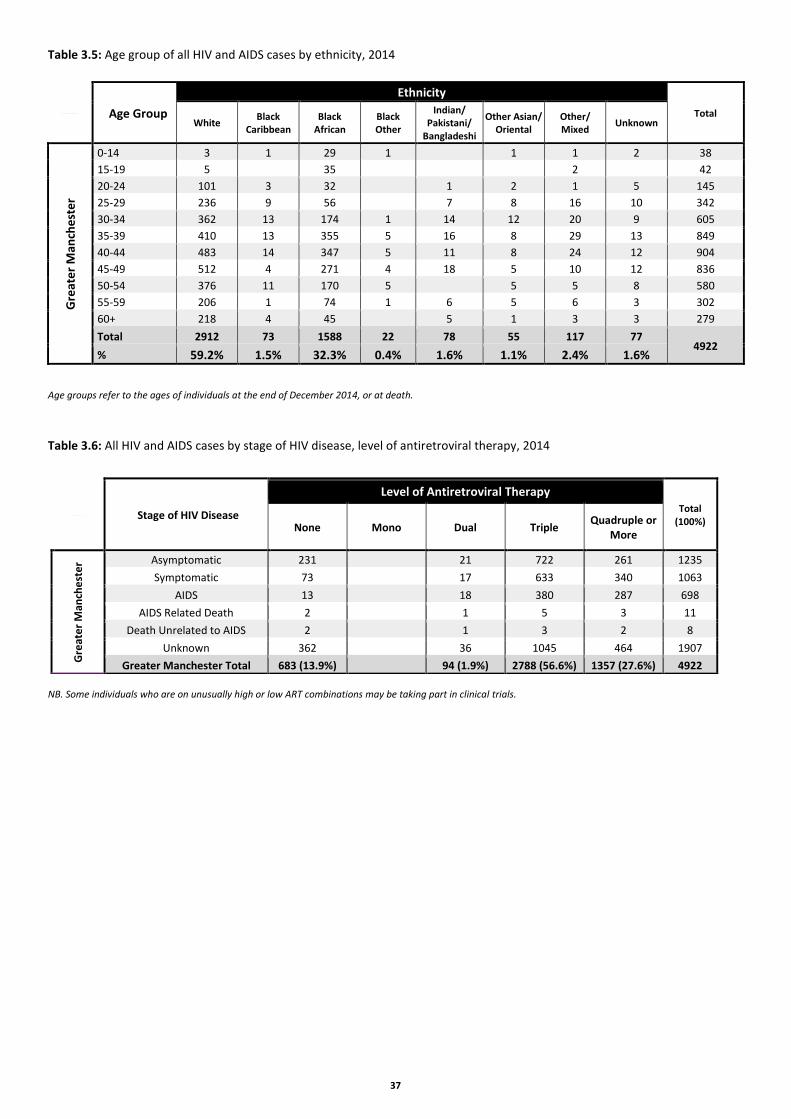
37
Table 3.5: Age group of all HIV and AIDS cases by ethnicity, 2014
Age Group
Ethnicity
Total White
Black Caribbean
Black African
Black Other
Indian/ Pakistani/
Bangladeshi
Other Asian/ Oriental
Other/ Mixed
Unknown
Gre
ate
r M
anch
est
er
0-14 3 1 29 1 1 1 2 38
15-19 5 35 2 42
20-24 101 3 32 1 2 1 5 145
25-29 236 9 56 7 8 16 10 342
30-34 362 13 174 1 14 12 20 9 605
35-39 410 13 355 5 16 8 29 13 849
40-44 483 14 347 5 11 8 24 12 904
45-49 512 4 271 4 18 5 10 12 836
50-54 376 11 170 5 5 5 8 580
55-59 206 1 74 1 6 5 6 3 302
60+ 218 4 45 5 1 3 3 279
Total 2912 73 1588 22 78 55 117 77 4922
% 59.2% 1.5% 32.3% 0.4% 1.6% 1.1% 2.4% 1.6%
Age groups refer to the ages of individuals at the end of December 2014, or at death.
Table 3.6: All HIV and AIDS cases by stage of HIV disease, level of antiretroviral therapy, 2014
NB. Some individuals who are on unusually high or low ART combinations may be taking part in clinical trials.
Stage of HIV Disease
Level of Antiretroviral Therapy Total
(100%) None Mono Dual Triple
Quadruple or More
Gre
ate
r M
anch
est
er Asymptomatic 231 21 722 261 1235
Symptomatic 73 17 633 340 1063
AIDS 13 18 380 287 698
AIDS Related Death 2 1 5 3 11
Death Unrelated to AIDS 2 1 3 2 8
Unknown 362 36 1045 464 1907
Greater Manchester Total 683 (13.9%) 94 (1.9%) 2788 (56.6%) 1357 (27.6%) 4922

38
Table 3.7: Ethnic distribution of all HIV and AIDS cases by sex, stage of HIV disease and exposure abroad, 2014
Table 3.8: Global region of HIV exposure by infection route of all HIV and AIDS cases, 2014
Men who were exposed through sex with men (MSM) and are also injecting drug users are included in the MSM category.
Ethnicity
Total (100%) White
Black Caribbean
Black African Black Other
Indian/ Pakistani/
Bangladeshi
Other Asian/
Oriental
Other/ Mixed
Unknown
Sex Male 2708 (76.2%) 44 (1.2%) 553 (15.6%) 12 (0.3%) 62 (1.7%) 30 (0.8%) 99 (2.8%) 48 (1.3%) 3556
Female 204 (14.9%) 29 (2.1%) 1035 (75.8%) 10 (0.7%) 16 (1.2%) 25 (1.8%) 18 (1.3%) 29 (2.1%) 1366
Stag
e o
f H
IV
Dis
eas
e
Asymptomatic 762 (61.7%) 14 (1.1%) 386 (31.3%) 4 (0.3%) 19 (1.5%) 11 (0.9%) 27 (2.2%) 12 (1%) 1235
Symptomatic 689 (64.8%) 4 (0.4%) 318 (29.9%) 8 (0.8%) 9 (0.8%) 6 (0.6%) 24 (2.3%) 5 (0.5%) 1063
AIDS 387 (55.4%) 7 (1%) 258 (37%) 5 (0.7%) 12 (1.7%) 15 (2.1%) 7 (1%) 7 (1%) 698
AIDS Related Death 6 (54.5%) 5 (45.5%) 11
Death Unrelated to AIDS 7 (87.5%) 1 (12.5%) 8
Unknown 1061 (55.6%) 48 (2.5%) 620 (32.5%) 5 (0.3%) 38 (2%) 23 (1.2%) 59 (3.1%) 53 (2.8%) 1907
Exp
osu
re
Ab
road
UK 2399 (88.8%) 35 (1.3%) 124 (4.6%) 7 (0.3%) 33 (1.2%) 16 (0.6%) 52 (1.9%) 37 (1.4%) 2703
Abroad 334 (17.8%) 28 (1.5%) 1369 (72.9%) 14 (0.7%) 33 (1.8%) 34 (1.8%) 44 (2.3%) 23 (1.2%) 1879
Unknown 179 (52.6%) 10 (2.9%) 95 (27.9%) 1 (0.3%) 12 (3.5%) 5 (1.5%) 21 (6.2%) 17 (5%) 340
Total 2912 (59.2%) 73 (1.5%) 1588 (32.3%) 22 (0.4%) 78 (1.6%) 55 (1.1%) 117 (2.4% 77 (1.6%) 4922
Region of HIV Exposure
Infection Route Total (100%)
MSM Injecting Drug Use
Hetero- sexual
Blood/ Tissue
Mother to Child
Undeter- mined
Abroad 221 (11.8%) 27 (1.4%) 1541 (82%) 11 (0.6%) 67 (3.6%) 12 (0.6%) 1879
Caribbean 4 25 1 30
East Asia & Pacific 3 4 7
Eastern Europe & Central Asia 11 8 17 1 2 1 40
Latin America 11 1 5 17
North Africa & Middle East 7 2 18 1 2 30
North America 22 1 7 1 31
Oceania 8 1 9
South & South-East Asia 24 1 97 2 124
Sub-Saharan Africa 26 4 1306 6 61 8 1411
Western Europe 81 9 45 1 136
Multiple 19 11 3 33
Unknown 5 6 11
UK 2168 (80.2%) 65 (2.4%) 386 (14.3%) 18 (0.7%) 30 (1.1%) 36 (1.3%) 2703
Unknown 178 (52.4%) 4 (1.2%) 138 (40.6%) 3 (0.9%) 17 (5%) 340
Total 2567 (52.2%) 96 (2%) 2065 (42%) 29 (0.6%) 100 (2%) 65 (1.3%) 4922

39
Table 3.9: Distribution of treatment for all HIV and AIDS cases by infection route, 2014
Treatment Centre
Infection Route
Total (100%) MSM
Injecting Drug Use
Hetero-sexual
Blood/ Tissue
Mother to Child
Undeter- mined
BURY 33 (40.7%) 47 (58%) 1 (1.2%) 81
STP 81 (56.6%) 1 (0.7%) 58 (40.6%) 1 (0.7%) 2 (1.4%) 143
TRAG 8 (80%) 2 (20%) 10
For a definition of the abbreviated treatment centres please refer to the glossary at the back of the report. Columns cannot be totalled vertically as some individuals may appear in more than one row (i.e. those attending two or more treatment locations), thus exaggerating the totals. Men who were exposed through sex with men (MSM) and are also injecting drug users are included in the MSM category.
Table 3.10: Distribution of treatment for all HIV and AIDS cases by level of antiretroviral therapy, 2014
NB Some individuals who are on unusually high or low ART combinations may be taking part in clinical trials. Columns cannot be totalled vertically as some individuals may appear in more than one row (i.e. those attending two or more treatment locations), thus exaggerating the totals.
Table 3.11: Local authority of residence of all HIV and AIDS cases by number of treatment centres attended, 2014
Treatment Centre
Level of Antiretroviral Therapy Total
(100%) None Mono Dual Triple Quadruple
or More
BURY 9 (11.1%) 2 (2.5%) 58 (71.6%) 12 (14.8%) 81 STP 16 (11.2%) 88 (61.5%) 39 (27.3%) 143 TRAG 10 (100%) 10
Local Authority of Residence Treatment Centres Attended Total
(100%) One Two Three
Gre
ate
r
Man
che
ste
r Wigan 211 (96.3%) 8 (3.7%) 219
Bury 218 (93.6%) 15 (6.4%) 233
Trafford 258 (91.2%) 25 (8.8%) 283
Stockport 215 (94.3%) 13 (5.7%) 228
Unknown Greater Manchester 1 (100%) 1
Greater Manchester Total 4580 (93.1%) 336 (6.8%) 6 (0.1%) 4922

40
Table 3.12: Distribution of total and mean number of outpatient visits, day cases, inpatient episodes, inpatient days and home
visits by treatment centre and stage of HIV disease, 2014
Outpatient Visits
Day Cases
Inpatient Episodes
Inpatient Days Home Visits
Total Mean Total Mean Total Mean Total Mean Total Mean
Ce
ntr
e BURY 361 4.46 STP 541 3.78 1 0.01 10 0.07 TRAG 16 1.6
Asymptomatic 5152 4.19 43 0.06 120 0.10 500 0.40
Stag
e o
f H
IV
Dis
eas
e
Symptomatic 4706 4.44 6 0.01 176 0.17 703 0.66 AIDS 3100 4.45 4 0.02 229 0.33 977 1.40 8 0.04 AIDS Related Death 64 5.82 11 1 216 19.64 Death Unrelated to AIDS 32 4 19 2.38 93 11.63 Unknown 6641 3.48 6 0.003 129 0.07 Total 19695 4.01 53 0.02 561 0.11 2618 0.53 8 0.002

41
Table 3.13: Residency status of all cases of HIV and AIDS by sex, age group, infection route, ethnicity and stage of HIV disease,
2014
Men who were exposed through sex with men (MSM) and are also injecting drug users are included in the MSM category. Age groups refer to the ages of individuals at the end of December 2014, or at death. *Includes residency status defined as ‘Migrant worker’, ‘Dependant’ and ‘Other’.
Residency Status Total
UK National Asylum Seeker Overseas Student
Temporary Visitor
Refugee Other* Unknown
Sex Male 2761 (80.6%) 87 (32.1%) 35 (39.3%) 11 (39.3%) 62 (36.5%) 70 (42.9%) 530 (68.4%) 3556
Female 665 (19.4%) 184 (67.9%) 54 (60.7%) 17 (60.7%) 108 (63.5%) 93 (57.1%) 245 (31.6%) 1366
Age
Gro
up
0-14 23 (0.7%) 2 (0.7%) 1 (0.6%) 4 (2.5%) 8 (1%) 38
15-19 19 (0.6%) 1 (0.4%) 2 (1.2%) 7 (4.3%) 13 (1.7%) 42
20-24 84 (2.5%) 6 (2.2%) 7 (4.3%) 48 (6.2%) 145
25-29 200 (5.8%) 7 (2.6%) 6 (6.7%) 8 (4.7%) 11 (6.7%) 110 (14.2%) 342
30-34 394 (11.5%) 37 (13.7%) 14 (15.7%) 3 (10.7%) 16 (9.4%) 22 (13.5%) 119 (15.4%) 605
35-39 521 (15.2%) 73 (26.9%) 21 (23.6%) 4 (14.3%) 35 (20.6%) 42 (25.8%) 153 (19.7%) 849
40-44 630 (18.4%) 55 (20.3%) 21 (23.6%) 6 (21.4%) 39 (22.9%) 29 (17.8%) 124 (16%) 904
45-49 619 (18.1%) 46 (17%) 16 (18%) 9 (32.1%) 27 (15.9%) 20 (12.3%) 99 (12.8%) 836
50-54 445 (13%) 28 (10.3%) 7 (7.9%) 3 (10.7%) 19 (11.2%) 12 (7.4%) 66 (8.5%) 580
55-59 251 (7.3%) 7 (2.6%) 3 (3.4%) 1 (3.6%) 20 (11.8%) 5 (3.1%) 15 (1.9%) 302
60+ 240 (7%) 9 (3.3%) 1 (1.1%) 2 (7.1%) 3 (1.8%) 4 (2.5%) 20 (2.6%) 279
Infe
ctio
n R
ou
te MSM 2174 (63.5%) 5 (1.8%) 6 (6.7%) 4 (14.3%) 3 (1.8%) 30 (18.4%) 345 (44.5%) 2567
Injecting Drug Use 88 (2.6%) 1 (0.4%) 4 (2.5%) 3 (0.4%) 96
Heterosexual 1040 (30.4%) 260 (95.9%) 83 (93.3%) 24 (85.7%) 163 (95.9%) 111 (68.1%) 384 (49.5%) 2065
Blood/Tissue 24 (0.7%) 1 (0.6%) 4 (0.5%) 29
Mother to Child 53 (1.5%) 5 (1.8%) 4 (2.4%) 17 (10.4%) 21 (2.7%) 100
Undetermined 47 (1.4%) 18 (2.3%) 65
Eth
nic
ity
White 2533 (73.9%) 4 (1.5%) 4 (4.5%) 4 (14.3%) 28 (17.2%) 339 (43.7%) 2912
Black Caribbean 47 (1.4%) 2 (0.7%) 2 (2.2%) 2 (1.2%) 6 (3.7%) 14 (1.8%) 73
Black African 654 (19.1%) 259 (95.6%) 78 (87.6%) 23 (82.1%) 164 (96.5%) 111 (68.1%) 299 (38.6%) 1588
Black Other 13 (0.4%) 2 (1.2%) 7 (0.9%) 22
Indian/Pakistani/Bangladeshi 56 (1.6%) 2 (0.7%) 2 (2.2%) 1 (3.6%) 1 (0.6%) 2 (1.2%) 14 (1.8%) 78
Other Asian/Oriental 35 (1%) 2 (0.7%) 1 (0.6%) 3 (1.8%) 14 (1.8%) 55
Other/Mixed 69 (2%) 2 (0.7%) 3 (3.4%) 2 (1.2%) 11 (6.7%) 30 (3.9%) 117
Unknown 19 (0.6%) 58 (7.5%) 77
Stag
e o
f H
IV
Dis
ea
se
Asymptomatic 1003 (29.3%) 60 (22.1%) 14 (15.7%) 1 (3.6%) 27 (15.9%) 49 (30.1%) 81 (10.5%) 1235
Symptomatic 839 (24.5%) 47 (17.3%) 16 (18%) 5 (17.9%) 34 (20%) 29 (17.8%) 93 (12%) 1063
AIDS 513 (15%) 32 (11.8%) 14 (15.7%) 5 (17.9%) 19 (11.2) 24 (14.7%) 91 (11.7%) 698
AIDS Related Death 6 (0.2%) 1 (0.6%) 1 (0.6%) 3 (0.4%) 11
Death Unrelated to AIDS 7 (0.2%) 1 (0.1%) 8
Unknown 1058 (30.9%) 132 (48.7%) 45 (50.6%) 17 (60.7%) 89 (52.4%) 60 (36.8%) 506 (65.3%) 1907
Total (100%) 3426 271 89 28 170 163 775 4922

42
4. Community Sector 2014 Community Sector organisations continue to play a
fundamental role in providing support to people living with
HIV in the United Kingdom[69]
. In the north west of England,
community sector organisations provide a wide range of
services to people living with HIV including information,
financial assistance, outreach support, counselling, training,
complementary therapies, advocacy, support groups and help
lines as well as awareness-raising campaigns, free condoms
and fundraising,. Some also offer medical services such as
nurse-led sessions and outreach testing run by local NHS staff.
These organisations provide services for a wide variety of
people living with HIV and many run special sessions for
women, gay men, black Africans and young people. Many
organisations also provide care and support to the friends and
family of those affected by HIV.
Data continue to show that there is a small cohort of
individuals who access community services in the north west
of England and who do not appear to be known to the
statutory sector in the region. Past research has shown that
these individuals are significantly more likely to be living in
areas of high deprivation than those who accessed the
statutory sector alone, or statutory and community sector[147]
,
suggesting that community sector organisations continue to
provide support to some of the most susceptible people living
with HIV in the region.
During 2014, 2,537 HIV positive individuals were reported to
the North West HIV/AIDS Monitoring Unit by six community
sector organisations in the north west of England. There was a
slight increase in the overall number of individuals seen by the
community sector from 2013 to 2014 (1%; 2,537 compared
with 2,513).
The numbers included in this section are based on attributable
data provided by each community sector organisation. It is
important to note that this data will not necessarily fully
reflect the overall service provision since organisations often
provide support for all those affected by HIV (including
families, partners and carers of HIV positive people). Where
information relating to infection route and ethnicity was not
available from community sector providers, data have been
updated from the data submitted by statutory care providers.
Matching between databases relies on the same attributable
data being provided by the community and statutory sector,
underlining the need for accuracy in recording of soundex
codes, dates of birth and sex. Tables 4.1 and 4.2 illustrate the
key characteristics of individuals accessing care from each
community sector organisation, and will include some
duplicate counting as individuals may attend more than one
organisation. Table 4.3 presents the overall characteristics of
individuals accessing the community sector as a whole and
contains only unique individuals. Where appropriate,
reference is made to corresponding data from previous north
west of England reports [2-18]
.
Community sector organisations have contributed data to the
North West HIV/AIDS Monitoring Unit since 1995 and as
previously mentioned consistently appear to provide services
to a broader constituency than the statutory sector alone [2-18]
.
In 2014, 44% of individuals seen by community sector
organisations did not access care in the statutory sector and
26% of individuals have never been treated by the statutory
sector in the north west of England (table 4.3). This proportion
is higher than seen in previous years; however caution must
be taken when interpreting this increase as statutory services
in Cheshire and Merseyside (with the exception of Liverpool)
no longer commission the monitoring system. Individuals
accessing treatment at a Cheshire and Merseyside (outside of
Liverpool) treatment centre for the first time in 2014 are not
included in this data and the loss of information from these
services may account for some of this increase.
Table 4.1 illustrates demographic information on the number
of HIV positive individuals presenting to six community sector
organisations in the north west of England during 2014, and
the number who also presented at statutory agencies during
2014 or prior to 2014 (but not in 2014). The proportion of
clients seen by each community sector organisation fluctuated
considerably compared with the previous year; Renaissance
(23%), Body Positive Cheshire and North Wales (12%) and
George House Trust (1%) and saw an increase on client
numbers compared with 2013 while Sahir House (1%)
Barnardos (33%) and Armistead (65%) all saw a decrease in
client numbers .
There is some variation in the proportion of community sector
clients also seen by the statutory sector in 2014, ranging from
83% at Renaissance to 4% at Body Positive Cheshire and North
Wales. This figure for BPCNW must be interpreted with
caution; as previously noted, data was not provided for
Cheshire and Merseyside statutory treatment centres (with
the exception of Liverpool) in 2014 and this along with the
service also providing support for clients in Wales will
contribute to this small percentage. A notable number of
individuals have never been seen at statutory centres, for
example, 464 individuals seen at GHT have never had contact
with the statutory sector. These data suggest that the
community sector may be the sole provider of care and
support for a substantial number of HIV positive individuals.

43
Table 4.1 also categorises individuals accessing community
sector organisations in 2014 according to sex, age group,
infection route, ethnicity and residency. The majority of
clients seen at community organisations in 2014 were infected
through sex with men (54%; table 4.3) and MSM represented
the largest proportion of individuals presenting for support at
four community organisations providing data in 2014 (Body
Positive Cheshire & North Wales, 56%; GHT, 56%; ARM, 50%;
and Renaissance, 49%). For Sahir House the main route of
infection was heterosexual sex, (44%). At BARM the main
route of infection was mother to child (49%) followed by
heterosexual sex (36%) and a high proportion of service users
at BARM were female (80%). Four out of the six community
sector organisations (GHT, BPCNW, Sahir House and
Renaissance) reporting in 2014 had clients infected via
injecting drug use.
The majority of clients at all community sector organisations
were aged between 25 and 49 years with the exception of
BARM. BARM treated the most clients aged 14 years or under
(8 individuals, 13% of all those seen at BARM), as would be
expected for an organisation specialising in the needs of
young people. BARM provides support for families with young
people affected by HIV; in some cases the HIV positive client is
a parent, in other cases the young person. GHT saw the
highest number of clients aged 50 years or over (459
individuals).
The differing profiles and characteristics of HIV positive clients
accessing the north west of England community sector
organisations in part reflects the different range of services
provided and the varying strategies used to encourage HIV
positive people to use the services.
For most community sector organisations, the majority of
individuals seen in 2014 were of white ethnicity, (Body
Positive Cheshire & North Wales, 84%; Renaissance, 81%;
Sahir House, 65% GHT, 61%). BARM provided care for a high
proportion of HIV positive black Africans (95%) while GHT
provided care for the largest number of HIV positive black
Africans (629 individuals).
The majority of clients seen by community sector
organisations in 2014 were resident in the north west of
England, ranging from 99% at Renaissance, to 83% at ARM.
BP Cheshire and North Wales had the highest proportion of
clients from outside the region (30%), reflecting the proximity
of the organisation to Wales and the West Midlands and the
specific services it provides in North Wales.
Table 4.2 illustrates the crossover of care for HIV positive
individuals between the north west of England community
sector organisations and the statutory organisations during
2014. The distribution of statutory treatment and care of
community sector clients in part reflects the geographical
location of the community sector organisations. However, the
Infectious Disease Unit at North Manchester General Hospital
(NMG) and the Manchester Centre for Sexual Health (MRIG),
the two largest HIV treatment centres in the north west of
England, account for a significant number of presentations by
individuals accessing community sector organisations across
the whole region (441 and 459 presentations respectively).
Table 4.3 illustrates the sex, infection route, ethnicity and
residency status of HIV positive individuals accessing the
community sector in the north west of England in 2014 by
attendance at the statutory sector during the year. Unlike
table 4.1 and 4.2, this table only contains one record for each
individual rather than all those attending all organisations.
Due to the relatively high proportion of individuals for whom
infection route is unknown, the percentages in the table are
taken from those for whom the information is known. The
predominant route of exposure to HIV amongst community
sector clients during 2014 was sex between men, accounting
for 54% of cases. This is similar to the proportion for the
previous year (55%). Forty one percent of clients seen in the
community sector were infected through heterosexual sex (a
similar proportion to the previous year; 42%). This has
increased since 2001 when only 19% of community sector
clients acquired their HIV heterosexually. In 2014, the majority
of community sector clients were male (71%), primarily due to
the relatively high rates of HIV infection acquired through sex
between men. The majority of community sector clients are of
white ethnicity (64%) but this varies between services (table
4.1).
Table 4.3 also shows that 44% of individuals (1,105 out of
2,537) using community sector organisations did not attend a
statutory sector service during 2014 and 26% have never been
seen by the statutory sector. As previously stated some of this
increase on previous years can be accounted for by data no
longer being collected from Cheshire and Merseyside (with
the exception of Liverpool) treatment centres in 2014.
However, previous research suggests that the profile of those
who have never presented to the statutory sector is quite
distinct: they are less likely to be MSM; more likely to be black
African and more likely to be an asylum seeker[2-18,147].

44
Table 4.1: Attendance by HIV positive individuals at community sector organisation in the North West, by statutory sector
attendance, sex, age group, infection route, ethnicity, residency status and North West residency, 2014
Community Sector Organisation
ARM BARM BP Cheshire N.
Wales* GHT Renaissanceⱡ Sahir
Never seen 3 (50%) 28 (45.9%) 127 (43.8%) 464 (24.2%) 13 (14.9%) 41 (17.9%)
Seen in 2014 1 (16.7%) 31 (50.8%) 11 (3.8%) 1216 (63.4%) 72 (82.8%) 139 (60.7%)
Seen prior to 2014 2 (33.3%) 2 (3.3%) 152 (52.4%) 237 (12.4%) 2 (2.3%) 49 (21.4%)
Sex Male 4 (66.7%) 12 (19.7%) 230 (79.3%) 1369 (71.4%) 64 (73.6%) 147 (64.2%)
Female 2 (33.3%) 49 (80.3%) 60 (20.7%) 548 (28.6%) 23 (26.4%) 82 (35.8%)
Age
Gro
up
0-14 8 (13.1%) 1 (0.4%) 3 (0.2%)
15-19 17 (27.9%) 5 (2.1%) 7 (0.4%) 2 (0.9%)
20-24 6 (9.8%) 19 (7.8%) 51 (2.7%) 3 (3.4%) 13 (5.7%)
25-29 1 (16.7%) 20 (8.2%) 118 (6.2%) 5 (5.7%) 19 (8.3%)
30-34 1 (16.7%) 8 (13.1%) 30 (12.3%) 224 (11.7%) 9 (10.3%) 30 (13.1%)
35-39 10 (16.4%) 28 (11.5%) 346 (18%) 11 (12.6%) 32 (14%)
40-44 3 (50%) 4 (6.6%) 38 (15.6%) 364 (19%) 13 (14.9%) 33 (14.4%)
45-49 1 (16.7%) 4 (6.6%) 37 (15.2%) 345 (18%) 17 (19.5%) 36 (15.7%)
50-54 1 (1.6%) 24 (9.9%) 248 (12.9%) 10 (11.5%) 31 (13.5%)
55-59 18 (7.4%) 115 (6%) 13 (14.9%) 22 (9.6%)
60+ 3 (4.9%) 23 (9.5%) 96 (5%) 6 (6.9%) 11 (4.8%)
Infe
ctio
n R
ou
te MSM 3 (50%) 161 (55.5%) 1076 (56.1%) 43 (49.4%) 69 (30.1%)
Injecting Drug Use 7 (2.4%) 35 (1.8%) 2 (2.3%) 4 (1.7%)
Heterosexual 1 (16.7%) 22 (36.1%) 95 (32.8%) 784 (40.9%) 41 (47.1%) 100 (43.7%)
Blood/Tissue 3 (1%) 7 (0.4%) 3 (1.3%)
Mother to Child 30 (49.2%) 4 (1.4%) 15 (0.8%) 3 (1.3%)
Undetermined 2 (33.3%) 9 (14.8%) 20 (6.9%) 1 (1.1%) 50 (21.8%)
Eth
nic
ity
White 3 (50%) 1 (1.6%) 244 (84.1%) 1167 (60.9%) 70 (80.5%) 148 (64.6%)
Black Caribbean 1 (1.6%) 28 (1.5%) 4 (4.6%) 4 (1.7%)
Black African 3 (50%) 58 (95.1%) 30 (10.3%) 629 (32.8%) 10 (11.5%) 66 (28.8%)
Black Other 14 (0.7%) 1 (0.4%)
Indian/Pakistani/Bangladeshi 1 (1.6%) 21 (1.1%) 2 (2.3%)
Other Asian/Oriental 6 (2.1%) 21 (1.1%) 5 (2.2%)
Other/Mixed 7 (2.4%) 34 (1.8%) 1 (1.1%) 5 (2.2%)
Unknown 3 (1%) 3 (0.2%)
Re
sid
en
cy
UK National 3 (50%) 13 (21.3%) 262 (90.3%) 1323 (69%) 79 (90.8%) 108 (47.2%)
Asylum Seeker 2 (33.3%) 8 (13.1%) 2 (0.7%) 147 (7.7%) 5 (5.7%) 44 (19.2%)
Overseas Student 2 (3.3%) 1 (0.3%) 48 (2.5%)
Migrant Worker 2 (0.7%) 96 (5%) 2 (0.9%)
Temporary Visitor 1 (1.6%) 3 (1%) 14 (0.7%) 1 (0.4%)
Other 15 (24.6%) 9 (3.1%) 92 (4.8%) 1 (0.4%)
Refugee 1 (16.7%) 4 (6.6%) 2 (0.7%) 168 (8.8%) 3 (3.4%) 6 (2.6%)
Dependent 18 (29.5%) 1 (0.3%) 2 (0.1%)
Unknown 8 (2.8%) 27 (1.4%) 67 (29.3%)
North West
Resident
Resident Outside North West 1 (16.7%) 3 (4.9%) 87 (30%) 50 (2.6%) 1 (1.1%) 6 (2.6%)
North West Resident 5 (83.3%) 58 (95.1%) 203 (70%) 1867 (97.4%) 86 (98.9%) 223 (97.4%)
Total (100%) 6 61 290 1917 87 229
For a definition of the abbreviated community sector organisation, please refer to the glossary at the back of the report. Men who were exposed through sex with men (MSM) and are also injecting drug users are included in the MSM category. Age groups refer to the ages of individuals at the end of December 2013, or at death. Rows cannot be totalled horizontally as some individuals may appear in more than one row or column (i.e. those attending two or more organisations), thus exaggerating the totals. *Date of birth was unavailable for 47 clients at Body Positive Cheshire & North Wales so age categories cannot be totalled vertically. ⱡRenaissance at Drugline Lancashire Ltd is a Sexual Health and Substance Misuse Service covering Lancashire and Blackpool. Our Lancashire service falls under the umbrella of Healthier Living and our Blackpool service Horizon
Sta
tuto
ry
Se
cto
r
Att
en
da
nc
e

45
Table 4.2: Distribution of statutory treatment for HIV and AIDS cases presenting to community sector organisations, 2014
Treatment Centre
Community Sector Organisation
ARM BARM BPCNW GHT Renaissanceⱡ Sahir
AHC 2 BLAG 11 11 BOLG 1 1 53 1 BURG 13 26 BURY 1 20 CUMB 3 FGH 1 1 LCN 2 35 MGP 54 MRIG 8 2 448 1 NMG 22 1 408 4 6 NMGG 1 25 2 OLDG 18 PG 16 19 RLG 1 4 24 131 RLH 1 RLI 5 11 ROCG 17 SALG 1 48 STP 44 TAMG 17 TRAG 1 WGH 4 WITG 95 WORK 1
For a definition of the abbreviated treatment centres and community sector organisations please refer to the glossary at the back of the report. Columns cannot be totalled vertically or horizontally as some individuals may appear in more than one row or column (i.e. those attending two or more treatment locations or community sector organisations), thus exaggerating the totals. ⱡRenaissance at Drugline Lancashire Ltd is a Sexual Health and Substance Misuse Service covering Lancashire and Blackpool. The Lancashire service falls under the umbrella of Healthier Living and our Blackpool service Horizon
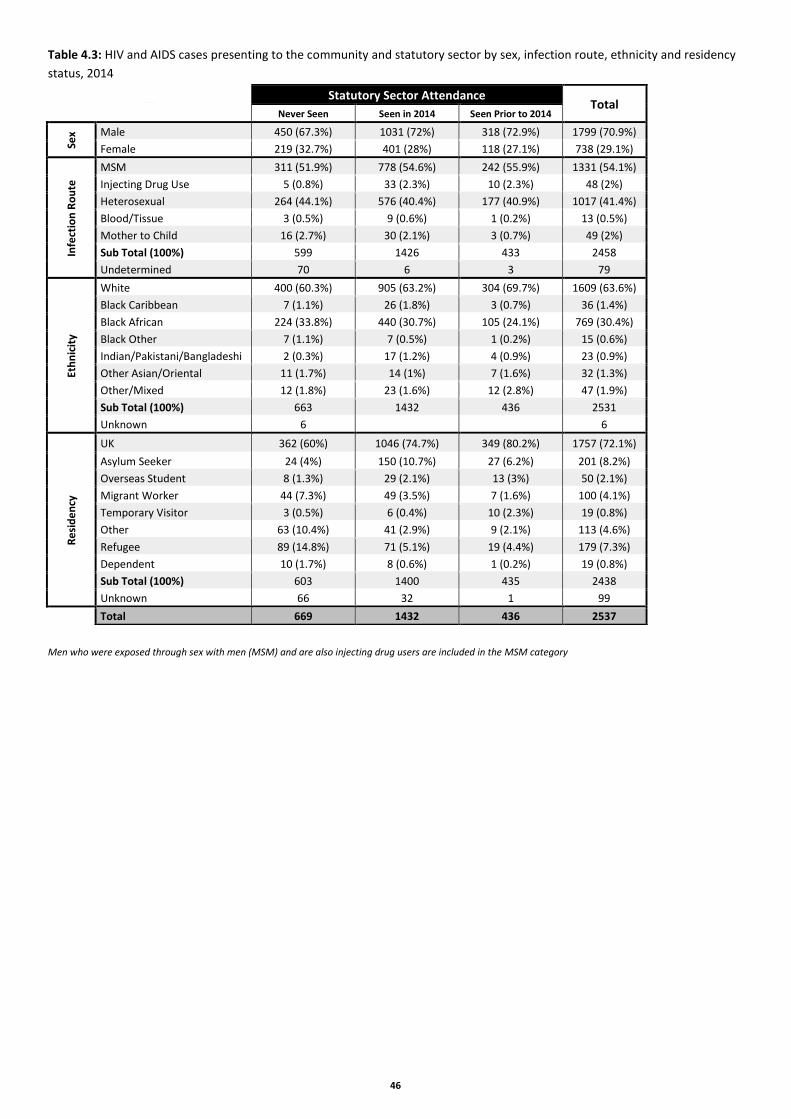
46
Table 4.3: HIV and AIDS cases presenting to the community and statutory sector by sex, infection route, ethnicity and residency
status, 2014
Men who were exposed through sex with men (MSM) and are also injecting drug users are included in the MSM category
Statutory Sector Attendance Total
Never Seen Seen in 2014 Seen Prior to 2014
Sex Male 450 (67.3%) 1031 (72%) 318 (72.9%) 1799 (70.9%)
Female 219 (32.7%) 401 (28%) 118 (27.1%) 738 (29.1%)
Infe
ctio
n R
ou
te
MSM 311 (51.9%) 778 (54.6%) 242 (55.9%) 1331 (54.1%)
Injecting Drug Use 5 (0.8%) 33 (2.3%) 10 (2.3%) 48 (2%)
Heterosexual 264 (44.1%) 576 (40.4%) 177 (40.9%) 1017 (41.4%)
Blood/Tissue 3 (0.5%) 9 (0.6%) 1 (0.2%) 13 (0.5%)
Mother to Child 16 (2.7%) 30 (2.1%) 3 (0.7%) 49 (2%)
Sub Total (100%) 599 1426 433 2458
Undetermined 70 6 3 79
Eth
nic
ity
White 400 (60.3%) 905 (63.2%) 304 (69.7%) 1609 (63.6%)
Black Caribbean 7 (1.1%) 26 (1.8%) 3 (0.7%) 36 (1.4%)
Black African 224 (33.8%) 440 (30.7%) 105 (24.1%) 769 (30.4%)
Black Other 7 (1.1%) 7 (0.5%) 1 (0.2%) 15 (0.6%)
Indian/Pakistani/Bangladeshi 2 (0.3%) 17 (1.2%) 4 (0.9%) 23 (0.9%)
Other Asian/Oriental 11 (1.7%) 14 (1%) 7 (1.6%) 32 (1.3%)
Other/Mixed 12 (1.8%) 23 (1.6%) 12 (2.8%) 47 (1.9%)
Sub Total (100%) 663 1432 436 2531
Unknown 6 6
Re
sid
en
cy
UK 362 (60%) 1046 (74.7%) 349 (80.2%) 1757 (72.1%)
Asylum Seeker 24 (4%) 150 (10.7%) 27 (6.2%) 201 (8.2%)
Overseas Student 8 (1.3%) 29 (2.1%) 13 (3%) 50 (2.1%)
Migrant Worker 44 (7.3%) 49 (3.5%) 7 (1.6%) 100 (4.1%)
Temporary Visitor 3 (0.5%) 6 (0.4%) 10 (2.3%) 19 (0.8%)
Other 63 (10.4%) 41 (2.9%) 9 (2.1%) 113 (4.6%)
Refugee 89 (14.8%) 71 (5.1%) 19 (4.4%) 179 (7.3%)
Dependent 10 (1.7%) 8 (0.6%) 1 (0.2%) 19 (0.8%)
Sub Total (100%) 603 1400 435 2438
Unknown 66 32 1 99
Total 669 1432 436 2537

47
Case Study: Banardo’s client story Background
JH is a Black African, 16yr old female who has lived in the UK
since aged 7 years. She is one of eight children & has been
HIV positive since birth. At the age of 9 years JH was started
on Antiretroviral (ARV) drugs used to manage HIV. With 100%
adherence to ARV’s life expectancy is equivalent to someone
not living with HIV. JH historically has poor medication
adherence. Her mother has never consistently ensured she
takes her ARV’s despite a referral to Children’s Services in
2009 to encourage her compliance. The Barnardo’s worker &
the specialist paediatric team at North Manchester General
Hospital (NMGH) have provided ongoing support to both JH &
her mother in an attempt to improve medication adherence.
Any improvement has been short lived & consequently JH has
multi-drug resistance. In September 2012 JH was on the last-
line of medication & if she becomes resistant to this line of
medication there is no other available treatment. The
outcome is the development of an HIV-related illness & early
death.
Planned work
JH has some cognitive development delay & medical staff felt
she may have difficulty remembering to take her ARV’s. The
paediatric specialist nurse at NMGH introduced Direct
Observation Therapy (DOT) in order to help her establish a
routine. JH was observed taking her ARV’s twice a week by
the nurse or the Barnardo’s worker & by her mother the
remaining days. In June 2012 the mother found doses of JH’s
ARV’s hidden around the house. This indicated that JH’s
mother was not in fact observing JH taking her medication &,
that JH was actively choosing not to take her ARV’s.
Work completed
At this point the Barnardo’s worker assessed that DOT was
neither sustainable nor a long term solution to JH’s poor
medication adherence. The intervention plan instead focused
on weekly sessions to improve JH’s self-esteem, enabling her
to identify herself, what the reasons are for her poor
medication adherence. The paediatric specialist nurse
continued to carry out DOT with JH twice weekly at home.
The remaining days JH was instructed to go to the Children’s
Ward at NMGH for DOT. After two months the nurse was
informed that JH had stopped going to the Children’s Ward &
JH’s NMGH consultant stopped her medication due to the
significant risk of her developing resistance to this last-line
medication.
Outcomes
Gradually JH has talked about her poor relationship with her
mother & the unreasonable expectations placed on her
around childcare & domestic chores. JH has stated that her
life is not that of a teenager & she feels like a servant. JH was
finally able to tell the Barnardo’s worker that she does not
take her ARV’s because she cannot see the point of being alive
particularly as her mother tells her frequently she hates JH &
wants her to leave home. With continued support from the
Barnardo’s worker JH has agreed to a referral to a supported
accommodation provider for young people. JH has told the
worker she wants to live in this semi-independent
accommodation in order to find some peace, & to have time
for herself so that she can complete her college course & live
a life similar to her peers. JH has said she hopes this will make
her feel happy & that she has a future & that this significant
change will motivate her to take her ARV’s. JH is currently
waiting for the outcome of the referral & it is anticipated that
if a flat is secured her consultant will re-start her ARV
treatment.
Written by: Sarah Lennox, Social Worker (Non-Statutory)

48
5. Social Care Providers 2014 This is the thirteenth year that the North West HIV/AIDS
Monitoring Unit has collected data related to the care and
support of HIV positive individuals who contact social service
departments in the north west of England. Five social service
departments were able to participate in this report. Data were
gathered on 122 individuals accessing HIV care and support
during 2014.
Social services play a vital role overseeing and ensuring the
needs of HIV positive people are met. They offer assistance
with housing, financial needs, advocacy and health &
wellbeing. Together with this they give guidance to those
dealing with the immigration system and support to
individuals who suffer with feelings of loneliness and isolation.
For many this service is a lifeline and an essential source of
support for those living with HIV (table 5.1). It is important to
note that not all clients will reveal their HIV status to social
services; therefore these data represent only the number of
people known to be living with HIV and accessing social
services.
Table 5.1 shows the number of HIV positive individuals
presenting to each social service department who provided us
with data by sex, infection route, residency status and
statutory sector attendance. Of the five social service
departments that reported in 2014 more females (53%) than
males (47%) attended. The majority of individuals accessing
social care acquired HIV through heterosexual sex (54%
overall); however the majority of those seen by Salford Social
Services acquired their HIV through sex between men (83%).
At all social service departments the residency category with
the largest proportion was UK national (40%). Although
Liverpool also saw a large number of asylum seekers (34%)
and refugees (28%).
The majority of individuals seen by each social service
department had been seen at statutory services in the north
west of England since monitoring began in 1995. Two out of
five social service departments had a number of clients who
were never seen by the statutory sector ranging from 50% of
individuals seen by Blackburn social service department (one
of two individuals) to 19% seen by Liverpool social service
department. This indicates that social services may be the sole
provider of care and support to some individuals who do not
contact statutory services.
Table 5.2 illustrates those social service attendees who also
accessed north west of England community service
organisations in 2014. Four social service departments
(Knowsley, Liverpool, Salford and Warrington) had service
users who also used community service organisations, with
the largest number (34) seen at Sahir House.

49
Table 5.1: HIV and AIDS cases presenting to five social service departments by sex, infection route, residency status and
statutory sector attendance, 2014
Social Service Department
Bla
ckb
urn
Kn
ow
sle
y
Live
rpo
ol
Salf
ord
War
rin
gto
n
Tota
l
Sex Male 1 (50%) 1 (33.3%) 49 (45%) 5 (83.3%) 1 (50%) 57 (46.7%)
Female 1 (50%) 2 (66.7%) 60 (55%) 1 (16.7%) 1 (50%) 65 (53.3%)
Infe
ctio
n
Ro
ute
MSM 22 (20.2%) 5 (83.3%) 1 (50%) 28 (23%)
Injecting Drug Use 3 (2.8%) 3 (2.5%)
Heterosexual 3 (100%) 62 (56.9%) 1 (50%) 66 (54.1%)
Undetermined 2 (100%) 22 (20.2%) 1 (16.7%) 25 (20.5%)
Re
sid
en
cy
UK National 1 (50%) 3 (100%) 40 (36.7%) 4 (66.7%) 1 (50%) 49 (40.2%)
Asylum Seeker 37 (33.9%) 1 (50%) 38 (31.1%)
Migrant Worker 1 (0.9%) 1 (0.8%)
Temporary Visitor 1 (16.7%) 1 (0.8%)
Refugee 30 (27.5%) 1 (16.7%) 31 (25.4%)
Dependent 1 (0.9%) 1 (0.8%)
Unknown 1 (50%) 1 (0.8%)
Stat
uto
ry
Sect
or
Att
en
dan
ce
Never seen 1 (50%) 21 (19.3%) 22 (18%)
Seen in 2014 1 (50%) 3 (100%) 61 (56%) 5 (83.3%) 70 (57.4%)
Seen prior to 2014 27 (24.8%) 1 (16.7%) 2 (100%) 30 (24.6%)
Total (100%) 2 3 109 6 2 122
Men who were exposed through sex with men (MSM) and are also injecting drug users are included in the MSM category.
Table 5.2: Distribution of social service care for HIV and AIDS cases presenting to community organisations, 2014
Community Agency
BPCNW GHT SAHIR Total
Knowsley
3 3
Liverpool 5 31 36
Salford 2
2
Warrington 1 1

50
6. HIV Trends The North West HIV/AIDS Monitoring Unit has been collecting
and collating data on the treatment and care of HIV positive
individuals since 1996. This chapter presents trends broken
down by county and commissioning local authorities of
residence. Data from 1996 cannot be presented here due to
space restrictions and it should be noted that some variables
were introduced to the surveillance system in later years.
The number of people accessing HIV services in north west
England has increased year on year since recording began, and
in Greater Manchester it has risen by 774% since 1996 (from
563 individuals in 1996 to 4922 individuals in 2014). There has
been a continued increase (5%) in the size of the HIV positive
population from 2013 to 2014. This is a steady increase when
compared to the change between 2012 and 2013 (5%).
The number of new cases rose annually between 2000 and
2005, with the most dramatic increase in new cases seen
between 2001 and 2002 (a rise of 47%). Since 2005, the
numbers of new cases have decreased overall with a 1%
decrease from 2005 to 2014, however the year on year
numbers have fluctuated with a 13% increase between 2013 -
2014.
Figure 6.1 shows proportional changes in the number of new
cases from 2000 to 2014 by sexual route of HIV infection.
Overall there has been an increase in new cases by 190% since
2000. The most striking change is the 435% increase in
heterosexual infections. This is a trend that has been noted
nationally[34]
and is accompanied by a national rise in the
proportion of heterosexual cases acquired in the UK
It should be noted that although this rise in heterosexual
cases dominates the statistics, the annual number of new
cases acquired through MSM has also a 169% increase
between 2000 and 2014. This again reflects the continued rise
of MSM cases nationally[34]
and stresses the need to maintain
and develop prevention strategies amongst this group.
Table 6.1 shows the infection route of new HIV and AIDS cases
from 2005 to 2014 for Greater Manchester residents. The
most common route of infection has altered over the years. In
2001, MSM accounted for the majority of new HIV infections
(52%) but by 2002 heterosexual sex overtook MSM for the
first time as the main mode of HIV exposure and this trend
continued until 2009. In recent years the gap between MSM
and heterosexual cases has closed and by 2014, there were
more new cases infected through MSM (57%) than
heterosexual (37%) once again. The number of infections
acquired through IDU has remained low over the years; this
may partly be due to the early implementation of syringe
exchange programmes across the north west of England. The
number of mother to child infections has remained relatively
stable over the past decade with an increase of 16.7% from
2005 to 2014 (from 6 to 7 individuals). The continuing
occurrence of new cases in mother to child transmission is
linked to the high number of heterosexually infected HIV
positive females, which in turn is linked to migration from high
prevalence countries. Were it not for large improvements in
diagnosis during pregnancy and effective prevention of HIV
transmission to the infant (see chapter 1), the number of
infected children would be much higher. The majority of new
cases of mother to child transmission have occurred overseas
prior to arrival in the UK (see table 2.7).
Greater Manchester has seen a small decrease in new cases
since 2005 (1%) but there was an increase in the number of
new cases between 2013 and 2014 (13%). The overall number
of new MSM cases has risen since 2005 (45%) while the
number of new heterosexual cases has declined (31%).
Greater Manchester saw an increase in the number of new
cases infected through heterosexual sex between 2013 and
2014 (5%) whilst the number of new cases acquired through
MSM increased by 23%. Greater Manchester remains the
north west county with the greatest overall number of new
MSM cases (301 individuals). This is consistent with the fact
that the Manchester area has a large gay community and
evidence of high levels of sexual risk behaviour.
Figure 6.2 illustrates proportional changes in the level of
antiretroviral therapy (ART) prescribed to HIV positive
individuals attending treatment and care between 2000 and
2014. Individuals are categorised by the highest level of
combination therapy they received in a given year. Since 2003,
the number of individuals on triple and quadruple or more
therapy has increased in line with the increasing number of
HIV cases and the number not taking any antiretroviral drugs
has decreased. There has been a slight increase in dual
therapy use but overall numbers on mono and dual have
remained low, in line with research[148]
and guidelines which
define triple or more antiretroviral drugs as the most effective
form of therapy[149]
.
Table 6.2 refers to the level of ART received by all HIV positive
Greater Manchester residents accessing treatment and care
between 2005 and 2014. Between 2005 and 2014, those
receiving triple or more therapy has increased from 66% in
2005 to 84% in 2014. From 2005 to 2007, approximately one
third (33%) of HIV positive individuals did not receive ART at
the reporting time. Since then, this proportion has decreased
to 14% in 2014. In 2014 no one was in receipt of monotherapy

51
and this number has remained relatively low since 2005. This
type of therapy is still used during pregnancy and so its use
continues to fluctuate over time. As outlined in the most
recent BHIVA guidelines, giving HIV positive pregnant women
a single antiretroviral drug (e.g. Zidovudine) during pregnancy
significantly reduces the chance of the infant becoming
infected, and remains a valid option for treatment during
pregnancy (where a women is not already on an effective
HAART regimen at conception)[150]
. With the ongoing high
number of females with HIV infection, the use of mono
therapy may continue to fluctuate in the future. The
proportion taking dual therapy has increased since 2005 (from
4 individuals to 94 individuals) but the proportion taking dual
therapy still remains low at 2% of cases. Between 2005 and
2014, the number of people receiving treatment in Greater
Manchester increased by 161%. Greater Manchester remains
the north west of England county with the largest number of
people receiving treatment with 4,239 people receiving
treatment in 2014 compared with 1,627 in 2005.
Table 6.3 shows the number of new cases of HIV from 2009 to
2014 subdivided by commissioning local authority (LA) of
residence. Stockport saw the largest increase in new cases
from 2009 to 2014 (from 10 to 31 new cases; 210%).
Table 6.4 shows data for all cases of HIV presenting for
treatment between 2009 and 2014, subdivided by
commissioning LA of residence. The total numbers of HIV
cases have increased annually. The number of individuals
accessing treatment and care has increased between 2009
and 2014 (5%) although this five year rate of increase does
appear to be slowing compared with previous years. None of
the LAs had fewer than 200 cases of HIV in 2014. The largest
percentage increase since 2009 was seen in Stockport (from
145 to 228; 57%)

52
Figure 6.1: Percentage change in new cases of HIV by selected infection route of HIV, 2000-2014
Figure 6.2: Percentage change in total cases of HIV by level of antiretroviral therapy, 2000-2014
0
100
200
300
400
500
600
700
800
2000 2001 2002 2003 2004 2005 2006 2007 2008 2009 2010 2011 2012 2013 2014
% c
han
ge o
n 2
00
0
Year
MSM Heterosexual Total
-300-200-100
0100200300400500600700800900
100011001200130014001500160017001800190020002100220023002400250026002700280029003000
2000 2001 2002 2003 2004 2005 2006 2007 2008 2009 2010 2011 2012 2013 2014
% c
han
ge o
n 2
00
0
Year
None Mono/dual Triple Quadruple or more Total

53
Table 6.1: Number of new HIV and AIDS cases by infection route of HIV, 2004-2013
Infection Route
Year % Change 2005-2014
% Change 2013-2014
2005 2006 2007 2008 2009 2010 2011 2012 2013 2014
Gre
ate
r M
anch
est
er MSM 208 241 190 207 202 158 210 210 244 301 44.7 23.4
Injecting Drug Use 9 9 7 6 6 4 8 7 4 5 -44.4 25.0
Heterosexual 288 278 239 269 250 137 201 203 188 198 -31.3 5.3
Blood/Tissue 2 1 1 3 1 4
Mother to Child 6 12 10 10 10 4 8 7 7 7 16.7 0.0
Undetermined 26 24 13 30 29 122 13 14 25 16 -38.5 -36.0
Greater Manchester Total 537 564 461 522 498 426 443 442 468 531 -1.1 13.5
Men who were exposed through sex with men (MSM) and are also injecting drug users are included in the MSM category.
Table 6.2: Total number of HIV and AIDS cases by level of antiretroviral therapy, 2005-2014
Table 6.3: New cases of HIV and AIDS by local authority of residence, 2009-2014
Local Authority of Residence
Year % change 2009-2014
% change 2013-2014 2009 2010 2011 2012 2013 2014
Gre
ate
r M
anch
est
er Wigan 21 24 23 17 17 18 -14 6
Bury 24 12 21 22 17 21 -13 24 Trafford 18 26 31 24 30 34 89 13 Stockport 10 24 23 21 15 31 210 107 Greater Manchester Total 498 426 443 442 468 531 7 13
Table 6.4: All cases of HIV and AIDS by local authority of residence, 2009-2014
Local Authority of Residence
Year % change 2009-
2014 % change 2013-2014
2009 2010 2011 2012 2013 2014
Gre
ate
r
Man
che
ste
r Wigan 148 168 189 196 216 219 48 1 Bury 178 184 206 221 226 233 31 3 Trafford 198 207 237 246 272 283 43 4 Stockport 145 167 190 204 202 228 57 13 Greater Manchester Total 3754 3980 4276 4462 4682 4922 31 5
ART
Year % Change 2005-2014
% Change 2013-2014
2005 2006 2007 2008 2009 2010 2011 2012 2013 2014
Gre
ate
r
Man
che
ste
r
None 840 955 988 993 1007 782 831 634 682 683 -18.7 0.1
Mono 6 2 4 2 1 2 1 1 -100.0 -100.0
Dual 4 1 21 2 7 7 14 59 75 94 2250.0 25.3
Triple 1264 1207 1240 1494 1670 2038 2204 2492 2636 2788 120.6 5.8
Quadruple or more 353 693 822 927 1070 1152 1225 1276 1288 1357 284.4 5.4
Greater Manchester Total 2467 2858 3075 3418 3754 3980 4276 4462 4682 4922 99.5 5.1

54
Glossary of Service Providers
Statutory Treatment Centres
AHC Alder Hey Children’s Hospital, Haematology Treatment Centre, Eaton Road, Liverpool, L12 2AP. Tel: (0151) 228 4811
BLAG Blackpool Sexual Health Services, Whitegate Health Centre, 150 Whitegate Drive, Blackpool, FY3 9ES. Tel: (01253)
303 238 BOLG Royal Bolton Hospital, Bolton Centre for Sexual Health, Minerva Road, Farnworth, Bolton, BL4 0JR. Tel: (01204)
390 771 ELANC GUM Clinic, St Peter’s Centre, Church St, Burnley, Lancashire, BB11 2DL. Tel: (01282) 805 979 BURY Bury Sexual Health Service, 3
rd Floor, Townside Primary Care Centre, 1 Knowsley Place, Bury, BL9 0SN. Tel: (0161)
762 1588 CUMB Cumberland Partnership NHS Trust, Solway Clinic, Centre for Sexual Health, Hilltop Heights, London Road, Carlisle,
CA1 2NS. Tel: (01228) 814 814 FGH Furness General Hospital, Department of GUM, Dalton Lane, Barrow in Furness, Cumbria, LA14 4LF. Tel: (01229)
404 464
LCN Liverpool Community HIV Specialist Nursing Team, Hartington Road Clinic, Hartington Road, Liverpool, L8 0SG. Tel: (0151) 285 2802
MGP 'The Docs' General Practice, Manchester, 55-59 Bloom Street, Manchester, M1 3LY. Tel: (0161) 237 9490 MRIG Manchester Royal Infirmary, Manchester Centre for Sexual Health, Hathersage Centre, 280 Upper Brook Street,
Manchester, M13 0FH. Tel: (0161) 276 5200 MRIH Manchester Royal Infirmary, Department of Haematology, Oxford Road, Manchester, M13 9WL. Tel: (0161) 276
4180
NMG North Manchester General Hospital, Infectious Disease Unit, Delaunays Road, Crumpsall, Manchester, M8 5RB.
Tel: (0161) 795 4567 NMGG North Manchester General Hospital, Department of GUM, Delaunays Road, Crumpsall, Manchester, M8 5RB. Tel:
(0161) 795 4567 NOBL Noble’s Isle of Man Hospital, Department of GUM, Strang, Douglas, Isle of Man, IM4 4RJ. Tel: (01624) 650 710 OLDG Oldham Sexual Health Service, Integrated Care Centre 2
nd Floor, New Radcliffe Street, Oldham, OL1 1NL. Tel:
(0300) 303 8565 PG Royal Preston Hospital, Department of GUM, Sharoe Green Lane North, Fulwood, Preston, PR2 9HT. Tel: (01772)
716 565 RLG Royal Liverpool University Hospital, The Liverpool Centre for Sexual Health, Dept of GUM, Royal Liverpool &
Broadgreen Hospital Trust, Prescott Street, Liverpool, L7 8XP. Tel: (0151) 706 2620 RLH Royal Liverpool University Hospital, Roald Dahl Haemostasis and Thrombosis Centre, Prescot Street, Liverpool, L7
8XP. Tel: (0151) 706 4392
RLI Royal Lancaster Infirmary, Ashton Road, Lancaster, LA1 4RP. Tel: (01524) 65944

55
ROCG Bridge Sexual Health Centre/GUM Clinic, 2nd
Floor, Stonehill Block, Whitehall Street, Rochdale, OL12 0NB. Tel: (01706) 517 686
SALG The Goodman Centre for Sexual Health, Churchill Way, Lance Burn Health Centre, Churchill Way, Salford, M6 5QX.
Tel: (0161) 212 5717 STP The Choices Centre, 1 High Bank, Stockport, Cheshire, SK1 1HB. Tel: (0161) 426 5298 TAMG Tameside and Glossop Centre for Sexual Health, Orange Suite, Ashton Primary Care Centre, 193 Old Street,
Ashton-under-Lyne, OL6 6SR. Tel: (0161) 342 7109 TRAG Trafford Integrated Sexual Health – Urmston Clinic, 74 Princess Road, Urmston, Manchester, M41 5SL.
Tel: (0161) 749 1160 WGH Westmorland General Hospital, Outpatients Department, Burton Road, Kendal, Cumbria, LA9 7RG.
Tel: (01539) 732 288 WITG Withington Hospital, South Manchester Centre for Sexual Health, Nell Lane, West Didsbury, Manchester, M20 2LR.
Tel: (0161) 217 3180 WORK Workington Community Hospital, Department of GUM, Park Lane, Workington, Cumbria, CA14 2RW. Tel: (01900) 705 050 WYTH Wythenshawe Hospital, Southmoor Road, Wythenshawe, Manchester M23 9LT. Tel: (0161) 291 5811

56
Community Sector Organisations
Social Service Departments
ARM The Armistead Project Tel: (0151) 227 1931
BARM Barnardo’s (Manchester) Tel: (0161) 273 2901
BP Cheshire and N. Wales Body Positive Cheshire and North Wales Tel: (01270) 653 150
Healthier Living Drugline Lancashire (Preston) Tel: (01772) 253840
GHT George House Trust Tel: (0161) 274 4499
Sahir Sahir House Tel: (0151) 237 3989
Horizon Drugline Lancashire (Blackpool) Tel: (01253) 311431
Blackburn Tel: (01254) 585 585
Knowsley Tel: (0151) 443 5626
Liverpool Tel: (0151) 706 2000
Salford Tel: (0161) 909 6517
Warrington Tel: (01925) 573 489

57
List of Abbreviations AIDS - Acquired immunodeficiency syndrome ART – Antiretroviral therapy BME – Black and minority ethnic groups CPH – The Centre for Public Health based at Liverpool John Moores University GUM - Genito-Urinary Medicine HIV - Human immunodeficiency virus HPA – Health Protection Agency (now Public Health England) IDU – Injecting drug use/user LA – Local authority LSOA – Lower super output area MSM – Men who have sex with men NASS – National Asylum Support Service NAT – National AIDS trust ONS – Office of national statistics PHE – Public Health England PrEP – Pre-exposure Prophylaxis SCIEH – Scottish Centre for Infection and Environmental Health SOPHID - Survey of Prevalent HIV Infections Diagnosed STI – Sexually transmitted infection UNAIDS – Joint United Nations Programme on HIV/AIDS WHO – World Health Organisation
Definition: New Cases New cases are classed as individuals who are new to the north west database in 2014 and have not been seen at a
statutory treatment centre in north west England since 1994. New cases include transfers from outside of the region so
new cases in the north west treatment and care database are not necessarily new diagnoses. However, whilst slightly
overestimating the number of new diagnoses, new cases remain an accurate proxy measure of new diagnoses in north
west England.

58
References
1. British HIV Association, British Association of Sexual Health and HIV and British Infection Society (2008). UK
National Guidelines for HIV Testing 2008, British HIV Association. 2. McCullagh, J., Syed, Q. and Bellis, M.A. (1997). HIV and AIDS in the North West of England 1996, University of
Liverpool, Department of Public Health. 3. McVeigh, J., et al. (1998). HIV and AIDS in the North West of England 1997, Liverpool John Moores University,
Public Health Sector. 4. McVeigh, J., et al. (1999). HIV and AIDS in the North West of England 1998, Liverpool John Moores University,
Public Health Sector. 5. McVeigh, J., et al. (2000). HIV and AIDS in the North West of England 1999, Liverpool John Moores University,
Public Health Sector. 6. Cook, P.A., et al. (2001). HIV and AIDS in the North West of England 2000, Liverpool John Moores University,
Public Health Sector. 7. Cook, P.A., et al. (2002). HIV and AIDS in the North West of England 2001, Liverpool John Moores University,
Public Health Sector. 8. Cook, P.A., et al. (2003). HIV and AIDS in the North West of England 2002, Liverpool John Moores University,
Centre for Public Health. 9. Cook, P.A., et al. (2004). HIV and AIDS in the North West of England 2003, Liverpool John Moores University,
Centre for Public Health. 10. Cook, P.A., et al. (2005). HIV and AIDS in the North West of England 2004, Liverpool John Moores University,
Centre for Public Health. 11. Cook, P.A., et al. (2006). HIV and AIDS in the North West of England 2005, Liverpool John Moores University,
Centre for Public Health. 12. Downing, J., et al. (2007). HIV and AIDS in the North West of England 2006, Liverpool John Moores University,
Centre for Public Health. 13. Downing, J., et al. (2008). HIV and AIDS in the North West of England 2007, Liverpool John Moores University,
Centre for Public Health. 14. Hargreaves, S.C., et al. (2009). HIV and AIDS in the North West of England 2008, Liverpool John Moores University,
Centre for Public Health. 15. Hargreaves, S.C., et al. (2010). HIV and AIDS in the North West of England 2009, Centre for Public Health Liverpool
John Moores University. 16. Harris, J., et al. (2011). HIV & AIDS in the North West of England 2011. Liverpool, Centre for Public Health,
Liverpool John Moores University. 17. Harris, J., et al. (2013). HIV & AIDS in the North West of England 2012. Liverpool, Centre for Public Health,
Liverpool John Moores University. 18. Harris, J., et al. (2014). HIV and AIDS in the North West of England 2013. Liverpool, Centre for Public Health, LJMU. 19. UNAIDS (2014). Global Report. UNAIDS Report on the Global AIDS Epidemic 2013.

59
20. Joint United Nations Programme on HIV/AIDS (UNAIDS) (2010). Getting to zero: 2011-2015 strategy Joint United Nations programme on HIV/AIDS (UNAIDS). Geneva, UNAIDS.
21. UNAIDS, (2011). HIV in Asia and the Pacific: Getting to Zero. Bangkok, UNAIDS. 22. UNAIDS (2014). The Gap Report. Geneva, UNAIDS. 23. United Nations (2014). The Millennium Development Goals Report 2014. New York, UN. 24. UNAIDS (2014). How AIDS changed everything 2014 Global Statistics Fact Sheet. Geneva, UNAIDS. 25. UNAIDS (2014). FAST TRACK Ending the AIDS Epidemic by 2030. Geneva, UNAIDS. 26. Public Health England (PHE) (2013). United Kingdom National HIV Surveillance Tables. PHE. Colindale, PHE. 27. Public Health England (2014). United Kingdom National HIV surveillance data tables. PHE. Centers for Infection,
Colindale. 28. Health Protection Agency (2010). United Kingdom new HIV diagnoses to end of December 2009 No. 2: 2009,
Centre for Infections, HPA. 29. Bellis, M.A., et al. (1997). Inequality in funding for AIDS across England threatens regional services. British Medical
Journal 315: 950-951. 30. Bellis, M.A., et al. (1999). The national lottery. Health Service Journal: 22-23. 31. Cosgrove, P., Lyons, M. and Bellis, M.A. (2001). Economics of HIV and AIDS in the North West of England.
Liverpool, Liverpool John Moores University, Public Health Sector. 32. Cosgrove, P., Thomson, R. and Bellis, M.A. (2000). Equitable strife. Health Service Journal(4): 23. 33. HPA (2011). United Kingdom New HIV Diagnoses to end of December 2010. H. HIV/STI Department. Colindale. 34. Public Health England (PHE) (2014). HIV in the United Kingdom: 2014 Report. UK, PHE. 35. Public Health England (PHE) (2013). United Kingdom Prevention Group HIV data tables. PHE. Colindale. 36. Adamma Aghaizu, A.B., Anthony Nardone, O.Noel Gill and Valerie Delpech (2013). HIV in the United Kingdom:
2013 Report. London, Public Health England. 37. Dougan, S., et al. (2008). HIV in gay and bisexual men in the United Kingdom: 25 years of public health
surveillance. Epidemiology and Infection(136): 145-156. 38. Wayal, S., et al. (2013). Repeat cross-sectional survey of sexual behaviour and partnerships of HIV-positive MSM
attending a HIV clinic in London, UK: implications for HIV prevention among MSM. The Lancet 382: S101. 39. Mercer, C., et al. (2015). O8 The sexual health and well-being of men who have sex with men (MSM): evidence
from britain's national surveys of sexual attitudes and lifestyles (NATSAL). Sexually Transmitted Infections 91(Suppl 1): A3-A3.
40. Hunter, L.J., et al. (2014). Recreational drug use in men who have sex with men (MSM) attending UK sexual health
services is significantly higher than in non-MSM. Postgrad Med J 90(1061): 133-138. 41. Daskalopoulou, M., et al. (2014). Recreational drug use, polydrug use, and sexual behaviour in HIV-diagnosed men
who have sex with men in the UK: results from the cross-sectional ASTRA study. The Lancet HIV. 42. Lee, M., et al. (2015). O11 Chemsex and the city: sexualised substance use in gay bisexual and other men who
have sex with men. Sexually Transmitted Infections 91(Suppl 1): A4-A4.

60
43. Bourne, A.R., D.; Hickson, F.; Torres Rueda, S.; Weatherburn, P. (2014). The Chemsex Study: drug use in sexual
settings among gay and bisexual men in Lambeth, Southwark & Lewisham. London, Sigma Research, London School of Hygiene and Tropical Medicine.
44. Birrell, P.J., et al. (2013). HIV incidence in men who have sex with men in England and Wales 2001–10: a
nationwide population study. The Lancet Infectious Diseases 13(4): 313-318. 45. Flowers, P., et al. (2013). Has testing been normalized? An analysis of changes in barriers to HIV testing among
men who have sex with men between 2000 and 2010 in Scotland, UK. HIV Med 14(2): 92-98. 46. Knussen, C., McDaid, L.M. and Flowers, P. (2013). Measures of risk do not discriminate between MSM tested for
HIV within the previous 6 months and MSM tested 6-12 months previously: data from Glasgow, Scotland, in 2010. Sex Transm Infect 89(5): 382.
47. Aghaizu, A., et al. (2015). O5 Understanding continuing high hiv incidence: sexual behavioural trends among msm
in london, 2000-2013. Sexually Transmitted Infections 91(Suppl 1): A2-A2. 48. Sigma Research, CHAPS and Terence Higgins Trust (THT) (2011). The UK Gay Men's Sex Survey. Vital Statistics
2010. The European MSM Internet Sex (EMIS) survey. London, London School of Hygience and Tropical Medicine. 49. Sigma Research, CHAPS and Terence Higgins Trust (THT) (2011). The UK Gay Men's Sex Survey. Vital Statistics
2010. North West region of residence data report. The European MSM Internet Survey (EMIS). London, Sigma. 50. Hickson, F., et al. (2010). Tactical Dangers. Findings from the United Kingdom Gay Men's Sex Survey 2008. London,
Sigma Research, London School of Hygiene and Tropical Medicine. 51. National AIDS Trust (2015). Boys who like boys. London, NAT. 52. Phillips, A.N., et al. (2013). Increased HIV incidence in men who have sex with men despite high levels of ART-
induced viral suppression: analysis of an extensively documented epidemic. PLoS One 8(2): e55312. 53. Aghaizu, A., et al. (2013). Who would use PrEP? Factors associated with intention to use among MSM in London: a
community survey. Sex Transm Infect 89(3): 207-211. 54. McCormack, S., et al. (2012). The British HIV Association/British Association for Sexual Health and HIV Position
Statement on pre-exposure prophylaxis in the UK. Int J STD AIDS 23(1): 1-4. 55. MRC Clinical Trials Unit and Public Health England (PHE) (2014). "Examining the Impact on gay men of using Pre-
Exposure Prophylaxis (PrEP) (PROUD)." Retrieved 15/09/14, 2014, from http://www.proud.mrc.ac.uk/default.aspx.
56. Cambiano, V., et al. (2015). O1 Is pre-exposure prophylaxis for hiv prevention cost-effective in men who have sex
with men who engage in condomless sex in the uk? Sexually Transmitted Infections 91(Suppl 1): A1-A1. 57. Public Health England (2014). National Antenatal Infections Screening Monitoring. Data tables : England 2005 -
2013. N.A.I.S.M.N. Programme and U.N.S.C.U. NSC). UK, PHE. 58. Sherr, L., et al. (2012). Gender and mental health aspects of living with HIV disease and its longer-term outcomes
for UK heterosexual patients. Women Health 52(3): 214-233. 59. The Sophia Forum (2012). GBV and HIV. Violence as a Cause or Consequence of HIV for Women in England. A
Feasibility Study Regarding a Potential National Investigation. London, Sophia Forum. 60. Dhairyawan, R., et al. (2013). Intimate partner violence in women living with HIV attending an inner city clinic in
the UK: prevalence and associated factors. HIV Med 14(5): 303-310. 61. Public Health England (2014). Prevention Group HIV data tables. PHE. Centre for Infections, Colindale.

61
62. Owour, J.O.A., Locke, A. and Heyman, B. (2013). When Talking or Not Talking Becomes a Risk: A Grounded Theory
Study Exploring the Impact of HIV on Immigrant Black African Families in the UK. Sex Transm Dis 89: A302. 63. Bourne, A.R., D.; Weatherburn, P. (2014). African Health and Sex Survey 2013-2014. London, Sigma Research,
London School of Hygiene and Tropical Medicine. 64. Tabeth Timba-Emmanuel, T.K.a.M.R. (2015). P252 Till death do us part: marriage, african born women and hiv
preventiation in the united kingdom. Sex Transm Infect 91(1): A98-A99. 65. Public Health England (PHE) (2014). Shooting Up 2013 Accompanying Data Tables. London, PHE. 66. Public Health England (PHE), P.H.W., Centre for Public Health LJMU, (2014). Data tables of the Unlinked
Anonymous Monitoring Survey of HIV and Hepatitis in People Who Inject Drugs People who inject image and performance enhancing drugs. PHE. Colindale.
67. Public Health England (PHE) (2014). Data tables of the Unlinked Anonymous Monitoring Survey of HIV and
Hepatitis in People Who Inject Drugs. PHE. Colindale. 68. European Monitoring Centre for Drugs and Drug Addiction (EMCDDA) and European Centre for Disease
Prevention and Control (ECDC) (2011). Joint EMCDDA and ECDC rapid risk assessment. HIV in injecting drug users in the EU/EEA, following a reported increase of cases in Greece and Romania. Portugal, EMCDDA.
69. House of Lords, Select Committee on HIV and AIDS in the United Kingdom,, (2011). No vaccine, no cure: HIV and
AIDS in the United Kingdom. London, TSO. 1st Report of Session 2010-12. 70. MacArthur, G.J., et al. (2014). Interventions to prevent HIV and Hepatitis C in people who inject drugs: a review of
reviews to assess evidence of effectiveness. Int J Drug Policy 25(1): 34-52. 71. MacArthur, G.J., et al. (2012). Opiate substitution treatment and HIV transmission in people who inject drugs:
systematic review and meta-analysis. Bmj 345(oct03 3): e5945-e5945. 72. National AIDS Trust (NAT) (2012). Hepatitis C and HIV Co-infection. London, NAT. 73. Marongiu, A., et al. (2012). Male IDUs who have sex with men in England, Wales and Northern Ireland: are they at
greater risk of bloodborne virus infection and harm than those who only have sex with women? Sex Transm Infect 88(6): 456-461.
74. Ward, C. and Lee, V. (2014). Experience of acute hepatitis C and HIV co-infection in an inner city clinic in the UK. J
Int AIDS Soc 17(4 Suppl 3): 19639. 75. Turner, J., et al. (2010). The prevalence of hepatitis C virus (HCV) infection in HIV-positive individuals in the UK -
trends in HCV testing and the impact of HCV on HIV treatment outcomes. J Viral Hepat 17(8): 569-577. 76. Vickerman, P., et al. (2013). Is the HCV-HIV co-infection prevalence amongst injecting drug users a marker for the
level of sexual and injection related HIV transmission? Drug Alcohol Depend 132(1-2): 172-181. 77. Tavitian-Exley, I., et al. (2015). Influence of different drugs on HIV risk in people who inject: systematic review and
meta-analysis. Addiction 110(4): 572-584. 78. Hope, V.D., et al. (2013). Prevalence of, and risk factors for, HIV, hepatitis B and C infections among men who
inject image and performance enhancing drugs: a cross-sectional study. BMJ Open 3(9): e003207. 79. Edelman, N.L., et al. (2014). Sexual health risks and health-seeking behaviours among substance-misusing women.
J Adv Nurs 70(12): 2861-2870. 80. Sabin, C.A., et al. (2005). Twenty five years of HIV infection in haemophilic men in Britain: an observational study.
BMJ 331(7523): 997-998.

62
81. Mortimer, J.Y. and Spooner, R.J. (1997). HIV infection transmitted through blood product treatment, blood
transfusion, and tissue transplantation. Commun Dis Rep CDR Rev 7(9): R130-132. 82. Regan, F.A., et al. (2000). Prospective investigation of transfusion transmitted infection in recipients of over 20
000 units of blood. TTI Study Group. BMJ 320(7232): 403-406. 83. Health Protection Agency (HPA) North West Regional Epidemiology Service (2012). Antenatal Screening of
Infectious Diseases in the North West. Annual Report 2012. 2003-2011 Surveillance Data. Liverpool, HPA North West.
84. Townsend, C.L., et al. (2014). Earlier initiation of ART and further decline in mother-to-child HIV transmission
rates, 2000-2011. AIDS 28(7): 1049-1057. 85. de Ruiter, A., et al. (2014). British HIV Association guidelines for the management of HIV infection in pregnant
women 2012 (2014 interim review). HIV Med 15 Suppl 4: 1-77. 86. Huntington, S., et al. (2014). Response to antiretroviral therapy (ART): comparing women with previous use of
zidovudine monotherapy (ZDVm) in pregnancy with ART naive women. BMC Infect Dis 14: 127. 87. Taylor, G.P., et al. (2012). British HIV Association guidelines for the management of HIV infection in pregnant
women 2012. HIV Medicine 13: 87-157. 88. Aebi-Popp, K., et al. (2013). Missed opportunities among HIV-positive women to control viral replication during
pregnancy and to have a vaginal delivery. J Acquir Immune Defic Syndr. 89. Vijayan, T., et al. (2009). We never thought this would happen: transitioning care of adolescents with perinatally
acquired HIV infection from pediatrics to internal medicine. AIDS Care 21(10): 1222-1229. 90. Prime, K.P., Jungmann, E.A. and Edwards, S.G. (2004). Decline in mortality in children with HIV in the UK and
Ireland: HIV positive adolescents urgently need dedicated services. BMJ 328(7438): 524; author reply 524. 91. Foster, C., et al. (2009). Young People in the United Kingdom and Ireland with Preinatally Acquired HIV: The
Pediatric Legacy for Adult Services. AIDS Patient Care and STDS 23(3): 159-166. 92. Hamblin, E. (2011). Just Normal Young People. Supporting young people living with HIV in their transition to
adulthood A report from the Children and Young People HIV Network. London, National Children's Bureau. 93. Evangeli, M., et al. (2014). Parenting considerations in young adults with perinatally acquired HIV. AIDS Care
26(7): 813-816. 94. Byrne, L., et al. (2014). Pregnancy outcomes in women growing up with perinatally acquired HIV in the United
Kingdom and Ireland. J Int AIDS Soc 17(4 Suppl 3): 19693. 95. Office of the United Nations High Commissioner for Human Rights and Joint United Nations Programme on
HIV/AIDS (UNAIDS) (2006). Internation Guidelines on HIV/AIDS and Human Rights. 2006 Consolidated Verison. Geneva, UNAIDS.
96. Chimienti, M. and Solomos, J. (2015). How Do International Human Rights Influence National Healthcare
Provisions for Irregular Migrants?: A Case Study in France and the United Kingdom. Journal of Human Rights: 1-21. 97. Butler, P. (2015). Do foreigners come to the UK to get HIV treatment? The Guardian. online. 98. Arie, S. (2013). Are migrant patients really a drain on European health systems? BMJ 347: f6444. 99. Allsop, J.S., N.; Phillimore, J. (2014). Poverty among refugees and asylum seekers in the UK An evidence and policy
review. IRIS Working Paper Series. I.f.R.i. Superdiversity. Birmingham, University of Birmingham. 1.

63
100. Delpech, V.C., et al. (2013). Migrant patients' access to HIV care: testing should always be free. BMJ 347: f7056. 101. Chinouya, M., et al. (2014). Migrants and HIV stigma: findings from the Stigma Index Study (UK). Health Soc Care
Community. 102. Potter, J.L. (2015). Providing accessible healthcare to migrants is morally right and cost effective. BMJ 351: h3775. 103. UK Parliment Publications (2012). Lords Hansard Text for 29 February 2012 Column 1393. www.parliament.uk. 104. Creighton, S., et al. (2004). Dispersal of HIV positive asylum seekers: national survey of UK healthcare providers.
BMJ 329(7461): 322-323. 105. All Party Parlimentary Group on AIDS (APPGA) (2003). Migration and HIV: improving lives in Britain. An Inquiry
into the impact of the UK nationality and immigration system on people living with HIV. London, APPGA. 106. National AIDS Trust (NAT) (2006). Dispersal of Asylum Seekers living with HIV. London, NAT. 107. British HIV Association (BHIVA) and National AIDS Trust (NAT) (2009). Detention, Removal and People Living with
HIV. Advice for healthcare and voluntary sector professionals. London, BHIVA. 108. Home Office (HO) (2014). Immigration Statistics - October to December 2014. 109. Public Health England (2014). Table 5 HIV test uptake coverage 2010-2014. G. PHE. London. 110. Hartney, T., et al. (2014). Expanded HIV testing in high-prevalence areas in England: results of a 2012 audit of
sexual health commissioners. HIV Med 15(4): 251-254. 111. Health Protection Agency (HPA) (2011). Time to test for HIV: Expanding HIV testing in healthcare and community
services in England. Colindale, HPA. 112. Public Health England (PHE) (2014). HIV Testing and Self Testing Frequently Asked Questions. London, PHE. 113. Public Health England (2015). Sexual and Reproductive Health Profiles. 114. United Nations (UN) General Assembly (2011). Political Declaration on HIV and AIDS: Intensifying Our Efforts to
Eliminate HIV and AIDS. 65/277. 115. Cohen, M.S., et al. (2011). Prevention of HIV-1 Infection with Early Antiretroviral Therapy. N Engl J Med 365(6):
494-505. 116. World Health Organisation (WHO) (2013). Consolidated Guidelines on the Use of Anitretroviral Drugs for Treating
and Preventing HIV Infection. Reccomendations for a public health approach. Geneva, WHO. 117. World Health Organisation (WHO) (2015). Guideline on when to start antiretroviral therapy and on pre-exposure
prophylaxis for HIV. Geneva, WHO. 118. National Institute of Allergy and Infectious Disease (NIAID) (2015). Starting Antiretroviral Treatment Early
Improves Outcomes for HIV-Infected Individuals. 119. British HIV Association (BHIVA) (2015). British HIV Association guidelines for the treatment of HIV-1-positive
adults with antiretroviral therapy 2015. London, BHIVA. 120. Rerks-Ngarm, S., et al. (2009). Vaccination with ALVAC and AIDSVAX to Prevent HIV-1 Infection in Thailand. N Engl
J Med 361: 2209-2220. 121. Pitisuttithum, P., Excler, J.-L. and Kim, J. (2013). Beyond RV144 Efficacy Results: An Update. Procedia in
Vaccinology 7: 49-56.

64
122. HIV Vaccines and Microbicides Resource Tracking Working Group (2012). Investing to End the AIDS Epidemic- A New Era for HIV Prevention Research & Development>. New York, AVAC.
123. Robert M. Grant, M.D., M.P.H., Javier R. Lama, M.D., M.P.H., Peter L. Anderson, Pharm.D., Vanessa McMahan,
B.S.,, et al. (2010). Preexposure Chemoprophylaxis for HIV Prevention in Men Who Have Sex with Men. N Engl J Med 363(27).
124. Baeten, J.M., et al. (2012). Antiretroviral prophylaxis for HIV prevention in heterosexual men and women. N Engl J
Med 367(5): 399-410. 125. McCormack, S., et al. (2015). Pre-exposure prophylaxis to prevent the acquisition of HIV-1 infection (PROUD):
effectiveness results from the pilot phase of a pragmatic open-label randomised trial. Lancet. 126. Mugo, N., et al. (2013). Pregnancy incidence and birth outcomes among African women in a clinical trial of pre-
exposure prophylaxis: the Partners PrEP Study. Internation AIDS Society (IAS) on HIV Pathogenisis, Treatment and Prevention. Kuala Lumpar.
127. Whetham, J., et al. (2014). Pre-exposure prophylaxis for conception (PrEP-C) as a risk reduction strategy in HIV-
positive men and HIV-negative women in the UK. AIDS Care 26(3): 332-336. 128. van Lunzen, J., et al. (2013). Functional cure after long term HAART initiated during early HIV infection: a
comprehensive case study. International AIDS Society (AIDS) Conference onf HIV Pathogenesis, Treatment and Prevention. Kuala Lumpur. TUPE246.
129. Saez-Cirion, A., et al. (2013). Post-treatment HIV-1 controllers with a long-term virological remission after the
interruption of early initiated antiretroviral therapy ANRS VISCONTI Study. PLoS Pathog 9(3): e1003211. 130. Persaud, D., et al. (2013). Absence of detectable HIV-1 viremia after treatment cessation in an infant. N Engl J
Med 369(19): 1828-1835. 131. Rasmussen, T.A., et al. (2013). Comparison of HDAC inhibitors in clinical development: effect on HIV production in
latently infected cells and T-cell activation. Hum Vaccin Immunother 9(5): 993-1001. 132. S, S. (2014). The HDAC inhibitor romidepsin is safe and effectively reverses HIV-1 latency in vivo as measured by
standard clinical assays. 20th International AIDS Conference. Melbourne. TUAA0106LB. 133. Public Health England (2013). United Kingdom PHE centre and London Sector HIV data tables. PHE. Colindale. 134. Health Protection Agency (HPA) (2012). Data Tables of the Unlinked Anonymous Dried Blood Spot Sruvey of
Newborn Infants - Prevalence of HIV in Women Giving Birth. Surveillance Update: 2012. Colindale, HPA. 135. Public Health England (2014). Table 2: STI diagnoses and rates by gender, sexual risk and age group, 2010-2014.
London, PHE. 136. Royce, R.A., et al. (1997). Sexual transmission of HIV. N Engl J Med 336(15): 1072-1078. 137. Hayes, R., et al. (2010). Treeatment of sexually transmitted infections for HIV prevention: end of the road or new
beginning? AIDS 24(suppl 4): 515-526. 138. Department of Health (DH) (2012). The Power of Information. Putting all of us in control of the health and care
information we need. London, DH. 139. Walker, P. (1999). Protecting and using patient information: a national framework. Consultation Paper, NHS
Executive. 140. Marmot, M. (2008). Fair Society, Healthy Lives. The Marmot Review. London, UCL.

65
141. United Nations Office on Drugs and Crime (UNODC) (2014). World Drug Report 2014. Vienna, United Nations Office on Drugs and Crime
142. Ministerio de Sanidad, S.S.e.I. (2012). Informe National sobre los Progresos Realizados en la Aplicacion del
UNGASS, Espana. UNAIDS Country AIDS Progress Report. UNAIDS. Madrid, Ministerio de Sanidad, Espana. 143. Downing, J., et al. (2011). Factors associated with risky sexual behaviour: a comparison of British, Spanish and
German holidaymakers to the Balearics. Eur J Public Health 21(3): 275-281. 144. Hughes, K., et al. (2009). Alcohol, drugs, sex and violence: health risks and consequences in young British
holidaymakers to the Balearics. Adicciones 21(4): 265-277. 145. Mandalia, S., et al. (2010). Rising population cost for treating people living with HIV in the UK, 1997-2013. PLoS
One 5(12): e15677. 146. Office for National Statistics (ONS) (2012). 2011 Census: Key Statistics for local authorities in England and Wales.
ONS. London, ONS. 147. Madden, H.C., et al. (2011). Access to HIV community services by vulnerable populations: evidence from an
enhanced HIV/AIDS surveillance system. AIDS Care 23(5): 542-549. 148. Jordan, R., et al. (2002). Systematic review and meta analysis of evidence for increasing numbers of drugs in
antiretroviral combination therapy. British Medical Journal 324: 757-767. 149. BHIVA (2015). BHIVA guidelines for the treatment of HIV-‐1-‐positive adults with antiretroviral therapy 2015,
BHIVA. 150. BHIVA (2013). Summary of BHIVA guidelines HIV treatment for pregnant women: HIV treatment. London, NAM
Publications.

Jane Harris, Ann Lincoln, Mark Whitfield, Jim McVeigh Centre for Public HealthFaculty of Education, Health and CommunityLiverpool John Moores University2nd Floor Henry Cotton Campus15-21 Webster StreetLiverpoolL3 2ET
Tel: +44(151) 231 4542Fax: +44(151) 231 4552
December 2015www.cph.org.uk/expertise/sexual-health
ISBN: 978-1-910725-27-6 (web)