
HIV-1 TAR RNA Spontaneously Undergoes Relevant Apo … · HIV-1 TAR RNA Spontaneously Undergoes...
13
HIV-1 TAR RNA Spontaneously Undergoes Relevant Apo-to-Holo Conformational Transitions in Molecular Dynamics and Constrained Geometrical Simulations Simone Fulle, †,‡,§ Nina Alexandra Christ, †,‡ Eva Kestner, ‡ and Holger Gohlke* ,‡,§ Department of Biological Sciences, Goethe-University, Frankfurt, Germany and Department of Mathematics and Natural Sciences, Heinrich-Heine-University, Du ¨sseldorf, Germany Received March 13, 2010 We report all-atom molecular dynamics and replica exchange molecular dynamics simulations on the unbound human immunodeficiency virus type-1 (HIV-1) transactivation responsive region (TAR) RNA structure and three TAR RNA structures in bound conformations of, in total, ∼250 ns length. We compare the extent of observed conformational sampling with that of the conceptually simpler and computationally much cheaper constrained geometrical simulation approach framework rigidity optimized dynamic algorithm (FRODA). Atomic fluctuations obtained by replica-exchange molecular dynamics (REMD) simulations agree quantitatively with those obtained by molecular dynamics (MD) and FRODA simulations for the unbound TAR structure. Regarding the stereochemical quality of the generated conformations, backbone torsion angles and puckering modes of the sugar-phosphate backbone were reproduced equally well by MD and REMD simulations, but further improvement is needed in the case of FRODA simulations. Essential dynamics analysis reveals that all three simulation approaches show a tendency to sample bound conformations when starting from the unbound TAR structure, with MD and REMD simulations being superior with respect to FRODA. These results are consistent with the experimental view that bound TAR RNA conformations are transiently sampled in the free ensemble, following a conformation selection model. The simulation-generated TAR RNA conformations have been successfully used as receptor structures for docking. This finding has important implications for RNA-ligand docking in that docking into an ensemble of simulation-generated RNA structures is shown to be a valuable means to cope with large apo-to-holo conformational transitions of the receptor structure. INTRODUCTION RNA structures show a remarkable ability to undergo large but controlled conformational changes to achieve their diverse functional roles. 1 The conformational changes span a wide range of amplitudes and time scales and are either self-induced or, more common, triggered upon binding to a range of cellular cofactors. To understand the functional mechanisms of RNA conformational transitions, it is highly desirable to have a detailed structural description of the underlying processes. In this regard, one of the best investigated RNA structures is the HIV-1 transactivation response element (TAR). 2-6 TAR RNA is a 59-nucleotide hairpin structure located at the 5′-end of all pre-mRNA in a HIV-1 transcript. Binding of the regulatory Tat protein to a bulge region within the TAR RNA structure is an essential step for HIV-1 viral replication. The bulge region links two A-form helical stem domains including a CUGGGA hexa- loop. The secondary structure of this element is shown in Figure 1 and will be referred to as TAR RNA throughout the remainder of this text. The TAR RNA is highly flexible and adopts rather different conformations upon binding to different ligands (Figure 1). Whereas the unbound structure has a pronounced kink of 45° between the two stems, e.g., binding of the transactivator of transcription (Tat) protein results in a coaxial alignment of the two stems and, hence, an overall linear structure. This dramatic conformational change is required for the activation of the viral transcription in a stepwise manner. 7 In the search for therapeutic compounds, a promis- ing strategy is to develop small molecules that either inhibit the Tat-TAR interaction or prevent the conformational change to the bound structure. 8-10 Currently, six different ligand-bound conformations are structurally known, compris- ing a conformation bound to a modification of the cognate Tat protein 2,11 and five conformations bound to small molecules that inhibit the TAR-Tat interaction (Figure 1). 9,12-14 The flexible nature of TAR RNA calls for docking approaches that consider target conformational changes, including backbone motions, when it comes to structure- based drug design. So far, only two such approaches that are fast enough to allow for flexible-RNA virtual screening have been introduced. 15,16 Other strategies well-known in the field of protein-ligand docking, including parallel docking into multiple target conformations, 17-20 modeling target motions in reduced coordinates, 21,22 or deforming interaction grids according to target movements, 23 have not yet been described for RNA. 24 As a possible reason, all of these approaches require either one or multiple RNA structures close to bound conformations or knowledge about * Corresponding author. Telephone: (+49) 211-81-13662. Fax: (+49) 211 81-13847. E-mail: [email protected]. † These authors contributed equally to this work. ‡ Goethe-University. § Heinrich-Heine-University. J. Chem. Inf. Model. 2010, 50, 1489–1501 1489 10.1021/ci100101w 2010 American Chemical Society Published on Web 07/13/2010
Transcript of HIV-1 TAR RNA Spontaneously Undergoes Relevant Apo … · HIV-1 TAR RNA Spontaneously Undergoes...

HIV-1 TAR RNA Spontaneously Undergoes Relevant Apo-to-Holo ConformationalTransitions in Molecular Dynamics and Constrained Geometrical Simulations
Simone Fulle,†,‡,§ Nina Alexandra Christ,†,‡ Eva Kestner,‡ and Holger Gohlke*,‡,§
Department of Biological Sciences, Goethe-University, Frankfurt, Germany and Department of Mathematicsand Natural Sciences, Heinrich-Heine-University, Dusseldorf, Germany
Received March 13, 2010
We report all-atom molecular dynamics and replica exchange molecular dynamics simulations on the unboundhuman immunodeficiency virus type-1 (HIV-1) transactivation responsive region (TAR) RNA structure andthree TAR RNA structures in bound conformations of, in total, ∼250 ns length. We compare the extent ofobserved conformational sampling with that of the conceptually simpler and computationally much cheaperconstrained geometrical simulation approach framework rigidity optimized dynamic algorithm (FRODA).Atomic fluctuations obtained by replica-exchange molecular dynamics (REMD) simulations agreequantitatively with those obtained by molecular dynamics (MD) and FRODA simulations for the unboundTAR structure. Regarding the stereochemical quality of the generated conformations, backbone torsion anglesand puckering modes of the sugar-phosphate backbone were reproduced equally well by MD and REMDsimulations, but further improvement is needed in the case of FRODA simulations. Essential dynamicsanalysis reveals that all three simulation approaches show a tendency to sample bound conformations whenstarting from the unbound TAR structure, with MD and REMD simulations being superior with respect toFRODA. These results are consistent with the experimental view that bound TAR RNA conformations aretransiently sampled in the free ensemble, following a conformation selection model. The simulation-generatedTAR RNA conformations have been successfully used as receptor structures for docking. This finding hasimportant implications for RNA-ligand docking in that docking into an ensemble of simulation-generatedRNA structures is shown to be a valuable means to cope with large apo-to-holo conformational transitionsof the receptor structure.
INTRODUCTION
RNA structures show a remarkable ability to undergo largebut controlled conformational changes to achieve theirdiverse functional roles.1 The conformational changes spana wide range of amplitudes and time scales and are eitherself-induced or, more common, triggered upon binding to arange of cellular cofactors. To understand the functionalmechanisms of RNA conformational transitions, it is highlydesirable to have a detailed structural description of theunderlying processes. In this regard, one of the bestinvestigated RNA structures is the HIV-1 transactivationresponse element (TAR).2-6 TAR RNA is a 59-nucleotidehairpin structure located at the 5′-end of all pre-mRNA in aHIV-1 transcript. Binding of the regulatory Tat protein to abulge region within the TAR RNA structure is an essentialstep for HIV-1 viral replication. The bulge region links twoA-form helical stem domains including a CUGGGA hexa-loop. The secondary structure of this element is shown inFigure 1 and will be referred to as TAR RNA throughoutthe remainder of this text.
The TAR RNA is highly flexible and adopts ratherdifferent conformations upon binding to different ligands(Figure 1). Whereas the unbound structure has a pronounced
kink of 45° between the two stems, e.g., binding of thetransactivator of transcription (Tat) protein results in a coaxialalignment of the two stems and, hence, an overall linearstructure. This dramatic conformational change is requiredfor the activation of the viral transcription in a stepwisemanner.7 In the search for therapeutic compounds, a promis-ing strategy is to develop small molecules that either inhibitthe Tat-TAR interaction or prevent the conformationalchange to the bound structure.8-10 Currently, six differentligand-bound conformations are structurally known, compris-ing a conformation bound to a modification of the cognateTat protein2,11 and five conformations bound to smallmolecules that inhibit the TAR-Tat interaction (Figure1).9,12-14
The flexible nature of TAR RNA calls for dockingapproaches that consider target conformational changes,including backbone motions, when it comes to structure-based drug design. So far, only two such approaches thatare fast enough to allow for flexible-RNA virtual screeninghave been introduced.15,16 Other strategies well-known inthe field of protein-ligand docking, including paralleldocking into multiple target conformations,17-20 modelingtarget motions in reduced coordinates,21,22 or deforminginteraction grids according to target movements,23 have notyet been described for RNA.24 As a possible reason, all ofthese approaches require either one or multiple RNAstructures close to bound conformations or knowledge about
* Corresponding author. Telephone: (+49) 211-81-13662. Fax: (+49)211 81-13847. E-mail: [email protected].
† These authors contributed equally to this work.‡ Goethe-University.§ Heinrich-Heine-University.
J. Chem. Inf. Model. 2010, 50, 1489–1501 1489
10.1021/ci100101w 2010 American Chemical SocietyPublished on Web 07/13/2010

how a given RNA can move. What are the prospects toprovide such information by computational means?
From an experimental point of view, TAR RNA cantransiently sample the linear (bound) conformation, even inthe absence of a ligand.4,5,25,26 The linear conformation isthen stabilized relative to other competing conformations byweak intermolecular interactions between the RNA and aligand.27 In such a conformation selection model,28,29 aligand captures a minor pre-existing population in theunbound state of the TAR RNA, while the population ofthe other conformers present in the unbound state aredepleted.30 Accordingly, if the TAR RNA can adopt boundconformers with low energy costs even in the absence ofany ligands, then a strategy to find new therapeuticallycompounds is: (i) to sample the conformational space of theunbound TAR RNA structure and (ii) to carry out subse-quently docking calculations on the transiently sampled RNAconformations. In total, this results in docking to an ensembleof different (fixed) receptor conformations, thereby implicitlytaking into account conformational changes upon binding.31
Molecular dynamics (MD) simulation32 is the state-of-the-art tool to generate conformational ensembles of bio-macromolecules at an atomic level. Enhanced samplingmethods, such as replica exchange molecular dynamics(REMD),33 are increasingly used to overcome barriersbetween local minima. However, both simulation methodsare very time-consuming and are only able to explore timescales on the tens to hundreds of ns scale. In contrast, bindingto TAR RNA and related conformational transitions occuron a ns to ms time scale.5,25,26 Thus, the likelihood to samplebound TAR RNA conformations by the above approachesis low. As an alternative, for enhancing sampling, constrainedgeometric simulation techniques34,35 make use of a naturalcoarse graining of the biomacromolecule in terms of rigid
and flexible regions36 and restrict the allowed conformationalsearch space to an important subspace. These simplifiedsimulation methods have been successfully applied to theprotein world,34,35,37-40 but experience is lacking for nucleicacid structures.41
Consequently, in the following the performance of MDand REMD simulations to sample the conformational spaceof TAR RNA will be compared to that of the constrainedgeometric simulation method framework rigidity optimizeddynamics algorithm34 (FRODA) for four HIV-1 TAR RNAstructures. FRODA relies upon a decomposition of amacromolecule into rigid and flexible regions. The flexibleparts are then moved through allowed regions of conforma-tional space using random Brownian-type (Monte Carlo)dynamics, whereas atoms in rigid clusters are movedcollectively. In particular, we will investigate which of thethree simulation methods is able to sample known boundconformations starting from either the free (unbound) TARRNA state or the bound conformations after removing therespective ligand. Furthermore, we will analyze the stereo-chemical quality of the generated TAR RNA conformationsand test whether they are adequate for docking.
MATERIALS AND METHODS
Data Set for Simulations. The coordinates of the freeTAR RNA (PDB code 1ANR)10 and bound to argininamide(PDB code 1ARJ),11 acetylpromazine (PDB code 1LVJ),13
and neomycin B (PDB code 1QD3)12 were used as startingstructures for MD, REMD, and FRODA simulations. Thesestructures were modified such that they all consist of thebase sequence G17CCA20GAUCUGAGCC30UGGGAGC-UCU40CUGGC45.
Furthermore, we used the TAR RNA structures bound toRbt158 (PDB code 1UUI),14 Rbt203 (PDB code 1UUD),14
Figure 1. (a) Sequence and secondary structure of the 29-mer TAR RNA used for MD, REMD, and FRODA simulations. (b) Conformationof the HIV-1 TAR RNA in the free form and when bound to different ligands: argininamide, acetylpromazine, neomycin B, Rbt158,Rbt203, and Rbt550. In the structures, the bulge (red), loop (orange), and stem regions (blue) are marked. According to experimentalevidence,4,5,25,26 the unbound TAR RNA undergoes dynamical changes that sample the known ligand bound conformations along specificconformation pathways. Figure adapted from ref 86.
1490 J. Chem. Inf. Model., Vol. 50, No. 8, 2010 FULLE ET AL.
and Rbt550 (PDB code 1UTS)9 for our analyses. In the caseof the NMR determined structures 1ANR, 1LVJ, 1QD3, and1UTS, the first structure of the conformational ensemble wasused. Only one model was reported in structures 1UUI and1UUD. In the case of 1ANR, we followed a previous MDstudy and chose the second structure of the conformationalensemble.42 For unbound simulations, the ligand moleculeswere removed from the respective RNA-ligand complexes.In the following, we will refer to the different unbound TARRNA conformations as TAR-free (unbound), TAR-Arg(obtained from 1ARJ), TAR-AcP (obtained from 1LVJ),TAR-NeoB (obtained from 1QD3), TAR-Rbt158 (obtainedfrom 1UUI), TAR-Rbt203 (obtained from 1UUD), and TAR-Rbt550 (obtained from 1UTS), respectively.
MD and REMD Simulations. The MD and REMDsimulations were performed using the AMBER 8 suite ofprograms43 together with the parm94 force field of Cornellet al.44 For this, the system was neutralized by adding sodiumcounterions and solvated in a box of TIP3P water mol-ecules,45 forming a solvent shell of at least 11 Å betweeneach face of the box and the solute. The particle mesh Ewald(PME) method was used with a direct-space nonbondedcutoff of 8 Å. Bond lengths involving hydrogen atoms wereconstrained using the SHAKE algorithm, and the time stepfor all simulations was 2 fs. For the REMD simulations 16replicas were used, and the temperatures were distributedexponentially between 300 and 350 K at 300, 303.0996,306.2311, 309.3949, 312.5913, 315.8206, 319.0831, 322.3792,325.7093, 329.0737, 332.4727, 335.9067, 339.3760, 342.8811,346.4223, and 350 K. After equilibration, 50 ps of unre-strained MD in the canonical ensemble (NVT) were per-formed after which snapshots were sampled for analyses.
The production runs of the unbound MD simulations ofTAR-free, TAR-Arg, TAR-AcP, and TAR-NeoP are of 50ns length each and the unbound REMD simulations are of13 ns length for the TAR-free structure, 14 ns for the TAR-Arg structure, 10 ns for the TAR-AcP structure, and 6.2 nsfor the TAR-NeoB structure.
Force Field Selection. The validity of current MDsimulations is influenced by the sampling of the conforma-tional space and the approximate nature of the used forcefield.46 Of the available force fields, the Amber force fieldsparm9444 and parm9947 are the most popular ones for RNAsimulations given that they have provided stable simulationsof numerous complex RNA structures for simulations ofabout 10 ns length46,48,49 and allowed to reproduce experi-mental free energies of stability with a reasonable degree ofaccuracy.50,51 A recent reparameterization of the R and γtorsions in these force fields led to the parmbsc0 force field,52
which improved the simulation of DNA duplexes on verylong time scales (1 µs range). However, further tests onA-RNA duplexes53 and UAA/GAN internal loops of 23SrRNA H4054 revealed that the penalization of the R/γtransitions in the parmbsc0 force field may be too excessivefor RNA structures and leads to a modest narrowing of themajor groove due to the suppression of the γ-trans states.54
In the present study, when investigating R and γ torsionssampled during MD and REMD simulations using parm94,we found only one to two transitions toward R/γ t/t substates,e.g., for nucleotides 20 and 28 in the two stem regions. Thisresult agrees with the occasional finding of these substatesin experimental structures54 and, thus, supports the validity
of our simulations. Moreover, the force field variants parm94,parm99, and parmbsc0 all resulted in overall similar descrip-tions of RNA structures in simulations of up to 100 ns lengthin previous studies.54,55 Thus, we expect that the main resultsof our simulations will not be sensitive to the used Amberforce field variant.
Constrained Geometrical Simulations. The FRODAapproach34 consists of two steps. In the first step, a TARRNA structure is decomposed into rigid clusters and flexiblehinges in between. Rigid regions are those parts of a moleculethat have a well-defined equilibrium structure and areexpected to move as a rigid body with six degrees offreedom. Thus, no relative motion is allowed within rigidregions. In turn, flexible regions are hinge regions of themolecule where bond rotational motions can occur withouta high cost of energy. For the analysis, a full atomicrepresentation of the structure is modeled as a directed graphof covalent and noncovalent constraints. Noncovalent con-straints are included according to a network parameterizationthat has been recently developed by us for RNA structures.41,56
Hydrophobic interactions are considered between a pair ofcarbon and/or sulfur atoms if the distance between the atomsis smaller than the sum of the van der Waals radii (1.7 forcarbon and 1.8 Å for sulfur) plus 0.15 Å. Hydrophobicinteractions are modeled such that two degrees of freedomare removed from the network. This is supposed to model aless geometrically restrained interaction compared to ahydrogen bond. Furthermore, the number of hydrophobicinteractions for base stacking is limited to one to preventexcessive hydrophobic contacts between sequentially adja-cent bases. Hydrogen bonds and salt bridges are included asdistance and angular constraints between hydrogen andacceptor atoms as well as two neighboring atoms, dependingon their geometry and interaction energy. For this, potentialhydrogen bonds are ranked according to an energy functionthat takes into account the hybridization state of donor andacceptor atoms as well as their mutual orientation.57 Bytuning the energy threshold EHB, strong hydrogen bonds canbe distinguished from weaker ones. Hydrogen bonds areincluded if their energy is e-1.0 kcal/mol. Further detailsabout the underlying rigidity theory and the networkparameterization have been described elsewhere.41,57,58
Given a network representation of the RNA structure, thepebble game,59 a fast combinatorial algorithm, is applied toexactly enumerate the number and spatial distribution of bondrotational degrees of freedom in the network. Based on theaccessibility of rotational degrees of freedom, each bond isidentified as part of either a rigid cluster or a flexible link inbetween. The resulting decomposition of the RNA structureinto rigid and flexible regions is used in the second step ofthe approach as input for the FRODA simulation, whichfinally explores the molecule’s mobility.34,60 Default FRODAvalues were used for this second step. During the unboundFRODA simulations, 78 200 conformations of TAR-free,27 200 conformations of TAR-AcP, 999 900 of TAR-Arg,and 999 900 of TAR-NeoB were produced.
Analysis of the Trajectories. To analyze conformationalproperties of the molecules, every 100th conformation of theFRODA simulation if less than 500 000 steps were simulated,every 200th conformation of the FRODA simulation if morethan 500 000 steps were simulated, and snapshots saved at10 ps intervals along the MD and REMD production runs
CONFORMATIONAL TRANSITIONS OF HIV-1 TAR RNA J. Chem. Inf. Model., Vol. 50, No. 8, 2010 1491

were used. The ‘ptraj’ module of the AMBER 9 suite ofprograms43 was used for analyzing the root-mean-squaredeviation (rmsd) between structure pairs, the root-mean-square fluctuations about the mean position of atoms, andprincipal components of structural ensembles.
For rmsd calculations only the heavy atoms of thosenucleotides that have at least one heavy atom within 5 Å ofthe respective bound ligand were considered, whereas loop(C30-A35) and terminal nucleotides (G17-C18 andG44-C45) were neglected. This resulted in the nucleotidesA20-C29 and G36-U40 in the case of TAR-Arg, nucle-otides G21-A27 and U38-C41 in the case of TAR-AcP,nucleotides C19-A27 and C39-G43 in the case of TAR-NeoB, nucleotides A20-A27 and C39-U40 in the case ofTAR-Rbt550, nucleotides A22-U23, U25-C29, and G36-U40 in the case of TAR-Rbt203, and nucleotides A22-U23,G26-G28, and G36-U40 in the case of TAR-Rbt158.
For the principal component analysis (PCA),61 a mass-weighted covariance matrix of all phosphorus atoms wasdetermined for each simulation run, and the first teneigenvectors and eigenvalues were calculated subsequently.Overall translational and rotational motions for the PCA wereremoved with respect to all phosphorus atoms of the TAR-free structure. Eigenvectors describe the directions of es-sential motions in conformational space, and the associatedeigenvalues determine how much of the variance in theensemble is explained by each eigenvector. Results of thePCA are compared with experimentally observed confor-mational changes in terms of directions of motions. For this,the first six eigenvectors were obtained by PCA analysis foran ensemble consisting of the experimentally determinedTAR-free, TAR-AcP, TAR-Arg, TAR-Neo, TAR-Rbt158,TAR-Rbt203, and TAR-Rbt550 structures.
The maximal overlap value Imax between the conforma-tional changes observed in the experimentally determinedstructures uFi and within a trajectory VFj is calculatedaccording to
An overlap of one indicates that the directions of bothkinds of collective phosphorus displacements are identical.
The analysis of the backbone torsion angles R, �, γ, δ, ε,and �, the glycosidic torsion angle �, and the sugar puckeringwere carried out using the CURVES 5.2 algorithm.62 Rangesof reference average backbone torsion angles of canonicalA-form RNA structures are listed in Table 1.63
The conformational free energy difference ∆Gfreefbound
between the TAR-free structure and a bound conformationis determined from a standard thermodynamic relation64-66
according to
where R is the universal gas constant, T is the temperatureand is set to 298 K, and Nbound (Nfree) is the number ofsampled configurations close to the respective bound (TAR-free) conformation, as determined by rmsd calculationsdescribed above. Here, a sampled configuration is considered
to be close to the TAR-free or bound conformation only ifrmsd < 3.0 Å with respect to the reference.
Data Set for Docking. RNA-ligand complexes wereobtained from the PDB, as described in the Data Set forSimulations Section. After separating RNA and ligandmolecules (Figure 2), the TAR RNA structures wereconverted to mol2 format using Moloc. DrugScoreRNA grids67
were calculated, using a grid spacing of 0.375 Å, centeredon the binding site of the respective ligand. The grids covera volume that extends at least 7 Å beyond any ligand atomin the native bound conformation. Ligands were convertedto mol2 format using PRODRG,68 and atom types wereassigned using Antechamber69 together with manual correc-tions. Finally, rotatable bonds of the ligands were definedusing the Autotors utility from the AutoDock suite ofprograms,70 disallowing only torsion rotations in peptidebonds, ring systems, guanidinium groups, and terminal bondsbetween heavy atoms. In the case of the TAR-Arg structure,an arginine was present in the PDB file instead of anargininamide.11 For the docking experiments, we modeledthe argininamide by substituting the carboxylate group ofarginine with an amide group.
Docking Parameters. For each docking, 100 independentdocking runs were performed with AutoDock 3.05 using theknowledge-based scoring function DrugScoreRNA 67 andholding the TAR RNA structures rigid. The Lamarckiangenetic algorithm was applied using standard parametersprovided by AutoDock, with an initial population size of100, a termination criterion of 3 × 10⁶ energy evaluations,mutation and crossover rates of 0.8 and 0.02, respectively,a local search frequency of 0.06, and maximal 300 iterations.The final rank was determined only by intermolecularenergies. At the end, the 100 generated ligand conformationswere clustered using a rsmd tolerance of 1 Å. Solutions withrmsd < 2.5 Å with respect to the experimentally determinedstructure are considered as native-like/successful.
RESULTS AND DISCUSSION
Root-Mean-Square Atomic Fluctuations from MD,REMD, and FRODA Simulations. Initially, the simulationresults are compared to characteristics of atomic motions asobtained from conformational changes within the experi-mentally determined free NMR ensemble (Figure 3). Root-mean-square atomic fluctuations of all atoms as obtainedfrom MD, REMD, and FRODA trajectories on the TAR-free, TAR-AcP, TAR-Arg, and TAR-NeoB structures aregiven in Figure 3.
Imax ) maxi,j
|uiF · VjF|
(uiF · u
iF)
1/2(VjF · VjF)
1/2
(1)
∆Gfreefbound ) -RT ln(Nbound
Nfree) (2)
Table 1. Average Backbone Torsion Angles of Canonical A-FormRNA63
torsion angle atoms involved rangea
R O3′(n-1)-P-O5′-C5′ -95 to -50� P-O5′-C5′-C4′ 165 to -150γ O5′-C5′-C4′-C3′ 45 to 60δ C5′-C4′-C3′-O3′ 75 to 95ε C4′-C3′-O3′-P 170 to -150� C3′-O3′-P-O5′(n+1) -85 to -40
� O4′-C1′-N1-C2b syn, 90 to 0O4′-C1′-N9-C4c anti, -120 to 180
a In degrees; ranges are given in clockwise rotation. b Forpyrimidine bases. c For purine bases.
1492 J. Chem. Inf. Model., Vol. 50, No. 8, 2010 FULLE ET AL.

Figure 3. Root-mean-square fluctuations of unbound HIV-1 TAR RNA as obtained from the NMR ensemble (red, continuous lines), MD(gray, continuous lines), REMD (black, continuous lines), and FRODA (blue, dashed lines) simulations. (a) TAR-free, (b) TAR-AcP, (c)TAR-Arg, and (d) TAR-NeoB structures were used as starting structures. Upper panels: The free NMR ensemble is compared with theREMD trajectories of the TAR-free, TAR-AcP, TAR-Arg, and TAR-NeoB structures, respectively. Lower panels: The MD, REMD, andFRODA trajectories of the TAR-free, TAR-AcP, TAR-Arg, and TAR-NeoB structures are compared. The bulge (nucleotides U23-U25)and the loop (nucleotides C30-A35) regions are indicated.
Figure 2. Chemical structures of the ligands used in this study: argininamide (1), acetylpromazine (2), neomycin B (3), Rbt158 (4), Rbt203(5), and Rbt550 (6).
CONFORMATIONAL TRANSITIONS OF HIV-1 TAR RNA J. Chem. Inf. Model., Vol. 50, No. 8, 2010 1493

The overall trends of experimental fluctuations are repro-duced very well by the REMD trajectories in the case of theTAR-free and TAR-AcP structures (Figure 3a and b),although details do not compare perfectly. Not surprisingly,the largest deviations between experimentally determined andcomputed fluctuations occur in the most mobile regions ofTAR RNA, the bulge and the loop. As such, the pronouncedexperimental fluctuations of nucleotide U25, which ispartially or transiently looped out of the helix in the freestate,10 are underestimated in both cases, whereas thefluctuations of nucleotide A35 are slightly overestimated inthe REMD simulation of the TAR-free structure. Still,sampling is impressive given that fluctuations up to 10 Åare correctly reproduced by the REMD simulation of theTAR-free structure. For TAR-Arg and TAR-NeoB, locationsof maxima of computed atomic fluctuations, as obtained fromthe REMD trajectory, again compare favorably with thosedetermined from the free TAR RNA NMR ensemble (Figure3c and d). However, in these two cases, the computed atomicfluctuations are generally too low compared to experiment.
When comparing atomic fluctuations obtained from theREMD trajectories with those obtained from MD andFRODA trajectories (lower panel in Figure 3), quantitativelysimilar patterns are observed in the case of the TAR-freestructure. The experimental fluctuation pattern of nucleotideA35 is even better reproduced by MD and FRODA simula-tions than by REMD. In our opinion, it is striking that theFRODA approach, despite being conceptually much simpler,performs equally well compared to MD and REMD simula-tions in sampling large conformational movements in thebulge and loop regions of TAR RNA. A major reason isthat the rigid-cluster decomposition of the TAR-free structure(Supporting Information, Figure S1) results in two largerrigid clusters located at the lower (comprising nucleotidesG17-G21 and C41-C45) and upper (comprising nucleotidesG26-G28 and C37-C39) stems, which are linked byflexible bulge and loop regions. This rigid-cluster decom-position reflects experimental findings that in the freeconformation of TAR RNA the two stable helical stemscollectively undergo a large-amplitude, hinge-like motionaround the flexible bulge region.4,6 Consequently, when usedas input to the constrained geometrical simulation FRODA,TAR RNA motions are successfully predicted based on theidentified bonds that limit motion within molecules and theircoupling.
A different picture emerges in the case of TAR-AcP. First,while the REMD fluctuation pattern of the loop region ismatched very well by the FRODA simulation, the fluctuationvalues obtained from the MD simulation are in general toolow. Second, FRODA and MD simulations both underesti-mate fluctuations in the bulge region. This is not surprisingin the case of the FRODA simulation, given that for thisregion a large rigid cluster was identified by the precedingflexibility analysis (Supporting Information, Figure S1).
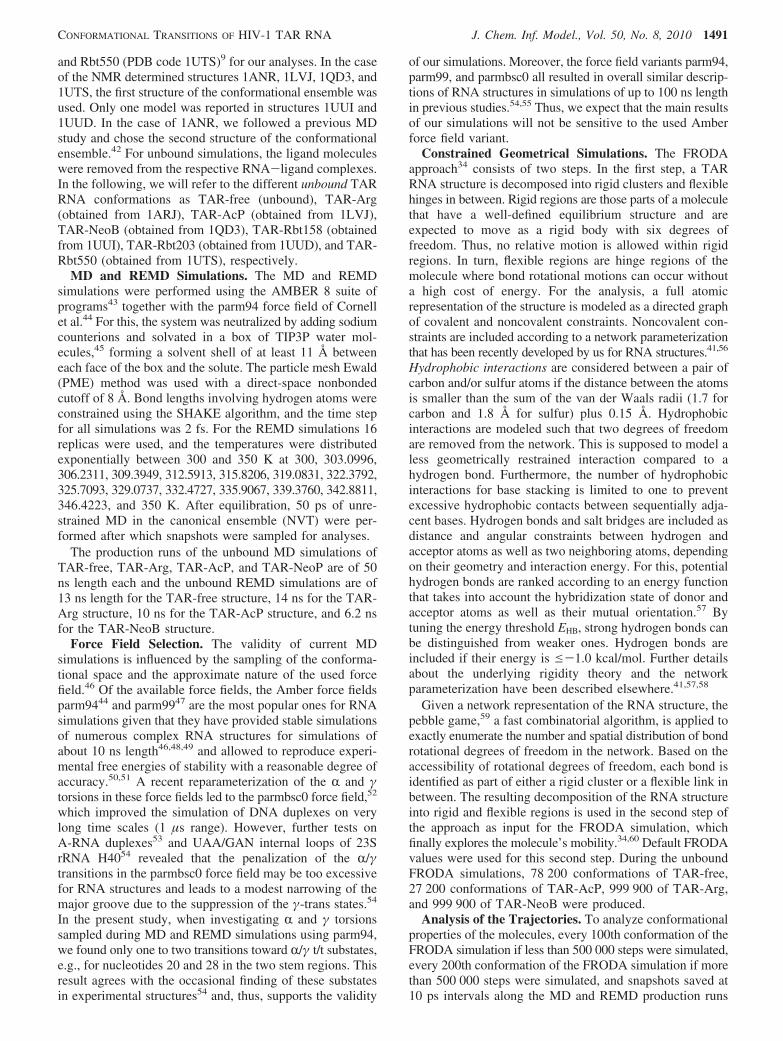
Analysis of the Stereochemical Quality of the Gener-ated Structures. The generated TAR RNA conformationswere further analyzed by calculating the backbone torsionangles R, �, γ, δ, ε, and �, the torsion angles of the glycosidicbond �, and the puckering mode of the ribose.62 Sampledtorsion angles of the TAR-free starting structure are plottedin Figure 4 for A20 of the lower stem, U23 of the bulgeregion, G28 of the upper stem, and G32 of the loop region.
The range of average backbone torsion angles of canonicalA-form RNA structures (Table 1) are indicated for com-parison.63 Corresponding plots for TAR-Arg, TAR-AcP, andTAR-NeoB structures are given in the Supporting Informa-tion (Figures S2-S4).
The sampled range of torsion angles of the MD and REMDsimulations are strikingly similar, with larger deviationsfound for the U23 bulge and G32 loop nucleotides comparedto that of the two stem nucleotides, A20 and G28. Theglycosidic bonds of the stem nucleotides A20 and G28 staypreferably in the anti conformation, whereas the U23 bulgeand G32 loop nucleotides sample much larger ranges of �values, varying between -180° and 90°. Fluctuations aboutthe glycosidic bond do not occur independently but lead toconcerted torsion angle fluctuations in the sugar-phosphatebackbone and the sugar puckering mode.71 Along these lines,the distribution of the backbone torsion angles of the A20and G28 stem nucleotides are close to those of standardA-form helices, whereas the backbone torsion angles of theG23 bulge and G32 loop nucleotides rotate more freely. Theonly exception is the backbone angle γ, which shows abimodal distribution about 60° and 180° in the stemnucleotides A20 and G28. In general, these observations arealso true for other nucleotides of the stem, bulge, and loopregions (data not shown), except terminal stem nucleotides.These are less ordered than central stem nucleotides, whichis consistent with the pronounced atomic fluctuations foundin these regions (Figure 3).
In contrast to the sampling of preferred torsion angles byMD and REMD simulations, in the case of FRODAsimulations, torsion angles either are mostly freely sampled,as in the case of R and γ of the U23 bulge nucleotide, orremain fixed at the starting value, as in the case of all torsionangles of the A20 stem nucleotide. Only in some cases, e.g.,for torsion angles ε and � of the U23 bulge and G32 loopnucleotides, respectively, a restricted torsion angle range isobserved, which is probably due to steric hindrances of thesenucleotides.
On the one hand, fully fixed torsion angles are observedin FRODA simulations if a nucleotide is part of a rigidcluster, whose atoms are moved collectively per simulationstep without any internal motions allowed. This is true perse for all ribose moieties, as five-membered rings come outas rigid bodies from the flexibility analysis. Modeling abiomacromolecule in such a coarse-grained fashion has beenfound to not impair the prediction of finite amplitudemotions, however, as shown for proteins72,73 and other RNAmolecules,41 provided that the decomposition in rigid andflexible regions is based on an appropriate network repre-sentation.41 On the other hand, the free sampling of someof the torsion angles in bulge and loop nucleotides is aconsequence of the random walk strategy used by FRODAand calls for a restriction of torsion angles to preferred ranges.As such, knowledge about discrete dihedral angle combina-tions could be integrated into FRODA. Such a modeling ofrotameric states in terms of torsion angle constraints has beenshown to significantly improve the stereochemistry of proteinconformations sampled by the NMSim approach.73
The average puckering mode of nucleotides of the MD(REMD) trajectories of the TAR-free structure amounts to(Supporting Information, Table S1) 70% (63%) in a C3′-endo conformation and only 5% (7%) in a C2′-endo
1494 J. Chem. Inf. Model., Vol. 50, No. 8, 2010 FULLE ET AL.
conformation in the stem region, 30% (18%) in a C3′-endoconformation and 29% (50%) in a C2′-endo conformationin the bulge region, and 20% (26%) in a C3′-endo conforma-tion and 39% (34%) in a C2′-endo conformation in the loopregion. This is consistent with previous findings that theribose in A-form RNA prefers the C3′-endo form but thatoutside regular helices, RNA riboses adopt C2′-endoconformations.63,74 With respect to the average populatedpuckering mode, MD and REMD simulations show ingeneral similar results for the stem and loop regions(Supporting Information, Table S1). However, compared to
the MD simulation, more C2′-endo conformations aresampled in the bulge region during the REMD simulation,which may be due to better sampling by the latter approach.The majority of the bulge nucleotides being in a C2′-endoconformation is consistent with previous MD75,76 and NMRstudies2 on bulge systems. As already mentioned above, dueto the rigid character of riboses in the FRODA approach,the puckering mode does not change from its startingstructure value in FRODA simulations. Modeling the ribosering as flexible instead yielded significantly worse mobilitypredictions for RNA structures in a previous study.41
Figure 4. Conformation wheels depicting sampled backbone and glycosidic torsion angles of exemplary nucleotides in the stem, bulge, andloop regions during MD, REMD, and FRODA simulations of the TAR-free structure. Torsion angles are given in the range of -180° to180°. The occurrence of a particular torsion angle is denoted by a radial line at the appropriate angular location. Ranges of average backbonetorsion angles of canonical A-form RNA structures (black lines) and syn and anti ranges of the glycosidic bond are indicated.63
CONFORMATIONAL TRANSITIONS OF HIV-1 TAR RNA J. Chem. Inf. Model., Vol. 50, No. 8, 2010 1495
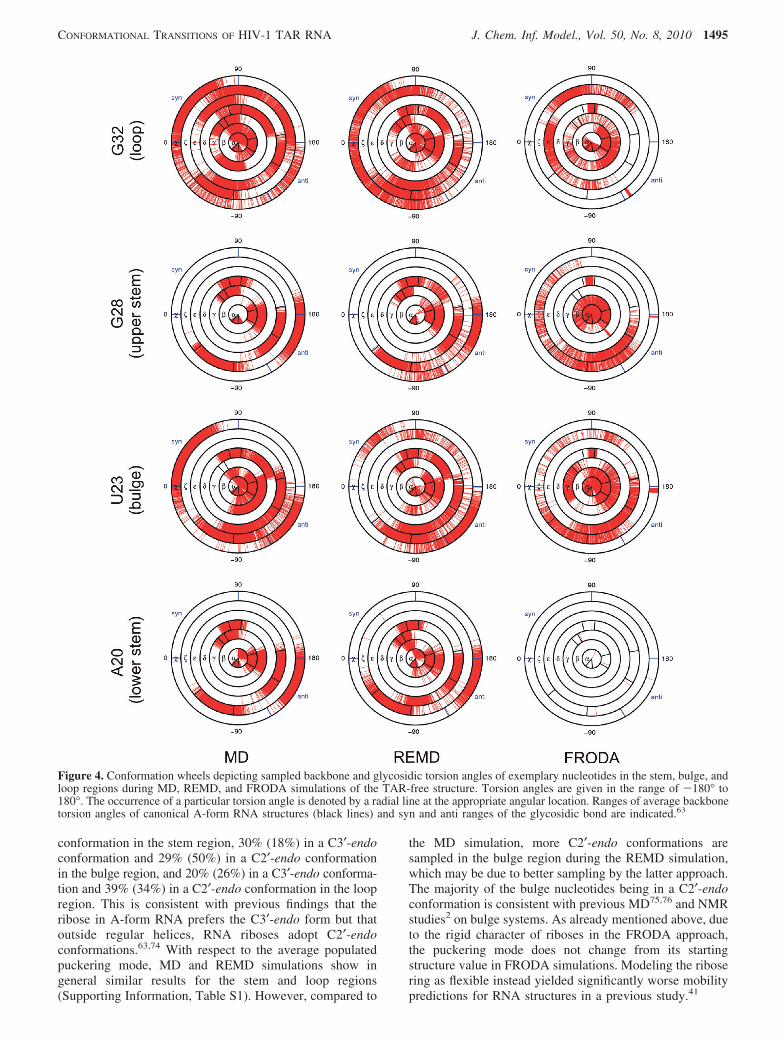
Essential Dynamics of Unbound and Bound TARRNA Structures. Unbound TAR RNA can transientlysample distinct bound conformations according to experi-mental evidence.4,5,25 We thus analyzed all trajectories asto whether unbound TAR RNA also samples bound confor-mations during MD, REMD, and FRODA simulations. Forthis, essential motions were calculated from simulated TARRNA ensembles and compared with essential motionsderived from the ensemble of experimentally determinedunbound and bound TAR RNA molecules. As an example,in Figure 5, essential motions derived from the experimentalensemble and from the REMD-generated ensemble of theTAR-free starting structure are mapped onto the TAR-freestructure for those two modes that show the maximal overlap(eq 1). All maximal overlap values Imax for modes of essentialmotions derived from the experimental ensemble and fromsimulation-generated ensembles for all starting structures aregiven in Table 2.
Using MD simulations, Imax g 0.68 is found for all fourstarting structures, with Imax ≈ 0.8 found for TAR-Arg andTAR-NeoB starting structures. Very similar results areobserved for REMD simulations, except for the simulationstarted from the TAR-Arg structure (Imax ) 0.56 comparedto Imax ) 0.78 obtained for the MD simulation). Thus, giventhat at least twice as much total simulation time was appliedfor the REMD simulations in comparison to the MDsimulations, it is discouraging that the enhanced samplingtechnique apparently does not provide a better sampling ofknown conformational transitions than that of standard MD.Comparing these results with those obtained for FRODAsimulations, in general lower Imax ≈ 0.60 is found for thelatter. Only in the case of the TAR-AcP starting structure,the FRODA-generated ensemble yields Imax ) 0.73, slightlyhigher than found in MD and REMD simulations.
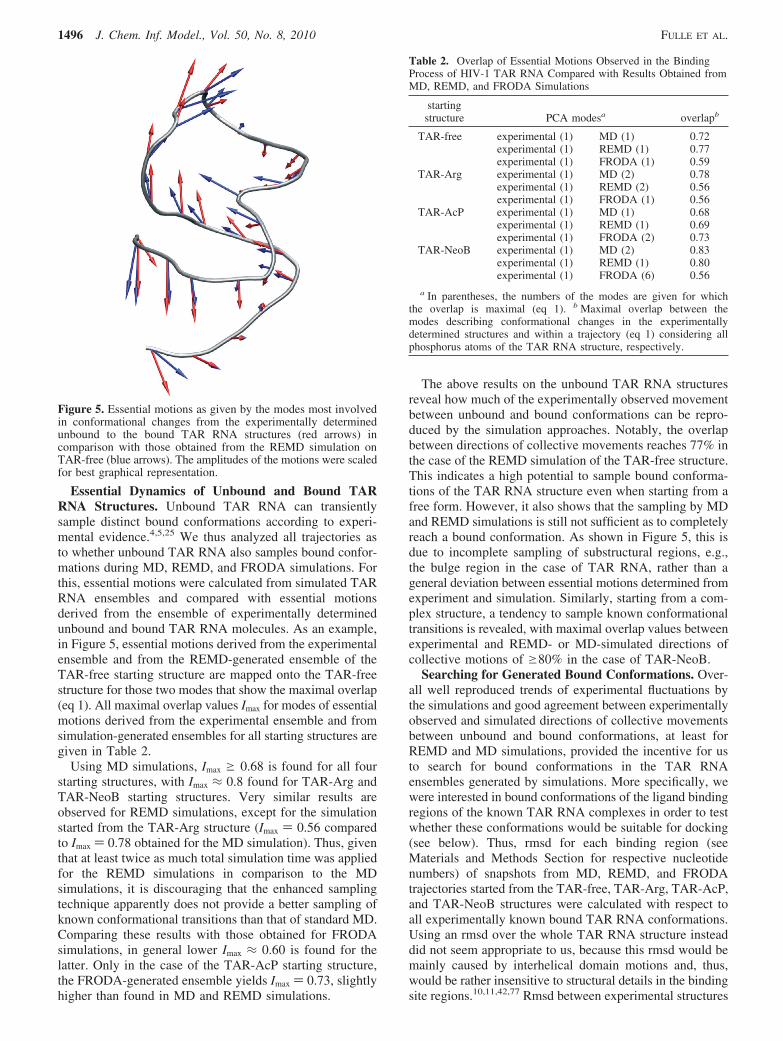
The above results on the unbound TAR RNA structuresreveal how much of the experimentally observed movementbetween unbound and bound conformations can be repro-duced by the simulation approaches. Notably, the overlapbetween directions of collective movements reaches 77% inthe case of the REMD simulation of the TAR-free structure.This indicates a high potential to sample bound conforma-tions of the TAR RNA structure even when starting from afree form. However, it also shows that the sampling by MDand REMD simulations is still not sufficient as to completelyreach a bound conformation. As shown in Figure 5, this isdue to incomplete sampling of substructural regions, e.g.,the bulge region in the case of TAR RNA, rather than ageneral deviation between essential motions determined fromexperiment and simulation. Similarly, starting from a com-plex structure, a tendency to sample known conformationaltransitions is revealed, with maximal overlap values betweenexperimental and REMD- or MD-simulated directions ofcollective motions of g80% in the case of TAR-NeoB.
Searching for Generated Bound Conformations. Over-all well reproduced trends of experimental fluctuations bythe simulations and good agreement between experimentallyobserved and simulated directions of collective movementsbetween unbound and bound conformations, at least forREMD and MD simulations, provided the incentive for usto search for bound conformations in the TAR RNAensembles generated by simulations. More specifically, wewere interested in bound conformations of the ligand bindingregions of the known TAR RNA complexes in order to testwhether these conformations would be suitable for docking(see below). Thus, rmsd for each binding region (seeMaterials and Methods Section for respective nucleotidenumbers) of snapshots from MD, REMD, and FRODAtrajectories started from the TAR-free, TAR-Arg, TAR-AcP,and TAR-NeoB structures were calculated with respect toall experimentally known bound TAR RNA conformations.Using an rmsd over the whole TAR RNA structure insteaddid not seem appropriate to us, because this rmsd would bemainly caused by interhelical domain motions and, thus,would be rather insensitive to structural details in the bindingsite regions.10,11,42,77 Rmsd between experimental structures
Figure 5. Essential motions as given by the modes most involvedin conformational changes from the experimentally determinedunbound to the bound TAR RNA structures (red arrows) incomparison with those obtained from the REMD simulation onTAR-free (blue arrows). The amplitudes of the motions were scaledfor best graphical representation.
Table 2. Overlap of Essential Motions Observed in the BindingProcess of HIV-1 TAR RNA Compared with Results Obtained fromMD, REMD, and FRODA Simulations
startingstructure PCA modesa overlapb
TAR-free experimental (1) MD (1) 0.72experimental (1) REMD (1) 0.77experimental (1) FRODA (1) 0.59
TAR-Arg experimental (1) MD (2) 0.78experimental (1) REMD (2) 0.56experimental (1) FRODA (1) 0.56
TAR-AcP experimental (1) MD (1) 0.68experimental (1) REMD (1) 0.69experimental (1) FRODA (2) 0.73
TAR-NeoB experimental (1) MD (2) 0.83experimental (1) REMD (1) 0.80experimental (1) FRODA (6) 0.56
a In parentheses, the numbers of the modes are given for whichthe overlap is maximal (eq 1). b Maximal overlap between themodes describing conformational changes in the experimentallydetermined structures and within a trajectory (eq 1) considering allphosphorus atoms of the TAR RNA structure, respectively.
1496 J. Chem. Inf. Model., Vol. 50, No. 8, 2010 FULLE ET AL.
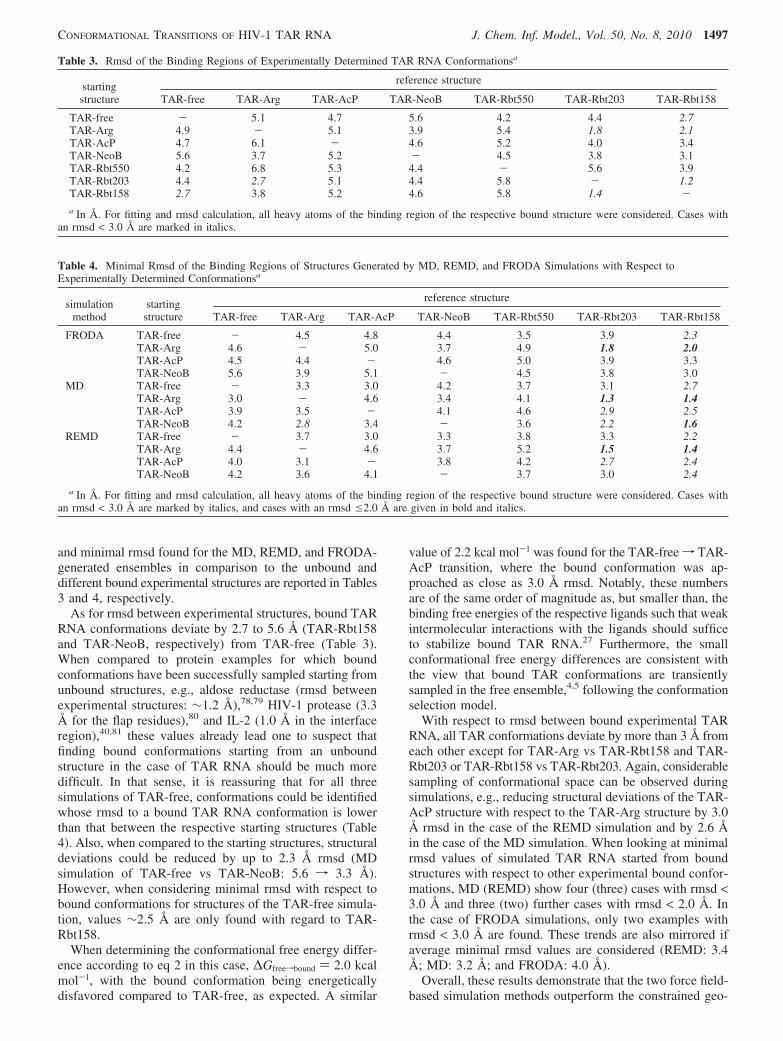
and minimal rmsd found for the MD, REMD, and FRODA-generated ensembles in comparison to the unbound anddifferent bound experimental structures are reported in Tables3 and 4, respectively.
As for rmsd between experimental structures, bound TARRNA conformations deviate by 2.7 to 5.6 Å (TAR-Rbt158and TAR-NeoB, respectively) from TAR-free (Table 3).When compared to protein examples for which boundconformations have been successfully sampled starting fromunbound structures, e.g., aldose reductase (rmsd betweenexperimental structures: ∼1.2 Å),78,79 HIV-1 protease (3.3Å for the flap residues),80 and IL-2 (1.0 Å in the interfaceregion),40,81 these values already lead one to suspect thatfinding bound conformations starting from an unboundstructure in the case of TAR RNA should be much moredifficult. In that sense, it is reassuring that for all threesimulations of TAR-free, conformations could be identifiedwhose rmsd to a bound TAR RNA conformation is lowerthan that between the respective starting structures (Table4). Also, when compared to the starting structures, structuraldeviations could be reduced by up to 2.3 Å rmsd (MDsimulation of TAR-free vs TAR-NeoB: 5.6 f 3.3 Å).However, when considering minimal rmsd with respect tobound conformations for structures of the TAR-free simula-tion, values ∼2.5 Å are only found with regard to TAR-Rbt158.
When determining the conformational free energy differ-ence according to eq 2 in this case, ∆Gfreefbound ) 2.0 kcalmol-1, with the bound conformation being energeticallydisfavored compared to TAR-free, as expected. A similar
value of 2.2 kcal mol-1 was found for the TAR-freef TAR-AcP transition, where the bound conformation was ap-proached as close as 3.0 Å rmsd. Notably, these numbersare of the same order of magnitude as, but smaller than, thebinding free energies of the respective ligands such that weakintermolecular interactions with the ligands should sufficeto stabilize bound TAR RNA.27 Furthermore, the smallconformational free energy differences are consistent withthe view that bound TAR conformations are transientlysampled in the free ensemble,4,5 following the conformationselection model.
With respect to rmsd between bound experimental TARRNA, all TAR conformations deviate by more than 3 Å fromeach other except for TAR-Arg vs TAR-Rbt158 and TAR-Rbt203 or TAR-Rbt158 vs TAR-Rbt203. Again, considerablesampling of conformational space can be observed duringsimulations, e.g., reducing structural deviations of the TAR-AcP structure with respect to the TAR-Arg structure by 3.0Å rmsd in the case of the REMD simulation and by 2.6 Åin the case of the MD simulation. When looking at minimalrmsd values of simulated TAR RNA started from boundstructures with respect to other experimental bound confor-mations, MD (REMD) show four (three) cases with rmsd <3.0 Å and three (two) further cases with rmsd < 2.0 Å. Inthe case of FRODA simulations, only two examples withrmsd < 3.0 Å are found. These trends are also mirrored ifaverage minimal rmsd values are considered (REMD: 3.4Å; MD: 3.2 Å; and FRODA: 4.0 Å).
Overall, these results demonstrate that the two force field-based simulation methods outperform the constrained geo-
Table 3. Rmsd of the Binding Regions of Experimentally Determined TAR RNA Conformationsa
reference structurestartingstructure TAR-free TAR-Arg TAR-AcP TAR-NeoB TAR-Rbt550 TAR-Rbt203 TAR-Rbt158
TAR-free - 5.1 4.7 5.6 4.2 4.4 2.7TAR-Arg 4.9 - 5.1 3.9 5.4 1.8 2.1TAR-AcP 4.7 6.1 - 4.6 5.2 4.0 3.4TAR-NeoB 5.6 3.7 5.2 - 4.5 3.8 3.1TAR-Rbt550 4.2 6.8 5.3 4.4 - 5.6 3.9TAR-Rbt203 4.4 2.7 5.1 4.4 5.8 - 1.2TAR-Rbt158 2.7 3.8 5.2 4.6 5.8 1.4 -a In Å. For fitting and rmsd calculation, all heavy atoms of the binding region of the respective bound structure were considered. Cases with
an rmsd < 3.0 Å are marked in italics.
Table 4. Minimal Rmsd of the Binding Regions of Structures Generated by MD, REMD, and FRODA Simulations with Respect toExperimentally Determined Conformationsa
reference structuresimulation
methodstartingstructure TAR-free TAR-Arg TAR-AcP TAR-NeoB TAR-Rbt550 TAR-Rbt203 TAR-Rbt158
FRODA TAR-free - 4.5 4.8 4.4 3.5 3.9 2.3TAR-Arg 4.6 - 5.0 3.7 4.9 1.8 2.0TAR-AcP 4.5 4.4 - 4.6 5.0 3.9 3.3TAR-NeoB 5.6 3.9 5.1 - 4.5 3.8 3.0
MD TAR-free - 3.3 3.0 4.2 3.7 3.1 2.7TAR-Arg 3.0 - 4.6 3.4 4.1 1.3 1.4TAR-AcP 3.9 3.5 - 4.1 4.6 2.9 2.5TAR-NeoB 4.2 2.8 3.4 - 3.6 2.2 1.6
REMD TAR-free - 3.7 3.0 3.3 3.8 3.3 2.2TAR-Arg 4.4 - 4.6 3.7 5.2 1.5 1.4TAR-AcP 4.0 3.1 - 3.8 4.2 2.7 2.4TAR-NeoB 4.2 3.6 4.1 - 3.7 3.0 2.4
a In Å. For fitting and rmsd calculation, all heavy atoms of the binding region of the respective bound structure were considered. Cases withan rmsd < 3.0 Å are marked by italics, and cases with an rmsd e2.0 Å are given in bold and italics.
CONFORMATIONAL TRANSITIONS OF HIV-1 TAR RNA J. Chem. Inf. Model., Vol. 50, No. 8, 2010 1497

metrical simulation method FRODA in sampling the TARRNA conformational space. A possible reason is that theinitial constraint network is not changed during FRODAsimulations, which may result in too strict a limitation ofmovements. Instead, breaking and reformation of constraintsduring the simulation may be necessary to achieve confor-mational transitions as large as observed for TAR RNA.Furthermore, it is encouraging to note that rmsd deviationsbetween TAR RNA binding sites could be reduced by ∼3Å with respect to the starting structures. However, an overallsimulation time of >200 ns in the case of the REMDsimulation of the TAR-free structure is apparently still notsufficient to overcome structural differences of 5.6 Å rmsdbetween TAR-free and TAR-NeoB structures.
Docking into Sampled TAR RNA Structures. Next, weinvestigated whether simulated TAR RNA conformations thathave been identified as being close to bound conformationsof other complex structures can be used as receptor structuresfor docking. For this, we extracted those generated confor-mations that have a minimal rmsd value <3.0 Å comparedto another reference bound structures. This resulted in 17TAR RNA conformations, into which the respective knownTAR RNA ligand was docked using AutoDock together withDrugScoreRNA 67 as an objective function. The docking resultsare summarized in the Supporting Information, Table S2. Inno case, a ‘good’ docking solution (rmsd e 2.5 Å to thenative structure)15 was found on the first scoring rank or inthe largest cluster of generated ligand poses. However, forconformations extracted from MD and REMD simulationsof the TAR-Arg structure in comparison with TAR-Rbt203(rmsd of the binding pocket region e1.5 Å), docking poseswith rmsd < 2.5 Å to the native structure had been generatedamong all 100 solutions, respectively (Figure 6). In the caseof the FRODA simulations, no ‘good’ docking pose couldbe generated, which may result from less closely approaching
the bound TAR RNA conformations during the simulationsas well as the lower stereochemical quality of the generatedconformations.
When assessing these results, it should be considered thatdocking to RNA structures is still more challenging than thatto proteins.24 In fact, the best success rates reported so farfor docking solutions on the first rank are 42% (45%) for adata set of 31 RNA complexes using a 2.0 Å (2.5 Å) rmsdcutoff when docking with AutoDock/DrugScoreRNA 67 and65% (74%) for a data set of 57 RNA complexes used in astudy by Guilbert et al.15 When tested on 28 complexescommon to both studies, both methods perform equally(AutoDock/DrugScoreRNA: 50%; and Guilbert et al.: 57%).15
We note that this already appoints to a strong data setdependence.24 In the case of the TAR RNA structures, bothmethods perform less satisfyingly, even in redocking experi-ments (Supporting Information, Table S3). Out of six cases,the method of Guilbert et al. identifies a good bindinggeometry on the first rank only for the TAR-NeoB complex(rmsd ) 2.47 Å), and AutoDock/Drug-ScoreRNA succeedsin the TAR-NeoB (rmsd ) 0.88 Å) and the TAR-Rbt203(rmsd ) 1.59 Å) cases.
Overall, this demonstrates that some of the simulation-generated bound TAR RNA conformations are apparentlysimilar enough to an experimentally determined complexTAR RNA structure such as to allow for successful posegeneration. As a prerequisite for successful docking into thegenerated structures, a rmsd of respective binding pocketregions ∼1.5 Å was identified. Even in the case of successfuldocking the Rbt203 ligand into TAR-Arg, sampling ad-ditional TAR-RNA conformations turned out to be essential.In this case, cross-docking the Rbt203 ligand into theexperimentally determined TAR-Arg structure failed toproduce ‘good’ ligand poses, although the experimentallydetermined TAR-Arg and TAR-Rbt203 structures differ by
Figure 6. Alignment of TAR-Rbt203 (purple) and TAR-Arg (orange) used either as starting structures or as generated during MD andREMD simulations, respectively. The alignments with the lowest rmsd of the binding regions are given. For alignment only the nucleotidese5 Å apart from the ligand Rbt203 were considered. The rmsd of the TAR RNA structures are given for the binding pocket region (rmsd-br) and for nucleotides C19-G43 (rmsd-tot). Docking solutions (orange) with minimal rmsd to the native ligand conformations (yellow)are shown.
1498 J. Chem. Inf. Model., Vol. 50, No. 8, 2010 FULLE ET AL.
only 1.8 Å rmsd. Not being able to identify these poses onthe first rank or as members of the largest cluster must thenbe attributed to a weakness of the applied scoring functionand, consequently, calls for further improvement here. Whenrelated to the protein-ligand docking field, for which muchmore experience is available, these results are encouragingin that a drop in docking accuracy compared to redockingwas often found to be mirrored by the degree to which aprotein moves upon ligand binding,82,83 so that docking toan apo form usually shows the largest deterioration.84 In thisregard, being able to move closer to a bound conformationby up to 2.3 Å rmsd, as in the case of TAR-free versus TAR-NeoB, and to come as close as 2.2 Å rmsd to a boundconformation, as in the case of TAR-free versus TAR-Rbt158, already is a valuable achievement.
Abbreviations. TAR-free, conformation of HIV-1 TARRNA in the free state; TAR-Arg, conformation of HIV-1TAR RNA when bound to argininamide; TAR-AcP, con-formation of HIV-1 TAR RNA when bound to acetylpro-mazine; TAR-NeoB, conformation of HIV-1 TAR RNAwhen bound to neomycin B; TAR-Rbt158, conformation ofHIV-1 TAR RNA when bound to Rbt158; TAR-Rbt203,conformation of HIV-1 TAR RNA when bound to Rbt203;TAR-Rbt550, conformation of HIV-1 TAR RNA whenbound to Rbt550.
CONCLUSIONS
Several X-ray crystallography, nuclear magnetic resonance(NMR) spectroscopy, and molecular dynamics (MD) studieshave provided insights into the structure, dynamics, andbinding properties of HIV-1 TAR RNA, thus making it avaluable test case for simulation methods for RNA. Here,we have performed MD and replica-exchange moleculardynamics (REMD) simulations on the unbound humanimmunodeficiency virus type-1 (HIV-1) TAR RNA structureand on three TAR RNA structures in a bound conformation,totaling ∼250 ns in length, in order to compare the extentof sampling with that of the constrained geometrical simula-tion approach FRODA and the quality of the generatedconformations.
Root-mean-square atomic fluctuations obtained from un-bound REMD simulations agreed very well with character-istics of atomic motions as obtained from conformationalchanges within the experimentally determined NMR en-semble of the free structure. When comparing atomicfluctuations obtained by REMD simulations with thoseobtained by MD and framework rigidity optimized dynamicalgorithm (FRODA) simulations, quantitatively similar pat-terns are observed in the case of the TAR-free structure. Thisresult is striking because FRODA, despite being conceptuallysimpler and computationally much cheaper, thus performedequally well in sampling local conformational movementsin the bulge and loop regions of TAR RNA. An appropriaterigid-cluster decomposition of TAR RNA used as input toFRODA turned out to be detrimental for success, and resultsfor FRODA-simulated bound TAR RNA conformationssuggest that using a less coarse-grained representation willbe advantageous in general. Regarding the stereochemicalquality of the generated conformations, backbone torsionangles and puckering modes of the sugar-phosphate back-bone were reproduced equally well by MD and REMD
simulations, but further improvement is needed in the caseof FRODA simulations. In particular, a restriction of torsionangles to preferred ranges by including knowledge aboutdiscrete dihedral angle combinations from experimentalstructures should be integrated into FRODA.
Another main goal of this study was to investigate whetherMD, REMD, or FRODA simulations are able to sampleknown bound conformations of HIV-1 TAR RNA whenstarting from an unbound structure. As indicated by essentialdynamics analysis, all three simulation approaches showeda tendency to sample bound conformations, with MD andREMD simulations being superior with respect to FRODA,as shown by maximal overlap values Imax for modes ofessential motions derived from the experimental and simula-tion-generated ensembles. This can be explained in thatFRODA generates new conformers by satisfying existingconstraints, so that only local motions consistent with theanalyzed constraint network can be observed. Instead,breaking and reformation of constraints during the simulationmay be necessary to achieve conformational transitions aslarge as observed for TAR RNA. The finding was alsocorroborated when structural deviations of the binding pocketregions of sampled conformations, which were started fromthe TAR-free structure, were evaluated with respect to boundTAR conformations. Notably, structural deviations could bereduced by up to 2.3 Å rmsd when compared to deviationsbetween experimental structures, although only in the TAR-Rbt158 case a minimal rmsd with respect to bound confor-mations of ∼2.5 Å was found, accompanied by a confor-mational free energy change of 2.0 kcal mol-1. With respectto rmsd between bound experimental TAR RNA, again,considerable sampling of conformational space could beobserved during simulations, which allowed reducing rmsddeviations between TAR RNA binding sites by 3.0 Å withrespect to deviations in the starting structures. When lookingat minimal rmsd values of simulated TAR RNA started frombound structures with respect to other experimental boundconformations, out of 14 cases, MD (REMD) showed four(three) instances with rmsd < 3.0 Å and three (two) caseswith rmsd < 2.0 Å.
These above results are consistent with the experimentalview that the bound TAR RNA is stabilized by weakintermolecular interactions with the ligand27 and that boundconformations are transiently sampled in the free ensemble,4,5
following the conformation selection model. The results arealso encouraging from an application point of view in thatthose simulated TAR RNA conformations can be used asreceptor structures for docking. In fact, simulation-generatedbound TAR RNA conformations with an rmsd of respectivebinding pocket regions <1.5 Å were found to be suitable forsuccessful pose generation.
At present, the question remains as to how one can identifysuitable bound conformations from the generated ensembleswithout already knowing an experimentally determinedbound conformation. An energetic evaluation appears to bedifficult, because the conformational variability of a receptorleads to a disfavorable reorganization energy that can be largeand vary strongly, even for relatively well preorganizedbinding sites.85 Instead, we propose to cluster the generatedconformations with respect to deviations in the bindingregions and to dock preferentially into cluster representativesof well-populated clusters.
CONFORMATIONAL TRANSITIONS OF HIV-1 TAR RNA J. Chem. Inf. Model., Vol. 50, No. 8, 2010 1499

As long as large conformational changes of the receptorremain a challenge for current docking approaches, dockinginto an ensemble of receptor structures generated, e.g., bysimulation techniques, provides an attractive alternative. Thisholds true especially for molecules like TAR RNA, whoseconformational transitions upon binding follow a conforma-tion selection model. The present study represents an attemptto fathom the scope and the limitations of this strategy inthe field of RNA-ligand recognition.
ACKNOWLEDGMENT
This work was supported by the DFG (SFB 579, “RNA-ligand interactions”), Goethe-University, Frankfurt, Germanyand Heinrich-Heine-University, Dusseldorf, Germany. S.F.acknowledges financial support from the Hessian ScienceProgram, the Frankfurt International Graduate School forScience (FIGSS), and the Otto-Stern-School in Frankfurt.H.G. acknowledges fruitful discussions at the workshop“Dynamics under constraints II”, McGill University’s BellairsResearch Institute, Barbados, 2007. We are grateful toChristopher Pfleger for assistance in generating wheel plotsand to the “Zentrum fuer Informations und Medientechnolo-gie” (ZIM) at the Heinrich Heine-University, Düsseldorf, forcomputational support.
Supporting Information Available: Tables with thepercent occupation of puckering modes and docking resultsas well as graphical representations of rigid-cluster decom-positions and sampled backbone and glycosidic torsion anglesof TAR RNA structures. This information is available freeof charge via the Internet at http://pubs.acs.org.
REFERENCES AND NOTES
(1) Al-Hashimi, H.; Walter, N. RNA dynamics: It is about time. Curr.Opin. Struct. Biol. 2008, 18, 321–329.
(2) Puglisi, J. D.; Tan, R.; Calnan, B. J.; Frankel, A. D.; Williamson,J. R. Conformation of the TAR RNA-arginine complex by NMRspectroscopy. Science 1992, 257, 76–80.
(3) Long, K. S.; Crothers, D. M. Characterization of the solutionconformations of unbound and Tat peptide-bound forms of HIV-1 TARRNA. Biochemistry 1999, 38, 10059–10069.
(4) Al-Hashimi, H. M.; Gosser, Y.; Gorin, A.; Hu, W.; Majumdar, A.;Patel, D. J. Concerted motions in HIV-1 TAR RNA may allow accessto bound state conformations: RNA dynamics from NMR residualdipolar couplings. J. Mol. Biol. 2002, 315, 95–102.
(5) Zhang, Q.; Sun, X.; Watt, E. D.; Al-Hashimi, H. M. Resolving themotional modes that code for RNA adaptation. Science 2006, 311,653–656.
(6) Musselman, C.; Al-Hashimi, H. M.; Andricioaei, I. iRED snalysis ofTAR RNA reveals motional coupling, long-range correlations, and adynamical hinge. Biophys. J. 2007, 93, 411–422.
(7) Cullen, B. R. Trans-activation of human immunodeficiency virusoccurs via a bimodal mechanism. Cell 1986, 46, 973–982.
(8) Gallego, J.; Varani, G. Targeting RNA with small-molecule drugs:Therapeutic promise and chemical challenges. Acc. Chem. Res. 2001,34, 836–843.
(9) Murchie, A. I.; Davis, B.; Isel, C.; Afshar, M.; Drysdale, M. J.; Bower,J.; Potter, A. J.; Starkey, I. D.; Swarbrick, T. M.; Mirza, S.; Prescott,C. D.; Vaglio, P.; Aboul-ela, F.; Karn, J. Structure-based drug designtargeting an inactive RNA conformation: Exploiting the flexibility ofHIV-1 TAR RNA. J. Mol. Biol. 2004, 336, 625–638.
(10) Aboul-ela, F.; Karn, J.; Varani, G. Structure of HIV-1 TAR RNA inthe absence of ligands reveals a novel conformation of the trinucleotidebulge. Nucleic Acids Res. 1996, 24, 3974–3981.
(11) Aboul-ela, F.; Karn, J.; Varani, G. The structure of the humanimmunodeficiency virus type-1 TAR RNA reveals principles of RNArecognition by Tat protein. J. Mol. Biol. 1995, 253, 313–332.
(12) Faber, C.; Sticht, H.; Schweimer, K.; Rosch, P. Structural rearrange-ments of HIV-1 Tat-responsive RNA upon binding of neomycin B.J. Biol. Chem. 2000, 275, 20660–20666.
(13) Du, Z.; Lind, K. E.; James, T. L. Structure of TAR RNA complexedwith a Tat-TAR interaction nanomolar inhibitor that was identifiedby computational screening. Chem. Biol. 2002, 9, 707–712.
(14) Davis, B.; Afshar, M.; Varani, G.; Murchie, A. I.; Karn, J.; Lentzen,G.; Drysdale, M.; Bower, J.; Potter, A. J.; Starkey, I. D.; Swarbrick,T.; Aboul-ela, F. Rational design of inhibitors of HIV-1 TAR RNAthrough the stabilisation of electrostatic “hot spots”. J. Mol. Biol. 2004,336, 343–356.
(15) Guilbert, C.; James, T. Docking to RNA via root-mean-square-deviation-driven energy minimization with flexible ligands and flexibletargets. J. Chem. Inf. Model. 2008, 48, 1257–1268.
(16) Moitessier, N.; Westhof, E.; Hanessian, S. Docking of aminoglycosidesto hydrated and flexible RNA. J. Med. Chem. 2006, 49, 1023–1033.
(17) Cavasotto, C. N.; Abagyan, R. A. Protein flexibility in ligand dockingand virtual screening to protein kinases. J. Mol. Biol. 2004, 337, 209–225.
(18) Huang, S. Y.; Zou, X. Q. Ensemble docking of multiple proteinstructures: Considering protein structural variations in moleculardocking. Proteins: Struct., Funct., Bioinf. 2007, 66, 399–421.
(19) Nabuurs, S. B.; Wagener, M.; De Vlieg, J. A flexible approach toinduced fit docking. J. Med. Chem. 2007, 50, 6507–6518.
(20) Cavasotto, C. N.; Kovacs, J. A.; Abagyan, R. A. Representing receptorflexibility in ligand docking through relevant normal modes. J. Am.Chem. Soc. 2005, 127, 9632–9640.
(21) Tozzini, V. Coarse-grained models for proteins. Curr. Opin. Struct.Biol. 2005, 15, 144–150.
(22) Bahar, I.; Rader, A. J. Coarse-grained normal mode analysis instructural biology. Curr. Opin. Struct. Biol. 2005, 15, 586–592.
(23) Kazemi, S.; Kruger, D. M.; Sirockin, F.; Gohlke, H. Elastic potentialgrids: Accurate and efficient representation of intermolecular interac-tions for fully flexible docking. ChemMedChem 2009, 4, 1264–1268.
(24) Fulle, S.; Gohlke, H. Molecular recognition of RNA. Challenges formodeling interactions and plasticity. J. Mol. Recognit. 2010, 23, 220–231.
(25) Zhang, Q.; Stelzer, A.; Fisher, C.; Al-Hashimi, H. Visualizing spatiallycorrelated dynamics that directs RNA conformational transitions.Nature 2007, 450, 1263–1267.
(26) Olsen, G. L.; Bardaro, M. F., Jr.; Echodu, D. C.; Drobny, G. P.; Varani,G. Intermediate rate atomic trajectories of RNA by solid-state NMRspectroscopy. J. Am. Chem. Soc. 2010, 132, 303–308.
(27) Al-Hashimi, H. M. Dynamics-based amplification of RNA functionand its characterization by using NMR spectroscopy. ChemBioChem2005, 6, 1506–1519.
(28) Tsai, C. J.; Ma, B. Y.; Nussinov, R. Folding and binding cascades:Shifts in energy landscapes. Proc. Natl Acad. Sci. U.S.A. 1999, 96,9970–9972.
(29) Tsai, C. J.; Kumar, S.; Ma, B. Y.; Nussinov, R. Folding funnels,binding funnels, and protein function. Protein Sci. 1999, 8, 1181–1190.
(30) Leulliot, N.; Varani, G. Current topics in RNA-protein recognition:Control of specificity and biological function through induced fit andconformational capture. Biochemistry 2001, 40, 7947–7956.
(31) Totrov, M.; Abagyan, R. Flexible ligand docking to multiple receptorconformations: A practical alternative. Curr. Opin. Struct. Biol. 2008,18, 178–184.
(32) Karplus, M.; McCammon, J. A. Molecular dynamics simulations ofbiomolecules. Nat. Struct. Biol. 2002, 9, 646–652.
(33) Sugita, Y.; Okamoto, Y. Replica-exchange molecular dynamics methodfor protein folding. Chem. Phys. Lett. 1999, 314, 141–151.
(34) Wells, S.; Menor, S.; Hespenheide, B.; Thorpe, M. F. Constrainedgeometric simulation of diffusive motion in proteins. Phys. Biol. 2005,2, S127–136.
(35) Lei, M.; Zavodszky, M. I.; Kuhn, L. A.; Thorpe, M. F. Samplingprotein conformations and pathways. J. Comput. Chem. 2004, 25,1133–1148.
(36) Gohlke, H.; Thorpe, M. F. A natural coarse graining for simulatinglarge biomolecular motion. Biophys. J. 2006, 91, 2115–2120.
(37) Macchiarulo, A.; Nuti, R.; Bellocchi, D.; Camaioni, E.; Pellicciari,R. Molecular docking and spatial coarse graining simulations as toolsto investigate substrate recognition, enhancer binding and conforma-tional transitions in indoleamine-2,3-dioxygenase (IDO). Biochim.Biophys. Acta 2007, 1774, 1058–1068.
(38) Jolley, C. C.; Wells, S. A.; Frornme, P.; Thorpe, M. F. Fitting low-resolution cryo-EM maps of proteins using constrained geometricsimulations. Biophys. J. 2008, 94, 1613–1621.
(39) Macchiarulo, A.; Giacche, N.; Carotti, A.; Baroni, M.; Gabriele, C.;Pellicciari, R. Targeting the conformational transitions of MDM2 andMDMX: Insights into dissimilarities and similarities of p53 recognition.J. Chem. Inf. Mod. 2008, 48, 1999–2009.
(40) Cozzini, P.; Kellogg, G. E.; Spyrakis, F.; Abraham, D. J.; Costantino,G.; Emerson, A.; Fanelli, F.; Gohlke, H.; Kuhn, L. A.; Morris, G. M.;
1500 J. Chem. Inf. Model., Vol. 50, No. 8, 2010 FULLE ET AL.

Orozco, M.; Pertinhez, T. A.; Rizzi, M.; Sotriffer, C. A. Targetflexibility: An emerging consideration in drug discovery and design.J. Med. Chem. 2008, 51, 6237–6255.
(41) Fulle, S.; Gohlke, H. Analysing the flexibility of RNA structures byconstraint counting. Biophys. J. 2008, 94, 4202–4219.
(42) Nifosi, R.; Reyes, C. M.; Kollman, P. A. Molecular dynamics studiesof the HIV-1 TAR and its complex with argininamide. Nucleic AcidsRes. 2000, 28, 4944–4955.
(43) Case, D. A.; Cheatham, T. E.; Darden, T.; Gohlke, H.; Luo, R.; Merz,K. M.; Onufriev, A.; Simmerling, C.; Wang, B.; Woods, R. J. TheAmber biomolecular simulation programs. J. Comput. Chem. 2005,26, 1668–1688.
(44) Cornell, W. D.; Cieplak, P.; Bayly, C. I.; Gould, I. R.; Merz Jr, K. M.;Ferguson, D. M.; Spellmeyer, D. C.; Fox, T.; Caldwell, J. W.; Kollman,P. A. A second generation force field for the simulation of proteins,nucleic acids, and organic molecules. J. Am. Chem. Soc. 1995, 117,5179–5197.
(45) Jorgensen, W.; Chandrasekhar, J.; Madura, J.; Impey, R.; Klein, M.Comparison of simple potential functions for simulating liquid water.J. Chem. Phys. 1983, 79, 926–935.
(46) Ditzler, M. A.; Otyepka, M.; Sponer, J.; Walter, N. G. Moleculardynamics and quantum mechanics of RNA: Conformational andchemical change we can believe in. Acc. Chem. Res. 2010, 43, 40–47.
(47) Cheatham, T. E.; Cieplak, P.; Kollman, P. A. A modified version ofthe Cornell et al. force field with improved sugar pucker phases andhelical repeat. J. Biomol. Struct. Dyn. 1999, 16, 845–862.
(48) McDowell, E. S.; Spackova, N. a.; Sponer, J.; Walter, N. Moleculardynamics simulations of RNA: An in silico single molecule approach.Biopolymers 2007, 85, 169–184.
(49) Orozco, M.; Noy, A.; Perez, A. Recent advances in the study of nucleicacid flexibility by molecular dynamics. Curr. Opin. Struct. Biol. 2008,18, 185–193.
(50) Freedman, H.; Huynh, L. P.; Le, L.; Cheatham, T. E.; Tuszynski, J. A.;Truong, T. N. Explicitly solvated ligand contribution to continuumsolvation models for binding free energies: Selectivity of theophyllinebinding to an RNA aptamer. J. Phys. Chem. B 2010, 114, 2227–2237.
(51) Kopitz, H.; Zivkovic, A.; Engels, J. W.; Gohlke, H. Determinants ofthe unexpected stability of RNA fluorobenzene self pairs. ChemBio-Chem 2008, 9, 2619–2622.
(52) Perez, A.; Marchan, I.; Svozil, D.; Sponer, J.; Cheatham, T.; Laughton,C.; Orozco, M. Refinement of the AMBER force field for nucleic acids:Improving the description of R/γ conformers. Biophys. J. 2007, 92,3817–3829.
(53) Besseova, I.; Otyepka, M.; Reblova, K.; Sponer, J. Dependence ofA-RNA simulations on the choice of the force field and salt strength.Phys. Chem. Chem. Phys. 2009, 11, 10701–10711.
(54) Reblova, K.; Strelcova, Z.; Kulhanek, P.; Besseova, I.; Mathews, D. H.;Van Nostrand, K.; Yildirim, I.; Turner, D. H.; Sponer, J. An RNAmolecular switch: Intrinsic flexibility of 23S rRNA helices 40 and 685′-UAA/5′-GAN internal loops studied by molecular dynamicsmethods. J. Chem. Theory Comput. 2010, 6, 910–929.
(55) Zhang, Y. F.; Zhao, X.; Mu, Y. G. Conformational transition map ofan RNA GCAA tetraloop explored by replica-exchange moleculardynamics simulation. J. Chem. Theory Comput. 2009, 5, 1146–1154.
(56) Fulle, S.; Gohlke, H. Constraint counting on RNA structures: Linkingflexibility and function. Methods 2009, 49, 181–188.
(57) Jacobs, D. J.; Rader, A. J.; Kuhn, L. A.; Thorpe, M. F. Proteinflexibility predictions using graph theory. Proteins 2001, 44, 150–165.
(58) Gohlke, H.; Kuhn, L. A.; Case, D. A. Change in protein flexibilityupon complex formation: Analysis of Ras-Raf using moleculardynamics and a molecular framework approach. Proteins 2004, 56,322–337.
(59) Jacobs, D. J.; Thorpe, M. F. Generic rigidity percolation: The pebblegame. Phys. ReV. Lett. 1995, 75, 4051–4054.
(60) Farrell, D. W.; Mamonova, T.; Kurnikova, M.; Thorpe, M. F.Generating pathways for free energy calculations in proteins usingconstraint-based conformational sampling. Biophys. J. 2009, 96, 407a.
(61) Ichiye, T.; Karplus, M. Collective motions in proteins: A covarianceanalysis of atomic fluctuations in molecular dynamics and normal modesimulations. Proteins: Struct., Funct., Genet. 1991, 11, 205–217.
(62) Lavery, R.; Sklenar, H. The definition of generalized helicoidalparameters and of axis curvature for irregular nucleic-acids. J. Biomol.Struct. Dyn. 1988, 6, 63–91.
(63) Saenger, W. Principles of Nucleic Acid Structure; Springer-Verlag:New York, 1984.
(64) Martinek, V.; Bren, U.; Goodman, M. F.; Warshel, A.; Florian, J. DNApolymerase beta catalytic efficiency mirrors the Asn279-dCTP H-bonding strength. FEBS Lett. 2007, 581, 775–780.
(65) Udommaneethanakit, T.; Rungrotmongkol, T.; Bren, U.; Frecer, V.;Stanislav, M. Dynamic behavior of avian influenza a virus neuramini-dase subtype H5N1 in complex with oseltamivir, zanamivir, peramivir,and their phosphonate analogues. J. Chem. Inf. Model. 2009, 49, 2323–2332.
(66) Bren, U.; Lah, J.; Bren, M.; Martinek, V.; Florian, J. DNA duplexstability: The role of preorganized electrostatics. J. Phys. Chem. B2010, 114, 2876–2885.
(67) Pfeffer, P.; Gohlke, H. DrugScoreRNA - Knowledge-based scoringfunction to predict RNA-ligand interactions. J. Chem. Inf. Model. 2007,47, 1868–1876.
(68) Schuttelkopf, A. W.; van Aalten, D. M. F. PRODRG: A tool for high-throughput crystallography of protein-ligand complexes. Acta Crys-tallogr., Sect. D: Biol. Crystallogr. 2004, 60, 1355–1363.
(69) Wang, J.; Wang, W.; Kollman, P. A.; Case, D. A. Automatic atomtype and bond type perception in molecular mechanical calculations.J. Mol. Graphics Modell. 2006, 25, 247–260.
(70) Morris, G.; Goodsell, D.; Halliday, R.; Huey, R.; Hart, W.; Belew,R.; Olson, A. Automated docking using a Lamarckian geneticalgorithm and an empirical binding free energy function. J. Comput.Chem. 1999, 19, 1639–1662.
(71) Ravindranathan, S.; Kim, C.-H.; Bodenhausen, G. Cross correlationsbetween 13C-1H dipolar interactions and 15N chemical shift anisotropyin nucleic acids. J. Biomol. NMR 2003, 27, 365–375.
(72) Ahmed, A.; Gohlke, H. Multiscale modeling of macromolecularconformational changes combining concepts from rigidity and elasticnetwork theory. Proteins 2006, 63, 1038–1051.
(73) Ahmed, A.; Gohlke, H. Multiscale modeling of macromolecularconformational changes, In Proceedings of the 1st InternationalConference on Computational & Mathematical Biomedical Engineer-ing - CMBE09; Nithiarasu, P., Lohner, R., Eds.; Swansea: U.K., 2009;pp 219-222.
(74) Auffinger, P.; Westhof, E. Rules governing the orientation of the 2′-hydroxyl group in RNA. J. Mol. Biol. 1997, 27, 454–63.
(75) Feig, M.; Zacharias, R.; Pettitt, B. M. Conformations of an adeninebulge in a DNA octamer and its influence on DNA structure frommolecular dynamics simulations. Biophys. J. 2001, 81, 352–370.
(76) Barthel, A.; Zacharias, M. Conformational transitions in RNA singleuridine and adenosine bulge structures: A molecular dynamics freeenergy simulation study. Biophys. J. 2006, 90, 2450–2462.
(77) Allain, F. H.; Varani, G. Structure of the P1 helix from group I self-splicing introns. J. Mol. Biol. 1995, 250, 333–353.
(78) Steuber, H.; Zentgraf, M.; Gerlach, C.; Sotriffer, C. A.; Heine, A.;Klebe, G. Expect the unexpected or caveat for drug designers: multiplestructure determinations using aldose reductase crystals treated undervarying soaking and co-crystallisation conditions. J. Mol. Biol. 2006,363, 174–187.
(79) Zentgraf, M. Characterization of binding pocket flexibility of aldosereductase., Ph.D. Dissertation, Philipps-University Marburg: Marburg,Germany, 2006.
(80) Hornak, V.; Okur, A.; Rizzo, R. C.; Simmerling, C. HIV-1 proteaseflaps spontaneously open and reclose in molecular dynamics simula-tions. Proc. Natl Acad. Sci. U.S.A. 2006, 103, 915–920.
(81) Eyrisch, S.; Helms, V. Transient pockets on protein surfaces involvedin protein-protein interaction. J. Med. Chem. 2007, 50, 3457–3464.
(82) Ferrara, P.; Gohlke, H.; Price, D. J.; Klebe, G.; Brooks, C. L. Assessingscoring functions for protein-ligand interactions. J. Med. Chem. 2004,47, 3032–3047.
(83) Verdonk, M. L.; Mortenson, P. N.; Hall, R. J.; Hartshorn, M. J.;Murray, C. W. Protein-ligand docking against non-native proteinconformers. J. Chem. Inf. Model. 2008, 48, 2214–2225.
(84) Erickson, J. A.; Jalaie, M.; Robertson, D. H.; Lewis, R. A.; Vieth, M.Lessons in molecular recognition: the effects of ligand and proteinflexibility on molecular docking accuracy. J. Med. Chem. 2004, 47,45–55.
(85) Ahmed, A.; Kazemi, S.; Gohlke, H. Protein flexibility and mobilityin structure-based drug design. Front. Drug Des. DiscoVery 2007, 3,455–476.
(86) Casiano-Negroni, A.; Sun, X.; Al-Hashimi, H. M. Probing Na(+)-induced changes in the HIV-1 TAR conformational dynamics usingNMR residual dipolar couplings: New insights into the role ofcounterions and electrostatic interactions in adaptive recognition.Biochemistry 2007, 46, 6525–6535.
CI100101W
CONFORMATIONAL TRANSITIONS OF HIV-1 TAR RNA J. Chem. Inf. Model., Vol. 50, No. 8, 2010 1501


