A fluorescence-based bacterial bioreporter for the specific detection

Quantitative fluorescence detection of multiple
microscale cell culture assays in situ
Taek-il Oh
The Graduate School
Yonsei University
School of Electrical and Electronic Engineering

Quantitative fluorescence detection of multiple
microscale cell culture assays in situ
A Master’s Thesis
Submitted to the School of Electrical and Electronic
Engineering and the Graduate School of Yonsei University
in partial fulfillment of the
requirements for the degree of
Master of Science
Taek-il Oh
July 2007
This certifies that the master’s thesis of
Taek-il Oh is approved.
___________________________
Thesis Supervisor: [Donghyun Kim]
___________________________
Thesis Committee Member #1 : [Woo-Young Choi]
___________________________
Thesis Committee Member #2 : [Michael L. Shuler]
The Graduate School
Yonsei University
July 2007

i
Table of contents
Table of contents···································································· i
List of tables ······································································· ii
List of figures ····································································· iii
Abstract ············································································· v
Chapter 1: Introduction and motivation········································· 1
Chapter 2: Materials and methods ··············································· 4
2.1 Light source selection ················································· 4
2.2 LED switching circuit design ········································ 6
2.3 Detection system design ·············································· 7
2.4 Cell culture method ··················································· 10
2.5 Microscale cell culture analog device ······························ 10
2.6 Post Image processing ················································ 15
Chapter 3: Results and discussion ·············································· 16
3.1 Pre-experimental results: CCD dark current noise ················ 16
3.2 Real time fluorescence images ······································ 17
3.2.1 Short term experiment: cell death experiment
with EtOH ····························································· 18
3.2.2 Mid-term experiment: inhibition effect of tegafur ········· 24
3.2.3 Long-term experiment: growth curve on μCCA ·········· 27
3.3 Feasibility study: photo-diode experiment ······················· 32
Chapter 4: Future directions ····················································· 34

ii
Chapter 5: Conclusion ··························································· 36
References ········································································· 37
국문요약 ·········································································· 43

iii
List of tables
Table 1 Measured optical power of light sources ································· 4
Table 2 Chamber designation of the μCCA chip under test. ·················· 12
Table 3 Measured cell growth index and growth inhibition ratio of test and
control μCCA chip at 1 mM tegafur after 25 hours. ···························· 26
iv
Lists of Figures
Figure 1 Measured spectrum data of Luxeon LED ······························· 5
Figure 2 Switching circuit diagram of light source. ······························ 6
Figure 3 (Top) Detection system in an incubator (Bottom) Detection system
overview (F1: excitation filter, F2: emission filter, L1, imaging lens, L2: relay
lens, P: pin-hole, and BS: beam splitter). The blue and green solid lines
represent an illuminating and emitted beam, respectively. ······················ 8
Figure 4 (a) Assembly of a μCCA device sealed with a PMMA holder and (b)
its final form (A, B, C, and D for four compartments). (c) A μCCA device
with silicone tubes. ································································· 11
Figure 5 Measured dark current noise of CCD. ································· 17
Figure 6 Variation of cell viability index after 0% (control), 5%, 10%, and
20% EtOH injection at 20th minute. ············································· 19
Figure 7 Fluorescence images of HepG2/C3A cells exposed to EtOH
concentration of 0% (control, top row, a-d), 5% (second row, e-h), 10% (third
row, i-l), and 20% (bottom row, m-p). EtOH was injected 20 minutes after the
test was begun. ······································································ 20
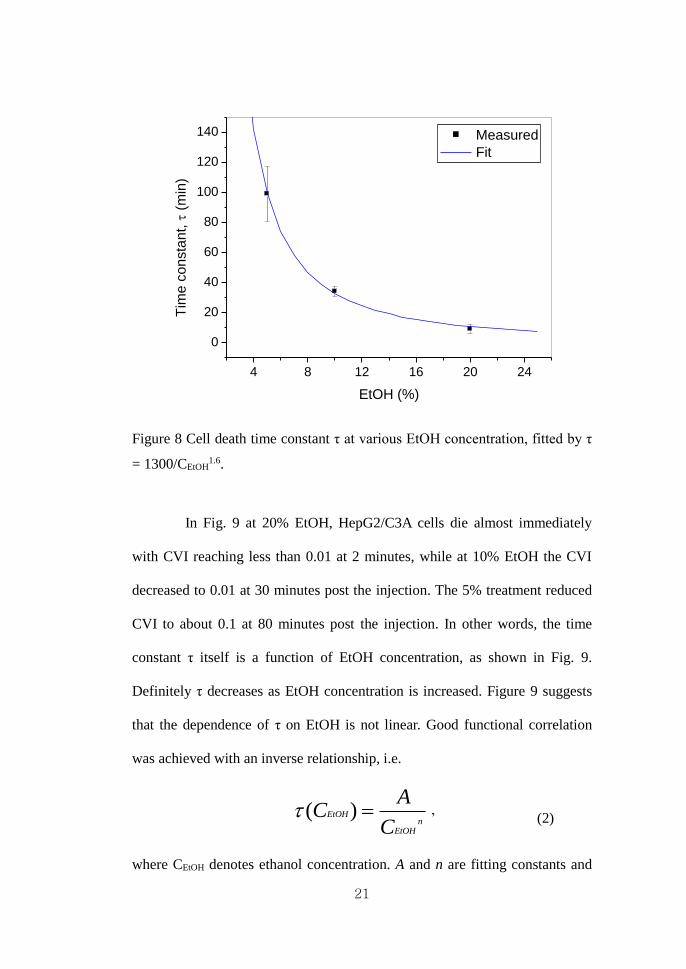
Figure 8 Cell death time constant τ at various EtOH concentration, fitted by τ
= 1300/CEtOH1.6. ····································································· 21
Figure 9 (a) Fluorescence intensity graph of HepG2/C3A cells in liver and
uterus cancer chamber that shows initial calcein AM (2 μM, injected
externally) uptake and following cytotoxicity of 10 % EtOH injected at 90th
minute. (b) Corresponding fluorescence images of HepG2/C3A cells in the

v
liver chamber. ······································································· 23
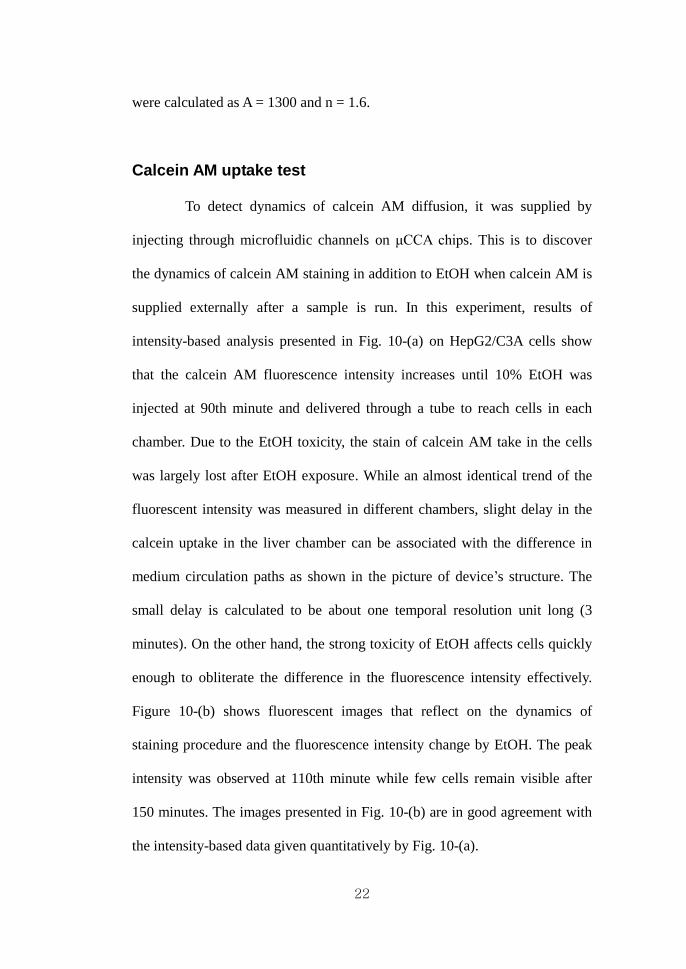
Figure 10 (Top) Fluorescence images of MESSA H2B-GFP cells in B
chamber after 1 mM tegafur exposure. (Bottom) Fluorescence images of
HepG2-C3A cells in A chamber after 1 mM tegafur exposure. ··············· 25
Figure 11 Cell growth index changes of MESSA H2B-GFP and HepG2/C3A
cells after 1 mM tegafur exposure. ··············································· 26
Figure 12 Cell growth fluorescence images of (a) HepG2/C3A cells in the
chamber A and (b) MESSA H2B-GFP cells in the chamber B. ··············· 28
Figure 13 Cell growth index of MESSA H2B-GFP and HepG2/C3A cells in
μCCA assays. ······································································· 30
Figure 14 Fluorescence intensity measured by a photodiode: MESSA H2B-
GFP and HepG2-C3A cells. ······················································· 33
Figure 15 Proposed scheme of a nano-structured cell culture assay ········· 35

vi
Abstract
In this study, we present a fluorescence-based imaging system that
provides quantitative real-time data of the metabolic interactions in
microscale cell culture analog (µCCA) with an emphasis on measuring
multiple μCCA samples simultaneously for high-throughput screening. A
µCCA is a cell-based lab-on-a-chip assay that, as an animal surrogate, is
applied to pharmacological studies for toxicology tests. A µCCA typically
contains multiple chambers and microfluidics that combine the chambers,
which represent animal organs and blood flow to mimic animal metabolism
more realistically. A µCCA is expected to provide an application for high-
throughput drug discovery.
The detection system was assembled by optics components; a high-
power LED and a charge-coupled device (CCD) camera as a light source and
a detector, for monitoring cellular status on the chambers of each μCCA
sample. Multiple samples are characterized mechanically on a motorized
linear stage, which is fully-automated. The optical system measures the short-
term cytotoxic uptake of ethanol, long-term cell growth dynamics and the
effects of tegafur as an anti-cancer chemical on drug-resistant tumor cell-
lines. Real-time quantitative data of the intensity loss of enhanced green
fluorescent protein (EGFP) during cell death of target cells were also
collected over several minutes to 40 hours. Finally, design issues and
improvements are discussed.

vii
Keywords: microscale cell culture assays, fluorescence detection, high-
throughput, real time live cell detection, cell dynamics

1
Chapter 1
Introduction
Fluorescence microscopy is a conventional method of imaging
various types of cells, proteins and more importantly their interactions.1,2,3
Oftentimes, it’s not implantable on the site which the biological event occurs,
and therefore it prohibits real-time imaging. To resolve this issue, a portable
fluorescence cytometric system has been developed for characterizing
chemical concentration and cellular status. The system provides in vitro
images in real time. To implement a portable in situ fluorescence imaging
system, optical components including a charge coupled device (CCD) camera,
and a light source were set up for multiple cell culture devices while housed in
an incubator. Previously, a portable fluorescence detection system was
investigated for a single μCCA device in real-time. 4 Based on discrete
optical components, we investigated a multiple fluorescence optical imaging
system that measures multiple microscale cell culture assays in situ to provide
quantitative, non-invasive, and real-time data on cell viability.
2
A cell culture analog (CCA) system can be used as an initial
toxicological and pharmacological test.5 Development of microfabrication
technology has allowed creation of a microscale cell culture analog (μCCA)
chip. Such a device is suitable for toxicological and pharmacological tests and
may allow many tests to be done simultaneously. It has been previously
shown to replicate toxicological events that are undetectable using ordinary in
vitro experiments.6 Toxicological and pharmacological testing enabled by
μCCA devices can be critical in chemical and pharmaceutical application. 7
In this study, the microfluidic-based cell chips such as μCCA were used as a
physical replica of a physiologically-based-pharmacokinetic (PBPK)
model.8,9,10. This cell culture device is expected to provide a tool to shorten the
time and to reduce cost of the drug discovery process.
The optical system was evaluated by the short-term cytotoxic uptake
of ethanol and by maintaining cell growth dynamics and the effects of tegafur
as an anti-cancer chemical on drug-resistant tumor cell-lines using two sample
assays simultaneously. We have used a calcein acetoxymethylester (calcein
AM) staining technique for quantitative analysis of cytotoxic uptake of
ethanol (EtOH) over three hours.
Real-time experiments for a longer period are often complicated with
issues such as cell division and long-term effectiveness of fluorescence dye
molecules. This provoked us into exploring the long-term applicability of the
system by determining nutrient-limited cell growth curves in a μCCA device
for over 90 hours on a continuous basis. The system has been evaluated to
3
determining nutrient-limited cell growth curves in a μCCA device and
exploring tumor cell viability against an anti-cancer drug. For this study, we
have used enhanced green fluorescence protein (EGFP), which has good
photostability and thus is relatively insensitive to photobleaching for a large
number of exposures.11 In particular, the intensity variation of EGFP during
cell death of target cells has been measured. The intensity results of the EGFP
protein in cells captured in real-time are presented. As a feasibility study,
quantification with a photodiode is also discussed. The results confirm the
applicability of the portable optical system, especially to high-throughput
analysis of cell-based assays.

4
Chapter 2
Materials and methods
2.1 Light source selection
To select a proper light source, commercial sources were
investigated. A typical light source for microscopy is broad-band one with
filters. In our system, one LED was used as a light source for portability and
compactness. After testing several commercial LEDs, the system was
upgraded to a high power royal blue LED (Luxeon LXHL-BR02, Philips, San
Jose, CA, U.S.A.).
Table 1 Measured optical power of light sources
Olympus IMT-2 Olympus BX51WI Luxeon LED
Measured
optical power
3.2 mW (with 20X
objective)
2.9 mW (with 4X
objective) 2.0 mW
Table 1 shows optical power of various light sources measured on
the sample position, which cell culture assays are placed on, by a photodiode
(818 low power detector, Newport, Irvine, CA, U.S.A.) and an optical power
5
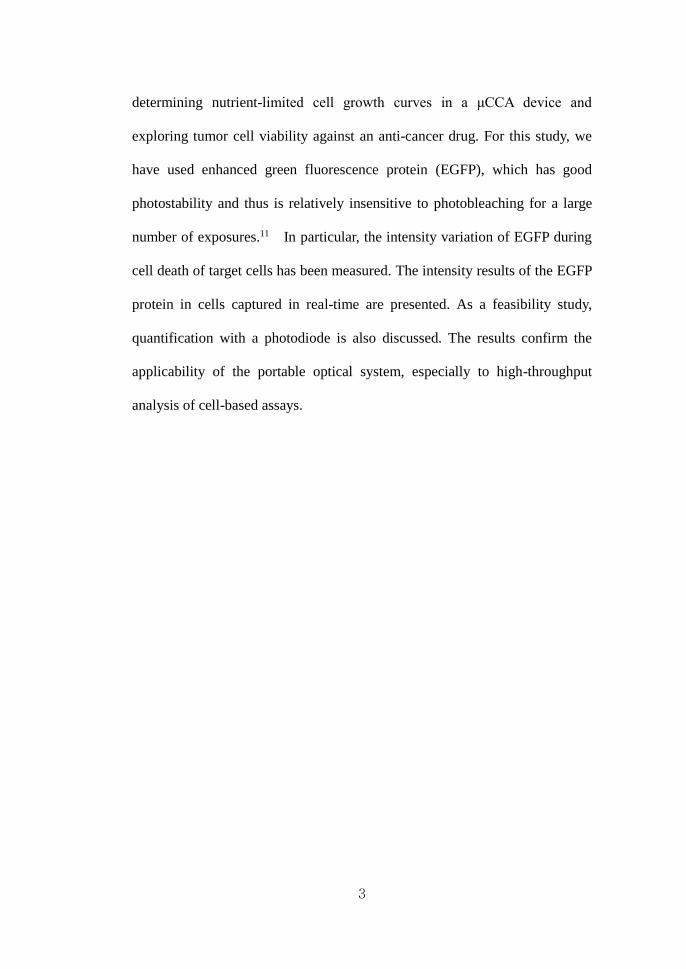
meter (1830-C, Newport, Irvine, CA, U.S.A). The source power level of an
exciter is an important issue since it should be enough to excite fluorephores
while not causing significant photobleaching. Luxeon LED light source was
measured to exhibit optical power that is comparable with that of a
commercial microscope such as Olympus IMT-2 (inverted microscope,
Olympus, Center Valley, PA, U.S.A.) and Olympus BX51WI (fixed stage
microscope, Olympus, Center Valley, PA, U.S.A.). From the results, we can
expect the LED source to have enough excitation level of flurephores without
unnecessary photobleaching. Figure 1 shows measured spectrum of Luxeon
LED.
400 420 440 460 480 500 520
0.0
5.0x10⁻⁹
1.0x10⁻⁸
1.5x10⁻⁸
2.0x10⁻⁸
2.5x10⁻⁸
3.0x10⁻⁸
3.5x10⁻⁸
4.0x10⁻⁸
4.5x10⁻⁸
5.0x10⁻⁸
Po
we
r (a
.u.)
Wavelength (nm)
without Filter
with Filter
Figure 1 Measured spectrum data of Luxeon LED
Peak wavelength was measured at λ = 459.5 nm with the full width-
half maximum as 25 nm. The cutoff wavelength, defined as the wavelength at
which the optical power is reduced to 1% of the maximum is 524 nm without
6
using an excitation filter. This overlaps the emission spectrum of green
fluorescence signal. When the excitation filter was assembled on the LED, the
cutoff wavelength decreased to 498 nm, which eliminates reflection noise
from cells.
2.2 LED switching circuit design
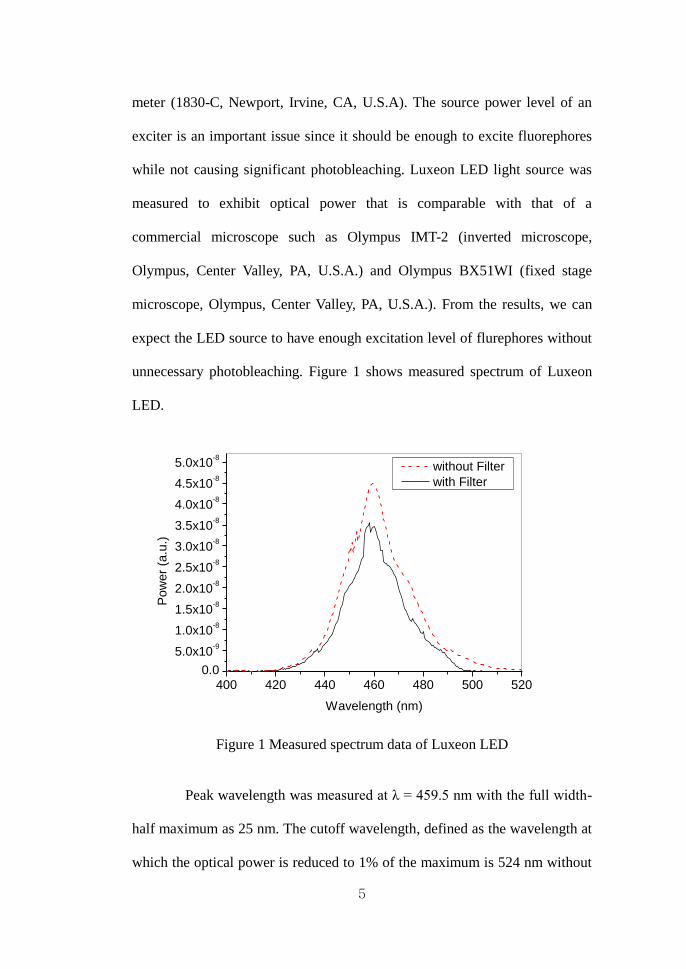
Figure 2 Switching circuit diagram of light source.
Figure 2 shows a simple control circuit for LED lighting. A drain
resistor R1 and a gate resistor R2 are 1 Ω and 200 Ω respectively. The center
mosfet is IRF510 power mosfet (Intersil Corporation, Milpitas, CA U.S.). The
control signal through DAQ board (National Instrument, Seoul, Korea) was
programmed in LabVIEW 7.1(National Instrument, Seoul, Korea).Using
them, the movements of the system was programmed, and the light source
was controlled for μCCA samples to be exposed minimally around 1~2
seconds to protect cells from being photobleached.1 Also, the exposure time
was carefully controlled to avoid unnecessary saturation of CCD camera.

7
2.3 Detection system design
The system described here is based on with a mechanical motorized
stage for imaging multiple cell culture assays. After considering several
feasible optical designs for multi-sample imaging, the mechanical motorized
stage (UTM100CC1DD, Newport, Irvine, CA, U.S.A.) was selected for
multiple imaging in this research. It was built with discrete optical
components, such as lenses, narrow band filters, and beam splitters for
optimal imaging performance. To develop a portable fluorescence-based
optical microscope system and perform in-situ fluorescence measurements,
the system was assembled inside a standard cell culture incubator to
investigate cellular reaction at 37°C under 95% air and 5% CO2. Because
field of views do not have to move between measurements, captured images
allow more accurate time-course measurements of cell status and the fate of
each cell on a quantitative basis. In Fig. 3, the fluorescence detection system
with a high-power LED and a CCD camera (QICAM FAST 1394, Qimaging,
Burnaby, BC, Canada) is shown.

8
Figure 3 (Top) Detection system in an incubator (Bottom) Detection system
overview (F1: excitation filter, F2: emission filter, L1, imaging lens, L2: relay
lens, P: pin-hole, and BS: beam splitter). The blue (a) and green (b) solid lines
represent an illuminating and an emitted beam, respectively.

9
The imaging system is designed to offer relatively low magnification
in order to provide cell status information on the basis of statistical average by
imaging a large number of cells simultaneously. Light from a high power
royal blue LED is focused by an imaging lens L1 (PCX, f = 35 mm, d = 24.5
mm) to excite fluorophore of target cells. Excited fluorescence imaged by L1
is relayed by L2 (PCX, f = 150 mm, d = 50 mm), to a CCD. A pinhole
aperture is placed for baffling out the noise from other optical path. The center
wavelength / band width of the excitation filter (F1) and emission filter (F2)
in a fluorescence filter cube (31054GFP, Chroma Technology, Rockingham,
VT, U.S.A.) are given respectively by 455 nm / 70 nm and 525 nm / 30 nm
(provided by the manufacturer). The effect of non-collimation through F2 is
minimal because the sample-to-L1 distance is close to the focal length of L1
and thus the image distance from L1 is large relative to the overall size of the
system. Two μCCA chips were mounted on a motorized stage with a linear
resolution of 1 μm. The total dimension of the detection system is 30(L) x
23(W) x 20(H) cm3.
In mechanical movements between chambers, the transition time has
been controlled to be short for minimal disparity between measurement
conditions and yet sufficiently long to take observable time not to affect the
drug diffusion process in μCCA. Registration error of the motorized stage was
less than 1 m, which is much smaller than the cell size. Thus, the error
caused by mispositioning in the images taken at different time points was
minimal.

10
2.4 Cell culture method
All cell lines tested in this study (heptocyte and uterine cancer cells)
were obtained from the American Type Culture Collection (ATCC, Manassas,
VA, U.S.A.) and were transformed further if necessary. The transformation of
H2B-GFP has been done by Daniel Tatosian at Cornell. The cell lines were
cultured in the appropriate media recommended from ATCC, supplemented
with 10% FBS from Invitrogen (Carlsbad, CA, U.S.A.). Media used for
culturing the cell lines were minimum essential medium (MEM) from
Invitrogen and McCoy’s 5a medium from Sigma Aldrich (St Louis, MO,
U.S.A.). Calcein AM was purchased from Invitrogen and ethanol was
purchased from Sigma Aldrich.
2.5 Microscale cell culture analog device
Fabrication techniques of μCCA devices are described in detail
elsewhere.12 The μCCA device used in this study is shown in Fig. 4-(a) and
chambers are listed in Table 2.
(a)

11
(b)
(c)
Figure 4 (a) Assembly of a μCCA device sealed with a PMMA holder and (b)
its final form (A, B, C, and D for four compartments). (c) A μCCA device
with silicone tubes.

12
Table 2 Chamber designation of the μCCA chip under test.
A Liver chamber
B Bone marrow chamber
C Normal colon chamber
D Colon tumor cell chamber
On the liver chamber, the liver hepatomacellular carcinoma cell-line
HepG2/C3A was seeded (A) and a cell line derived from human uterine
cancer, MESSA, was seeded on the bone marrow chamber (B) for this study.
These cell-lines grow attached to the bottom surface of the chamber. PMMA
was adapted as a top cover of μCCA; the use of PMMA minimizes
autofluorescence of plastic packaging material.13 In this study, the normal
colon cell chamber (C) and colon tumor cell chamber (D) were not used.
In the long-term growth study, MESSA and HepG2/C3A cell-lines
transfected with H2B-GFP gene were employed. The human histone protein,
H2B-GFP, fused at the amino terminus to EGFP. The fusion protein binds to
DNA and assists opening and closing DNA strands during DNA replication.
Previously it was reported that the fluorescence intensity of this protein is
significantly reduced during cell death.14 Consequently, the cell viability can
be decided by measuring the fluorescence intensity of the cell.
Chip preparation and CCA experiment protocol are described in

13
detail elsewhere.12 Briefly, the chips were immersed in piranah solution for 20
minutes to remove organic residues, rinsed with deionized water,and
autoclaved for sterilization. Then the chips were coated with 0.1 mg/ml poly-
D-lysine (Sigma-Aldrich), and washing with PBS and coating with 50 μg/ml
fibronectin (Chemicon International, Temecula, CA, U.S.A.). Cells were
trypsinized and resuspended in medium approximately to the final
concentration of 7.5 x 10⁵ cells/ml. An appropriate volume of cell suspension
(20 μl ~ 50 μl) was placed on each chamber to completely cover the chamber
without overflow. Chips loaded with cells were incubated at 37°C with 95%
air and 5% CO2 overnight. Before assembling the CCA device, if desired,
whole chip was immersed in 2 μM calcein AM solution for 30 minutes. Then
the chips were assembled and sealed with a PMMA holder by screwing the
top and bottom plates together. Silicone tubes (PharMed Pump Tubing, inside
diameter = 0.25 mm, Cole-Parmer, IL, U.S.A.) connected the assembled CCA
with a medium reservoir as shown in Fig. 4-(c). A peristaltic pump was used
to supply the medium at a constant speed (0.5 rpm equivalent to 2 μl/min
approximately).
- For cell death experiments with ethanol
To verify quantitative results of the optical system in situ, the cells in
the CCA device were treated with various concentrations of ethanol. For this
experiment, the cells on the chips were stained with calcein AM prior to the
assembly of a CCA device. After setting up the CCA device and the optical

14
system, initial measurements were made for 20 minutes while supplying
media with a peristaltic pump, in order to show that the cells were being
monitored consistently. After 20 minutes passed, various concentrations of
ethanol (0%~20% v/v) in MEM media were introduced into the system to
induce cell death. This detection was continued until there were no live cells
left, which took around 40~120 minutes depending on the concentration of
ethanol.
- For tegafur toxicity test and cell growth monitoring
The tegafur toxicity test and cell growth monitoring in the CCA
device were performed with the same optical system in order to verify that the
system can be operated for several days continually. For this mid-term and
long-term experiment, cells transfected with H2B-GFP express GFP protein
constitutively, thus giving off green fluorescent signal as long as they are
live.14 The CCA chips loaded with both cell lines were assembled. Then the
whole optical system with the CCA device and a peristaltic pump was put in
an incubator. The device was connected to a medium reservoir via silicone
tubes. The medium coming out of the device were fed back into the medium
reservoir, therefore the medium was being recirculated through out the system
for the whole time. The volume of the medium reservoir was 200 μl, which
supports the growth of cells for about three days. The measurements were
made for 90 hours.

15
2.6 Post Image processing
ImageJ, ImagePro Express, and Cell Profiler™ can be applied on
post image processing with the acquired raw images from the detection
system. In this study, Cell Profiler™ is the main software for several post
image processing steps. The image processing using the software is elaborated
elsewhere in detail.15,16,17 The processing involves cropping, illumination
correction, thresholding, and measuring identified objects. The illumination
correction is a step of correcting uneven light distribution across a field of
view since the center of a field of view is more strongly illuminated. A pre-
calculated illumination function is used to produce corrected images.
Thresholding distinguishes signal from noise. The overall image processing
can be performed based on object numbers, areas occupied by objects, and
image intensity. Image processing based on these procedures, in general,
provided consistent results with each data.
16
Chapter 3
Results and discussion
3.1 Pre-experimental results: CCD dark current noise
Since a CCD is afflicted inherently with dark current noise, thermal
noise characterization was required at an incubating temperature.18,19 Figure 5
shows the results of an initial dark current noise test of a CCD for determining
saturation time after the system was installed in an incubator.

17
0 10 20 30 40 50 60 70 80 90 100
0
200
400
600
800
1000
1200
1400
1600
1800
2000
Da
rk c
urr
en
t n
ois
e (
a.u
.)
minutes
Dark current noise
Figure 5 Measured dark current noise of CCD.
The maximum change in the dark noise was a 10% increase,
compared to that of room temperature. Thus, all experiments were initiated at
least 30 minutes after a CCD was embedded on the system.
3.2 Real time Fluorescence images
The fluorescent imaging system provides a sequence of fluorescence
images in real-time and the images can be quantified as intensity variation
over time. The detection system was employed to different time scale
experiments; cell viability test against a cytotoxic chemical by measuring
changes of fluorescence signal, tegafur’s growth inhibition effect test, and cell
growth curve measurement on μCCA by recording the intensity variation of
EGFP of target cells cultured in multiple μCCA system.

18
3.2.1 Short-term experiment: Cell death experiment with
EtOH
As a short-term experiment, a response test to ethanol addition was
conducted on a couple of identical μCCA chips where HepG2/C3A cells were
seeded and cultured under the same measurement conditions. Target
HepG2/C3A cells were treated with calcein AM for fluorescence detection
prior to the packaging of μCCA. The cytotoxicity of ethanol is well-known
with details described elsewhere.20,21,22 Figure 7 shows the cell number
variation in terms of cell viability index (CVI) measured in real-time. To
analyze cell growth and maintence quantitatively, CVI was defined as follows
# of cells at each timeCell viability index (CVI) =
# of cells at initial time (1)

19
0 20 40 60 80 100 120
0.0
0.2
0.4
0.6
0.8
1.0
1.2
Cell
via
bili
ty index
Time (min)
0%
5%
10%
20%
EtOH
injection
Figure 6 Variation of cell viability index after 0% (control), 5%, 10%, and
20% EtOH injection at 20th minute.
CVI measures relative increase or decrease in reference to the initial
cell number. EtOH was injected 20 minutes after running the chips using a
peristaltic pump. EtOH travels through the silicone tubes for approximately
21 minutes to reach the target chamber. Therefore, cells were exposed to
EtOH ~41 minutes after the test chips were run. Figure 7 shows that when the
cells were exposed to ethanol, it immediately caused cell death and all cells
died within the time range of a few minutes to one hour, depending on the
different EtOH concentration.
Figure 7 also shows real-time fluorescence images of HepG2/C3A
cells at EtOH concentration of 0% (top row), 5% (second row), 10% (third

20
row), and 20% (bottom row). Figures 7 and 8 emphasize the strengths of our
system to monitor the migration and motility of an individual cell and also to
observe cell dynamics in real time.
Figure 7 Fluorescence images of HepG2/C3A cells exposed to EtOH
concentration of 0% (control, top row, a-d), 5% (second row, e-h), 10% (third
row, i-l), and 20% (bottom row, m-p). EtOH was injected 20 minutes after the
test was begun.
A time constant τ can be connected with the cell death in response to
EtOH. Note that τ indicates the time which takes for cells to die at a specific
EtOH concentration in a given experimental environment. τ depends on
chemical concentration, cell types, cell status, flow rates, etc. Figure 9
presents the cell death time constant τ over different EtOH concentration
values. Here, τ was obtained as a time constant that reaches CVI = 0.01.
21
4 8 12 16 20 24
0
20
40
60
80
100
120
140 Measured
Fit
Tim
e c
onsta
nt,
(m
in)
EtOH (%)
Figure 8 Cell death time constant τ at various EtOH concentration, fitted by τ
= 1300/CEtOH1.6.
In Fig. 9 at 20% EtOH, HepG2/C3A cells die almost immediately
with CVI reaching less than 0.01 at 2 minutes, while at 10% EtOH the CVI
decreased to 0.01 at 30 minutes post the injection. The 5% treatment reduced
CVI to about 0.1 at 80 minutes post the injection. In other words, the time
constant τ itself is a function of EtOH concentration, as shown in Fig. 9.
Definitely τ decreases as EtOH concentration is increased. Figure 9 suggests
that the dependence of τ on EtOH is not linear. Good functional correlation
was achieved with an inverse relationship, i.e.
( )EtOHn
EtOH
AC
C = ’ (2)
where CEtOH denotes ethanol concentration. A and n are fitting constants and
22
were calculated as A = 1300 and n = 1.6.
Calcein AM uptake test
To detect dynamics of calcein AM diffusion, it was supplied by
injecting through microfluidic channels on μCCA chips. This is to discover
the dynamics of calcein AM staining in addition to EtOH when calcein AM is
supplied externally after a sample is run. In this experiment, results of
intensity-based analysis presented in Fig. 10-(a) on HepG2/C3A cells show
that the calcein AM fluorescence intensity increases until 10% EtOH was
injected at 90th minute and delivered through a tube to reach cells in each
chamber. Due to the EtOH toxicity, the stain of calcein AM take in the cells
was largely lost after EtOH exposure. While an almost identical trend of the
fluorescent intensity was measured in different chambers, slight delay in the
calcein uptake in the liver chamber can be associated with the difference in
medium circulation paths as shown in the picture of device’s structure. The
small delay is calculated to be about one temporal resolution unit long (3
minutes). On the other hand, the strong toxicity of EtOH affects cells quickly
enough to obliterate the difference in the fluorescence intensity effectively.
Figure 10-(b) shows fluorescent images that reflect on the dynamics of
staining procedure and the fluorescence intensity change by EtOH. The peak
intensity was observed at 110th minute while few cells remain visible after
150 minutes. The images presented in Fig. 10-(b) are in good agreement with
the intensity-based data given quantitatively by Fig. 10-(a).

23
0 50 100 150 2000
20
40
60
80
100
120
140
160
180
200
EtOH
injection
Liver chamber
Uterus chamber
Inte
nsity (
a.u
.)
Time (min)
Calcein AM
injection
(a)
(b)
Figure 9 (a) Fluorescence intensity graph of HepG2/C3A cells in liver and
uterus cancer chamber that shows initial calcein AM (2 μM, injected
externally) uptake and following cytotoxicity of 10 % EtOH injected at 90th
minute. (b) Corresponding fluorescence images of HepG2/C3A cells in the
liver chamber.

24
3.2.2 Mid-term experiment: Inhibition effect of tegafur
Also conducted were the tests to investigate the response of normal
and tumor cells to tegafur, an anti-cancer drug. Tegafur is an oral prodrug and
needs to be converted to an active metabolite, 5-FU, by liver cytochrome
P450 enzymes.24 Cytotoxicity of tegafur is discussed in Ref. 23. Figures 11
shows images of A chamber (HepG2/C3A) and B chamber (MESSA H2B-
GFP) of a test μCCA chip captured at 1st, 10th, 20th, and 30th hour since the
beginning of the measurement. Tumor cell growth is negatively affected by
tegafur, so the test images are kept at constant brightness or even turn
gradually less fluorescent with time. Note that tegafur should be activated
through the metabolism by liver cells to become cytotoxic.24 Figure 11 shows
the cell number profiles of HepG2/C3A and MESSA H2B-GFP cells of a test
μCCA chip with tegafur at 1 mM and of a control μCCA sample without
tegafur. While fluorescent images in Fig. 11 suggests the trends of inhibited
growth of tumor cells, Fig. 11 confirms the inhibitory effect of tegafur on the
growth of cells for both cell-lines by comparing to a control growth curve.
Tegafur, as well as its active metabolite 5-FU, act as an antimetabolite drug, is
known to be cell cycle specific, thus it exerts a stronger effect on rapidly
growing cells.25,26,27 On the other hand, Fig. 11 suggests that the specific
effect does not appear appreciably within the time scale of 30 hours.
25
Figure 10 (Top) Fluorescence images of MESSA H2B-GFP cells in B
chamber after 1 mM tegafur exposure. (Bottom) Fluorescence images of
HepG2-C3A cells in A chamber after 1 mM tegafur exposure.
Table 3 presents the cell growth index of both cell-lines in the test
and control μCCA chip measured at 25th hour. The inhibitory effect of tegafur
is visible for both cell-lines and, more importantly, can be quantified. On the
other hand, the growth inhibition ratio, defined as the ratio of the cell growth
rate of test over that of control μCCA, is given as 0.883 and 0.892,

26
respectively for MESSA H2B-GFP and HepG2/C3A. This indicates that the
tegafur inhibitory effect on MESSA H2B-GFP and HepG2/C3A is not
substantially different within 25 hours.
Table 3 Measured cell growth index and growth inhibition ratio of test and
control μCCA chip at 1 mM tegafur after 25 hours.
Cell-line
Cell growth index
Growth
inhibition ratio Medium +
tegafur
(test)
Medium +
no tegafur
(control)
MESSA H2B-GFP 1.08 1.23 0.883
HepG2/C3A 1.02 1.15 0.892
0 2 4 6 8 10 12 14 16 18 20 22 24 260.0
0.2
0.4
0.6
0.8
1.0
1.2
MESSA H2B-GFP
HepG2-C3A
MESSA H2B-GFP (control)
HepG2-C3A (control)
Ce
ll in
hib
itio
n r
atio
Time (h)
Figure 11 Cell growth index changes of MESSA H2B-GFP and HepG2/C3A
cells after 1 mM tegafur exposure.

27
Note that only qualitative description can be drawn based on
fluorescence image data in Fig. 11, while Fig. 12 provides quantitative results.
The experiments described in Figs. 11 and 12 were conducted on the two
identical μCCA chips under the same measurement conditions.
3.2.3 Long-term experiment: Growth curve on μCCA
The last experiment of fluorescence imaging concerns the evaluation
of the growth and maintence of liver and tumor cells using two μCCA chips.
Typically, a cell growth curve on a μCCA depends on many factors such as
nutrient supply, initial cell density and distribution, each cell’s growth phase,
and stress in a μCCA (eg. hydrodynamic shear stress).28 The images shown in
Fig. 13 are in qualitative agreement with the quantitative data presented in Fig.
14 so that no significant change is observed in the case of HepG2/C3A, while
the cell number for MESSA H2B-GFP fluctuates until eventual cell death
after 90 hours. For quantitative comparison as normalized cell number with
respective to an initial cell number, cell growth index was defined as follows.
# of cells at each timeCell growth index =
# of cells at initial time (3)

28
Figure 12 Cell growth fluorescence images of (a) HepG2/C3A cells in the
chamber A and (b) MESSA H2B-GFP cells in the chamber B.
The growth curve of MESSA H2B-GFP cells in the chamber B of the
first μCCA chip was obtained for a 90 hour experiment (Fig. 14). In Fig. 14,
the growth and maintence curve for MESSA H2B-GFP cells shows that after
an initial lag phase (about 30 hours) cells start proliferating. Cells then grow
until about 65th hour when they may enter into a stationary phase. After 70
hours, the cell number starts to decrease. The decrease in the cell number
includes the cells’ death and detachment from the surface. The death of cells
can be caused by nutrient depletion and a change in the pH due to the
accumulation of wastes by cell metabolism.
Figure 14 also shows that HepG2/C3A H2B-GFP cells number does
not change apparently over the test period, compared to MESSA H2B-GFP.
Growth was not expected as the cells were seeded on the chip at high
confluency. In this experiment, the liver chamber was almost fully confluent
when the experiment started. HepG2/C3A is a derivative cell-line of HepG2
cell-line, selected for strong contact inhibition of growth and high albumin

29
production. 29 The lack of space would prevent cell growth and also,
HepG2/C3A cell-line grows slower than MESSA H2B-GFP cells, which is a
tumor cell-line. Note that liver cell division time is 32~35 hours, compared
with the division time of tumor cells, which is 22~24 hours.30,31 In the case of
HepG2/C3A cells, the cell number does not decrease significantly even after
80th hour, although the decrease appears to start after about 85th hour. The
trend is associated with the nature of the HepG2/C3A cell-line that typically
adheres to the surface more strongly than the tumor cell-line MESSA H2B-
GFP. HepG2/C3A cells generally require a longer incubation time with
trypsin-EDTA than other tumor cell-lines to detach from the surface.29 For an
identical incubation time, HepG2/C3A cells likely adhered to the surface even
at a critical stage where the tumor cells have already detached.
30
0 20 40 60 80 1000.0
0.2
0.4
0.6
0.8
1.0
1.2
1.4
MESSA H2B-GFP
HepG2/C3A
Ce
ll g
row
th in
de
x
Time (h)
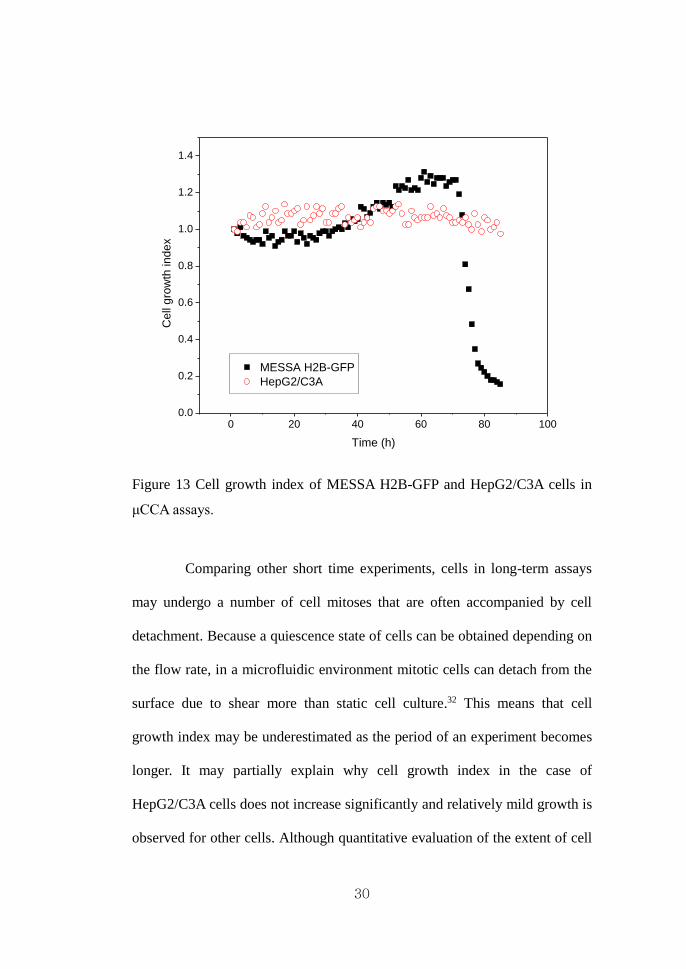
Figure 13 Cell growth index of MESSA H2B-GFP and HepG2/C3A cells in
μCCA assays.
Comparing other short time experiments, cells in long-term assays
may undergo a number of cell mitoses that are often accompanied by cell
detachment. Because a quiescence state of cells can be obtained depending on
the flow rate, in a microfluidic environment mitotic cells can detach from the
surface due to shear more than static cell culture.32 This means that cell
growth index may be underestimated as the period of an experiment becomes
longer. It may partially explain why cell growth index in the case of
HepG2/C3A cells does not increase significantly and relatively mild growth is
observed for other cells. Although quantitative evaluation of the extent of cell

31
mitosis was not attempted in this study, the imaging system, with sufficient
temporal resolution, can differentiate mitotic cells that are occasionally
detached. This is because it measures cells in situ and thus a surface attached
individual cell can be traced on a morphological basis. For this reason, in the
long-term analysis cell number-based analysis is more appropriate to address
cell detachment than an intensity-based approach.
32
3.3 Feasibility study: Photo-diode experiment
In this study, the feasibility of using a photo-diode was also
conducted. Quantification of cell status was performed with a photodiode in
addition to a conventional microscope. A photodiode can be applied as an
intensity-based data analyzer for high-throughput screening of a large number
of cell-based assays. For example, a combination of LEDs and photodiodes in
a simple optical set-up can be easily made to circumvent the power reduction
issue that accompanies the measurement of multiple samples and is thus
expected to provide an extremely useful high-throughput platform to analyze
μCCA chips. As a preliminary study, 96 well plates were used for intensity
measurement of two different cells.
The data in Fig. 6 present optical power with various cell densities
measured by a photodiode. The results for MESSA H2B-GFP and
HepG2/C3A cells exhibit an intensity pattern increasing sublinearly with the
cell density, while epi-fluorescence intensity depends on cell types at a given
cell density. The fluorescent intensity for different cell-lines correlates with
the efficiency of GFP expression, i.e. MESSA H2B-GFP expresses GFP more
efficiently than HepG2/C3A by almost 3 times. The cell density used in our
experiments corresponds approximately to 8.3 x 10⁴ cells/cm2, which falls in
the regime where GFP expression can be estimated using a concentration
model versus optical intensity determined through our experiments. Note that
the fluorescent intensity depends on many factors such as cell types, the cell
confluency, and the spatial cell distribution. These factors may contribute to

33
the non-linear cell density characteristics shown in Fig. 6.
0 1x10⁵
2x10⁵
3x10⁵
4x10⁵
0
1
2
3
4
5
6
Inte
nsity (
nW
)
Cell density (#/cm2)
MESSA H2B-GFP
HepG2-C3A
Figure 14 Fluorescence intensity measured by a photodiode: MESSA H2B-
GFP and HepG2-C3A cells.
With a conjecture that every cell contributes to the overall intensity
by the same amount, cell density can be identified by measuring optical power
on a photodiode. The results suggest an interesting possibility that using
microfabrication technology, photodiodes may be integrated onto the chip to
allow simultaneous multiple detections.33

34
Chapter 4
Future directions
For another biological discovery, cell migration in the cell culture
chip can be a good area of application for μCCA device and the detection
system. Cell trajectory tracking can be performed with ImageJ software. The
step includes ‘file → import → image sequence’ and ‘plugins → particle
detector’. The module ‘particle detector’ tracks the changes between image
sequences. The cell viability may be described by the correlation function of
cell’s vector motilities. The cell movement study on different conditions can
be a good application for this tracking system.
Another application is built with an integrated photodiode. To
minimize the system size into ~cm level, an integrated photodiode can be
employed to on-chip high throughput detection system. For quantitative study
of fluorescence, the photodiode application is valuable to be studied. The
photon energy from stained cells is very low so that pre-amplification or

35
avalanche photo-diode should be considered for this application. Because the
signal from a photodiode is electrical form, the high throughput detection and
analysis on real time base can be a merit of this system.
Figure 15 Proposed scheme of a nano-structured cell culture assay
At last, Figure 15 shows the nano structured cell culture assay with
surface plasmon resonance (SPR) sensor for cell viability test. Using nano
structure with special optical property, it can be applied on fluorescence
imaging. The system also includes SPR structure on the bottom of the chip.
SPR sensor could detect the changes of bottom cell membrane. This can be
called ‘SPR coupled fluorescence assay’ and can be used as a multimodal
and multi resolution detection system.

36
Chapter 5
Conclusion
In this study, a quantitative fluorescence detection system was
demonstrated. It can measure the cell viability changes of multiple μCCA
assays in real time and provides quantitative data of the cell viability. The
system uses one LED as a light source, creating an inexpensive and portable
alternative to traditional broad band light microscopy. The system was
installed in an incubator and took measurements of a couple of μCCA devices
in situ. The system measured the toxicity effects of EtOH and tegafur on
HepG2/C3A cell-line and also explored nutrient-limited cell growth for
normal and tumor cell-lines. In general, the measured data are consistent with
qualitative image results. The intensity and cell number based detection
system on μCCA assays is expected to useful to provide high-throughput drug
discovery data.
37
REFERENCES
1. D. J. Stephens and V. J. Allan, “Light microscopy techniques for live cell
imaging,” Science, 2003, 300, 82-86.
2. R. Yuste, “Fluorescence microscopy today,” Nat. Methods, 2005, 2, 902-
904.
3. J. W. Lichtman and J.-A. Conchello “Fluorescence microscopy,” Nat.
Methods, 2005, 2, 910-919.
4. D. A. Tatosian, M. L. Shuler, and D. Kim, “Portable in-situ fluorescence
cytometry of microscale cell-based assay,” Opt. Lett., 2005, 30, 1689-1691.
5. K. Viravaidya, A. Sin, and M. L. Shuler, “Development of a microscale cell
culture analog to probe naphthalene toxicity,” Biotechnol. Prog., 2004, 20,
316-323.
6. K. Viravaidya and M. L. Shuler, “Incorporation of 3T3-L1 cells to mimic
bioaccumulation in a microscale cell culture analog device for toxicity
studies,” Biotechnol. Prog., 2004, 20, 590-597.
7. M. L. Shuler, A. Ghanem, D. Quick, M. C. Wong, and P. Miller, “A self-
regulating cell culture analog device to mimic animal and human
toxicological responses,” Biotechnol. Bioeng., 1996, 52, 45-60.
8. H. Andersson and A. van den Berg, “Microfabrication and microfluidics for
tissue engineering: state of the art and future opportunities,” Lab Chip, 2004,
4, 98-103.
9. J. El-Ali, P. K. Sorger, and K. F. Jensen, “Cells on chips,” Nature, 2006,
442, 403-411.
38
10. J. M. Pihl, M. Karlsson, and D. T. Chiu, “Microfluidic technologies in
drug discovery,” Drug Discovery Today, 2005, 10, 1377-1383.
11. N. C. Shaner, P. A. Steinbach, and R. Y. Tsien “A guide to choosing
fluorescent proteins,” Nature Methods, 2005, 2, 905-909.
12. A. Sin, K. C. Chin, M. F. Jamil, Y. Kostov, G. Rao, and M. L. Shuler, “The
design and fabrication of three-chamber microscale cell culture analog
devices with integrated dissolved oxygen sensors,” Biotechnol. Prog., 2004,
20, 338-345.
13. A. Piruska, I. Nikcevic, S. H. Lee, C. Ahn, W. R. Heineman, P. A.
Limbach, and C. J. Seliskar, “The autofluorescence of plastic materials and
chips measured under laser irradiation,” Lab Chip, 2005, 5, 1348-1354.
14 . Y. Gavrieli, Y. Sherman, and S.A. Ben-Sasson, “Identification of
programmed cell death in situ via specific labeling of nuclear DNA
fragmentation,” J. Cell Biol., 1992, 119, 493-501.
15. Cell Profiler™, http://www.cellprofiler.org.
16. M. R. Lamprecht, D. M. Sabatini, and A. E. Carpenter, ”CellProfiler™:
free, versatile software for automated biological image analysis,”
BioTechniques, 2007, 42, 71-75.
17. A. E. Carpenter, T. R. Jones, M. R. Lamprecht, C. Clarke, I. H. Kang, O.
Friman, D. A. Guertin, J. H. Chang, R. A. Lindquist, J. Moffat, P. Golland,
and D. M. Sabatini, “CellProfiler: image analysis software for identifying and
quantifying cell phenotypes,” Genome Biol. 2006, 7, R100.
18. R. D. Goldman and D. L. Spector, eds., Live cell imaging, Cold Spring

39
Harbor Laboratory Press, New York, U. S. A., 2005.
19. R. C. Lanza, S. Shi, and E. W. McFarland, “A cooled CCD based neutron
imaging system for low fluence neutron sources,” IEEE Trans. Nucl. Sci.,
1996, 43, 1347-1351.
20. S.-Y. Chen, B. Yang, K. Jacobson, and K. K. Sulik, “The membrane
disordering effect of ethanol on neural crest cells in vitro and the protective
role of GM1 ganglioside,” Alcohol, 1996, 13, 589-595.
21. J. Y. Wan, J. Y. Wang, Y. Wang, and J. Y. Wang, “A comparison between
acute exposures to ethanol and acetaldehyde on neurotoxicity, nitric oxide
production and NMDA-induced excitotoxicity in primary cultures of cortical
neurons,” Chin. J. Physiol., 2000, 43, 131-138.
22. K. Mashimo, S. Sato, and Y. Ohno, “Acute cytotoxic effects of ethanol on
cultured mouse myocardial cells in a monolayer--enzymatic, chronotropic and
ultrastructural studies,” Jpn. J. Alcohol Studies Drug Dependence, 2001, 36,
142-153.
23 . D. B. Longley, D. P. Harkin, and P. G. Johnston, “5-fluorouracil:
mechanisms of action and clinical strategies,” Nature Rev. Cancer, 2003, 3,
330-338.
24. F. Tanaka, T. Fukuse, H. Wada, and M. Fukushima, “The history,
mechanism and clinical use of oral 5-fluorouracil derivative chemotherapeutic
agents,” Curr. Pharm. Biotechnol., 2000, 2, 137-164.
25. S. Wadler, R. Horowitz, H. Y. Zhang, and E. L. Schwartz, “Effects of
perturbations of pools of deoxyribonucleoside triphosphates on expression of

40
ribonucleotide reductase, a G1/S transition state enzyme, in p53-mutated
cells,” Biochem. Pharmacol., 1998, 55, 1353-1360.
26. H. Takeda, M. Haisa, Y. Naomoto, R. Kawashima, K. Satomoto, T.
Yamatuji, and N. Tanaka, “Effect of 5-fluorouracil on cell cycle regulatory
proteins in human colon cancer cell line.” Jpn. J. Cancer Res., 1999, 90, 677-
684.
27. T. Inada, A. Ichikawa, T. Kubota, Y. Ogata, A. R. Moossa, and R. M.
Hoffman “5-FU-induced apoptosis correlates with efficacy against human
gastric and colon cancer xenografts in nude mice,” Anticancer Res., 1997, 17,
1965-1971.
28. E. Leclerc, B. David, L. Griscom, B. Lepioufle, T. Fujii, P. Layrolle, and C.
Legallaisa, “Study of osteoblastic cells in a microfluidic environment,”
Biomaterials, 2006, 27, 586-595.
29. J. H. Kelly, “Permanent human hepatocyte cell line and its use in a liver
assist device (LAD),” US Pat., 5 290 684, 1994.
30. D. Triglia and A. Purchio, “Clonal cells and cell lines derived from C3A
cells and methods of making and using them,” US Pat., 6 653 105, 2003.
31. W. G. Harker, F. R. MacKintosh, and B. I. Sikic, “Development and
characterization of a human sarcoma cell line, MES-SA, sensitive to multiple
drugs,” Cancer Res., 1983, 43, 4943-4950.
32. A. Prokop, Z. Prokop, D. Schaffer, E. Kozlov, J. Wikswo, D. Cliffel, and F.
Baudenbacher, “NanoLiterBioReactor: long-term mammalian cell culture at
nanofabricated scale,” Biomed. Microdevices, 2004, 6, 325-339.

41
33. T. Kamei, B. M. Paegel, J. R. Scherer, A. M. Skelley, R. A. Street, and R.
A. Mathies, “Integrated hydrogenated amorphous Si photodiode detector for
microfluidic bioanalytical devices,” Anal. Chem., 2003, 75, 5300-5305.

42
국 문 요 약
마이크로 세포칩을 위한 정량적 형광
측정 시스템 연구
본 연구에서는, 마이크로 세포칩 (μCCA) 측정을 위한 실시간 정량
측정 방법에 관한 연구를 진행하였다. 세포 생장성을 형광 표지를
사용하여 측정하는 시스템 개발 및 테스트되었다. 본 실험에 사용 된
마이크로 세포칩은 다세포의 성장성과 독성 실험에 응용될 수 있는 기기로
미국 코넬 대학의 연구되고 있다. 칩을 이용한 이러한 배양 기법과 기술이
약물 실험과 세포 성장 실험등에 여러가지로 쓰일 수 있음이 지난 연구를
통해 보고되었다.
이와 같은 생물학적 실험에서 현재까지 가장 널리 쓰이는 관측
시스템은 현미경이며, 세포의 상태와 생장성을 파악하고 판단하는데 매우
중요한 자료로 사용된다.1,2,3 하지만, 일반적인 현미경은 배양기 안에 넣을
수 없을 만큼 크기 때문에 배양기안에 배양되고 있는 세포를 실시간으로
모니터링 할 수 없었다. 이러한 단점을 보안하기 위해서, 이번 연구에서는
기존의 광원보다 작지만 충분한 파워를 가진 LED와 광학 소자들을
이용하여, 생물 실험 응용을 위한 형광 측정 시스템을 디자인하고 만들게
되었다. 본 연구에서는 특별히 다세포 마이크로칩 안에 세포 생장성
측정을 위한 형광 관측 시스템을 구현하고, 나아가 하나 이상의 칩을
관찰하기 위한 멀티 측정 시스템 구현을 목표로 하였다.
형광 측정 시스템은 렌즈, 광분할기, 필터, CCD 카메라, LED 등의 광학
소자들을 사용 했으며, 멀티 측정 시스템을 구현하기 위해서 마이크로
세포칩은 스테이지 위에 고정되어 원하는 위치로 이동할 수 있도록 만들어
졌다. 전체 측정 시스템은 세포의 정상 성장을 위해 5% CO2 세포 배양기
안에 설치 될 수 있는 크기로 고안되었다.
측정 시스템을 테스트하기 위한 단기, 중기, 장기 실험이
진행되었으며, 각각의 실험 결과는 연구된 형광 측정 시스템이 정량적

43
결과를 낼 수 있다는 것을 보여준다. 이 실험에는 간세포와 자궁암세포가
사용되었으며, 세포가 죽어가는 것을 관찰하기 위한 독성 물질로 에탄올과
Tegafur가 사용 되었다. 에탄올 실험에서는 에탄올에 농도에 따른 세포의
죽어가는 속도를 측정하여 정량적으로 차이가 있는 실험이 구분 될 수
있는지를 보여 준다. 또한, 90시간에 걸쳐 마이크로 세포칩 안에서 세포가
자라나고 죽는 것을 2개의 칩을 동시에 이용하여, 실시간 사진과 데이터를
내는 실험을 보여주고 있다.
마지막으로 앞으로의 연구 방향을 위한 ‘칩 위에 집적된 측정
시스템’을 구현하기 위한 예비 결과로 포토다이오드 (photodiode) 응용
실험을 행하였다. 포토다이오드가 주는 출력 파워 값이 세포의 농도와
비례함을 확인할 수 있었으며, 이는 차후에 이러한 기술이 생물 실험의
정량적 데이터 분석에 응용될 수 있음을 보여 주는 예비 결과라고 할 수
있다.
핵심되는 말 : 마이크로 세포칩, 형광 측정, 실시간 측정, 살아있는 세포
관찰, 세포의 생장성과 다이나믹스 정량적 측정