High School Guidance Counseling E.D. Tabs - National Center for
124
High School Guidance Counseling U.S. Department of Education Institute of Education Sciences NCES 2003-015 E.D. Tabs
Transcript of High School Guidance Counseling E.D. Tabs - National Center for

High School GuidanceCounseling
U.S. Department of EducationInstitute of Education SciencesNCES 2003-015
E.D. Tabs

High School Guidance Counseling
U.S. Department of Education Institute of Education Sciences NCES 2003-015
E.D. Tabs
August 2003
Basmat Parsad Debbie Alexander Elizabeth Farris Westat
Lisa Hudson National Center for Education Statistics
Bernard Greene Project Officer National Center for Education Statistics

U.S. Department of Education Rod Paige Secretary
Institute of Education Sciences Grover J. Whitehurst Director
National Center for Education Statistics Val Plisko Associate Commissioner The National Center for Education Statistics (NCES) is the primary federal entity for collecting, analyzing, and reporting data related to education in the United States and other nations. It fulfills a congressional mandate to collect, collate, analyze, and report full and complete statistics on the condition of education in the United States; conduct and publish reports and specialized analyses of the meaning and significance of such statistics; assist state and local education agencies in improving their statistical systems; and review and report on education activities in foreign countries. NCES activities are designed to address high priority education data needs; provide consistent, reliable, complete, and accurate indicators of education status and trends; and report timely, useful, and high quality data to the U.S. Department of Education, the Congress, the states, other education policymakers, practitioners, data users, and the general public. We strive to make our products available in a variety of formats and in language that is appropriate to a variety of audiences. You, as our customer, are the best judge of our success in communicating information effectively. If you have any comments or suggestions about this or any other NCES product or report, we would like to hear from you. Please direct your comments to:
National Center for Education Statistics Institute of Education Sciences U.S. Department of Education 1990 K Street NW Washington, DC 20006
August 2003 The NCES World Wide Web Home Page is: http://nces.ed.gov The NCES World Wide Web Electronic Catalog is: http://nces.ed.gov/pubsearch Suggested Citation U.S. Department of Education, National Center for Education Statistics. High School Guidance Counseling, NCES 2003–015, by Basmat Parsad, Debbie Alexander, Elizabeth Farris, and Lisa Hudson. Project Officer: Bernard Greene. Washington, DC: 2003. Content Contact: Bernie Greene (202) 502–7348 [email protected]

iii
Executive Summary
Introduction
Recent literature on school counseling has focused on the need for new directions for school counseling and redefined roles for school counselors (Baker 1996; Fitch, Newby, and Ballestero 2001; Perusse, Goodnough, and Noel 2001; Schmidt 1999). However, since the 1984 supplement to the High School and Beyond (HS&B) survey,1 no national data have been collected to describe guidance counseling programs and activities. To help address this lack of current information, the National Center for Education Statistics (NCES) conducted a survey on high school guidance counseling in spring 2002 for the Office of Vocational and Adult Education, U.S. Department of Education. The survey, conducted through the NCES Fast Response Survey System (FRSS), provides a description of public high school guidance programs, activities, and staff in 2002.2
Key Findings
This E.D. Tab report summarizes findings for all public high schools in the 2002 FRSS survey and the 1984 supplement to HS&B. Findings for schools in the FRSS survey are also presented by the following school characteristics: enrollment size, locale, percentage of college-bound students, and number of vocational courses offered per 100 students.3 This executive summary presents highlights of findings for all public high schools and compares results from the FRSS survey and the supplement to HS&B concerning program goals, written plans, and selected guidance activities.
Program Goals and Written Plans
Of the four program goals examined in the 2002 FRSS survey, helping students with their academic achievement in high school was the most emphasized goal of high school guidance programs; 48 percent of all public high schools emphasized this goal the most (table 1). Fewer schools reported that the most emphasized goal of their guidance programs was helping students plan and prepare for postsecondary schooling (26 percent) or helping students with personal growth and development (17 percent). Schools were least likely to report that the most emphasized goal of their guidance programs was helping students plan and prepare for their work roles after high school (8 percent). Between 1984 and 2002, the proportion of public high schools indicating that helping students with their academic achievement in high school was the most emphasized guidance goal increased from 35 percent to 48 percent.
1 The 1984 supplement to the HS&B surveyed staff in about half of the original sample of 1,015 schools that participated in the base year (1980)
HS&B. The supplemental survey collected data on high school guidance counseling activities in 1984. 2 To retain comparability with the 1984 survey, this study used a working definition of high schools as schools with a highest grade of 11 or 12.
Most (90 percent) of the respondents were guidance counselors, 7 percent were principals, and 3 percent were some other staff member (see appendix A, methodology, for details on the sample and definitions).
3 The tables in the report also summarize findings for public high schools by region of the country, minority enrollment, and access to an area or regional vocational school.

iv
Fifty-six percent of public high schools in 1984 (not shown in tables) and 61 percent of public high schools in 2002 had written plans for their guidance programs (table 3). One-half (50 percent) of all public high schools had guidance plans with written standards in 2002.4
School Programs and Features
The FRSS survey gathered information about six school programs and features. Three of the six were found in a majority of public high schools: required state academic assessment for high school graduation (70 percent), school-to-work programs (65 percent), and a team approach to career development (56 percent; table 4). Fewer schools had a curriculum aligned around career clusters/paths (45 percent) or block scheduling (42 percent). The schools were least likely to have small learning communities such as houses or academies (15 percent). Public high schools also reported their perceptions of the overall effect of the programs or features on their ability to deliver guidance services; for every school program or feature examined, the schools reported mostly positive effects more often than no effects or mostly negative effects (table 5).
Selected Guidance Activities: Availability and Student Participation
The 2002 FRSS survey asked about 15 of the 16 guidance activities examined in the 1984 supplement to HS&B.5 In both surveys, schools indicated whether each activity was available to students and the percentage of students in grades 11 and 12 who participated in the activity.
Among the guidance activities examined in the survey, the following were the most commonly
available at public high schools in 2002: use of college catalogs, individual counseling sessions, use of computerized career information sources, testing and having tests interpreted for career planning purposes, and use of noncomputerized career information sources. These activities were offered by 92 to 100 percent of the schools (table 6). In addition, between 73 percent and 87 percent offered occupational information units in subject-matter courses, exploratory work experience programs, career days/nights, vocationally oriented assemblies and speakers in class, job-site tours, tours of postsecondary institutions, job shadowing, group guidance/counseling sessions, and training in job seeking skills. School courses in career decisionmaking were the least available activity, although this activity was available in 57 percent of all public high schools. Between 1984 and 2002, the proportion of schools offering a guidance activity declined for 3 of the 15 activities—career days/nights, tours of postsecondary institutions, and training in job seeking skills. During this time period, no differences were detected in the proportion of schools indicating that the remaining guidance activities were available.
Student participation (regardless of whether an activity is offered) provides a second indicator of
the prevalence of guidance activities.6 The guidance activity in which public high school students participated most often in 2002 was individual counseling sessions (78 percent of students; table 8). Fewer students (44 to 61 percent) participated in 8 of the remaining 14 activities—career days/nights, vocationally oriented assemblies and speakers in class, testing and having tests interpreted for career
4 Plans for guidance programs include program description, program schedule, staff roles and responsibilities, program resources, budget, and
management schedule. Standards are statements that provide a description of what students should know and be able to do at the highest level of expectation.
5 “Simulations” was not included in the 2002 FRSS survey because pretesting suggested that this activity is hardly ever used in schools and respondents might have difficulty answering the question.
6 For these analyses, schools that did not offer an activity were coded as having zero students participating in that activity.

v
planning purposes, group guidance/counseling sessions, occupational information units in subject-matter courses, the use of noncomputerized career information sources, the use of computerized career information sources, and the use of college catalogs. The activity in which students participated least often was job shadowing (17 percent).
As in 2002, the activity in which students participated most often in 1984 was individual
counseling sessions (79 percent), and the activity in which they participated least often was job shadowing (5 percent; table 8). Between 1984 and 2002, the proportion of students who participated in a guidance activity increased for 5 of the 15 activities: occupational information units in subject-matter courses, exploratory work experience programs, job-site tours, job shadowing, and the use of computerized career information sources. No significant differences were detected between these years in the proportion of students who participated in the remaining guidance activities.
Other School Activities
In the FRSS survey, public high schools were asked about four school activities that had not been included in the 1984 supplement to HS&B: regularly scheduled group guidance sessions led by teachers or other school staff, a written career plan, a senior project based on the student’s career of interest, and the selection of a career major or path to guide the student’s selection of courses. Schools indicated whether each activity was available and whether it was required of all, some, or no students.
In 2002, 77 percent of public high schools indicated that selection of a career major or path was
available, and 50 percent of all public high schools required all students to participate in the activity (table 10). Sixty-four percent of public high schools indicated that written career plans were available, and 47 percent required all students to participate in the activity. Sixty-three percent of public high schools reported that regularly scheduled group guidance sessions led by teachers or other school staff were available, and 35 percent required all students to participate in the activity. Finally, 31 percent of public high schools reported that senior projects based on the student’s career of interest were available, and 14 percent required all students to participate in that activity.
Guidance Staff
In the 2002 FRSS survey, public high schools reported the number of full- and part-time guidance counselors assigned to high school students, the number of counselors who were certified, the number of guidance paraprofessionals, and the percentage of time that the school’s guidance counselors spent delivering selected services to high school students during the school year. Schools also indicated whether their state or school district provided in-service training or professional development in selected topics for high school guidance counselors during the 12 months preceding the survey. In addition, the survey respondent (typically a lead guidance counselor) was asked to report the number of hours he/she spent on professional development in each topic.

vi
In 2002, about 49,500 guidance staff (counselors and paraprofessionals) were assigned to public high school students; this represents an average of 249 students for every guidance staff member and 284 students for every guidance counselor, including full- and part-time counselors (table 12).7 The ratio of high school students to full-time guidance counselors was 315:1 (not shown in tables). Most guidance counselors (90 percent) were employed full time, and most (94 percent) were certified, with full-time counselors being more likely than part-time counselors to be certified (96 vs. 79 percent; table 13).
Time Spent Delivering Services
The two listed services at which guidance counselors spent the most time in 2002 were the choice and scheduling of high school courses, and postsecondary education admissions and selections; 49 percent of public high schools reported that more than 20 percent of their guidance staff’s time was spent on the choice and scheduling of courses, and 43 percent indicated that more than 20 percent of their guidance staff’s time was spent on postsecondary education admissions and selections (table 14). The third activity at which guidance counselors spent the most time was students’ attendance, discipline, and other school and personal problems; one-third of public high schools reported that more than 20 percent of their guidance staff’s time was spent on this activity. Fewer public high schools (13 to 19 percent) indicated that more than 20 percent of their guidance staff’s time was spent on academic testing, occupational choice and career planning, and other guidance activities. Schools were least likely to report that more than 20 percent of their guidance staff’s time was spent on job placement and employability skill development (2 percent) and on non-guidance activities such as hall or lunch duty, substitute teaching, and bus duty (5 percent).
Professional Development for Guidance Counselors
About two-thirds (64 percent) of all public high schools indicated that their state or school district provided professional development on academic curriculum standards/frameworks or assessments for guidance counselors during the 12 months preceding the survey (table 16). Fewer schools (51 to 53 percent) reported the availability of professional development on career guidance standards/frameworks/models, how to interpret test scores and assess student achievement, and how to work with students with special needs. Of the five listed topics, the least available was training on occupational/vocational curriculum standards/frameworks or assessments (43 percent). Thirty-eight to 51 percent of respondents spent 4 or fewer hours, or the equivalent of one-half of a day or less, on professional development for a listed topic over the 12 months preceding the survey (table 17). The proportion of respondents who spent more than 8 hours on professional development for a listed topic during the preceding 12 months ranged from 18 percent for training on how to interpret test scores and assess student achievement to 30 percent for training on state or local career guidance standards/ frameworks/models and for training on state or local academic curriculum standards/frameworks or assessments.
7 It is important to note that the number of counselors and the student-counselor ratios from the FRSS survey are not strictly comparable to
estimates from the Common Core of Data (CCD). The CCD estimates are based on a definition of secondary schools as schools comprising any span of grades beginning with the next grade following an elementary or middle school (usually 7, 8, or 9) and ending with or below grade 12 (Snyder 2001). In contrast, the 2001–02 FRSS study defined secondary schools as schools with a highest grade of 11 or 12. Thus, the CCD definition encompasses a broader range of schools than does the FRSS definition. Because the CCD data are reported at the district level rather than the school level (i.e., the counts reflect all guidance counselors in the district assigned to secondary grades regardless of whether the school is a middle school, a senior high school, or a combined school), the CCD data cannot be disaggregated to reflect a definition of secondary schools that is comparable to the definition used by the FRSS study.

vii
Acknowledgments
The authors wish to thank the many individuals who contributed to the development of the survey
and this report. The survey was requested by Gisela Harkin of the Office of Vocational and Adult Education. Sharon Belli and Gisela Harkin contributed to the development of the survey.
At Westat, Tim Smith provided valuable input throughout the survey development and pretesting
phases. Debbie Alexander directed the data collection efforts, assisted by Ratna Basavaraju. Alla Belenky, Robert Delfierro, and Peter Wobus were the programmers. Carol Litman edited the report, which was formatted by Sylvie Warren.
The NCES staff who reviewed the report and provided valuable suggestions include William
Hussar, Val Plisko, John Ralph, Kathryn Chandler, Patrick Rooney, Lance Ferderer, Marilyn Seastrom, and Bruce Taylor. Reviewers outside of NCES were Steve Equall of the Nebraska Planning and Fiscal Management for Career and Technical Education, Gisela Harkin and Carolyn Lee of the Office of Vocational and Adult Education, U.S. Department of Education, Kimberley Green of the National Association of State Directors of Vocational-Technical Education Consortium, Daniel Goldenberg of Policy and Program Studies Service, and Stephanie Cronen, Lawrence Lanahan, and Sally Dillow of the American Institutes for Research, Education Statistics Services Institute.

viii

ix
Table of Contents
Section Page
Executive Summary.............................................................................................................. iii Introduction........................................................................................................................... 1 Selected Findings.................................................................................................................. 5
Guidance Programs....................................................................................................... 5 Program Goals ................................................................................................. 5 Program Plan and Written Standards............................................................... 6 School Programs and Features......................................................................... 6
Availability of School Programs and Features ................................... 7 Perceived Effects of School Programs and Features .......................... 7
School Guidance Activities........................................................................................... 8
Selected Guidance Activities: Availability and Student Participation............ 8
Availability of Selected Guidance Activities...................................... 9 Student Participation in Selected Guidance Activities ....................... 10
Other School Activities: Availability and Requirements................................ 11
Guidance Staff .............................................................................................................. 12
Characteristics of Guidance Staff .................................................................... 12 Time Spent Delivering Services ...................................................................... 13 Professional Development for Guidance Counselors ...................................... 14
References............................................................................................................................. 17
List of Appendixes
Appendix
A Methodology.............................................................................................................. A-1 B FRSS Survey Instrument, High School Guidance Counseling: 2001....................... B-1 C Selected Items from the 1984 Supplement to the High School and Beyond
Longitudinal Study (HS&B)...................................................................................... C-1

x
Table of Contents (Continued)
List of Tables
Table Page
1 Percentage distribution of public high schools indicating the extent to which their guidance programs emphasize selected goals: 1984 and 2002 ........................ 20
1a Standard errors of the percentage distribution of public high schools indicating
the extent to which their guidance programs emphasize selected goals: 1984 and 2002 .................................................................................................................... 21
2 Percentage distribution of public high schools indicating the extent to which
their guidance programs emphasize selected goals, by selected school characteristics: 2002 ................................................................................................. 22
2a Standard errors of the percentage distribution of public high schools indicating
the extent to which their guidance programs emphasize selected goals, by selected school characteristics: 2002........................................................................ 24
3 Percent of public high schools with written plans for their career guidance
programs, and percent indicating that their plans included written standards, by selected school characteristics: 2002................................................................... 26
3a Standard errors of the percent of public high schools with written plans for
their career guidance programs, and percent indicating that their plans included written standards, by selected school characteristics: 2002...................................... 27
4 Percent of public high schools indicating that the school currently has various
programs and features, by selected school characteristics: 2002.............................. 28 4a Standard errors of the percent of public high schools indicating that the school
currently has various programs and features, by selected school characteristics: 2002 ........................................................................................................................... 29
5 Of public high schools with programs and features, percentage distribution
reporting the perceived overall effect of those programs and features on the school’s ability to deliver guidance programs, by selected school characteristics: 2002 ................................................................................................. 30
5a Of public high schools with programs and features, standard errors of the
percentage distribution reporting the perceived overall effect of those programs and features on the school’s ability to deliver guidance programs, by selected school characteristics: 2002...................................................................................... 33

xi
Table of Contents (Continued)
List of Tables (Continued)
Table Page
6 Percent of public high schools indicating that various guidance activities are available at the school: 1984 and 2002..................................................................... 36
6a Standard errors of the percent of public high schools indicating that various
guidance activities are available at the school: 1984 and 2002 ................................ 37 7 Percent of public high schools indicating that various guidance activities are
available at the school, by selected school characteristics: 2002 ............................. 38 7a Standard errors of the percent of public high schools indicating that various
guidance activities are available at the school, by selected school characteristics: 2002 ................................................................................................. 41
8 Percent of public high school students who participate in various activities at
least once during the time period when they start 11th grade and ending when they leave high school: 1984 and 2002 .................................................................... 44
8a Standard errors of the percent of public high school students who participate in
various activities at least once during the time period when they start 11th grade and ending when they leave high school: 1984 and 2002 .............................. 45
9 Percent of public high school students who participate in various activities at
least once during the time period when they start 11th grade and ending when they leave high school, by selected school characteristics: 2002 ............................. 46
9a Standard errors of the percent of public high school students who participate in
various activities at least once during the time period when they start 11th grade and ending when they leave high school, by selected school characteristics: 2002 ................................................................................................. 49
10 Percent of public high schools indicating that various activities were available
during the 2001–02 school year, and percent reporting that the activity was required of all, some, or no high school students, by selected school characteristics ............................................................................................................ 52
10a Standard errors of the percent of public high schools indicating that various
activities were available during the 2001–02 school year, and percent reporting that the activity was required of all, some, or no high school students, by selected school characteristics ................................................................................... 56

xii
Table of Contents (Continued)
List of Tables (Continued)
Table Page
11 Percent of public high schools reporting that written career plans and the selection of career major or paths were both available to high school students, and of those schools, percent indicating that both activities were required of all students, by selected school characteristics: School year 2001–02.......................... 60
11a Standard errors of the percent of public high schools reporting that written
career plans and the selection of career major or paths were both available to high school students, and of those schools, the standard errors of the percent indicating that both activities were required of all students, by selected school characteristics: School year 2001–02 ....................................................................... 61
12 Number of guidance staff and counselors, and the number of students per
guidance staff and per counselor assigned to public high school students, by selected school characteristics: 2002................................................................... 62
12a Standard errors of the number of guidance staff and counselors, and the number
of students per guidance staff and per counselor assigned to public high school students, by selected school characteristics: 2002.................................................... 63
13 Percent of guidance counselors assigned to public high school students, and
percent of certified counselors, by employment status and selected school characteristics: 2002 ................................................................................................. 64
13a Standard errors of the percent of guidance counselors assigned to public high
school students, and percent of certified counselors, by employment status and selected school characteristics: 2002........................................................................ 65
14 Percentage distribution of public high schools indicating the percent of time
that all of the school’s guidance staff spent delivering selected guidance services to high school students: 2002 ..................................................................... 66
14a Standard errors of the percentage distribution of public high schools indicating
the percent of time that all of the school’s guidance staff spent delivering selected guidance services to high school students: 2002 ........................................ 67

xiii
Table of Contents (Continued)
List of Tables (Continued)
Table Page
15 Percentage distribution of public high schools indicating the percent of time that all of the school’s guidance staff spent delivering selected guidance services to high school students, by selected school characteristics: 2002 .............. 68
15a Standard errors of the percentage distribution of public high schools indicating
the percent of time that all of the school’s guidance staff spent delivering selected guidance services to high school students, by selected school characteristics: 2002 ................................................................................................. 72
16 Percent of public high schools indicating that their state or school district
provided in-service training or professional development in selected topics for the school’s high school guidance counselors during the past 12 months, by selected school characteristics: 2002................................................................... 76
16a Standard errors of the percent of public high schools indicating that their state
or school district provided in-service training or professional development in selected topics for the school’s high school guidance counselors during the past 12 months, by selected school characteristics: 2002 ................................................ 77
17 Percentage distribution of respondents reporting the time they spent on in-
service training or professional development in selected topics during the past 12 months, by selected school characteristics: 2002 ................................................ 78
17a Standard errors of the percentage distribution of respondents reporting the time
they spent on in-service training or professional development in selected topics during the past 12 months, by selected school characteristics: 2002........................ 80
18 Number of vocational courses per 100 students offered at responding schools
or at their area or regional vocational schools, and percentage distribution of schools reporting the number of courses available, by selected school characteristics: 2002 ................................................................................................. 82
18a Standard errors of the number of vocational courses per 100 students offered at
responding schools or at their area or regional vocational schools, and percentage distribution of schools reporting the number of courses available, by selected school characteristics: 2002................................................................... 83

xiv
Table of Contents (Continued)
List of Tables (continued)
Table Page
19 Percentage distribution of public high school 2000–2001 graduates who pursued selected activities directly after high school, by selected school characteristics: 2002 ................................................................................................. 84
19a Standard errors of the percentage distribution of public high school 2000–2001
graduates who pursued selected activities directly after high school, by selected school characteristics: 2002...................................................................................... 85
20 Percentage distribution of public high schools indicating primary sources of
information that were used to report the percent of 2000–2001 graduates who pursued selected activities directly after high school: 2002 ..................................... 86
20a Standard errors of the percentage distribution of public high schools indicating
primary sources of information that were used to report the percent of 2000–2001 graduates who pursued selected activities directly after high school: 2002 .... 87
A-1 Number and percent of responding public high schools in the study sample,
weighted estimates, and base estimates from the Common Core of Data (CCD), by selected school characteristics: 2002 and 1999–2000 ......................................... A-5

1
Introduction
Recent literature on school counseling has focused on the need for new directions for school
counseling and redefined roles for school counselors. Some educators (Baker 1996; Beale and McCay 2001; Campbell and Dahir 1997; Schmidt 1999) contend that school counseling programs need to become more closely aligned with state and national standards for school counselors. Some argue that school counselors often undertake inappropriate activities (e.g., scheduling of classes, student discipline, and clerical duties). These activities tend to compromise the counselors� ability to deal with key dimensions of school counseling�such as individual and group counseling, consultation, case management, program evaluation, and the development of schoolwide guidance programs (Baker 1996; Fitch, Newby, and Ballestero 2001; Perusse, Goodnough, and Noel 2001; Schmidt 1999).1
Federal support for improving or expanding guidance counseling programs in elementary and
secondary schools is reflected in several pieces of legislation under the Elementary and Secondary Education Act (ESEA) of 2001.2 For example, the Elementary and Secondary School Counseling Programs, under Title IV, Part D, of the ESEA, is a grant program that provides local agencies with federal funds to establish or expand elementary and secondary school counseling programs.3 Legislation on career guidance and counseling programs, embodied in the Carl D. Perkins Vocational and Technical Education Act of 1998 (Public Law 105-332), offers federal grants to help provide vocational-technical education programs and services to youths and adults. Thus, schools may use Perkins funds to support career counseling and guidance activities for students who participate in vocational programs.4
To address problems that may interfere with students� learning, guidance counselors may take on a
range of responsibilities, such as individual or group counseling on academic, career, and personal issues, and student discipline. However, no national data exist that provide a current picture of high school guidance counseling programs and activities. The most recent national data on high school guidance counseling were collected in 1984, as part of the Administrator and Teacher Survey, a supplement to the High School and Beyond Longitudinal Study (HS&B).5 To help address the lack of current information on high school guidance counseling, the National Center for Education Statistics (NCES) conducted a survey in spring 2002 for the Office of Vocational and Adult Education, U.S. Department of Education. The survey on high school guidance counseling was designed to provide a description of guidance
1 Sources of role statements for school counselors come from the American School Counselor Association (ASCA), state education departments,
and the professional literature on school counseling. Based on the ASCA National Standards for School Counseling Programs, school counselors are expected to engage in activities that would support the academic, career, and personal development of students.
2 Also referred to as the No Child Left Behind Act of 2001. 3 Counseling is also an allowable use of funds under other ESEA programs, such as Part A of the Title I program, Improving the Academic
Achievement of the Disadvantaged. 4 Perkins funds are made available mainly through state education agencies. According to the Office of Vocational and Adult Education
(OVAE), other frequent uses of Perkins funds include vocational curriculum materials, occupationally relevant equipment, materials for learning laboratories, curriculum development or modification, staff development, efforts for academic-vocational integration, supplemental services for special populations, remedial classes, and expansion of �tech prep� programs. The most frequent use of Perkins funds falls under accounting codes of salaries and equipment for programmatic purposes such as professional development, tech prep, career guidance and counseling, and integration of academic and vocational education (see description of the Carl D. Perkins Vocational and Technical Education Act of 1998, Available: http://www.ed.gov/offices/OVAE/CTE/legis.html).
5 The High School and Beyond (HS&B) survey was first conducted in 1980. The 1984 supplement to HS&B is a component of the Administrator and School Survey (ATS) of the second HS&B followup study in 1984 (see appendix A, methodology, for details).

2
programs, guidance activities for high school students, and guidance staff in 2002.6 Specifically, the 2002 survey examined the following dimensions of high school guidance counseling:
• goals, plans, and features of guidance programs;
• guidance activities engaged in by 11th- and 12th-grade students;
• professional characteristics of guidance staff, including employment status, certification, and time spent delivering guidance services; and
• professional development offered to guidance staff in the past year.
In addition to presenting current data from the 2002 survey, this report compares survey findings
with data from the 1984 supplement to HS&B concerning program goals, written plans, and guidance activities.7
NCES conducted the 2002 survey using the Fast Response Survey System (FRSS). The FRSS is
designed to collect small amounts of issue-oriented data with minimal burden on the respondents and to disseminate findings within a relatively short time period. Questionnaires were mailed to a nationally representative sample of 1,001 public high schools in the 50 states and the District of Columbia in January 2002. Principals were instructed to have the questionnaire completed by a lead guidance counselor or another staff member who was responsible for providing guidance services at the school. Most respondents (90 percent) were guidance counselors. Data have been weighted to yield national estimates. The weighted response rate is 94 percent. Detailed information about the survey methodology is provided in appendix A, and the questionnaire can be found in appendix B.
The summary tables report national estimates by the following school characteristics:8 • enrollment size (less than 500; 500 to 1,199; 1,200 or more);
• locale (city, urban fringe, town, rural);
• percent college bound (less than 50 percent, 50 to 74 percent, 75 percent or more);
• number of vocational courses offered per 100 students (fewer than 3 courses, 3 to 6 courses, more than 6 courses);
6 The survey was developed and approved by the Office of Management and Budget (OMB) in fall 2001, but it was mailed to schools in January
2002. For the remainder of this report, the survey will be referred to as the 2002 survey. To retain comparability with the HS&B data, this study uses a working definition of high schools as schools with a highest grade of 11 or 12. Most (90 percent) of the respondents were guidance counselors, 7 percent were principals, and 3 percent were some other staff member (see appendix A, methodology, for details on sample and definitions).
7 Comparisons between the 1984 and 2002 data are based on three survey questions asked in the 2002 survey that were comparable to questions asked in the 1984 supplement to HS&B (see appendix C for the HS&B questions).
8 For a full description of these variables, see appendix A, methodology. When referring to the categories for school enrollment size, schools with fewer than 500 students are referred to as small schools, those with 500 to 1,199 students are referred to as medium schools, and those with 1,200 or more students are referred to as large schools. When referring to the categories for the percent college bound, less than 50 percent students is considered a low proportion, 50 to 74 percent is considered a moderate proportion, and 75 percent or more is considered a high proportion. When referring to the categories for number of vocational courses offered per 100 students, fewer than 3 courses is considered a low number, 3 to 6 courses is considered a moderate number, and more than 6 courses is considered a high number of courses.

3
• region (Northeast, Southeast, Central, West);
• percent minority enrollment in the school (less than 6 percent, 6 to 20 percent, 21 to 49 percent, 50 percent or more); and
• access to area/regional vocational school (has access, does not have access).9
The section on selected findings discusses survey findings by four of the school characteristics
listed above�enrollment size, locale, percent college bound, and number of vocational courses offered per 100 students. In general, comparisons by these school characteristics are discussed only where significant differences were detected and follow meaningful patterns.10 All specific statements of comparisons made in this report have been tested for statistical significance using trend tests or t-tests adjusted for multiple comparisons using the Bonferroni adjustment.11 Comparison statements are significant at the 95 percent confidence level. The reader is referred to the methodology section (appendix A) for further details on the statistical methods used and on the school characteristics variables listed here.
It is important to note that many of these school characteristics may be related to each other. For
example, school size and locale are related, with city schools typically being larger than rural schools. Other relationships between these analysis variables may exist. However, this E.D. Tab report focuses on bivariate relationships between the analysis and questionnaire variables rather than more complex analyses.12
9 One issue that was of interest to the Office of Vocational and Adult Education, U.S. Department of Education, was whether the delivery system
used for vocational-technical education was related to the types of career guidance activities and programs available to students. To help address this issue, this report includes an examination of the extent to which guidance counseling differed by whether students at the school had access to an area/regional vocational school.
10Differences by these school characteristics are reported when clear patterns are detected. For example, differences in the proportion of schools with written guidance plans by enrollment size are reported where those differences follow an increasing or decreasing pattern or where differences are detected between small and large schools (i.e., the highest and lowest categories of the ordinal school characteristic variable). Some nonsignificant findings are reported in cases where significant differences were expected or where no differences were detected across a key variable or group of variables.
11The Bonferroni adjustment is appropriate to test for statistical significance when the analyses are mainly exploratory (as in this report) because it results in a more conservative critical value for judging statistical significance (see appendix A, methodology, for a more detailed discussion of the Bonferroni adjustment).
12E.D. Tab reports focus on the presentation of selected descriptive data in tabular format.

4

5
Selected Findings This E.D. Tab report presents national data from the 2002 FRSS survey on guidance counseling in
public high schools and selected comparisons with the 1984 supplement to HS&B. To highlight key dimensions of high school guidance counseling in 2002, data from the FRSS survey are presented for guidance program goals, activities, and staff.13 Comparisons between the 1984 and 2002 data are based on questions about guidance program goals and written plans, the availability of 15 selected guidance activities, and student participation in those activities.
Guidance Programs
To provide a description of the focus and content of guidance programs, the 2002 FRSS survey and the 1984 supplement to HS&B asked schools to indicate the extent to which selected goals were emphasized by the school�s guidance program and whether the school had a written plan for its career guidance program. In addition, the FRSS survey asked about written standards for guidance programs, the availability of selected school programs and features, and the impact of those programs and features on the school�s ability to deliver guidance services.
Program Goals
In the 1984 supplement to HS&B and the 2002 FRSS survey, public high schools reported the extent to which their guidance programs emphasized four goals: helping students plan and prepare for their work roles after high school, helping students with personal growth and development, helping students plan and prepare for postsecondary schooling, and helping students with their academic achievement in high school.14
• In 2002, helping students with their academic achievement in high school was the most
emphasized goal of public high school guidance programs; 48 percent of the schools emphasized this goal the most (table 1). Fewer schools reported that the most emphasized goal of their guidance programs was helping students plan and prepare for postsecondary schooling (26 percent) or helping students with personal growth and development (17 percent). Schools were least likely to report that their most emphasized guidance goal was helping students plan and prepare for their work roles after high school (8 percent).
• Between 1984 and 2002, the proportion of public high schools indicating that helping students with their academic achievement in high school was the most emphasized guidance goal increased from 35 percent to 48 percent (table 1). During this time period, no significant differences were detected in the proportion of schools reporting any of the other goals as their most emphasized guidance goal.
13Although the summary tables present additional data on the availability of vocational education courses for high school students and activities
pursued by high school graduates (tables 18 through 20), those data are included only as school characteristics in this section. 14The questionnaire asked schools to place 1 beside the goal with the most emphasis, 2 beside the goal with the second-most emphasis, and so on
through 4 for the goal with the least emphasis.

6
• In 2002, the proportion of public high schools indicating that helping students with their academic achievement in high school was the most emphasized guidance goal differed by enrollment size, locale, and the number of vocational courses offered per 100 students (table 2). The proportion of schools reporting this goal as their most emphasized guidance goal was positively related to enrollment size but negatively related to the number of vocational courses offered per 100 students. In addition, rural schools were less likely than schools located in urban fringes or cities to report this goal as their most emphasized guidance goal (39 percent vs. 59 percent, respectively).
• In 2002, there was a negative relationship between enrollment size and the proportion of public high schools reporting that helping students plan and prepare for postsecondary schooling was the most emphasized guidance goal (table 2).
Program Plan and Written Standards
Both the 1984 supplement to HS&B and the 2002 FRSS survey asked public high schools whether they had a written plan for their career guidance program. The FRSS survey also asked public high schools with written plans whether their plans included written standards.15
• Between 1984 and 2002, no significant difference was detected in the proportion of public high
schools with written plans for their career guidance programs. Fifty-six percent of public high schools in 1984 (not shown in tables) and 61 percent of public high schools in 2002 (table 3) had written plans for their guidance programs.
• In 2002, the proportion of public high schools with written plans for their guidance programs was positively related to enrollment size and the percentage of college-bound students at the school (table 3).
• One-half (50 percent) of all public high schools had guidance plans with written standards in 2002 (table 3). No differences were detected in the proportion of schools with written guidance standards by enrollment size, locale, the percentage of college-bound students, or the number of vocational courses offered per 100 students. 16
School Programs and Features
In 2002, public high schools indicated whether six selected school programs or features were available: a school-to-work program, small learning communities (e.g., houses or academies), block scheduling, a team approach to career development (e.g., among counselors, teachers, and parents), a curriculum aligned around career clusters/paths, and a required state academic assessment for high school graduation. In addition, schools reported their perceptions of the overall effect of these features on their ability to deliver guidance services.
15Plans for guidance programs include program description, program schedule, staff roles and responsibilities, program resources, budget, and
management schedule. Standards are statements that provide a description of what students should know and be able to do at the highest level of expectation.
16Differences that appear large in the tables may not be significant because of relatively large standard errors for the estimates of college-bound students.

7
Availability of School Programs and Features
• In 2002, three of the school programs and features were found in a majority of public high schools�required state academic assessment for high school graduation (70 percent), school-to-work programs (65 percent), and a team approach to career development (56 percent; table 4). Fewer schools had a curriculum that was aligned around career clusters/paths (45 percent) or block scheduling (42 percent). Schools were least likely to have small learning communities such as houses or academies (15 percent).
• The proportion of public high schools offering a school-to-work program was positively related to enrollment size (table 4).
• The proportion of public high schools with small learning communities differed by enrollment size, locale, the percentage of college-bound students, and the number of vocational courses offered per 100 students (table 4). For example, the likelihood of schools reporting that they had small learning communities was positively related to enrollment size and the percentage of college-bound students. In addition, the proportion of schools indicating that they had small learning communities was negatively related to the number of vocational courses per 100 students.
• The proportion of public high schools with block scheduling differed by enrollment size, with large and medium schools being more likely than small schools to report that they had this feature (48 and 51 percent vs. 31 percent, respectively; table 4). In addition, the likelihood of public high schools having block scheduling was negatively related to the number of vocational courses offered per 100 students.
• The proportion of public high schools using a team approach to career development was positively related to the number of vocational courses offered per 100 students (table 4).
• No significant differences were detected in the proportion of public high schools with a curriculum aligned around career clusters/paths by any of the selected school characteristics�enrollment size, locale, the percentage of college-bound students, or the number of vocational courses offered per 100 students (table 4). 17
Perceived Effects of School Programs and Features
In 2002, public high schools typically perceived overall positive effects of the listed school programs and features on their ability to deliver guidance services (table 5).18 For every school program and feature examined in the survey, public high schools were more likely to report mostly positive effects than no effects, and they were least likely to report that the effects were mostly negative.
• A team approach to career development was the most common of the listed programs for
which public high schools reported positive effects on their ability to deliver guidance services. Of schools that reported this program, 91 percent felt that it had mostly positive effects on the
17Differences by school characteristics in the proportion of schools with a required state assessment for high school graduation are not reported
because those differences may reflect variations at the state level. 18The reporting of effects of school programs or features on the school�s ability to deliver guidance services is based on individual assessments by
survey respondents.

8
school�s ability to deliver guidance services, and the remaining 9 percent reported that the program had no effects (table 5).
• Among public high schools with a curriculum aligned around career clusters/paths, 84 percent perceived that this feature had mostly positive effects on the school�s ability to deliver guidance services, 16 percent reported no effects, and 1 percent reported that this feature had mostly negative effects (table 5).
• Of public high schools with small learning communities, 83 percent perceived that the program had mostly positive effects on the school�s ability to deliver guidance services, 16 percent reported no effects, and 1 percent reported that the effects were mostly negative (table 5).
• Of public high schools with block scheduling, 76 percent felt that this feature had mostly positive effects on the school�s ability to deliver guidance services, 16 percent reported no effects, and 8 percent reported mostly negative effects (table 5).
• Among public high schools that had a school-to-work program, 75 percent perceived that the program had mostly positive effects on the school�s ability to deliver guidance services, 23 percent reported that the program had no effects, and 2 percent reported that it had mostly negative effects (table 5).
• A required state assessment for high school graduation was the least common of the listed programs and features for which public high schools reported positive effects on the school�s ability to deliver guidance services. Of the schools that had this requirement, 58 percent felt that its effects were mostly positive, 28 percent reported no effects, and 14 percent reported mostly negative effects (table 5).
School Guidance Activities
The 2002 FRSS questionnaire asked about 15 of the 16 selected guidance activities examined in the 1984 supplement to HS&B.19 In both years, public high schools indicated whether each activity was available to students during the school year and the percentage of students in grades 11 and 12 who participated in the activity. The 2002 survey also asked about the extent to which a second set of selected activities were available and required of students.
Selected Guidance Activities: Availability and Student Participation
In the 1984 supplement to HS&B and the 2002 FRSS survey, public high schools were asked about the availability of and student participation in 15 guidance activities: school courses in career decisionmaking, occupational information units in subject-matter courses, exploratory work experience programs, career days/nights, vocationally oriented assemblies and speakers in class, job-site tours or visits, tours of postsecondary institutions, job shadowing, testing and having tests interpreted for career planning purposes, individual counseling sessions, group guidance/counseling sessions, training in job
19�Simulations� was not included in the 2002 FRSS survey because pretesting suggested that this activity is hardly ever used in schools and
respondents may have difficulty answering the question.

9
seeking skills, the use of computerized career information sources, the use of noncomputerized career information sources, and use of college catalogs.
Availability of Selected Guidance Activities
• Among the guidance activities examined in the survey, the following were the five most commonly available at public high schools in 2002: use of college catalogs, individual counseling sessions, use of computerized career information sources, testing and having tests interpreted for career planning purposes, and use of noncomputerized career information sources. These activities were available at 92 to 100 percent of all public high schools (table 6). The proportion of schools with 9 of the remaining 10 activities ranged from 73 percent for career days/nights to 87 percent for vocationally oriented assemblies and speakers in class. School courses in career decisionmaking was the least available activity, although it was available in 57 percent of all public high schools.
• In 1984, the proportion of public high schools with a particular guidance activity ranged from 69 percent for school courses in career decisionmaking to 100 percent for individual counseling sessions and the use of college catalogs (table 6).
• Public high schools in 2002 were less likely than schools in 1984 to report that 3 of the 15 guidance activities were available�career days/nights, tours of postsecondary institutions, and training in job seeking skills (table 6). No significant differences were detected between these years in the proportion of schools indicating that the remaining guidance activities were available.
• In 2002, few differences by school characteristics were detected in the proportion of schools that had the guidance activities examined in the survey (table 7). Differences that were found include the following:
The proportion of schools with exploratory work experience programs differed by enrollment size, locale, and the number of vocational courses offered per 100 students. The proportion of schools with this program was positively related to enrollment size but negatively related to the number of vocational courses per 100 students. These programs were also less likely to be offered in rural schools than in schools in other locales.
Large and medium schools were less likely than small schools to offer tours of postsecondary institutions, but they were more likely than small schools to have group guidance/counseling sessions.
Computerized career information sources were more often available in schools with a high or moderate proportion of college-bound students than in schools with a low proportion of college-bound students.

10
Student Participation in Selected Guidance Activities
Student participation in a guidance activity is reported for all public high schools regardless of whether the activity was offered by the school.20 In the 1984 supplement to HS&B and the 2002 FRSS survey, schools reported the percentage of 11th- and 12th-grade students who participated in each of the 15 guidance activities. This information was used with enrollment data for grades 11 and 12 to calculate the number of students who participated in an activity at each public high school and the percentage across all public high schools.21 Enrollment data for the 2002 FRSS survey items were obtained from the 1999�2000 Common Core of Data (CCD) School Universe file, and enrollment data for the 1984 supplement to HS&B items were taken from the 1980 HS&B data.22 Thus, national estimates for the percentage of 11th- and 12th-grade students who participated in an activity were calculated by dividing the sum of 11th- and 12th-grade students who participated in the activity by the sum of students enrolled in those grades.
• The guidance activity in which 11th- and 12th-grade students participated most often in 2002
was individual counseling sessions; 78 percent of all public high school students participated in individual counseling sessions at least once during the 11th and 12th grades (table 8). Fewer students (ranging from 44 percent to 61 percent) participated in 8 of the remaining 14 activities�group guidance/counseling sessions, use of computerized career information sources, testing and having tests interpreted for career planning purposes, use of college catalogs, occupational information units in subject matter courses, use of noncomputerized information sources, career days/nights, and vocationally oriented assemblies and speakers in class. The activity in which students participated least often was job shadowing (17 percent).
• As in 2002, the guidance activity in which 11th- and 12th-grade students participated most often in 1984 was individual counseling sessions (79 percent), and the activity in which they participated the least was job shadowing (5 percent; table 8). The proportion of students who participated in the remaining 13 activities ranged from 15 percent to 55 percent.
• Between 1984 and 2002, the proportion of 11th- and 12th-grade students who participated in a guidance activity increased for 5 of the 15 activities�occupational information units in subject-matter courses, exploratory work experience programs, job-site tours, job shadowing, and the use of computerized career information sources (table 8). During this time period, no significant differences were detected in the proportion of students who participated in the remaining guidance activities.
• In 2002, the proportion of 11th- and 12th-grade students who participated in an activity differed by enrollment size for 10 of the guidance activities examined in the survey23�career days/nights, vocationally oriented assemblies and speakers in class, job-site tours or visits, tours of postsecondary institutions, job shadowing, testing and having tests interpreted for career planning purposes, individual counseling sessions, training in job seeking skills, use of
20For these analyses, schools that did not offer an activity were coded as having zero students participating in that activity. 21To retain comparability with the 1984 supplement to HS&B, the 2002 FRSS survey asked for the percent (rather than the number) of 11th- and
12th-grade students who participated in a guidance activity. For each activity, this percent was then converted to the number of 11th- and 12th-grade students for each school, which was then used to calculate the number and percent of 11th- and 12th-grade students across all public high schools, thus yielding a student-weighted estimate.
22See appendix A, methodology, for a description of the HS&B study. 23Some differences by school characteristics in the proportion of students who participated in an activity are not reported because they did not
follow a clear pattern. For example, while the proportion of students who participated in group guidance or counseling sessions was lower in small than medium schools, no differences were detected between small and large schools or medium and large schools.

11
noncomputerized career information sources, and use of computerized career information sources (table 9). In most instances in which differences were detected, there was a negative relationship between the proportion of students who participated in the activity and enrollment size; for example, 73 percent of students in small schools, 62 percent of students in medium schools, and 49 percent of students in large schools participated in testing and having tests interpreted for career planning purposes. The one exception was individual counseling sessions; a greater proportion of students in medium and large schools participated in this activity than did students in small schools.
• The proportion of 11th- and 12th-grade students who participated in an activity differed by school locale for four of the activities examined in the survey24�job-site tours or visits, tours of postsecondary institutions, job shadowing, and testing and having tests interpreted for career planning purposes (table 9). For example, the percentage of students who participated in job-site tours or visits was higher in rural schools than in schools in other locales, and the percentages of students who participated in tours of postsecondary institutions and job shadowing were higher in schools located in rural areas and towns than in schools located in cities or urban fringes.
• For two of the activities�use of computerized career information sources and the use of college catalogs�the proportion of 11th- and 12th-grade students who participated in the activity was positively related to the percentage of college-bound students at the school (table 9).
• The proportion of 11th- and 12th-grade students who participated in an activity was positively related to the number of vocational courses offered per 100 students for 7 of the activities examined in the survey�vocationally oriented assemblies and speakers in class, job-site tours or visits, tours of postsecondary institutions, job shadowing, testing and having tests interpreted for career planning purposes, training in job seeking skills, and the use of computerized career information sources (table 9).
Other School Activities: Availability and Requirements
In 2002, public high schools were asked about the availability and requirement status of four school activities that had not been included in the 1984 supplement to HS&B: regularly scheduled group guidance sessions led by teachers or other school staff, a written career plan, a senior project based on the student�s career of interest, and the selection of a career major or path to guide the student�s selection of courses. These activities were examined separately from the 15 guidance activities discussed earlier to explore the extent to which they were required of high school students. Thus, schools indicated whether each activity was available during the 2001�02 school year and whether it was required of all, some, or no students.
• Sixty-three percent of public high schools reported that regularly scheduled group guidance
sessions led by teachers or other school staff were available during the 2001�02 school year (table 10). Thirty-five percent of all public high schools required all students to participate in
24Some differences by school characteristics in the proportion of students who participated in an activity are not reported because they did not
follow a clear pattern. For example, while the proportion of students who participated in group guidance or counseling sessions was lower in rural schools than schools located in urban fringes, no differences were detected among schools in other locales.

12
the activity, 20 percent of schools required some students to participate in the activity, and 8 percent did not require any students to participate in the activity.
• Sixty-four percent of public high schools indicated that written career plans were available to students during the 2001�02 school year (table 10). Forty-seven percent of all public high schools required that all students participate in the activity, 15 percent of schools required that some students participate, and 2 percent did not require that any student participate.
• Thirty-one percent of public high schools reported that senior projects based on the student�s career of interest were available during the 2001�02 school year (table 10). Fourteen percent of all public high schools required that all students participate in the activity, 15 percent of schools required that some students participate, and 2 percent did not require that any student participate.
• Seventy-seven percent of public high schools indicated that selection of a career major or path was available to students during the 2001�02 school year (table 10). One-half (50 percent) of all public high schools required that all students participate in the activity, 23 percent of schools required that some students participate, and 4 percent did not require that any student participate.
• The survey data allow for an examination of public high schools that had both written career plans and the selection of a career major or path available during the 2001�02 school year. A majority of schools (57 percent) reported that both written career plans and the selection of a career major or path were available (table 11). Of the schools that had both activities available, 58 percent indicated that they required those activities of all of their students.
Guidance Staff
In 2002, public high schools reported the number of full- and part-time guidance counselors assigned to high school students, the number of counselors who were certified, the number of guidance paraprofessionals, and the percent of time that all of the school�s guidance counselors spent delivering selected services to high school students during the entire school year.
Characteristics of Guidance Staff
• In 2002, about 49,500 guidance staff (counselors and paraprofessionals) were assigned to students at public high schools. Across public high schools, there was an average of 249 students for every guidance staff member and 284 students for every guidance counselor, including counselors who were employed full and part time (table 12).25 The ratio of high school students to full-time guidance counselors was 315:1 (not shown in tables).
25It is important to note that the number of counselors and the student-counselor ratios from the FRSS survey are not strictly comparable to
estimates from the Common Core of Data (CCD). The CCD estimates are based on a definition of secondary schools as schools comprising any span of grades beginning with the next grade following an elementary or middle school (usually 7, 8, or 9) and ending with or below grade 12 (Snyder 2001). In contrast, the 2001�02 FRSS study defined secondary schools as schools with a highest grade of 11 or 12. Thus, the CCD definition encompasses a broader range of schools than does the FRSS definition. Because the CCD data are reported at the district level rather than the school level (i.e., the counts reflect all guidance counselors in the district assigned to secondary grades regardless of whether the school is a middle school, a senior high school, or a combined school), the CCD data cannot be disaggregated to reflect a definition of secondary schools that is comparable to the definition used by the FRSS study.

13
• The number of students per guidance staff was positively related to enrollment size but negatively related to the number of vocational courses offered per 100 students at public high schools (table 12). For example, the number of students per guidance staff was 150 for small schools, 237 for medium schools, and 293 for large schools. The number of students per guidance staff also varied by locale; rural schools had fewer students per guidance staff than schools in other locales (196 students in rural schools vs. 261 or more students in other locales).
• Most guidance counselors (90 percent) assigned to public high school students were employed full time (table 13). The percentage of counselors who were employed full time was positively related to enrollment size, but negatively related to the number of vocational courses offered per 100 students. The percentage of counselors who were employed full time also differed by locale; rural schools had a lower percentage of full-time counselors than did schools in other locales.
• Most guidance counselors (94 percent) assigned to public high school students were certified, with full-time counselors being more likely than part-time counselors to be certified (96 vs. 79 percent; table 13). The proportion of certified guidance counselors was higher in large and medium schools than in small schools. In addition, the proportion of certified guidance counselors was positively related to the percentage of college-bound students.
Time Spent Delivering Services
In 2002, public high schools indicated the percentage of time during the entire school year that all of their guidance staff spent on the following services: the choice and scheduling of high school courses; postsecondary education admissions and selections; occupational choice and career planning; job placement and employability skill development; dealing with students� attendance, discipline, and other school and personal problems; academic testing; other guidance activities; and non-guidance activities.
• The two services at which guidance staff were most likely to spend more than 20 percent of
their time during the entire school year were the choice and scheduling of classes and postsecondary education admissions and selections; 49 percent of public high schools reported that more than 20 percent of their guidance staff�s time was spent on the choice and scheduling of classes, and 43 percent of the schools indicated that more than 20 percent of their guidance staff�s time was spent on postsecondary education admissions and selections (table 14).
• The third service at which guidance staff were most likely to spend more than 20 percent of their time during the school year was dealing with student attendance, discipline, and other school and personal problems; one-third of public high schools reported that more than 20 percent of their guidance staff�s time was spent on this service (table 14). Fewer public high schools indicated that more than 20 percent of their guidance staff�s time was spent on academic testing (19 percent), occupational choice and career planning (17 percent), and other guidance activities (13 percent).
• Public high schools were least likely to report that more than 20 percent of their guidance staff�s time was spent on services related to job placement and employability skill development (2 percent) and on non-guidance activities such as hall or lunch duty, substitute teaching, and bus duty (5 percent; table 14).

14
• The proportion of public high schools indicating that more than 20 percent of their guidance staff�s time was spent on choice and scheduling of high school courses differed by enrollment size, locale, and the number of vocational courses offered per 100 students (table 15). The proportion of schools reporting more than 20 percent of their guidance staff�s time on this service was positively related to enrollment size but negatively related to the number of vocational courses per 100 students. In addition, rural schools were less likely than schools in other locales to indicate that more than 20 percent of their guidance staff�s time was spent on this service The proportion of public high schools reporting more than 20 percent of their guidance staff�s time on postsecondary education admissions and selections was positively related to the percentage of college-bound students but negatively related to the number of vocational courses offered per 100 students (table 15).
• No differences were detected by school enrollment size, locale, percentage of college-bound students, or vocational courses per 100 students in the proportion of public high schools indicating that more than 20 percent of their guidance staff�s time was spent on two of the remaining activities�occupational choice and career planning, and job placement and employability skill development (table 15).
Professional Development for Guidance Counselors
In 2002, public high schools indicated whether their state or school district provided in-service training or professional development in selected topics for high school guidance counselors during the 12 months preceding the survey. The topics included training on state or local career guidance standards/frameworks/models, state or local academic curriculum standards/frameworks/or assessments, state or local occupational/vocational curriculum standards/frameworks or assessments, how to work with students with special needs, and how to interpret test scores and assess student achievement. In addition, each survey respondent (typically a lead guidance counselor)26 was asked to report the number of hours he/she spent on professional development in each topic.
• The most common topic for which public high schools reported in-service training or
professional development for guidance counselors was academic curriculum standards/frameworks or assessments; about two-thirds (64 percent) of all public high schools indicated that their state or school district provided in-service training or professional development on this topic (table 16). Fewer schools, about one-half, reported the availability of professional development on career guidance standards/frameworks/models (53 percent), how to interpret test scores and assess student achievement (52 percent), and how to work with students with special needs (51 percent). Of the five listed topics, the least available was occupational/vocational curriculum standards/frameworks or assessments; 43 percent of the schools indicated that their state or school district provided professional development on this topic for guidance counselors.
• Thirty-eight to 51 percent of respondents spent 4 hours or less, or the equivalent of one-half a day or less, on professional development for a listed topic over the 12 months preceding the survey (table 17). For example, 38 percent of the respondents spent 4 hours or less on professional development on training on state or local academic curriculum standards/
26The survey cover letter addressed to the principal requested that the questionnaire be completed by the lead counselor or other staff member
who was responsible for providing guidance counseling services at the school. Most (90 percent) of the respondents were guidance counselors, 7 percent were principals, and 3 percent were some other staff member.

15
frameworks or assessments, while about half (51 percent) of the respondents spent 4 or fewer hours on training on state or local occupational/vocational curriculum standards/frameworks or assessments, and training on how to interpret test scores and assess student achievement.
• The proportion of respondents who spent more than 8 hours on professional development for a listed topic over the 12 months preceding the survey ranged from 18 percent for training on how to interpret test scores and assess student achievement to 30 percent for training on state or local career guidance standards/frameworks/models and for training on state or local academic curriculum standards/frameworks or assessments (table 17).

16

17
References
Baker, S.B. (1996). School Counseling for the Twenty-First Century. Englewood Cliffs, NJ: Prentice Hall.
Beale, A., and McCay, E. (2001). Selecting School Counselors: What Administrators Should Look for in Prospective Counselors. Clearing House, 74(5): 257�260.
Campbell, C.A., and Dahir, C.A. (1997). Sharing the Vision: The National Standards for School Counseling Programs. Alexandria, VA: American School Counselor Association.
Carl D. Perkins Vocational and Technical Education Act of 1998. Available: http://www.ed.gov/offices/OVAE/CTE/legis.html
Fitch, T.J., Newby, E., and Ballestero, V. (2001). Future School Administrators� Perceptions of the School Counselor�s Role. Counselor Education and Supervision, 41(2): 88�99.
Frankel, M., Kohnke, L., Buonanno, D., and Tourangeau, R. (1981). High School and Beyond: A National Longitudinal Study for the 1980�s. Sample Design Report. Chicago: National Opinion Research Center.
Perusse, R., Goodnough, G.E., and Noel, C.J. (2001). A National Survey of School Counselor Preparation Programs: Screening Methods, Faculty Experiences, Curricular Content, and Fieldwork Requirements. Counselor Education and Supervision, 40(4): 252�262.
Pfeffermann, D., and La Vange, L. (1989). Regression Models for Stratified Multi-Stage Cluster Samples. In C.J. Skinner, D. Holt., and T.M.F. Smith (Eds.), Analysis of Complex Surveys (pp. 237-260). New York: John Wiley and Sons.
Schmidt, J.J. (1999). Counseling in Schools: Essential Services and Comprehensive Programs. Boston: Allyn and Bacon.
Snyder, T. (2001). Digest of Education Statistics, 2000 (NCES 2001-034). U.S. Department of Education, National Center for Education Statistics. Washington, DC: U.S. Government Printing Office.
U.S. Department of Education, National Center for Education Statistics. (1989). High School and Beyond, 1980: Sophomore and Senior Cohort Second Follow-Up (1984). Administrator and Teacher Survey. Vol. IV (ICPSR 8443). Ann Arbor, MI.: Inter-university Consortium for Political and Social Research.

18

19
Tables of Estimates and Standard Errors

20
Table 1. Percentage distribution of public high schools indicating the extent to which their guidance programs emphasize selected goals: 1984 and 2002
Goal Most emphasis
Second most
emphasis Third most
emphasis Fourth most
emphasis 2002
Help students plan and prepare for their work roles after high school ...... 8 12 30 51 Help students with personal growth and development .............................. 17 21 31 31 Help students plan and prepare for postsecondary schooling.................... 26 39 26 9 Help students with their academic achievement in high school ................ 48 29 14 9
1984
Help students plan and prepare for their work roles after high school ...... 11 17 33 39 Help students with personal growth and development .............................. 27 28 16 29 Help students plan and prepare for postsecondary schooling.................... 27 32 29 12 Help students with their academic achievement in high school ................ 35 23 22 20
NOTE: Detail may not sum to totals because of rounding.
SOURCES: U.S. Department of Education, National Center for Education Statistics, Supplement to the High School and Beyond Longitudinal Study, �Administrator and Teacher Survey,� 1984; Fast Response Survey System, �Survey on High School Guidance Counseling, 2001,� FRSS 80, 2002.

21
Table 1a. Standard errors of the percentage distribution of public high schools indicating the extent to which their guidance programs emphasize selected goals: 1984 and 2002
Goal Most emphasis
Second most
emphasis Third most
emphasis Fourth most
emphasis 2002
Help students plan and prepare for their work roles after high school ...... 1.1 1.3 1.6 1.7 Help students with personal growth and development .............................. 1.4 1.6 1.4 1.7 Help students plan and prepare for postsecondary schooling.................... 1.7 1.9 1.6 1.1 Help students with their academic achievement in high school ................ 1.6 1.7 1.5 1.2
1984 Help students plan and prepare for their work roles after high school ...... 3.1 3.8 3.8 3.6 Help students with personal growth and development .............................. 4.9 4.8 3.0 4.7 Help students plan and prepare for postsecondary schooling.................... 4.4 4.5 3.8 2.9 Help students with their academic achievement in high school ................ 3.4 4.6 3.3 4.1
SOURCES: U.S. Department of Education, National Center for Education Statistics, Supplement to the High School and Beyond Longitudinal Study, �Administrator and Teacher Survey,� 1984; Fast Response Survey System, �Survey on High School Guidance Counseling, 2001,� FRSS 80, 2002.

22
Table 2. Percentage distribution of public high schools indicating the extent to which their guidance programs emphasize selected goals, by selected school characteristics: 2002
Help students plan and prepare for their work
roles after high school Help students with personal growth and
development
School characteristic
Most emphasis
Second most
emphasis
Third most
emphasis
Fourth most
emphasis Most
emphasis
Second most
emphasis
Third most
emphasis
Fourth most
emphasis All public high schools............................. 8 12 30 51 17 21 31 31
Enrollment size
Less than 500 ........................................... 12 15 35 38 21 18 24 36 500 to 1,199.............................................. 5 9 28 58 16 23 32 29 1,200 or more ........................................... 5 9 24 62 12 23 40 25
School locale
City .......................................................... 7 7 26 59 15 21 37 27 Urban fringe ............................................. 4 5 31 59 14 23 36 28 Town ........................................................ 6 9 28 57 18 28 28 25 Rural......................................................... 11 17 30 42 20 18 26 36
Percent college bound
Less than 50 percent................................. 11 9 38 41 17 28 22 32 50 to 74 percent........................................ 8 14 29 49 19 24 27 31 75 percent or more.................................... 7 10 28 55 16 17 35 31
Vocational courses per 100 students
Fewer than 3 courses ................................ 8 8 26 57 12 25 36 27 3 to 6 courses............................................ 5 14 29 52 17 22 30 32 More than 6 courses ................................. 11 11 33 45 21 19 27 33
Region Northeast .................................................. 4 4 24 67 17 27 33 23 Southeast .................................................. 8 13 25 53 18 25 32 25 Central...................................................... 10 12 36 42 21 16 27 36 West ......................................................... 8 14 29 49 14 20 32 34
Percent minority enrollment
Less than 6 percent................................... 8 13 37 42 20 18 23 39 6 to 20 percent.......................................... 11 10 24 55 16 23 35 26 21 to 49 percent........................................ 6 12 25 57 14 26 34 25 50 percent or more.................................... 8 8 28 57 17 20 36 27
Access to area/regional vocational school
Has access ................................................ 7 10 31 52 16 21 32 31 Does not have access................................ 10 15 27 48 19 22 27 32
See notes at end of table.

23
Table 2. Percentage distribution of public high schools indicating the extent to which their guidance programs emphasize selected goals, by selected school characteristics: 2002�Continued
Help students plan and prepare for
postsecondary schooling Help students with their academic achievement
in high school
School characteristic
Most emphasis
Second most
emphasis
Third most
emphasis
Fourth most
emphasis Most
emphasis
Second most
emphasis
Third most
emphasis
Fourth most
emphasis
All public high schools............................. 26 39 26 9 48 29 14 9 Enrollment size
Less than 500 ........................................... 31 34 23 11 35 33 18 14 500 to 1,199.............................................. 26 38 27 9 53 30 13 5 1,200 or more ........................................... 18 46 28 8 65 21 9 5
School locale
City .......................................................... 19 45 27 9 59 26 10 5 Urban fringe ............................................. 24 44 22 10 59 28 10 3 Town ........................................................ 24 36 30 10 51 27 14 8 Rural......................................................... 30 34 26 10 39 31 17 13
Percent college bound
Less than 50 percent................................. 20 38 23 19 52 24 17 7 50 to 74 percent........................................ 27 37 27 9 46 26 17 11 75 percent or more.................................... 27 40 26 7 49 32 11 8
Vocational courses per 100 students
Fewer than 3 courses ................................ 22 44 26 8 58 22 12 8 3 to 6 courses............................................ 25 37 28 10 52 28 14 7 More than 6 courses ................................. 30 36 24 9 38 34 16 12
Region
Northeast .................................................. 30 33 31 7 49 36 12 3 Southeast .................................................. 23 37 27 13 52 24 15 9 Central...................................................... 27 41 23 9 42 31 14 13 West ......................................................... 26 40 25 10 52 26 14 7
Percent minority enrollment
Less than 6 percent................................... 34 35 24 8 39 34 16 11 6 to 20 percent.......................................... 24 42 24 10 49 25 17 10 21 to 49 percent........................................ 22 38 28 12 58 24 12 6 50 percent or more.................................... 19 43 28 10 57 29 8 6
Access to area/regional vocational school
Has access ................................................ 27 41 23 9 50 29 14 8 Does not have access................................ 25 35 31 9 46 29 15 11
NOTE: Detail may not sum to totals because of rounding.
SOURCE: U.S. Department of Education, National Center for Education Statistics: Fast Response Survey System, �Survey on High School Guidance Counseling, 2001,� FRSS 80, 2002.

24
Table 2a. Standard errors of the percentage distribution of public high schools indicating the extent to which their guidance programs emphasize selected goals, by selected school characteristics: 2002
Help students plan and prepare for their work
roles after high school Help students with personal growth and
development
School characteristic
Most emphasis
Second most
emphasis
Third most
emphasis
Fourth most
emphasis Most
emphasis
Second most
emphasis
Third most
emphasis
Fourth most
emphasis
All public high schools............................. 1.1 1.3 1.6 1.7 1.4 1.6 1.4 1.7
Enrollment size
Less than 500 ........................................... 2.3 2.6 3.3 3.3 2.9 2.6 2.9 3.2 500 to 1,199.............................................. 1.1 1.6 2.9 3.0 1.9 2.6 2.5 3.1 1,200 or more ........................................... 1.5 1.6 2.2 2.6 1.9 2.4 2.5 2.4
School locale
City .......................................................... 2.4 1.9 3.6 4.8 2.8 3.4 4.1 3.7 Urban fringe ............................................. 1.2 1.4 2.8 2.6 2.2 2.6 2.7 2.9 Town ........................................................ 2.5 2.7 3.3 4.5 3.7 4.3 4.9 3.6 Rural......................................................... 2.1 2.7 2.9 2.7 2.6 2.7 2.5 3.0
Percent college bound
Less than 50 percent................................. 3.5 2.7 5.5 5.5 4.4 5.9 5.0 5.5 50 to 74 percent........................................ 1.8 2.3 3.1 3.4 2.1 2.6 2.6 3.3 75 percent or more.................................... 1.7 1.8 2.1 2.8 1.9 2.0 2.2 2.4
Vocational courses per 100 students
Fewer than 3 courses ................................ 1.8 1.7 2.2 3.4 2.3 2.4 2.7 2.7 3 to 6 courses............................................ 1.4 2.7 2.9 3.1 2.1 2.6 2.5 3.1 More than 6 courses ................................. 2.2 2.2 2.8 3.2 3.0 3.0 2.9 3.2
Region
Northeast .................................................. 1.6 1.5 3.7 4.1 3.0 3.4 4.3 3.4 Southeast .................................................. 2.1 2.9 3.5 4.2 2.7 3.4 3.6 3.8 Central...................................................... 2.1 2.6 3.2 3.2 2.8 2.6 2.9 3.1 West ......................................................... 2.1 2.1 3.5 3.3 3.0 3.3 2.7 3.8
Percent minority enrollment
Less than 6 percent................................... 1.7 2.8 2.8 3.0 2.3 2.8 2.7 3.2 6 to 20 percent.......................................... 2.3 1.9 2.6 2.7 3.1 3.1 3.2 2.9 21 to 49 percent........................................ 2.2 2.9 3.7 4.3 3.4 4.1 3.4 3.5 50 percent or more.................................... 2.2 2.0 3.3 3.9 2.8 2.7 4.1 3.3
Access to area/regional vocational school
Has access ................................................ 1.1 1.3 1.6 1.7 1.7 2.0 1.6 1.8 Does not have access................................ 2.1 2.8 3.1 3.5 3.0 3.0 2.8 3.4
See notes at end of table.

25
Table 2a. Standard errors of the percentage distribution of public high schools indicating the extent to which their guidance programs emphasize selected goals, by selected school characteristics: 2002�Continued
Help students plan and prepare for
postsecondary schooling Help students with their academic achievement
in high school
School characteristic
Most emphasis
Second most
emphasis
Third most
emphasis
Fourth most
emphasis Most
emphasis
Second most
emphasis
Third most
emphasis
Fourth most
emphasis
All public high schools............................. 1.7 1.9 1.6 1.1 1.6 1.7 1.5 1.2
Enrollment size
Less than 500 ........................................... 2.9 3.6 3.0 2.2 2.9 3.1 2.8 2.6 500 to 1,199.............................................. 2.6 3.1 2.8 1.7 2.5 2.8 1.9 1.1 1,200 or more ........................................... 2.2 2.8 2.4 1.7 2.5 2.3 1.7 1.3
School locale
City .......................................................... 2.8 3.6 3.7 2.4 3.2 3.4 2.7 2.0 Urban fringe ............................................. 2.8 3.5 2.7 2.2 3.1 3.1 1.8 1.1 Town ........................................................ 4.5 4.2 4.6 3.0 4.7 4.1 3.5 3.2 Rural......................................................... 3.1 3.3 2.7 1.8 2.9 2.9 2.4 2.5
Percent college bound
Less than 50 percent................................. 4.6 6.1 4.3 4.7 5.1 5.1 3.9 2.9 50 to 74 percent........................................ 3.0 3.2 2.8 1.6 2.6 2.4 2.4 2.2 75 percent or more.................................... 2.9 2.9 2.0 1.4 2.9 2.9 1.8 1.7
Vocational courses per 100 students
Fewer than 3 courses ................................ 2.0 2.8 2.4 1.4 2.7 2.7 1.8 2.1 3 to 6 courses............................................ 2.8 3.6 2.7 2.0 3.1 3.1 2.6 1.3 More than 6 courses ................................. 3.4 3.3 2.9 2.2 2.9 3.4 2.6 2.7
Region
Northeast .................................................. 3.3 4.5 4.0 2.0 3.6 4.2 3.7 1.3 Southeast .................................................. 3.2 3.4 3.3 2.6 3.4 3.4 2.7 2.8 Central...................................................... 3.2 3.4 3.1 2.0 3.3 4.0 2.7 2.7 West ......................................................... 4.0 3.9 3.0 2.2 3.6 2.7 2.3 2.4
Percent minority enrollment
Less than 6 percent................................... 3.2 3.0 3.0 1.6 2.6 3.5 2.8 2.2 6 to 20 percent.......................................... 3.3 3.9 3.0 2.1 3.8 2.8 2.8 2.4 21 to 49 percent........................................ 4.5 4.1 3.9 2.8 4.3 2.9 3.1 2.6 50 percent or more.................................... 2.7 3.7 3.2 2.4 3.2 2.9 2.4 2.0
Access to area/regional vocational school
Has access ................................................ 2.2 2.3 2.0 1.4 1.8 1.9 1.7 1.3 Does not have access................................ 3.2 3.6 2.8 1.7 3.2 3.3 2.4 2.5
SOURCE: U.S. Department of Education, National Center for Education Statistics: Fast Response Survey System, �Survey on High School Guidance Counseling, 2001,� FRSS 80, 2002.

26
Table 3. Percent of public high schools with written plans for their career guidance programs, and percent indicating that their plans included written standards, by selected school characteristics: 2002
School characteristic Percent of schools with
written plans for guidance programs
Percent of schools with written plans that included
written standards
All public high schools ............................................................................. 61 50 Enrollment size
Less than 500............................................................................................ 55 46 500 to 1,199.............................................................................................. 64 51 1,200 or more ........................................................................................... 67 56
School locale
City........................................................................................................... 62 51 Urban fringe ............................................................................................. 59 48 Town ........................................................................................................ 69 57 Rural......................................................................................................... 60 49
Percent college bound Less than 50 percent ................................................................................. 44 37 50 to 74 percent ........................................................................................ 60 50 75 percent or more.................................................................................... 66 54
Vocational courses per 100 students
Fewer than 3 courses ................................................................................ 61 51 3 to 6 courses............................................................................................ 64 51 More than 6 courses.................................................................................. 58 48
Region
Northeast .................................................................................................. 56 39 Southeast .................................................................................................. 68 60 Central ...................................................................................................... 60 50 West.......................................................................................................... 61 50
Percent minority enrollment
Less than 6 percent ................................................................................... 59 48 6 to 20 percent .......................................................................................... 65 54 21 to 49 percent ........................................................................................ 59 47 50 percent or more.................................................................................... 62 51
Access to area/regional vocational school
Has access ................................................................................................ 63 52 Does not have access ................................................................................ 57 45
SOURCE: U.S. Department of Education, National Center for Education Statistics, Fast Response Survey System, �Survey on High School Guidance Counseling, 2001,� FRSS 80, 2002.

27
Table 3a. Standard errors of the percent of public high schools with written plans for their career guidance programs, and percent indicating that their plans included written standards, by selected school characteristics: 2002
School characteristic Percent of schools with
written plans for guidance programs
Percent of schools with written plans that included
written standards
All public high schools ............................................................................. 1.9 1.8 Enrollment size
Less than 500............................................................................................ 3.3 3.3 500 to 1,199.............................................................................................. 3.4 3.3 1,200 or more ........................................................................................... 2.6 2.5
School locale
City........................................................................................................... 4.6 4.3 Urban fringe ............................................................................................. 3.4 3.3 Town ........................................................................................................ 4.9 5.3 Rural......................................................................................................... 2.8 2.7
Percent college bound
Less than 50 percent ................................................................................. 7.2 7.3 50 to 74 percent ........................................................................................ 3.3 3.5 75 percent or more.................................................................................... 2.6 2.7
Vocational courses per 100 students
Fewer than 3 courses ................................................................................ 3.4 3.1 3 to 6 courses............................................................................................ 2.8 3.1 More than 6 courses.................................................................................. 3.5 3.1
Region
Northeast .................................................................................................. 5.3 4.5 Southeast .................................................................................................. 2.8 3.5 Central ...................................................................................................... 3.0 3.5 West.......................................................................................................... 4.0 4.0
Percent minority enrollment
Less than 6 percent ................................................................................... 3.3 3.3 6 to 20 percent .......................................................................................... 3.8 4.2 21 to 49 percent ........................................................................................ 4.9 4.9 50 percent or more.................................................................................... 4.6 4.3
Access to area/regional vocational school Has access ................................................................................................ 2.2 2.1 Does not have access ................................................................................ 3.6 3.7
SOURCE: U.S. Department of Education, National Center for Education Statistics, Fast Response Survey System, �Survey on High School Guidance Counseling, 2001,� FRSS 80, 2002.

28
Table 4. Percent of public high schools indicating that the school currently has various programs and features, by selected school characteristics: 2002
School characteristic School-to-
work program
Small learning
communities Block
scheduling
A team approach to
career development
Curriculum aligned around career
clusters/ paths
Required state
assessment for high
school graduation
All public high schools ................ 65 15 42 56 45 70
Enrollment size
Less than 500............................... 57 7 31 60 41 62 500 to 1,199................................. 66 10 51 51 49 77 1,200 or more .............................. 76 35 48 57 48 77
School locale
City.............................................. 71 41 59 56 51 78 Urban fringe ................................ 64 16 43 53 44 75 Town ........................................... 69 6 49 59 54 68 Rural............................................ 62 9 34 58 42 66
Percent college bound Less than 50 percent .................... 57 8 41 50 34 76 50 to 74 percent ........................... 67 15 40 55 50 68 75 percent or more....................... 65 16 43 59 45 70
Vocational courses per 100 students
Fewer than 3 courses ................... 67 26 50 49 42 78 3 to 6 courses............................... 70 14 43 56 47 75 More than 6 courses..................... 59 9 34 61 46 61
Region
Northeast ..................................... 62 14 38 43 33 71 Southeast ..................................... 72 17 63 62 62 89 Central ......................................... 61 11 35 56 43 50 West............................................. 65 18 36 61 42 78
Percent minority enrollment
Less than 6 percent ...................... 62 6 39 56 45 58 6 to 20 percent ............................. 66 14 39 58 39 69 21 to 49 percent ........................... 65 14 38 51 46 84 50 percent or more....................... 70 35 53 62 51 85
Access to area/regional vocational school
Has access ................................... 64 15 42 53 43 71 Does not have access ................... 65 16 41 63 49 69
SOURCE: U.S. Department of Education, National Center for Education Statistics, Fast Response Survey System, �Survey on High School Guidance Counseling, 2001,� FRSS 80, 2002.

29
Table 4a. Standard errors of the percent of public high schools indicating that the school currently has various programs and features, by selected school characteristics: 2002
School characteristic School-to-
work program
Small learning
communities Block
scheduling
A team approach to
career development
Curriculum aligned around career
clusters/ paths
Required state
assessment for high
school graduation
All public high schools ................ 2.0 1.2 1.9 1.9 2.0 1.9
Enrollment size
Less than 500............................... 3.0 1.7 3.7 3.5 3.6 3.6 500 to 1,199................................. 3.0 1.8 2.6 2.8 3.2 2.2 1,200 or more .............................. 2.4 2.8 2.8 3.0 2.5 2.0
School locale
City.............................................. 4.2 4.4 4.1 4.5 3.9 3.8 Urban fringe ................................ 3.4 2.3 2.6 4.0 3.3 3.0 Town ........................................... 5.2 2.6 4.4 4.8 4.7 5.1 Rural............................................ 2.8 1.5 3.3 3.3 3.2 3.0
Percent college bound Less than 50 percent .................... 5.2 2.3 5.6 5.9 5.8 4.8 50 to 74 percent ........................... 2.9 2.2 2.4 3.2 3.5 3.6 75 percent or more....................... 3.0 1.5 2.8 2.8 2.7 2.9
Vocational courses per 100 students
Fewer than 3 courses ................... 2.7 2.7 3.1 2.6 2.5 2.6 3 to 6 courses............................... 2.7 2.1 2.6 2.9 2.7 2.7 More than 6 courses..................... 3.2 2.0 3.6 3.8 3.6 3.8
Region
Northeast ..................................... 4.8 2.9 3.5 4.6 3.8 4.1 Southeast ..................................... 3.3 2.3 3.3 3.4 3.4 2.9 Central ......................................... 3.9 2.0 3.9 3.5 4.2 3.8 West............................................. 3.1 2.6 2.9 3.3 3.7 2.6
Percent minority enrollment
Less than 6 percent ...................... 3.5 1.7 3.9 3.6 3.8 3.6 6 to 20 percent ............................. 3.9 2.1 3.7 3.4 3.8 4.8 21 to 49 percent ........................... 3.9 2.7 4.5 4.0 4.5 3.0 50 percent or more....................... 4.2 4.2 4.0 3.6 4.0 3.1
Access to area/regional vocational school
Has access ................................... 2.3 1.4 2.2 2.1 2.4 2.3 Does not have access ................... 3.3 2.3 3.1 3.3 3.9 3.1
SOURCE: U.S. Department of Education, National Center for Education Statistics, Fast Response Survey System, �Survey on High School Guidance Counseling, 2001,� FRSS 80, 2002.

30
Table 5. Of public high schools with programs and features, percentage distribution reporting the perceived overall effect of those programs and features on the school�s ability to deliver guidance programs, by selected school characteristics: 2002
School-to-work program Small learning communities
School characteristic Mostly positive
effect No
effect
Mostly negative
effect
Mostly positive
effect No
effect
Mostly negative
effect All public high schools ........................... 75 23 2 83 16 1
Enrollment size
Less than 500.......................................... 71 25 4 76 24 # 500 to 1,199............................................ 77 23 # 81 18 1 1,200 or more ......................................... 77 22 1 87 13 1
School locale
City......................................................... 82 17 1 89 11 # Urban fringe ........................................... 72 27 1 81 17 2 Town ...................................................... 80 20 # 69 27 4 Rural....................................................... 72 25 3 80 20 #
Percent college bound Less than 50 percent ............................... 67 29 4 92 8 # 50 to 74 percent ...................................... 75 25 # 87 13 # 75 percent or more.................................. 77 21 3 80 19 1
Vocational courses per 100 students
Fewer than 3 courses .............................. 76 24 1 83 16 1 3 to 6 courses.......................................... 74 23 2 83 16 1 More than 6 courses................................ 75 23 2 84 16 #
Region
Northeast ................................................ 73 26 1 88 12 # Southeast ................................................ 76 22 2 89 8 3 Central .................................................... 74 25 2 83 17 # West........................................................ 76 22 2 77 23 #
Percent minority enrollment
Less than 6 percent ................................. 70 28 3 82 18 # 6 to 20 percent ........................................ 76 22 2 77 23 # 21 to 49 percent ...................................... 79 21 # 91 9 # 50 percent or more.................................. 77 21 2 84 14 2
Access to area/regional vocational school
Has access .............................................. 74 25 1 82 16 1 Does not have access .............................. 76 21 3 85 15 #
See notes at end of table.

31
Table 5. Of public high schools with programs and features, percentage distribution reporting the perceived overall effect of those programs and features on the school�s ability to deliver guidance programs, by selected school characteristics: 2002�Continued
Block scheduling A team approach to career development
School characteristic Mostly positive
effect No
effect
Mostly negative
effect
Mostly positive
effect No
effect
Mostly negative
effect All public high schools ........................... 76 16 8 91 9 #
Enrollment size
Less than 500.......................................... 72 20 8 90 10 # 500 to 1,199............................................ 78 12 10 92 8 # 1,200 or more ......................................... 78 18 4 90 9 #
School locale
City......................................................... 84 11 5 87 13 # Urban fringe ........................................... 75 19 7 90 9 # Town ...................................................... 81 11 8 94 6 # Rural....................................................... 70 20 10 91 9 #
Percent college bound Less than 50 percent ............................... 56 34 10 77 22 # 50 to 74 percent ...................................... 82 13 5 94 5 # 75 percent or more.................................. 77 14 9 91 9 #
Vocational courses per 100 students
Fewer than 3 courses .............................. 75 19 6 88 12 # 3 to 6 courses.......................................... 78 12 11 95 5 # More than 6 courses................................ 75 19 6 89 11 #
Region
Northeast ................................................ 89 3 8 93 7 # Southeast ................................................ 69 19 13 92 8 # Central .................................................... 80 14 5 87 13 # West........................................................ 73 24 3 93 7 1
Percent minority enrollment
Less than 6 percent ................................. 76 15 9 91 9 # 6 to 20 percent ........................................ 76 17 7 90 10 # 21 to 49 percent ...................................... 80 14 6 95 5 # 50 percent or more.................................. 75 17 8 90 9 #
Access to area/regional vocational school
Has access .............................................. 76 15 9 91 9 # Does not have access .............................. 75 19 6 91 9 #
See notes at end of table.

32
Table 5. Of public high schools with programs and features, percentage distribution indicating the overall effect of those programs and features on the school�s ability to deliver guidance programs, by selected school characteristics: 2002�Continued
Curriculum aligned around career
clusters/paths Required state assessment for high school
graduation
School characteristic Mostly positive
effect No
effect
Mostly negative
effect
Mostly positive
effect No
effect
Mostly negative
effect All public high schools ........................... 84 16 1 58 28 14
Enrollment size
Less than 500.......................................... 86 13 1 59 31 10 500 to 1,199............................................ 87 13 # 56 28 17 1,200 or more ......................................... 76 23 1 59 24 17
School locale
City......................................................... 81 18 1 59 23 18 Urban fringe ........................................... 82 18 # 58 29 14 Town ...................................................... 86 14 1 64 20 17 Rural....................................................... 84 14 2 56 31 13
Percent college bound Less than 50 percent ............................... 73 21 5 62 24 14 50 to 74 percent ...................................... 88 12 # 59 28 13 75 percent or more.................................. 82 17 1 56 29 15
Vocational courses per 100 students
Fewer than 3 courses .............................. 81 18 1 60 24 15 3 to 6 courses.......................................... 84 16 1 58 30 12 More than 6 courses................................ 85 14 1 54 29 16
Region
Northeast ................................................ 83 16 1 51 36 13 Southeast ................................................ 81 16 3 60 21 19 Central .................................................... 85 15 # 52 32 16 West........................................................ 85 15 # 64 26 10
Percent minority enrollment
Less than 6 percent ................................. 82 16 2 46 36 18 6 to 20 percent ........................................ 87 13 # 54 28 18 21 to 49 percent ...................................... 84 15 1 70 23 7 50 percent or more.................................. 82 17 # 67 19 14
Access to area/regional vocational school
Has access .............................................. 81 17 1 54 29 16 Does not have access .............................. 88 12 # 65 25 11
# Estimate is less than 0.5 percent.
NOTE: Data presented in this table are based on the percent of schools with the program or feature (see table 4). The reporting of effects of school programs or features on the schools� ability to deliver guidance services is based on individual assessments of survey respondents. Detail may not sum to totals because of rounding. SOURCE: U.S. Department of Education, National Center for Education Statistics, Fast Response Survey System, �Survey on High School Guidance Counseling, 2001,� FRSS 80, 2002.

33
Table 5a. Of public high schools with programs and features, standard errors of the percentage distribution reporting the perceived overall effect of those programs and features on the school�s ability to deliver guidance programs, by selected school characteristics: 2002
School-to-work program Small learning communities
School characteristic Mostly positive
effect No
effect
Mostly negative
effect
Mostly positive
effect No
effect
Mostly negative
effect All public high schools ........................... 2.3 2.2 0.7 3.2 3.2 0.5
Enrollment size
Less than 500.......................................... 4.4 4.0 1.8 12.9 12.9 � 500 to 1,199............................................ 2.8 2.8 � 6.4 6.4 1.3 1,200 or more ......................................... 3.1 3.0 0.6 2.9 2.9 0.8
School locale
City......................................................... 3.9 3.7 1.0 3.8 3.8 � Urban fringe ........................................... 3.9 4.0 0.8 6.1 6.1 1.8 Town ...................................................... 5.4 5.4 � 28.3 29.3 4.7 Rural....................................................... 3.8 3.4 1.5 8.0 8.0 �
Percent college bound Less than 50 percent ............................... 6.3 6.0 3.4 8.2 8.2 � 50 to 74 percent ...................................... 3.5 3.5 � 4.2 4.2 � 75 percent or more.................................. 2.9 2.5 1.2 5.6 5.5 1.0
Vocational courses per 100 students
Fewer than 3 courses .............................. 3.3 3.2 0.5 3.7 3.7 1.0 3 to 6 courses.......................................... 3.6 3.5 1.3 5.7 5.4 0.8 More than 6 courses................................ 4.5 4.4 1.5 10.9 10.9 �
Region
Northeast ................................................ 4.5 4.5 1.4 6.4 6.4 � Southeast ................................................ 4.2 4.0 1.6 5.8 5.6 2.3 Central .................................................... 3.9 4.0 1.4 8.4 8.4 � West........................................................ 4.7 4.6 1.5 5.7 5.7 �
Percent minority enrollment
Less than 6 percent ................................. 4.4 4.3 1.6 12.8 12.8 � 6 to 20 percent ........................................ 4.1 3.8 1.7 8.8 8.8 � 21 to 49 percent ...................................... 4.7 4.7 � 6.7 6.7 � 50 percent or more.................................. 3.1 2.9 1.1 3.5 3.5 1.2
Access to area/regional vocational school
Has access .............................................. 2.5 2.5 0.7 4.4 4.5 0.8 Does not have access .............................. 3.9 3.4 1.8 4.3 4.3 �
See notes at end of table.

34
Table 5a. Of public high schools with programs and features, standard errors of the percentage distribution reporting the perceived overall effect of those programs and features on the school�s ability to deliver guidance programs, by selected school characteristics: 2002�Continued
Block scheduling A team approach to career development
School characteristic Mostly positive
effect No
effect
Mostly negative
effect
Mostly positive
effect No
effect
Mostly negative
effect All public high schools ........................... 2.3 1.8 1.4 1.5 1.5 �
Enrollment size
Less than 500.......................................... 5.0 4.8 2.4 2.8 2.8 � 500 to 1,199............................................ 3.7 2.5 2.7 2.3 2.3 � 1,200 or more ......................................... 3.5 3.1 1.7 1.8 1.8 �
School locale
City......................................................... 4.6 3.7 2.1 3.7 3.7 � Urban fringe ........................................... 4.7 3.8 2.8 2.6 2.5 � Town ...................................................... 5.1 4.3 3.3 3.8 3.8 � Rural....................................................... 4.7 4.3 2.8 2.3 2.3 �
Percent college bound Less than 50 percent ............................... 8.1 8.6 4.7 7.6 7.6 � 50 to 74 percent ...................................... 2.8 2.7 1.7 1.8 1.8 � 75 percent or more.................................. 3.9 3.1 2.3 1.9 1.9 �
Vocational courses per 100 students
Fewer than 3 courses .............................. 4.1 3.9 2.3 2.8 2.8 � 3 to 6 courses.......................................... 3.7 2.7 2.7 1.5 1.4 � More than 6 courses................................ 4.9 4.7 2.6 2.8 2.8 �
Region
Northeast ................................................ 4.1 2.2 3.6 2.8 2.8 � Southeast ................................................ 3.4 3.1 2.9 2.8 2.7 � Central .................................................... 4.3 4.0 2.3 3.0 3.0 � West........................................................ 4.7 4.6 1.7 2.2 2.1 �
Percent minority enrollment
Less than 6 percent ................................. 4.6 4.2 2.5 2.4 2.4 � 6 to 20 percent ........................................ 5.9 4.3 3.3 3.0 3.0 � 21 to 49 percent ...................................... 5.2 4.2 2.9 2.9 2.9 � 50 percent or more.................................. 4.5 3.6 2.9 2.5 2.5 �
Access to area/regional vocational school
Has access .............................................. 3.1 2.5 1.7 1.7 1.8 � Does not have access .............................. 4.1 4.0 2.1 2.5 2.5 �
See notes at end of table.

35
Table 5a. Of public high schools with programs and features, standard errors of the percentage distribution reporting the perceived overall effect of those programs and features on the school�s ability to deliver guidance programs, by selected school characteristics: 2002�Continued
Curriculum aligned around career
clusters/paths Required state assessment for high school
graduation
School characteristic Mostly positive
effect No
effect
Mostly negative
effect
Mostly positive
effect No
effect
Mostly negative
effect All public high schools ........................... 1.9 1.9 0.5 1.9 1.6 1.6
Enrollment size
Less than 500.......................................... 3.7 3.7 1.3 3.8 3.3 3.2 500 to 1,199............................................ 2.7 2.6 � 3.8 3.3 2.3 1,200 or more ......................................... 3.4 3.5 0.9 3.5 3.0 2.3
School locale
City......................................................... 4.5 4.5 1.0 4.1 3.6 3.1 Urban fringe ........................................... 3.4 3.4 � 4.0 3.7 2.6 Town ...................................................... 4.4 4.4 0.5 6.3 3.8 3.8 Rural....................................................... 3.1 3.0 1.2 3.0 3.1 2.4
Percent college bound Less than 50 percent ............................... 7.2 6.5 5.3 5.7 4.9 4.3 50 to 74 percent ...................................... 2.2 2.2 � 3.5 3.4 1.9 75 percent or more.................................. 3.0 3.0 0.5 2.8 2.6 2.7
Vocational courses per 100 students
Fewer than 3 courses .............................. 3.0 3.0 0.7 3.0 2.8 2.2 3 to 6 courses.......................................... 2.9 2.8 0.6 3.0 3.1 1.9 More than 6 courses................................ 3.4 3.4 1.3 4.1 3.7 4.1
Region
Northeast ................................................ 5.1 4.9 1.4 3.5 4.2 2.7 Southeast ................................................ 3.6 3.0 1.8 3.8 3.1 2.4 Central .................................................... 4.0 4.0 � 5.1 4.3 4.3 West........................................................ 3.3 3.3 � 4.2 3.8 2.6
Percent minority enrollment
Less than 6 percent ................................. 3.6 3.6 1.4 3.5 3.4 4.1 6 to 20 percent ........................................ 3.9 3.9 � 3.5 3.5 3.0 21 to 49 percent ...................................... 4.2 3.7 1.0 4.2 3.3 2.3 50 percent or more.................................. 2.9 3.0 � 3.7 3.0 2.2
Access to area/regional vocational school
Has access .............................................. 2.3 2.3 0.8 2.1 2.1 1.9 Does not have access .............................. 3.2 3.2 � 3.8 3.3 2.4
�Estimate of standard error is not derived because it is based on a statistic estimated at 0 percent. SOURCES: U.S. Department of Education, National Center for Education Statistics, Fast Response Survey System, �Survey on High School Guidance Counseling, 2001,� FRSS 80, 2002.

36
Table 6. Percent of public high schools indicating that various guidance activities are available at the school: 1984 and 2002
Activity 1984 2002 School courses in career decisionmaking......................................................................................... 69 57 Occupational information units in subject-matter courses ............................................................... 88 79 Exploratory work experience programs (for example, co-op, work study, internship)..................... 87 85 Career days/nights ........................................................................................................................... 90 73 Vocationally oriented assemblies and speakers in class................................................................... 92 87 Job-site tours or visits (field trips) ................................................................................................... 87 78 Tours of postsecondary institutions ................................................................................................. 93 79 Job shadowing (extended observations of a worker)........................................................................ 72 74 Testing and having tests interpreted for career planning purposes (for example, interest
inventories, vocational aptitude tests) .......................................................................................... 92 93 Individual counseling sessions......................................................................................................... 100 98 Group guidance/counseling sessions................................................................................................ 93 85 Training in job seeking skills........................................................................................................... 91 80 Use of noncomputerized career information sources ....................................................................... 98 92 Use of computerized career information sources ............................................................................. 89 96 Use of college catalogs .................................................................................................................... 100 1100
1Rounds to 100 percent for presentation in table.
SOURCES: U.S. Department of Education, National Center for Education Statistics: Supplement to the High School and Beyond Longitudinal Study, �Administrator and Teacher Survey,� 1984; Fast Response Survey System, �Survey on High School Guidance Counseling, 2001,� FRSS 80, 2002.

37
Table 6a. Standard errors of the percent of public high schools indicating that various guidance activities are available at the school: 1984 and 2002
Activity 1984 2002
School courses in career decisionmaking......................................................................................... 4.4 1.8 Occupational information units in subject-matter courses ............................................................... 3.7 1.7 Exploratory work experience programs (for example, co-op, work study, internship)..................... 4.0 1.3 Career days/nights ........................................................................................................................... 3.0 1.3 Vocationally oriented assemblies and speakers in class................................................................... 3.3 1.1 Job-site tours or visits (field trips) ................................................................................................... 3.7 1.6 Tours of postsecondary institutions ................................................................................................. 2.8 1.4 Job shadowing (extended observations of a worker)........................................................................ 4.5 1.7 Testing and having tests interpreted for career planning purposes (for example, interest
inventories, vocational aptitude tests) .......................................................................................... 3.4 0.8 Individual counseling sessions......................................................................................................... � 0.5 Group guidance/counseling sessions................................................................................................ 2.7 1.5 Training in job seeking skills........................................................................................................... 3.0 1.5 Use of noncomputerized career information sources ....................................................................... 2.1 1.0 Use of computerized career information sources ............................................................................. 2.9 0.8 Use of college catalogs .................................................................................................................... � 0.3
�Estimate of standard error is not derived because it is based on a statistic estimated at 100 percent. SOURCES: U.S. Department of Education, National Center for Education Statistics: Supplement to the High School and Beyond Longitudinal Study, �Administrator and Teacher Survey,� 1984; Fast Response Survey System, �Survey on High School Guidance Counseling, 2001,� FRSS 80, 2002.

38
Table 7. Percent of public high schools indicating that various guidance activities are available at the school, by selected school characteristics: 2002
School characteristic
School courses in
career decision-
making
Occupational information
units in subject-
matter courses
Exploratory work
experience programs
Career days/nights
Vocationally oriented
assemblies and speakers
in class
All public high schools ........................ 57 79 85 73 87 Enrollment size
Less than 500....................................... 60 75 74 74 84 500 to 1,199......................................... 54 81 91 70 89 1,200 or more ...................................... 57 81 97 74 88
School locale
City...................................................... 56 80 94 69 86 Urban fringe ........................................ 56 79 90 67 88 Town ................................................... 60 85 93 81 86 Rural.................................................... 58 76 78 75 86
Percent college bound Less than 50 percent ............................... 52 71 81 68 84 50 to 74 percent ...................................... 61 81 81 75 91 75 percent or more.................................. 56 79 90 73 84
Vocational courses per 100 students
Fewer than 3 courses .............................. 52 78 90 70 85 3 to 6 courses.......................................... 57 79 88 69 87 More than 6 courses................................ 62 80 80 78 88
Region
Northeast ............................................. 52 76 92 64 86 Southeast ............................................. 52 81 84 79 94 Central ................................................. 62 80 85 73 87 West..................................................... 59 77 83 74 82
Percent minority enrollment
Less than 6 percent .............................. 57 78 79 72 86 6 to 20 percent ..................................... 58 81 91 75 88 21 to 49 percent ................................... 55 77 86 73 83 50 percent or more............................... 59 78 89 74 90
Access to area/regional vocational school
Has access .............................................. 58 79 87 72 89 Does not have access .............................. 56 77 82 75 81
See notes at end of table.

39
Table 7. Percent of public high schools indicating that various guidance activities are available at the school, by selected school characteristics: 2002�Continued
School characteristic Job-site tours
or visits (field trips)
Tours of postsecondary
institutions
Job shadowing (extended
observations of a worker)
Testing and having tests
interpreted for career
planning purposes
Individual counseling
sessions
All public high schools ........................ 78 79 74 93 98 Enrollment size
Less than 500....................................... 74 85 73 93 97 500 to 1,199......................................... 79 75 77 93 1001
1,200 or more ...................................... 82 75 73 92 99 School locale
City...................................................... 80 84 70 88 100 Urban fringe ........................................ 76 67 66 93 98 Town ................................................... 86 88 84 94 1001
Rural.................................................... 76 82 77 94 98 Percent college bound
Less than 50 percent ............................... 75 81 67 91 96 50 to 74 percent ...................................... 79 81 74 94 99 75 percent or more.................................. 77 78 76 93 98
Vocational courses per 100 students
Fewer than 3 courses .............................. 78 79 68 90 99 3 to 6 courses.......................................... 75 75 77 93 98 More than 6 courses................................ 80 83 77 95 98
Region
Northeast ............................................. 75 70 73 92 99 Southeast ............................................. 82 79 75 93 99 Central ................................................. 79 80 80 94 100 West..................................................... 76 84 67 93 96
Percent minority enrollment
Less than 6 percent .............................. 80 78 82 94 99 6 to 20 percent ..................................... 76 75 71 95 99 21 to 49 percent ................................... 74 81 70 90 98 50 percent or more............................... 78 87 66 90 96
Access to area/regional vocational school
Has access .............................................. 79 77 76 94 99 Does not have access .............................. 75 84 71 90 97
See notes at end of table.

40
Table 7. Percent of public high schools indicating that various guidance activities are available at the school, by selected school characteristics: 2002�Continued
School characteristic Group
guidance/ counseling
sessions
Training in job seeking
skills
Use of noncomputer-
ized career information
sources
Use of computerized
career information
sources
Use of college
catalogs
All public high schools ........................ 85 80 92 96 1001
Enrollment size
Less than 500....................................... 78 78 93 94 99 500 to 1,199......................................... 91 81 93 96 100 1,200 or more ...................................... 90 82 91 97 100
School locale
City...................................................... 88 80 93 95 100 Urban fringe ........................................ 91 74 93 98 100 Town ................................................... 85 84 90 99 100 Rural.................................................... 81 82 93 93 99
Percent college bound
Less than 50 percent ............................... 80 75 89 86 100 50 to 74 percent ...................................... 88 84 94 97 100
75 percent or more.................................. 84 78 92 97 99 Vocational courses per 100 students
Fewer than 3 courses .............................. 87 77 90 93 100 3 to 6 courses.......................................... 87 81 94 98 100 More than 6 courses................................ 82 82 93 95 99
Region
Northeast ............................................. 94 74 94 99 100 Southeast ............................................. 89 84 91 93 100 Central ................................................. 84 80 96 97 100 West..................................................... 78 80 89 95 99
Percent minority enrollment
Less than 6 percent .............................. 85 79 94 96 100 6 to 20 percent ..................................... 85 81 93 97 99 21 to 49 percent ................................... 83 79 91 95 100 50 percent or more............................... 87 80 90 93 99
Access to area/regional vocational school
Has access .............................................. 88 79 94 97 100 Does not have access .............................. 80 82 90 93 99
1Rounds to 100 percent for presentation in table.
SOURCE: U.S. Department of Education, National Center for Education Statistics, Fast Response Survey System, �Survey on High School Guidance Counseling, 2001,� FRSS 80, 2002.

41
Table 7a. Standard errors of the percent of public high schools indicating that various guidance activities are available at the school, by selected school characteristics: 2002
School characteristic
School courses in
career decision-
making
Occupational information
units in subject-
matter courses
Exploratory work
experience programs
Career days/nights
Vocationally oriented
assemblies and speakers
in class
All public high schools ........................ 1.8 1.7 1.3 1.3 1.1 Enrollment size
Less than 500....................................... 3.6 3.1 3.0 2.8 2.2 500 to 1,199......................................... 2.4 2.4 1.6 2.7 1.8 1,200 or more ...................................... 2.9 1.9 0.9 2.4 1.8
School locale
City...................................................... 4.3 3.0 2.2 4.0 2.9 Urban fringe ........................................ 3.6 2.1 2.2 3.0 1.9 Town ................................................... 4.5 4.1 2.4 3.2 3.4 Rural.................................................... 3.1 2.9 2.8 2.5 2.1
Percent college bound Less than 50 percent ............................... 6.0 5.8 4.3 4.6 3.8 50 to 74 percent ...................................... 2.6 2.5 2.6 2.8 1.5 75 percent or more.................................. 2.8 2.4 1.9 2.6 1.9
Vocational courses per 100 students
Fewer than 3 courses .............................. 2.9 2.5 2.1 2.8 2.0 3 to 6 courses.......................................... 2.8 2.6 2.1 2.8 2.2 More than 6 courses................................ 3.5 2.8 3.4 2.7 2.3
Region
Northeast ............................................. 4.2 3.4 2.0 4.8 3.0 Southeast ............................................. 3.1 2.9 2.8 2.7 1.9 Central ................................................. 3.7 2.9 2.8 2.6 2.2 West..................................................... 3.4 3.4 3.0 2.9 2.6
Percent minority enrollment
Less than 6 percent .............................. 3.5 2.9 2.8 2.8 2.4 6 to 20 percent ..................................... 3.3 3.3 1.9 3.1 2.2 21 to 49 percent ................................... 4.0 3.6 3.3 4.1 3.6 50 percent or more............................... 3.4 2.9 2.8 3.7 2.2
Access to area/regional vocational school
Has access .............................................. 2.1 1.9 1.4 1.7 1.3 Does not have access .............................. 3.3 3.2 2.9 2.7 3.0
See notes at end of table.

42
Table 7a. Standard errors of the percent of public high schools indicating that various guidance activities are available at the school, by selected school characteristics: 2002�Continued
School characteristic Job-site tours
or visits (field trips)
Tours of postsecondary
institutions
Job shadowing (extended
observations of a worker)
Testing and having tests
interpreted for career
planning purposes
Individual counseling
sessions
All public high schools ........................ 1.6 1.4 1.7 0.8 0.5 Enrollment size
Less than 500....................................... 3.1 2.4 3.1 1.5 1.2 500 to 1,199......................................... 2.6 2.4 2.3 1.4 0.4 1,200 or more ...................................... 1.9 2.0 2.6 1.5 0.5
School locale
City...................................................... 3.0 3.2 4.0 2.9 � Urban fringe ........................................ 2.8 3.5 3.5 1.7 0.9 Town ................................................... 3.1 3.0 3.6 2.1 0.4 Rural.................................................... 2.8 2.5 2.6 1.4 0.9
Percent college bound Less than 50 percent ............................... 4.7 4.7 5.7 3.6 2.2 50 to 74 percent ...................................... 2.9 2.2 2.8 1.4 0.7 75 percent or more.................................. 2.2 2.2 2.1 1.3 0.6
Vocational courses per 100 students
Fewer than 3 courses .............................. 2.2 2.6 3.3 1.9 0.5 3 to 6 courses.......................................... 2.7 2.6 2.7 1.6 0.9 More than 6 courses................................ 3.3 2.7 3.0 1.4 0.9
Region
Northeast ............................................. 3.8 3.9 4.1 2.7 0.9 Southeast ............................................. 3.0 2.6 2.9 2.2 0.4 Central ................................................. 2.8 2.4 2.9 1.6 � West..................................................... 3.2 2.6 3.4 2.0 1.4
Percent minority enrollment
Less than 6 percent .............................. 2.5 2.4 2.7 1.6 0.5 6 to 20 percent ..................................... 3.4 2.4 3.3 1.4 0.9 21 to 49 percent ................................... 4.7 3.2 4.9 2.8 1.4 50 percent or more............................... 3.2 2.7 3.4 2.2 1.6
Access to area/regional vocational school
Has access .............................................. 1.6 1.6 2.3 0.9 0.3 Does not have access .............................. 2.8 2.5 3.2 2.0 1.3
See notes at end of table.

43
Table 7a. Standard errors of the percent of public high schools indicating that various guidance activities are available at the school, by selected school characteristics: 2002�Continued
School characteristic Group
guidance/ counseling
sessions
Training in job seeking
skills
Use of noncomputer-
ized career information
sources
Use of computerized
career information
sources
Use of college
catalogs
All public high schools ........................ 1.5 1.5 1.0 0.8 0.3 Enrollment size
Less than 500....................................... 3.0 2.6 1.5 1.6 0.6 500 to 1,199......................................... 1.7 2.1 1.5 1.1 � 1,200 or more ...................................... 1.6 2.1 1.5 0.9 �
School locale
City...................................................... 3.2 3.3 1.9 1.6 � Urban fringe ........................................ 1.8 2.9 1.6 0.8 � Town ................................................... 4.2 4.1 3.2 1.1 � Rural.................................................... 2.7 2.3 1.5 1.6 0.6
Percent college bound Less than 50 percent ............................... 4.0 5.0 3.6 4.1 � 50 to 74 percent ...................................... 2.7 2.1 1.5 0.8 � 75 percent or more.................................. 2.0 2.2 1.3 0.9 0.5
Vocational courses per 100 students
Fewer than 3 courses .............................. 2.1 2.6 1.8 1.6 � 3 to 6 courses.......................................... 2.2 2.2 1.3 0.9 � More than 6 courses................................ 2.7 3.0 1.7 1.3 0.6
Region
Northeast ............................................. 1.8 3.8 2.1 0.8 � Southeast ............................................. 2.2 2.7 2.3 2.7 � Central ................................................. 2.4 2.6 1.4 1.1 � West..................................................... 3.6 3.0 2.1 1.8 0.9
Percent minority enrollment
Less than 6 percent .............................. 2.4 2.6 1.4 1.1 � 6 to 20 percent ..................................... 3.0 3.0 2.0 1.9 0.9 21 to 49 percent ................................... 3.1 3.6 2.6 2.2 � 50 percent or more............................... 2.9 3.5 2.0 1.9 0l7
Access to area/regional vocational school
Has access .............................................. 1.4 2.0 1.1 0.8 � Does not have access .............................. 3.1 2.6 2.2 2.0 0.8
� Estimate for standard error is not derived because it is based on a statistic of 100 percent.
SOURCE: U.S. Department of Education, National Center for Education Statistics, Fast Response Survey System, �Survey on High School Guidance Counseling, 2001,� FRSS 80, 2002.

44
Table 8. Percent of public high school students who participate in various activities at least once during the time period when they start 11th grade and ending when they leave high school: 1984 and 2002
Activity 1984 2002 School courses in career decisionmaking............................................................................................ 22 27 Occupational information units in subject-matter courses .................................................................. 37 49 Exploratory work experience programs (for example, co-op, work study, internship)........................ 15 23 Career days/nights .............................................................................................................................. 39 45 Vocationally oriented assemblies and speakers in class...................................................................... 44 44 Job-site tours or visits (field trips) ...................................................................................................... 17 22 Tours of postsecondary institutions .................................................................................................... 22 26 Job shadowing (extended observations of a worker)........................................................................... 5 17 Testing and having tests interpreted for career planning purposes (for example, interest
inventories, vocational aptitude tests) ............................................................................................. 53 56 Individual counseling sessions............................................................................................................ 79 78 Group guidance/counseling sessions................................................................................................... 55 61 Training in job seeking skills.............................................................................................................. 32 36 Use of noncomputerized career information sources .......................................................................... 50 47 Use of computerized career information sources ................................................................................ 27 57 Use of college catalogs ....................................................................................................................... 51 55
NOTE: Percentages are based on information provided by public high schools about their students� participation in each activity. Student participation in a guidance activity is reported for all public high schools, regardless of whether the activity was offered by the school. Thus, for these analyses, schools that did not offer an activity were coded as having zero students participating in that activity. In the 1984 supplement to HS&B and the 2002 FRSS survey, schools reported the percentage of 11th- and 12th-grade students who participated in each of the 15 guidance activities. This information was used with enrollment data for grades 11 and 12 to calculate the number of students who participated in an activity at each public high school, and the percentage across all public high schools. Enrollment data for the 2002 FRSS survey items were obtained from the 1999�2000 Common Core of Data (CCD) School Universe file, and enrollment data for the 1984 supplement to HS&B items were taken from the 1980 HS&B data. Thus, national estimates for the percentage of 11th- and 12th-grade students who participated in an activity were calculated by dividing the sum of 11th- and 12th-grade students who participated in the activity by the sum of students enrolled in those grades. SOURCES: U.S. Department of Education, National Center for Education Statistics, Supplement to the High School and Beyond Longitudinal Study, �Administrator and Teacher Survey,� 1984; Fast Response Survey System, �Survey on High School Guidance Counseling, 2001,� FRSS 80, 2002.

45
Table 8a. Standard errors of the percent of public high school students who participate in various activities at least once during the time period when they start 11th grade and ending when they leave high school: 1984 and 2002
Activity 1984 2002 School courses in career decisionmaking............................................................................................ 2.4 1.3 Occupational information units in subject-matter courses .................................................................. 1.9 1.5 Exploratory work experience programs (for example, co-op, work study, internship)........................ 0.7 0.9 Career days/nights .............................................................................................................................. 2.3 1.5 Vocationally oriented assemblies and speakers in class...................................................................... 2.5 1.1 Job-site tours or visits (field trips) ...................................................................................................... 1.3 0.8 Tours of postsecondary institutions .................................................................................................... 1.6 0.8 Job shadowing (extended observations of a worker)........................................................................... 0.8 0.9 Testing and having tests interpreted for career planning purposes (for example, interest
inventories, vocational aptitude tests) ............................................................................................. 2.4 1.6 Individual counseling sessions............................................................................................................ 1.9 0.9 Group guidance/counseling sessions................................................................................................... 2.1 1.7 Training in job seeking skills.............................................................................................................. 2.1 1.4 Use of noncomputerized career information sources .......................................................................... 1.8 1.6 Use of computerized career information sources ................................................................................ 1.6 1.4 Use of college catalogs ....................................................................................................................... 1.5 1.0
SOURCES: U.S. Department of Education, National Center for Education Statistics: Supplement to the High School and Beyond Longitudinal Study, �Administrator and Teacher Survey,� 1984; Fast Response Survey System, �Survey on High School Guidance Counseling, 2001,� FRSS 80, 2002.

46
Table 9. Percent of public high school students who participate in various activities at least once during the time period when they start 11th grade and ending when they leave high school, by selected school characteristics: 2002
School characteristic
School courses in
career decision-
making
Occupational information
units in subject-
matter courses
Exploratory work
experience programs
Career days/nights
Vocationally oriented
assemblies and speakers
in class
All public high schools ........................ 27 49 23 45 44 Enrollment size
Less than 500....................................... 33 51 22 55 58 500 to 1,199......................................... 25 51 23 45 49 1,200 or more ...................................... 26 48 22 43 39
School locale
City...................................................... 23 46 25 44 38 Urban fringe ........................................ 26 48 22 38 42 Town ................................................... 28 54 21 54 49 Rural.................................................... 32 50 22 54 51
Percent college bound Less than 50 percent ............................... 27 43 21 46 44 50 to 74 percent ...................................... 28 51 22 46 45 75 percent or more.................................. 26 48 23 44 44
Vocational courses per 100 students
Fewer than 3 courses .............................. 26 45 23 45 41 3 to 6 courses.......................................... 27 52 23 42 45 More than 6 courses................................ 28 51 21 51 52
Region
Northeast ............................................. 28 47 25 35 37 Southeast ............................................. 21 51 22 56 56 Central ................................................. 33 51 22 41 44 West..................................................... 24 47 22 47 39
Percent minority enrollment
Less than 6 percent .............................. 29 51 20 45 49 6 to 20 percent ..................................... 29 54 24 41 42 21 to 49 percent ................................... 21 41 24 46 42 50 percent or more............................... 27 47 23 48 44
Access to area/regional vocational school
Has access .............................................. 27 49 22 43 43 Does not have access .............................. 25 48 24 50 45
See notes at end of table.

47
Table 9. Percent of public high school students who participate in various activities at least once during the time period when they start 11th grade and ending when they leave high school, by selected school characteristics: 2002�Continued
School characteristic Job-site tours
or visits (field trips)
Tours of postsecondary
institutions
Job shadowing (extended
observations of a worker)
Testing and having tests
interpreted for career
planning purposes
Individual counseling
sessions
All public high schools ........................ 22 26 17 56 78 Enrollment size
Less than 500....................................... 32 43 26 73 70 500 to 1,199......................................... 24 28 22 62 80 1,200 or more ...................................... 20 22 12 49 78
School locale
City...................................................... 20 24 14 46 80 Urban fringe ........................................ 20 21 13 54 81 Town ................................................... 21 32 22 62 71 Rural.................................................... 31 35 23 66 75
Percent college bound Less than 50 percent ............................... 22 20 14 46 69 50 to 74 percent ...................................... 23 26 17 57 77 75 percent or more.................................. 22 27 17 57 80
Vocational courses per 100 students
Fewer than 3 courses .............................. 19 24 13 52 79 3 to 6 courses.......................................... 23 25 20 57 79 More than 6 courses................................ 31 34 22 65 74
Region
Northeast ............................................. 19 22 15 55 91 Southeast ............................................. 28 26 18 59 77 Central ................................................. 25 30 20 62 79 West..................................................... 19 25 14 50 71
Percent minority enrollment
Less than 6 percent .............................. 26 28 24 67 77 6 to 20 percent ..................................... 20 27 16 57 82 21 to 49 percent ................................... 20 21 15 47 75 50 percent or more............................... 23 29 12 49 78
Access to area/regional vocational school
Has access .............................................. 22 25 17 57 79 Does not have access .............................. 23 29 17 54 77
See notes at end of table.

48
Table 9. Percent of public high school students who participate in various activities at least once during the time period when they start 11th grade and ending when they leave high school, by selected school characteristics: 2002�Continued
School characteristic Group
guidance/ counseling
sessions
Training in job seeking
skills
Use of noncomputer-
ized career information
sources
Use of computerized
career information
sources
Use of college
catalogs
All public high schools ........................ 61 36 47 57 55 Enrollment size
Less than 500....................................... 54 42 55 64 58 500 to 1,199......................................... 65 39 50 59 59 1,200 or more ...................................... 60 34 44 54 53
School locale
City...................................................... 57 34 42 51 51 Urban fringe ........................................ 66 32 47 57 58 Town ................................................... 62 40 42 60 54 Rural.................................................... 54 44 55 60 56
Percent college bound Less than 50 percent ............................... 50 35 43 40 38 50 to 74 percent ...................................... 59 36 47 53 52 75 percent or more.................................. 63 37 48 61 60
Vocational courses per 100 students
Fewer than 3 courses .............................. 60 34 43 53 54 3 to 6 courses.......................................... 62 37 50 59 55 More than 6 courses................................ 62 43 52 63 59
Region
Northeast ............................................. 72 30 52 61 66 Southeast ............................................. 70 41 50 53 54 Central ................................................. 55 36 49 59 57 West..................................................... 52 37 41 55 48
Percent minority enrollment
Less than 6 percent .............................. 61 37 55 62 58 6 to 20 percent ..................................... 62 39 48 58 59 21 to 49 percent ................................... 63 32 43 54 52 50 percent or more............................... 58 35 41 51 53
Access to area/regional vocational school
Has access .............................................. 63 36 48 57 55 Does not have access .............................. 56 37 46 55 56
NOTE: Percentages are based on information provided by public high schools about their students� participation in each activity.
SOURCE: U.S. Department of Education, National Center for Education Statistics, Fast Response Survey System, �Survey on High School Guidance Counseling, 2001,� FRSS 80, 2002.

49
Table 9a. Standard errors of the percent of public high school students who participate in various activities at least once during the time period when they start 11th grade and ending when they leave high school, by selected school characteristics: 2002
School characteristic
School courses in
career decision-
making
Occupational information
units in subject-
matter courses
Exploratory work
experience programs
Career days/nights
Vocationally oriented
assemblies and speakers
in class
All public high schools ........................ 1.3 1.5 0.9 1.5 1.1 Enrollment size
Less than 500....................................... 3.0 3.0 1.8 3.1 2.9 500 to 1,199......................................... 1.9 2.3 1.5 2.5 2.1 1,200 or more ...................................... 2.2 1.9 1.3 2.3 1.6
School locale
City...................................................... 2.7 3.2 1.6 3.1 2.5 Urban fringe ........................................ 2.2 2.4 1.6 2.6 2.5 Town ................................................... 3.8 3.6 2.3 4.0 3.3 Rural.................................................... 3.3 2.8 1.6 2.9 2.3
Percent college bound Less than 50 percent ............................... 4.7 4.3 3.4 5.9 4.5 50 to 74 percent ...................................... 2.3 2.3 1.3 2.4 1.7 75 percent or more.................................. 2.0 2.0 1.3 2.3 1.7
Vocational courses per 100 students
Fewer than 3 courses .............................. 2.3 2.3 1.2 2.6 1.8 3 to 6 courses.......................................... 2.0 2.4 1.4 2.3 1.9 More than 6 courses................................ 2.6 3.2 1.8 3.4 2.2
Region
Northeast ............................................. 3.5 3.7 2.6 3.7 2.9 Southeast ............................................. 2.7 3.0 1.6 3.1 3.3 Central ................................................. 3.2 2.8 1.3 2.3 2.5 West..................................................... 2.7 2.6 1.4 3.3 2.2
Percent minority enrollment
Less than 6 percent .............................. 3.1 3.1 1.5 2.7 2.9 6 to 20 percent ..................................... 2.8 3.3 1.9 3.0 2.5 21 to 49 percent ................................... 2.7 3.7 1.9 3.7 3.6 50 percent or more............................... 3.4 3.0 1.7 3.1 3.0
Access to area/regional vocational school
Has access .............................................. 1.7 1.8 1.0 1.7 1.2 Does not have access .............................. 2.6 2.9 1.6 2.7 2.7
See notes at end of table.
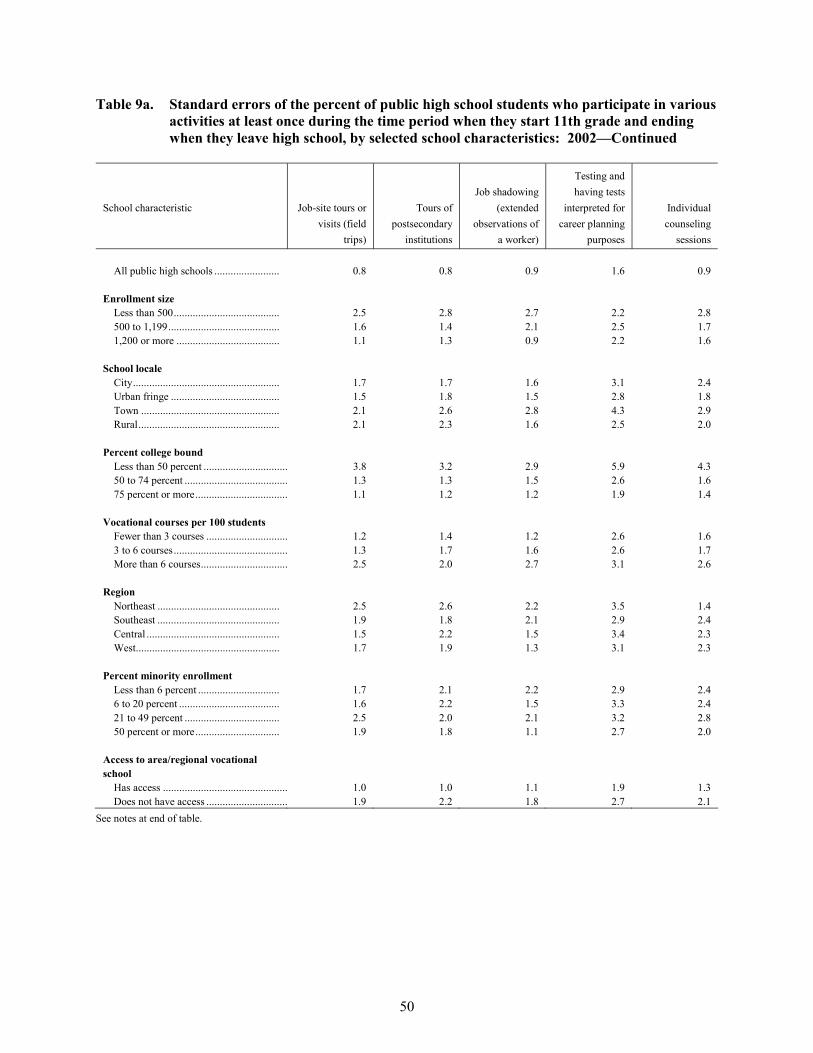
50
Table 9a. Standard errors of the percent of public high school students who participate in various activities at least once during the time period when they start 11th grade and ending when they leave high school, by selected school characteristics: 2002�Continued
School characteristic Job-site tours or visits (field
trips)
Tours of postsecondary
institutions
Job shadowing (extended
observations of a worker)
Testing and having tests
interpreted for career planning
purposes
Individual counseling
sessions
All public high schools ........................ 0.8 0.8 0.9 1.6 0.9 Enrollment size
Less than 500....................................... 2.5 2.8 2.7 2.2 2.8 500 to 1,199......................................... 1.6 1.4 2.1 2.5 1.7 1,200 or more ...................................... 1.1 1.3 0.9 2.2 1.6
School locale
City...................................................... 1.7 1.7 1.6 3.1 2.4 Urban fringe ........................................ 1.5 1.8 1.5 2.8 1.8 Town ................................................... 2.1 2.6 2.8 4.3 2.9 Rural.................................................... 2.1 2.3 1.6 2.5 2.0
Percent college bound Less than 50 percent ............................... 3.8 3.2 2.9 5.9 4.3 50 to 74 percent ...................................... 1.3 1.3 1.5 2.6 1.6 75 percent or more.................................. 1.1 1.2 1.2 1.9 1.4
Vocational courses per 100 students
Fewer than 3 courses .............................. 1.2 1.4 1.2 2.6 1.6 3 to 6 courses.......................................... 1.3 1.7 1.6 2.6 1.7 More than 6 courses................................ 2.5 2.0 2.7 3.1 2.6
Region
Northeast ............................................. 2.5 2.6 2.2 3.5 1.4 Southeast ............................................. 1.9 1.8 2.1 2.9 2.4 Central ................................................. 1.5 2.2 1.5 3.4 2.3 West..................................................... 1.7 1.9 1.3 3.1 2.3
Percent minority enrollment
Less than 6 percent .............................. 1.7 2.1 2.2 2.9 2.4 6 to 20 percent ..................................... 1.6 2.2 1.5 3.3 2.4 21 to 49 percent ................................... 2.5 2.0 2.1 3.2 2.8 50 percent or more............................... 1.9 1.8 1.1 2.7 2.0
Access to area/regional vocational school
Has access .............................................. 1.0 1.0 1.1 1.9 1.3 Does not have access .............................. 1.9 2.2 1.8 2.7 2.1
See notes at end of table.

51
Table 9a. Standard errors of the percent of public high school students who participate in various activities at least once during the time period when they start 11th grade and ending when they leave high school, by selected school characteristics: 2002�Continued
School characteristic Group
guidance/ counseling
sessions
Training in job seeking
skills
Use of noncomputer-
ized career information
sources
Use of computerized
career information
sources
Use of college
catalogs
All public high schools ........................ 1.7 1.4 1.6 1.4 1.0 Enrollment size
Less than 500....................................... 3.1 2.3 2.9 2.1 2.6 500 to 1,199......................................... 2.6 2.6 2.2 2.1 1.6 1,200 or more ...................................... 2.5 2.0 2.2 1.7 1.7
School locale
City...................................................... 4.3 2.9 3.1 3.2 2.6 Urban fringe ........................................ 2.7 2.6 2.6 2.3 2.0 Town ................................................... 4.5 4.1 4.4 3.8 2.8 Rural.................................................... 3.3 2.1 2.4 1.9 1.8
Percent college bound Less than 50 percent ............................... 5.7 5.8 5.1 4.1 3.1 50 to 74 percent ...................................... 2.9 1.8 2.2 2.1 1.5 75 percent or more.................................. 2.1 2.1 2.1 1.9 1.6
Vocational courses per 100 students
Fewer than 3 courses .............................. 2.7 2.5 2.6 2.3 1.3 3 to 6 courses.......................................... 2.6 1.8 2.1 2.4 1.8 More than 6 courses................................ 3.0 2.5 2.9 2.5 1.8
Region
Northeast ............................................. 3.0 3.2 3.1 2.9 2.2 Southeast ............................................. 3.3 2.8 3.4 2.5 2.1 Central ................................................. 3.0 2.3 2.2 2.8 2.0 West..................................................... 3.3 2.8 2.6 2.6 1.9
Percent minority enrollment
Less than 6 percent .............................. 2.9 2.2 2.6 2.4 1.9 6 to 20 percent ..................................... 3.2 2.8 2.7 2.7 2.4 21 to 49 percent ................................... 3.6 3.0 3.3 3.1 2.7 50 percent or more............................... 3.8 3.1 3.0 2.6 2.3
Access to area/regional vocational school
Has access .............................................. 1.8 1.8 1.8 1.5 1.3 Does not have access .............................. 3.2 2.2 2.7 2.5 1.9
SOURCE: U.S. Department of Education, National Center for Education Statistics, Fast Response Survey System, �Survey on High School Guidance Counseling, 2001,� FRSS 80, 2002.

52
Table 10. Percent of public high schools indicating that various activities were available during the 2001�02 school year, and percent reporting that the activity was required of all, some, or no high school students, by selected school characteristics
Regularly scheduled group guidance sessions led by teachers or other school staff was:
Available and required of: School characteristic
Not available Available All high school
students
Some high school
students
No high school
students All public high schools ........................... 37 63 35 20 8
Enrollment size
Less than 500.......................................... 48 52 24 19 9 500 to 1,199............................................ 31 69 43 19 7 1,200 or more ......................................... 26 74 44 22 8
School locale
City......................................................... 30 70 39 22 9 Urban fringe ........................................... 28 72 43 23 7 Town ...................................................... 40 60 28 24 8 Rural....................................................... 43 57 32 16 9
Percent college bound
Less than 50 percent ............................... 49 51 31 15 6 50 to 74 percent ...................................... 37 63 33 21 10 75 percent or more.................................. 34 66 38 20 8
Vocational courses per 100 students
Fewer than 3 courses .............................. 32 68 40 21 7 3 to 6 courses.......................................... 30 70 43 18 9 More than 6 courses................................ 47 53 26 20 8
Region
Northeast ................................................ 28 72 49 18 5 Southeast ................................................ 28 72 48 20 5 Central .................................................... 39 61 29 23 10 West........................................................ 47 53 25 17 11
Percent minority enrollment
Less than 6 percent ................................. 37 63 34 19 10 6 to 20 percent ........................................ 37 63 38 19 6 21 to 49 percent ...................................... 42 58 30 17 12 50 percent or more.................................. 31 69 40 26 3
Access to area/regional vocational school
Has access .............................................. 33 67 38 21 8 Does not have access .............................. 45 55 30 16 9
See notes at end of table.

53
Table 10. Percent of public high schools indicating that various activities were available during the 2001�02 school year, and percent reporting that the activity was required of all, some, or no high school students, by selected school characteristics�Continued
A written career plan was:
Available and required of: School characteristic
Not available Available All high school
students
Some high school
students
No high school
students All public high schools ........................... 36 64 47 15 2
Enrollment size
Less than 500.......................................... 42 58 42 14 2 500 to 1,199............................................ 32 68 55 12 1 1,200 or more ......................................... 29 71 46 22 2
School locale
City......................................................... 33 68 49 17 1 Urban fringe ........................................... 35 65 44 20 2 Town ...................................................... 33 67 49 16 1 Rural....................................................... 38 62 48 12 2
Percent college bound
Less than 50 percent ............................... 48 52 41 11 1 50 to 74 percent ...................................... 31 69 50 18 1 75 percent or more.................................. 36 64 47 14 2
Vocational courses per 100 students
Fewer than 3 courses .............................. 39 61 44 16 1 3 to 6 courses.......................................... 31 69 51 16 2 More than 6 courses................................ 38 62 46 14 2
Region
Northeast ................................................ 53 47 31 15 # Southeast ................................................ 23 77 63 13 1 Central .................................................... 33 67 52 14 1 West........................................................ 39 61 40 18 3
Percent minority enrollment
Less than 6 percent ................................. 34 66 52 12 3 6 to 20 percent ........................................ 35 65 49 15 1 21 to 49 percent ...................................... 41 59 41 17 1 50 percent or more.................................. 35 65 42 21 2
Access to area/regional vocational school
Has access .............................................. 32 68 50 18 1 Does not have access .............................. 44 56 42 10 3
See notes at end of table.

54
Table 10. Percent of public high schools indicating that various activities were available during the 2001�02 school year, and percent reporting that the activity was required of all, some, or no high school students, by selected school characteristics�Continued
A senior project based on the student�s career of interest was:
Available and required of: School characteristic
Not available Available All high
school students
Some high school
students
No high school
students All public high schools ........................... 69 31 14 15 2
Enrollment size
Less than 500.......................................... 70 30 17 13 1 500 to 1,199............................................ 71 29 12 14 3 1,200 or more ......................................... 67 33 11 20 1
School locale
City......................................................... 69 31 9 20 2 Urban fringe ........................................... 66 34 14 16 4 Town ...................................................... 72 28 16 11 1 Rural....................................................... 71 29 15 14 1
Percent college bound
Less than 50 percent ............................... 81 19 9 9 1 50 to 74 percent ...................................... 71 29 15 13 1 75 percent or more.................................. 65 35 15 18 2
Vocational courses per 100 students
Fewer than 3 courses .............................. 71 29 10 18 1 3 to 6 courses.......................................... 66 34 15 17 3 More than 6 courses................................ 71 29 16 11 1
Region
Northeast ................................................ 69 31 15 13 4 Southeast ................................................ 65 35 11 22 2 Central .................................................... 71 29 14 13 2 West........................................................ 72 28 15 13 #
Percent minority enrollment
Less than 6 percent ................................. 70 30 17 12 2 6 to 20 percent ........................................ 67 33 12 18 3 21 to 49 percent ...................................... 69 31 11 18 2 50 percent or more.................................. 71 29 14 15 1
Access to area/regional vocational school
Has access .............................................. 69 31 13 16 2 Does not have access .............................. 70 30 16 13 1
See notes at end of table.

55
Table 10. Percent of public high schools indicating that various activities were available during the 2001�02 school year, and percent reporting that the activity was required of all, some, or no high school students, by selected school characteristics�Continued
Selection of a career major or path to guide student�s selection of courses was:
Available and required of: School characteristic
Not available Available All high school
students
Some high school
students
No high school
students All public high schools ........................... 23 77 50 23 4
Enrollment size
Less than 500.......................................... 25 75 46 25 4 500 to 1,199............................................ 23 77 56 17 4 1,200 or more ......................................... 19 81 50 26 4
School locale
City......................................................... 23 77 49 25 3 Urban fringe ........................................... 23 77 49 23 5 Town ...................................................... 23 77 50 23 3 Rural....................................................... 23 77 51 21 4
Percent college bound
Less than 50 percent ............................... 36 64 41 20 3 50 to 74 percent ...................................... 16 84 60 20 4 75 percent or more.................................. 25 75 46 25 5
Vocational courses per 100 students
Fewer than 3 courses .............................. 28 72 50 20 2 3 to 6 courses.......................................... 19 81 52 23 6 More than 6 courses................................ 23 77 47 25 4
Region
Northeast ................................................ 29 71 42 25 4 Southeast ................................................ 14 86 68 17 2 Central .................................................... 25 75 47 23 4 West........................................................ 24 76 46 25 5
Percent minority enrollment
Less than 6 percent ................................. 23 77 51 22 3 6 to 20 percent ........................................ 25 75 47 22 7 21 to 49 percent ...................................... 25 75 45 25 4 50 percent or more.................................. 19 81 56 23 2
Access to area/regional vocational school
Has access .............................................. 20 80 51 24 4 Does not have access .............................. 29 71 46 20 5
# Estimate is less than 0.5 percent.
NOTE: Detail may not sum to totals because of rounding.
SOURCE: U.S. Department of Education, National Center for Education Statistics, Fast Response Survey System, �Survey on High School Guidance Counseling, 2001,� FRSS 80, 2002.

56
Table 10a. Standard errors of the percent of public high schools indicating that various activities were available during the 2001�02 school year, and percent reporting that the activity was required of all, some, or no high school students, by selected school characteristics
Regularly scheduled group guidance sessions led by teachers or other school staff was:
Available and required of: School characteristic
Not available Available All high school
students
Some high school
students
No high school
students All public high schools ........................... 1.6 1.6 1.6 1.4 1.2
Enrollment size
Less than 500.......................................... 3.1 3.1 2.7 2.8 2.1 500 to 1,199............................................ 2.7 2.7 2.9 2.3 1.6 1,200 or more ......................................... 2.4 2.4 2.8 2.0 1.6
School locale
City......................................................... 4.3 4.3 3.9 3.9 2.2 Urban fringe ........................................... 3.0 3.0 3.6 3.3 1.5 Town ...................................................... 4.8 4.8 4.3 4.0 2.6 Rural....................................................... 2.9 2.9 2.5 2.3 2.2
Percent college bound
Less than 50 percent ............................... 6.2 6.2 5.2 3.6 2.1 50 to 74 percent ...................................... 3.3 3.3 3.0 2.7 2.1 75 percent or more.................................. 2.4 2.4 2.4 2.1 1.5
Vocational courses per 100 students
Fewer than 3 courses .............................. 2.8 2.8 2.6 2.5 1.6 3 to 6 courses.......................................... 2.6 2.6 2.8 2.2 2.1 More than 6 courses................................ 3.5 3.5 2.9 2.6 1.9
Region
Northeast ................................................ 3.8 3.8 4.8 3.5 1.9 Southeast ................................................ 3.6 3.6 3.7 3.3 1.3 Central .................................................... 3.8 3.8 3.2 3.1 1.9 West........................................................ 3.3 3.3 2.8 2.3 2.6
Percent minority enrollment
Less than 6 percent ................................. 3.1 3.1 2.8 2.5 1.8 6 to 20 percent ........................................ 3.4 3.4 3.9 3.3 1.6 21 to 49 percent ...................................... 4.6 4.6 4.1 2.9 3.6 50 percent or more.................................. 4.1 4.1 3.6 3.2 1.0
Access to area/regional vocational school
Has access .............................................. 1.5 1.5 1.6 1.7 1.2 Does not have access .............................. 3.2 3.2 3.3 2.4 2.2
See notes at end of table.

57
Table 10a. Standard errors of the percent of public high schools indicating that various activities were available during the 2001�02 school year, and percent reporting that the activity was required of all, some, or no high school students, by selected school characteristics�Continued
A written career plan was:
Available and required of: School characteristic
Not available Available All high school
students
Some high school
students
No high school
students All public high schools ........................... 2.0 2.0 1.8 1.5 0.6
Enrollment size
Less than 500.......................................... 3.3 3.3 3.1 2.5 1.0 500 to 1,199............................................ 2.7 2.7 2.8 2.2 0.5 1,200 or more ......................................... 2.5 2.5 2.8 2.5 0.9
School locale
City......................................................... 4.1 4.1 3.9 3.3 0.7 Urban fringe ........................................... 3.2 3.2 3.1 2.4 1.1 Town ...................................................... 3.2 3.2 4.2 3.4 1.0 Rural....................................................... 3.4 3.4 3.0 2.7 0.9
Percent college bound
Less than 50 percent ............................... 6.2 6.2 6.0 3.3 0.9 50 to 74 percent ...................................... 3.0 3.0 3.0 2.9 0.6 75 percent or more.................................. 2.2 2.2 2.0 1.9 1.0
Vocational courses per 100 students
Fewer than 3 courses .............................. 3.4 3.4 3.2 2.4 0.7 3 to 6 courses.......................................... 3.3 3.3 3.5 1.9 1.0 More than 6 courses................................ 3.0 3.0 3.2 2.7 0.9
Region
Northeast ................................................ 4.3 4.3 3.9 3.3 � Southeast ................................................ 3.3 3.3 3.5 2.3 0.8 Central .................................................... 3.4 3.4 3.0 2.7 1.2 West........................................................ 3.6 3.6 3.5 2.7 1.3
Percent minority enrollment
Less than 6 percent ................................. 3.1 3.1 3.2 2.9 1.3 6 to 20 percent ........................................ 3.7 3.7 3.5 2.5 0.4 21 to 49 percent ...................................... 4.6 4.6 4.2 3.1 0.9 50 percent or more.................................. 3.8 3.8 3.3 3.0 0.9
Access to area/regional vocational school
Has access .............................................. 2.2 2.2 2.2 1.8 0.5 Does not have access .............................. 4.2 4.2 3.7 1.9 1.3
See notes at end of table.

58
Table 10a. Standard errors of the percent of public high schools indicating that various activities were available during the 2001�02 school year, and percent reporting that the activity was required of all, some, or no high school students, by selected school characteristics�Continued
A senior project based on the student�s career of interest was:
Available and required of: School characteristic
Not available Available All high school
students
Some high school
students
No high school
students All public high schools ........................... 1.9 1.9 1.3 1.4 0.4
Enrollment size
Less than 500.......................................... 3.2 3.2 2.2 2.5 0.4 500 to 1,199............................................ 2.6 2.6 1.9 2.4 1.1 1,200 or more ......................................... 3.0 3.0 1.9 2.3 0.6
School locale
City......................................................... 4.0 4.0 2.1 3.4 1.0 Urban fringe ........................................... 2.7 2.7 2.2 2.5 1.2 Town ...................................................... 3.6 3.6 3.2 3.0 0.6 Rural....................................................... 2.9 2.9 2.1 2.2 0.4
Percent college bound
Less than 50 percent ............................... 3.9 3.9 3.1 2.5 0.8 50 to 74 percent ...................................... 2.4 2.4 2.0 2.0 0.5 75 percent or more.................................. 2.9 2.9 2.1 1.9 0.6
Vocational courses per 100 students
Fewer than 3 courses .............................. 3.2 3.2 1.8 2.4 0.6 3 to 6 courses.......................................... 2.8 2.8 2.2 2.4 0.8 More than 6 courses................................ 3.5 3.5 2.4 2.2 0.6
Region
Northeast ................................................ 4.0 4.0 2.9 3.3 1.5 Southeast ................................................ 3.0 3.0 1.9 2.8 0.8 Central .................................................... 3.4 3.4 2.4 2.3 0.7 West........................................................ 2.7 2.7 2.3 2.7 �
Percent minority enrollment
Less than 6 percent ................................. 3.4 3.4 2.5 2.3 0.6 6 to 20 percent ........................................ 3.9 3.9 2.8 3.2 1.1 21 to 49 percent ...................................... 3.6 3.6 2.7 3.5 0.9 50 percent or more.................................. 2.9 2.9 2.8 2.2 0.4
Access to area/regional vocational school
Has access .............................................. 2.3 2.3 1.6 1.5 0.6 Does not have access .............................. 3.2 3.2 2.4 2.4 0.4
See notes at end of table.
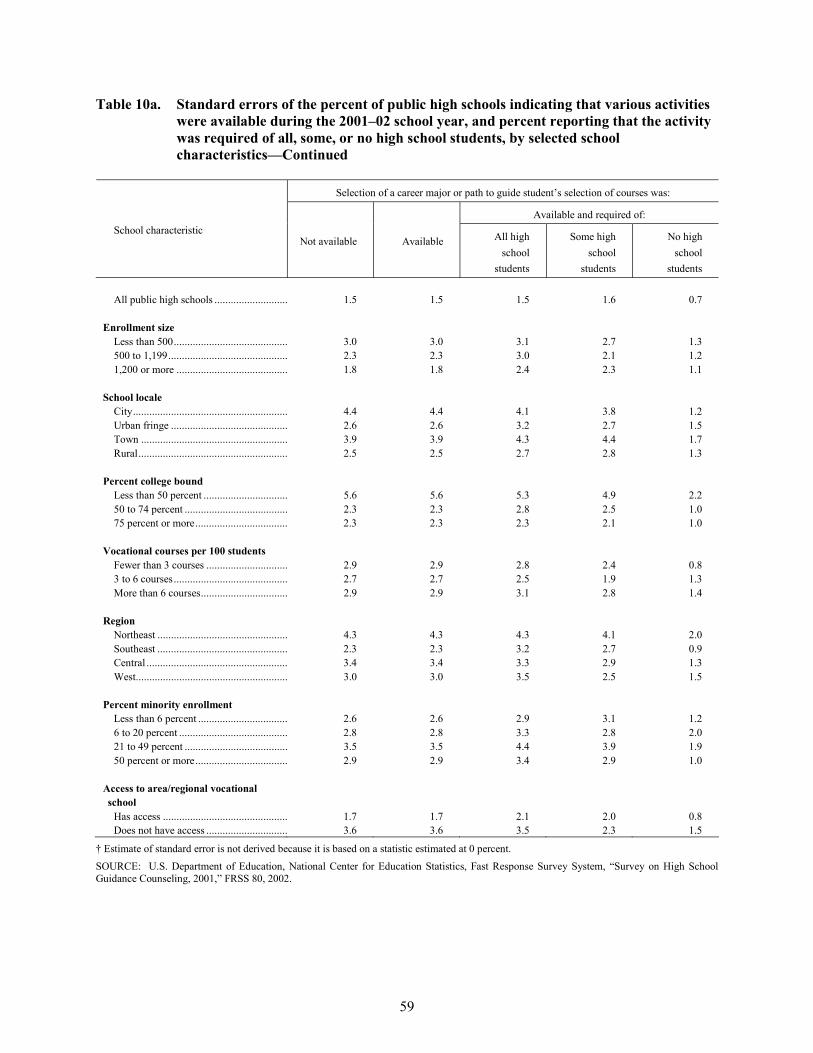
59
Table 10a. Standard errors of the percent of public high schools indicating that various activities were available during the 2001�02 school year, and percent reporting that the activity was required of all, some, or no high school students, by selected school characteristics�Continued
Selection of a career major or path to guide student�s selection of courses was:
Available and required of: School characteristic
Not available Available All high school
students
Some high school
students
No high school
students All public high schools ........................... 1.5 1.5 1.5 1.6 0.7
Enrollment size
Less than 500.......................................... 3.0 3.0 3.1 2.7 1.3 500 to 1,199............................................ 2.3 2.3 3.0 2.1 1.2 1,200 or more ......................................... 1.8 1.8 2.4 2.3 1.1
School locale
City......................................................... 4.4 4.4 4.1 3.8 1.2 Urban fringe ........................................... 2.6 2.6 3.2 2.7 1.5 Town ...................................................... 3.9 3.9 4.3 4.4 1.7 Rural....................................................... 2.5 2.5 2.7 2.8 1.3
Percent college bound
Less than 50 percent ............................... 5.6 5.6 5.3 4.9 2.2 50 to 74 percent ...................................... 2.3 2.3 2.8 2.5 1.0 75 percent or more.................................. 2.3 2.3 2.3 2.1 1.0
Vocational courses per 100 students
Fewer than 3 courses .............................. 2.9 2.9 2.8 2.4 0.8 3 to 6 courses.......................................... 2.7 2.7 2.5 1.9 1.3 More than 6 courses................................ 2.9 2.9 3.1 2.8 1.4
Region
Northeast ................................................ 4.3 4.3 4.3 4.1 2.0 Southeast ................................................ 2.3 2.3 3.2 2.7 0.9 Central .................................................... 3.4 3.4 3.3 2.9 1.3 West........................................................ 3.0 3.0 3.5 2.5 1.5
Percent minority enrollment
Less than 6 percent ................................. 2.6 2.6 2.9 3.1 1.2 6 to 20 percent ........................................ 2.8 2.8 3.3 2.8 2.0 21 to 49 percent ...................................... 3.5 3.5 4.4 3.9 1.9 50 percent or more.................................. 2.9 2.9 3.4 2.9 1.0
Access to area/regional vocational school
Has access .............................................. 1.7 1.7 2.1 2.0 0.8 Does not have access .............................. 3.6 3.6 3.5 2.3 1.5
� Estimate of standard error is not derived because it is based on a statistic estimated at 0 percent.
SOURCE: U.S. Department of Education, National Center for Education Statistics, Fast Response Survey System, �Survey on High School Guidance Counseling, 2001,� FRSS 80, 2002.

60
Table 11. Percent of public high schools reporting that written career plans and the selection of career major or paths were both available to high school students, and of those schools, percent indicating that both activities were required of all students, by selected school characteristics: School year 2001�02
School characteristic Both activities were available
Of schools with both activities available, percent requiring both
activities of all students All public high schools ................................................................. 57 58
Enrollment size ...............................................................................
Less than 500................................................................................ 52 57 500 to 1,199.................................................................................. 59 67 1,200 or more ............................................................................... 62 49
School locale
City............................................................................................... 59 50 Urban fringe ................................................................................. 57 53 Town ............................................................................................ 57 59 Rural............................................................................................. 56 63
Percent college bound
Less than 50 percent ..................................................................... 45 61 50 to 74 percent ............................................................................ 64 62 75 percent or more........................................................................ 54 54
Vocational courses per 100 students
Fewer than 3 courses .................................................................... 51 59 3 to 6 courses................................................................................ 63 60 More than 6 courses...................................................................... 55 54
Region
Northeast ...................................................................................... 36 47 Southeast ...................................................................................... 71 70 Central .......................................................................................... 60 57 West.............................................................................................. 53 51
Percent minority enrollment
Less than 6 percent ....................................................................... 59 63 6 to 20 percent .............................................................................. 56 58 21 to 49 percent ............................................................................ 50 54 50 percent or more........................................................................ 59 50
Access to area/regional vocational school
Has access .................................................................................... 61 55 Does not have access .................................................................... 47 64
SOURCE: U.S. Department of Education, National Center for Education Statistics, Fast Response Survey System, �Survey on High School Guidance Counseling, 2001,� FRSS 80, 2002.

61
Table 11a. Standard errors of the percent of public high schools reporting that written career plans and the selection of career major or paths were both available to high school students, and of those schools, the standard errors of the percent indicating that both activities were required of all students, by selected school characteristics: School year 2001�02
School characteristic Both activities were available
Of schools with both activities available, percent requiring both
activities of all students All public high schools ................................................................. 1.9 2.3
Enrollment size ...............................................................................
Less than 500................................................................................ 3.7 4.6 500 to 1,199.................................................................................. 2.7 4.0 1,200 or more ............................................................................... 2.5 3.5
School locale
City............................................................................................... 4.4 5.1 Urban fringe ................................................................................. 2.9 4.7 Town ............................................................................................ 3.5 6.3 Rural............................................................................................. 3.3 4.5
Percent college bound
Less than 50 percent ..................................................................... 6.0 6.5 50 to 74 percent ............................................................................ 3.2 4.0 75 percent or more........................................................................ 2.4 3.3
Vocational courses per 100 students
Fewer than 3 courses .................................................................... 3.4 3.6 3 to 6 courses................................................................................ 3.2 3.2 More than 6 courses...................................................................... 3.3 4.8
Region
Northeast ...................................................................................... 4.3 7.0 Southeast ...................................................................................... 3.1 3.8 Central .......................................................................................... 3.8 4.2 West.............................................................................................. 3.2 5.3
Percent minority enrollment
Less than 6 percent ....................................................................... 3.1 4.5 6 to 20 percent .............................................................................. 3.8 4.8 21 to 49 percent ............................................................................ 4.3 6.7 50 percent or more........................................................................ 3.9 4.5
Access to area/regional vocational school
Has access .................................................................................... 2.0 2.7 Does not have access .................................................................... 4.4 4.2
SOURCE: U.S. Department of Education, National Center for Education Statistics, Fast Response Survey System, �Survey on High School Guidance Counseling, 2001,� FRSS 80, 2002.

62
Table 12. Number of guidance staff and counselors, and the number of students per guidance staff and per counselor assigned to public high school students, by selected school characteristics: 2002
School characteristic Total number of guidance staff 1
Total number of counselors
Number of students per
guidance staff 1
Number of students per
counselor
All public high schools ............................................. 49,477 43,401 249 284 School size
Less than 500............................................................ 8,988 7,972 150 171 500 to 1,199.............................................................. 15,707 13,764 237 270 1,200 or more ........................................................... 24,781 21,665 293 335
School locale
City........................................................................... 11,927 10,242 273 318 Urban fringe ............................................................. 18,271 16,208 269 303 Town ........................................................................ 5,806 5,032 261 300 Rural......................................................................... 13,472 11,919 196 221
Percent college bound
Less than 50 percent ................................................. 4,737 3,953 221 265 50 to 74 percent ........................................................ 17,117 14,983 259 296 75 percent or more.................................................... 27,280 24,181 247 279
Vocational courses per 100 students
Fewer than 3 courses ................................................ 20,469 18,009 282 321 3 to 6 courses............................................................ 17,560 15,400 254 288 More than 6 courses.................................................. 10,537 9,154 176 204
Region
Northeast .................................................................. 10,987 10,099 208 227 Southeast .................................................................. 10,410 9,141 289 328 Central ...................................................................... 12,949 11,516 237 266 West.......................................................................... 15,131 12,646 262 315
Percent minority enrollment
Less than 6 percent ................................................... 12,333 11,393 237 256 6 to 20 percent .......................................................... 13,599 11,660 228 266 21 to 49 percent ........................................................ 9,972 8,545 264 309 50 percent or more.................................................... 13,087 11,391 272 313
Access to area/regional vocational school
Has access ................................................................ 34,744 30,549 254 289 Does not have access ................................................ 13,977 12,169 235 271
1Guidance staff includes guidance counselors and paraprofessionals.
NOTE: Detail may not sum to totals because of missing data.
SOURCE: U.S. Department of Education, National Center for Education Statistics, Fast Response Survey System, �Survey on High School Guidance Counseling, 2001,� FRSS 80, 2002.

63
Table 12a. Standard errors of the number of guidance staff and counselors, and the number of students per guidance staff and per counselor assigned to public high school students, by selected school characteristics: 2002
School characteristic Total number of guidance staff
Total number of counselors
Number of students per
guidance staff
Number of students per
counselor
All public high schools ............................................. 713 756 3.5 3.8 School size
Less than 500............................................................ 396 336 6.3 6.9 500 to 1,199.............................................................. 569 517 4.8 5.6 1,200 or more ........................................................... 593 592 5.2 5.9
School locale
City........................................................................... 702 595 7.4 7.7 Urban fringe ............................................................. 803 691 6.5 6.7 Town ........................................................................ 459 399 9.4 8.6 Rural......................................................................... 860 756 6.3 7.0
Percent college bound
Less than 50 percent ................................................. 604 503 15.4 16.2 50 to 74 percent ........................................................ 726 651 6.4 7.3 75 percent or more.................................................... 888 809 5.3 5.2
Vocational courses per 100 students
Fewer than 3 courses ................................................ 1,082 989 5.7 7.7 3 to 6 courses............................................................ 950 881 5.5 6.3 More than 6 courses.................................................. 745 629 7.2 7.6
Region
Northeast .................................................................. 724 683 5.1 4.8 Southeast .................................................................. 681 566 7.6 7.0 Central ...................................................................... 630 600 6.5 5.8 West.......................................................................... 751 627 7.6 10.9
Percent minority enrollment
Less than 6 percent ................................................... 642 571 6.4 6.1 6 to 20 percent .......................................................... 885 767 7.9 8.7 21 to 49 percent ........................................................ 691 580 7.0 8.3 50 percent or more.................................................... 786 661 6.8 8.6
Access to area/regional vocational school
Has access ................................................................ 839 785 4.1 4.1 Does not have access ................................................ 830 740 7.4 8.7
SOURCE: U.S. Department of Education, National Center for Education Statistics, Fast Response Survey System, �Survey on High School Guidance Counseling, 2001,� FRSS 80, 2002.

64
Table 13. Percent of guidance counselors assigned to public high school students, and percent of certified counselors, by employment status and selected school characteristics: 2002
Percent assigned Percent certified1
School characteristic
Full time Part time All
counselors Full time Part time All public high schools .................................................. 90 10 94 96 79
Enrollment size
Less than 500................................................................. 69 31 85 90 75 500 to 1,199................................................................... 93 7 97 97 88 1,200 or more ................................................................ 96 4 96 97 82
School locale
City................................................................................ 96 4 94 95 67 Urban fringe .................................................................. 95 5 97 97 82 Town ............................................................................. 92 8 96 97 83 Rural.............................................................................. 78 22 90 94 79
Percent college bound Less than 50 percent ...................................................... 84 16 90 95 61 50 to 74 percent ............................................................. 90 10 93 95 76 75 percent or more......................................................... 91 9 96 97 86
Vocational courses per 100 students
Fewer than 3 courses ..................................................... 95 5 95 96 79 3 to 6 courses................................................................. 91 9 95 96 81 More than 6 courses....................................................... 78 22 91 95 77
Region
Northeast ....................................................................... 95 5 97 98 84 Southeast ....................................................................... 93 7 94 96 78 Central ........................................................................... 88 12 95 96 86 West............................................................................... 86 14 91 94 72
Percent minority enrollment
Less than 6 percent ........................................................ 86 14 94 95 87 6 to 20 percent ............................................................... 92 8 94 97 69 21 to 49 percent ............................................................. 91 9 95 96 81 50 percent or more......................................................... 93 7 94 95 76
Access to area/regional vocational school
Has access ..................................................................... 93 7 96 97 82 Does not have access ..................................................... 84 16 91 94 74
1Estimates are based on the number of guidance counselors in each employment status category.
SOURCE: U.S. Department of Education, National Center for Education Statistics, Fast Response Survey System, �Survey on High School Guidance Counseling, 2001,� FRSS 80, 2002.

65
Table 13a. Standard errors of the percent of guidance counselors assigned to public high school students, and percent of certified counselors, by employment status and selected school characteristics: 2002
Percent assigned Percent certified
School characteristic
Full time Part time All
counselors Full time Part time All public high schools ................................................... 0.8 0.8 0.6 0.4 4.0
Enrollment size
Less than 500.................................................................. 3.4 3.4 2.8 2.2 7.1 500 to 1,199.................................................................... 1.0 1.0 0.7 0.7 4.2 1,200 or more ................................................................. 0.4 0.4 0.7 0.6 5.5
School locale
City................................................................................. 0.9 0.9 1.2 1.1 8.6 Urban fringe ................................................................... 0.8 0.8 0.7 0.6 6.1 Town .............................................................................. 1.6 1.6 1.4 1.4 8.1 Rural............................................................................... 2.5 2.5 2.0 1.4 6.7
Percent college bound Less than 50 percent ....................................................... 3.7 3.7 2.4 1.8 10.7 50 to 74 percent .............................................................. 1.8 1.8 1.4 0.9 10.1 75 percent or more.......................................................... 0.9 0.9 0.7 0.6 4.6
Vocational courses per 100 students
Fewer than 3 courses ...................................................... 0.7 0.7 0.7 0.7 5.9 3 to 6 courses.................................................................. 0.8 0.8 0.9 0.8 5.2 More than 6 courses........................................................ 2.9 2.9 2.1 1.6 8.2
Region
Northeast ........................................................................ 0.9 0.9 0.7 0.7 6.7 Southeast ........................................................................ 1.0 1.0 1.4 1.2 7.8 Central ............................................................................ 1.6 1.6 1.2 1.0 6.5 West................................................................................ 2.2 2.2 1.7 1.1 8.4
Percent minority enrollment
Less than 6 percent ......................................................... 1.8 1.8 1.3 1.2 5.9 6 to 20 percent ................................................................ 1.9 1.9 1.6 0.9 15.2 21 to 49 percent .............................................................. 1.5 1.5 1.0 1.0 6.3 50 percent or more.......................................................... 1.1 1.1 1.3 1.1 7.4
Access to area/regional vocational school
Has access ...................................................................... 0.8 0.8 0.5 0.5 4.2 Does not have access ...................................................... 2.2 2.2 1.8 1.2 8.3
SOURCE: U.S. Department of Education, National Center for Education Statistics, Fast Response Survey System, �Survey on High School Guidance Counseling, 2001,� FRSS 80, 2002.

66
Table 14. Percentage distribution of public high schools indicating the percent of time that all of the school�s guidance staff spent delivering selected guidance services to high school students: 2002
Percent of time
Service
5 or less 6 to 10 11 to 20 More than
20 Choice and scheduling of high school courses.............................................. 7 14 30 49 Postsecondary education admissions and selections ..................................... 4 15 38 43 Occupational choice and career planning...................................................... 10 33 40 17 Job placement and employability skill development..................................... 54 30 14 2 Students� attendance, discipline, and other school and personal problems ... 15 19 33 33 Academic testing .......................................................................................... 23 29 30 19 Other guidance activities .............................................................................. 56 14 18 13 Non-guidance activities (hall/lunch duty, substitute teaching, bus duty,
etc.) .......................................................................................................... 73 15 7 5
NOTE: Detail may not sum to totals because of rounding.
SOURCE: U.S. Department of Education, National Center for Education Statistics, Fast Response Survey System, �Survey on High School Guidance Counseling, 2001,� FRSS 80, 2002.

67
Table 14a. Standard errors of the percentage distribution of public high schools indicating the percent of time that all of the school�s guidance staff spent delivering selected guidance services to high school students: 2002
Percent of time
Service
5 or less 6 to 10 11 to 20 More than
20 Choice and scheduling of high school courses.............................................. 1.0 1.3 1.8 1.8 Postsecondary education admissions and selections ..................................... 0.6 1.4 1.5 1.7 Occupational choice and career planning...................................................... 1.0 1.7 2.1 1.6 Job placement and employability skill development..................................... 1.9 1.5 1.6 0.5 Students� attendance, discipline, and other school and personal problems ... 1.4 1.8 1.4 1.9 Academic testing .......................................................................................... 1.3 1.8 1.8 1.7 Other guidance activities .............................................................................. 1.7 1.3 1.5 1.2 Non-guidance activities (hall/lunch duty, substitute teaching, bus duty,
etc.) .......................................................................................................... 1.8 1.5 1.0 0.9
SOURCE: U.S. Department of Education, National Center for Education Statistics, Fast Response Survey System, �Survey on High School Guidance Counseling, 2001,� FRSS 80, 2002.

68
Table 15. Percentage distribution of public high schools indicating the percent of time that all of the school�s guidance staff spent delivering selected guidance services to high school students, by selected school characteristics: 2002
Choice and scheduling of high school courses Postsecondary education admissions
and selections
Percent of time Percent of time School characteristic
5 or less 6 to 10
11 to 20
More than 20
5 or less 6 to 10
11 to 20
More than 20
All public high schools ............. 7 14 30 49 4 15 38 43
Enrollment size`
Less than 500............................ 13 22 30 34 4 19 39 38 500 to 1,199.............................. 3 9 31 57 3 11 38 48 1,200 or more ........................... 2 6 27 65 3 13 38 46
School locale
City........................................... 7 8 26 60 5 14 31 50 Urban fringe ............................. 1 6 31 62 2 10 38 50 Town ........................................ 4 14 21 61 2 17 41 40 Rural......................................... 12 20 33 35 4 17 40 38
Percent college bound Less than 50 percent ................. 11 15 26 49 12 20 36 31 50 to 74 percent ........................ 5 12 37 46 3 19 43 35 75 percent or more.................... 8 16 25 51 2 11 36 52
Vocational courses per 100
students Fewer than 3 courses ................ 5 12 21 62 2 11 37 50 3 to 6 courses............................ 4 11 31 54 5 14 36 45 More than 6 courses.................. 12 18 35 34 4 18 41 37
Region
Northeast .................................. 4 12 32 52 1 5 25 68 Southeast .................................. 3 11 30 56 6 13 39 42 Central ...................................... 10 19 32 39 2 15 47 36 West.......................................... 10 13 24 53 5 22 35 38
Percent minority enrollment
Less than 6 percent ................... 9 19 32 41 3 16 41 41 6 to 20 percent .......................... 6 13 34 48 3 13 40 44 21 to 49 percent ........................ 7 12 26 55 4 19 29 48 50 percent or more.................... 8 8 24 60 5 13 38 44
Access to area/regional
vocational school Has access ................................ 5 12 31 51 4 14 38 44 Does not have access ................ 12 18 26 44 4 17 39 41
See notes at end of table.

69
Table 15. Percentage distribution of public high schools indicating the percent of time that all of the school�s guidance staff spent delivering selected guidance services to high school students, by selected school characteristics: 2002�Continued
Occupational choice and career planning Job placement and employability skill
development
Percent of time Percent of time School characteristic
5 or less 6 to 10
11 to 20
More than 20
5 or less 6 to 10
11 to 20
More than 20
All public high schools ............. 10 33 40 17 54 30 14 2
Enrollment size
Less than 500............................ 8 31 40 22 45 35 18 2 500 to 1,199.............................. 10 38 40 11 64 23 11 1 1,200 or more ........................... 15 31 39 16 57 30 10 3
School locale
City........................................... 13 32 36 19 55 27 14 5 Urban fringe ............................. 12 35 39 15 57 31 10 2 Town ........................................ 8 39 37 16 57 28 14 1 Rural......................................... 9 30 43 18 51 32 15 1
Percent college bound Less than 50 percent ................. 15 34 34 17 51 32 16 # 50 to 74 percent ........................ 9 34 44 13 50 32 15 3 75 percent or more.................... 10 32 38 20 58 28 12 2
Vocational courses per 100
students Fewer than 3 courses ................ 13 32 43 13 58 29 11 2 3 to 6 courses............................ 10 34 39 17 57 31 9 3 More than 6 courses.................. 8 33 39 20 48 31 20 #
Region
Northeast .................................. 10 34 38 18 62 24 11 3 Southeast .................................. 11 30 47 11 51 28 16 5 Central ...................................... 7 38 37 18 56 33 11 # West.......................................... 13 29 39 19 49 32 17 2
Percent minority enrollment
Less than 6 percent ................... 8 36 38 18 56 29 13 1 6 to 20 percent .......................... 9 35 41 15 56 34 10 1 21 to 49 percent ........................ 19 29 33 19 53 30 15 2 50 percent or more.................... 9 28 47 16 46 30 20 4
Access to area/regional
vocational school Has access ................................ 11 34 38 17 56 29 13 2 Does not have access ................ 8 31 45 17 50 33 15 2
See notes at end of table.

70
Table 15. Percentage distribution of public high schools indicating the percent of time that all of the school�s guidance staff spent delivering selected guidance services to high school students, by selected school characteristics: 2002�Continued
Students� attendance, discipline, and other school
and personal problems Academic testing
Percent of time Percent of time School characteristic
5 or less 6 to 10
11 to 20
More than 20
5 or less 6 to 10
11 to 20
More than 20
All public high schools ............. 15 19 33 33 23 29 30 19
Enrollment size
Less than 500............................ 21 19 32 29 15 32 32 21 500 to 1,199.............................. 12 21 32 35 26 25 30 18 1,200 or more ........................... 8 15 37 39 32 28 26 14
School locale
City........................................... 10 11 43 36 29 30 23 18 Urban fringe ............................. 10 21 36 34 33 23 30 14 Town ........................................ 19 21 23 37 19 26 30 25 Rural......................................... 18 19 32 31 17 32 32 19
Percent college bound Less than 50 percent ................. 22 17 34 26 28 35 23 15 50 to 74 percent ........................ 14 17 33 36 17 26 34 23 75 percent or more.................... 13 21 33 33 26 29 29 17
Vocational courses per 100
students Fewer than 3 courses ................ 11 17 38 34 29 27 27 16 3 to 6 courses............................ 11 20 32 37 25 24 31 20 More than 6 courses.................. 22 18 31 29 16 35 31 18
Region
Northeast .................................. 5 17 36 42 45 24 26 6 Southeast .................................. 10 18 37 34 15 22 33 30 Central ...................................... 19 24 33 24 19 35 30 16 West.......................................... 19 14 29 38 20 30 30 20
Percent minority enrollment
Less than 6 percent ................... 16 22 32 30 22 31 30 17 6 to 20 percent .......................... 16 18 31 35 26 32 26 15 21 to 49 percent ........................ 15 19 35 31 21 24 34 21 50 percent or more.................... 11 12 36 41 22 25 30 23
Access to area/regional
vocational school Has access ................................ 15 20 33 32 26 29 28 17 Does not have access ................ 15 15 34 36 17 30 32 21
See notes at end of table.

71
Table 15. Percentage distribution of public high schools indicating the percent of time that all of the school�s guidance staff spent delivering selected guidance services to high school students, by selected school characteristics: 2002�Continued
Other guidance activities Non-guidance activities
(hall/lunch duty, substitute teaching, bus duty, etc.)
Percent of time Percent of time School characteristic
5 or less 6 to 10
11 to 20
More than 20
5 or less 6 to 10
11 to 20
More than 20
All public high schools ............. 56 14 18 13 73 15 7 5
Enrollment size
Less than 500............................ 57 13 16 12 61 20 10 9 500 to 1,199.............................. 55 15 17 13 82 12 5 1 1,200 or more ........................... 54 14 18 13 79 13 6 2
School locale
City........................................... 57 12 17 15 75 13 7 4 Urban fringe ............................. 56 14 18 12 79 13 7 2 Town ........................................ 56 13 19 12 77 12 8 3 Rural......................................... 55 15 18 13 67 18 7 7
Percent college bound
Less than 50 percent ................. 65 9 15 10 67 16 6 11 50 to 74 percent ........................ 57 12 18 13 73 16 8 4 75 percent or more.................... 53 16 19 13 74 15 7 4
Vocational courses per 100
students Fewer than 3 courses ................ 56 14 18 12 74 16 6 4 3 to 6 courses............................ 55 15 17 13 78 15 6 2 More than 6 courses.................. 56 13 19 12 67 15 9 8
Region
Northeast .................................. 48 17 21 14 82 12 5 1 Southeast .................................. 59 11 18 13 80 11 5 4 Central ...................................... 49 19 20 13 67 20 9 4 West.......................................... 65 9 14 12 68 16 9 8
Percent minority enrollment
Less than 6 percent ................... 49 16 21 14 70 17 8 4 6 to 20 percent .......................... 58 12 18 12 78 14 4 4 21 to 49 percent ........................ 72 10 8 10 72 16 6 6 50 percent or more.................... 49 16 21 14 71 13 12 4
Access to area/regional
vocational school Has access ................................ 54 14 20 13 75 14 6 4 Does not have access ................ 60 14 14 11 67 18 10 5
# Estimate is less than 0.5 percent. NOTE: Detail may not sum to totals because of rounding. SOURCE: U.S. Department of Education, National Center for Education Statistics, Fast Response Survey System, �Survey on High School Guidance Counseling, 2001,� FRSS 80, 2002.

72
Table 15a. Standard errors of the percentage distribution of public high schools indicating the percent of time that all of the school�s guidance staff spent delivering selected guidance services to high school students, by selected school characteristics: 2002
Choice and scheduling of high school courses Postsecondary education admissions
and selections
Percent of time Percent of time School characteristic
5 or less 6 to 10
11 to 20
More than 20
5 or less 6 to 10
11 to 20
More than 20
All public high schools ............. 1.0 1.3 1.8 1.8 0.6 1.4 1.5 1.7
Enrollment size
Less than 500............................ 2.4 2.8 3.2 3.4 1.2 2.9 3.2 3.0 500 to 1,199.............................. 1.0 1.7 1.9 2.2 0.9 1.7 2.9 2.9 1,200 or more ........................... 0.8 1.3 2.2 2.8 0.9 1.8 2.5 2.6
School locale
City........................................... 2.4 2.4 3.3 3.6 1.5 3.4 3.5 4.2 Urban fringe ............................. 0.7 1.7 3.3 3.4 1.2 1.8 3.8 3.9 Town ........................................ 2.0 3.2 3.5 4.9 1.5 3.2 4.1 4.1 Rural......................................... 2.1 2.5 2.9 2.7 1.1 2.3 2.7 2.4
Percent college bound Less than 50 percent ................. 3.8 5.1 4.8 5.0 4.2 5.3 5.6 5.0 50 to 74 percent ........................ 1.4 2.2 2.7 2.2 0.8 2.2 2.6 2.9 75 percent or more.................... 1.5 2.2 2.6 3.1 0.5 1.7 2.5 2.7
Vocational courses per 100
students Fewer than 3 courses ................ 1.5 1.9 2.2 3.0 0.7 1.8 2.6 2.8 3 to 6 courses............................ 1.2 2.1 2.3 3.0 1.1 2.2 2.9 3.1 More than 6 courses.................. 2.5 2.4 3.1 2.7 1.2 2.6 3.3 3.0
Region
Northeast .................................. 1.7 3.0 4.5 4.0 0.8 2.0 4.0 4.4 Southeast .................................. 1.4 2.6 3.9 3.6 1.9 2.7 3.3 3.5 Central ...................................... 2.0 2.8 3.4 3.0 0.7 2.6 3.1 3.0 West.......................................... 2.6 2.4 2.8 3.3 1.5 2.9 3.4 3.7
Percent minority enrollment
Less than 6 percent ................... 2.0 2.9 3.4 3.2 1.0 2.4 3.0 3.1 6 to 20 percent .......................... 1.8 2.5 4.1 3.9 1.4 2.6 3.3 3.4 21 to 49 percent ........................ 2.5 2.7 4.0 4.1 1.9 3.5 3.9 3.9 50 percent or more.................... 2.3 1.9 3.5 3.7 1.3 2.5 3.7 4.1
Access to area/regional
vocational school Has access ................................ 1.0 1.4 2.0 2.0 0.7 1.6 2.0 1.9 Does not have access ................ 2.5 2.9 3.2 3.3 1.3 2.9 3.5 3.1
See notes at end of table.
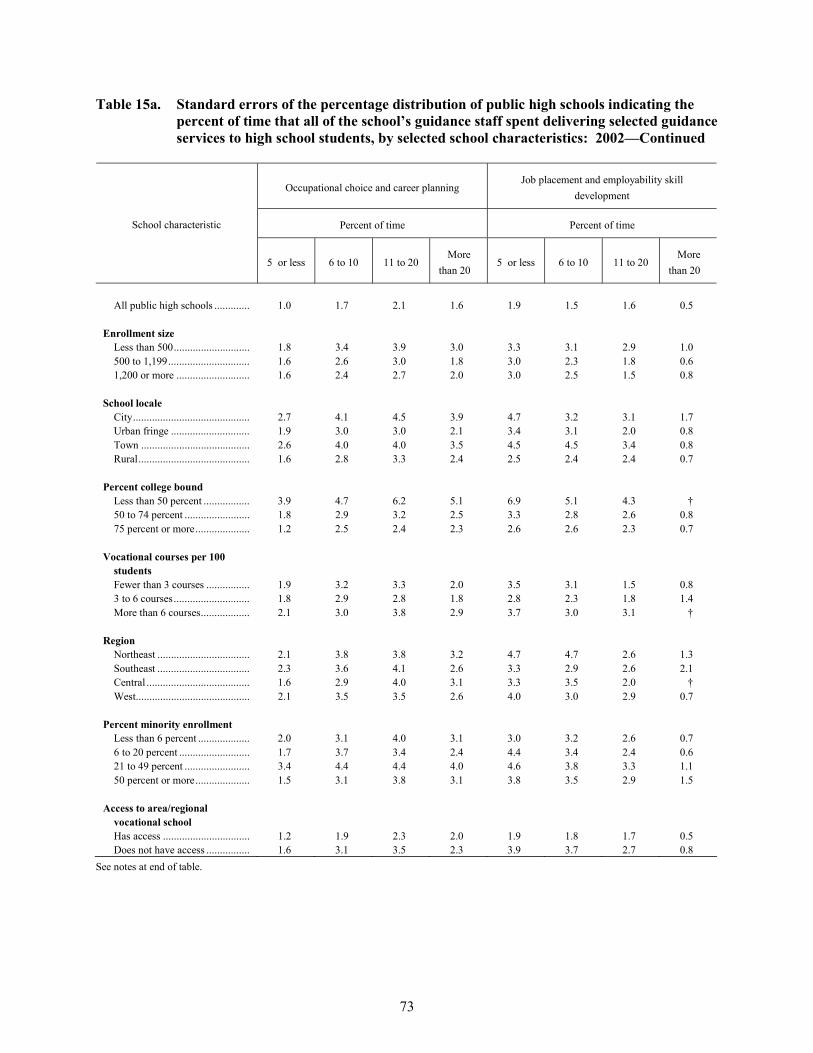
73
Table 15a. Standard errors of the percentage distribution of public high schools indicating the percent of time that all of the school�s guidance staff spent delivering selected guidance services to high school students, by selected school characteristics: 2002�Continued
Occupational choice and career planning Job placement and employability skill
development
Percent of time Percent of time School characteristic
5 or less 6 to 10 11 to 20 More
than 20 5 or less 6 to 10 11 to 20
More than 20
All public high schools ............. 1.0 1.7 2.1 1.6 1.9 1.5 1.6 0.5
Enrollment size
Less than 500............................ 1.8 3.4 3.9 3.0 3.3 3.1 2.9 1.0 500 to 1,199.............................. 1.6 2.6 3.0 1.8 3.0 2.3 1.8 0.6 1,200 or more ........................... 1.6 2.4 2.7 2.0 3.0 2.5 1.5 0.8
School locale
City........................................... 2.7 4.1 4.5 3.9 4.7 3.2 3.1 1.7 Urban fringe ............................. 1.9 3.0 3.0 2.1 3.4 3.1 2.0 0.8 Town ........................................ 2.6 4.0 4.0 3.5 4.5 4.5 3.4 0.8 Rural......................................... 1.6 2.8 3.3 2.4 2.5 2.4 2.4 0.7
Percent college bound Less than 50 percent ................. 3.9 4.7 6.2 5.1 6.9 5.1 4.3 � 50 to 74 percent ........................ 1.8 2.9 3.2 2.5 3.3 2.8 2.6 0.8 75 percent or more.................... 1.2 2.5 2.4 2.3 2.6 2.6 2.3 0.7
Vocational courses per 100
students
Fewer than 3 courses ................ 1.9 3.2 3.3 2.0 3.5 3.1 1.5 0.8 3 to 6 courses............................ 1.8 2.9 2.8 1.8 2.8 2.3 1.8 1.4 More than 6 courses.................. 2.1 3.0 3.8 2.9 3.7 3.0 3.1 �
Region
Northeast .................................. 2.1 3.8 3.8 3.2 4.7 4.7 2.6 1.3 Southeast .................................. 2.3 3.6 4.1 2.6 3.3 2.9 2.6 2.1 Central ...................................... 1.6 2.9 4.0 3.1 3.3 3.5 2.0 � West.......................................... 2.1 3.5 3.5 2.6 4.0 3.0 2.9 0.7
Percent minority enrollment
Less than 6 percent ................... 2.0 3.1 4.0 3.1 3.0 3.2 2.6 0.7 6 to 20 percent .......................... 1.7 3.7 3.4 2.4 4.4 3.4 2.4 0.6 21 to 49 percent ........................ 3.4 4.4 4.4 4.0 4.6 3.8 3.3 1.1 50 percent or more.................... 1.5 3.1 3.8 3.1 3.8 3.5 2.9 1.5
Access to area/regional
vocational school
Has access ................................ 1.2 1.9 2.3 2.0 1.9 1.8 1.7 0.5 Does not have access ................ 1.6 3.1 3.5 2.3 3.9 3.7 2.7 0.8
See notes at end of table.

74
Table 15a. Standard errors of the percentage distribution of public high schools indicating the percent of time that all of the school�s guidance staff spent delivering selected guidance services to high school students, by selected school characteristics: 2002�Continued
Students� attendance, discipline and other school
and personal problems Academic testing
Percent of time Percent of time School characteristic
5 or less 6 to 10
11 to 20
More than 20
5 or less 6 to 10
11 to 20
More than 20
All public high schools ............. 1.4 1.8 1.4 1.9 1.3 1.8 1.8 1.7
Enrollment size
Less than 500............................ 2.6 3.1 2.5 3.3 2.3 3.3 3.5 3.1 500 to 1,199.............................. 1.8 2.5 2.7 2.6 2.3 2.2 2.5 2.4 1,200 or more ........................... 1.5 2.4 2.5 3.2 1.3 2.8 2.4 2.1
School locale
City........................................... 3.0 2.7 3.4 3.9 4.3 4.5 3.2 3.6 Urban fringe ............................. 2.2 2.6 3.2 3.0 3.0 2.9 3.4 2.1 Town ........................................ 3.8 3.4 3.9 4.6 3.8 3.8 4.6 4.0 Rural......................................... 2.5 2.9 2.3 3.1 2.1 3.2 3.5 2.6
Percent college bound Less than 50 percent ................. 4.5 4.3 4.9 4.8 5.0 5.4 4.6 3.9 50 to 74 percent ........................ 2.1 2.6 2.5 3.4 2.8 2.6 3.0 2.7 75 percent or more.................... 1.6 2.1 2.0 2.1 1.9 2.5 2.8 2.1
Vocational courses per 100
students Fewer than 3 courses ................ 2.1 2.1 2.8 2.4 2.5 2.6 2.7 2.2 3 to 6 courses............................ 2.4 2.6 2.9 3.4 2.8 2.9 2.5 2.9 More than 6 courses.................. 2.8 3.0 2.8 2.8 2.3 3.0 3.5 2.9
Region
Northeast .................................. 1.7 3.1 3.7 4.2 3.4 3.6 3.8 1.7 Southeast .................................. 2.1 2.7 3.8 4.2 2.6 3.2 2.9 3.7 Central ...................................... 2.6 3.1 3.1 2.5 2.9 3.4 3.4 2.6 West.......................................... 2.8 2.9 2.9 3.5 2.4 3.1 3.0 3.4
Percent minority enrollment
Less than 6 percent ................... 2.1 2.9 3.3 3.1 2.7 3.1 3.3 2.5 6 to 20 percent .......................... 3.1 2.7 3.4 3.8 2.7 3.4 3.7 2.8 21 to 49 percent ........................ 3.1 3.4 4.1 4.7 3.1 3.8 3.8 4.2 50 percent or more.................... 2.4 3.0 3.6 3.0 3.0 3.1 3.1 3.1
Access to area/regional
vocational school Has access ................................ 1.7 2.0 2.1 2.4 1.6 2.0 2.2 1.8 Does not have access ................ 2.9 2.9 2.8 3.3 2.3 3.3 3.0 3.4
See notes at end of table.

75
Table 15a. Standard errors of the percentage distribution of public high schools indicating the percent of time that all of the school�s guidance staff spent delivering selected guidance services to high school students, by selected school characteristics: 2002�Continued
Other guidance activities Non-guidance activities
(hall/lunch duty, substitute teaching, bus duty, etc.)
Percent of time Percent of time School characteristic
5 or less 6 to 10
11 to 20
More than 20
5 or less 6 to 10
11 to 20
More than 20
All public high schools ............. 1.7 1.3 1.5 1.2 1.8 1.5 1.0 0.9
Enrollment size
Less than 500............................ 3.5 2.4 2.8 2.3 3.4 2.9 2.1 2.0 500 to 1,199.............................. 3.1 2.0 2.2 2.1 2.3 1.8 1.2 0.7 1,200 or more ........................... 3.0 2.1 2.5 1.8 1.9 1.7 1.3 0.8
School locale
City........................................... 4.4 2.6 3.5 2.4 3.6 2.7 2.6 1.8 Urban fringe ............................. 3.1 2.1 2.1 2.1 2.8 2.5 1.6 0.8 Town ........................................ 4.4 2.8 3.2 2.6 3.8 3.0 2.8 1.7 Rural......................................... 3.1 2.3 2.6 2.3 3.1 2.8 1.6 1.8
Percent college bound
Less than 50 percent ................. 5.3 2.9 5.4 3.2 5.1 4.0 3.5 3.8 50 to 74 percent ........................ 3.1 2.2 2.8 2.2 3.3 2.3 1.8 1.2 75 percent or more.................... 2.4 1.9 1.9 1.8 2.2 1.9 1.4 1.4
Vocational courses per 100
students Fewer than 3 courses ................ 2.6 1.9 2.2 1.6 2.4 2.1 1.5 1.3 3 to 6 courses............................ 3.1 2.1 1.9 1.7 2.9 2.5 1.6 0.9 More than 6 courses.................. 3.3 2.2 2.7 2.3 3.3 2.8 1.9 2.2
Region
Northeast .................................. 3.2 3.0 3.1 3.0 3.1 2.6 2.1 0.7 Southeast .................................. 3.1 2.5 3.0 2.2 3.0 2.3 1.6 1.8 Central ...................................... 3.5 3.0 3.3 2.1 2.9 3.1 2.1 1.9 West.......................................... 3.0 1.5 2.7 2.2 3.3 2.5 2.0 2.1
Percent minority enrollment
Less than 6 percent ................... 3.0 2.5 2.5 2.3 2.9 2.7 1.7 1.7 6 to 20 percent .......................... 3.8 2.2 2.6 2.7 3.1 2.5 1.9 1.5 21 to 49 percent ........................ 3.6 2.0 2.5 2.1 4.1 3.2 2.0 2.3 50 percent or more.................... 3.6 2.6 3.1 2.4 3.0 2.8 2.7 1.8
Access to area/regional
vocational school Has access ................................ 1.9 1.4 1.7 1.5 2.0 1.8 1.1 1.2 Does not have access ................ 3.7 2.3 2.6 1.9 3.5 2.8 2.3 1.8
� Estimate of standard error is not derived because it is based on a statistic estimated at 0 percent. SOURCE: U.S. Department of Education, National Center for Education Statistics, Fast Response Survey System, �Survey on High School Guidance Counseling, 2001,� FRSS 80, 2002.

76
Table 16. Percent of public high schools indicating that their state or school district provided in-service training or professional development in selected topics for the school�s high school guidance counselors during the past 12 months, by selected school characteristics: 2002
School characteristic
Training on state or local
career guidance
standards/ frameworks/
models
Training on state or local
academic curriculum standards/
frameworks or
assessments
Training on state or local
occupational/ vocational curriculum standards/
frameworks or
assessments
Training on how to work
with students with special
needs
Training on how to
interpret test scores and
assess student achievement
All public high schools ........................ 53 64 43 51 52
Enrollment size
Less than 500....................................... 53 66 47 47 59 500 to 1,199......................................... 52 63 37 54 48 1,200 or more ...................................... 55 61 44 54 45
School locale
City...................................................... 54 70 49 54 48 Urban fringe ........................................ 52 57 39 54 45 Town ................................................... 50 64 44 50 55 Rural.................................................... 55 65 42 49 56
Percent college bound Less than 50 percent ............................ 47 57 41 46 45 50 to 74 percent ................................... 54 65 41 52 49 75 percent or more............................... 54 65 44 52 55
Vocational courses per 100 students
Fewer than 3 courses ........................... 54 62 37 56 48 3 to 6 courses....................................... 50 61 42 49 48 More than 6 courses............................. 56 67 47 50 59
Region
Northeast ............................................. 39 56 28 52 31 Southeast ............................................. 57 67 53 55 62 Central ................................................. 56 64 42 44 54 West..................................................... 56 65 45 56 53
Percent minority enrollment
Less than 6 percent .............................. 49 62 40 48 51 6 to 20 percent ..................................... 58 62 44 53 52 21 to 49 percent ................................... 51 64 44 54 49 50 percent or more............................... 59 68 47 53 54
Access to area/regional vocational
school Has access ........................................... 51 62 42 49 48 Does not have access ........................... 57 66 43 55 60
SOURCE: U.S. Department of Education, National Center for Education Statistics, Fast Response Survey System, �Survey on High School Guidance Counseling, 2001,� FRSS 80, 2002.

77
Table 16a. Standard errors of the percentage distribution of public high schools indicating that their state or school district provided in-service training or professional development in selected topics for the school�s high school guidance counselors during the past 12 months, by selected school characteristics: 2002
School characteristic
Training on state or local
career guidance
standards/ frameworks/
models
Training on state or local
academic curriculum standards/
frameworks or
assessments
Training on state or local
occupational/ vocational curriculum standards/
frameworks or
assessments
Training on how to work
with students with special
needs
Training on how to
interpret test scores and
assess student achievement
All public high schools ........................ 1.6 1.9 2.0 1.7 2.1
Enrollment size
Less than 500....................................... 3.5 3.3 3.6 3.5 3.3 500 to 1,199......................................... 3.0 3.0 2.7 3.1 3.3 1,200 or more ...................................... 3.0 3.3 3.0 2.9 3.2
School locale
City...................................................... 4.3 4.3 4.2 4.6 4.5 Urban fringe ........................................ 3.4 2.8 2.7 3.3 3.3 Town ................................................... 4.8 4.5 4.1 4.8 4.3 Rural.................................................... 2.7 2.9 3.2 3.2 3.1
Percent college bound Less than 50 percent ............................ 6.3 5.9 5.8 5.9 5.9 50 to 74 percent ................................... 2.8 2.6 3.1 2.3 3.1 75 percent or more............................... 2.4 2.7 2.9 2.6 2.5
Vocational courses per 100 students
Fewer than 3 courses ........................... 3.4 3.2 3.2 3.2 3.9 3 to 6 courses....................................... 3.0 3.5 3.0 3.1 3.0 More than 6 courses............................. 2.9 3.5 3.8 3.7 3.2
Region
Northeast ............................................. 4.4 4.6 4.0 4.9 3.8 Southeast ............................................. 3.8 3.4 3.6 3.4 2.9 Central ................................................. 3.1 3.5 3.5 3.5 3.8 West..................................................... 3.0 3.3 3.4 3.8 3.9
Percent minority enrollment
Less than 6 percent .............................. 3.2 3.6 3.0 3.1 3.3 6 to 20 percent ..................................... 3.2 3.3 3.5 3.9 3.3 21 to 49 percent ................................... 4.0 3.9 4.2 4.5 4.5 50 percent or more............................... 4.8 4.1 4.5 4.7 4.5
Access to area/regional vocational
school Has access ........................................... 2.0 2.3 2.5 2.1 2.3 Does not have access ........................... 3.6 3.5 3.2 3.3 3.8
SOURCE: U.S. Department of Education, National Center for Education Statistics, Fast Response Survey System, �Survey on High School Guidance Counseling, 2001,� FRSS 80, 2002.

78
Table 17. Percentage distribution of respondents reporting the time they spent on in-service training or professional development in selected topics during the past 12 months, by selected school characteristics: 2002
Training on state or local career guidance standards/
frameworks/ models
Training on state or local academic curriculum
standards/ frameworks or assessments
Training on state or local occupational/
vocational curriculum standards/ frameworks or
assessments School characteristic
4 hours
or less
5 to 8
hours
More than
8 hours
4 hours
or less
5 to 8
hours
More than
8 hours
4 hours
or less
5 to 8
hours
More than
8 hours
All public high schools ........................ 40 30 30 38 32 30 51 28 21
Enrollment size
Less than 500....................................... 39 36 25 35 35 30 48 32 21 500 to 1,199......................................... 40 28 32 40 31 29 50 26 24 1,200 or more ...................................... 41 24 35 41 28 30 59 23 18
School locale
City...................................................... 43 27 30 40 28 32 55 23 22 Urban fringe ........................................ 42 30 29 40 32 28 54 29 17 Town ................................................... 32 29 39 33 35 32 56 21 24 Rural.................................................... 40 32 28 37 33 29 47 31 22
Percent college bound
Less than 50 percent ............................... 44 26 31 42 27 31 64 21 15 50 to 74 percent ...................................... 39 30 31 38 33 29 55 21 24 75 percent or more.................................. 40 32 27 37 32 30 46 33 21
Vocational courses per 100 students
Fewer than 3 courses .............................. 40 36 25 46 32 22 62 22 16 3 to 6 courses.......................................... 38 34 28 36 35 30 55 23 23 More than 6 courses................................ 36 31 33 34 31 34 45 34 21
Region
Northeast ............................................. 51 22 27 42 27 30 55 29 16 Southeast ............................................. 38 28 34 46 29 26 56 28 17 Central ................................................. 46 28 25 40 34 27 47 31 22 West..................................................... 30 38 33 29 35 36 51 23 25
Percent minority enrollment
Less than 6 percent .............................. 45 27 28 41 33 25 53 29 19 6 to 20 percent ..................................... 37 34 29 38 25 37 47 35 18 21 to 49 percent ................................... 39 38 23 36 37 27 60 21 20 50 percent or more............................... 35 26 39 35 36 29 46 24 30
Access to area/regional vocational school
Has access .............................................. 43 26 31 39 32 29 52 27 21 Does not have access .............................. 35 40 25 35 34 31 53 28 18
See notes at end of table.

79
Table 17. Percentage distribution of respondents reporting the time they spent on in-service training or professional development in selected topics during the past 12 months, by selected school characteristics: 2002�Continued
Training on how to work with students with
special needs Training on how to interpret test scores and
assess student achievement School characteristic
4 hours or less
5 to 8 hours
More than 8 hours
4 hours or less
5 to 8 hours
More than 8 hours
All public high schools ........................ 44 31 24 51 31 18
Enrollment size
Less than 500....................................... 39 36 25 48 31 18 500 to 1,199......................................... 44 26 31 46 37 20 1,200 or more ...................................... 54 30 15 65 20 16
School locale
City...................................................... 44 35 21 61 27 13 Urban fringe ........................................ 53 25 23 58 29 13 Town ................................................... 32 35 33 43 28 29 Rural.................................................... 44 33 24 48 34 19
Percent college bound
Less than 50 percent ................................. 41 44 16 70 23 7 50 to 74 percent ........................................ 49 29 23 49 28 23 75 percent or more.................................... 42 30 28 48 35 17
Vocational courses per 100 students
Fewer than 3 courses ................................ 45 31 24 61 25 14 3 to 6 courses............................................ 50 26 23 47 34 18 More than 6 courses.................................. 40 34 26 48 32 20
Region
Northeast ............................................. 36 30 34 55 33 12 Southeast ............................................. 55 23 22 48 29 23 Central ................................................. 42 32 26 56 32 12 West..................................................... 44 37 19 46 30 24
Percent minority enrollment
Less than 6 percent .............................. 44 30 26 54 35 11 6 to 20 percent ..................................... 50 26 23 48 26 26 21 to 49 percent ................................... 43 35 22 41 38 20 50 percent or more............................... 40 34 26 52 24 23
Access to area/regional vocational school
Has access ................................................ 49 27 24 54 28 18 Does not have access ................................ 38 37 25 47 35 19
NOTE: Data presented in this table are based on respondents� reports of the time they spent on in-service training or professional development. Most respondents (90 percent) were guidance counselors. The remaining respondents included principals (7 percent) or other staff members (3 percent) who were responsible for providing guidance services at the school. Detail may not sum to totals because of rounding.
SOURCE: U.S. Department of Education, National Center for Education Statistics, Fast Response Survey System, �Survey on High School Guidance Counseling, 2001,� FRSS 80, 2002.

80
Table 17a. Standard errors of the percentage distribution of respondents reporting the time they spent on in-service training or professional development in selected topics during the past 12 months, by selected school characteristics: 2002
Training on state or local career guidance standards/
frameworks/ models
Training on state or local academic curriculum
standards/ frameworks or assessments
Training on state or local occupational/
vocational curriculum standards/ frameworks or
assessments School characteristic 4
hours or
less
5 to 8
hours
More than
8 hours
4 hours
or less
5 to 8
hours
More than
8 hours
4 hours
or less
5 to 8
hours
More than
8 hours
All public high schools ........................ 2.6 2.3 2.2 2.1 2.5 2.2 2.9 3.0 2.9
Enrollment size
Less than 500....................................... 4.5 4.0 3.9 4.0 4.1 5.5 5.0 4.8 5.2 500 to 1,199......................................... 4.9 3.7 4.2 3.8 3.6 2.9 4.6 4.3 4.1 1,200 or more ...................................... 3.3 2.8 3.7 3.2 3.1 3.0 3.6 3.4 3.0
School locale
City...................................................... 5.4 5.2 5.0 5.4 4.1 4.8 6.3 5.5 5.3 Urban fringe ........................................ 4.4 4.0 4.0 4.6 4.3 4.3 5.2 5.1 3.7 Town ................................................... 5.3 5.7 5.6 5.7 6.1 5.2 6.9 6.0 6.5 Rural.................................................... 3.9 3.6 3.5 3.3 3.5 3.6 4.5 4.5 4.6
Percent college bound
Less than 50 percent ............................... 8.3 8.4 7.1 7.7 6.5 7.0 9.7 8.6 6.1 50 to 74 percent ...................................... 3.5 3.6 3.2 3.5 3.6 3.0 5.1 4.6 3.9 75 percent or more.................................. 3.4 3.1 3.1 3.2 3.4 3.7 3.8 3.8 3.8
Vocational courses per 100 students
Fewer than 3 courses .............................. 3.5 3.4 3.0 3.7 3.9 3.1 5.1 4.8 4.0 3 to 6 courses.......................................... 4.3 4.0 3.5 4.0 3.6 3.7 4.7 4.3 3.1 More than 6 courses................................ 3.9 3.8 3.7 3.7 3.2 4.3 4.8 5.0 5.6
Region
Northeast ............................................. 6.4 6.5 5.7 6.8 5.4 6.4 8.2 7.9 5.7 Southeast ............................................. 4.7 4.0 4.2 4.7 4.2 3.5 5.4 4.4 3.6 Central ................................................. 4.6 5.3 3.6 3.9 4.1 4.6 5.7 6.1 5.1 West..................................................... 3.8 4.1 4.4 4.2 4.5 4.9 6.2 5.1 5.3
Percent minority enrollment
Less than 6 percent .............................. 5.0 4.9 3.6 3.4 3.8 3.7 5.2 5.5 5.4 6 to 20 percent ..................................... 4.8 3.5 4.5 4.7 4.2 5.3 6.3 6.0 4.2 21 to 49 percent ................................... 5.8 5.5 4.5 5.5 5.7 4.7 7.0 5.0 5.3 50 percent or more............................... 5.1 4.2 5.1 4.5 5.1 4.3 5.6 5.0 4.9
Access to area/regional vocational school
Has access .............................................. 3.1 2.8 2.9 2.7 2.8 2.5 3.7 3.4 3.0 Does not have access .............................. 3.6 3.5 3.6 4.3 4.3 4.1 5.4 5.4 4.7
See notes at end of table.

81
Table 17a. Standard errors of the percentage distribution of respondents reporting the time they spent on in-service training or professional development in selected topics during the past 12 months, by selected school characteristics: 2002�Continued
Training on how to work with students with
special needs Training on how to interpret test scores and
assess student achievement School characteristic
4 hours or less
5 to 8 hours
More than 8 hours
4 hours or less
5 to 8 hours
More than 8 hours
All public high schools ........................ 2.6 2.9 2.2 2.4 2.7 2.0
Enrollment size
Less than 500....................................... 5.5 5.5 4.5 4.1 4.4 3.2 500 to 1,199......................................... 3.9 3.5 3.8 4.8 4.0 3.0 1,200 or more ...................................... 4.1 4.1 2.4 3.3 2.8 2.6
School locale
City...................................................... 5.3 4.9 5.5 6.1 5.1 4.0 Urban fringe ........................................ 4.6 3.7 3.2 4.5 4.2 3.1 Town ................................................... 6.0 6.5 6.0 5.7 5.8 5.9 Rural.................................................... 4.9 4.8 3.8 4.3 4.6 3.2
Percent college bound
Less than 50 percent ................................. 7.8 8.9 6.0 8.5 8.6 4.0 50 to 74 percent ........................................ 4.6 4.0 3.4 4.2 3.9 3.6 75 percent or more.................................... 3.2 3.1 3.4 3.4 3.1 2.9
Vocational courses per 100 students
Fewer than 3 courses ................................ 5.1 4.1 4.1 4.2 3.9 2.8 3 to 6 courses............................................ 4.2 4.4 3.9 3.9 4.1 3.4 More than 6 courses.................................. 5.2 4.3 4.6 4.2 4.3 3.8
Region
Northeast ............................................. 5.7 4.5 5.7 7.5 6.9 4.8 Southeast ............................................. 4.0 4.4 4.3 4.7 4.9 4.7 Central ................................................. 4.9 4.7 4.7 5.5 5.2 2.8 West..................................................... 5.2 5.5 3.8 4.7 5.1 4.6
Percent minority enrollment
Less than 6 percent .............................. 5.2 5.0 4.6 5.0 4.6 2.7 6 to 20 percent ..................................... 5.1 4.8 3.9 5.2 5.4 4.9 21 to 49 percent ................................... 6.2 6.9 4.9 5.6 5.6 5.5 50 percent or more............................... 4.5 4.7 4.9 5.3 5.1 4.5
Access to area/regional vocational school
Has access ................................................ 2.9 2.6 2.6 2.9 2.8 2.3 Does not have access ................................ 4.5 5.3 4.6 4.7 5.2 3.3
SOURCE: U.S. Department of Education, National Center for Education Statistics, Fast Response Survey System, �Survey on High School Guidance Counseling, 2001,� FRSS 80, 2002.

82
Table 18. Number of vocational courses per 100 students offered at responding schools or at their area or regional vocational schools, and percentage distribution of schools reporting the number of courses available, by selected school characteristics: 2002
Percent of schools
School characteristic
Average number of
courses per 100
students Fewer than 3 courses
3 to 6 courses
More than 6 courses
All public high schools .................................................................... 4 28 34 38
Enrollment size
Less than 500................................................................................... 10 7 26 67 500 to 1,199..................................................................................... 5 30 46 25 1,200 or more .................................................................................. 3 60 34 5
School locale
City.................................................................................................. 2 63 26 11 Urban fringe .................................................................................... 3 39 41 19 Town ............................................................................................... 6 22 43 36 Rural................................................................................................ 6 12 31 57
Percent college bound Less than 50 percent ........................................................................ 5 27 30 43 50 to 74 percent ............................................................................... 4 25 35 40 75 percent or more........................................................................... 4 30 35 35
Region
Northeast ......................................................................................... 4 36 40 24 Southeast ......................................................................................... 4 32 42 26 Central ............................................................................................. 5 20 28 52 West................................................................................................. 3 29 32 39
Percent minority enrollment
Less than 6 percent .......................................................................... 6 16 32 52 6 to 20 percent ................................................................................. 5 26 36 38 21 to 49 percent ............................................................................... 3 29 45 26 50 percent or more........................................................................... 2 52 27 21
Access to area/regional vocational school
Has access ....................................................................................... 5 24 37 39 Does not have access ....................................................................... 3 35 29 36
NOTE: Detail may not sum to totals because of rounding.
SOURCE: U.S. Department of Education, National Center for Education Statistics, Fast Response Survey System, �Survey on High School Guidance Counseling, 2001,� FRSS 80, 2002.

83
Table 18a. Standard errors of the number of vocational courses per 100 students offered at responding schools or at their area or regional vocational schools, and percentage distribution of schools reporting the number of courses available, by selected school characteristics: 2002
Percentage of schools
School characteristic
Average number of
courses per 100 students Fewer than
3 courses 3 to 6
courses More than 6 courses
All public high schools .................................................................... 0.2 1.5 1.7 1.7
Enrollment size
Less than 500................................................................................... 0.6 1.6 2.8 3.0 500 to 1,199..................................................................................... 0.3 2.8 3.1 2.9 1,200 or more .................................................................................. 0.2 3.0 3.1 1.2
School locale
City.................................................................................................. 0.2 4.6 4.0 3.2 Urban fringe .................................................................................... 0.3 2.7 3.0 2.4 Town ............................................................................................... 0.7 3.8 4.3 5.0 Rural................................................................................................ 0.4 1.9 2.5 2.8
Percent college bound Less than 50 percent ........................................................................ 0.7 4.8 5.7 5.6 50 to 74 percent ............................................................................... 0.4 2.1 2.6 3.1 75 percent or more........................................................................... 0.2 1.9 2.4 2.4
Region
Northeast ......................................................................................... 0.3 4.5 5.1 3.9 Southeast ......................................................................................... 0.3 3.4 4.0 3.6 Central ............................................................................................. 0.5 2.2 3.3 3.5 West................................................................................................. 0.3 2.9 2.6 3.5
Percent minority enrollment
Less than 6 percent .......................................................................... 0.4 2.1 2.5 3.1 6 to 20 percent ................................................................................. 0.5 2.9 3.7 3.7 21 to 49 percent ............................................................................... 0.2 3.7 4.5 4.3 50 percent or more........................................................................... 0.2 4.0 3.4 3.3
Access to area/regional vocational school
Has access ....................................................................................... 0.2 1.6 2.0 1.8 Does not have access ....................................................................... 0.2 3.1 3.1 3.8
SOURCE: U.S. Department of Education, National Center for Education Statistics, Fast Response Survey System, �Survey on High School Guidance Counseling, 2001,� FRSS 80, 2002.
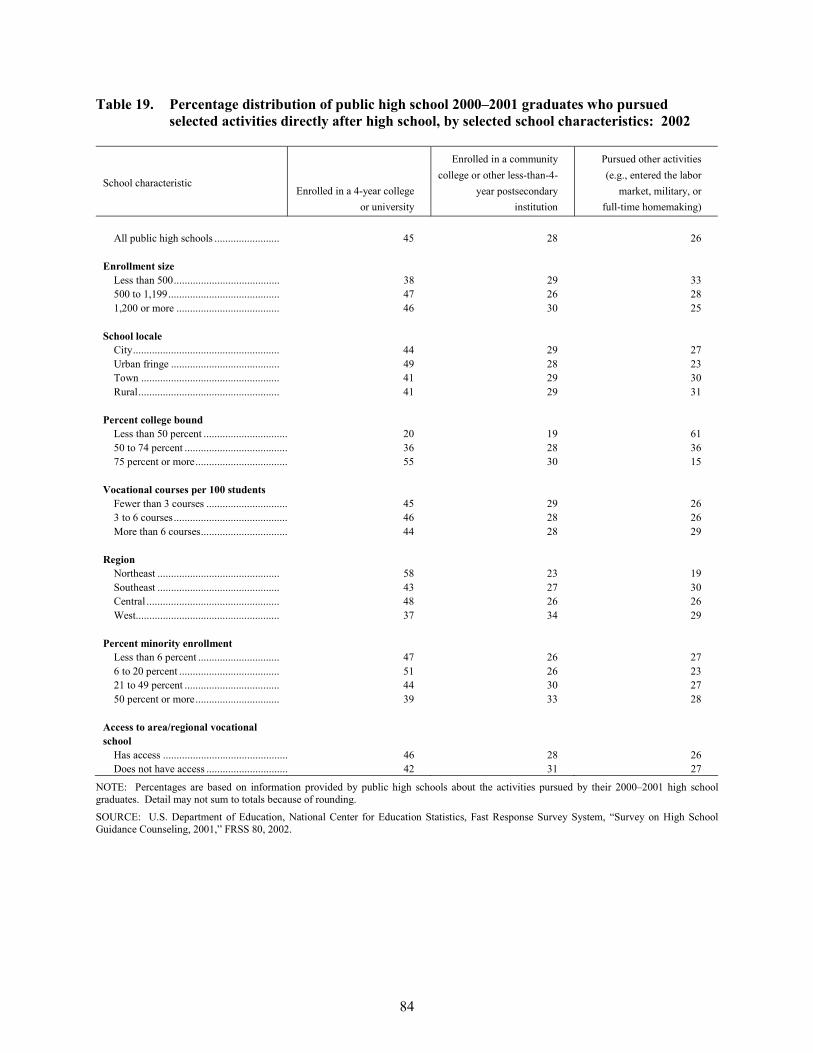
84
Table 19. Percentage distribution of public high school 2000�2001 graduates who pursued selected activities directly after high school, by selected school characteristics: 2002
School characteristic Enrolled in a 4-year college
or university
Enrolled in a community college or other less-than-4-
year postsecondary institution
Pursued other activities (e.g., entered the labor
market, military, or full-time homemaking)
All public high schools ........................ 45 28 26
Enrollment size
Less than 500....................................... 38 29 33 500 to 1,199......................................... 47 26 28 1,200 or more ...................................... 46 30 25
School locale
City...................................................... 44 29 27 Urban fringe ........................................ 49 28 23 Town ................................................... 41 29 30 Rural.................................................... 41 29 31
Percent college bound Less than 50 percent ............................... 20 19 61 50 to 74 percent ...................................... 36 28 36 75 percent or more.................................. 55 30 15
Vocational courses per 100 students
Fewer than 3 courses .............................. 45 29 26 3 to 6 courses.......................................... 46 28 26 More than 6 courses................................ 44 28 29
Region
Northeast ............................................. 58 23 19 Southeast ............................................. 43 27 30 Central ................................................. 48 26 26 West..................................................... 37 34 29
Percent minority enrollment
Less than 6 percent .............................. 47 26 27 6 to 20 percent ..................................... 51 26 23 21 to 49 percent ................................... 44 30 27 50 percent or more............................... 39 33 28
Access to area/regional vocational school
Has access .............................................. 46 28 26 Does not have access .............................. 42 31 27
NOTE: Percentages are based on information provided by public high schools about the activities pursued by their 2000�2001 high school graduates. Detail may not sum to totals because of rounding.
SOURCE: U.S. Department of Education, National Center for Education Statistics, Fast Response Survey System, �Survey on High School Guidance Counseling, 2001,� FRSS 80, 2002.

85
Table 19a. Standard errors of the percentage distribution of public high school 2000�2001 graduates who pursued selected activities directly after high school, by selected school characteristics: 2002
School characteristic Enrolled in a 4-year college
or university
Enrolled in a community college or other less-than-4-
year postsecondary institution
Pursued other activities (e.g., entered the labor
market, military, or full-time homemaking)
All public high schools ........................ 0.7 0.5 0.6
Enrollment size
Less than 500....................................... 1.3 1.1 1.4 500 to 1,199......................................... 1.1 0.9 0.9 1,200 or more ...................................... 1.1 0.8 0.9
School locale
City...................................................... 1.6 1.3 1.3 Urban fringe ........................................ 1.4 0.8 1.0 Town ................................................... 1.3 1.3 1.2 Rural.................................................... 1.3 1.3 1.1
Percent college bound Less than 50 percent ............................... 1.6 1.1 1.0 50 to 74 percent ...................................... 0.9 0.8 0.4 75 percent or more.................................. 1.0 0.8 0.3
Vocational courses per 100 students
Fewer than 3 courses .............................. 1.3 0.9 1.0 3 to 6 courses.......................................... 1.3 1.0 0.8 More than 6 courses................................ 1.4 0.9 1.4
Region
Northeast ............................................. 1.4 1.0 0.8 Southeast ............................................. 1.5 1.1 1.2 Central ................................................. 1.3 0.9 1.2 West..................................................... 1.2 1.0 1.1
Percent minority enrollment
Less than 6 percent .............................. 1.3 0.8 1.0 6 to 20 percent ..................................... 1.4 0.9 1.1 21 to 49 percent ................................... 1.5 1.4 1.3 50 percent or more............................... 1.8 1.4 1.6
Access to area/regional vocational school
Has access .............................................. 0.9 0.7 0.7 Does not have access .............................. 1.6 1.2 1.1
SOURCE: U.S. Department of Education, National Center for Education Statistics, Fast Response Survey System, �Survey on High School Guidance Counseling, 2001,� FRSS 80, 2002.

86
Table 20. Percentage distribution of public high schools indicating primary sources of information that were used to report the percent of 2000�2001 graduates who pursued selected activities directly after high school: 2002
Source of information
Activity School or district records
Other student
data Personal estimate
Other source
Enrolled in a 4-year college or university ....................................................... 53 16 32 4 Enrolled in a community college or other less-than-4-year postsecondary
education institution................................................................................. 52 17 31 5 Pursued other activities (for example, entered the labor market, military, or
full-time homemaking) ............................................................................ 45 16 39 5
NOTE: Respondents could report more than one primary source of information.
SOURCE: U.S. Department of Education, National Center for Education Statistics, Fast Response Survey System, �Survey on High School Guidance Counseling, 2001,� FRSS 80, 2002.

87
Table 20a. Standard errors of the percentage distribution of public high schools indicating primary sources of information that were used to report the percent of 2000�2001 graduates who pursued selected activities directly after high school: 2002
Source of information
Activity School or district records
Other student
data Personal estimate
Other source
Enrolled in a 4-year college or university ....................................................... 1.9 1.3 1.8 1.0 Enrolled in a community college or other less-than-4-year postsecondary
education institution................................................................................. 1.9 1.2 1.8 1.0 Pursued other activities (for example, entered the labor market, military, or
full-time homemaking) ............................................................................ 1.8 1.0 1.8 0.9
SOURCE: U.S. Department of Education, National Center for Education Statistics, Fast Response Survey System, �Survey on High School Guidance Counseling, 2001,� FRSS 80, 2002.

88

A-1
Appendix A
Methodology

A-2

A-3
Methodology
Fast Response Survey System
The Fast Response Survey System (FRSS) was established in 1975 by the National Center for Education Statistics (NCES), U.S. Department of Education. FRSS is designed to collect issue-oriented data within a relatively short timeframe. FRSS collects data from state education agencies, local education agencies, public and private elementary and secondary schools, public school teachers, and public libraries. To ensure minimal burden on respondents, the surveys are generally limited to three pages of questions, with a response burden of about 30 minutes per respondent. Sample sizes are relatively small (usually about 1,000 to 1,500 respondents per survey) so that data collection can be completed quickly. Data are weighted to produce national estimates of the sampled education sector. The sample size permits limited breakouts by classification variables. However, as the number of categories within the classification variables increases, the sample size within categories decreases, which results in larger sampling errors for the breakouts by classification variables.
Sample Selection for Survey on High School Guidance Counseling
The sample for the FRSS survey on high school guidance counseling consisted of 1,001 secondary schools in the 50 states and the District of Columbia. It was selected from the 1999�2000 NCES Common Core of Data (CCD) Public School Universe file, which was the most current file available at the time of selection. The sampling frame included 16,897 regular secondary schools. For the purposes of the study, a secondary school was defined as a school with a highest grade of 11 or 12. Excluded from the sampling frame were schools with a highest grade lower than 11, along with special education, vocational, and alternative/other schools, and schools in the U.S. territories.
The public school sampling frame was stratified by enrollment size (less than 300, 300 to 499, 500
to 999, 1,000 to 1,499, and 1,500 or more), and poverty concentration as defined by the percentage of students eligible for free or reduced-price lunch (less than 35, 35 to 49, 50 to 74, and 75 to 100 percent).27 Stratification by poverty concentration was designed to ensure a higher proportion of high poverty schools (i.e., 75 percent or more eligible for free or reduced-priced lunch) were selected, for analysis purposes.28 These schools were therefore oversampled, resulting in low poverty schools (i.e., less than 35 percent eligible for free or reduced-priced lunch) being sampled at a reduced rate, in order to maintain the desired sample size. Finally, schools in the sampling frame were sorted by type of locale (city, urban fringe, town, rural) and region (Northeast, Southeast, Central, West) to induce additional implicit stratification.29 These variables are defined in more detail below in the section Definitions of Analysis Variables.
27The CCD data for enrollment size were missing for 47 schools; these schools were excluded from the sampling frame. In addition, data for the
number of students eligible for free or reduced-price lunch were missing for 504 schools; these schools were assigned to a separate stratum for sampling purposes.
28Schools were not analyzed by poverty concentration, however, due to a relatively high proportion of missing data for responding schools. 29There were no missing data for type of locale and region in the sampling frame.

A-4
Respondent and Response Rates
Questionnaires and cover letters for the study were mailed to the principal of each sampled school on January 29, 2002.30 The letter introduced the study and requested that the questionnaire be completed by the school�s lead guidance counselor or other staff member who is responsible for providing counseling services at the school. Telephone follow up was initiated February 19, 2002, and continued through May 2002 with schools that did not respond to the initial questionnaire mailing.
Of the 1,001 schools in the sample, 13 were found to be ineligible for the survey because they did
not have an 11th or 12th grade. Another 31 were found to be ineligible because the school did not meet some other criteria for inclusion in the sample (e.g., it was an alternative education school). This left a total of 957 eligible schools in the sample. Completed questionnaires were received from 888 schools, or 93 percent of the sampled schools (table A-1). The weighted response rate was 94 percent. The weighted item nonresponse rates ranged from 0 percent to 1.4 percent. Imputation for item nonresponse was not implemented. The weighted number of eligible institutions in the survey represent the estimated universe of regular secondary schools in the 50 states and the District of Columbia (table A-1). The estimated number of schools in the survey universe decreased from the 16,944 schools in the CCD sampling frame to an estimated 15,789 because some of the schools were determined to be ineligible for the FRSS survey during data collection.
Sampling and Nonsampling Errors
The responses were weighted to produce national estimates (see table A-1). The weights were designed to adjust for the variable probabilities of selection and differential nonresponse. The findings in this report are estimates based on the sample selected and, consequently, are subject to sampling variability. General sampling theory was used to estimate the sampling variability of the estimates and to test for statistically significant differences between estimates (see the Variances section below).
Variances
The standard error is a measure of the variability of an estimate due to sampling. It indicates the variability of a sample estimate that would be obtained from all possible samples of a given design and size. Standard errors are used as a measure of the precision expected from a particular sample. If all possible samples were surveyed under similar conditions, intervals of 1.96 standard errors below to 1.96 standard errors above a particular statistic would include the true population parameter being estimated in about 95 percent of the samples. This is a 95 percent confidence interval. For example, the estimated percentage of public high schools with written plans for their guidance programs is 61.2 percent and the standard error is 1.9 percent (see tables 3 and 3a). The 95 percent confidence interval for the statistic extends from [61.2 � (1.9 x 1.96)] to [61.2 + (1.9 x 1.96)], or from 57.5 to 64.9 percent. The 1.96 is the critical value for a statistical test at the 0.05 significance level (where 0.05 indicates the 5 percent of all possible samples that would be outside the range of the confidence interval).
30The survey was developed and approved by the Office of Management and Budget (OMB) in fall 2001.

A-5
Table A-1. Number and percent of responding public high schools in the study sample, weighted estimates, and base counts from the Common Core of Data (CCD), by selected school characteristics: 2002 and 1999�2000
Study sample Weighted estimate Common Core of Data
School characteristic1
Number Percent Number Percent Number Percent
All public high schools ................................. 888 100 15,789 100 16,944 100
Enrollment size Less than 500 ................................................. 244 27 6,801 43 7,806 46 500 to 1,199 ................................................... 305 34 4,991 32 5,105 30 1,200 or more ................................................. 339 38 3,997 25 3,986 24
School locale City ................................................................ 175 20 2,276 14 2,832 17 Urban fringe ................................................... 274 31 3,948 25 4,368 26 Town .............................................................. 127 14 2,250 14 2,427 14 Rural .............................................................. 312 35 7,314 46 7,317 43
Percent college bound Less than 50 percent ....................................... 102 12 1,967 13 � � 50 to 74 percent .............................................. 331 38 5,939 38 � � 75 percent or more.......................................... 449 51 7,807 50 � �
Vocational courses per 100 students
Fewer than 3 courses ...................................... 316 36 4,297 27 � � 3 to 6 courses.................................................. 318 36 5,346 34 � � More than 6 courses........................................ 240 27 5,928 38 � �
Region Northeast ........................................................ 159 18 2,638 17 2,734 16 Southeast ........................................................ 222 25 3,426 22 3,853 23 Central............................................................ 242 27 5,115 32 5,367 32 West ............................................................... 265 30 4,610 29 4,990 29
Percent minority enrollment Less than 6 percent......................................... 266 30 5,899 37 5,765 34 6 to 20 percent................................................ 216 24 3,850 24 3,789 22 21 to 49 percent.............................................. 163 18 2,783 18 3,282 19 50 percent or more ......................................... 235 26 3,074 19 3,604 21
Access to area/regional vocational school Has access ...................................................... 606 68 10,451 66 � � Does not have access ...................................... 269 30 5,132 33 � �
� Data are not applicable. The Common Core of Data (CCD) file does not contain data on these variables. 1The following four variables were based on data from the 1999�2000 Common Core of Data (CCD), School Universe File: enrollment size, school locale, region, and percent minority enrollment. Two of the remaining variables�percent college bound and access to area/regional vocational schools�were based on data from the 2002 FRSS study. The number of vocational courses per 100 students variable was calculated using data from the 2002 FRSS study and the 1999�2000 CCD data. NOTE: Detail may not sum to totals because of rounding or missing data. For the FRSS study sample, there were small amounts of missing data for the percent minority enrollment in the school (8 cases), percent of college-bound students (6 cases), vocational courses offered per 100 students (14 cases), and access to area/regional vocational school (13 cases). For the Common Core of Data (CCD), there were missing data for enrollment (47 cases) and percent minority enrollment (504 cases). SOURCES: U.S. Department of Education, National Center for Education Statistics, Fast Response Survey System, �Survey on High School Guidance Counseling, 2001,� FRSS 80, 2002; Common Core of Data School Universe file, 1999�2000.

A-6
Because the data from the FRSS guidance counselor survey were collected using a complex sampling design, the variances of the estimates from this survey (e.g., estimates of proportions) are typically different from what would be expected from data collected with a simple random sample. Not taking the complex sample design into account can lead to an underestimate of the standard errors associated with such estimates. To generate accurate standard errors for the estimates in this report, standard errors were computed using a technique known as jackknife replication. As with any replication method, jackknife replication involves constructing a number of subsamples (replicates) from the full sample and computing the statistic of interest for each replicate. The mean square error of the replicate estimates around the full sample estimate provides an estimate of the variance of the statistic. To construct the replications, 50 stratified subsamples of the full sample were created and then dropped 1 at a time to define 50 jackknife replicates. A computer program (WesVar) was used to calculate the estimates of standard errors. WesVar is a stand-alone Windows application that computes sampling errors from complex samples for a wide variety of statistics (totals, percents, ratios, log-odds ratios, general functions of estimates in tables, linear regression parameters, and logistic regression parameters).
The test statistics used in the analysis were calculated using the jackknife variances and thus
appropriately reflect the complex nature of the sample design. Bonferroni adjustments were also made to control for multiple comparisons where appropriate. For example, for a comparison involving g pairwise comparisons, each difference was tested at the 0.05/g significance level to control for the fact that g differences were simultaneously tested. The Bonferroni adjustment results in a more conservative critical value for judging statistical significance. This means that comparisons that would have been significant with a critical value of 1.96 may not be significant with the more conservative critical value.
When comparing percentage or ratio estimates across a family of three or more ordered categories
(e.g., categories defined by percent minority enrollment), regression analyses were used to test for trends rather than a series of paired comparisons. For percentages, the analyses involved fitting models in WesVar with the ordered categories as the independent variable and the (dichotomous) outcome of interest (e.g., whether or not the school had written plans for guidance programs) as the dependent variable. For testing the overall significance, an analysis of variance (ANOVA) model was fitted by treating the categories of the independent variables as nominal categories. For the trend test, a simple linear regression model was used with the categories of the independent variable as an ordinal quantitative variable. In both cases, tests of significance were performed using an adjusted Wald F-test (WESVAR 4.0 User�s Guide, page C-21). The test is applicable to data collected through complex sample surveys and is analogous to F tests in standard regression analysis. For estimated ratios, similar tests of overall significance and linear trends were performed using procedures analogous to those described in Chapter 12 of the book Analysis of Complex Surveys (Pfeffermann and La Vange 1989). A test was considered significant if the p-value associated with the statistic was less than 0.05.
Definitions of Analysis Variables Enrollment Size � This variable indicates the total number of students enrolled in school based on data from the 1999�2000 CCD.31 The variable was collapsed into the following three categories:
Less than 500 students 500 to 1,199 students 1,200 or more students
31Schools with missing enrollment (47 cases) were excluded from the sampling frame because they were primarily out of scope for the survey
(e.g., alternative education or special education schools).

A-7
School locale � This variable indicates the type of community in which the school is located, as defined in the 1999�2000 CCD (which uses definitions based on U.S. Census Bureau classifications). This variable was based on the eight-category locale variable from CCD and recoded into a four-category analysis variable for this report. Large and midsize cities were coded as city, the urban fringes of large and midsize cities were coded as urban fringe, large and small towns were coded as town, and rural areas outside and inside Metropolitan Statistical Areas (MSAs) were coded as rural. The categories are described in more detail below.
City � A large or midsize central city of a Consolidated Metropolitan Statistical Area (CMSA) or Metropolitan Statistical Area (MSA). Urban fringe � Any incorporated place, Census-designated place, or non-place territory within a CSMA or MSA of a large or midsize city, and defined as urban by the Census Bureau. Town � Any incorporated place or Census-designated place with a population greater than or equal to 2,500 and located outside a CMSA or MSA. Rural � Any incorporated place, Census-designated place, or non-place territory defined as rural by the Census Bureau.
Percent College Bound � This variable represents the percentage of public high school 2000�2001 graduates who were reported by schools as enrolling in a 2-year or 4-year college directly after high school, as reported by the school. It was derived for each school by summing the percentages from column A of questions 12a and 12b (i.e., the percentage of students who enrolled in a 4-year college and the percentage that enrolled in a community college or other less-than-4-year postsecondary education institution). Data on this variable were missing for six schools; missing data were excluded from all analyses by questionnaire variables. The variable was collapsed into the following three categories:
Less than 50 percent of students 50 to 74 percent of students 75 percent or more of students
Vocational Courses per 100 Students � This variable indicates the ratio of vocational courses offered per 100 grade 9�12 students. It was derived from question 11 of the 2001 FRSS survey on high school guidance counseling, and the total number of high school students (grades 9 through 12) reported in the 1999�2000 CCD School Universe Survey. Vocational courses were defined on the cover of the questionnaire, and include courses available to students at the responding schools or at area or regional vocational schools. Data on this variable were missing for 14 schools; missing data were excluded from all analyses by questionnaire variables. The variable was collapsed into the following three categories:
Fewer than 3 courses 3 to 6 courses More than 6 courses

A-8
Region � This variable classifies schools into one of the four geographic regions used by the Bureau of Economic Analysis of the U.S. Department of Commerce, the National Assessment of Educational Progress, and the National Education Association. Data were obtained from the 1999�2000 CCD School Universe file. The geographic regions are:
Northeast � Connecticut, Delaware, District of Columbia, Maine, Maryland, Massachusetts, New Hampshire, New Jersey, New York, Pennsylvania, Rhode Island, and Vermont Southeast � Alabama, Arkansas, Florida, Georgia, Kentucky, Louisiana, Mississippi, North Carolina, South Carolina, Tennessee, Virginia, and West Virginia Central � Illinois, Indiana, Iowa, Kansas, Michigan, Minnesota, Missouri, Nebraska, North Dakota, Ohio, South Dakota, and Wisconsin West � Alaska, Arizona, California, Colorado, Hawaii, Idaho, Montana, Nevada, New Mexico, Oklahoma, Oregon, Texas, Utah, Washington, and Wyoming
Percent Minority Enrollment � This variable indicates the percentage of students enrolled in the school whose race or ethnicity is classified as one of the following: American Indian or Alaska Native, Asian or Pacific Islander, non-Hispanic Black, or Hispanic, based on data in the 1999�2000 CCD School Universe file. Data on this variable were missing for eight schools; missing data were excluded from all analyses by questionnaire variables. The variable was collapsed into the following four categories:
Less than 6 percent minority 6 to 20 percent minority 21 to 49 percent minority 50 percent or more minority
Access to Area/Regional Vocational School � This variable indicates whether any vocational education courses (as defined on the cover of the questionnaire) were offered to students at the sampled high school through an area or regional vocational school. The variable was derived from part (b) of question 11 of the 2001 FRSS survey on high school guidance counseling. Thus, if the response to question 11 (b) was greater than zero courses, the school was coded as having access to an area/regional vocational school. Data on this variable were missing for 13 schools; missing data were excluded from all analyses by questionnaire variables. This is a dichotomous variable:
Has access to area/regional vocational school Does not have access to area/regional vocational school It is important to note that many of these school characteristics may be related to each other. For
example, school size and locale are related, with city schools typically being larger than rural schools. Other relationships between these analysis variables may exist. However, this E.D. Tab report focuses on bivariate relationships between the analysis variables and questionnaire variables rather than more complex analyses.

A-9
The 1984 Supplement to High School and Beyond Data
Data from the 1984 supplement to HS&B on guidance counseling were collected through the guidance questionnaire of the Administrator and Teacher Surveys (ATS) conducted as part of the second followup of the High School and Beyond (HS&B) surveys.32 The questionnaire was designed to be completed by the schools� heads of guidance counselors. Data from the 1984 supplement to the HS&B guidance questionnaire were re-analyzed for three questionnaire items that are the same or similar to items from the 2002 FRSS survey on high school guidance counseling. The three questionnaire items from the 1984 supplement to the HS&B guidance questionnaire are shown in appendix C.
To create a comparable sample of 1984 high schools, a subset of schools was selected from the
1984 supplement to the HS&B guidance survey that was similar to the schools sampled for FRSS; that is, regular public high schools in the 50 states and the District of Columbia. As with the FRSS study, a high school was defined as those with a highest grade of 11 or 12. Excluded from the sample were schools with a highest grade lower than 11, private schools, special education schools, vocational and alternative/other schools, and schools in the U.S. territories. Of the 537 public and private schools that responded to the guidance questionnaire of the 1984 supplement to HS&B, 319 regular public high schools with a high grade of 11 or 12 were selected for comparisons with the FRSS survey.
Variance Estimation for HS&B Data
The original variance estimation for the HS&B used the Taylor series approximation method. However, the stratum codes that are needed to implement this method were not available in the public use files. Therefore, to obtain approximate variances for the HS&B sample, jackknife replicates were used to calculate the required standard errors. As with the FRSS analyses, jackknife replicates were derived by sorting the schools in the HS&B sample by geographic region (nine Census divisions), degree of urbanization (urban central city, suburban, and rural), income level of the community (measured by percentage of disadvantaged students), percentage of non-English speaking students, proximity to a college, and 12th-grade enrollment size. Jackknife replicates were then systematically assigned to the schools in the sorted list to 50 subsamples.
The sorting specified above to create the jackknife replicates for the HS&B sample is rough
because not all of the original stratifiers were available in the public use files. The original sample of schools was drawn based on the following stratification: (1) type of control (public, Catholic, non-Catholic private), (2) geographic region (nine Census divisions), (3) racial and ethnic composition (various combinations of White, non-Hispanic, Black, and Hispanic enrollment ratios), (4) degree of urbanization (urban central city, suburban, and rural), (5) income level of the community, (6) proximity to a college, and (7) enrollment size. However, income level, enrollment size, and the racial and ethnic composition variables were missing in the public use file. In place of these, percentage of disadvantaged students, 12th-grade enrollment size, and percentage of non-English-speaking students (or students not speaking English at home) were used as described above.
32Base year data for HS&B were collected in 1980, and the first follow up was conducted in 1982. In 1984, the ATS was conducted as a
supplemental survey in approximately half of the schools sampled in the original HS&B study. Within the ATS, separate questionnaires were administered to high school teachers, administrators, vocational education coordinators, and heads of guidance programs. For a description of the HS&B methodology see U.S. Department of Education, National Center for Education Statistics. (1981). High School and Beyond: A National Longitudinal Study for the 1980�s. Sample Design Report, by Martin Frankel, Luane Kohnke, David Buonanno, and Roger Tourangeau. For a description of ATS, see National Center for Education Statistics, High School and Beyond, 1980: Sophomore and Senior Cohort Second Follow-Up (1984), Vol. IV (ICPSR 8443) (Washington, DC: U.S. Department of Education, 1989).

A-10
Comparisons Between FRSS and HS&B Data
Data from the 1984 supplement to HS&B were compared with the 2002 FRSS data for three comparable items (see appendix C). There are a number of possible reasons why these data sets might yield different estimates on these items. One obvious reason is that the differences show actual change between 1984 and 2002. However, it is important to consider other possibilities. While the subset of schools from HS&B was very similar to the FRSS sample of schools, there may still be some differences in the samples for the two surveys that result in differences in estimates. In addition, the FRSS questionnaire and the HS&B questionnaire provided different response contexts for guidance counselors. Whereas the FRSS questionnaire contained 3 pages of questions and collected information in a very compact format, the HS&B questionnaire had more than 62 questions, of which only 3 were included for comparisons with FRSS data.
FRSS Survey Sponsorship and Acknowledgments
The survey was performed under contract with Westat. Bernie Greene was the NCES Project Officer. The data were requested by the Office of Vocational and Adult Education and the National Center for Education Statistics of the U.S. Department of Education.
This report was reviewed by the following individuals: Outside NCES
• Steve Equall, Planning and Fiscal Management for Career and Technical Education, Nebraska
• Gisela Harkin, Office of Vocational and Adult Education, U.S. Department of Education
• Carolyn Lee, Office of Vocational and Adult Education, U.S. Department of Education
• Stephanie Cronen, American Institutes for Research, Education Statistics Services Institute
• Lawrence Lanahan, American Institutes for Research, Education Statistics Services Institute
• Sally Dillow, American Institutes for Research, Education Statistics Services Institute
• Kimberley Green, National Association of State Directors of Vocational-Technical Education Consortium
• Daniel Goldenberg, Policy and Program Studies Service
Inside NCES
• William Hussar, Early Childhood, International, and Crosscutting Studies Division
• Val Plisko, Early Childhood, International, and Crosscutting Studies Division
• John Ralph, Early Childhood, International, and Crosscutting Studies Division
• Kathryn Chandler, Elementary/Secondary and Libraries Studies Division
• Patrick Rooney, Early Childhood, International, and Crosscutting Studies Division
• Lance Ferderer, Assessment Division

A-11
• Marilyn Seastrom, Statistical Standards Program, Office of the Deputy Commissioner
• Bruce Taylor, Statistical Standards Program, Office of the Deputy Commissioner
For more information about the survey, contact Bernie Greene, Early Childhood, International, and
Crosscutting Studies Division, National Center for Education Statistics, Institute of Education Sciences, U.S. Department of Education, 1990 K Street NW, Washington, DC 20006, e-mail: [email protected]; telephone (202) 502-7348.

A-12

B-1
Appendix B
FRSS Survey Instrument High School Guidance Counseling: 2001

B-2

B-3
Infor
mation
Cop
y - D
o Not
Comple
te
U.S. DEPARTMENT OF EDUCATION FORM APPROVED NATIONAL CENTER FOR EDUCATION STATISTICS O.M.B. NO.: 1850-0733 WASHINGTON, D.C. 20208-5651 EXPIRATION DATE: 7/2002 HIGH SCHOOL GUIDANCE COUNSELING: 2001 FAST RESPONSE SURVEY SYSTEM This survey is authorized by law (P.L. 103-382). While you are not required to respond, your cooperation is needed to make the results of this survey comprehensive, accurate, and timely.
LABEL
DEFINITIONS FOR THIS SURVEY Guidance staff � Please include all staff whose primary responsibility is to provide academic, career, or personal/social counseling to high school students. Vocational courses � Please include high school courses in the following areas: agriculture, business, marketing/distribution, health care, technology/communications, construction, mechanical/repair, precision production (drafting, metals, electricity, etc.), public and protective services, food service/hospitality, child care/education, personal and other services (cosmetology, fashion design, etc.), and transportation/materials moving. Please provide the following information: Name of person completing form: _____________________________________ Telephone: _______________________ Title/position: _____________________________________________________ E-Mail: ___________________________ Name of School:______________________________________________________________________________________ Best days and times to reach you (in case of questions): ______________________________________________________
THANK YOU. PLEASE KEEP A COPY OF THIS SURVEY FOR YOUR RECORDS. PLEASE RETURN COMPLETED FORM TO: IF YOU HAVE ANY QUESTIONS, CONTACT: WESTAT Basmat Parsad Attention: 716623 - Parsad 800-937-8281, ext. 8222 1650 Research Boulevard Fax: 800-254-0984 Rockville, Maryland 20850 E-mail: [email protected] According to the Paperwork Reduction Act of 1995, no persons are required to respond to a collection of information unless it displays a valid OMB control number. The valid OMB control number for this information is 1850-0733. The time required to complete this information collection is estimated to average 30 minutes per response, including the time to review instructions, search existing data resources, gather the data needed, and complete and review the information collected. If you have any comments concerning the accuracy of the time estimate(s) or suggestions for improving this form, please write to: U.S. Department of Education, Washington, D.C. 20202-4651. If you have comments or concerns regarding the status of your individual submission of this form, write directly to: National Center for Education Statistics, 1990 K Street, N.W., Washington, D.C. 20006. FRSS Form No. 80, 01/2002

B-4
Infor
mation
Cop
y - D
o Not
Comple
te
1. On a scale of 1 to 4, please rank the extent to which the following goals are currently emphasized by the guidance program at your school. Place �1� beside the goal with the most important emphasis, a �2� beside the goal with the second-most emphasis, and so on through �4� for the goal with the least emphasis. (Write in rank. Do not duplicate rankings.)
Goal Rank (write 1 for the goal with
the most emphasis and 4 with the least emphasis)
a. Help students plan and prepare for their work roles after high school ... _________ b. Help students with personal growth and development........................... _________ c. Help students plan and prepare for postsecondary schooling ............... _________ d. Help students with their academic achievement in high school ............. _________
2. For each of the following activities:
• Indicate in column A whether the activity is currently available at your school. • If yes, indicate in column B, about what percentage of students in your school participate in each activity
at least once during the time period beginning when they start the 11th grade and ending when they leave high school? (Write in percent. If unsure, give your best estimate. If none, enter �0.�)
A. Available at school?
Activity Yes No
B. If yes, what percent of students participated at least once starting in
grade 11?
a. School courses in career decisionmaking................................. 1 2 _____________ b. Occupational information units in subject-matter courses ........ 1 2 _____________ c. Exploratory work experience programs
(for example, co-op, work study, internship).............................. 1 2 _____________ d. Career days/nights .................................................................... 1 2 _____________ e. Vocationally oriented assemblies and speakers in class .......... 1 2 _____________ f. Job-site tours or visits (field trips).............................................. 1 2 _____________ g. Tours of postsecondary institutions........................................... 1 2 _____________ h. Job shadowing (extended observations of a worker)................ 1 2 _____________ i. Testing and having tests interpreted for career planning
purposes (for example, interest inventories, vocational aptitude tests) ............................................................................ 1 2 _____________
j. Individual counseling sessions .................................................. 1 2 _____________ k. Group guidance/counseling sessions ....................................... 1 2 _____________ l. Training in job seeking skills...................................................... 1 2 _____________ m. Use of noncomputerized career information sources ............... 1 2 _____________ n. Use of computerized career information sources...................... 1 2 _____________ o. Use of college catalogs ............................................................. 1 2 _____________
3. For each of the following activities:
• Indicate in column A whether the activity is available at your school during the current school year. • If yes, indicate in column B whether the activity is required of all high school students, required of
some high school students, or not required of any students. A. Available at school?
B. If yes, required of which high school students?
Activity Yes No All Some None
a. Regularly scheduled group guidance sessions led by teachers or other school staff ............................................ 1 2 1 2 3
b. A written career plan ......................................................... 1 2 1 2 3 c. A senior project based on the student�s career of
interest............................................................................... 1 2 1 2 3 d. Selection of a career major or path to guide students�
selection of courses........................................................... 1 2 1 2 3

B-5
Infor
mation
Cop
y - D
o Not
Comple
te
4. Indicate in column A whether your school currently has each of the following programs or features. If yes, indicate in column B its overall effect on your school�s ability to deliver guidance services.
Program or feature A. Have
program or feature?
B. If yes, what is the overall effect on ability to deliver
guidance services?
Yes No Mostly
negative effect
No effect
Mostly positive effect
a. School-to-Work program ............................................... 1 2 1 2 3 b. Small learning communities (for example, houses or
academies) .................................................................... 1 2 1
2
3
c. Block scheduling............................................................ 1 2 1 2 3 d. A team approach to career development (for example,
among counselors, teachers, and parents) ................... 1 2 1
2
3
e. Curriculum aligned around career clusters/paths.......... 1 2 1 2 3 f. Required state academic assessment for high school
graduation...................................................................... 1 2 1
2
3
5. Does your school have a written plan for its career guidance program? (Circle one.)
Yes .................................. 1 No ..................................... 2 (Skip to Question 7.) 6. Does the plan include written standards? (Circle one.)
Yes .................................. 1 No ..................................... 2 7. Indicate in column A the number of full-time and part-time guidance counselors assigned to high school
students at your school. Of those assigned, indicated in column B the number of counselors that are certified as high school guidance counselors. (Complete each row. If none, write �0�.)
Full- or part-time status A. Number assigned to school
B. Of those assigned, number certified as
guidance counselors
a. Full-time high school counselors .................. _______________ _______________
b. Part-time high school counselors ................. _______________ _______________
8. How many guidance para-professionals are assigned to high school students in your school? (If none, write �0�.) _________ guidance para-professionals
9. For the entire school year, about what percentage of time do all of your school�s guidance staff spend
delivering guidance services to high school students in the areas listed below? (Circle one on each line.) Percent of time spent on service
Area 5% or less 6-10% 11-20% 21-50% More
than 50% a. Choice and scheduling of high school courses .... 1 2 3 4 5 b. Postsecondary education admissions and
selections.............................................................. 1 2 3 4 5 c. Occupational choice and career planning ............ 1 2 3 4 5 d. Job placement and employability skill
development ......................................................... 1 2 3 4 5 e. Students� attendance, discipline and other
school and personal problems ............................. 1 2 3 4 5 f. Academic testing .................................................. 1 2 3 4 5 g. Other guidance activities (Please specify.)
____________________________________ ..... 1 2 3 4 5 h. Non-guidance activities (hall/lunch duty,
substitute teaching, bus duty, etc.)....................... 1 2 3 4 5

B-6
Infor
mation
Cop
y - D
o Not
Comple
te
10. For each of the following topics:
• Indicate in column A whether your state or school district provided in-service training or professional development for your school�s high school guidance counselors during the past 12 months?
• If yes, indicate in column B the number hours of instruction that you had on each in-service topic during the past 12 months.
A. Provided to guidance
counselors? Topic Yes No
B. If yes, how many hours of instruction did
you have?
a. Training on state or local career guidance standards/frameworks/models .......................................................... 1 2 ___________
b. Training on state or local academic curriculum standards/frameworks or assessments............................................. 1 2 ___________
c. Training on state or local occupational/vocational curriculum standards/frameworks or assessments............................................. 1 2 ___________
d. Training on how to work with students with special needs ............... 1 2 ___________e. Training on how to interpret test scores and assess student
achievement ...................................................................................... 1 2 ___________ 11. How many vocational education courses (see list on cover page) are currently offered to high school
students at your school or at an area or regional vocational school? (Enter �0� if no vocational education courses are offered.)
a. At your school................................................................ _________courses
b. At an area or regional vocational school ....................... _________courses
12. For the graduating class of 2000�2001:
• Indicate in column A the percentage of students who pursued the listed activities directly after high school.
• Indicate in column B the primary source of information you used to answer the question. B. Source of information
Activity A. Percent
of students
School or
district records
Other student
data
Personal estimate
Other source
a. Enrolled in a four-year college or university ...... ________ 1 2 3 4 b. Enrolled in a community college or other
less-than-4-year postsecondary education institution ........................................................... ________ 1 2 3 4
c. Pursued other activities (for example, entered the labor market, military, or full-time homemaking)..................................................... ________ 1 2 3 4
Thank you. Please keep a copy for your records.

C-1
Appendix C
Selected Items from the 1984 Supplement to the High School and Beyond Longitudinal Study (HS&B)

C-2

C-3
2. Please rank the extent to which the following goals are currently emphasized by the guidance program at your school. Place �1� beside the goal with the most important emphasis, a �2� beside the goal with the second-most emphasis, and so on through �4� for the goal with the least emphasis. (WRITE IN RANK. DO NOT DUPLICATE RANKINGS.) e. Help students plan and prepare for their work roles after high school... _________ f. Help students with personal growth and development .......................... _________ g. Help students plan and prepare for postsecondary schooling............... _________ h. Help students with their academic achievement in high school............. _________
10. Does your school have a written plan for its career guidance program? (CIRCLE ONE.)
Yes��(GO TO Q.11)���������.1
No��.(SKIP TO Q.11)��������..2
24. About what percentage of students in your school participate in each of the following activities at least once during the time period beginning when they start the 11th grade and ending and ending when they leave high school? (WRITE IN PERCENT. IF UNSURE, GIVE YOUR BEST ESTIMATE. IF NONE, ENTER �000�)
Not Offered
a. School courses in career decisionmaking ............................... 9 ______ %
b. Occupational information units in subject-matter courses ....... 9 ______ %
c. Exploratory work experience programs (for example, co-op, work study, internship)............................ 9 ______ %
d. Career days/nights................................................................... 9 ______ %
e. Vocationally oriented assemblies and speakers in class......... 9 ______ %
f. Job-site tours or visits (field trips) ............................................ 9 ______ %
g. Tours of postsecondary institutions ......................................... 9 ______ %
h. Job shadowing (extended observations of a worker) .............. 9 ______ %
i. Simulations (e.g., Singer, SRA job experience kits)*............... 9 ______ %
j. Testing and having tests interpreted for career planning purposes (for example, interest inventories, vocational aptitude tests) .......................................................................... 9 ______ %
k. Individual counseling sessions ................................................ 9 ______ %
l. Group guidance/counseling sessions ...................................... 9 ______ %
m. Training in job seeking skills .................................................... 9 ______ %
n. Use of noncomputerized career information sources .............. 9 ______ %
o. Use of computerized career information sources .................... 9 ______ %
p. Use of college catalogs............................................................ 9 ______ %
* This question was excluded from the 2002 FRSS questionnaire because pretesting suggested that this activity is hardly ever used in schools and respondents may have difficulty answering the question.


![PrÁcticas de Laboratorio [e.d.]](https://static.fdocuments.net/doc/165x107/5571f3da49795947648ead4f/practicas-de-laboratorio-ed.jpg)