Catalyst Technology Submitted by: Mercury Marine Prepared ...

High Impact Technology Catalyst: Technology Deployment Strategies September 2015 Prepared by Navigant Consulting, Inc.


NOTICE
This report was prepared as an account of work sponsored by an agency of the United States Government. Neither the United States Government, nor any agency thereof, nor any of their employees, nor any of their contractors, subcontractors, or their employees, makes any warranty, express or implied, or assumes any legal liability or responsibility for the accuracy, completeness, or usefulness of any information, apparatus, product, or process disclosed, or represents that its use would not infringe privately owned rights. Reference herein to any specific commercial product, process, or service by trade name, trademark, manufacturer, or otherwise, does not necessarily constitute or imply its endorsement, recommendation, or favoring by the United States Government or any agency, contractor or subcontractor thereof. The views and opinions of authors expressed herein do not necessarily state or reflect those of the United States Government or any agency thereof.

Prepared for:
U.S. Department of Energy Office of Energy Efficiency and Renewable Energy
Building Technologies Office www.eere.energy.gov/buildings
Prepared by: Navigant Consulting, Inc.
77 South Bedford Street, Suite 400 Burlington, MA 01803
William Goetzler
Collin Weber

HIGH IMPACT TECHNOLOGY CATALYST: 2015 MARKET TRANSFORMATION PLANS
List of Acronyms
ACCA Air Conditioning Contractors of America ACEEE American Council for an Energy Efficient Economy AHRI Air-Conditioning, Heating, and Refrigeration Institute AMCA Air Movement and Control Association International ANL Argonne National Laboratory APS Arizona Public Service ASHRAE American Society of Heating, Refrigerating, and Air-Conditioning Engineers BAS Building Automation System BBA Better Buildings Alliance BEMOSS Building Energy Management Open-Source Software Development BMS Building Management System BOMA Building Owners and Managers Association BTO Building Technologies Office CBEI Consortium for Building Energy Innovation CBERD Center for Building Energy Research and Development CBI Commercial Buildings Integration CGDB Complex Glazing Database CPD Certified Product Database CRP Certified Ratings Program DOE Department of Energy EIS Energy Information System EMIS Energy Management and Information System EMS Energy Management System ET Emerging Technologies FDD Fault Detection and Diagnostics FEMP Federal Energy Management Program FY Fiscal Year GSA General Services Administration HIT High Impact Technology HVAC Heating, Ventilation, and Air Conditioning IES Illuminating Engineering Society IFMA International Facility Management Association ILC Interior Lighting Campaign IT Information Technology kW Kilowatt kWh Kilowatt-Hour LBNL Lawrence Berkeley National Laboratory LED Light-Emitting Diode LEED Leaders in Energy and Environmental Design LUMEN Lighting Utility Midwest Exchange Network M&V Measurement and Verification MEEA Midwest Energy Efficiency Alliance

NEEA Northwest Energy Efficiency Alliance NEEP Northeast Energy Efficiency Partnerships NREL National Renewable Energy Laboratory NYSERDA New York State Energy Research and Development Authority OEM Original Equipment Manufacturers ORNL Oak Ridge National Laboratory P-Tool Prioritization Tool PIER Public Interest Energy Research Program PG&E Pacific Gas and Electric PNNL Pacific Northwest National Laboratory R&D Research and Development REEO Regional Energy Efficiency Organizations RFI Request for Information SaaS Software as a Service SCE Southern California Edison SMACNA Sheet Metal & Air Conditioning Contractor’s National Association SMSCB Small- and Midsize Commercial Buildings SMUD Sacramento Municipal Utility District SSL Solid State Lighting TBtu Trillion British Thermal Units TWh Terawatt-Hour USGBC United States Green Building Council VFD Variable Frequency Drive WCMA Window Covers Manufacturing Association

HIGH IMPACT TECHNOLOGY CATALYST: 2015 MARKET TRANSFORMATION PLANS
Table of Contents List of Tables and Figures ........................................................................................................................... vii 1 Introduction and Purpose ..................................................................................................................... 1 2 HIT Background and Selection Methodology ...................................................................................... 3
2.1 HIT Selection Methodology.......................................................................................................... 3 2.1.1 Technology Evaluation Criteria ............................................................................................ 3 2.1.2 HIT Matrix ............................................................................................................................ 4 2.1.3 Stakeholder Workshop Process ............................................................................................. 5
2.2 Selected HITs ................................................................................................................................ 7 3 Overview of Market Transformation Plans ........................................................................................ 10 4 Market Transformation Plan – LED Troffers and Controls ............................................................... 12
4.1 Evaluation of Current Market Landscape ................................................................................... 12 4.1.1 Key Sectors and Applications ............................................................................................. 12 4.1.2 Major Manufactures ............................................................................................................ 13 4.1.3 Relevant CBI Work and Resources..................................................................................... 14 4.1.4 Technical and Market Barriers ............................................................................................ 15 4.1.5 Other Complementary Programs and Cross-Cutting Opportunities ................................... 17
4.2 Market Transformation Goals and Timeframe ........................................................................... 18 4.3 Market Transformation Activities ............................................................................................... 18
5 Market Transformation Plan – Monitoring-based Building Energy Performance Improvements ..... 20 5.1 Evaluation of Current Market Landscape ................................................................................... 20
5.1.1 Key Sectors and Applications ............................................................................................. 20 5.1.2 Major Manufacturers ........................................................................................................... 21 5.1.3 Relevant CBI Work and Resources..................................................................................... 22 5.1.4 Technical and Market Barriers ............................................................................................ 25 5.1.5 Other Focus Programs and Cross-Cutting Opportunities .................................................... 26
5.2 Market Transformation Goals and Timeframe ........................................................................... 28 5.3 Market Transformation Activities ............................................................................................... 28
6 Market Transformation Plan – Attachments ...................................................................................... 30 6.1 Evaluation of Current Market Landscape ................................................................................... 30
6.1.1 Key Sectors and Applications ............................................................................................. 30 6.1.2 Major Manufactures ............................................................................................................ 31 6.1.3 Relevant CBI Work and Resources..................................................................................... 32 6.1.4 Technical and Market Barriers ............................................................................................ 33 6.1.5 Other Focus Programs and Cross-Cutting Opportunities .................................................... 36
6.2 Market Transformation Goals and Timeframe ........................................................................... 36 6.3 Market Transformation Activities ............................................................................................... 37
7 Market Transformation Plan - Refrigeration Controls and Display Case Retrofits ........................... 39 7.1 Evaluation of Current Market Landscape – Refrigeration Controls ........................................... 39
7.1.1 Key Sectors and Applications ............................................................................................. 39 7.1.2 Major Manufactures ............................................................................................................ 41 7.1.3 Relevant CBI Work and Resources..................................................................................... 41 7.1.4 Technical and Market Barriers ............................................................................................ 42
7.1.5 Other Focus Programs and Cross-Cutting Opportunities .................................................... 43 7.2 Evaluation of Current Market Landscape – Open Case Retrofits ............................................... 44
7.2.1 Key Sectors and Applications ............................................................................................. 44 7.2.2 Major Manufacturers ........................................................................................................... 44 7.2.3 Relevant CBI Work and Resources..................................................................................... 45 7.2.4 Technical and Market Barriers ............................................................................................ 45 7.2.5 Other Focus Programs and Cross-Cutting Opportunities .................................................... 46
7.3 Market Transformation Goals and Timeframe ........................................................................... 47 7.4 Market Transformation Activities ............................................................................................... 47
8 Market Transformation Plan – Commercial Fans .............................................................................. 49 8.1 Evaluation of Current Market Landscape ................................................................................... 49
8.1.1 Key Sectors and Applications ............................................................................................. 49 8.1.2 Major Manufacturers ........................................................................................................... 49 8.1.3 Relevant CBI Work and Resources..................................................................................... 50 8.1.4 Technical and Market Barriers ............................................................................................ 50 8.1.5 Other Focus Programs and Cross-Cutting Opportunities .................................................... 52
8.2 Market Transformation Goals and Timeframe ........................................................................... 54 8.3 Market Transformation Activities ............................................................................................... 54

List of Tables and Figures Tables: Table 2-1: HIT Screening Factors ................................................................................................................. 4 Table 2-2: HIT Workshop Participants ......................................................................................................... 5 Table 2-3: LED Troffers with Controls - Overview ..................................................................................... 8 Table 2-4: Energy Management and Information Systems/Whole Building Diagnostics - Overview ......... 8 Table 2-5: Attachments - Overview .............................................................................................................. 9 Table 2-6: Refrigeration Controls and Display Case Retrofits - Overview .................................................. 9 Table 2-7: Commercial Fans - Overview ...................................................................................................... 9 Table 4-1: Major Industry Players - LED Troffers and Controls ................................................................ 13 Table 4-2: Snapshot of DOE Efforts Supporting Market Adoption of LED Troffers and Controls ........... 14 Table 4-3: Barriers – LED Troffers and Controls ....................................................................................... 15 Table 4-4: Snapshot of Other Efforts Supporting Adoption of LED Troffers and Controls ...................... 17 Table 5-1: Estimated Energy Management System Revenue by Customer Type, North America: 2015 .. 21 Table 5-2: System Providers – Building Energy Management and Information Systems .......................... 22 Table 5-3: Better Buildings Alliance EMIS Information ............................................................................ 23 Table 5-4: Snapshot of DOE Efforts Supporting Market Adoption of Energy Management and Information Systems ...................................................................................... 24 Table 5-5: Snapshot of DOE Efforts Supporting Sensors, Controls, and Transactional Networks ............ 24 Table 5-6: Barriers – Energy Management and Information Systems ........................................................ 25 Table 5-7: Snapshot of Other Programs Supporting Adoption of Energy Management and Information Systems .......................................................................................... 27 Table 6-1: Representative Industry Players – Attachments ........................................................................ 32 Table 6-2: Snapshot of DOE Efforts Supporting Market Adoption of Commercial Building Attachments ........................................................................................................ 33 Table 6-3: Barriers – Attachments .............................................................................................................. 34 Table 6-4: Snapshot of Other Efforts Supporting Adoption of Attachments .............................................. 36 Table 6-5: Key Attachments Deployment Partners .................................................................................... 37 Table 7-1: Major Industry Players – Refrigeration Controls ...................................................................... 41 Table 7-2: Snapshot of DOE Efforts Supporting Market Adoption of Refrigeration Controls .................. 42 Table 7-3: Barriers – Refrigeration Controls .............................................................................................. 42 Table 7-4: Snapshot of Other Efforts Supporting Adoption of Refrigeration Controls .............................. 43 Table 7-5: Major Industry Players – Door Retrofits ................................................................................... 45 Table 7-6: Snapshot of DOE Efforts Supporting Market Adoption of Door Retrofits ............................... 45 Table 7-7: Barriers – Open Case Retrofits .................................................................................................. 46 Table 7-8: Snapshot of Other Programs Supporting Adoption of Open Case Retrofits ............................. 46 Table 8-1: Major Industry Players – Commercial Fans .............................................................................. 49 Table 8-2: Snapshot of DOE Efforts Supporting Market Adoption of Efficient Fan Systems ................... 50 Table 8-3: Barriers – Fans ........................................................................................................................... 51 Table 8-4: Snapshot of Other Efforts Supporting Adoption of Efficient Fans ........................................... 52 Table 8-5: Potential Fan Deployment Partners ........................................................................................... 54

Figures: Figure 1-1: HIT Catalyst Annual Cycle ........................................................................................................ 2 Figure 2-1: HIT Technology Screening Overview ....................................................................................... 3 Figure 3-1: HIT Activity Decision Map ..................................................................................................... 11 Figure 4-1: Composition of Linear Fixture Installed Base ......................................................................... 13 Figure 4-2: Pathway for LED Troffers and Controls .................................................................................. 18 Figure 5-1: Pathway for Energy Management Information Systems .......................................................... 28 Figure 6-1: Examples of Attachments ........................................................................................................ 31 Figure 6-2: Pathway for Attachments ......................................................................................................... 38 Figure 7-1: Breakdown of Refrigeration Energy Use ................................................................................. 39 Figure 7-2: Typical Supermarket Refrigeration System Configuration ...................................................... 40 Figure 7-3: Pathway for Refrigeration Controls and Display Case Retrofits ............................................. 47 Figure 8-1: Pathway for Commercial Fans ................................................................................................. 55

HIGH IMPACT TECHNOLOGY CATALYST: 2015 TECHNOLOGY DEPLOYMENT STRATEGIES
1 Introduction and Purpose The High Impact Technology (HIT) Catalyst was initiated by the U.S. Department of Energy’s (DOE)’s Commercial Buildings Integration (CBI) program in 2014. Its mission is to identify underutilized building technologies with large energy savings potential and provide the market with resources needed to accelerate their adoption. In addition, the HIT Catalyst serves to bring all of CBI’s previously disparate technology-specific market transformation activities under a single strategic framework. Each year, the DOE’s Building Technologies Office (BTO) conducts a research, identification, and evaluation exercise to develop deployment strategies for those technologies that can make the most impact in achieving BTO’s energy savings goals, High Impact Technologies or HITs. HITs are prioritized based on key quantitative and market criteria to generate a HIT List. The key question for each technology on the HIT list is: “Which of the HIT Core Activities can most effectively improve the market adoption of this technology?” Five Core Activities reflect proven and successful market stimulation work. Core Activities are selected using decision criteria that relies on an assessment of the technology landscape and the most significant market barriers. The Core HIT Market Stimulation Activities function as follows:
• Innovation Challenge: Triggers product development where the market has not met current owner and designer demands for more efficient products.
• Real Building Demonstration: Overcomes owner uncertainty about how the technology will perform in real-world settings.
• Performance Specification: Answers the need for technical and functional guidance on the selection of the highest performing technologies.
• Application Guidance: Highlights best practices in design, installation, and ongoing maintenance of HITs.
• Adoption Campaign: Provides incentive for owners/operators to choose and implement high impact technologies. Adoption campaigns provide assistance and recognition for participants, help drive down costs, and enable the BTO to share best practices and energy savings results from real projects that achieve maximum energy savings.
An understanding of the landscape and barriers for each HIT leads the BTO to activities that have the greatest likelihood of significantly affecting the markets for the chosen technologies—The Game Plan. Tailoring activities and transformation plans to each HIT ensures that resources will be allocated in the most effective manner attainable for the greatest market impact. The HIT Catalyst program operates cyclically. Each year, new technologies are taken in and added to the program. Existing HITs are reevaluated and new activities are initiated to build off of existing work or handed off to external organizations to lock in or maintain efficiency efforts. Figure 1-1 below discusses the annual efforts.
Introduction and Purpose 1

HIGH IMPACT TECHNOLOGY CATALYST: 2015 MARKET TRANSFORMATION PLANS
Figure 1-1: HIT Catalyst Annual Cycle
Quarter Quarterly Action Steps Ongoing Activities (Year-Round)
Spring
• Initiate request for information (RFI) to gather suggestions on new candidate HITs
• Conduct literature and market review on possible new HITs, including new P-Tool measures and “graduates” of other technology R&D programs (Tech Sweep)
• New inputs are added to the HIT Matrix • Use BTO Peer Review and Better Buildings Summit to review HIT
Matrix program feedback
• Catalog data and suggestions on possible HITs for next cycle
• Initiate new market transformation activities
• Reevaluate deployment plans for existing HITs and move to next step upon activity completion
• Hand off HITs once CBI work complete
Summer • Conduct workshop to answer qualitative questions, understand
changing market conditions and uncover work by others • Refresh HIT selection matrix with workshop feedback
Fall • Revisit HIT priority list based on HIT Matrix updates • Develop HIT Watchlist based on emerging high-potential techs
Winter
• Develop market transformation plans for new HITs (as applicable for new technologies)
• Update Game Plans for existing HITs based on new market conditions
This document serves as an overview of the HIT Catalyst program activities, including a summary of the selection process undertaken to identify, evaluate and prioritize the current HITs, descriptions of the technologies and markets for each HIT, and plans for deployment.
2 Introduction and Purpose

HIGH IMPACT TECHNOLOGY CATALYST: 2015 TECHNOLOGY DEPLOYMENT STRATEGIES
2 HIT Background and Selection Methodology
2.1 HIT Selection Methodology The DOE’s initial list of candidate technologies was drawn from a thorough literature review (the Tech Sweep) and from the BTO Prioritization Tool (P-Tool, now Scout1), a spreadsheet model developed by BTO to track the potential energy savings impacts of all of the energy efficiency technologies within BTO’s purview. Technology descriptions and energy savings potential values were migrated from the P-Tool to begin the HIT Matrix and were augmented with additional technologies from supplementary channels. In total, the candidate technologies evaluated for 2015 numbered over 400. The BTO organized the HIT Matrix under two screens to gauge technical energy savings potential with market interest, cost, and manufacturing readiness and capacity. This technology evaluation ensures that BTO can effect structured, activity-based technology market transformation. Figure 2-1 below depicts the technology screening process.
Figure 2-1: HIT Technology Screening Overview
2.1.1 Technology Evaluation Criteria A number of criteria were used to characterize the candidate technologies and develop the initial outputs of the HIT selection process, depicted in Table 2-1. The criteria used in the first screen are largely quantitative and are used to eliminate technologies inappropriate for the program. The criteria in the second screen were used during workshops to rank the technologies based on qualitative factors for further consideration. The DOE selected specific criteria, building from successful technology deployment projects and discerning the pre-existing conditions that helped lead these projects to success.
1 For more information, please see http://energy.gov/eere/buildings/prioritization-tool
HIT Background and Selection Methodology 3

HIGH IMPACT TECHNOLOGY CATALYST: 2015 MARKET TRANSFORMATION PLANS
Table 2-1: HIT Screening Factors
Screen Evaluation Criteria
First
• Significance of unit savings potential • Significance of national savings potential • Specificity of measure • Deployment readiness • Alignment with HIT program methodology • Starting in 2016: GHG emissions reduction potential • Starting in 2016:water savings potential
Second
• Level of stakeholder interest • Criticality of CBI involvement • Existing manufacturing capacity • Current cost-effectiveness • Cost reduction potential
In 2016, BTO will add screening factors for greenhouse gas emissions reduction potential and water savings potential in addition to energy savings potential.
2.1.2 HIT Matrix The HIT list is developed using the HIT Matrix, an internal Excel-based tool created for use in categorizing the data for each candidate technology and ranking the HITs. The HIT Matrix includes information for each technology in the following key areas:
• Technology description and overview • Technology area (end-use sector) • Per-unit and national technical energy savings potential (drawn from the BTO
Prioritization Tool and Tech Sweep) • Estimates of technology readiness and technology match within the HIT program • Quantification of the status of key market factors (as described in previous section) • Discussion of existing CBI efforts focused on the technology2
The HIT Matrix allows for the CBI program to continually grow its database of known technologies and associated attributes as new technologies and supporting data arises from literature review, RFI responses, stakeholder workshops, and other channels. It is a living document that can be easily updated in real time. This tool also provides an easy mechanism for sorting HITs based on their technical energy savings potential, market factors, relevant end-use sector, and other key areas. The sorted list of HIT Matrix entries is used as the basis for final discussion and selection of HITs for targeted market transformation activities. In 2016, the HIT Matrix will reflect new updates to the BTO Prioritization Tool/Scout to support multi-system/integrated measure analysis. BTO will conduct a supplemental HIT analysis to identify the opportunity for deployment of technologies that impact multiple systems and groupings or packages of building efficiency measures.
2 Deployment Activities may include work with utilities, trade associations (such as ASHRAE, IES or USGBC), regional energy organization and nonprofits as well as the activities of the Better Buildings Alliance., https://www4.eere.energy.gov/alliance/
4 HIT Background and Selection Methodology

HIGH IMPACT TECHNOLOGY CATALYST: 2015 TECHNOLOGY DEPLOYMENT STRATEGIES
2.1.3 Stakeholder Workshop Process BTO collects comprehensive ongoing technology inputs and feedback through existing stakeholder networks such as the Better Buildings Initiative, the Consortium for Building Energy Innovation (CBEI), state and local governments, utility groups, etc. The HIT Catalyst program is reviewed at the annual BTO Program Review, and HITs are emphasized as part of the Better Buildings Summit technology tracks. A key component of the HIT list development process is the convening of discussions between the CBI program and a number of specific external and federal inter-agency stakeholders. These meetings allow the program to solicit specific feedback on the HIT Catalyst methodology, candidate technologies, and other programs underway in key commercial building technology sectors. As part of the development process for the 2015 HIT List, an in-person stakeholder workshop was convened at the DOE headquarters in Washington, D.C., followed by a number of virtual webinars with additional organizations and a second workshop at the DOE headquarters to solicit feedback from federal entities. A list of participants in the workshopping process is provided in Table 2-2 below.
Table 2-2: HIT Workshop Participants
Workshop Participants
Con Edison Lawrence Berkeley National Laboratory Office of Secretary of Defense
Southeast Energy Efficiency Alliance McCurdy & Associates, LLC U.S. General Services
Administration Northeast Energy Efficiency Partnerships (NEEA)
University of Southern California
Naval Facilities Engineering Command
Midwest Energy Efficiency Alliance (MEEA) Structures Design/Build, LLC DOE SunShot Program
Pacific Northwest National Laboratory (PNNL Purdue University Penn State University
National Renewable Energy Laboratory (NREL) Rutgers University United Technologies
Corporation Electric Power Research Institute Texas A&M University Bayer
Oak Ridge National Laboratory (ORNL) City College of New York Carnegie Mellon University
Pacific Gas and Electric Company (PG&E) San Diego Gas & Electric Tennessee Valley Authority
South-Central Partnership for Energy-Efficiency as a Resource
HIT Background and Selection Methodology 5

HIGH IMPACT TECHNOLOGY CATALYST: 2015 MARKET TRANSFORMATION PLANS
These workshops proved perspective on the various technologies under consideration and in shaping the final HIT list. Going forward, CBI plans to continue and expand these discussions as part of the annual HIT prioritization process. Based on the HIT list, BTO convenes technology-specific discussions to understand the market landscape for that technology, uncover specific barriers or challenges, and to identify new promising emerging products that meet deployment goals.
6 HIT Background and Selection Methodology

HIGH IMPACT TECHNOLOGY CATALYST: 2015 TECHNOLOGY DEPLOYMENT STRATEGIES
2.2 Selected HITs As a result of the initial selection process described in Section 2.1 above, BTO prioritized deployment of five HITs. Furthermore, BTO identified technologies to watch for future deployment opportunities (the HIT Watchlist). The HIT Watchlist is compiled from analysis of HIT criteria, but for technologies still in development; thus current manufacturing and cost thresholds may inhibit those technologies from passing the screens. Future deployment of technologies on the Watchlist will depend on the state of the technology and the market at that time. Questions we will ask include: Has it already been demonstrated? Are resources widely available? Is the energy savings opportunity large enough and is there significant stakeholder interest necessary support impactful deployment activities? The HIT Watchlist for 2015 includes:
• Distributed systems for collecting occupancy information (lighting, plug load devices) • Interoperable, multi-system building energy management platforms • Cold climate heat pumps (ET graduate) • Low global warming potential refrigerants • Automated auditing and commissioning
The HIT List for 2015 includes:
• LED troffers with controls • Energy management and information systems (EMISs) and building diagnostics and
controls, including3: o Automated fault detection and diagnostics o Submetering o Monitoring-based commissioning
• Exterior shading measures • Refrigeration controls and display case door retrofits • Commercial fans
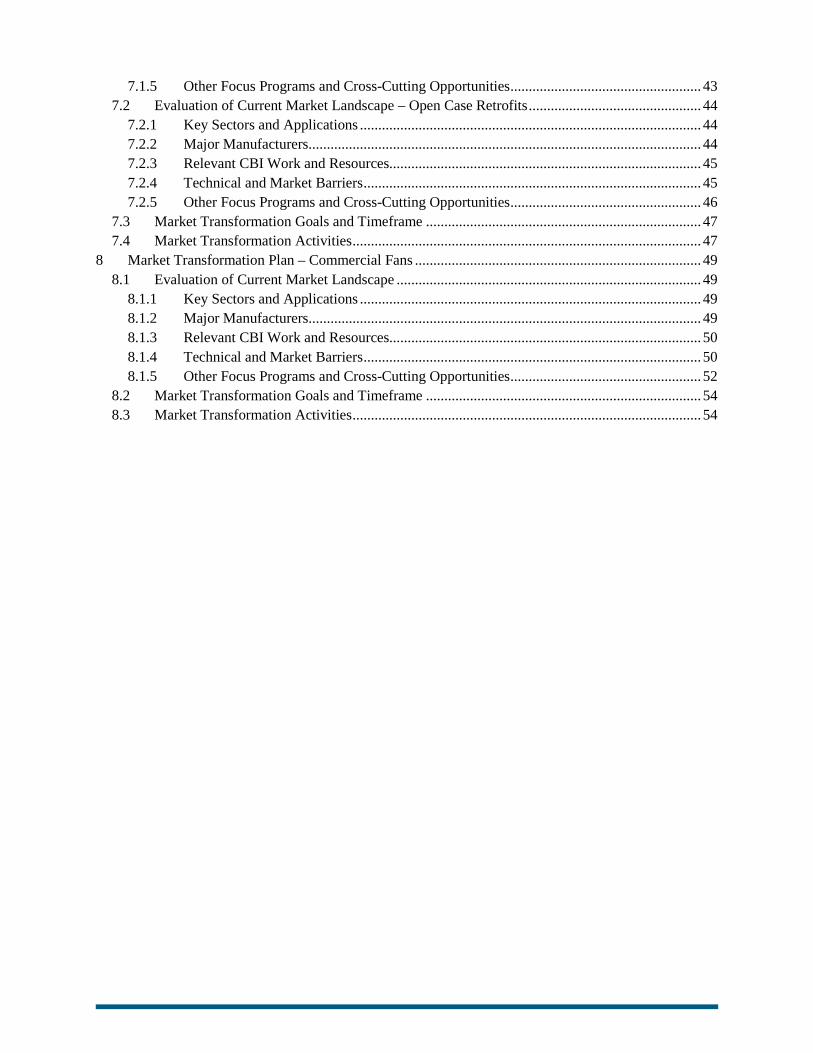
Table 2-3 through Table 2-7 below provides specific details about each of the HIT list measures and the outcomes of the HIT prioritization process. The tables include estimates of the national technical energy savings potential for each technology, along with market factor assessments on a 1-3 scale, with 3 being the highest level of opportunity, need, or interest.
3 Throughout this document, this technology area will be referred to as EMIS
HIT Background and Selection Methodology 7
HIGH IMPACT TECHNOLOGY CATALYST: 2015 MARKET TRANSFORMATION PLANS
Table 2-3: LED Troffers with Controls - Overview
Deploy high-efficiency (solid state) troffers with integrated controls.
National Primary Energy Savings
Potential
Stakeholder Interest
Criticality Of DOE Involvement
Cost-Effectiveness And Reduction
Potential
500-1000 TBtu 3 2 2 Estimated annual energy
savings if all existing fluorescent troffers were switched to LED troffers
with controls.
Stakeholders understand the high energy and cost
savings potential is attainable through lighting retrofits.
Although many efforts on LED lighting exist, the
DOE can support operators by providing
performance information, technical assistance, and
recognition for best practices to drive
adoption.
Solid state lighting prices are currently on a
downward trajectory, and further decreases are
expected.
Table 2-4: Energy Management and Information Systems/Whole Building Diagnostics - Overview
EMISs encompass a broad family of tools and services to manage commercial building energy use. These technologies include, for example, energy information systems, equipment-specific fault detection and diagnostic systems, benchmarking and utility tracking tools, automated system optimization tools, and building automation systems. National Primary Energy Savings
Potential
Stakeholder Interest
Criticality Of DOE Involvement
Cost-Effectiveness And Reduction
Potential
1000+ TBtu 2 3 2.5 Estimated annual energy savings if all commercial
buildings adopted advanced EMSs/EMISs.
CBI efforts focusing on EMISs to date have drawn significant interest from
building owners.
The market is crowded and competing data exists.
There is a strong opportunity for the DOE to play a key facilitation
role.
Systems can currently achieve desirable
paybacks; however significant volume
opportunities may still exist.
8 HIT Background and Selection Methodology

HIGH IMPACT TECHNOLOGY CATALYST: 2015 TECHNOLOGY DEPLOYMENT STRATEGIES
Table 2-5: Attachments - Overview
Demonstrate energy use reduction and other benefits arising from the use of awnings and other permanent envelope attachments.
National Primary Energy Savings
Potential
Stakeholder Interest
Criticality Of DOE Involvement
Cost-Effectiveness And Reduction
Potential
500-1000 TBtu 2 2 2.5 Estimated annual energy savings if all applicable commercial buildings
employed shading elements.
Participants in the DOE workshops and
stakeholder meetings have expressed significant
interest.
This technology is mature globally but nascent in the
U.S. The DOE can help bridge the gap to domestic
acceptance.
Technology is rare in the U.S.; thus significant
volume opportunities exist to bring down costs.
Table 2-6: Refrigeration Controls and Display Case Retrofits - Overview
Accelerate market uptake of commercial refrigeration controls and retrofit of existing open display cases with glass doors.
National Primary Energy Savings
Potential
Stakeholder Interest
Criticality Of DOE Involvement
Cost-Effectiveness And Reduction
Potential
100-500 TBtu 2 3 2 Estimated annual energy savings attributable to
refrigeration controllers and applicable open case
retrofits.
Stakeholders have exhibited interest in these
measures.
There is limited information available on
these measures and a large installed base of
target equipment.
Open case retrofits and controls often currently exhibit attractive multi-year payback periods.
Table 2-7: Commercial Fans - Overview
Assist commercial building owners in right-sizing, selection, and proper deployment of commercial fans to meet ventilation needs while minimizing energy use.
National Primary Energy Savings
Potential
Stakeholder Interest
Criticality Of DOE Involvement
Cost-Effectiveness And Reduction
Potential
100-500 TBtu 2 3 2.5 Estimated annual energy savings possible through proper sizing, selection,
and application of commercial fan technologies.
Rulemaking on this technology area has
shown significant industry interest.
DOE efforts to date have suggested that there is a
shortage of sound guidance available to end users to aid in equipment
selection and use.
Proper equipment selection can increase energy efficiency with zero, or even negative,
cost on margin.
HIT Background and Selection Methodology 9

HIGH IMPACT TECHNOLOGY CATALYST: 2015 MARKET TRANSFORMATION PLANS
3 Overview of Market Transformation Plans Section 4 through Section 8 contain the respective market evaluations and market transformation strategies for each of the five HITs. The function of these sections is to lay out the market landscape for the technology at the time of its selection as a HIT and to explain the CBI’s process for mapping out activities to support market adoption for the HIT. These sections each include the following information focusing on the subject HIT:
• A market assessment, including: o Discussion of key sectors and applications for the technology o Major manufacturers and suppliers of the HIT o Relevant DOE CBI work to date o Technical and market barriers to enhanced market uptake o A summary of programs and external efforts outside of CBI focusing on the
technology • A discussion of the target outcome of the HIT Catalyst’s involvement with the
technology—the desired market transformation goal, the metrics of success, the time frame, and the methodology for handoff of the technology-specific outcomes and products.
• A market transformation strategy, including actions tailored to the particular HIT chosen from the core Market Stimulation activities below:
o HIT Challenge: Implemented to help overcome a communication and solution delivery failure in the market—when building owners desire a specific product that is not being provided by manufacturers. The DOE organizes building owners, identifies required specifications, and helps to challenge manufacturers to meet this demand.
o HIT Demonstration: Addresses the lack of objective performance and cost data that inhibit some technologies from finding their customer base. The DOE collaborates with the General Services Administration’s Green Proving Ground and other programs to match HITs with host sites; to install and monitor the performance of a HIT in a real-world installation; and to communicate the results to the public via a case study.
o HIT Purchase Support Resources: Provides guidance on product selection for key technical and energy performance issues as buyers are developing purchasing criteria. The DOE works with purchasers, technology providers, and other stakeholders to identify technology attributes that will enable product technical and energy performance. Technical Specifications are accompanied by a demonstration and case study that supports their value. The DOE also works with potential buyers and interested utilities to define the HIT’s energy savings potential and to produce information and data to support proper incentive levels.
o HIT Application Resources: Improves the understanding of how to select, size, install, and properly operate a HIT for optimal performance and thus maximize the value of the HIT. The DOE works with designers, engineers, installers, and technicians to identify barriers and solutions to help improve these processes. In addition, in select instances the DOE will conduct training sessions to support this effort.
10 Overview of Market Transformation Plans

HIGH IMPACT TECHNOLOGY CATALYST: 2015 TECHNOLOGY DEPLOYMENT STRATEGIES
o HIT Adoption Campaign: The terminal HIT activity that incorporates many of the other resources developed via the program, such as specifications and case studies. The DOE works through strategic industry partnerships to facilitate scaled adoption, providing technical support to encourage adopters to commit to installing a HIT, and offers recognition and awards to promote participation.
The HIT Activity Decision Map, depicted below, was developed to help identify the most effective deployment activities. It serves as a visual representation of the structure of the HIT Catalyst planning methodology—how we define the Game Plan. For each HIT, the pathway of CBI’s involvement is determined using the Decision Map.
Figure 3-1: HIT Activity Decision Map
For each HIT, the starting point for market stimulation work is determined based on the status of activities undertaken to date, an assessment of the market, and a quantification of barriers to implementation and stakeholder needs. Then, based on those factors, CBI selects the appropriate core market stimulation activity for that technology. At the conclusion of that activity, the market is reassessed, the map updated, and the next applicable activity initiated. This process is conducted iteratively until CBI’s goal for the technology is achieved. The starting position of the technology and optimal activity flow to achieve CBI’s goal for that technology result in a unique, custom pathway for each HIT while holding core activities for consistency and standardization, which help set expectations over time.
START: Can the HIT be purchased?
YesNo
HIT Challenge HIT Demonstration
HIT Purchase Support
Resources
HIT Application Resources
HIT Adoption Campaign
Does the marginal cost meet payback thresholds (<5 years for most products)?
Yes
No
Are sufficient, objective demonstration data available?
Have stakeholders provided feedback on the HIT or has a market assessment been completed?
Yes
NoQuery stakeholders Will adoption
information influence increased efficiency?
What are the main barriers to adoption?
Financial / Purchase
Operational / Design
Are partners, resources, data and incentives available to drive and track cost-effective adoption?
Yes
Yes
No
No
Hand off to Utility
Programs
Yes
NoYesNo
Emerging Technologies
Program
Will manufacturers commit to voluntarily innovate their product line based on end-user demand?
Lock In Savings
Pre-market Activities Market Stimulation Activities Late Market
Activities
No Major Barriers
End OR
Back to Emerging
Technologies to drive
additional innovation
Overview of Market Transformation Plans 11

HIGH IMPACT TECHNOLOGY CATALYST: 2015 MARKET TRANSFORMATION PLANS
4 Market Transformation Plan – LED Troffers and Controls
4.1 Evaluation of Current Market Landscape
4.1.1 Key Sectors and Applications LED troffers and controls have applications in all sectors of commercial buildings and provide opportunities for significant energy savings. Lighting accounts for approximately 20% of commercial building energy consumption. The majority of commercial buildings use florescent lighting fixtures; in 2010, florescent lighting systems accounted for over 75% of commercial building lighting.4 The most common commercial lighting fixtures include 1'x4', 2'x4' and 2'x2' recessed lighting troffers. These are the fixtures being focused on in the DOE’s newly-launched Interior Lighting Campaign5. In 2015, the DOE estimated that 50% of commercial lighting fixtures were 1'x4', 2'x4', or 2'x2' recessed lighting troffers that operate for more than 10 hours per day (on average) and consume more than 96.7 TWh of electricity annually.6 LED troffer technologies have the potential to provide up to 60% energy savings in typical commercial office building applications. Energy savings can reach up to 75% if lighting control systems (such as timers, motion sensors, or daylighting sensors) are incorporated. Savings associated with lighting controls can be particularly high in intermittently occupied spaces. 6, 7, 8 A broad range of LED troffer and control technologies are available for both new construction and retrofit applications. There are varying degrees of retrofit options for installing LED technologies in existing buildings, including replacing the lamp with an LED lamp, replacing the lamp and other luminaire components with an LED retrofit kit, or replacing the entire luminaire with a luminaire designed for LED lamps, including integrated control sensors. Although adoption of LED troffers has been increasing steadily, Figure 4-1 shows that LED technology still represents less than 2% of current installed base of linear fixtures in commercial buildings.10
4 Solid-State Lighting Technology Fact Sheet, DOE Building Technologies Office, available at: http://apps1.eere.energy.gov/buildings/publications/pdfs/ssl/led_troffer-upgrades_fs.pdf 5 https://www4.eere.energy.gov/alliance/activities/technology-solutions-teams/lighting-electrical/interior-lighting-campaign 6 DOE Commercial Building Energy Alliance, 2012 Annual Report, Available at: http://apps1.eere.energy.gov/buildings/publications/pdfs/alliances/cbea_annual_report_2012.pdf 7 A 2015 compilation of data from 16 lighting control demonstration sites showed an average use reduction across all sites of 46%. 8 LED Lighting - The New Low-hanging Fruit in a Lighting (R)evolution, Kyle Hemmi, Available at: http://www.clearesult.com/eeroundup-2014-presentations/LED-lighting.pdf
12 Market Transformation Plan – LED Troffers and Controls

HIGH IMPACT TECHNOLOGY CATALYST: 2015 TECHNOLOGY DEPLOYMENT STRATEGIES
Figure 4-1: Composition of Linear Fixture Installed Base9
4.1.2 Major Manufactures The LED troffer and controls market consists of a range of different industry players, from large multinational corporations to small startup companies. Many of the larger players provide holistic lighting solutions including troffers, lamps, and controls for all of the major lighting types; alternatively, many of the smaller companies focus only on specific technologies or products. Table 4-1 lists the major industry players in the LED lighting space and identifies each player’s target market and sector.
Table 4-1: Major Industry Players - LED Troffers and Controls4
Company Products Target Markets
GE Lighting All major lamp and luminaire technologies Global
Philips All major lamp and luminaire technologies Global
Acuity Brands Inc.
All major lamp and luminaire technologies North America
Cooper Lighting
All major lamp and luminaire technologies
Global, large U.S. focus
Cree, Inc. LED lamps and luminaires United States Finelite LED lamps and luminaires United States Hubbell Lighting, Inc.
All major lamp and luminaire technologies
North America, some international
Lutron Control technologies Global WattStopper Control technologies Global
9 Adoption of Light-Emitting Diodes in Common Lighting Applications. July 2015. Prepared by Navigant for the U.S. Department of Energy Solid-State Lighting Program. Available http://energy.gov/sites/prod/files/2015/07/f24/led-adoption-report_2015.pdf
Market Transformation Plan – LED Troffers and Controls 13

HIGH IMPACT TECHNOLOGY CATALYST: 2015 MARKET TRANSFORMATION PLANS
4.1.3 Relevant CBI Work and Resources CBI works hand-in-hand with the Solid State Lighting (SSL) Program within the BTO’s Emerging Technologies Group to support market adoption of LED lighting and control technologies. This R&D and deployment joint strategy supports a range of efforts, including demonstration projects, testing, and field studies. Although the BTO has supported many demonstrations of LED lighting technologies through its GATEWAY Demonstration Program, most of the demonstration projects focused on LED spot, exterior lighting, and other non-troffer LED types. The DOE has, however, conducted substantial research and testing on LED troffer systems. Table 4-2 summarizes some of the most relevant activities supported by CBI and the SSL team for LED troffers and controls.
Table 4-2: Snapshot of DOE Efforts Supporting Market Adoption of LED Troffers and Controls
Project Title Lead Performer Report Link Market Research on the adoption of solid-state lighting and future savings potential Navigant Consulting Link
CALiPER Report 21.4: Summary of Linear (T8) LED Lamp Testing
Pacific Northwest National Laboratory Link
Color Maintenance of LEDs in Laboratory and Field Applications
Pacific Northwest National Laboratory Link
Exploratory Study: Recessed Troffer Lighting Pacific Northwest National Laboratory Link
LED T8 Replacement Products: Seattle, Washington
Pacific Northwest National Laboratory Link
Lighting Research Group (focusing on light sources, light distribution systems, controls, and communications protocols)
Lawrence Berkeley National Laboratory Link
Measured Energy Savings from Lighting Controls at 16 Demonstration Sites
Lawrence Berkeley National Laboratory Link
LED Office Lighting and Advanced Lighting Control System Pacific Gas & Electric Link
NEEA Study on Luminaire Level Lighting Controls
Northwest Energy Efficiency Alliance Link
A Meta-Analysis of Energy Savings from Lighting Controls in Commercial Buildings
Lawrence Berkeley National Laboratory Link
The DOE also supports adoption of LED technologies through the Better Buildings Alliance, DOE’s partnership with building owners and key industry players focused on improving the energy efficiency of commercial buildings. The BBA High-Efficiency Troffer Performance Specification provides a framework for commercial building owners on best practices for selecting and installing LED lighting systems. In February 2012, the BBA released the first High-Efficiency Troffer Lighting Specification (version 3.0), which offered suggested optimal
14 Market Transformation Plan – LED Troffers and Controls

HIGH IMPACT TECHNOLOGY CATALYST: 2015 TECHNOLOGY DEPLOYMENT STRATEGIES
performance requirements for high-efficiency LED and fluorescent troffer products in the 2'x4', 2'x2', and 1'x4' configurations.10 An updated version of the specification was released in May 2015 (version 5.0).11
4.1.4 Technical and Market Barriers LED troffer and control technologies have evolved into highly advanced commercial lighting solutions; however, they still face significant barriers to adoption. The technical and market barriers known to the DOE are described in more detail in Table 4-3 below.
Table 4-3: Barriers – LED Troffers and Controls
ID Barrier Description 1 Concerns over
product inconsistency
Perceptions of quality and performance inconsistency between LED products lead to skepticism and uncertainty among commercial building owners, making them less likely to install LED technologies. Even with recent product improvements, these anecdotal concerns may remain.
2 Performance inconsistency
The performance of some LED products changes based on operating time and environmental conditions, such as ambient temperature. This can lead to potential problems with color point consistency, flickering, and glare. These issues present barriers to adoption by commercial building owners, particularly in applications that require high-quality, consistent lighting. Additional research is needed to determine what consumers’ tolerance is for variations in light color and brightness in different lighting applications.
3 Controllability The primary technical barriers in LED lighting controls include improving the quality of LED dimming controls and developing more standardized design and control strategies to increase integration of LED lighting and control technologies with other building and energy management technologies. Additionally, compatibility between both hardware and software systems is a limiting factor. Most building owners have stated that the lack of interoperability between systems has hindered building performance evaluation, thus leaving owners without a full picture of building operations. Data should be exchangeable between systems (e.g., fixture status, occupancy, energy consumption).
10 BBA High-Efficiency Troffer Lighting Specification Brochure, DOE Better Buildings Alliance, Available at: https://www4.eere.energy.gov/alliance/sites/default/files/uploaded-files/troffer_factsheet.pdf 11 https://www4.eere.energy.gov/alliance/sites/default/files/uploaded-files/high-efficiency-troffers-specification.pdf
Market Transformation Plan – LED Troffers and Controls 15

HIGH IMPACT TECHNOLOGY CATALYST: 2015 MARKET TRANSFORMATION PLANS
ID Barrier Description 4 Lack of data on
daylighting control performance
There is insufficient data on how reliably fixtures with individual or autonomous controls perform. Recent LED demonstrations have evaluated total energy performance, but few, if any, have evaluated if historical issues related to daylighting (such as hysteresis and inappropriate dimming on a per fixture or zone basis) have been solved with these new products.
5 Upfront cost Although the costs of LED technologies have dropped significantly and continue to decline, one of the single largest barriers to the adoption of LED troffers is their high upfront cost relative to legacy lighting technologies, especially in cases where LEDs incorporate performance features such as dimming, which are not valued or needed. Despite the proven short-term payback period of LEDs in some applications, the payback may still not be immediate enough for some commercial building owners.
6 Lack of awareness Lack of awareness and technical understanding are key barriers to LED adoption. Programs that provide ways to identify quality LED products have helped support market adoption thus far, but continued education, industry outreach, and awareness campaigns are needed.
7 Lack of compatibility and interoperability
LED lighting retrofit technologies are available for most applications. However, current lighting infrastructure and a lack of interchangeability in some applications still limit opportunities for LED adoption. Greater interoperability of lighting control components and more universal specifications for lighting control systems are required to maximize the energy savings potential from LED troffers and controls.
8 Lack of fully available product lines
Because of the rapid evolution of LED technologies, manufacturers can struggle to maintain complete LED product lines. This presents a barrier to adoption, as some commercial building owners are unable to find the model they require to meet a specific application.
9 Security concerns LED troffers with controls can be tied directly into building data networks to enable communication between the troffers themselves, as well as with other lighting and building systems controls. The addition of these extra devices to the network brings with it concerns over potential network security issues or the creation of unintended access points.
16 Market Transformation Plan – LED Troffers and Controls

HIGH IMPACT TECHNOLOGY CATALYST: 2015 TECHNOLOGY DEPLOYMENT STRATEGIES
4.1.5 Other Complementary Programs and Cross-Cutting Opportunities In addition to CBI’s efforts to support market adoption of LED troffers and controls, many energy efficiency organizations are also playing important roles with LED technologies. In particular, Table 4-4 summarizes some of the programs and activities that other government and non-government organizations have conducted.
Table 4-4: Snapshot of Other Efforts Supporting Adoption of LED Troffers and Controls
Provider Program Highlights Source Pacific Gas and Electric (PG&E)
• Emerging technology projects include retrofits for LED troffers with control systems in office space
• Offers many rebates for LED lighting measures • Potentially looking into rebates for troffers in the future
Link
General Services Administration (GSA) Green Proving Ground
• LED Replacement Lamps for Compact Fluorescent Lamps • LED Retrofits for Fluorescent Luminaires • Networked Lighting • LED Lighting with Integrated Controls • LED Retrofit Luminaires • Wireless Lighting Control System
Link
Federal Energy Management Program (FEMP)
• FEMP’s Promising Technologies List includes wireless lighting occupancy sensors
Link
New York State Energy Research and Development Authority (NYSERDA)
• NYSERDA conducts SSL R&D and demonstration projects Link
Northeast Energy Efficiency Partnerships (NEEP)
• NEEP is working with market players throughout the SSL industry from across North America and around the world to maximize the potential of LED technologies, including commercial lighting and controls
Link
Northwest Energy Efficiency Alliance (NEEA)
• Luminaire Level Lighting Controls Initiative • Commercial Lighting Upstream Platform/Reduced Wattage
Lamp Replacement
Link
Midwest Energy Efficiency Alliance (MEEA)
• Midwest Advanced Lighting Solutions Guide • The Lighting Utility Midwest Exchange Network (Midwest
LUMEN)
Link
Market Transformation Plan – LED Troffers and Controls 17

HIGH IMPACT TECHNOLOGY CATALYST: 2015 MARKET TRANSFORMATION PLANS
4.2 Market Transformation Goals and Timeframe CBI will collect the adoption, cost, and energy savings data through the Interior Lighting Campaign (ILC). PNNL will provide limited technical assistance necessary to facilitate the widespread adoption of advanced interior lighting applications and programs through the ILC, including energy efficiency programs and voluntary standards. Based on national widespread adoption data, CBI will work with the BTO Codes program to lock in minimum savings by improving minimum standards. Technology demonstrations, real project examples, and participation in programs will support technical and economic analysis. CBI will target the 2018 fiscal year (FY)—after 3 years of data collection—to achieve market stimulation and hand off goals. This target year will be reevaluated annually based on changing market conditions and advances in technology.
4.3 Market Transformation Activities Figure 4-2 below shows the planned market transformation pathway for LED troffers and controls.
Figure 4-2: Pathway for LED Troffers and Controls
START: Can the HIT be purchased?
YesNo
HIT Challenge HIT Demonstration
HIT Purchase Support
Resources
HIT Application Resources
HIT Adoption Campaign
Does the marginal cost meet payback thresholds (<5 years for most products)?
Yes
No
Are sufficient, objective demonstration data available?
Have stakeholders provided feedback on the HIT or has a market assessment been completed?
Yes
NoQuery stakeholders Will adoption
information influence increased efficiency?
What are the main barriers to adoption?
Financial / Purchase
Operational / Design
Are partners, resources, data and incentives available to drive and track cost-effective adoption?
Yes
Yes
No
No
Hand off to Utility & AS Programs
Yes
NoYesNo
Emerging Technologies
Program
Will manufacturers commit to voluntarily innovate their product line based on end-user demand?
No Major Barriers
LED TROFFERS AND CONTROLS
18 Market Transformation Plan – LED Troffers and Controls

HIGH IMPACT TECHNOLOGY CATALYST: 2015 TECHNOLOGY DEPLOYMENT STRATEGIES
In FY14, the DOE launched LED troffers and controls demonstrations with the Northeast Energy Efficiency Partnership. In FY15, the DOE outlined out a joint R&D/deployment strategy for lighting controls to ensure that R&D aligns with and reflects outcomes of concurrent deployment work. The DOE has developed and published an updated troffer procurement specification with partners in the BBA. CBI will focus on leveraging the adoption trajectory of LED troffers to drive the incorporation of controls for an added 20%–40% energy savings.
• Adoption Campaign: The BBA’s Interior Lighting Campaign (ILC) is an adoption campaign kicking off in the spring of 2015 with the DOE, the Building Owners and Managers Association (BOMA), the International Facility Management Association (IFMA), the Illuminating Engineering Society (IES), and the GSA as organizing partners. In the first year, the ILC will provide resources, assistance, and recognition for best practices in the application of high-efficiency troffer systems. The campaign will follow the structure of pre-existing, successful technology adoption campaigns (Lighting Energy Efficiency in Parking [LEEP] and the Advanced Rooftop Campaign). The HIT Catalyst will have little strategic oversight or day-to-day management responsibility for the ILC. Of note, the ILC promotes the adoption of troffer controls as a best practice for participating in the campaign. LEEP Campaign results show the widespread use of controls to achieve the highest energy savings applications12. Control resources that apply to LED troffer lighting will be included in the ILC suite of resources as they become available through GSA, NEEP, utility programs and other internal and external activities.
• Demonstration of Controls Energy Savings: Much foundational work, including demonstrations, has examined the energy savings of LED troffers. However, significantly less research touches on which controls strategies can cost-effectively multiply energy savings. The GSA’s Green Proving Ground program recently released the results of several lighting controls demonstrations that verify 20%–40% more energy savings than with a troffer retrofit alone. The NEEP is also examining these issues in FY2015 and FY2016 as part of the Advanced Lighting Controls demonstration program. As case studies are developed, their findings will be disseminated through the BBA’s ILC. Finally, the Northwest Energy Efficiency Alliance (NEEA) is conducting assessments of luminaire level controls to identify the granularity necessary to balance energy savings with cost of lighting control systems.
12 University of Minnesota achieved 89% energy savings by upgrading its lighting equipment and controls in one parking garage. The addition of controls in one parking structure lead to an additional 28% energy savings at that facility.
Market Transformation Plan – LED Troffers and Controls 19

HIGH IMPACT TECHNOLOGY CATALYST: 2015 MARKET TRANSFORMATION PLANS
5 Market Transformation Plan – Energy Management and Information Systems (EMIS)
5.1 Evaluation of Current Market Landscape
5.1.1 Key Sectors and Applications The market for building controls, information, and management systems is large and growing rapidly. The scope of technologies in this market can be unclear to many parties because broad terminology is often used throughout the industry and literature. Terms such as energy management system (EMS), energy information system (EIS), building management system (BMS), building automation system (BAS), and energy management and information system (EMIS) are often used interchangeably. CBI’s efforts focus on whole-building performance and low-cost/no-cost operational improvements to building systems based on continuous monitoring and commissioning. The EMIS includes the integration of control, fault detection and diagnostics (FDD), submetering, and energy information from multiple building systems to allow users to monitor and optimize the energy consumption of a whole building or a portfolio of multiple buildings. Due to the complex, overlapping, and often confusing nature of the terminology and technologies, the DOE BBA Energy Management Information Systems Technology Solutions Team (EMIS Team) has collaborated with a number of stakeholders to develop a technology classification framework13 that includes a consensus-driven definition of an EMIS. Specifically, the team uses the working definition of an EMIS to cover a broad family of tools and services used to manage commercial building energy use. These technologies include, for example, EISs, equipment-specific FDD systems, benchmarking and utility tracking tools, automated system optimization tools, and BASs. In this document, the term EMIS will be used to refer collectively to these technologies. As noted above, the potential market for EMIS is large and growing. Energy consumption across large commercial buildings (>100,000 SF) alone represents 2,425 TBtu annually.14 An EMIS can be installed either during construction of a new building or as a retrofit measure in an existing building. In both applications, the goal is to save energy through continuous monitoring of various building systems (e.g., heating, ventilation, and air conditioning [HVAC]; lighting; plug loads) and controlling these systems’ usage for optimal energy performance. EMISs often:
• Identify operational efficiency opportunities (e.g., scheduling, recommissioning, or detecting faulty equipment)
• Trend and compare building performance to historical data • Benchmark against other similar buildings • Monitor and manage peak loads and demand charges • Inform external data analytics services
13 https://www4.eere.energy.gov/alliance/sites/default/files/uploaded-files/emis-technology-classification-framework.pdf 14 U.S. Energy Information Administration Commercial Building Energy Consumption Survey. Available http://www.eia.gov/consumption/commercial/
20 Market Transformation Plan – Energy Management and Information Systems (EMIS) Energy Management and Information Systems (EMIS)
HIGH IMPACT TECHNOLOGY CATALYST: 2015 TECHNOLOGY DEPLOYMENT STRATEGIES
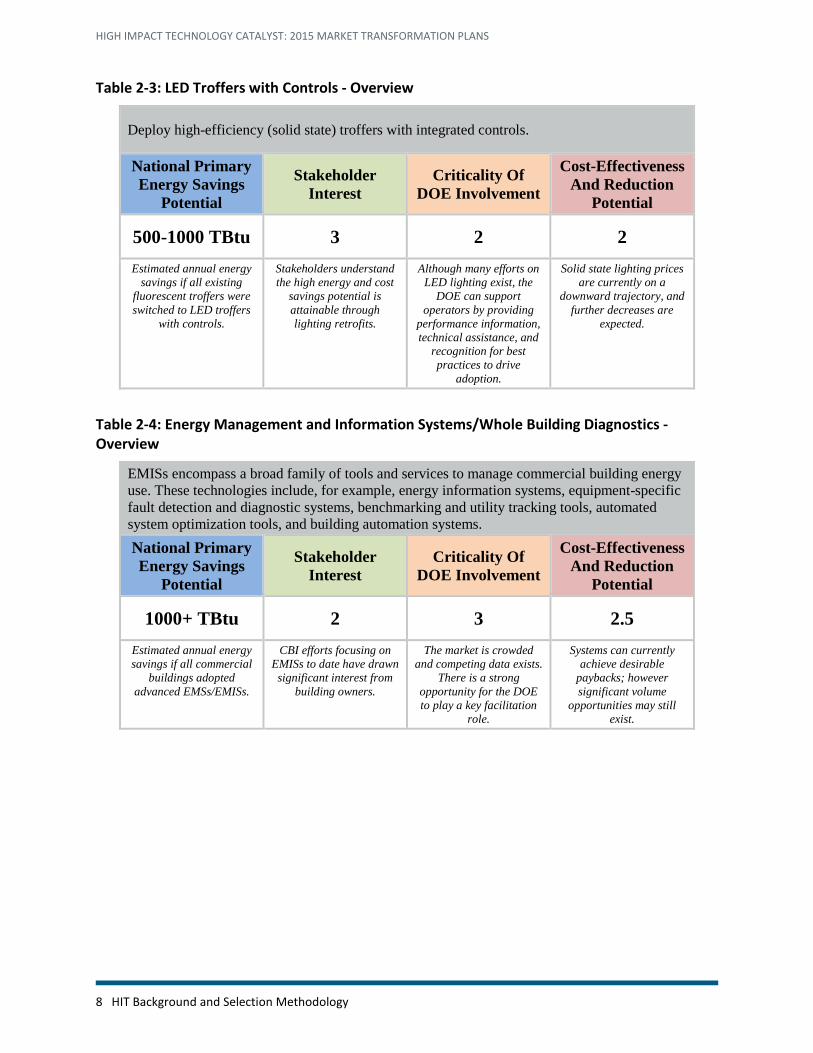
Notably, potential energy savings are heavily dependent on four major factors: (1) the features available in the EMIS, (2) the energy consumption baseline of the building prior to the installation of an EMIS, (3) the proper installation and commissioning of the EMIS, and (4) the proper long-term operation and usage of the EMIS. Some estimates suggest that proper EMIS installation and implementation can uncover up to 20% energy savings. In fact, recent case studies performed by the EMIS Team found median energy savings of 17% and 8% for individual and multiple buildings, respectively.15 Additionally, a meta-analysis by the Lawrence Berkeley National Laboratory (LBNL)16 suggested that savings attributable to an EMIS could average approximately 16% with a 1.1 year payback in line with these more recent study results. Applications for EMIS-enabled energy savings include the entire commercial building sector. Although EMIS technologies are rapidly evolving to address more technical challenges and market barriers, many mature EMIS technologies can be applied to most building systems. Available studies have indicated that EMISs are a significant and growing technology area in the United States. See Table 5-1 for current revenue estimates for just energy management products in North America by customer type. Note that the figures included in this table correspond to a general definition of “energy management systems” adopted by the study publisher; EMISs include but are not limited to the technologies included in this market study.
Table 5-1: Estimated Energy Management System Revenue by Customer Type, North America: 201517
Customer Type Units Revenue Percent
Enterprise/Office ($ Millions) $287.80 37% Government/Defense ($ Millions) 87.3 11% Retail ($ Millions) 147 19% Hospitality ($ Millions) 54.9 7% Healthcare ($ Millions) 41.3 5% Education ($ Millions) 82.1 11% Other* ($ Millions) 67.2 9% Total ($ Millions) $767.50 100% *Other: food service, warehouses, or customers that have more specialized needs
5.1.2 Major Manufacturers The EMIS market consists of an evolving list of industry players, many of which have emerged in recent years. While several large corporations offer EMIS products, the market appears diffuse with smaller players. Enabled by significant innovation in new technologies and software development, the market is changing rapidly. See Table 5-2 for an illustrative example of suppliers highlighting the diversity and breadth of offerings in the energy management
15 Better Buildings Alliance: Energy Management and Information Systems Team. “Costs and Energy-Saving Benefits of EIS.” 2013. http://eis.lbl.gov/pubs/costs-benefits-eis-11-2013.pdf 16 http://cx.lbl.gov/documents/2009-assessment/lbnl-cx-cost-benefit.pdf 17 Source: Navigant Research. “Building Energy Management Systems.” 2015
Market Transformation Plan – Energy Management and Information Systems (EMIS) 21
HIGH IMPACT TECHNOLOGY CATALYST: 2015 MARKET TRANSFORMATION PLANS
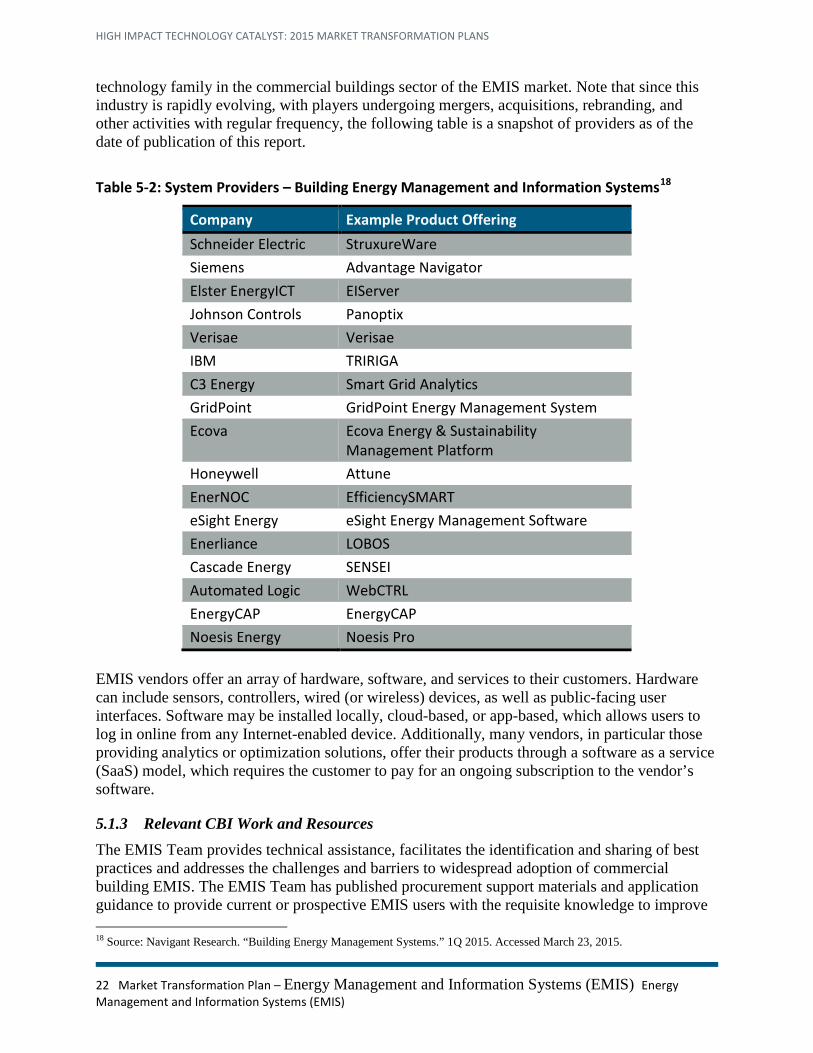
technology family in the commercial buildings sector of the EMIS market. Note that since this industry is rapidly evolving, with players undergoing mergers, acquisitions, rebranding, and other activities with regular frequency, the following table is a snapshot of providers as of the date of publication of this report.
Table 5-2: System Providers – Building Energy Management and Information Systems18
Company Example Product Offering Schneider Electric StruxureWare Siemens Advantage Navigator Elster EnergyICT EIServer Johnson Controls Panoptix Verisae Verisae IBM TRIRIGA C3 Energy Smart Grid Analytics GridPoint GridPoint Energy Management System Ecova Ecova Energy & Sustainability
Management Platform Honeywell Attune EnerNOC EfficiencySMART eSight Energy eSight Energy Management Software Enerliance LOBOS Cascade Energy SENSEI Automated Logic WebCTRL EnergyCAP EnergyCAP Noesis Energy Noesis Pro
EMIS vendors offer an array of hardware, software, and services to their customers. Hardware can include sensors, controllers, wired (or wireless) devices, as well as public-facing user interfaces. Software may be installed locally, cloud-based, or app-based, which allows users to log in online from any Internet-enabled device. Additionally, many vendors, in particular those providing analytics or optimization solutions, offer their products through a software as a service (SaaS) model, which requires the customer to pay for an ongoing subscription to the vendor’s software.
5.1.3 Relevant CBI Work and Resources The EMIS Team provides technical assistance, facilitates the identification and sharing of best practices and addresses the challenges and barriers to widespread adoption of commercial building EMIS. The EMIS Team has published procurement support materials and application guidance to provide current or prospective EMIS users with the requisite knowledge to improve
18 Source: Navigant Research. “Building Energy Management Systems.” 1Q 2015. Accessed March 23, 2015.
22 Market Transformation Plan – Energy Management and Information Systems (EMIS) Energy Management and Information Systems (EMIS)

HIGH IMPACT TECHNOLOGY CATALYST: 2015 TECHNOLOGY DEPLOYMENT STRATEGIES
operational efficiency through the effective use of EMIS. These documents also aim to equip prospective EMIS adopters with the required information to understand the energy saving potential of and potential business case for EMISs. See Table 5-3 for a summary of EMIS information currently available through the BBA.
Table 5-3: Better Buildings Alliance EMIS Information
Name Lead Performer Report Link General EIS
Energy Information Handbook LBNL/BBA EMIS Team Link Energy Information Systems: State of the Technology and User Case Studies
LBNL/BBA EMIS Team Link
Food Service EMS Energy Management Systems for Food Service Applications
BBA Food Service Team Link
Making a Business Case for EIS EIS Business Case LBNL/BBA EMIS Team Link Costs and Energy Saving Benefits of EIS Webinar Presentation LBNL/BBA EMIS Team Link
Costs and Energy Saving Benefits of EIS report LBNL/BBA EMIS Team Link
Implementing EMIS EMIS Technology Classification Framework LBNL/BBA EMIS Team Link
EMIS Crash Course LBNL/BBA EMIS Team Link Synthesis of EMIS Resources LBNL/BBA EMIS Team Link Regional Guide to EMIS Incentives LBNL/BBA EMIS Team Link
EMIS Specification and Procurement Support Materials LBNL/BBA EMIS Team Link
Market Transformation Plan – Energy Management and Information Systems (EMIS) 23
HIGH IMPACT TECHNOLOGY CATALYST: 2015 MARKET TRANSFORMATION PLANS
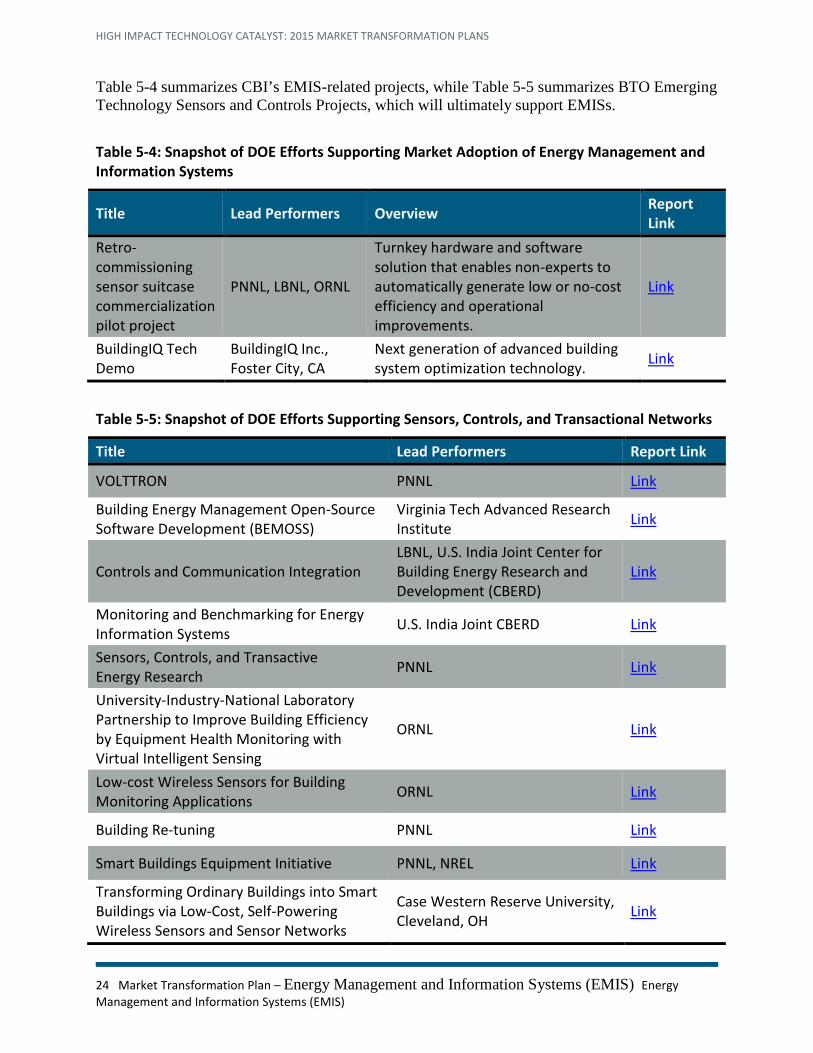
Table 5-4 summarizes CBI’s EMIS-related projects, while Table 5-5 summarizes BTO Emerging Technology Sensors and Controls Projects, which will ultimately support EMISs.
Table 5-4: Snapshot of DOE Efforts Supporting Market Adoption of Energy Management and Information Systems
Title Lead Performers Overview Report Link
Retro-commissioning sensor suitcase commercialization pilot project
PNNL, LBNL, ORNL
Turnkey hardware and software solution that enables non-experts to automatically generate low or no-cost efficiency and operational improvements.
Link
BuildingIQ Tech Demo
BuildingIQ Inc., Foster City, CA
Next generation of advanced building system optimization technology. Link
Table 5-5: Snapshot of DOE Efforts Supporting Sensors, Controls, and Transactional Networks
Title Lead Performers Report Link
VOLTTRON PNNL Link
Building Energy Management Open-Source Software Development (BEMOSS)
Virginia Tech Advanced Research Institute Link
Controls and Communication Integration LBNL, U.S. India Joint Center for Building Energy Research and Development (CBERD)
Link
Monitoring and Benchmarking for Energy Information Systems U.S. India Joint CBERD Link
Sensors, Controls, and Transactive Energy Research PNNL Link
University-Industry-National Laboratory Partnership to Improve Building Efficiency by Equipment Health Monitoring with Virtual Intelligent Sensing
ORNL Link
Low-cost Wireless Sensors for Building Monitoring Applications ORNL Link
Building Re-tuning PNNL Link
Smart Buildings Equipment Initiative PNNL, NREL Link
Transforming Ordinary Buildings into Smart Buildings via Low-Cost, Self-Powering Wireless Sensors and Sensor Networks
Case Western Reserve University, Cleveland, OH Link
24 Market Transformation Plan – Energy Management and Information Systems (EMIS) Energy Management and Information Systems (EMIS)
HIGH IMPACT TECHNOLOGY CATALYST: 2015 TECHNOLOGY DEPLOYMENT STRATEGIES
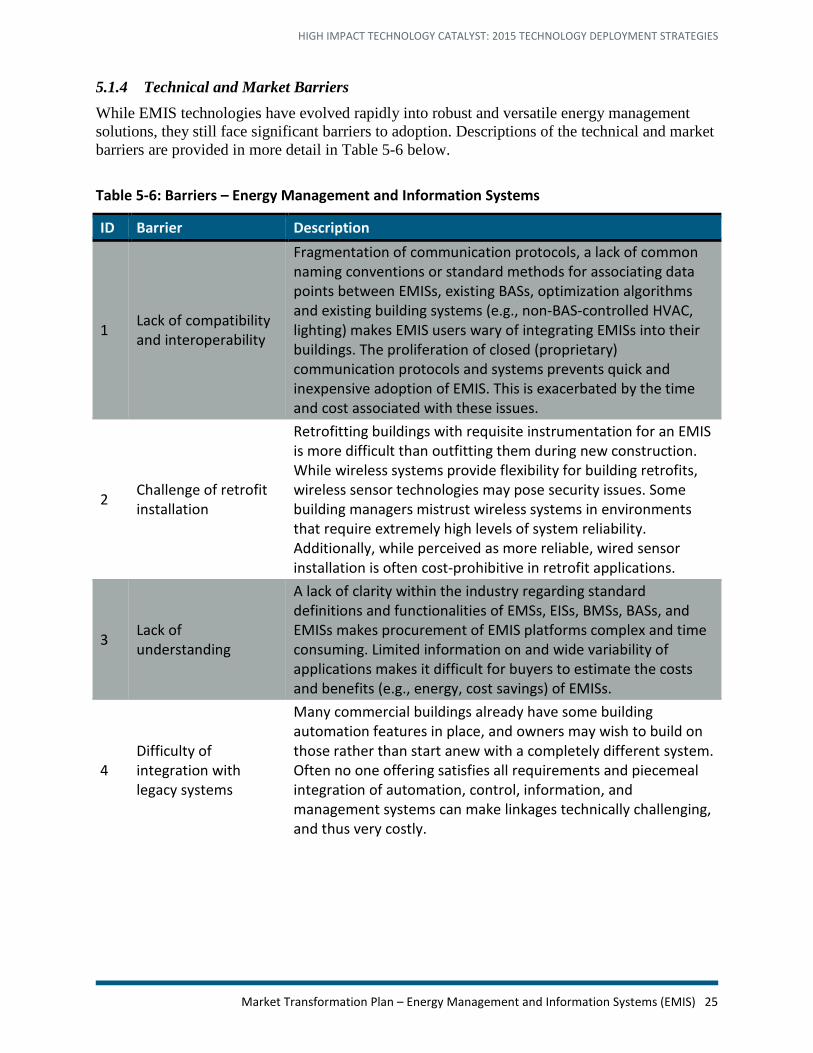
5.1.4 Technical and Market Barriers While EMIS technologies have evolved rapidly into robust and versatile energy management solutions, they still face significant barriers to adoption. Descriptions of the technical and market barriers are provided in more detail in Table 5-6 below.
Table 5-6: Barriers – Energy Management and Information Systems
ID Barrier Description
1 Lack of compatibility and interoperability
Fragmentation of communication protocols, a lack of common naming conventions or standard methods for associating data points between EMISs, existing BASs, optimization algorithms and existing building systems (e.g., non-BAS-controlled HVAC, lighting) makes EMIS users wary of integrating EMISs into their buildings. The proliferation of closed (proprietary) communication protocols and systems prevents quick and inexpensive adoption of EMIS. This is exacerbated by the time and cost associated with these issues.
2 Challenge of retrofit installation
Retrofitting buildings with requisite instrumentation for an EMIS is more difficult than outfitting them during new construction. While wireless systems provide flexibility for building retrofits, wireless sensor technologies may pose security issues. Some building managers mistrust wireless systems in environments that require extremely high levels of system reliability. Additionally, while perceived as more reliable, wired sensor installation is often cost-prohibitive in retrofit applications.
3 Lack of understanding
A lack of clarity within the industry regarding standard definitions and functionalities of EMSs, EISs, BMSs, BASs, and EMISs makes procurement of EMIS platforms complex and time consuming. Limited information on and wide variability of applications makes it difficult for buyers to estimate the costs and benefits (e.g., energy, cost savings) of EMISs.
4 Difficulty of integration with legacy systems
Many commercial buildings already have some building automation features in place, and owners may wish to build on those rather than start anew with a completely different system. Often no one offering satisfies all requirements and piecemeal integration of automation, control, information, and management systems can make linkages technically challenging, and thus very costly.
Market Transformation Plan – Energy Management and Information Systems (EMIS) 25

HIGH IMPACT TECHNOLOGY CATALYST: 2015 MARKET TRANSFORMATION PLANS
ID Barrier Description
5 High costs
Costs are coming down and many solutions are cost-effective for large owners and enterprises, but because EMIS software is often sold as SaaS, some users must commit to subscription costs.19 In addition, building owners may need to shoulder the costs of IT support in the event of EMIS faults or failures (e.g., lack of wireless connectivity, failed sensors, software support) depending on the terms of their particular agreement. A key barrier to adoption is that the systems are perceived as too expensive in smaller buildings and are not used at all. In small buildings, EMIS hardware is still as expensive as for larger buildings, but the dollar value of the energy savings is not as high due to the smaller footprint. Therefore, small building operators face lower return on investment.
6
Lack of awareness regarding performance optimization
EMIS-related energy savings can depend heavily on the technical competency and understanding of the EMIS user. Poor or unexpected user behavior can squander the energy savings and persistence of an EMIS optimization. Thus, training that focuses on how to evaluate, use, and maintain performance improvements from an EMIS is required for further adoption and impact.
5.1.5 Other Focus Programs and Cross-Cutting Opportunities In addition to CBI’s efforts to support market adoption of EMISs, many other organizations also support EMIS technologies. For a comprehensive and interactive guide on EMIS incentives, refer to LBNL’s Regional Guide to EMIS Incentives, which provides a state-by-state summary of utility and government incentive programs for various types of EMSs. In addition, Table 5-7 summarizes some of the programs and activities that other government and non-government organizations have conducted in support of EMIS.
19 Note: these costs are independent of installing any building automation, FDD, or other monitoring functions. Source: Costs and Energy Saving Benefits of EIS Webinar Presentation, http://eis.lbl.gov/
26 Market Transformation Plan – Energy Management and Information Systems (EMIS) Energy Management and Information Systems (EMIS)

HIGH IMPACT TECHNOLOGY CATALYST: 2015 TECHNOLOGY DEPLOYMENT STRATEGIES
Table 5-7: Snapshot of Other Programs Supporting Adoption of Energy Management and Information Systems
Provider Program Highlights Source
Consortium for Energy Efficiency
• Commercial Whole Building Performance Programs – focusing on continuous energy improvement and EMISs Link
California Commissioning Collaborative
• The Building Performance Tracking Handbook: Continuous Improvement for Every Building
o Introductory handbook on performance tracking for property managers, energy managers, and facilities engineers
Link
Public Interest Energy Research Program (PIER, California Energy Commission)
• Automated HVAC Fault Detection and Diagnostic (FDD) Commercialization Program
o Project team works with major manufacturers to develop systems and controls
o Includes field demonstrations to document energy performance and cost advantages of the systems
o HVAC Fault Detection and Diagnostics Tool marketed by Architectural Energy Corporation was demonstrated at UC and CSU sites
Link
Northwest Energy Efficiency Alliance (NEEA)
• Inventory of Commercial and Industrial EMIS for M&V Applications
Link
National Renewable Energy Laboratory (NREL)
• Simulation of Energy Management Systems in EnergyPlus
Link
Argonne National Laboratory (ANL)
• Proactive Energy Management for Next-Generation Building Systems
Link
American Council for an Energy Efficient Economy (ACEEE)
• Coordinating Fault Detection, Alarm Management, and Energy Efficiency in a Large Corporate Campus
Link
New York State Energy Research and Development Authority (NYSERDA)20
• Control and Building Automation Systems o Provides guidance to help commercial building
owners make energy efficiency improvements that measurably reduce energy costs and improve return on investments
Link
20 Also see NYSERDA’s proposed Real Time Energy Management strategy, included in the Clean Energy Fund Supplemental Filing on June 25, 2015.
Market Transformation Plan – Energy Management and Information Systems (EMIS) 27

HIGH IMPACT TECHNOLOGY CATALYST: 2015 MARKET TRANSFORMATION PLANS
5.2 Market Transformation Goals and Timeframe CBI will track national adoption, cost, and energy savings data starting in 2017, and will use this data as technical support to facilitate widespread EMIS applications and programs. Based on national widespread adoption data, we will lock in savings by improving minimum standards. Technology demonstrations, real project examples, and participation in programs will support technical and economic analysis. Scoping and planning commenced in the 2015 fiscal year to carefully define and bound future market transformation activities. CBI will target the 2018 fiscal year to launch a campaign to track the adoption of EMIS-based building performance and efficiency improvements. Target timeframes will be reevaluated based on changing market conditions and advances in technology.
5.3 Market Transformation Activities Figure 5-1 below shows the planned market transformation pathway for EMIS.
Figure 5-1: Pathway for Energy Management Information Systems
START: Can the HIT be purchased?
YesNo
HIT Challenge HIT Demonstration
HIT Purchase Support
Resources
HIT Application Resources
HIT Adoption Campaign
Does the marginal cost meet payback thresholds (<5 years for most products)?
Yes
No
Are sufficient, objective demonstration data available?
Have stakeholders provided feedback on the HIT or has a market assessment been completed?
Yes
NoQuery stakeholders Will adoption
information influence increased efficiency?
What are the main barriers to adoption?
Financial / Purchase
Operational / Design
Are partners, resources, data and incentives available to drive and track cost-effective adoption?
Yes
Yes
No
No
Hand off to Utility & AS Programs
Yes
NoYesNo
Emerging Technologies
Program
Will manufacturers commit to voluntarily innovate their product line based on end-user demand?
No Major Barriers
ENERGY MANAGEMENT INFORMATION SYSTEMS
28 Market Transformation Plan – Energy Management and Information Systems (EMIS) Energy Management and Information Systems (EMIS)

HIGH IMPACT TECHNOLOGY CATALYST: 2015 TECHNOLOGY DEPLOYMENT STRATEGIES
CBI has supported a number of efforts to date focusing on EMIS and related technologies. A few of these included:
• Wireless submetering challenge
• Monitoring-based commissioning sensor suitcase
• BBA EMIS procurement support materials
• FDD demonstrations
• Building re-tuning (both for BAS-controlled buildings and those without a BAS) CBI will build on this history of focused technology support by conducting the following activities in FY2015 through FY2019.
• Assess the national EMIS landscape, scope pathways to drive and track adoption, define trackable metrics and goals, laying the groundwork for the specific deployment steps as follows.
• Partner with utilities and other deployment partners to identify the resource and informational requirements to test measures and strategies for operational efficiency, FDD, and monitoring-based commissioning; utilize laboratory facilities and real building examples, as applicable, to verify EMIS applications that meet requirements as identified by partners.
• Utilize results from laboratory tests and real building projects to develop additional application and operations guidance and training resources, streamlining adoption by simplifying EMIS selection and implementation.
• Publish case studies to disseminate public, independently reviewed data on real project savings, costs, and adoption rates to inform best practices and increase adopter confidence.
• Work with partners (national laboratories, regional energy efficiency organizations [REEOs], utilities, and equipment providers) to begin defining key strategies, specific tasks and implementers of activities targeted at market transformation.
• Launch an Adoption Campaign starting in FY2017/18 to track adoption, costs, and energy savings associated with monitoring-based performance improvements as driven by building EMISs. This campaign will be based off of lessons learned through the successful pre-existing LEEP Campaign, the Advanced RTU Campaign, and the ILC. Campaign data and information will be used to support the development of energy efficiency programs and voluntary standards.
Market Transformation Plan – Energy Management and Information Systems (EMIS) 29

HIGH IMPACT TECHNOLOGY CATALYST: 2015 MARKET TRANSFORMATION PLANS
6 Market Transformation Plan – Attachments
6.1 Evaluation of Current Market Landscape
6.1.1 Key Sectors and Applications Attachments provide cost-effective and simple methods to modulate solar heat gains, and thus space conditioning load, while maintaining visible transmittance, minimizing glare, and controlling or modulating daylight, thereby enabling the reduction of electric lighting loads. Some attachments, such as storm windows, can also reduce overall window U-factor and in certain cases mitigate infiltration loads. Attachments may be applied inside the building, between glazing, outside of the building, or to skylights. They are applicable in both new and retrofit construction, in all climates, and for virtually all commercial building types. The industry is well-developed in Europe, with sales that approximate new window sales. While interior devices are common in the United States, the field of external devices, which have tremendous potential, is largely unknown in the country. The Attachments Energy Rating Council (AERC) is a newly formed public interest program consisting of a broad range of stakeholder representatives and initially supported by the DOE that seeks to certify, standardize, and disseminate rating information pertaining to this suite of technologies. Markets today are fundamentally limited by a lack of efficient systems solutions, lack of accurate performance data (and tools to select from and optimize those solutions), and lack of skilled expertise to install and maintain. All of these limitations increase risks and costs and result in dropped engagement. An ideal solution must be delivered to customers as an integrated system, not a list of technologies, and because these technologies come in a wide range of shapes, sizes, materials and operating strategies, it can be a huge challenge to deliver systems that meet performance expectations. Attachment technologies can be statically installed in place, or can be configured for seasonal adjustment or dynamic control to meet changing needs for energy and comfort. Dynamic control can be provided by occupants or via automated equipment. Window treatments, as window attachments are sometimes referred to, have been shown to reduce summertime solar heat gain up to 65% on south-facing windows and up to 77% on west-facing windows.21 Systems may be coplanar to the facade (Europe uses mostly coplanar shades like blinds and roller shades), or can be projecting, such as awnings, overhangs, and side fins. Operable systems can be manually operated by hand crank or motorized and automated. Roof overhangs and awnings block light from the high summer sun while admitting light from the lower winter sun, which can be beneficial for heating and lighting in colder climates.22 Operable systems, depending on the level of sophistication, can be integrated with a BMS to be operated automatically or can have autonomous unit that automatically operates them. Other benefits include potential for HVAC system downsizing in conjunction with planned upgrades or retrofits, enhancement of daylighting, and solar control if an appropriate system is selected. The
21 Energy-Efficient Window Treatments, Department of Energy, Available at: http://energy.gov/energysaver/articles/energy-efficient-window-treatments 22 Reducing Supplemental Loads, ENERGY STAR, Available at: http://www.energystar.gov/ia/business/EPA_BUM_CH7_SupLoads.pdf
30 Market Transformation Plan – Attachments

HIGH IMPACT TECHNOLOGY CATALYST: 2015 TECHNOLOGY DEPLOYMENT STRATEGIES
February 2014 DOE Building Technologies Office Windows and Building Envelope Research and Development Roadmap23 estimates that inclusion of attachments in the U.S. building stock has the potential to save 461 TBtu of primary energy. Attachments are applicable for any size commercial building. Awnings are generally inapplicable to high-rises over 10 stories due to wind and complexity of construction or structural requirements. Attachments can be incorporated either during the design of a new building or as a retrofit. Figure 6-1 illustrates the wide range of attachment options that are available for commercial buildings.
Figure 6-1: Examples of Attachments24
6.1.2 Major Manufactures The commercial building attachment industry is highly fragmented, with suppliers having varying levels of vertical integration and distribution. These range from suppliers that produce only materials (films, fabrics, etc.) to completely integrated firms that source their own materials, produce the attachments, and utilized in-house distribution networks to route products to customers. Many of these products are either provided by local vendors (possibly part of a larger distribution network), are custom-designed by an architect, or are provided by a construction materials supplier. The Window Covering Manufacturers Association (WCMA) and AERC will launch rating standards and procedures for interior and exterior attachment technologies in 2016. Table 6-1 provides a snapshot of representative industry players.
23 Available at: http://energy.gov/sites/prod/files/2014/02/f8/BTO_windows_and_envelope_report_3.pdf 24 Image sources from left to right: 1&2) http://www.wbdg.org/resources/suncontrol.php 3) http://zwhcherry916.en.ec21.com/Aluminium_Architectural_Vertical_Louver_for--5732818_5744867.html 4) http://www.homedesignfind.com/green/exterior-sun-shades-reduce-energy-use/
Market Transformation Plan – Attachments 31

HIGH IMPACT TECHNOLOGY CATALYST: 2015 MARKET TRANSFORMATION PLANS
Table 6-1: Representative Industry Players – Attachments
Company Link Allied Window Link Ametco Manufacturing Corp. Link Aristocrat Awnings Link Colt International Link Construction Specialties Link Draper Inc. Link Glen Raven Link Hansen Architectural Systems Link Hunter Douglas Link Alcoa/Kawneer Link MechoSystems Link MON-RAY Link QMotion Link Renson Link Rollac Link Rollease-Acmeda Link Ruskin Link Solar Shading Systems Link Somfy Link Sun Control Link Unicel Architectural Link Warema Link YKK Architectural Products Link
6.1.3 Relevant CBI Work and Resources Due to the lack of consistency and standardization of attachments energy performance characterizations, the DOE’s Windows and Building Envelope R&D team, through a competitive solicitation, selected to initiate a partnership with the WCMA to launch the AERC. The AERC is a public-interest independent rating, certification, labeling, and performance verification program for fenestration attachments for both residential and commercial buildings.25 In 2015, the AERC established a number of subcommittees with the objective of developing a comprehensive rating system for interior and exterior fenestration attachments and pathways to increase awareness, understanding, and adoption of attachments as an effective solar and shading management option to reduce building energy use and improve human comfort. In 2016, the AERC, working closely
25 Attachments Energy Ratings Council, - Available at: http://energy.gov/eere/buildings/downloads/attachments-energy-ratings-council
32 Market Transformation Plan – Attachments

HIGH IMPACT TECHNOLOGY CATALYST: 2015 TECHNOLOGY DEPLOYMENT STRATEGIES
with LBNL, will expand the offering of certified fenestration attachments available in the Complex Glazing Database (CGDB) and launch a Certified Product Database (CPD). The database will provide stakeholders such as architects, manufacturers, code officials, and utility program managers with credible, transparent, and actionable information to compare and select appropriate fenestration attachments for specific use cases. The DOE’s Emerging Technologies (ET) program funds the development of testing and simulation procedures to determine the shading performance of a range of attachment products at different locations, latitudes, climates and for various building conditions. Additionally, ET supports a suite of software tools and customized test facilities: EnergyPlus for annual energy impacts, WINDOW for assessing the thermal and solar optical properties of windows with shading systems, and Radiance to determine daylight impacts on lighting use and comfort. Table 6-2 summarizes some of the relevant activities that BTO has supported for attachments in commercial buildings.
Table 6-2: Snapshot of DOE Efforts Supporting Market Adoption of Commercial Building Attachments
Project Title Lead Performer Link Attachments Energy Rating Council (AERC)
• Window Covering Manufacturers Association (WCMA) Link
Lawrence Berkeley National Laboratory (LBNL)
• Advanced Windows Testbed: allows for testing of window shading technologies and measurement of their effect on solar heat gain within a controlled space.
• FLEXLAB – allows for testing of numerous building components and configurations.
• Development and verification of modeling tools to evaluate the performance of widely varying building and component designs (e.g., EnergyPlus, Radiance, WINDOW, COMFEN).
• Building Facade Solutions – conducts numerous research activities focused on windows and building exterior technologies.
Link (Windows)
Link (Facades)
6.1.4 Technical and Market Barriers Shading attachments for commercial buildings are fairly mature technologies, as evidenced by their ubiquity in European markets, but while some technical barriers have been solved, significant market barriers inhibit adoption. Table 6-3 below provides an overview of the technical and market barriers.
Market Transformation Plan – Attachments 33

HIGH IMPACT TECHNOLOGY CATALYST: 2015 MARKET TRANSFORMATION PLANS
Table 6-3: Barriers – Attachments26,27
ID Barrier Description 1 Complexity of
dynamic shading systems
Dynamic systems employ sophisticated sensors and control systems to automate operation. In Europe, there are more product options, great experience in design and installation, and lower costs; therefore the use of these dynamic systems is far more prevalent, proving that broad market acceptance is possible. In the United States, more training and education is needed to ease installation, reduce cost and complexity, and enable the adoption of existing lower-cost motors, sensors, and controls.
2 Maintenance challenges
Some shading attachments can present maintenance challenges for building owners. For example, on large commercial buildings that require window cleaning, certain types of shades could impede window cleaning operations. Additionally, some external shading types may invite nesting birds, which bring another set of maintenance issues. Attachments need to be designed and installed with building maintenance practices in mind.
3 Lack of accessible modeling tools and design information
There is a lack of accessible, functional energy assessment tools that can be used to guide decision-making and selection from among the wide variety of systems that architects can select or design for buildings. Instead, architects are often forced to rely on rules of thumb or general guidelines in order to design expensive custom systems. Functional assessment tools should also consider the relationships between shading, HVAC, and lighting energy use in order to properly qualify energy saving and return on investment.
4 Difficulty with code applications and lack of voluntary programs
Building owners and architects have expressed concerns regarding the application of code requirements which could deter the use of attachments, especially projecting attachments. Furthermore, major categories of attachments products with differing energy savings potential and trade-offs are lumped into the same code or program category. Voluntary programs offering credit for specific types of high impact attachments could dramatically improve the adoption of these technologies in new construction buildings. Without such codes or voluntary options, building owners and architects must actively navigate a complicated attachments landscape.
5 Lack of energy impact awareness
Owners and designers generally cannot easily understand the impact of solar heat gain on commercial building energy consumption and do not know to request mitigation technologies. Readily available and easy to understand/access information will
26 Windows and Building Envelope Research and Development Roadmap, DOE BTO, Available at: http://energy.gov/sites/prod/files/2014/02/f8/BTO_windows_and_envelope_report_3.pdf 27 Energy Efficient Building Envelopes Technology Roadmap, 2013, International Energy Agency, Available at: http://www.iea.org/publications/freepublications/publication/TechnologyRoadmapEnergyEfficientBuildingEnvelopes.pdf
34 Market Transformation Plan – Attachments

HIGH IMPACT TECHNOLOGY CATALYST: 2015 TECHNOLOGY DEPLOYMENT STRATEGIES
ID Barrier Description enable owners and designers to understand the impact of solar heat gain and better quantify the cost-effective benefits of shading technologies. Educating potential adopters on the synergies in energy savings possible through coordination of shading, lighting, and HVAC systems can help to better inform the business case for adopting the technology. Furthermore, long-term energy planning strategies can create more cost-effective scenarios. Owners and facility managers need best practices and guidance on longer-term phased asset replacement or retrofit strategies based on appropriate timing and budgeting, including systems trade-offs, operations and maintenance requirements, and energy savings potential.
6 Impact on aesthetic appeal and consumer acceptance
Most shading systems are designed to be aesthetically pleasing and to blend in with the overall design of the building. However, building owners may not appreciate the look of shading devices, particularly on a building that already has a distinctive style.
7 Lack of architect understanding and acceptance
Designers can incorporate attachment technologies most cost effectively during new construction or major retrofit periods (such as window replacements). Designers need best practices and guidance for optimized design. If shading systems are not sized and positioned correctly for a given building’s location and orientation, then they will not function correctly. In many climates, proper design is critical to ensuring that shading devices produce performance characteristics that increase comfort and provide desired energy savings outcomes.
8 Lack of standardization
The lack of standardization with respect to product sizes, materials, and mounting methods makes it difficult, time consuming, and costly for architects and contractors to design and install these systems. An additional barrier is the lack of interoperability between controls for these systems and controls serving other building systems such as lighting and space conditioning.
9 Operation and occupant interaction
Some types of attachments may require occupant operation or input. This is most commonly seen in the case of interior shading devices such as blinds, though it could apply to adaptive exterior technologies. In these instances, the level of demand on the occupants may serve as a barrier. Devices may not be used to their optimal profiles for solar load mitigation because of the time and effort requirements imposed upon building occupants.
Market Transformation Plan – Attachments 35

HIGH IMPACT TECHNOLOGY CATALYST: 2015 MARKET TRANSFORMATION PLANS
6.1.5 Other Focus Programs and Cross-Cutting Opportunities In addition to the DOE’s efforts to support market adoption of attachments, many other organizations are also playing important roles. Table 6-4 summarizes some of the programs and activities by other government and non-government organizations.
Table 6-4: Snapshot of Other Efforts Supporting Adoption of Attachments
Provider Program Highlights Source
Sacramento Municipal Utility District (SMUD)
• Energy Efficiency Measure Demonstrations for: o Interior and exterior shading devices and
window films o Photo- or time-activated awnings o Permanent shading devices
Link
Electric & Gas Industries Association
• GEOSmart Residential and Commercial Energy Program is a low interest loan for building upgrades, including window shading technologies
Link
Northwest Energy Efficiency Council (NEEC)
• Solar Gain Management Fact Sheet o Provides guidance on shading systems for
mitigating solar heat gain within commercial buildings
Link
Purdue University • Facade Engineering Lab allows for testing of window shading technologies including smart controls to operate shading attachments
Link
6.2 Market Transformation Goals and Timeframe CBI will work with key stakeholders and programs to develop technical and market data to support the inclusion of attachments as a measure within voluntary program offerings. Inclusion of provisions for this technology will solidify its placement as a visible option for builders and retrofitters, driving implementation. Initiatives such as the U.S. Green Building Council (USGBC) Leaders in Energy and Environmental Design (LEED) program drive early adopters to incorporate technologies into high-performance new construction. The AERC will provide consistent data for more simplified selection and application. Members of the AERC will drive standardized energy labels and messaging across the industry, which will capture attention from market leaders and early adopters in existing buildings. Data on the use of AERC resources and example applications will support expanded voluntary options.
36 Market Transformation Plan – Attachments

HIGH IMPACT TECHNOLOGY CATALYST: 2015 TECHNOLOGY DEPLOYMENT STRATEGIES
Table 6-5: Key Attachments Deployment Partners
Key Attachments Deployment Partners American Architectural
Manufacturers Association (AAMA)
American Institute of Architects (AIA)
Attachments Energy Rating Council (AERC)
U.S. Green Building Council (USGBC)
International Facility Management Association
(IFMA)
Window Covering Manufacturers Association
(WCMA) CBI will support deployment of attachment technologies using a phased approach. The goal of the AERC activity under the WCMA is to create consistent and accurate data and to make that data available for each class of devices. Commercial attachment products must first be evaluated; and performance data will then be disseminated through member organizations to the AERC. The concept is that WCMA/AERC will create a Standardized Performance Database file for products, which will allow software tools to do the analysis and/or optimization needed to adapt that shading solution for each application, orientation, etc. CBI will partner with AERC to promote the widespread use of this data and labeling system. Early demonstrations will help build confidence in the performance outcomes. Some products, such as screens and films, will be easier to implement sooner than more complex solutions like louvered overhangs or motorized shades. CBI will assess which systems to promote or demonstrate as the supporting databases are developed and the calculation procedures are validated.
6.3 Market Transformation Activities Figure 6-2 below shows the planned market transformation pathway for exterior shading measures.
Market Transformation Plan – Attachments 37

HIGH IMPACT TECHNOLOGY CATALYST: 2015 MARKET TRANSFORMATION PLANS
Figure 6-2: Pathway for Attachments
BTO has previously supported basic research into shading through the Emerging Technologies program. In 2015, CBI began preliminary scoping of the market landscape for attachments with CBEI, LBNL, Oak Ridge National Laboratory, and the AERC. CBI will begin scoping of further specific activities in FY2016:
• Initiate case studies to develop independently collected data on real project savings, costs, installation and operational factors to inform best practices and increase adopter confidence.
• Work with the organizers of the AERC to support deployment of tools and resources created through the organization and partners.
Additionally, CBEI28 is conducting a market assessment covering a variety of attachment technologies in small commercial buildings. Once this evaluation is complete, CBEI will coordinate with the AERC and DOE (ET and CBI) to evaluate the pathways to take advantage of major opportunities and resource needs to overcome significant barriers to the adoption of high impact attachment technologies. Based on the results of the CBEI assessment and AERC evaluations, the DOE will adjust the scope and nature of its deployment activities so as to ensure optimal alignment with collaborators and maximal market impact.
28 CBEI is an organization focused on generating impact in the small- and midsize commercial buildings (SMSCB) retrofit market. CBEI develops and demonstrates systems solutions in a real-world regional context for future national deployment. More information is available at http://cbei.psu.edu/
START: Can the HIT be purchased?
YesNo
HIT Challenge HIT Demonstration
HIT Purchase Support
Resources
HIT Application Resources
HIT Adoption Campaign
Does the marginal cost meet payback thresholds (<5 years for most products)?
Yes
No
Are sufficient, objective demonstration data available?
Have stakeholders provided feedback on the HIT or has a market assessment been completed?
Yes
NoQuery stakeholders Will adoption
information influence increased efficiency?
What are the main barriers to adoption?
Financial / Purchase
Operational / Design
Are partners, resources, data and incentives available to drive and track cost-effective adoption?
Yes
Yes
No
No
Hand off to Utility & AS Programs
Yes
NoYesNo
Emerging Technologies
Program
Will manufacturers commit to voluntarily innovate their product line based on end-user demand?
No Major Barriers
ATTACHMENTS
38 Market Transformation Plan – Attachments

HIGH IMPACT TECHNOLOGY CATALYST: 2015 TECHNOLOGY DEPLOYMENT STRATEGIES
7 Market Transformation Plan - Refrigeration Controls and Display Case Retrofits
7.1 Evaluation of Current Market Landscape – Refrigeration Controls
7.1.1 Key Sectors and Applications Refrigeration controls may find application in commercial buildings that use field-erected refrigeration systems, including food sales (grocery stores, supermarkets, etc.) and food service establishments. A majority of the installed base of refrigeration systems in commercial spaces is in food sales applications.29 Evidence suggests that a majority of new refrigeration systems installed at commercial establishments in the last decade have come with refrigeration controls included in the package. However, the nature of these controls varies widely from simple mechanical control valves to more modern digital and solid state systems.
Figure 7-1: Breakdown of Refrigeration Energy Use
A typical supermarket with roughly 50,000 square feet of floor area has about 60 display cases to display fresh and frozen food products, which account for between 30% and 50% of the store’s total electricity consumption. These cases may be open (typically used for fresh produce, dairy, etc.) or closed (typically used for frozen food). With the exception of some small, standalone display cases, a large majority of supermarket cases are remote-condensing units, wherein a bank of refrigerator and freezer units share a common rack of compressors and condensers that distribute refrigerant through the various cases.
29 Navigant Consulting. "Energy Savings Potential and R&D Opportunities for Commercial Refrigeration." (2009): US Department of Energy, 23 Sept. 2009. <http://apps1.eere.energy.gov/buildings/publications/pdfs/corporate/commercial_refrig_report_10-09.pdf>.
Annual Primary Energy Usage of Commercial Refrigeration Equipment
Supermarket Refrigeration Food Service Eqpt Beverage Merchandisers
Ice Machines Reach Ins Walk Ins
Market Transformation Plan - Refrigeration Controls and
Display Case Retrofits 39

HIGH IMPACT TECHNOLOGY CATALYST: 2015 MARKET TRANSFORMATION PLANS
Figure 7-2: Typical Supermarket Refrigeration System Configuration30
A variety of refrigeration control options are available to consumers. The most basic controls for a refrigeration unit make use of a single thermostat within the interior of the case to switch on or off the compressors as needed to maintain temperature. The thermostat controls the discharge air temperature, using a temperature sensor located at the exit of the honeycomb diffuser or discharge plenum. However, this basic system can limit control flexibility and increase energy consumption compared to more advanced systems that map control logic to desired temperature performance and changing conditions. Such basic systems are generally only seen on standalone, self-contained refrigeration equipment. Large remote-condensing systems use more complex controls. More accurate temperature control may be achieved by using adaptive controls to monitor and constantly adjust system parameters, such as superheat temperatures, as well as variable control systems can alter expansion valve positions (expansion valves are conventionally mechanical, requiring manual adjustment of pressure ratios). Several manufacturers also offer speed controllers for evaporator and condenser fans. Evaporator fan controllers slow down or temporarily shut off evaporator fans if they are not required to maintain cabinet temperature. Condenser fan controls allow for variable speed of the condenser fans as needed to maintain the setpoint compressor discharge head pressure. Timers, motion controls, and dimmers for display case lighting systems are simple but under-used. These systems are currently available on the market and have significant energy savings potential, especially when combined with LED technology to replace legacy fluorescent lighting. They allow display case lights to be switched off or dimmed automatically based on the time of day, customer proximity, or the ambient lighting level. Display cases also have anti-sweat heaters to prevent condensation from forming on the display case doors, frames, and walls. Monitors and control systems that run these heaters only based on the conditioned space dew
30 Image courtesy EPA GreenChill Partnership. Available at: http://www2.epa.gov/greenchill/advanced-refrigeration
40 Market Transformation Plan - Refrigeration Controls and Display Case Retrofits

HIGH IMPACT TECHNOLOGY CATALYST: 2015 TECHNOLOGY DEPLOYMENT STRATEGIES
point, as opposed to continuously, not only reduce heater electricity consumption by the heaters themselves, but also lower refrigeration electricity consumption, as less heat is emitted into the refrigerated space. Additionally, numerous offerings for defrost control are available in the marketplace, with additional research and development underway. Furthermore, refrigerant flow controls, water regulating valves (for systems utilizing water as a heat rejection medium), and refrigerant leak detection systems may also be deployed.
7.1.2 Major Manufactures A range of domestic and global manufacturers offer refrigeration controls. Typically, larger players provide complete refrigeration systems. Over the last decade, controls have increasingly been factory-installed with new refrigeration units and compressor racks. As such, many independent manufacturers of controls—such as Carel—typically produce equipment that refrigeration system manufacturers rebrand and offer either as a part of a new refrigeration system or as a retrofit through their dealer network. Due to the lack of standardization in this market, consumers may often purchase controls through the same vendor as the compressor racks and/or display cases.
Table 7-1: Major Industry Players – Refrigeration Controls
Company Products Sectors Target Markets Johnson Controls Refrigeration and air conditioning
controls All, but predominantly commercial
Global, strong U.S. focus
Honeywell Refrigeration controls All Global
Emerson Climate Technologies
Refrigeration controls, liquid line filters and driers, compressors for refrigeration units
All Global
Carel Refrigeration controls, humidifiers Commercial North America
Danfoss Refrigeration controls, compressors, refrigeration equipment, HVAC equipment
Commercial Global
GEA Refrigeration Technologies
Refrigeration controls, compressors, HVAC equipment
Commercial Global, very strong Europe/SE Asia presence
7.1.3 Relevant CBI Work and Resources Table 7-2 lists CBI activities focusing on refrigeration controls.
Market Transformation Plan - Refrigeration Controls and
Display Case Retrofits 41

HIGH IMPACT TECHNOLOGY CATALYST: 2015 MARKET TRANSFORMATION PLANS
Table 7-2: Snapshot of DOE Efforts Supporting Market Adoption of Refrigeration Controls
Project Title Report Link Refrigerated Display Case Controls (Webinar) Link
ASHRAE Refrigeration Systems Commissioning Guide, contains information on setting up and commissioning refrigeration systems with controls
Link
Grocery Store Advanced Energy Design Guide Link Commercial Buildings Resource Database - Commercial Building Partnerships Link
7.1.4 Technical and Market Barriers The market for refrigeration control systems has grown quickly, and most new refrigeration system installations now include a variety of controls. Even so, consumers face barriers to adoption. The technical and market barriers known to CBI are described in more detail in Table 7-3 below.
Table 7-3: Barriers – Refrigeration Controls
ID Barrier Description 1 Compatibility
and interoperability
Often controls are sold as OEM-branded products along with refrigeration systems. Adding or replacing controls as part of a retrofit or specifying controls separately from refrigeration racks can result in compatibility issues between the various pieces of equipment. Further complicating the issue is an absence of standardized communication protocols in this space.
2 Downtime In some cases, adding controls to existing units requires refrigeration systems to be shut down for the duration of the installation. Any downtime presents a significant barrier for consumers. Downtime also can risk perishable products if those products are not relocated.
3 Quantification of benefits
Owners and designers may find it difficult to evaluate the actual energy and cost savings that would result from installing refrigeration controls on a refrigeration system. While substantial academic literature is present, this material is often not presented in a manner in which the key takeaways are easily accessible to consumers. Furthermore, cost savings and project economics can vary significantly depending on site-specific factors.
4 Settings & optimization
The optimization of refrigeration control settings for energy savings and performance requires trained technicians to monitor and periodically refine each setting.
42 Market Transformation Plan - Refrigeration Controls and Display Case Retrofits

HIGH IMPACT TECHNOLOGY CATALYST: 2015 TECHNOLOGY DEPLOYMENT STRATEGIES
ID Barrier Description 5 Lack of
applicable information
Designers find it hard to obtain and compare quantitative data on specifications, costs, and complete product information regarding controls systems. Typically, refrigeration equipment manufacturers provide turnkey systems with embedded controls. Furthermore, these systems are usually custom-built for a given user and application. This makes it very difficult for widely applicable and publicly available information to be developed and disseminated.
6 Capital cost The cost of installing refrigeration controls includes not just the cost of the control systems and associated hardware, but also technical experts to evaluate, install, and monitor the equipment. Capital costs may be prohibitive, especially for small grocery store owners.
7 Complexity The number of products, control schemes, configurations, and interactivity levels available on the market can be confusing and intimidating for prospective adopters. This may lead to suboptimal system implementation or decisions not to utilize advanced controls at all.
7.1.5 Other Focus Programs and Cross-Cutting Opportunities Table 7-4 provides a snapshot of some of the programs and activities that support market adoption of refrigeration controls.
Table 7-4: Snapshot of Other Efforts Supporting Adoption of Refrigeration Controls
Provider Program Highlights Source Pacific Gas and Electric (PG&E)
• Refrigeration Rebate Catalog for businesses includes refrigeration control systems.
• Focus on adaptive refrigeration controls.
Link
Sacramento Municipal Utility District (SMUD)
• Energy Efficiency Measures Demonstrations for Refrigeration Controls.
• Incentives covering up to 80% of installation cost.
Link
Baltimore Gas and Electric
• Small Business Energy Solutions program provides refrigeration measures and financial incentives up to 80% of refrigeration control retrofits for customers who have billing demand of 60 kW or less.
Link
Connecticut Light and Power
• Small Business Energy Advantage Program offers an energy assessment, and incentives for control retrofits.
Link
Southern California Edison (SCE)
• Existing Building Direct Install Program provides consultation with an energy efficiency contractor to recommend refrigeration upgrades, including appropriate controls.
Link
Market Transformation Plan - Refrigeration Controls and
Display Case Retrofits 43

HIGH IMPACT TECHNOLOGY CATALYST: 2015 MARKET TRANSFORMATION PLANS
Provider Program Highlights Source Arizona Public Service (APS)
• Express Solutions program offers incentives of up to 90% of project costs for refrigeration upgrades including controls.
Link
7.2 Evaluation of Current Market Landscape – Open Case Retrofits
7.2.1 Key Sectors and Applications Most of the more than 37,00031 supermarkets and grocery stores in the United States use vertical, open display cases for fresh produce and dairy, in addition to other refrigerated beverages and products. These cases typically come in a range of standard integral lengths, between 8 and 12 feet long and featuring 3–5 decks for product display. Cases are often connected without internal partitions, forming a long, continuous bank. These banks of cases are generally served by a remote-condensing unit that supplies liquid refrigerant and discharge waste heat to the ambient environment. Open cases have no physical barrier between the refrigerated space and the store ambient air. Hence, they not only require more electricity to maintain temperatures than doored cases, but also affect the energy usage needed for space conditioning. It is estimated that a little over 10%32 of the current installed base of commercial refrigeration cases are of the medium-temperature, open type. To save energy and cut costs, stores may choose to install transparent doors on existing open cases. The DOE estimates that door retrofits on existing open cases will save between 50% and 80%33 of system electricity consumption, not including any savings in space conditioning energy use.
7.2.2 Major Manufacturers Display case door retrofit hardware is produced by a wide variety of small and large manufacturers. The market can be divided into two broad segments: 1) refrigeration system and display case OEMs that also market door retrofit components, and 2) third parties such as door manufacturers and retrofit kit manufacturers and contractors. Table 7-5 lists the major U.S. manufacturers of door retrofit systems.
31 "Supermarket Facts." Food Marketing Institute. <http://www.fmi.org/research-resources/supermarket-facts>. 32 32 Energy Conservation Program: Energy Conservation Standards for Commercial Refrigeration Equipment; Final Rule, 79 FR 17725 (March 23, 2014) (codified at 10 C.F.R. 431.66) 33 Navigant Consulting, Inc. "Guide for the Retrofitting of Open Refrigerated Display Cases with Doors." November 2012, Updated June 2013. Better Buildings Alliance, Buildings Technology Office, US Department of Energy. <http://www1.eere.energy.gov/buildings/commercial/pdfs/cbea_open_case_retrofit_guide.pdf>.
44 Market Transformation Plan - Refrigeration Controls and Display Case Retrofits

HIGH IMPACT TECHNOLOGY CATALYST: 2015 TECHNOLOGY DEPLOYMENT STRATEGIES
Table 7-5: Major Industry Players – Door Retrofits
Company Products Sectors Target Markets REMIS Retrofit Kits Commercial United States
Hillphoenix Display Cases, Doors, and Retrofit Kits
Commercial Global
Anthony International
Doors and Retrofit Kits Commercial Global
Hussmann Display Cases, Doors, and Retrofit Kits
Commercial Global
7.2.3 Relevant CBI Work and Resources BTO has supported a range of efforts to help inform potential adopters of open case retrofit technology. Table 7-6 summarizes some of the most relevant activities supported by CBI and the BBA Team for open case door retrofits.
Table 7-6: Snapshot of DOE Efforts Supporting Market Adoption of Door Retrofits
Project Title Report Link Guide for Retrofitting of Open Refrigerated Display Cases with Doors Link
Open Case Retrofit Savings Case Study: Fresh & Easy Link Open Case Retrofit Savings Calculator Link
Door Retrofits for Open Display Cases: Webinar Link Grocery Store Advanced Energy Design Guide Link Case Study: Walmart — Saving Energy, Saving Money Through Comprehensive Retrofits
Link
7.2.4 Technical and Market Barriers Many large grocery and multi-line retain chains have already started chain-wide installations of door retrofits for open cases and are minimizing the number of open cases in new installations. Even so, there remains a significant installed base of open cases with a large associated energy savings potential. Open case door retrofit technology is mature, and thus significant technical barriers are not often cited. Instead, the major remaining barriers to mass adoption are market-focused. A summary of these barriers is provided in more detail in Table 7-7 below.
Market Transformation Plan - Refrigeration Controls and
Display Case Retrofits 45

HIGH IMPACT TECHNOLOGY CATALYST: 2015 MARKET TRANSFORMATION PLANS
Table 7-7: Barriers – Open Case Retrofits
ID Barrier Description 1 Initial Cost While the lifetime energy cost savings from door retrofits typically
exceed the installation costs, some operators—often small chains with limited budgets—are deterred by the high initial cost of installing door retrofits.
2 Performance Concerns
Due to the lack of standardization, both for installation and for measurement of savings, some owners have achieved energy savings that are lower than expected.
3 Concerns Over Impacts on Sales
Some supermarket operators believe that installing glass doors on open cases will make merchandise less visible and less accessible to customers, thereby affecting product sales. This belief lingers despite the fact that some studies have shown the sales impact to be minimal or even positive, particularly when considering the value of conserved energy.34
7.2.5 Other Focus Programs and Cross-Cutting Opportunities Table 7-8 provides a snapshot of the programs and activities that support the adoption of open case door retrofits.
Table 7-8: Snapshot of Other Programs Supporting Adoption of Open Case Retrofits
Provider Program Highlights Source AVISTA Utilities • EnergySmart Grocer Rebate including a rebate of
$85/linear ft. for retrofit door installations. Link
Bonneville Power Administration
• EnergySmart Grocer Rebate including a rebate of $60/linear ft. for retrofit door installations.
Link
PG&E • EnergySmart Grocer Rebate including a rebate of $70/linear ft. for retrofit door installations.
Link
SCE • Express Energy Management Solutions incentives, offered to consumers planning to install retrofit doors, as well as those who have done so recently
Link
34 ASHRAE Journal, “Doored Display Cases – They Save Energy, Don’t Lose Sales”. Fricke, Brian A. and Bryan R. Becker. September 2010.
46 Market Transformation Plan - Refrigeration Controls and Display Case Retrofits
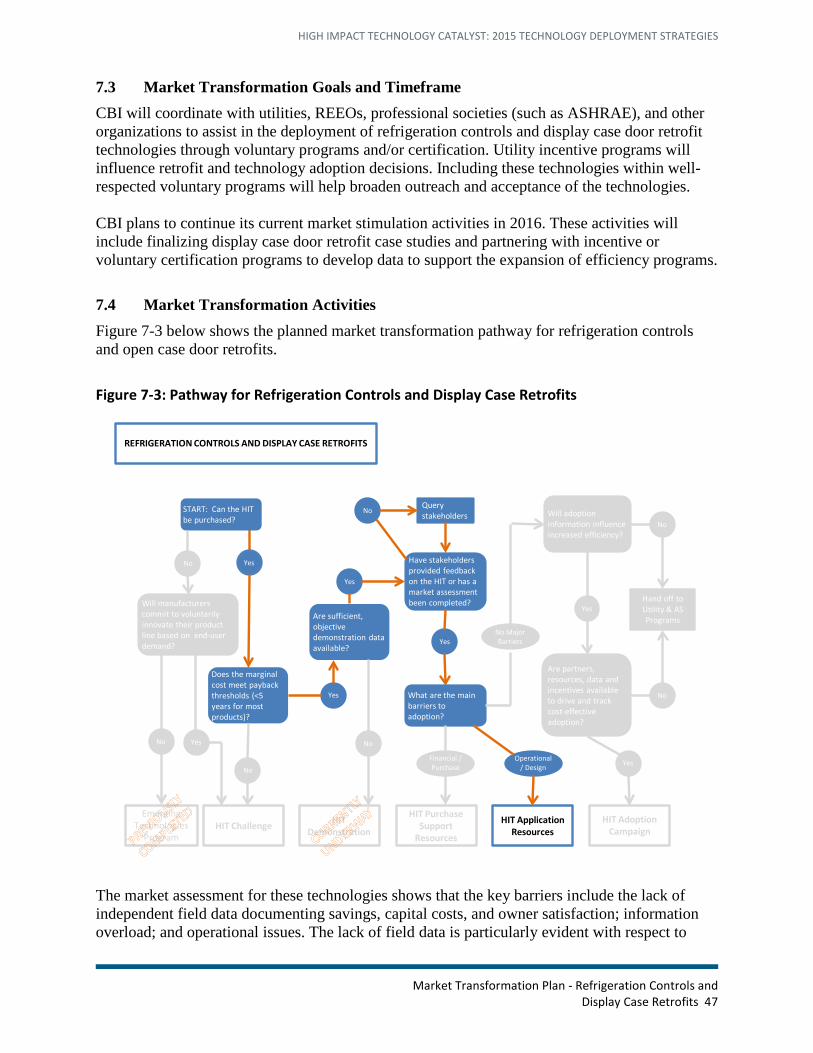
HIGH IMPACT TECHNOLOGY CATALYST: 2015 TECHNOLOGY DEPLOYMENT STRATEGIES
7.3 Market Transformation Goals and Timeframe CBI will coordinate with utilities, REEOs, professional societies (such as ASHRAE), and other organizations to assist in the deployment of refrigeration controls and display case door retrofit technologies through voluntary programs and/or certification. Utility incentive programs will influence retrofit and technology adoption decisions. Including these technologies within well-respected voluntary programs will help broaden outreach and acceptance of the technologies. CBI plans to continue its current market stimulation activities in 2016. These activities will include finalizing display case door retrofit case studies and partnering with incentive or voluntary certification programs to develop data to support the expansion of efficiency programs.
7.4 Market Transformation Activities Figure 7-3 below shows the planned market transformation pathway for refrigeration controls and open case door retrofits.
Figure 7-3: Pathway for Refrigeration Controls and Display Case Retrofits
The market assessment for these technologies shows that the key barriers include the lack of independent field data documenting savings, capital costs, and owner satisfaction; information overload; and operational issues. The lack of field data is particularly evident with respect to
START: Can the HIT be purchased?
YesNo
HIT Challenge HIT Demonstration
HIT Purchase Support
Resources
HIT Application Resources
HIT Adoption Campaign
Does the marginal cost meet payback thresholds (<5 years for most products)?
Yes
No
Are sufficient, objective demonstration data available?
Have stakeholders provided feedback on the HIT or has a market assessment been completed?
Yes
NoQuery stakeholders Will adoption
information influence increased efficiency?
What are the main barriers to adoption?
Financial / Purchase
Operational / Design
Are partners, resources, data and incentives available to drive and track cost-effective adoption?
Yes
Yes
No
No
Hand off to Utility & AS Programs
Yes
NoYesNo
Emerging Technologies
Program
Will manufacturers commit to voluntarily innovate their product line based on end-user demand?
No Major Barriers
REFRIGERATION CONTROLS AND DISPLAY CASE RETROFITS
Market Transformation Plan - Refrigeration Controls and
Display Case Retrofits 47

HIGH IMPACT TECHNOLOGY CATALYST: 2015 MARKET TRANSFORMATION PLANS
control technologies, where it is exacerbated by the extremely high amount of variation in the marketplace. To address these barriers, CBI will work to incorporate refrigeration controls as part of parallel EMIS work with building owners, equipment suppliers, and other relevant stakeholders. Activities may include gathering field performance data to elevate the confidence of building owners, utilities, and voluntary programs in these technologies. The DOE will continue to develop supporting application resources, including best-practice materials, to ensure that equipment achieves its performance potential when deployed in the field. CBI seeks to partner with utilities, regional energy efficiency organizations, or voluntary certification programs to drive adoption and track adoption metrics. These organizations are well-positioned to partner with CBI to create this data through existing member and partner bases. These entities are also positioned to provide incentives to members/customers, which will help to lower costs and hasten large-scale adoption.
48 Market Transformation Plan - Refrigeration Controls and Display Case Retrofits

HIGH IMPACT TECHNOLOGY CATALYST: 2015 TECHNOLOGY DEPLOYMENT STRATEGIES
8 Market Transformation Plan – Commercial Fans
8.1 Evaluation of Current Market Landscape
8.1.1 Key Sectors and Applications Fans are used across all sectors of the commercial building industry to provide supply, return, and exhaust air for building ventilation systems. Commercial fans are also used in process-specific applications, such as commercial kitchen exhaust hoods, and as part of cooling towers and air-cooled condensers supporting building HVAC systems. They are also embedded in packaged HVAC equipment such as rooftop units. Ventilation-related energy consumption, of which fan energy is the primary component, accounted for approximately 6% of commercial building energy consumption in 2010.35 The DOE estimates that commercial fans consume 139 billion kWh of electricity annually.36 There are energy savings opportunities available through improvements in fan selection, fan system design practices, and operational practices. Because fan power decreases as the cube of the operating speed and the maximum output of a given fan is not necessarily needed at all times of operation, the increased use of speed control has a large potential for energy savings.37
8.1.2 Major Manufacturers The commercial fan market consists of a range of different industry players from large multinational corporations to very small companies. The market is fragmented and competitive.38 Fan manufacturers generally consider fans to be commodity items, with some competitive advantages based around durability, support, and fulfillment time, depending on the application.39 Many manufacturers offer fan selection guides, fan selection software, and/or engineering capabilities to assist customers in making energy-efficient fan selections. Table 8-1 lists some of the major industry players in the commercial space.
Table 8-1: Major Industry Players – Commercial Fans4
Company Link Acme Engineering & Manufacturing Corporation Link American Coolair Corporation Link CaptiveAire Link Carnes Company Link Chicago Blower Link Cincinnati Fan Link ebm-papst Link Greenheck Fan Corporation Link
35 http://buildingsdatabook.eren.doe.gov/TableView.aspx?table=3.1.4 36 NOPD 2011 (Link) 37 Fan and Pump Systems ACEEE white paper 2002 (Link) 38 Fan and Pump Systems ACEEE white paper 2002 (Link) 39 DOE/AMCA publication: Improving Fan System Performance (2003) (Link)
Market Transformation Plan – Commercial Fans 49

HIGH IMPACT TECHNOLOGY CATALYST: 2015 MARKET TRANSFORMATION PLANS
Company Link Hartzell Air Movement Link Howden American Fan Company Link Lau Fan (Subsidiary of Ruskin) Link Loren Cook Company Link Morrison Products Link New York Blower Link PennBarry Link Soler & Palau USA Ventilation Systems Link Twin City Fan and Blower Link
8.1.3 Relevant CBI Work and Resources CBI works to support market adoption of high-efficiency commercial fan technologies. Table 8-2 lists some of the efforts in this area to date.
Table 8-2: Snapshot of DOE Efforts Supporting Market Adoption of Efficient Fan Systems
Project Title Lead Performer Report Link Higher Efficiency HVAC Motor Research QM Power Link
Improving Fan System Performance: A Sourcebook for Industry
LBNL, Resource Dynamics Corporation
Link
Fan System Assessment Tool ORNL, AMCA Link Advanced Rooftop Unit Campaign ASHRAE, Retail Industry
Leaders Association, DOE Link
Advanced Rooftop Control Retrofit Field Study PNNL Link
8.1.4 Technical and Market Barriers Highly efficient fans are available today for commercial applications; however, they still face significant barriers to adoption. The technical and market barriers known to CBI are described in more detail in Table 8-3 below.
50 Market Transformation Plan – Commercial Fans

HIGH IMPACT TECHNOLOGY CATALYST: 2015 TECHNOLOGY DEPLOYMENT STRATEGIES
Table 8-3: Barriers – Fans
ID Barrier Description 1 Sound level
constraints Commercial applications can have stringent sound level requirements in the building codes, project requirements, or both, especially in facilities such as schools and hospitals. In some cases, a tradeoff must be made between selecting the most efficient fan and ensuring that the system is able to meet these sound level requirements.
2 Size constraints In cases where there is a choice between a larger fan operating at a lower speed using less energy and a smaller fan operating at a higher RPM using more energy, the smaller fan may be selected in order to decrease the space, weight, and capital cost. This is especially true in replacement and retrofit situations where larger fans that may be more efficient may not fit in the available footprint. Additionally, there may be weight constraints based on the load-bearing capacity of the desired installation location.
3 Suboptimal system design
A fan must work against the system pressure to deliver the desired airflow in a commercial building. Suboptimal system designs not properly tailored to the specific building that they serve lead to much higher pressures than necessary, which in turn lead to fans that consume more energy. These include design practices based on estimation rather than calculation, or utilizing rules of thumb which may no longer be appropriate. Good system designs informed by the latest design practices and tools will enable energy saving fan specifications and installations.
4 Inconsistent installation and maintenance practices
Fan system installation and maintenance and operating practices can have a considerable effect on fan system energy use. Leaky or damaged ducts, clogged filters, or poor system balancing will increase system pressure, resulting in an increase in energy use to maintain the airflow. Loose belt drives or unlubricated bearings will increase the power required by the fan.
5 Upfront cost The difference in cost between the lowest upfront cost fan options and higher efficiency fan options can be considerable, as the higher efficiency options may be larger fans or more complex styles of fans (e.g., a mixed flow fan instead of a centrifugal inline fan). The upfront cost is a part of the capital budget allocated for the project, which often undergoes strict scrutiny before a project is started. In contrast, longer-term energy and operations and maintenance factors are less often considered when deciding whether or not to move forward with a project.
6 Lack of awareness and information
Lack of awareness and technical understanding, alongside lack of access to clear and concise information to drive sound purchasing decisions, are key barriers to adoption of higher efficiency fans.
Market Transformation Plan – Commercial Fans 51

HIGH IMPACT TECHNOLOGY CATALYST: 2015 MARKET TRANSFORMATION PLANS
ID Barrier Description 7 Differing incentives
for system designers and owners
Specifying engineers typically define the requirements for equipment in a particular commercial building, often competing for jobs based on first cost. This creates an incentive to design for the lowest first cost, which may preclude optimized fan system design for dynamic loads or space conditions. The design of systems for lowest first cost may include added safety factors to lower the risk of missing design requirements due to uncertainties in system design, or in later operation due to fouling effects or future capacity increases.
8 Time Investment System startup, optimization, adjustment, and maintenance can be a time-consuming process. Many site operators have a strong focus on minimizing downtime and installation time, and thus may prioritize having the system running over having it running optimally.
9 Industry inertia Decades-old “rule of thumb” fan system design and fan selection practices are still in use in many applications. These practices, including assumed static pressure loss, equal friction method duct design, and fitting loss estimation, overlook efficiency potential from technical improvements and project particulars.
8.1.5 Other Focus Programs and Cross-Cutting Opportunities Table 8-4 summarizes programs that support the market adoption of high-efficiency fan technologies and practices by other organizations outside of the DOE.
Table 8-4: Snapshot of Other Efforts Supporting Adoption of Efficient Fans
Provider Program Highlights Source U.S. General Services Administration (GSA) Green Proving Ground Program
• Conducted field research comparing the installed performance and payback period of cogged V-belts and synchronous-drive fan belts
Link
PG&E • Offers several rebates for fans and fan system measures, including Variable Frequency Drive (VFD) for HVAC fans, specific belt replacements, and certain types of demand control ventilation
Link
Efficiency Vermont
• Offers several rebates for fans and fan system measures, including VFD and ENERGYSTAR ventilation fans
Link
52 Market Transformation Plan – Commercial Fans

HIGH IMPACT TECHNOLOGY CATALYST: 2015 TECHNOLOGY DEPLOYMENT STRATEGIES
Provider Program Highlights Source Focus on Energy • Offers several rebates for fan and fan system measures,
including demand control ventilation and VFDs Link
Federal Energy Management Program (FEMP)
• FEMP’s Promising Technologies List includes: CAV to VAV installation and auto sash fume hoods
Link
New York State Energy Research and Development Authority (NYSERDA)
• Offers incentives for VFDs and demand-controlled ventilation sensors
Link
Air Movement and Control Association, International (AMCA)
• Certified Ratings Program (CRP) assures that a fan product line has been tested and rated in conformance with AMCA International’s test standards and rating requirements
o Certification label on certified equipment and its literature
o Challenge testing from competitors • Provides articles, education, and research papers to its
members and the public • Maintains and supports industry codes and standards on
fan testing and performance o Drafted fan performance requirements for
ASHRAE 90.1, the IgCC, etc.
Link
Greenheck Fan Company
• Provides in-person, online, and instructor-led courses on fan fundamentals and components
Link
SCE • Field survey of RTU Fan Efficiency and Operation Patterns, 2011-2012
• Demand control ventilation for commercial kitchen hoods project
Link
Link
PennBarry • Provides how-to guides and in-person training opportunities
Link
Twin City Fan • Provides in-person fan engineering seminars, as well as online fan engineering reference materials
Link
Chicago Blower • Offers onsite in-person seminars as well as a range of online fan engineering materials
Link
Market Transformation Plan – Commercial Fans 53

HIGH IMPACT TECHNOLOGY CATALYST: 2015 MARKET TRANSFORMATION PLANS
8.2 Market Transformation Goals and Timeframe CBI will coordinate with utilities, professional societies, industry groups, and other stakeholder organizations to encourage the use of best-practice guidance or procurement specifications by end users. Deployment through trusted channels will drive market uptake by end-user organizations. Potential deployment partners are listed in Table 8-5 below.
Table 8-5: Potential Fan Deployment Partners
Potential Fan Deployment Partners ASHRAE AMCA Air Conditioning Contractors
of America (ACCA) State and municipal utilities Sheet Metal & Air
Conditioning Contractor’s National Association
(SMACNA)
Air-Conditioning, Heating, and Refrigeration Institute
(AHRI)
CBI plans to focus on the development of application and procurement resources through the 2017 fiscal year and will collect and deploy new real building demonstration performance information as that becomes available or as late as FY2018. The DOE will track uptake and usage of new resources and information based on efficiency program participation and best practices as supplied by building owners, designers, and other stakeholder partners. The DOE will track deployment of real building demonstration data based on the efficiency levels supported by utilities for small fan motor replacements. If, in its ongoing evaluation of the market conditions and adoption, CBI determines that there is an opportunity to further accelerate market transformation for commercial fans, CBI will evaluate possible options and initiate support as appropriate.
8.3 Market Transformation Activities Figure 8-1 below shows the planned market transformation pathway for commercial fans.
54 Market Transformation Plan – Commercial Fans

HIGH IMPACT TECHNOLOGY CATALYST: 2015 TECHNOLOGY DEPLOYMENT STRATEGIES
Figure 8-1: Pathway for Commercial Fans
The market assessment for this technology has shown that current barriers lie in the procurement and operations spaces, and that major energy savings opportunities can be obtained through proper selection, design, and use of equipment. However, new research and development of fan motor technology will likely drive additional cost-effective savings in upcoming years. CBI will work with building owners, equipment suppliers, and other relevant stakeholders to develop and deploy these resources and demonstration data, helping to elevate the level of awareness and education with respect to equipment selection. The DOE will also develop supporting application resources, including best-practice materials, to ensure that equipment is utilized to its optimal performance potential once deployed in the field. After the HIT Catalyst activities are complete, CBI will hand the technology support resources off to parties that will oversee the next stage of that technology’s development and deployment in the marketplace. In the case of commercial fans, the DOE believes that the ideal partners for this stage will include regional energy efficiency organizations, industry groups, voluntary certification programs, utilities, and federal sector deployment partners. These organizations are well-aligned to disseminate the information that CBI will have developed to large target audiences utilizing their existing member/customer bases. Some of these entities may also be positioned to provide incentives to adopters, which will help to hasten large-scale adoption.
START: Can the HIT be purchased?
YesNo
HIT Challenge HIT Demonstration
HIT Purchase Support
Resources
HIT Application Resources
HIT Adoption Campaign
Does the marginal cost meet payback thresholds (<5 years for most products)?
Yes
No
Are sufficient, objective demonstration data available?
Have stakeholders provided feedback on the HIT or has a market assessment been completed?
Yes
NoQuery stakeholders Will adoption
information influence increased efficiency?
What are the main barriers to adoption?
Financial / Purchase
Operational / Design
Are partners, resources, data and incentives available to drive and track cost-effective adoption?
Yes
Yes
No
No
Hand off to Utility & AS Programs
Yes
NoYesNo
Emerging Technologies
Program
Will manufacturers commit to voluntarily innovate their product line based on end-user demand?
No Major Barriers
COMMERCIAL FANS
Market Transformation Plan – Commercial Fans 55

For more information, visit: energy.gov/buildings September 2015