High-Efficiency Buildings and Demand Response Phillip Price Mary Ann Piette Demand Response Research...
20
High-Efficiency Buildings and Demand Response Phillip Price Mary Ann Piette Demand Response Research Center Lawrence Berkeley National Laboratory
-
Upload
laurel-bailey -
Category
Documents
-
view
214 -
download
0
Transcript of High-Efficiency Buildings and Demand Response Phillip Price Mary Ann Piette Demand Response Research...

High-Efficiency Buildings and Demand Response
Phillip PriceMary Ann Piette
Demand Response Research CenterLawrence Berkeley National Laboratory

Outline1. Electric Load: why the peaks matter so much.2. What is the electricity used for; can peaks be reduced?3. Demand response: how it works, how effective is it?4. The future: beyond simply adjusting temperatures and time-
shifting usage.

Plot from Rubenstein et al., Lawrence Berkeley National Laboratory
Monthly California Peak Load Is Only Moderately Variable

California Daily Peak Loads -- 2006
0
10,000
20,000
30,000
40,000
50,000
60,000
70,000
Jan-06 Mar-06 May-06 Jul-06 Sep-06 Nov-06
MW
Residential Air Conditioning
Commercial Air Conditioning
Daily California Peak Load is Highly Variable
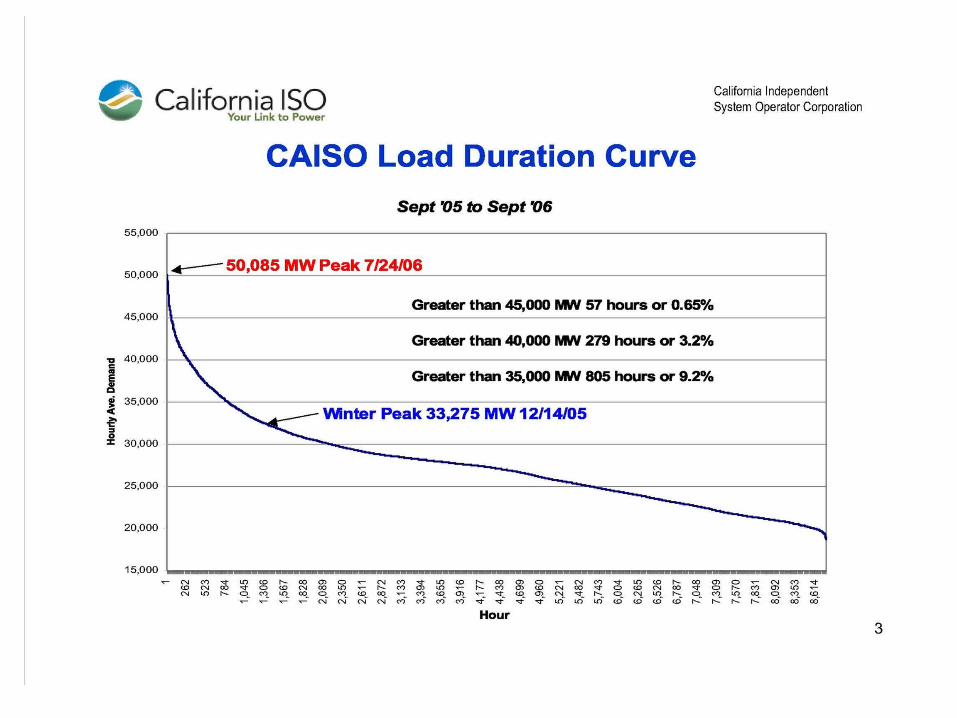

Electricity production capacity is determined by the need to meet the peak demand.
• Load shift: use electricity another time• Increase indoor temperature: “sweat and suffer.”• Reduce unimportant usage. (Why not do this all
the time?)• Eliminate/reduce high-intensity usage.

Data from a single building

Temperature-dependence dominates in many buildings

Temperature is not very predictive in some buildings

Comparison of End-Use Strategies
•
HVAC Lighting Other
Building use Glo
bal t
em
p.
adju
stm
ent
Duct
sta
tic p
res.
Incr
ea
se
SA
T Incr
ease
Fan V
FD
lim
it
CH
W te
mp
. In
crea
se
Fan q
ty. re
du
ctio
n
Pre
-co
olin
g
Coolin
g v
alv
e li
mit
Bo
iler
lock
out
Slo
w r
eco
very
Ext
end
ed s
hed p
eri
od
Com
mo
n a
rea li
ght dim
Offic
e a
rea li
ght
dim
Turn
off
light
Dim
mab
le b
alla
st
Bi-
leve
l sw
itchin
g
Non-c
ritic
al p
roce
ss s
hed
ACWD Office, lab X X X X X X XB of A Office, data center X X X X XChabot Museum X X2530 Arnold Office X X50 Douglas Office X XMDF Detention facility XEchelon Hi-tech office X X X X X X X XCenterville Junior Highschool X XIrvington Highschool X XGilead 300 Office XGilead 342 Office, Lab X XGilead 357 Office, Lab X XIKEA EPaloAlto Furniture retail XIKEA Emeryville Furniture retail XIKEA WSacto Furniture retailOracle Rocklin Office X XSafeway Stockton Supermarket XSolectron Office, Manufacture X XSvenhard's Bakery XSybase Hi-tech office XTarget Antioch Retail X XTarget Bakersfield Retail X XTarget Hayward Retail X X X XWalmart Fresno Retail X X
Global Temperature Adjustment (GTA)

Manual DR - Common Practice

DRAS Clients – 1. Software only (Smart)2. Software & Hardware
(Simple)
DR Automation Server and Client
4 Energy Management Control System (EMCS) and other systems carry out shed based on pre-programmed strategies.
3 Polling clients request price level and event data every minute
2 Price-Level and DR event signals sent on DRAS
Utility sends DR notification to DRAS1

-20%
-10%
0%
10%
20%
30%
40%
Ave
rag
e S
hed
Auto CPP Non-Auto CPP
Automated vs Manual Critical Peak Price Performance
Average CCP Peak Load Reduction
8% w/AutoDR-1% w/o AutoDR

Global Temperature Adjustment Widely Implemented
•
68.0
69.0
70.0
71.0
72.0
73.0
74.0
75.0
76.0
77.0
78.0
79.0
80.0
81.0
82.0
Customer
Tem
per
atu
re (
F)
Normal
Moderate
High
CPPAve. temp. increase (mod): 2.75 FAve. temp. increase (high): 1.88 FDBPAve. temp. increase: 2.3 F
DBP CPP one-level GTACPP two-level GTA
Ret
ail
Mus
eum
Offi
ce 1 Ret
ail 1
A
Offi
ce 3
Gov
ernm
ent 1
Ret
ail 2
Sch
ool
Lab/
Offi
ce2
Gov
ernm
ent 2
Gov
ernm
ent 3
Gov
ernm
ent 4
Ret
ail 3 O
ffice
4
Lab/
Offi
ce
Ave
rag
e
Ave
rag
e
Ave
rag
e
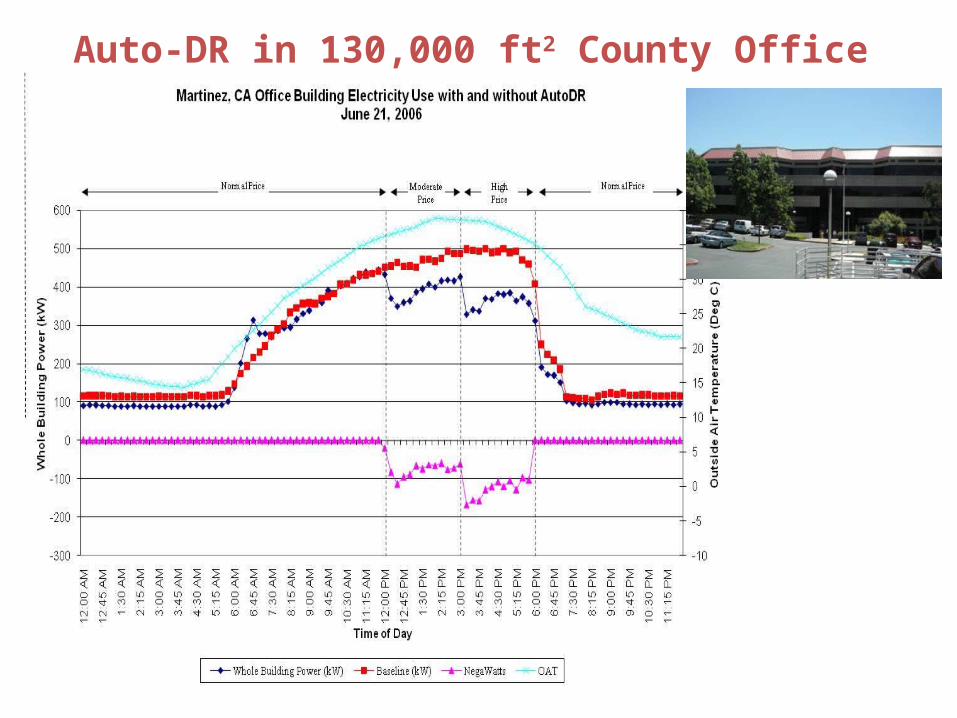
Auto-DR in 130,000 ft2 County Office

Cumulative Auto-DR Shed on 7/9/08
0
2000
4000
6000
8000
10000
12000
14000
16000
18000
20000
12:0
0 A
M
1:00
AM
2:00
AM
3:00
AM
4:00
AM
5:00
AM
6:00
AM
7:00
AM
8:00
AM
9:00
AM
10:0
0 A
M
11:0
0 A
M
12:0
0 P
M
1:00
PM
2:00
PM
3:00
PM
4:00
PM
5:00
PM
6:00
PM
7:00
PM
8:00
PM
9:00
PM
10:0
0 P
M
11:0
0 P
M
12:0
0 A
M
Wh
ole
Bu
ild
ing
Po
wer
(kW
)
CPP MA Baseline
28 Industrial and commercial sites

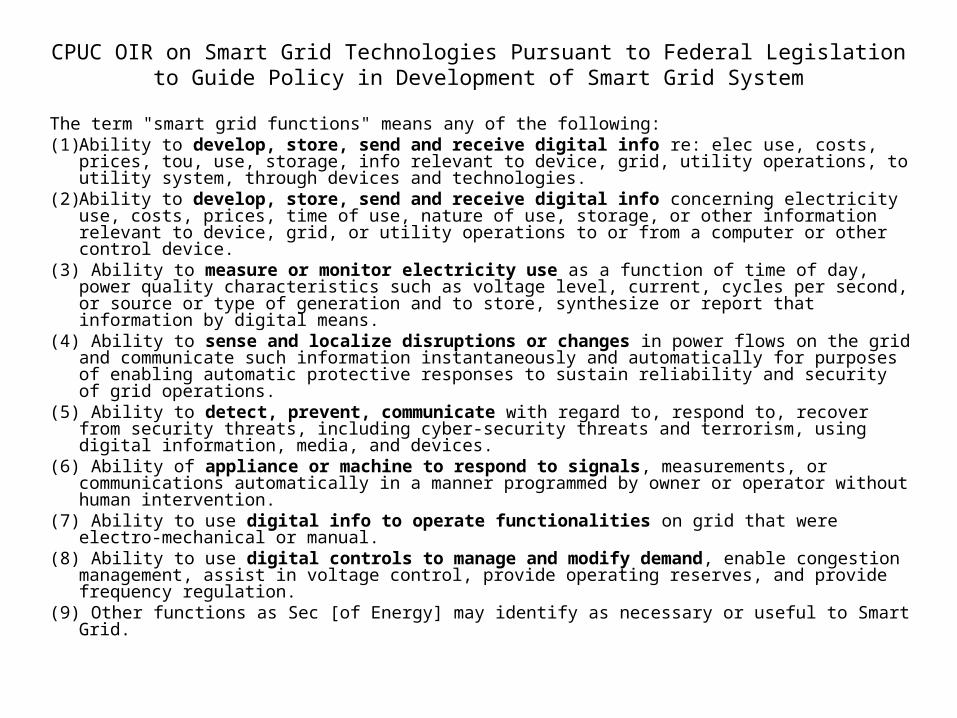
CPUC OIR on Smart Grid Technologies Pursuant to Federal Legislation to Guide Policy in Development of Smart Grid System
The term "smart grid functions" means any of the following:(1) Ability to develop, store, send and receive digital info re: elec use, costs, prices, tou, use,
storage, info relevant to device, grid, utility operations, to utility system, through devices and technologies.
(2) Ability to develop, store, send and receive digital info concerning electricity use, costs, prices, time of use, nature of use, storage, or other information relevant to device, grid, or utility operations to or from a computer or other control device.
(3) Ability to measure or monitor electricity use as a function of time of day, power quality characteristics such as voltage level, current, cycles per second, or source or type of generation and to store, synthesize or report that information by digital means.
(4) Ability to sense and localize disruptions or changes in power flows on the grid and communicate such information instantaneously and automatically for purposes of enabling automatic protective responses to sustain reliability and security of grid operations.
(5) Ability to detect, prevent, communicate with regard to, respond to, recover from security threats, including cyber-security threats and terrorism, using digital information, media, and devices.
(6) Ability of appliance or machine to respond to signals, measurements, or communications automatically in a manner programmed by owner or operator without human intervention.
(7) Ability to use digital info to operate functionalities on grid that were electro-mechanical or manual.
(8) Ability to use digital controls to manage and modify demand, enable congestion management, assist in voltage control, provide operating reserves, and provide frequency regulation.
(9) Other functions as Sec [of Energy] may identify as necessary or useful to Smart Grid.

Linking Energy Efficiency and Demand Response
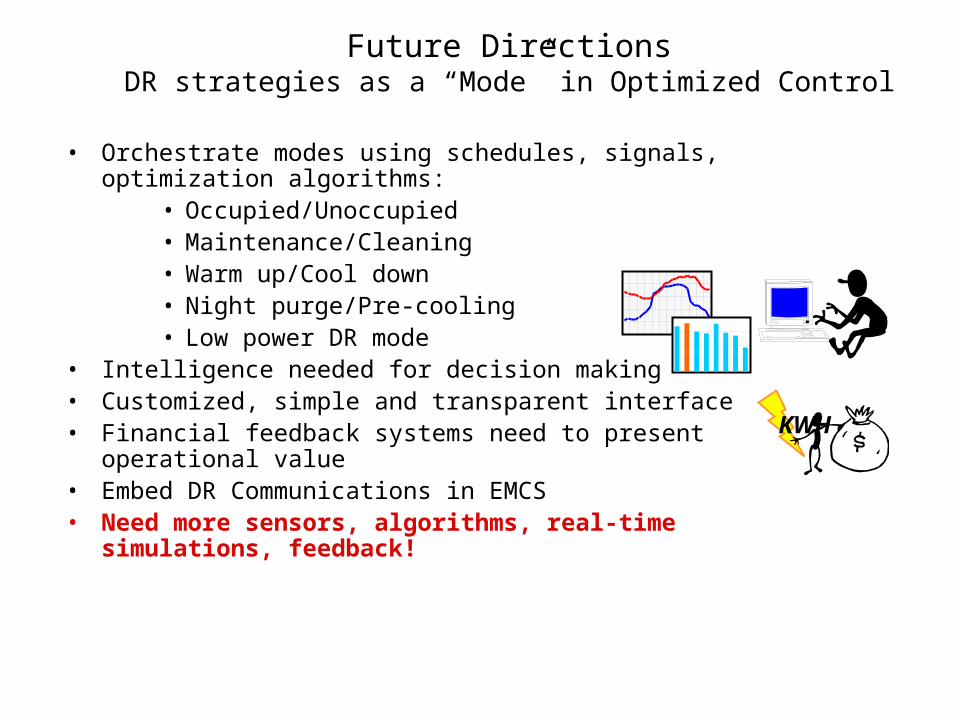
Future DirectionsDR strategies as a “Mode” in Optimized Control
• Orchestrate modes using schedules, signals, optimization algorithms:• Occupied/Unoccupied• Maintenance/Cleaning• Warm up/Cool down• Night purge/Pre-cooling• Low power DR mode
• Intelligence needed for decision making• Customized, simple and transparent interface• Financial feedback systems need to present operational value• Embed DR Communications in EMCS• Need more sensors, algorithms, real-time simulations, feedback!
KWH