HFR® Global Hedge Fund Industry Report Year End 2013 …...the latest HFR Global Hedge Fund...
22
HFR® Global Hedge Fund Industry Report – Year End 2013 Copyright 2014. All rights reserved. www.HedgeFundResearch.com BONUS SECTION: UCITS Alternative Investments
Transcript of HFR® Global Hedge Fund Industry Report Year End 2013 …...the latest HFR Global Hedge Fund...

HFR® Global Hedge Fund Industry Report – Year End 2013
Copyright 2014. All rights reserved.
www.HedgeFundResearch.com
BONUS SECTION: UCITS Alternative Investments

HFR® Global Hedge Fund Industry Report – Year End 2013
Copyright 2014. All rights reserved.
www.HedgeFundResearch.com 2
Hedge Fund Research, Inc.
HEDGE FUND ASSETS SURGE TO NEW RECORD TO BEGIN 2014
Inflows into Event Driven, Equity strategies led by Special Situations, Fundamental Growth;
Inflows to mid-sized firms top largest firms in 4Q as investor risk tolerance returns
CHICAGO, (January 21, 2014) – Capital invested in the global hedge fund industry surged to a record in the fourth quarter, finishing a strong year of capital growth as
hedge funds posted the best performance in three years. Total capital increased in 4Q by $120 billion on $10.5 billion of net inflows to $2.63 trillion, the sixth
consecutive quarterly record, led by a surge in investor interest in Event Driven strategies, including Special Situations and Distressed/Restructuring funds, according to
the latest HFR Global Hedge Fund Industry Report, released today by HFR®, the established global leader in the indexation, analysis and aggregation of the global
hedge fund industry. For the full year, total hedge fund capital increased by $376 billion on $63.7 billion of net inflows, as the HFRI® Fund Weighted Composite Index
posted a gain of +9.2 percent, the best calendar year performance since 2010.
Event Driven funds led capital inflows across all strategies for the first time since 2007, with investors allocating $29.5 billion in 2013. Event Driven
strategies grew by $140 billion to more than $698 billion for 2013, surpassing Relative Value Arbitrage as the second largest strategy area of hedge fund capital. Inflows
into Event Driven strategies for the year were led by Special Situations ($15.4 billion), Distressed/Restructuring ($6.7 billion) and Activist ($5.2 billion) sub-strategies.
The HFRI Event Driven Index gained +12.5 percent for 2013, the best performance since 2009.
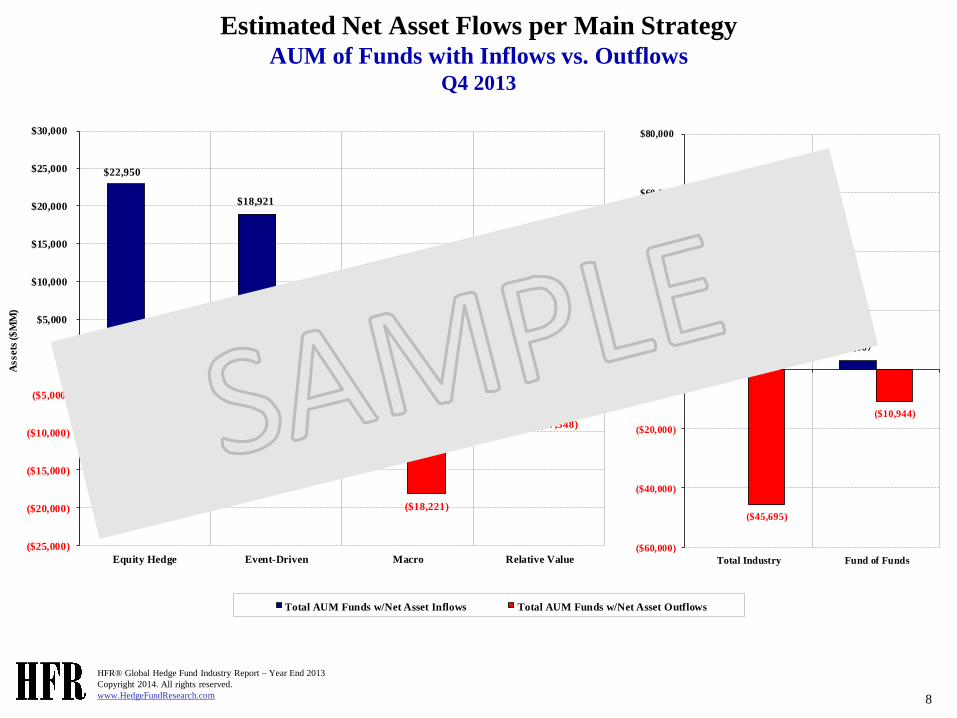
Capital invested in Equity Hedge strategies increased by $48 billion in 4Q, driven by investor inflows of $8.6 billion, with total capital invested in the
strategy reaching a record $734 billion, the industry’s largest strategy concentration of investor capital; total assets invested in Equity Hedge increased $136 billion for
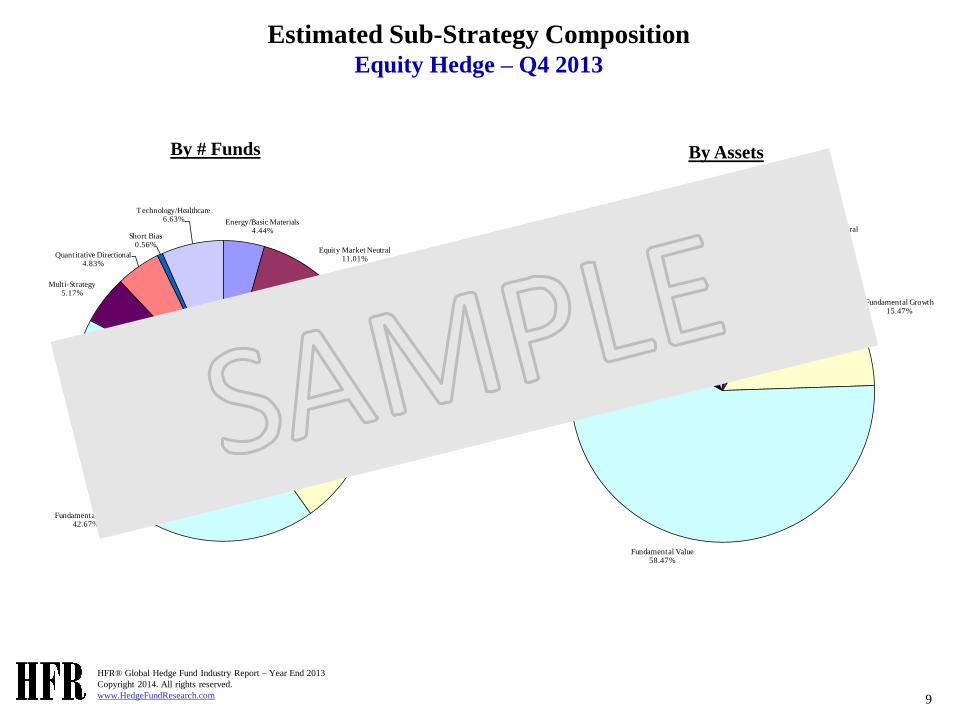
2013. Investor inflows of $17.9 billion were led by Multi-Strategy ($15.1 billion) and Fundamental Growth ($8.4 billion), while Fundamental Value, the largest EH
sub-strategy by capital, experienced an outflow of $10 billion for the year. The HFRI Equity Hedge Index gained +14.4 percent for 2013, also the best performance
since 2009.
Total assets invested in fixed income-based Relative Value Arbitrage (RVA) increased by $18 billion to $684 billion in 4Q on $2 billion of investor
inflows. For the FY 2013, RVA increased by $75.8 billion on inflows of $22.6 billion, led by inflows into Multi-Strategy ($14.8 billion), FI: Corporate ($3.7 billion) and
FI: Asset Backed ($3.6 billion). HFRI Relative Value Arbitrage Index gained +7.0 percent in 2013, the fifth consecutive annual gain.
Macro funds experienced an outflow of $13.3 billion in 4Q led by outflows from Systematic Diversified/CTA strategies of $4.9 billion. The HFRI
Macro: Systematic Diversified/CTA Index declined -0.7 percent for 2013, the third consecutive annual decline. Fourth quarter outflows offset allocations from prior
quarters, resulting in a FY 2013 net redemption of $6.3 billion from Macro funds. For the FY 2013, Macro assets increased by $23.7 billion to $511 billion as larger
firms posted relative performance-based asset increases despite the equal-weighted HFRI Macro Index narrowly declining by -0.2 percent, also the third consecutive
annual decline.
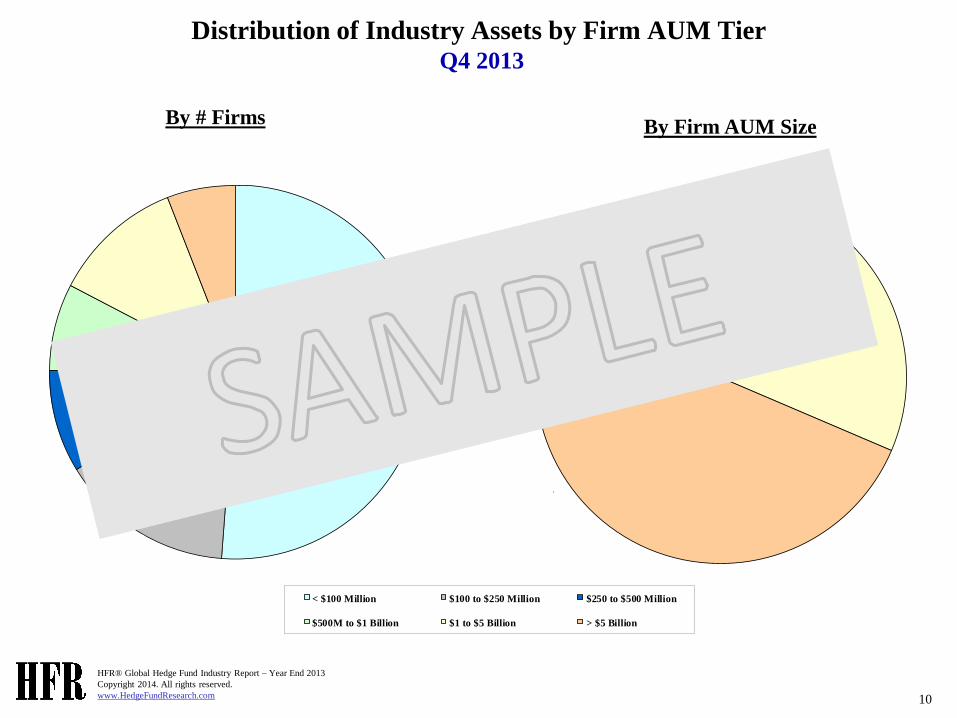
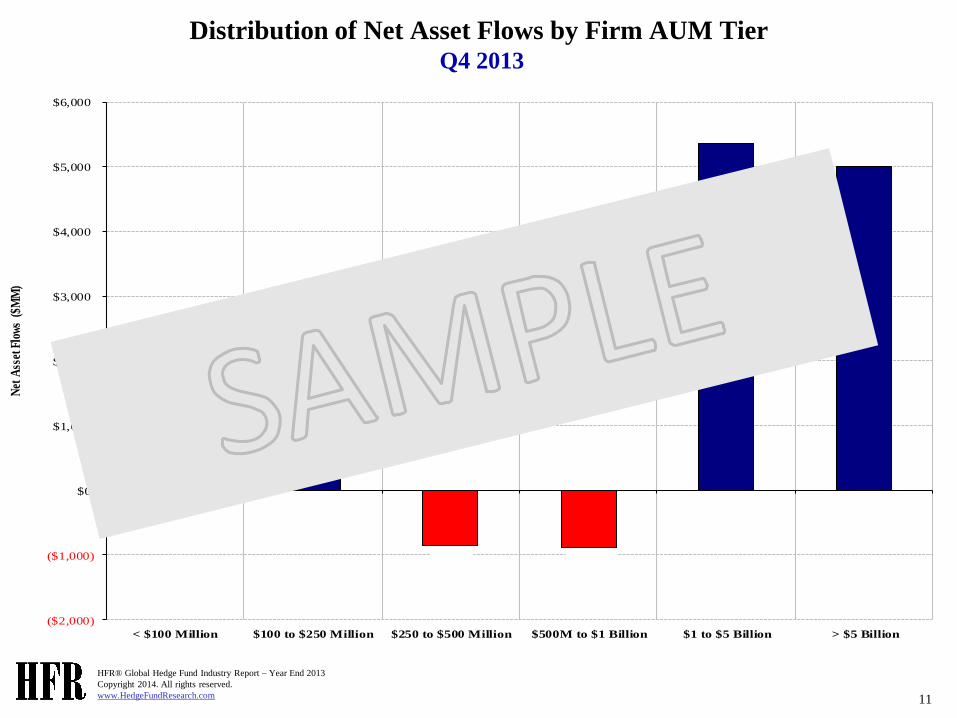
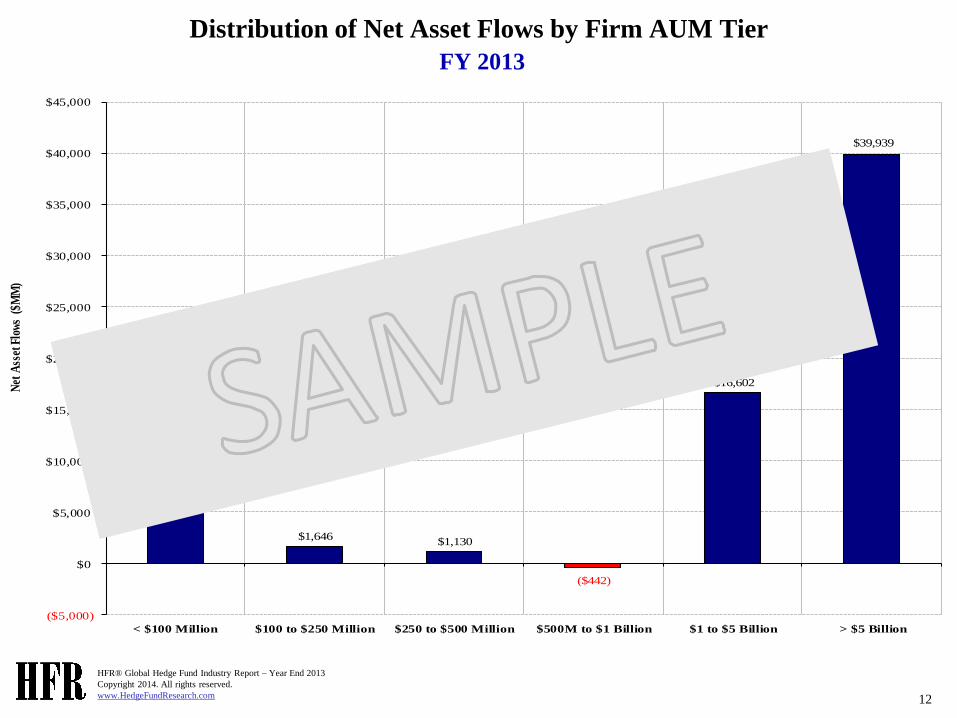
The concentration of capital inflows to the industry’s largest firms moderated slightly in 4Q, as investors allocated to firms across the market
capitalization spectrum. Investors allocated $5.0 billion to firms with greater than $5 billion in AUM, while allocating $5.3 billion to firms with between $1 and $5
billion. For the FY 2013, investors allocated $40 billion to firms with greater than $5 billion, $16.6 billion to firms with between $1 billion and $5 billion in AUM, and
$7.2 billion to firms with less than $1 billion in AUM. By management firm location, 71.6 percent of 2013 capital inflows were allocated to firms located in the
Americas region, with European-located funds receiving 22.3 percent while Asian-located funds received 5.8 percent of 2013 inflows.
“The powerful increase in investor risk tolerance drove strong capital flows into hedge funds as both institutional and retai l investors positioned for
greater intra-market equity dispersion across equity portfolios, and an extension of the dynamic M&A and Activist environment that dominated 2013,” said Kenneth
Heinz, President of HFR. “Hedge fund industry growth has continued to a record level of assets despite the challenges presented by a transitional regulatory
environment, strong gains in traditional equities, and uncertain macroeconomic and political environments in 2013. With the US Federal Reserve beginning the process
of tapering stimulus measures and economic pressures receding across the EU, the combined normalization of interest rates, equity market valuations and investor risk
tolerance is likely to contribute to a conducive environment for actively managed, long-short investing as investors hedge 2013 beta-driven gains in favor of
differentiated, uncorrelated alpha in coming years.”
HFR® Global Hedge Fund Industry Report – Year End 2013
Copyright 2014. All rights reserved.
www.HedgeFundResearch.com 3
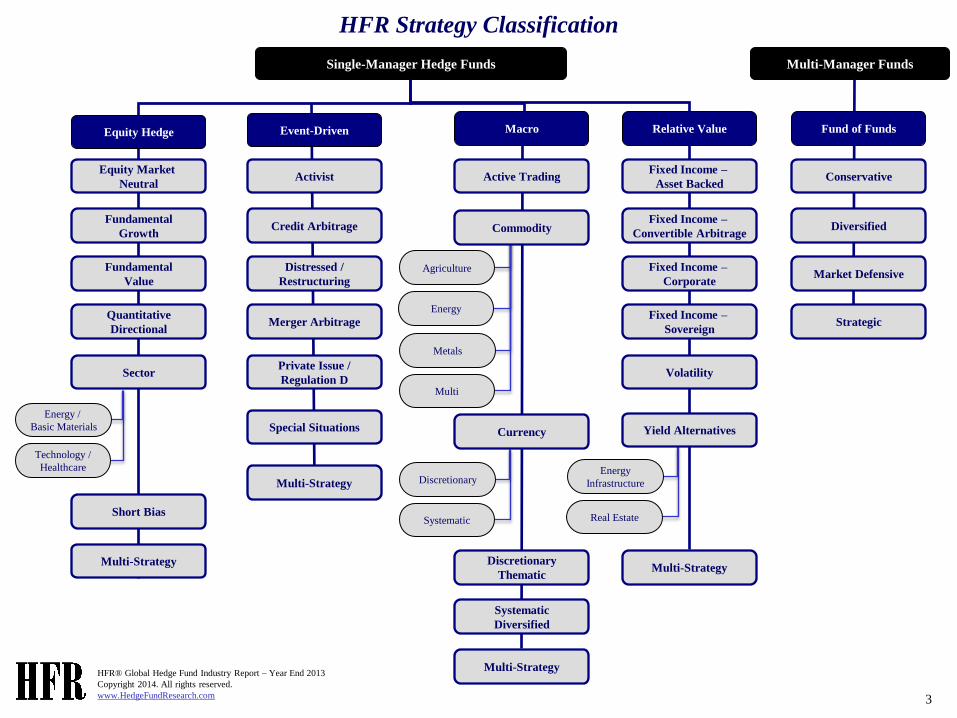
Single-Manager Hedge Funds
Special Situations
Activist
Credit Arbitrage
Distressed /
Restructuring
Merger Arbitrage
Private Issue /
Regulation D
Multi-Strategy
Discretionary
Thematic
Active Trading
Commodity
Agriculture
Energy
Systematic
Diversified
Currency
Discretionary
Systematic
Multi-Strategy
Short Bias
Equity Market
Neutral
Fundamental
Growth
Fundamental
Value
Quantitative
Directional
Sector
Energy /
Basic Materials
Technology /
Healthcare
Multi-Strategy
Equity Hedge Macro Event-Driven
Metals
Multi
Energy
Infrastructure
Real Estate
Relative Value
Fixed Income –
Asset Backed
Fixed Income –
Convertible Arbitrage
Fixed Income –
Corporate
Fixed Income –
Sovereign
Volatility
Yield Alternatives
Multi-Strategy
Multi-Manager Funds
Fund of Funds
Conservative
Diversified
Market Defensive
Strategic
HFR Strategy Classification

HFR® Global Hedge Fund Industry Report – Year End 2013
Copyright 2014. All rights reserved.
www.HedgeFundResearch.com 4
HFR Regional Investment Focus Classification
America Asia Europe Other
North America
Latin America
Pan-American
Japan
Asia ex-Japan
Asia with Japan
Western Europe /
UK
Russia /
Eastern Europe
Northern Europe
Pan-European
Africa
Middle East
Global
Multiple
Emerging Markets
Emerging Markets
Africa Latin America Middle East Multiple
Emerging Markets Asia ex-Japan Russia /
Eastern Europe
HFR® Global Hedge Fund Industry Report – Year End 2013
Copyright 2014. All rights reserved.
www.HedgeFundResearch.com 5
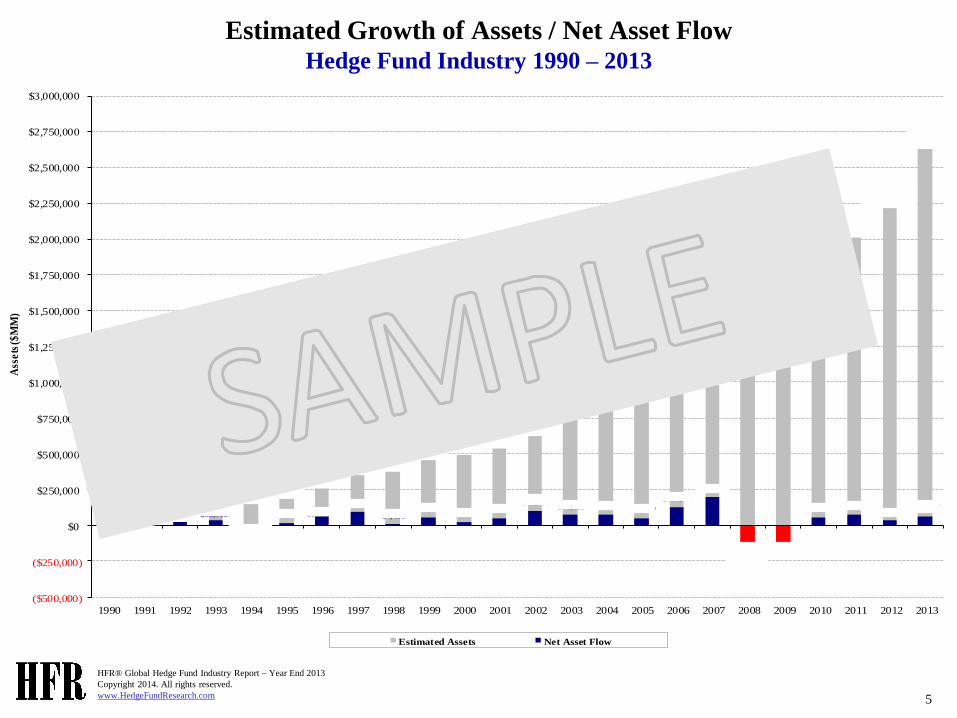
Estimated Growth of Assets / Net Asset Flow Hedge Fund Industry 1990 – 2013
$38,910 $58,370 $95,720
$167,790 $167,360
$185,750
$256,720
$367,560 $374,770
$456,430 $490,580
$539,060 $625,554
$820,009
$972,608
$1,105,385
$1,464,526
$1,868,419
$1,407,095
$1,600,156
$1,917,385
$2,008,065
$2,252,378
$2,628,329
$8,463 $27,861 $36,918
($1,141)
$14,698 $57,407
$91,431
$4,406 $55,340
$23,336 $46,545 $99,436
$70,635 $73,585 $46,907
$126,474
$194,515
($154,447)
($131,180)
$55,464 $70,596 $34,433
$63,747
($500,000)
($250,000)
$0
$250,000
$500,000
$750,000
$1,000,000
$1,250,000
$1,500,000
$1,750,000
$2,000,000
$2,250,000
$2,500,000
$2,750,000
$3,000,000
1990 1991 1992 1993 1994 1995 1996 1997 1998 1999 2000 2001 2002 2003 2004 2005 2006 2007 2008 2009 2010 2011 2012 2013
Ass
ets
($
MM
)
Estimated Assets Net Asset Flow

HFR® Global Hedge Fund Industry Report – Year End 2013
Copyright 2014. All rights reserved.
www.HedgeFundResearch.com 6
Estimated Change in Assets per Main Strategy Net Asset Flow vs. Performance-Based FY 2013
$17,905
$29,551
($6,322)
$22,613
$118,407
$110,569
$30,061
$53,167
($20,000)
$0
$20,000
$40,000
$60,000
$80,000
$100,000
$120,000
$140,000
Equity Hedge Event-Driven Macro Relative Value
Assets
($
MM
)
Net Asset Flow Performance-based Asset Change
$63,747
($20,181)
$312,204
$45,067
($50,000)
$0
$50,000
$100,000
$150,000
$200,000
$250,000
$300,000
$350,000
Total Industry Fund of Funds
HFR® Global Hedge Fund Industry Report – Year End 2013
Copyright 2014. All rights reserved.
www.HedgeFundResearch.com 7
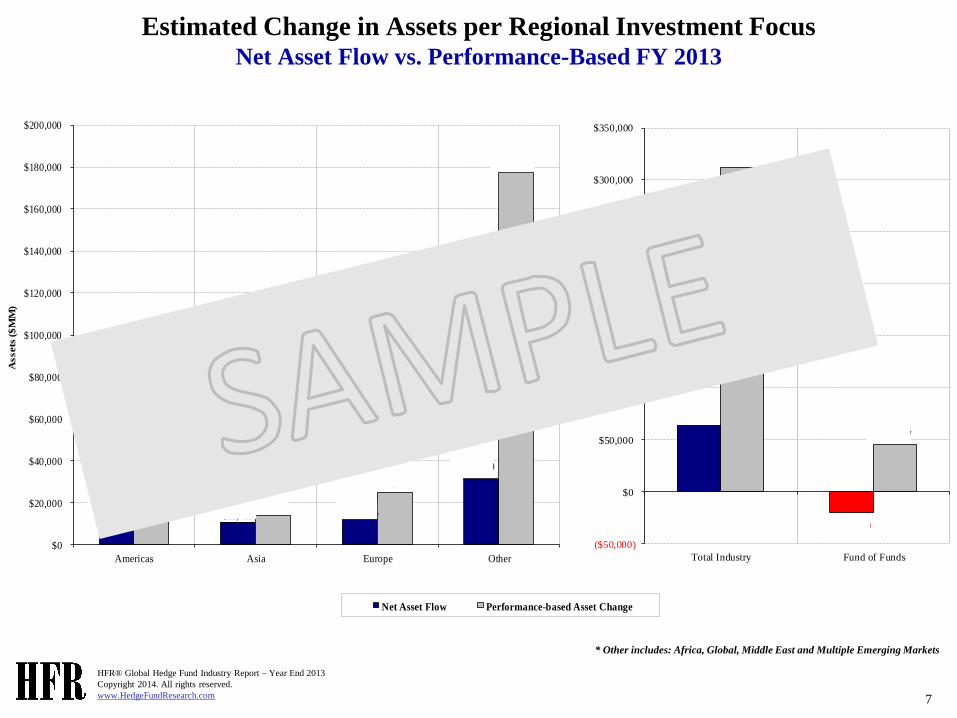
Estimated Change in Assets per Regional Investment Focus Net Asset Flow vs. Performance-Based FY 2013
$63,747
($20,181)
$312,204
$45,067
($50,000)
$0
$50,000
$100,000
$150,000
$200,000
$250,000
$300,000
$350,000
Total Industry Fund of Funds
$10,353 $10,460 $11,715
$31,219
$96,618
$13,600
$24,722
$177,264
$0
$20,000
$40,000
$60,000
$80,000
$100,000
$120,000
$140,000
$160,000
$180,000
$200,000
Americas Asia Europe Other
Assets
($
MM
)
Net Asset Flow Performance-based Asset Change
* Other includes: Africa, Global, Middle East and Multiple Emerging Markets
HFR® Global Hedge Fund Industry Report – Year End 2013
Copyright 2014. All rights reserved.
www.HedgeFundResearch.com 8
Estimated Net Asset Flows per Main Strategy AUM of Funds with Inflows vs. Outflows
Q4 2013
$22,950
$18,921
$4,953
$9,395
($14,337)
($5,789)
($18,221)
($7,348)
($25,000)
($20,000)
($15,000)
($10,000)
($5,000)
$0
$5,000
$10,000
$15,000
$20,000
$25,000
$30,000
Equity Hedge Event-Driven Macro Relative Value
Assets
($
MM
)
Total AUM Funds w/Net Asset Inflows Total AUM Funds w/Net Asset Outflows
$56,219
$2,867
($45,695)
($10,944)
($60,000)
($40,000)
($20,000)
$0
$20,000
$40,000
$60,000
$80,000
Total Industry Fund of Funds
HFR® Global Hedge Fund Industry Report – Year End 2013
Copyright 2014. All rights reserved.
www.HedgeFundResearch.com 9
Estimated Sub-Strategy Composition Equity Hedge – Q4 2013
By # Funds By Assets
Energy/Basic Materials4.44%
Equity Market Neutral11.01%
Fundamental Growth24.71%
Fundamental Value42.67%
Multi-Strategy5.17%
Quantitative Directional4.83%
Short Bias0.56%
Technology/Healthcare6.63%
Energy/Basic Materials3.12%
Equity Market Neutral5.87%
Fundamental Growth15.47%
Fundamental Value58.47%
Multi-Strategy4.38%
Quantitative Directional3.17%
Short Bias0.96%
Technology/Healthcare8.55%
HFR® Global Hedge Fund Industry Report – Year End 2013
Copyright 2014. All rights reserved.
www.HedgeFundResearch.com 10
Distribution of Industry Assets by Firm AUM Tier Q4 2013
By # Firms By Firm AUM Size
51.19%
15.08%
8.89%
7.52%
11.38%
5.94%
< $100 Million $100 to $250 Million $250 to $500 Million
$500M to $1 Billion $1 to $5 Billion > $5 Billion
1.30% 2.03%2.61%
4.30%
21.18%
68.58%
HFR® Global Hedge Fund Industry Report – Year End 2013
Copyright 2014. All rights reserved.
www.HedgeFundResearch.com 11
Distribution of Net Asset Flows by Firm AUM Tier Q4 2013
$1,724
$171
($850) ($895)
$5,374
$5,001
($2,000)
($1,000)
$0
$1,000
$2,000
$3,000
$4,000
$5,000
$6,000
< $100 Million $100 to $250 Million $250 to $500 Million $500M to $1 Billion $1 to $5 Billion > $5 Billion
Net
Ass
et F
low
s ($
MM
)
HFR® Global Hedge Fund Industry Report – Year End 2013
Copyright 2014. All rights reserved.
www.HedgeFundResearch.com 12
Distribution of Net Asset Flows by Firm AUM Tier
FY 2013
$4,873
$1,646 $1,130
($442)
$16,602
$39,939
($5,000)
$0
$5,000
$10,000
$15,000
$20,000
$25,000
$30,000
$35,000
$40,000
$45,000
< $100 Million $100 to $250 Million $250 to $500 Million $500M to $1 Billion $1 to $5 Billion > $5 Billion
Net
Ass
et F
low
s ($
MM
)
HFR® Global Hedge Fund Industry Report – Year End 2013
Copyright 2014. All rights reserved.
www.HedgeFundResearch.com 13
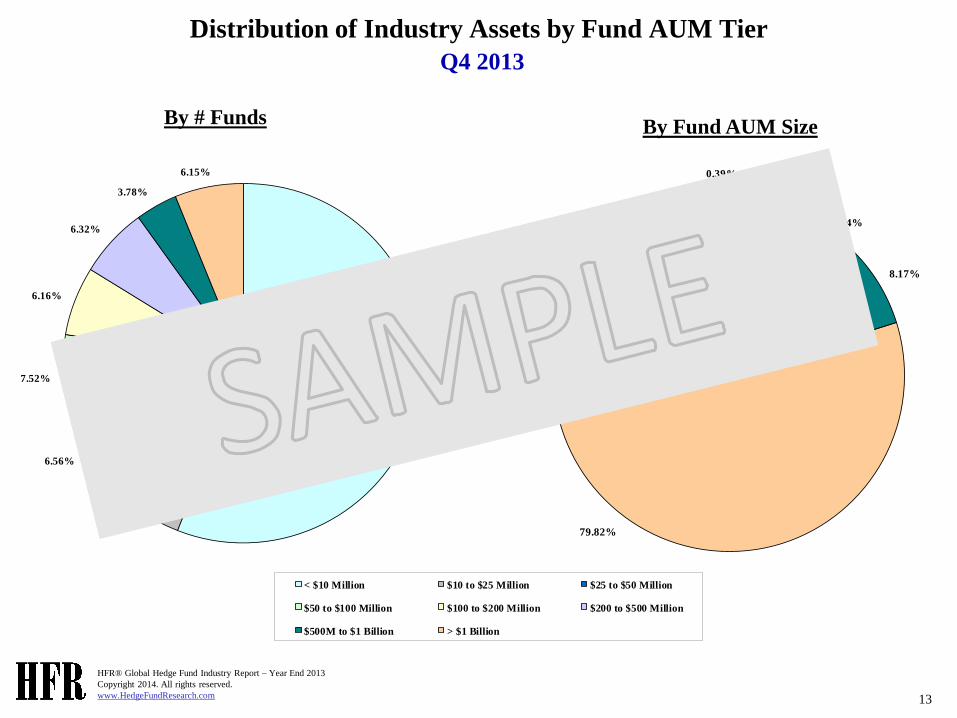
Distribution of Industry Assets by Fund AUM Tier
Q4 2013
By # Funds By Fund AUM Size
55.95%
7.56%
6.56%
7.52%
6.16%
6.32%
3.78%
6.15%
< $10 Million $10 to $25 Million $25 to $50 Million
$50 to $100 Million $100 to $200 Million $200 to $500 Million
$500M to $1 Billion > $1 Billion
0.12%
0.39% 0.74%
1.68%
2.74%
6.34%
8.17%
79.82%

HFR® Global Hedge Fund Industry Report – Year End 2013
Copyright 2014. All rights reserved.
www.HedgeFundResearch.com 14
Estimated Number of Funds Launched/Liquidated 1996 – YTD Q3 2013
507
261
450 348 328
673
1,087 1,094
1,435
2,073
1,518
1,197
659
784
935
1,113 1,108
816
(109)(52)
(115)(57) (71) (92)
(162) (176)
(296)
(848)(717)
(563)
(1,471)
(1,023)
(743) (775)(873)
(608)
(2,000)
(1,500)
(1,000)
(500)
0
500
1,000
1,500
2,000
2,500
1996 1997 1998 1999 2000 2001 2002 2003 2004 2005 2006 2007 2008 2009 2010 2011 2012 YTD
2013
Num
ber
of F
unds
Launches Liquidations
Excerpt slide from HFR Market Microstructure Report
HFR® Global Hedge Fund Industry Report – Year End 2013
Copyright 2014. All rights reserved.
www.HedgeFundResearch.com 15
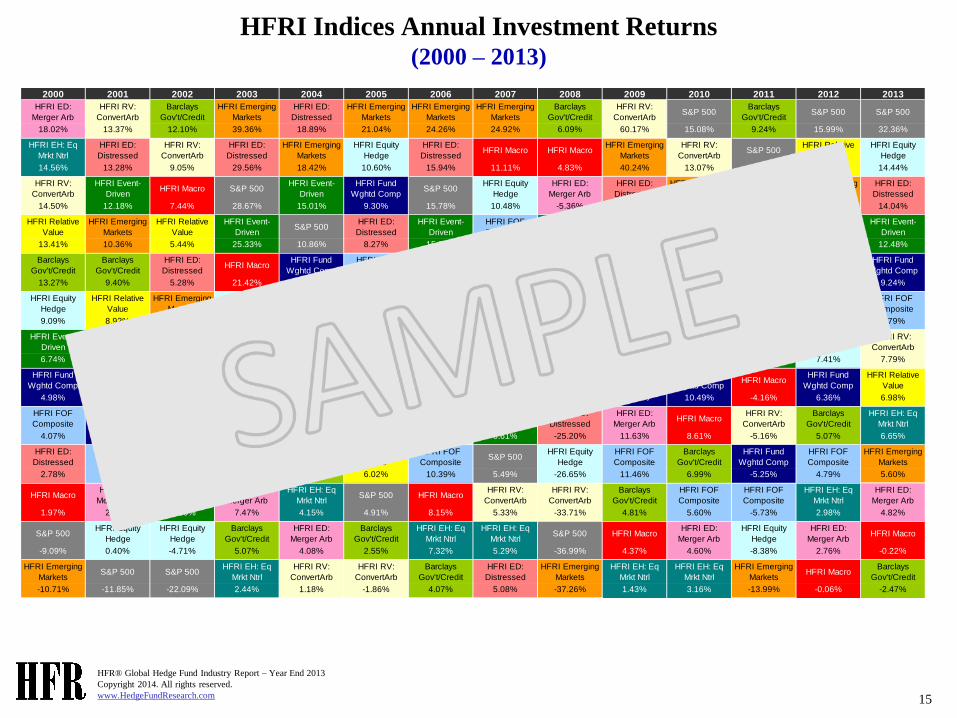
HFRI Indices Annual Investment Returns (2000 – 2013)
2000 2001 2002 2003 2004 2005 2006 2007 2008 2009 2010 2011 2012 2013
HFRI ED:
Merger Arb
HFRI RV:
ConvertArb
Barclays
Gov't/Credit
HFRI Emerging
Markets
HFRI ED:
Distressed
HFRI Emerging
Markets
HFRI Emerging
Markets
HFRI Emerging
Markets
Barclays
Gov't/Credit
HFRI RV:
ConvertArbS&P 500
Barclays
Gov't/CreditS&P 500 S&P 500
18.02% 13.37% 12.10% 39.36% 18.89% 21.04% 24.26% 24.92% 6.09% 60.17% 15.08% 9.24% 15.99% 32.36%
HFRI EH: Eq
Mrkt Ntrl
HFRI ED:
Distressed
HFRI RV:
ConvertArb
HFRI ED:
Distressed
HFRI Emerging
Markets
HFRI Equity
Hedge
HFRI ED:
DistressedHFRI Macro HFRI Macro
HFRI Emerging
Markets
HFRI RV:
ConvertArbS&P 500
HFRI Relative
Value
HFRI Equity
Hedge
14.56% 13.28% 9.05% 29.56% 18.42% 10.60% 15.94% 11.11% 4.83% 40.24% 13.07% 2.09% 10.59% 14.44%
HFRI RV:
ConvertArb
HFRI Event-
DrivenHFRI Macro S&P 500
HFRI Event-
Driven
HFRI Fund
Wghtd CompS&P 500
HFRI Equity
Hedge
HFRI ED:
Merger Arb
HFRI ED:
Distressed
HFRI Emerging
Markets
HFRI ED:
Merger Arb
HFRI Emerging
Markets
HFRI ED:
Distressed
14.50% 12.18% 7.44% 28.67% 15.01% 9.30% 15.78% 10.48% -5.36% 28.13% 11.96% 1.48% 10.37% 14.04%
HFRI Relative
Value
HFRI Emerging
Markets
HFRI Relative
Value
HFRI Event-
DrivenS&P 500
HFRI ED:
Distressed
HFRI Event-
Driven
HFRI FOF
Composite
HFRI EH: Eq
Mrkt NtrlS&P 500
HFRI Relative
Value
HFRI Relative
Value
HFRI ED:
Distressed
HFRI Event-
Driven
13.41% 10.36% 5.44% 25.33% 10.86% 8.27% 15.33% 10.25% -5.93% 26.47% 11.73% 0.15% 10.12% 12.48%
Barclays
Gov't/Credit
Barclays
Gov't/Credit
HFRI ED:
DistressedHFRI Macro
HFRI Fund
Wghtd Comp
HFRI FOF
Composite
HFRI ED:
Merger Arb
HFRI Fund
Wghtd Comp
HFRI Relative
Value
HFRI Relative
Value
HFRI Event-
Driven
HFRI ED:
Distressed
HFRI Event-
Driven
HFRI Fund
Wghtd Comp
13.27% 9.40% 5.28% 21.42% 9.03% 7.49% 14.24% 9.96% -18.04% 25.80% 11.53% -1.79% 8.89% 9.24%
HFRI Equity
Hedge
HFRI Relative
Value
HFRI Emerging
Markets
HFRI Equity
Hedge
HFRI Equity
Hedge
HFRI Event-
Driven
HFRI Fund
Wghtd Comp
HFRI Relative
Value
HFRI Fund
Wghtd Comp
HFRI Event-
Driven
HFRI ED:
Distressed
HFRI EH: Eq
Mrkt Ntrl
HFRI RV:
ConvertArb
HFRI FOF
Composite
9.09% 8.92% 3.70% 20.54% 7.68% 7.29% 12.89% 8.94% -19.02% 25.04% 11.26% -2.12% 8.58% 8.79%
HFRI Event-
DrivenHFRI Macro
HFRI FOF
Composite
HFRI Fund
Wghtd Comp
HFRI FOF
CompositeHFRI Macro
HFRI Relative
Value
Barclays
Gov't/Credit
HFRI FOF
Composite
HFRI Equity
Hedge
HFRI Equity
Hedge
HFRI Event-
Driven
HFRI Equity
Hedge
HFRI RV:
ConvertArb
6.74% 6.87% 1.02% 19.55% 6.86% 6.79% 12.37% 7.75% -21.36% 24.55% 10.58% -3.30% 7.41% 7.79%
HFRI Fund
Wghtd Comp
HFRI EH: Eq
Mrkt Ntrl
HFRI EH: Eq
Mrkt Ntrl
HFRI FOF
Composite
HFRI Relative
Value
HFRI ED:
Merger Arb
HFRI RV:
ConvertArb
HFRI ED:
Merger Arb
HFRI Event-
Driven
HFRI Fund
Wghtd Comp
HFRI Fund
Wghtd CompHFRI Macro
HFRI Fund
Wghtd Comp
HFRI Relative
Value
4.98% 6.71% 0.98% 11.61% 5.58% 6.25% 12.17% 7.05% -21.82% 19.98% 10.49% -4.16% 6.36% 6.98%
HFRI FOF
Composite
HFRI Fund
Wghtd Comp
HFRI ED:
Merger Arb
HFRI RV:
ConvertArbHFRI Macro
HFRI EH: Eq
Mrkt Ntrl
HFRI Equity
Hedge
HFRI Event-
Driven
HFRI ED:
Distressed
HFRI ED:
Merger ArbHFRI Macro
HFRI RV:
ConvertArb
Barclays
Gov't/Credit
HFRI EH: Eq
Mrkt Ntrl
4.07% 4.62% -0.87% 9.93% 4.63% 6.22% 11.71% 6.61% -25.20% 11.63% 8.61% -5.16% 5.07% 6.65%
HFRI ED:
Distressed
HFRI FOF
Composite
HFRI Fund
Wghtd Comp
HFRI Relative
Value
Barclays
Gov't/Credit
HFRI Relative
Value
HFRI FOF
CompositeS&P 500
HFRI Equity
Hedge
HFRI FOF
Composite
Barclays
Gov't/Credit
HFRI Fund
Wghtd Comp
HFRI FOF
Composite
HFRI Emerging
Markets
2.78% 2.80% -1.45% 9.72% 4.54% 6.02% 10.39% 5.49% -26.65% 11.46% 6.99% -5.25% 4.79% 5.60%
HFRI MacroHFRI ED:
Merger Arb
HFRI Event-
Driven
HFRI ED:
Merger Arb
HFRI EH: Eq
Mrkt NtrlS&P 500 HFRI Macro
HFRI RV:
ConvertArb
HFRI RV:
ConvertArb
Barclays
Gov't/Credit
HFRI FOF
Composite
HFRI FOF
Composite
HFRI EH: Eq
Mrkt Ntrl
HFRI ED:
Merger Arb
1.97% 2.76% -4.30% 7.47% 4.15% 4.91% 8.15% 5.33% -33.71% 4.81% 5.60% -5.73% 2.98% 4.82%
S&P 500HFRI Equity
Hedge
HFRI Equity
Hedge
Barclays
Gov't/Credit
HFRI ED:
Merger Arb
Barclays
Gov't/Credit
HFRI EH: Eq
Mrkt Ntrl
HFRI EH: Eq
Mrkt NtrlS&P 500 HFRI Macro
HFRI ED:
Merger Arb
HFRI Equity
Hedge
HFRI ED:
Merger ArbHFRI Macro
-9.09% 0.40% -4.71% 5.07% 4.08% 2.55% 7.32% 5.29% -36.99% 4.37% 4.60% -8.38% 2.76% -0.22%
HFRI Emerging
MarketsS&P 500 S&P 500
HFRI EH: Eq
Mrkt Ntrl
HFRI RV:
ConvertArb
HFRI RV:
ConvertArb
Barclays
Gov't/Credit
HFRI ED:
Distressed
HFRI Emerging
Markets
HFRI EH: Eq
Mrkt Ntrl
HFRI EH: Eq
Mrkt Ntrl
HFRI Emerging
MarketsHFRI Macro
Barclays
Gov't/Credit
-10.71% -11.85% -22.09% 2.44% 1.18% -1.86% 4.07% 5.08% -37.26% 1.43% 3.16% -13.99% -0.06% -2.47%

HFR® Global Hedge Fund Industry Report – Year End 2013
Copyright 2014. All rights reserved.
www.HedgeFundResearch.com 16
HFRI Fund Weighted Composite Constituents* Risk Return Comparison 12-Month
Scaled Down to 50% Return and 50% Standard Deviation
*The underlying hedge fund data represented in this chart is available to HFR Database subscribers or as an additional purchase to Industry Report subscribers.
(50.00)
(40.00)
(30.00)
(20.00)
(10.00)
0.00
10.00
20.00
30.00
40.00
50.00
0.00 5.00 10.00 15.00 20.00 25.00 30.00 35.00 40.00 45.00 50.00
Ret
urn
%
STD %
HFR® Global Hedge Fund Industry Report – Year End 2013
Copyright 2014. All rights reserved.
www.HedgeFundResearch.com 17
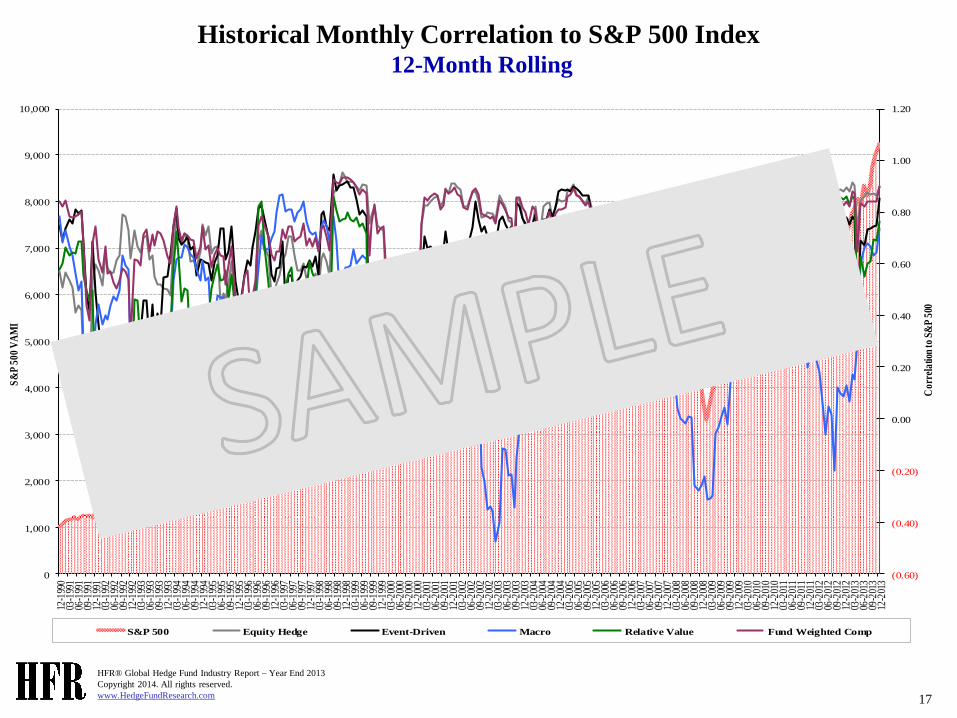
Historical Monthly Correlation to S&P 500 Index 12-Month Rolling
(0.60)
(0.40)
(0.20)
0.00
0.20
0.40
0.60
0.80
1.00
1.20
0
1,000
2,000
3,000
4,000
5,000
6,000
7,000
8,000
9,000
10,000
12-1
990
03-1
991
06-1
991
09-1
991
12-1
991
03-1
992
06-1
992
09-1
992
12-1
992
03-1
993
06-1
993
09-1
993
12-1
993
03-1
994
06-1
994
09-1
994
12-1
994
03-1
995
06-1
995
09-1
995
12-1
995
03-1
996
06-1
996
09-1
996
12-1
996
03-1
997
06-1
997
09-1
997
12-1
997
03-1
998
06-1
998
09-1
998
12-1
998
03-1
999
06-1
999
09-1
999
12-1
999
03-2
000
06-2
000
09-2
000
12-2
000
03-2
001
06-2
001
09-2
001
12-2
001
03-2
002
06-2
002
09-2
002
12-2
002
03-2
003
06-2
003
09-2
003
12-2
003
03-2
004
06-2
004
09-2
004
12-2
004
03-2
005
06-2
005
09-2
005
12-2
005
03-2
006
06-2
006
09-2
006
12-2
006
03-2
007
06-2
007
09-2
007
12-2
007
03-2
008
06-2
008
09-2
008
12-2
008
03-2
009
06-2
009
09-2
009
12-2
009
03-2
010
06-2
010
09-2
010
12-2
010
03-2
011
06-2
011
09-2
011
12-2
011
03-2
012
06-2
012
09-2
012
12-2
012
03-2
013
06-2
013
09-2
013
12-2
013
Cor
rela
tion
to S
&P
500
S&
P 5
00 V
AM
I
S&P 500 Equity Hedge Event-Driven Macro Relative Value Fund Weighted Comp

HFR® Global Hedge Fund Industry Report – Year End 2013
Copyright 2014. All rights reserved.
www.HedgeFundResearch.com 18
HFRI Index Correlation Matrix 12 Month
Index
Equi
ty H
edge
EH: E
q M
rkt N
trl
EH: Q
uant
Drc
tnl
EH: E
nerg
y/B
asic
Mat
eria
ls
EH: T
ech/
HC
EH: S
hort
Bia
s
Even
t-Driv
en
ED: D
istre
ssed
ED: M
erg
Arb
Mac
ro
Mac
ro: S
ys D
iv
Rel
ativ
e V
alue
RV
: FI-A
sset
Bac
ked
RV
: FI-C
onvA
rb
RV
: FI-C
orp
RV
: Mul
ti-St
rat
RV
: Yie
ld A
lts
Fund
Wei
ghte
d C
omp
FOF
Com
p
Emrg
ng M
rkts
(Tot
al)
EM: A
sia e
x-Ja
pan
EM: G
loba
l
EM: L
atA
m
EM: R
ussia
Bar
clay
s Gov
t/Crd
t Agg
Bon
d
S&P
500
Equity Hedge 1.00 0.73 0.82 0.70 0.68 (0.80) 0.91 0.83 0.51 0.72 0.52 0.80 0.59 0.80 0.80 0.73 0.65 0.97 0.95 0.83 0.79 0.83 0.69 0.69 0.22 0.87
EH: Eq Mrkt Ntrl 1.00 0.82 0.42 0.33 (0.48) 0.60 0.56 0.19 0.59 0.47 0.58 0.48 0.45 0.60 0.45 0.63 0.72 0.71 0.56 0.56 0.56 0.40 0.43 0.31 0.84
EH: Quant Drctnl 1.00 0.64 0.61 (0.55) 0.63 0.51 0.47 0.79 0.64 0.64 0.42 0.56 0.60 0.51 0.70 0.83 0.79 0.59 0.53 0.57 0.49 0.60 0.33 0.89
EH: Energy/Basic Materials 1.00 0.59 (0.34) 0.51 0.45 0.28 0.43 0.22 0.44 0.37 0.43 0.51 0.29 0.35 0.64 0.56 0.43 0.37 0.44 0.41 0.40 (0.06) 0.56
EH: Tech/HC 1.00 (0.59) 0.49 0.37 0.51 0.39 0.27 0.27 0.05 0.42 0.21 0.25 0.39 0.59 0.59 0.27 0.24 0.28 0.15 0.30 (0.09) 0.69
EH: Short Bias 1.00 (0.85) (0.82) (0.54) (0.48) (0.34) (0.67) (0.39) (0.82) (0.64) (0.71) (0.55) (0.77) (0.77) (0.67) (0.63) (0.71) (0.56) (0.50) (0.17) (0.72)
Event-Driven 1.00 0.96 0.54 0.69 0.51 0.82 0.66 0.91 0.84 0.84 0.49 0.92 0.92 0.86 0.87 0.89 0.65 0.66 0.16 0.74
ED: Distressed 1.00 0.46 0.61 0.46 0.82 0.72 0.89 0.86 0.86 0.45 0.85 0.88 0.80 0.83 0.84 0.61 0.49 0.20 0.68
ED: Merg Arb 1.00 0.49 0.43 0.31 0.01 0.50 0.34 0.35 0.05 0.52 0.52 0.45 0.41 0.42 0.33 0.49 0.24 0.52
Macro 1.00 0.94 0.77 0.54 0.60 0.68 0.76 0.66 0.84 0.84 0.67 0.64 0.71 0.56 0.54 0.32 0.71
Macro: Sys Div 1.00 0.66 0.43 0.47 0.53 0.70 0.59 0.68 0.70 0.50 0.51 0.53 0.42 0.34 0.39 0.59
Relative Value 1.00 0.87 0.79 0.96 0.95 0.62 0.88 0.88 0.88 0.86 0.87 0.85 0.64 0.55 0.61
RV: FI-Asset Backed 1.00 0.62 0.88 0.79 0.37 0.66 0.69 0.70 0.73 0.68 0.62 0.44 0.44 0.38
RV: FI-ConvArb 1.00 0.79 0.85 0.50 0.82 0.82 0.80 0.80 0.78 0.65 0.62 0.22 0.65
RV: FI-Corp 1.00 0.88 0.46 0.86 0.85 0.91 0.89 0.90 0.86 0.68 0.54 0.58
RV: Multi-Strat 1.00 0.60 0.83 0.86 0.82 0.83 0.84 0.75 0.53 0.43 0.57
RV: Yield Alts 1.00 0.69 0.66 0.44 0.40 0.47 0.43 0.30 0.16 0.73
Fund Weighted Comp 1.00 0.99 0.86 0.83 0.87 0.73 0.70 0.30 0.85
FOF Comp 1.00 0.84 0.83 0.85 0.67 0.63 0.31 0.85
Emrgng Mrkts (Total) 1.00 0.97 0.97 0.89 0.86 0.45 0.55
EM: Asia ex-Japan 1.00 0.92 0.79 0.77 0.43 0.54
EM: Global 1.00 0.86 0.80 0.34 0.57
EM: LatAm 1.00 0.78 0.60 0.39
EM: Russia 1.00 0.36 0.42
Barclays Govt/Crdt Agg Bond 1.00 0.22
S&P 500 1.00
HFR® Global Hedge Fund Industry Report – Year End 2013
Copyright 2014. All rights reserved.
www.HedgeFundResearch.com 19
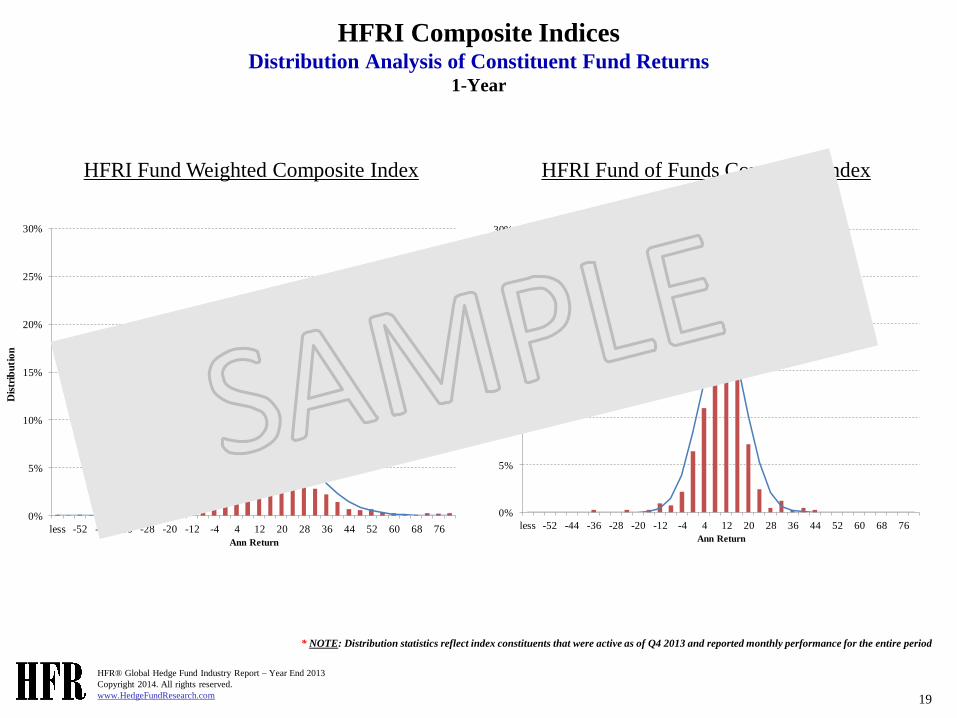
HFRI Composite Indices Distribution Analysis of Constituent Fund Returns
1-Year
* NOTE: Distribution statistics reflect index constituents that were active as of Q4 2013 and reported monthly performance for the entire period
0%
5%
10%
15%
20%
25%
30%
less -52 -44 -36 -28 -20 -12 -4 4 12 20 28 36 44 52 60 68 76
Dis
trib
uti
on
Ann Return
0%
5%
10%
15%
20%
25%
30%
less -52 -44 -36 -28 -20 -12 -4 4 12 20 28 36 44 52 60 68 76
Dis
trib
uti
on
Ann Return
HFRI Fund Weighted Composite Index HFRI Fund of Funds Composite Index

HFR® Global Hedge Fund Industry Report – Year End 2013
Copyright 2014. All rights reserved.
www.HedgeFundResearch.com 20
HFRI Main Strategy Indices Performance Analysis Since 1990
Index Net Return Standard Dev Net Return Standard Dev Net Return Standard Dev Net Return Standard Dev Net Return Standard Dev
HFRI FWC 9.24 3.68 3.25 5.31 7.81 5.88 5.72 6.39 10.94 6.89
HFRI Equity Hedge Index 14.44 4.94 4.04 7.97 9.15 8.45 5.26 8.72 12.71 9.09
HFRI Event-Driven Index 12.48 3.16 5.80 5.37 10.62 5.78 6.99 6.61 11.59 6.75
HFRI Macro Index (0.22) 3.30 (1.50) 4.04 1.50 4.69 4.25 4.86 11.60 7.47
HFRI Relative Value Index 6.98 2.60 5.82 3.18 10.68 3.81 6.43 4.96 10.11 4.34
12-Month 3-Year Annualized 5-Year Annualized 10-Year Annualized Since 1990
0
1,000
2,000
3,000
4,000
5,000
6,000
7,000
8,000
9,000
10,000
11,000
12,000
13,000
14,000
15,000
16,000
17,000
18,000
19,000
06-1
990
12-1
990
06-1
991
12-1
991
06-1
992
12-1
992
06-1
993
12-1
993
06-1
994
12-1
994
06-1
995
12-1
995
06-1
996
12-1
996
06-1
997
12-1
997
06-1
998
12-1
998
06-1
999
12-1
999
06-2
000
12-2
000
06-2
001
12-2
001
06-2
002
12-2
002
06-2
003
12-2
003
06-2
004
12-2
004
06-2
005
12-2
005
06-2
006
12-2
006
06-2
007
12-2
007
06-2
008
12-2
008
06-2
009
12-2
009
06-2
010
12-2
010
06-2
011
12-2
011
06-2
012
12-2
012
06-2
013
12-2
013
VA
MI
HFRI Fund Weighted Composite Index HFRI Equity Hedge (Total) Index HFRI Event-Driven (Total) Index
HFRI Macro (Total) Index HFRI Relative Value (Total) Index

HFR® Global Hedge Fund Industry Report – Year End 2013
Copyright 2014. All rights reserved.
www.HedgeFundResearch.com 21
HFRI Macro (Total) Index Drawdown Analysis since 1990
Start Date of
Drawdown Period
# of Months
Drawdown to
Trough
Date of
Trough
Drawdown to
trough
# Months to
Recover High
Water Mark
End Date of
Drawdown Period
6-month ROR
since Trough
12-Month ROR
since Trough
Jan-94 3 Apr-94 -10.70% 18 Jul-95 5.57% 7.85%
Apr-11 29 Sep-13 -7.99% #N/A #N/A 0.10% 0.10%
Feb-00 3 May-00 -7.32% 20 Oct-01 0.30% 5.99%
Jul-98 3 Oct-98 -5.93% 9 Apr-99 9.18% 10.79%
Jun-08 3 Sep-08 -4.94% 11 May-09 2.65% 7.66%
Jul-90 2 Sep-90 -4.72% 5 Dec-90 19.59% 39.75%
1,000
3,000
5,000
7,000
9,000
11,000
13,000
15,000
17,000
Dec
-89
Mar
-90
Jun-
90Se
p-90
Dec
-90
Mar
-91
Jun-
91Se
p-91
Dec
-91
Mar
-92
Jun-
92Se
p-92
Dec
-92
Mar
-93
Jun-
93Se
p-93
Dec
-93
Mar
-94
Jun-
94Se
p-94
Dec
-94
Mar
-95
Jun-
95Se
p-95
Dec
-95
Mar
-96
Jun-
96Se
p-96
Dec
-96
Mar
-97
Jun-
97Se
p-97
Dec
-97
Mar
-98
Jun-
98Se
p-98
Dec
-98
Mar
-99
Jun-
99Se
p-99
Dec
-99
Mar
-00
Jun-
00Se
p-00
Dec
-00
Mar
-01
Jun-
01Se
p-01
Dec
-01
Mar
-02
Jun-
02Se
p-02
Dec
-02
Mar
-03
Jun-
03Se
p-03
Dec
-03
Mar
-04
Jun-
04Se
p-04
Dec
-04
Mar
-05
Jun-
05Se
p-05
Dec
-05
Mar
-06
Jun-
06Se
p-06
Dec
-06
Mar
-07
Jun-
07Se
p-07
Dec
-07
Mar
-08
Jun-
08Se
p-08
Dec
-08
Mar
-09
Jun-
09Se
p-09
Dec
-09
Mar
-10
Jun-
10Se
p-10
Dec
-10
Mar
-11
Jun-
11Se
p-11
Dec
-11
Mar
-12
Jun-
12Se
p-12
Dec
-12
Mar
-13
Jun-
13Se
p-13
Dec
-13
VA
MI
NAV for HFRI Macro Index Peaks Trough

HFR® Global Hedge Fund Industry Report – Year End 2013
Copyright 2014. All rights reserved.
www.HedgeFundResearch.com 22
HFRI Fund Weighted Composite Index Percentage of Constituent Funds at High Watermark
2003 – Q4 2013
69.1%
74.3%
76.7%
87.1% 88.0%
56.4%
50.4%
58.5%
66.6%
48.4%
65.9%
0.0%
10.0%
20.0%
30.0%
40.0%
50.0%
60.0%
70.0%
80.0%
90.0%
100.0%20
03
2004
2005
2006
2007
2008
2009
2010
2011
2012
2013
% F
un
ds
at
HW
M
*Trailing 12 Months ending Q4 2013