Hemodynamic Computation Using Multiphase Flow Dynamics …Hemodynamic Computation Using Multiphase...
15
Annals of Biomedical Engineering, Vol. 34, No. 3, March 2006 ( C 2006) pp. 393–407 DOI: 10.1007/s10439-005-9017-0 Hemodynamic Computation Using Multiphase Flow Dynamics in a Right Coronary Artery JONGHWUN JUNG,AHMED HASSANEIN, and ROBERT W. L YCZKOWSKI Argonne National Laboratory, 9700 S. Cass Avenue, Argonne, IL (Received 29 March 2005; accepted 17 November 2005; published online: 15 February 2006) Abstract—Hemodynamic data on the roles of physiologically critical blood particulates are needed to better understand cardio- vascular diseases. The blood flow patterns and particulate buildup were numerically simulated using the multiphase non-Newtonian theory of dense suspension hemodynamics in a realistic right coronary artery (RCA) having various cross sections. The local hemodynamic factors, such as wall shear stress (WSS), red blood cell (RBC) buildup, viscosity, and velocity, varied with the spa- tially nonuniform vessel structures and temporal cardiac cycles. The model generally predicted higher RBC buildup on the inside radius of curvature. A low WSS region was found in the high RBC buildup region, in particular, on the area of maximum curvature of a realistic human RCA. The complex recirculation patterns, the oscillatory flow with flow reversal, and vessel geometry resulted in RBC buildup due to the prolonged particulate residence time, specifically, at the end of the diastole cycle. The increase of the initial plasma viscosity caused the lower WSS. These predictions have significant implications for understanding the local hemo- dynamic phenomena that may contribute to the earliest stage of atherosclerosis, as clinically observed on the inside curvatures and torsion of coronary arteries. Keywords—Multiphase, Particulate buildup, Computational fluid dynamics, Wall shear stress, Non-Newtonian, Secondary flow, Cardiovascular disease. INTRODUCTION Atherosclerosis, the most common type of cardiovascu- lar disease, 1 is a geometrically focused disease preferen- tially located in the inner curvatures of arteries, near side branches, and in the outer wall of bifurcations with com- plex flow patterns. 3 , 9 , 24, 37 , 69 Several studies have shown a strong correlation between hemodynamics and endothe- lial cell functions in the progression of atherosclerosis le- sions. 41 , 53, 58 Possible mechanisms for this correlation de- pend on the local flow phenomena, the rheological prop- erties of blood, the artery geometry, and the physiological state of the endothelium. 59 Under low wall shear stress (WSS), endothelial cell modulates gene expressions, re- sulting in random cell structures, a decrease of nitric ox- Address correspondence to Jonghwun Jung, Argonne National Lab- oratory, Energy Technology Division, Building 308,9700 South Cass Av- enue, Argonne, IL 60439. Electronic mail: [email protected] ide (NO) production, an increase of monocyte adhesion and migration, and an increase of permeability to macro- molecules. 7 , 11, 12, 28, 53, 63 , 64 Understanding the local hemo- dynamic parameters in the blood flow of the human artery is critical in the diagnosis and treatment 30 , 53 , 61 of patients with cardiovascular disease. In recent years, single-phase computational fluid dy- namics (CFD) techniques, combined with noninvasive medical imaging, have been used increasingly by re- searchers seeking to better understand hemodynamic fac- tors. 4, 12 , 25 , 31 , 44, 48, 51, 56, 67, 68 Various investigators have re- ported the coexistence of regions of low WSS and high tensile stress 57, 68 and an inverse relationship between WSS and wall thickness. 6 , 36 , 37 The increase in wall thickness was initially associated with plaque accumulation on the vessel wall. The lumen area remained unchanged with stenosis less than 40%. 26 After stenoses rose above 40%, however, Wentzel et al. 65 observed that the deposition of atheroscle- rotic plaque and vessel remodeling had no consistent corre- lation with low WSS. They suggested a growing importance of nonshear-stress-related plaque progression with lumen narrowing. Wall thickness was positively correlated with the curvature and torsion in the human coronary artery and seemed to be influenced by multiple aspects of the dynamic geometry. 69 Zeng et al. 67 concluded that WSS is driven by a complex combined effect of local and upstream geometry. Steinman and his colleagues 50 , 52 indicated that clinical de- cisions based on computational analyses must employ the actual vessel geometry for an individual’s cardiovascular disease, not the idealized vessel geometry, which can only be applied in a general sense to the human circulation. Additional hemodynamic factors to consider would be the cell interaction effect and the spatial distribution of particulate cells in blood flow for the normal case of about 40% (by volume) red blood cells (RBCs). 43 The motions of RBCs in concentrated suspensions were studied by tracking the particles in flow-through tubes. 27 Non-Newtonian shear thinning with plug flow in the core of the tubes was observed. The RBC viscosity was governed by the deformation of particles. Based on particle interactions in concentrated suspensions, Phillips et al. 46 393 0090-6964/06/0300-0393/0 C 2006 Biomedical Engineering Society
Transcript of Hemodynamic Computation Using Multiphase Flow Dynamics …Hemodynamic Computation Using Multiphase...

Annals of Biomedical Engineering, Vol. 34, No. 3, March 2006 ( C© 2006) pp. 393–407DOI: 10.1007/s10439-005-9017-0
Hemodynamic Computation Using Multiphase Flow Dynamicsin a Right Coronary Artery
JONGHWUN JUNG, AHMED HASSANEIN, and ROBERT W. LYCZKOWSKI
Argonne National Laboratory, 9700 S. Cass Avenue, Argonne, IL
(Received 29 March 2005; accepted 17 November 2005; published online: 15 February 2006)
Abstract—Hemodynamic data on the roles of physiologicallycritical blood particulates are needed to better understand cardio-vascular diseases. The blood flow patterns and particulate buildupwere numerically simulated using the multiphase non-Newtoniantheory of dense suspension hemodynamics in a realistic rightcoronary artery (RCA) having various cross sections. The localhemodynamic factors, such as wall shear stress (WSS), red bloodcell (RBC) buildup, viscosity, and velocity, varied with the spa-tially nonuniform vessel structures and temporal cardiac cycles.The model generally predicted higher RBC buildup on the insideradius of curvature. A low WSS region was found in the high RBCbuildup region, in particular, on the area of maximum curvatureof a realistic human RCA. The complex recirculation patterns, theoscillatory flow with flow reversal, and vessel geometry resultedin RBC buildup due to the prolonged particulate residence time,specifically, at the end of the diastole cycle. The increase of theinitial plasma viscosity caused the lower WSS. These predictionshave significant implications for understanding the local hemo-dynamic phenomena that may contribute to the earliest stage ofatherosclerosis, as clinically observed on the inside curvatures andtorsion of coronary arteries.
Keywords—Multiphase, Particulate buildup, Computational fluiddynamics, Wall shear stress, Non-Newtonian, Secondary flow,Cardiovascular disease.
INTRODUCTION
Atherosclerosis, the most common type of cardiovascu-lar disease,1 is a geometrically focused disease preferen-tially located in the inner curvatures of arteries, near sidebranches, and in the outer wall of bifurcations with com-plex flow patterns.3,9,24,37,69 Several studies have showna strong correlation between hemodynamics and endothe-lial cell functions in the progression of atherosclerosis le-sions.41,53,58 Possible mechanisms for this correlation de-pend on the local flow phenomena, the rheological prop-erties of blood, the artery geometry, and the physiologicalstate of the endothelium.59 Under low wall shear stress(WSS), endothelial cell modulates gene expressions, re-sulting in random cell structures, a decrease of nitric ox-
Address correspondence to Jonghwun Jung, Argonne National Lab-oratory, Energy Technology Division, Building 308,9700 South Cass Av-enue, Argonne, IL 60439. Electronic mail: [email protected]
ide (NO) production, an increase of monocyte adhesionand migration, and an increase of permeability to macro-molecules.7,11,12,28,53,63,64 Understanding the local hemo-dynamic parameters in the blood flow of the human arteryis critical in the diagnosis and treatment30,53,61 of patientswith cardiovascular disease.
In recent years, single-phase computational fluid dy-namics (CFD) techniques, combined with noninvasivemedical imaging, have been used increasingly by re-searchers seeking to better understand hemodynamic fac-tors.4,12,25,31,44,48,51,56,67,68 Various investigators have re-ported the coexistence of regions of low WSS and hightensile stress57,68 and an inverse relationship between WSSand wall thickness.6,36,37 The increase in wall thickness wasinitially associated with plaque accumulation on the vesselwall. The lumen area remained unchanged with stenosisless than 40%.26 After stenoses rose above 40%, however,Wentzel et al.65 observed that the deposition of atheroscle-rotic plaque and vessel remodeling had no consistent corre-lation with low WSS. They suggested a growing importanceof nonshear-stress-related plaque progression with lumennarrowing. Wall thickness was positively correlated withthe curvature and torsion in the human coronary artery andseemed to be influenced by multiple aspects of the dynamicgeometry.69 Zeng et al.67 concluded that WSS is driven bya complex combined effect of local and upstream geometry.Steinman and his colleagues50,52 indicated that clinical de-cisions based on computational analyses must employ theactual vessel geometry for an individual’s cardiovasculardisease, not the idealized vessel geometry, which can onlybe applied in a general sense to the human circulation.
Additional hemodynamic factors to consider wouldbe the cell interaction effect and the spatial distributionof particulate cells in blood flow for the normal caseof about 40% (by volume) red blood cells (RBCs).43
The motions of RBCs in concentrated suspensions werestudied by tracking the particles in flow-through tubes.27
Non-Newtonian shear thinning with plug flow in thecore of the tubes was observed. The RBC viscosity wasgoverned by the deformation of particles. Based on particleinteractions in concentrated suspensions, Phillips et al.46
393
0090-6964/06/0300-0393/0 C© 2006 Biomedical Engineering Society

394 JUNG et al.
derived a constitutive equation that consists of a stresstensor depending on the particle volume fraction and adiffusion equation accounting for shear-induced particlemigration. Based on in vitro experimental results, Munnet al. described the important role of RBCs in leukocyterolling, namely, that the RBCs greatly enhance leukocyteadhesion to activated endothelium.43
To better understand hemodynamics, several recent stud-ies34,40,55 have applied multiphase theory to blood flowmodeling. In the particle trajectory model for describing themotion of dilute spherical blood cells,40 the dominant forcesproved to be the drag and pressure gradient terms; othercontributions were relatively negligible. A model based onnear-wall residence time for particulate-wall interactionsindicated the probability of blood particulate deposition infemoral bypass graft anastomosis. Sun et al.55 analyzedthe interactions between RBCs and leukocytes in a capil-lary tube using a lattice Boltzmann approach. Our recentwork34 showed that RBC buildup in an idealized coronaryartery with the same tube diameter is on the inside radiusof curvature.
In this work, the application of multiphase CFD to testthe hypotheses of local hemodynamics was undertaken fora realistic human right coronary artery (RCA) using themultiphase non-Newtonian theory of concentrated suspen-sion flows.34 The model described the motion of the fluidand the particulates using the concept of local mean vari-ables, where the cell interactions and the drag force becomeimportant. Of specific interest is particulate deposition andWSS at the curvature of tortuous reduction in area as afunction of a cardiac cycle for the geometry effect, likestenosis in a vessel.
METHODS
RCA Geometry
The geometry for a 3-D model of a realistic hu-man RCA was constructed from the views of coronarog-raphy (http://flowlab.fluent.com/exercise/coronary.htm), asdescribed in detail by Berthier et al.4 (Fig. 1). By a tech-nique similar to clinical biplane angiography, 30 consec-utive cross sections were used to generate a realistic 3-DRCA. The vessel had different cross sections along withvariable shapes in the axial direction. From the views ofcoronarography,4 two side branches having small diameters[point (5) of Fig. 1] and a main side branch [point (6) of Fig.1] were observed. In the simulation, we used a long segmentof RCA without any side branches. The inlet area was 15mm2, and the outlet area was 2.2 mm2. The total lengthof the realistic RCA was 0.13 m. A straight entry tube of20-mm length was attached to the realistic RCA to removeinlet effects on the computed flow field and to ensure a fullydeveloped velocity profile in the blood entering region. Amesh was generated using GAMBIT software (from Flu-
ent Inc.) and a Cooper volume-meshing scheme. A meshrefinement having a total thickness of 0.182×10⁻³m wasused in the vicinity of the wall to better resolve the sheargradient. The total number of nodes used for the generatedmesh was 40,734. The total number of elements for themesh was 36,418 with 278 cross sections of 131 faces percross section. We adapted this mesh to our multiphase 3-Dsimulations using GAMBIT software.
Multiphase Governing Equations
A multiphase, non-Newtonian, 3-D CFD model wasdeveloped at Argonne National Laboratory for describingthe hemodynamics in vascular vessels. It uses the principlesof mass, momentum, and energy conservation for eachphase. This approach, based on the generalization ofthe well-known Navier–Stokes equations, is similarto that of Anderson and Jackson2 and Gidaspow.22
The principal difference compared with a single-phasemodel is the appearance of the volume fraction foreach phase, as well as mechanisms for the exchange ofmomentum, heat, and mass between the phases. To solvethe conservation equations for hemodynamics, appropriaterheological properties of each phase have to be specified.A modification of the Carreau–Yasuda viscosity modelwas used to describe the non-Newtonian shear-thinningrheological behavior of blood flow. Gidaspow gives adetailed multiphase flow description in his book.22
In the two-phase non-Newtonian hemodynamic model,the continuous phase is plasma, which contains water andvarious nutrients, minerals, and proteins.39 The predomi-nant dispersed (particulate) phase suspended in the plasmais RBCs, which have a hematocrit or volume fraction rangeof roughly 30–55% in vivo. Leukocytes or white blood cellsand platelets constitute an aggregate volume fraction lessthan one percent. In this paper only RBCs are modeledsince they control the blood rheology.
A general mass balance for each phase (k = plasma,RBCs) is given by
∂(ρkεk)
∂t+ ∇ · (ρkεk �vk) = 0 (1)
where ρ is density, ε is volume fraction, t is time, and vis velocity. In addition, the volume fraction of each phasemust sum to one as
np∑
k=1
εk = 1.0 (2)
where np is total number of phases. The volume fractionoccupied by one phase cannot be occupied by other phases.
The momentum equation for each phase is given by
∂(ρkεk �vk)
∂t+ ∇ · (ρkεk �vk �vk) = −εk∇ p + ∇ · τ k + εkρk �g
+∑
l �=k
βkl (�vl − �vk) + �Fk (3)

Hemodynamic Computation Using Multiphase Flow Dynamics in a Right Coronary Artery 395
FIGURE 1. 3-D computational mesh for a realistic coronary artery generated using Cooper mesh generation algorithm and GAMBITsoftware.4,19 The geometry was reconstructed from the views of coronarography. Point (1): inlet; point (2): the end of a straightentry tube; point (3): maximum curvature; point (4): outlet; and points (5) and (6): the positions of side branches in a real artery.
where p is the pressure, τ is the stress tensor, g is thegravity force, and F is the external forces such as virtualmass, rotational and shear lift, electricity, and magnetism.In the drag force k and l represent plasma or RBCs, and βkl
represents the interphase momentum exchange coefficients.Solving Eqs. (1)–(3) requires several constitutive rela-
tions, discussed next.
Constitutive Relations
Mixture Density
The blood mixture density, ρmix, is given by the sum ofthe volume-fraction-weighted densities for the plasma andRBCs, neglecting the minor blood-borne constituents:
ρmix = εplasmaρplasma + εrbcρrbc (4)
We used a mixture density65 of 1045 kg/m3 with an inlethematocrit of 45% at rest,16 in which the plasma densitywas 1003 kg/m3 and the RBC density8 was 1096 kg/m3.
Blood Rheology Model
The rheological model for blood viscosity is a key fac-tor in the simulation of hemodynamic flows. The non-Newtonian shear-thinning model is able to describe theflow in a neutrally buoyant dense suspension at high vol-ume fraction of particles.14 The Carreau–Yasuda viscositymodel was used to simulate single-phase hemodynamics ina carotid artery bifurcation,25 in which the flattened velocityprofiles were as expected for a shear thinning fluid. In oursimulation, the dimensionless relative mixture viscosity, η,depends on the shear rate as well as the hematocrit, H,in a way similar to that found by Ding et al.14 (Fig. 2).
The dimensionless relative mixture viscosity can be com-puted from the experimental rheological data for humanblood8,66:
η = εRBCµRBC + εplasmaµplasma
µplasma= m
[1 + (λγ̇ )2
](n−1)/2
(5)where m, λ, and n are parameters defined below, andγ̇ = (∇�v + (∇�v)T ) is shear rate (1 / s). The dimensionlessshear rate is given by1 + (λγ̇ )2. In our empirical corre-lation to the experimental data for the hematocrit rangebetween 30 and 75%, the time constant, λ, is taken to be
1
10
100
1 10 100 1000 10000 100000
Dimensionless Shear Rate
vital
eR
ss
eln
ois
ne
miD
eer
utxi
M yti
so
csi
V
H = 30H = 37.4H = 45H = 50H = 75
FIGURE 2. Dimensionless relative blood viscosity, η, as func-tion of dimensionless shear rate, 1 + (λγ̇)2 and hematocrit, ob-tained from experimental data for blood.8,66 The points rep-resent the experimental data at the different hematocrits andshear rates. The solid lines represent the empirical correlationat the constant hematocrit computed from Eq. (5).

396 JUNG et al.
0.110 s, the same as used by Gijsen et al.25 We correlatedthe two parameters n and m in Eq. (5) as a function ofhematocrit, H = εRBC, the RBC volume fraction, by thefollowing polynomial approximations:
n = 0.8092ε3RBC − 0.8246ε2
RBC − 0.3503εRBC + 1
m = 122.28ε3RBC − 51.213ε2
RBC + 16.305εRBC + 1(6)
As shown in Fig. 2, the dimensionless relative mixture vis-cosity increases with hematocrit and decreases with increas-ing dimensionless shear rate, displaying shear-thinning be-havior. As the hematocrit goes to zero, Eq. (5) reducesto the Newtonian plasma viscosity. This model is appliedto the wider physiological range of hematocrit lower than75%, where the dimensionless shear rate is between 1.2and 25,000, corresponding to a shear rate, γ̇ , of betweenapproximately 4 and 1500. Calculations with our empiricalmixture viscosity model vary from experimental data,21,66
near a shear rate of 1000. However, the difference is negli-gible for low hematocrit.
Plasma Stress Tensor
The stress tensor for the plasma phase is given by theNewtonian form as follows:
τ = εµ(∇�v + (∇�v)T ) + ε
(κ − 2
3µ
)∇ · �v I (7)
Here, κ and µ are the bulk and shear viscosity for the plasmaphase, respectively. ε is volume fraction of plasma, and Iis a unit tensor. The plasma bulk viscosity (κ) is assumedto be zero. The plasma viscosity, µplasma, is treated as aNewtonian fluid having a viscosity of 1 cp.
RBC Stress Tensor
The stress tensor for the RBC phase, the force experi-enced by the particle as a result of direct contact with otherparticles,2,22 is given by the form
τ = −pδ + εµ(∇�v + (∇�v)T ) + ε
(κ − 2
3µ
)∇ · �v I (8)
where δ is the Kronecker delta. The RBC pressure pRBC
then represents an interparticle pressure as a function ofvolume fraction of particulate, i.e., εRBC. This pressure is aresult either of the collision of particulates with each otheror elastic or inelastic contact between particulates, causinga repulsive force. A compressive force must be appliedto bring the particulates closer together. In our RBC-basedsimulation, the physical constraint that the particulates can-not overlap is assumed to be 90% hematocrit, since blood isfluid even at 98% hematocrit by volume.21 As a result, theinterparticle pressure for a suitable hematocrit range in thesimulation is negligibly small. RBC-RBC interactions [Eq.(8)] are represented by the product of effective viscosities
and shear rate of the RBCs, where the RBC bulk viscosity(κ) is assumed to be zero. The effective RBC viscosity,µRBC, is treated as a non-Newtonian shear-thinning fluidcalculated from Eq. (5). Hence, it depends on the shear rateand the concentration of RBC, i.e., hematocrit.
External Forces
As a particulate moves through a viscous fluid, a re-sistance to its motion is caused by the interphase drag.The RBCs behave somewhat like a liquid droplet in bloodflow.21 The interphase momentum exchange coefficients,β, between the plasma and RBCs are determined by theSchiller and Naumann model19 as
β = 3
4Cd
ρplasmaεplasmaεRBC|�vplasma − �vRBC|dRBCφ
(9)
where the drag coefficient, Cd, on a single sphere is relatedto the Reynolds number, Rep, as
Cd = 24
Rep
[1 + 0.15 Re0.687
p
]for Re < 1000 (10)
Cd = 0.44 for Re ≥ 1000 (11)
Rep = ρplasma dRBC
∣∣�vplasma − �vRBC
∣∣φµplasma
(12)
where d is the diameter of RBCs, and φ is the shape factor.The most important factor for the motion of particulates
is the fluid-particulate interaction force as a function ofthe relative velocity between the plasma and RBCs. Thecoupling between the momentum equation [Eq. (3)] forthe plasma phase and the RBC phase is made explicit bythis drag term. As in the case of the mixture equations forcomponents22, the mixture equations for phases show thatthe sum of the drag forces in Eq. (3) is zero.
A correction factor called the “shape factor” is addedto account for the effect of shape on particulate motionin the drag force. The shapes of particulates (sphere, disk,spheroids, and clusters of spheres) affect the drag forcethrough the drag coefficients and the shape factor. In thissimulation, the RBC shape for computing the drag force isassumed to be spherical, i.e., φ = 1. The drag force is animportant factor to determine correct flow fields with RBCbuildup in the local position. In future studies, its effect onthe simulations will be assessed in detail.
Other external forces acting on each phase consist of thevirtual mass and shear lift forces. The virtual mass force19
is given by
�Fvm = 0.5εmρk
(dk �vk
dt− dm �vm
dt
)∣∣∣∣k �=m
(�Fvm,k = − �Fvm,m
)(13)

Hemodynamic Computation Using Multiphase Flow Dynamics in a Right Coronary Artery 397
0
20
40
60
80
100
120
0 0.1 0.2 0.3 0.4 0.5 0.6 0.7 0.8
Cardiac Cycle Time (s)
)g
Hm
m( eru ss er
P
0
0.01
0.02
0.03
0.04
0.05
0.06
0.07
0.08
0.09
0.1
yticole
V telnI
)s/m(
in vivo Aorta PressureRCA Velocity
FIGURE 3. Inlet velocity waveform generated from RCA bloodflow patterns and in vivo pressure and flow rate in the ascend-ing aorta.10,45,47 Cardiac cycle period: 0.735 s.
where
d �vdt
= ∂ �v∂t
+ (�v · ∇) �v (14)
The shear lift force is given by
�Flift = −0.5εmρk (�vk − �vm) × (∇ × �vk)|k �=m
( �Flift,k = − �Flift,m) (15)
For multiphase flows, the virtual mass effect occurs when aparticulate phase accelerates relative to the primary phase.The lift force acts on a particulate mainly due to velocitygradients in the primary-phase flow field. In our coronaryartery simulation the estimated virtual mass force and thelift force were negligible.
Numerical Considerations, and Boundary and InitialConditions
To solve the partial differential equations given above asan initial value problem, the appropriate initial and bound-ary conditions are critical for the performance of a realis-tic simulation and comparison with experimental data. Tosimulate blood flow, we used the commercial code FLU-ENT 6.1.22,19 which contains the multiphase 3-D Eulerian–Eulerian model based on the finite-volume unstructuredmesh method. The numerical solution method uses a stag-gered grid arrangement. The scalar variables are located atthe cell center, and the vector variables are located at thecell boundaries. The momentum equation is solved with astaggered mesh, while the continuity equation is solved bya donor cell method. For gas-particle flow dominated byconvection, the bubble shapes strongly depend on the nu-merical diffusion introduced by the discretization schemesof the convection terms in the momentum equations.29,33
Multiphase CFD models have been validated by compar-ing calculated results with the measured data for spatialand temporal velocities and concentrations obtained fromexperimental techniques.22,35 The two-phase CFD modelwith the non-Newtonian shear-thinning model was initiallyvalidated for a neutrally buoyant dense suspension flow.13,
14 The current model in the FLUENT code was successfullyapplied by reanalyzing NMR slurry measurements49 for theapplication of blood flow.34
A pulsatile inlet velocity waveform with a cardiac periodof 0.735 s was used as an inlet boundary condition forboth the RBCs and plasma (Fig. 3). It was generated fromblood flow patterns for RCA45 and in vivo pressure andflow rate measured in the ascending aorta.10,47 The inletvelocity profiles were maintained uniform across the inletcross section. The boundary condition for zero slip velocitywas employed for both RBCs and plasma. The RBCs wereconsidered as spherical particles with a diameter of 8 µm.
FIGURE 4. Comparison of driving forces [Eq. (3)] determining the motion of red blood cells in the concentrated suspension flowcomputed by an Eulerian–Eulerian multiphase model. Computational simulations (a) with only the stress tensor term, (b) with thestress tensor and the gravity terms, (c) with the stress tensor and the gravity and the drag terms, and (d) with the gravity andthe drag terms. The cross sections were obtained from the maximum curvature [point (3)] indicated in Fig. 1 at 0.16 s. The colorindicates the RBC volume fraction, a the vector represents the secondary flow. The direction for gravity is positive Y.

398 JUNG et al.
The inlet volume fraction of RBCs was maintained steadyat 45%. For initial conditions the RBC volume fraction wasset to 45%, and both RBC and plasma velocities were setto zero. The FLUENT’s outflow boundary condition at theexit was used, where the reference pressure was set to 75mmHg. The outflow velocity and pressure in the FLUENTcode were updated in a manner that was consistent with afully developed-flow assumption. The maximum residualfor convergence of velocity and mass was 10−3 using aconstant time step of 10−4 s on a personal computer havinga 3.2-GHz processor running under a Windows system. Theaverage run time for a complete cardiac cycle was 33/4 hfor the multiphase flow and 23/4 h for the single-phase flow.The non-Newtonian viscosity model for single-phase flowwith a constant hematocrit and a density of 1045 kg/m3 wasa function of shear rate alone.
All simulations for the realistic RCA with rigid wallwere carried out in the 3-D computational domain. Thenon-Newtonian shear-thinning viscosity model for RBCs,the transient inlet-mixture velocity waveforms for the car-diac cycle, the lift force model, and the drag force modelwere programmed into the FLUENT code as individual sub-routine files. The computations were run for 21 completecardiac cycles. Most of the data analysis was performed forthe 20th cardiac cycle. Relative RBC buildup was repre-sented as follows:
Relative RBC buildup (%)
= RBC volume fraction − Initial RBC volume fraction
Initial RBC volume fraction×100% (16)
RESULTS
A non-Newtonian shear thinning model was developedfor describing the concentrated suspension flow of blood(Fig. 2), as shown in the literature.5,21,35 The model agreedwell with rheological data of blood in the RBC deformationregion, except for the very low shear rate obtained with highlevel of hematocrit.
The RBC motions were estimated using the multiphasehemodynamic model with the developed constitutive rela-tions. Clustering and segregation of particulates occur dueto the Bernoulli effect from the change of area, i.e., pressureand velocity fields.23 The dominant driving forces for theparticulate motion are assumed to be the fluid-particulateinteractions due to the drag force and the particulate–particulate interactions.2,22,35 The latter is known as theparticulate stress tensor [Eq. (8)] or pressure force. Withoutthe drag force, the simulations predicted the particulatesegregation over the whole range of RBC volume fractionbetween 1.0 and 0 [Figs. 4(a) and 4(b)]. The distributionsof the RBC volume fraction approached two limiting cases.The secondary flow was computed to be an order of mag-
0.45
0.46
0.47
0.48
0.49
0.50
0.51
0.0 2.0 4.0 6.0 8.0 10.0 12.0 14.0 16.0
Cardiac Cycle Time(s)
Cn
oc
tne
rat
fo
noi
RB
Cs
0.E+00
4.E-06
8.E-06
0 2 4 6
Frequency (Hz)
rew
oP
lartc ep
Syt is
neD
1.37Hz
2.74Hz
FIGURE 5. Averaged RBC volume fraction as a function ofcardiac cycle time at a point of maximum curvature [point (3)]indicated in Fig. 1. Frequency was obtained from between 10thand 20th cardiac cycle.
nitude higher near the lowest limiting case (εRBC = 0). Theabsence of the particulate stress tensor caused a divergencedue to the high packing of particulates.
Gravity affected the distribution of RBC volume fractionand the velocity fields. Its effect, however, was reducedby the drag force added to the momentum equations. Themodel with added drag force [Fig. 4(c)] predicted bloodflow with relatively high RBC concentrations in the center.The RBC buildup near the wall was observed in the regionof lower absolute pressure in the cross section. Actually,the complete fluid-particulate interactions include the to-tal pressure gradient term in the momentum equation forthe particulate phase [Eq. (3)], as described by Andersonand Jackson.2 Without the particulate stress tensor [Fig.4(d)], the features of non-Newtonian shear thinning flowdisappear. In the simulation, the virtual and lift forces wererelatively small compared with the drag force. The differ-ence due to the added forces was two orders of magnitudesmaller than when compared with the difference betweenFig. 4(c) and Fig. 4(d) indicated by the added stress tensor.The effect of the virtual force was relatively smaller than thelift force at the measured point of the maximum curvature[point (3) of Fig. 1]. The observations for the main drivingforces agreed with the results from the multiphase model22
and the particle trajectory model.40
A quasisteady-state condition for the plasma-RBChemodynamic simulations was established, depending onhemodynamic factors, in which the cardiac events relatedto valve function were repeated with a period of 0.735s (Fig. 3). In the single-phase simulations, this conditionwas established within the fifth cardiac cycle for all hemo-dynamic factors. In the multiphase simulation, however,it was essentially established by the end of the 14th car-diac cycle (Fig. 5), because a limit cycle behavior of localRBC buildup formed more slowly than other hemodynamic
Hemodynamic Computation Using Multiphase Flow Dynamics in a Right Coronary Artery 399
FIGURE 6. Inlet velocity profiles at the entrance region with the additional straight tube of 20 mm between points (1) and (2) ofFig. 1: (a) the axial velocity distributions in the cross sections for the diastole phase at the cardiac cycle time of 14.7 s; (b) theaxial velocity profiles at 14.7 s, and (c) 14.1 s. Flow is in the minus direction of the z-coordinate. The axial direction is the directionparallel with the vessel tube. The color bar represents the axial velocity.
factors. Local hemodynamic factors oscillated with themain frequency of 1.37 Hz. The second frequency was2.74 Hz. The frequencies were calculated by fast Fouriertransform between the 10th and 20th cardiac cycle.
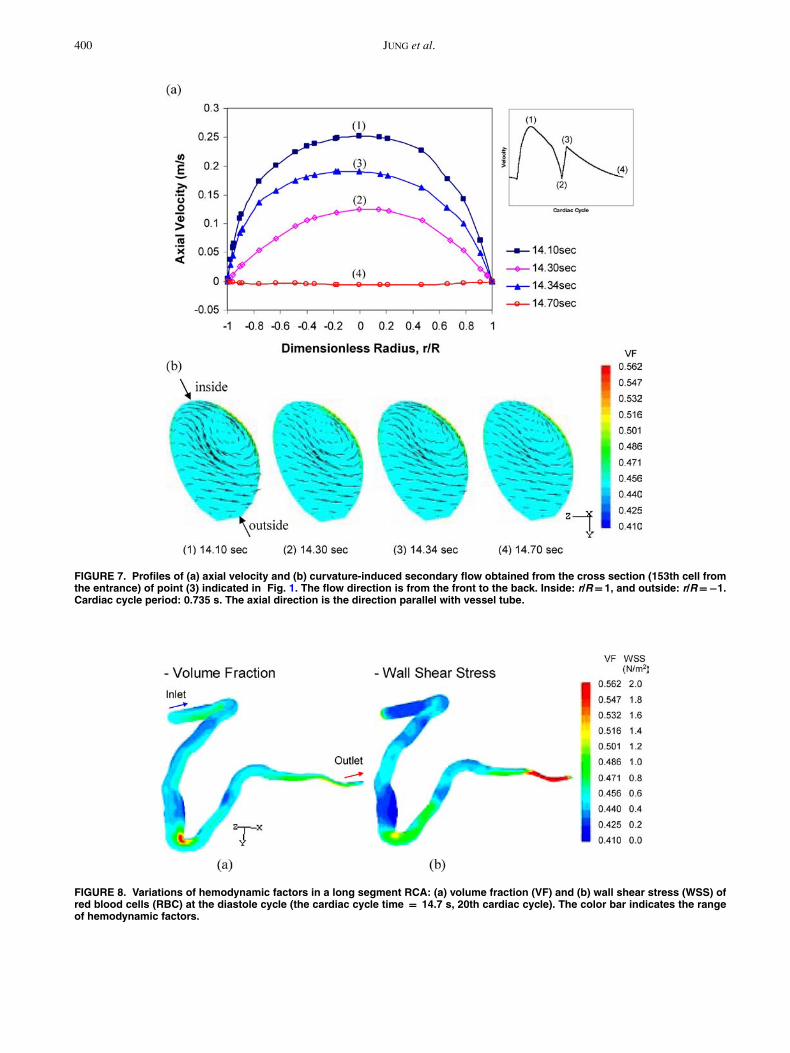
Local axial velocity varied along the length of the RCA(Figs. 6 and 7) with the inlet velocity waveform generatedby the cardiac events of the valve function (Fig. 3). Theaverage flow rate of blood in the inlet was approximately35 ml/min, corresponding to a mean inlet velocity of 0.042m/s, as reported in the literature.4 Inlet velocity profileswere indicated by a partial plug flow in the entrance regionof the added straight tube (Fig. 6). The axial peak velocityat the maximum curvature (Fig. 7) reached a value of 0.25m/s during the systole cycle, and then decreased to zeroduring the diastole cycle. The velocity distribution in theoutlet became almost parabolic with smaller cross-sectionarea.
A feature of non-Newtonian flow was a flat velocityprofile in the center region of the added tube (Fig. 6). Theentrance length for fully developed laminar flow in the tubeis 7.6 mm for a mixture Reynolds number of about 50,based upon classical transport theory.5 The entrance lengthof 20 mm for blood flow was sufficient for our simulation.The flow was fully developed within the artery length of15 mm. In the maximum curvature we are interested, the
axial velocity was predicted to be slightly minus at the endof the diastole cycle [point (4) of Fig. 7(a)]. The curvature-induced secondary flow profiles exhibited a single vortex[Fig. 7(b)]. The magnitude was the same order of magni-tude as the axial velocity at the end of the diastole cycle.The recirculation intensity of the secondary flow also var-ied during the cardiac cycle. The extent of RBC buildupgenerally increased with the aorta valve closure, before thebeginning of the diastole phase in each cardiac cycle, anddecreased during the systole phase.
In the long segment of RCA including the inlet and out-let area, we found that the computed local hemodynamicfactors such as RBC volume fraction and WSS vary alongthe length of this artery, which has non-uniform geome-try and diameter (Fig. 8). The non-Newtonian multiphaseCFD model generally predicted RBC buildup on the insideradius of curvature of a realistic human RCA [Fig. 8(a)].In particular, the simulation predicted higher RBC buildupwith a volume fraction of about 0.55 on the area of max-imum curvature just upstream of a tortuous reduction inarea. Such a distinguishing mark is due to the segregationof blood-borne particulates in the multiphase CFD model.
The WSS distribution [Fig. 8(b)] showed a similar trendto that observed with the single-phase CFD model. Com-pared with other RCA areas, the WSS in the inlet area is
400 JUNG et al.
FIGURE 7. Profiles of (a) axial velocity and (b) curvature-induced secondary flow obtained from the cross section (153th cell fromthe entrance) of point (3) indicated in Fig. 1. The flow direction is from the front to the back. Inside: r/R = 1, and outside: r/R =−1.Cardiac cycle period: 0.735 s. The axial direction is the direction parallel with vessel tube.
FIGURE 8. Variations of hemodynamic factors in a long segment RCA: (a) volume fraction (VF) and (b) wall shear stress (WSS) ofred blood cells (RBC) at the diastole cycle (the cardiac cycle time = 14.7 s, 20th cardiac cycle). The color bar indicates the rangeof hemodynamic factors.
Hemodynamic Computation Using Multiphase Flow Dynamics in a Right Coronary Artery 401
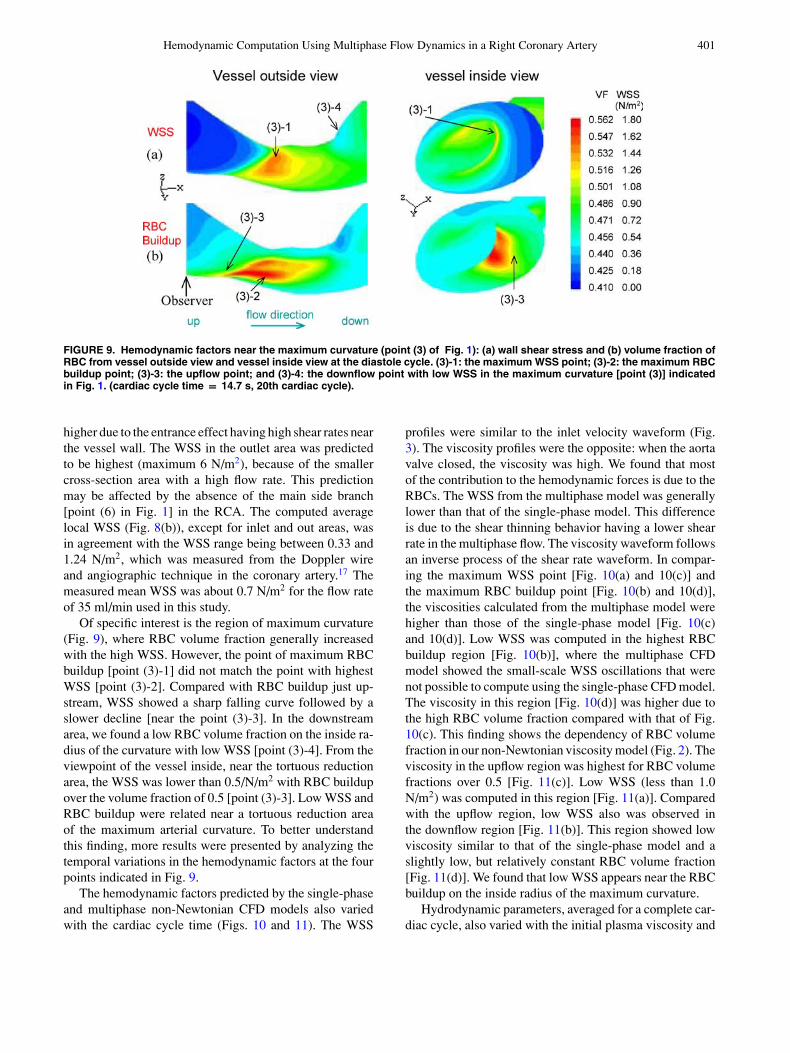
FIGURE 9. Hemodynamic factors near the maximum curvature (point (3) of Fig. 1): (a) wall shear stress and (b) volume fraction ofRBC from vessel outside view and vessel inside view at the diastole cycle. (3)-1: the maximum WSS point; (3)-2: the maximum RBCbuildup point; (3)-3: the upflow point; and (3)-4: the downflow point with low WSS in the maximum curvature [point (3)] indicatedin Fig. 1. (cardiac cycle time = 14.7 s, 20th cardiac cycle).
higher due to the entrance effect having high shear rates nearthe vessel wall. The WSS in the outlet area was predictedto be highest (maximum 6 N/m2), because of the smallercross-section area with a high flow rate. This predictionmay be affected by the absence of the main side branch[point (6) in Fig. 1] in the RCA. The computed averagelocal WSS (Fig. 8(b)), except for inlet and out areas, wasin agreement with the WSS range being between 0.33 and1.24 N/m2, which was measured from the Doppler wireand angiographic technique in the coronary artery.17 Themeasured mean WSS was about 0.7 N/m2 for the flow rateof 35 ml/min used in this study.
Of specific interest is the region of maximum curvature(Fig. 9), where RBC volume fraction generally increasedwith the high WSS. However, the point of maximum RBCbuildup [point (3)-1] did not match the point with highestWSS [point (3)-2]. Compared with RBC buildup just up-stream, WSS showed a sharp falling curve followed by aslower decline [near the point (3)-3]. In the downstreamarea, we found a low RBC volume fraction on the inside ra-dius of the curvature with low WSS [point (3)-4]. From theviewpoint of the vessel inside, near the tortuous reductionarea, the WSS was lower than 0.5/N/m2 with RBC buildupover the volume fraction of 0.5 [point (3)-3]. Low WSS andRBC buildup were related near a tortuous reduction areaof the maximum arterial curvature. To better understandthis finding, more results were presented by analyzing thetemporal variations in the hemodynamic factors at the fourpoints indicated in Fig. 9.
The hemodynamic factors predicted by the single-phaseand multiphase non-Newtonian CFD models also variedwith the cardiac cycle time (Figs. 10 and 11). The WSS
profiles were similar to the inlet velocity waveform (Fig.3). The viscosity profiles were the opposite: when the aortavalve closed, the viscosity was high. We found that mostof the contribution to the hemodynamic forces is due to theRBCs. The WSS from the multiphase model was generallylower than that of the single-phase model. This differenceis due to the shear thinning behavior having a lower shearrate in the multiphase flow. The viscosity waveform followsan inverse process of the shear rate waveform. In compar-ing the maximum WSS point [Fig. 10(a) and 10(c)] andthe maximum RBC buildup point [Fig. 10(b) and 10(d)],the viscosities calculated from the multiphase model werehigher than those of the single-phase model [Fig. 10(c)and 10(d)]. Low WSS was computed in the highest RBCbuildup region [Fig. 10(b)], where the multiphase CFDmodel showed the small-scale WSS oscillations that werenot possible to compute using the single-phase CFD model.The viscosity in this region [Fig. 10(d)] was higher due tothe high RBC volume fraction compared with that of Fig.10(c). This finding shows the dependency of RBC volumefraction in our non-Newtonian viscosity model (Fig. 2). Theviscosity in the upflow region was highest for RBC volumefractions over 0.5 [Fig. 11(c)]. Low WSS (less than 1.0N/m2) was computed in this region [Fig. 11(a)]. Comparedwith the upflow region, low WSS also was observed inthe downflow region [Fig. 11(b)]. This region showed lowviscosity similar to that of the single-phase model and aslightly low, but relatively constant RBC volume fraction[Fig. 11(d)]. We found that low WSS appears near the RBCbuildup on the inside radius of the maximum curvature.
Hydrodynamic parameters, averaged for a complete car-diac cycle, also varied with the initial plasma viscosity and

402 JUNG et al.
FIGURE 10. Temporal variations of hemodynamic factors near the maximum curvature [point (3)] indicated in Fig. 1. WSS variationsat (a) the maximum WSS point [point (3)-2 of Fig. 9] and (b) the maximum RBC buildup point [point (3)-1 of Fig. 9]. Variations of RBCvolume fraction and viscosity at (c) the maximum WSS point and (d) the maximum RBC buildup point. The mixture values for themultiphase model are volume-fraction-averaged plasma and RBC values. RBC: WSS due to RBCs computed from the multiphasemodel. RBC C: volume fraction of RBCs computed from the multiphase model. Mixture: total WSS or mixture viscosity computedfrom the multiphase model. Single: WSS or viscosity computed from the single-phase model at the same condition.
the initial RBC volume fraction in the artery (Fig. 12).As the initial plasma viscosity increased, the relative RBCbuildup and WSS decreased. Also, as the initial RBC vol-ume fraction increased, the relative RBC buildup decreased,but WSS increased. For nonspherical particles, presented bythe shape factor (φ) greater than one, both hydrodynamicparameters increased.
DISCUSSION
We have estimated the hemodynamic factors in a realistichuman RCA using a multiphase, transient, non-Newtonian,three-dimensional CFD model, FLUENT. The rheologicalproperties of human blood were determined from the non-Newtonian shear-thinning model as a function of shear rate
and hematocrit, based on experimental data (Fig. 2). Themodel successfully described the concentrated suspensionflow of blood in the wider physiological range of hema-tocrit and the shear rate. For blood flow, the viscosity ofnormal human RBCs having very high fluidity is differentfrom rigid spheres at the concentrated suspension flow.21
In normal circulation, the shear rate in the arteries andcapillaries is probably above 200 s−1. The deformation ofRBCs due to shear rate can be described by Eq. (8), thatis, the non-Newtonian shear-thinning model. In a crowdedsituation at high shear rate, RBCs are more deformablethan colliding particulates due to their biconcave shape.21
The plasma acts as a buffer fluid preventing direct contactbetween the particulate surfaces. Hence, the interparticlepressure term of Eq. (8) is negligibly small for the suitablerange of hematocrit and shear rates in the circulating blood

Hemodynamic Computation Using Multiphase Flow Dynamics in a Right Coronary Artery 403
FIGURE 11. Temporal variations of hemodynamic factors near the maximum curvature [point (3)] indicated in Fig. 1. WSS variationsat (a) the upflow [point (3)-3 of Fig. 9] and (b) the downflow [point (3)-4 of Fig. 9]. Variations of RBC volume fraction and viscosityat (c) the upflow and (d) the downflow. The mixture values for the multiphase model are volume-fraction-averaged plasma andRBC values. RBC: WSS due to RBCs computed from the multiphase model. RBC C: volume fraction of RBCs computed fromthe multiphase model. Mixture: total WSS or mixture viscosity computed from the multiphase model. Single: WSS or viscositycomputed from the single-phase model at the same condition.
flow. As a limiting case, the RBC aggregation at low shearrate is assumed to be negligible in this model.
An additional hemodynamic factor of RBC buildup wasobtained from the multiphase CFD model: the relation-ship between WSS and the vessel geometry, where theplaques are known to typically occur. In the single-phaseCFD model with a patient-specific geometry for a coronaryartery, high WSS was predicted at the stenosis itself on theinside curvature, but when compared with clinical observa-tions,18,62 low WSS was actually found around the steno-sis. Van Langenhove et al.60 observed helical flow drivenby the curvature in such a coronary artery. In an in vivo6-month follow-up study of native arterial segments,53,54
low WSS was associated with the outward remodeling ofatherosclerosis, a feature of vulnerable plaque. In these re-gions, WSS relatively increased with the increase of plaque
thickness without a change of lumen area. To accuratelyidentify arterial segments bearing vulnerable plaque, morehemodynamic factors in the circulating blood need to bedefined.
Hemodynamic factors strongly depend on the non-uniform vessel structure of a patient-specific geometry(Fig. 8). We have conducted a detailed analysis in the cur-vature region of RCA using the multiphase CFD model.We found that geometry-dependent WSS is associated withRBC buildup of a tortuous reduction area of the maxi-mum arterial curvature, even in the absence of significantlumen obstruction (Figs. 8 and 9). Large- and small-scaleoscillations for WSS were observed in the maximum RBCbuildup region (Fig. 10). The computation also showed thatthe oscillatory flow with flow reversal and the secondaryflow in this curvature play important roles in local RBC

404 JUNG et al.
0
1
2
3
4
5
6
7
8
9
10
0.8 1 1.2 1.4 1.6 1.8 2
Initial Plasma Viscosity (cp)
)%(
pudli
uB
CB
R evitaleR
2.00
2.02
2.04
2.06
2.08
2.10
2.12
2.14
2.16
m/N( s sert
S raehS lla
W2)
Buildup
WSS
0
2
4
6
8
10
12
0 0.1 0.2 0.3 0.4 0.5 0.6 0.7 0.8
Initial RBC Volume Fraction
)%(
pudli
uB
CB
R evita leR
0.0
0.5
1.0
1.5
2.0
2.5
3.0
3.5
4.0
m /N( ssert
S raehS lla
W2)
Buildup
WSS
0
5
10
15
20
0.9 1.0 1.1 1.2 1.3 1.4
Dynamic Shape Factor
liu
B C
BR evit ale
R)
%( p
ud
2.00
2.05
2.10
2.15
2.20
2.25
2.30
2.35
m/N( s sert
S r aeh
S ll aW
2 )
Buildup
WSS
(a) (b)
(c)
FIGURE 12. Hemodynamic parameters (relative RBC buildup and mixture WSS) computed as a function of (a) initial plasmaviscosity, (b) initial RBC volume fraction and (c) shape factor. The values averaged for third cardiac cycle at a point of maximumcurvature [point (3)] indicated in Fig. 1.
buildup in a realistic RCA (Fig. 7). Such a flow patterncauses the particulate deposit to shift to the upstream areaof the maximum curvature, where low and oscillating WSSwas computed (Figs. 10 and 11). As the WSS decreases,the RBC buildup generally increases during the diastole cy-cle. Hemodynamic conditions having low WSS in specificregions may relate to transport mechanisms of other bloodcomponents. In the low WSS region exposed to flow rever-sal, the endothelium is more easily penetrated by the mono-cytes and proteins.12,41,56,58 The prolonged residence timein the recirculation area allows for increased interactionsbetween cellular components and the vessel wall, specifi-cally, at the end of the diastole cycle. Our computationalresults are consistent with earlier clinical observations foratherosclerotic lesions.15,53,60 Our findings are consistentwith the hypotheses for progression of atherosclerosis de-scribed by Stone et al.53. Our simulations may give fur-ther insight into the hemodynamic characteristic for ini-
tial plaque formation and minor obstacle development inthe maximum arterial curvature. Clinical observations suchas plaque thickness and the degree of stenosis would benecessary.
Hemodynamic features were greatly affected by the rhe-ological nature of blood elements. In normal circulation,the viscosity of whole blood is about 4 cp,25,37 whichis the mixture viscosity computed from the multiphaseCFD model. At the high shear rates with an assumptionof no cell aggregation, the viscosity of blood is primarilyaffected by hematocrit and plasma viscosity. The majordeterminants of plasma viscosity are the concentrations ofhigh-molecular-weight plasma proteins such as fibrinogenand lipoproteins.20,32,38 The increase of the relative initialplasma viscosity due to the plasma protein concentrationsmight result in an increase of flow resistance. It affectedthe RBC fluidity, resulting in a WSS decrease on the innerartery wall for the same hematocrit and mixture viscosity

Hemodynamic Computation Using Multiphase Flow Dynamics in a Right Coronary Artery 405
(Fig. 12). The computed results agree with those of theliterature,20,32, 38 where the high value of plasma viscosityindicates susceptibility to coronary disease.
In in vitro experiment,42,43 the presence of RBCs en-hanced the leukocyte adhesion to the endothelium mono-layer, along with a dramatic increase of leukocyte rollingdensities and binding rates. The leukocyte behavior canbe influenced by the dispersion due to the RBC-leukocytecollisions in the bulk flow. The cell interactions increasedthe collision frequency with the endothelium.43 In the com-putational simulation, a non-Newtonian shear thinning ef-fect was enhanced by the increase of initial RBC volumefraction (Fig. 12). The shear rate near the wall increasedbecause the velocity distribution has a flatter profile in thecenter region of the artery. The RBC addition results in aWSS increase on the wall of the artery. The computationpredicted that most of the contribution to the WSS is dueto the RBCs. Munn et al.43 found that the adding of RBCsmay modify the existing paradigm for the pathological re-sponse of endothelial cells. We expect the cell interactions,including leukocyte and platelets, in blood flow to play animportant role in the early stage of atherosclerotic plaqueformation.
In the drag term to account for fluid-particulate interac-tions, the shape factor is defined as the ratio of the actualresistance force of the nonspherical particle to the resistanceforce of a sphere having the same volume and velocity.This means that the shape factor for nonspherical particlesis generally greater than 1.0, and more drag is experiencedby the nonspherical particle in fluid. If it is applicable tobiconcave-shaped RBC and/or their agglomerates, WSSmight be positively increased, as shown in computationalresults (Fig. 12). It becomes plausible that the biconcave-shaped RBC has more advantages than the spherical shapein the transport of circulating blood.21 More studies will berequired for nonspherical RBC with flow conditions.
Although this multiphase CFD model does not includethe physiologically realistic motions in an artery havingseveral branches, the model has begun to shed light onimportant hemodynamic phenomena, which have eludedinvestigators using single-phase CFD models, such as par-ticulate migration and interactions at the surface of endothe-lial cells. When the model includes monocytes with RBCs,the correlation between low WSS and particulate builduprelated to atherogenesis on a realistic artery is expected tobe better understood. Additional hemodynamic factors toconsider would be the mass transfer between blood and thearterial wall, and the cyclic bending of coronary arteriesdriven by the heart beat.48,51
ACKNOWLEDGMENTS
We thank Dr Marc Horner of Fluent, Inc., for his techni-cal support with the FLUENT code and Professor SanjeevG. Shroff of the University of Pittsburgh and Dr Chan-
drakant B. Panchal of ANL for their advice in the biomed-ical area. This study was supported under U.S. Departmentof Energy contract W-31-109-Eng-38.
REFERENCES
1American Heart Association. Heart Disease and StrokeStatistics—2004 Update. Dallas: American Heart Association.Available at www.americanheart.org, 2004.
2Anderson, T. B., and R. Jackson. A fluid mechanical descriptionof fluidized beds. I&EC Fundament. 6:524–539, 1967.
3Berger, S., and L. Jou. Flows in stenotic vessels. Annu. Rev.Fluid Mech. 32:347–382, 2000.
4Berthier, B., R. Bouzerar, and C. Legallais. Blood flow patternsin an anatomically realistic coronary vessel: Influence of threedifferent reconstruction methods. J. Biomech. 35:1347–1356,2002.
5Bird, R. B., W. E. Stewart, and E. N. Lightfoot. Transport Phe-nomena. New York: Wiley, 1960.
6Bonert, M., R. L. Leask, J. Butany, C. R. Ethier, J. G. Myers,K. W. Johnston, and M. Ojha. The relationship between wallshear stress distributions and intimal thickening in the humanabdominal aorta. Biomed. Eng. Online 2:I8, 2003.
7Boo, Y. C., J. Hwang, M. Sykes, B. J. Michell, B. E. Kemp,H. Lum, and H. Jo. Shear stress stimulates phosphorylation ofeNOS at Ser635 by a protein kinase A-dependent mechanism.Am. J. Physiol. Heart Circ. Physiol. 283:H1819–H1828, 2002.
8Brooks, D. E., J. W. Goodwin, and G. V. F. Seaman. Interactionsamong erythrocytes under shear. J. Appl. Physiol. 28:172–177,1970.
9Caro, C. G., J. M. Fitz-Gerald, and R. C. Schroter. Arterialwall shear and distribution of early atheroma in man. Nature223:1159–1161, 1969.
10Cholley, B. P., S. G. Shroff, J. Sandelski, C. Korcarz, B. A.Balasia, S. Jain, D. S. Berger, M. B. Murphy, R. H. Marcus, andR. M. Lang. Differential effects of chronic oral antihypertensivetherapies on systemic arterial circulation and ventricular ener-getics in African-American patients. Circulation 91:1052–1062,1995.
11Corson, M. A., N. L. James, S. E. Latta, R. M. Nerem, B. C. Berk,and D. G. Harrison. Phosphorylation of endothelial nitric oxidesynthase in response to fluid shear stress. Circ. Res. 79:984–991,1996.
12Dai, G., M. R. Kaazempur-Mofrad, S. Natarajan, Y. Zhang, S.Vaughn, B. R. Blackman, R. D. Kamm, G. Garcia-Cardena, andM. A. Gimbrone Jr. Distinct endothelial phenotypes evoked byarterial waveforms derived from atherosclerosis-susceptible and-resistant regions of human vasculature. Proc. Natl. Acad. Sci.101:14871–14876, 2004.
13Ding, J., R. W. Lyczkowski, W. T. Sha, S. A. Altobelli, and E.Fukushima. Numerical analysis of liquid-solid suspension ve-locities and concentrations obtained by NMR imaging. PowderTechnol. 77:301–312, 1993.
14Ding, J., R. W. Lyczkowski, and W. T. Sha. Modeling of con-centrated liquid-solids flow in pipes displaying shear-thinningphenomena. Chem. Eng. Commun. 138:145–155, 1995.
15Ding, Z., H. Zhu, and M. H. Friedman. Coronary artery dynamicsin vivo. Ann. Biomed. Eng. 30:419–429, 2002.
16 Dill, D. B., and D. L. Costill. Calculation of percentage changesin volumes of blood, plasma, and red cells in dehydration. J.Appl. Physiol. 37:247–248, 1974.
17Doriot, P.-A., P.-A. Dorsaz, L. Dorsaz, E. D. Benedetti, P. Chate-lain, and P. Delafontaine. In-vivo measurements of wall shear
406 JUNG et al.
stress in human coronary arteries. Coron. Artery Dis. 11:495–502, 2000.
18Feldman, C. L., O. J. Ilegbusi, Z. Hu., R. Nesto, S. Waxman, andP. H. Stone. Determination of in vivo velocity and endothelialshear stress patterns with phasic flow in human coronary arteries:A methodology to predict progression of coronary atheroscle-rosis. Am. Heart J. 143:931–939, 2002.
19Fluent Inc. FLUENT User’s Guide. Lebanon, NH: Fluent Inc.,2003.
20Fuchs, J., I. Weinberger, Z. Rotenberg, A. Erdberg, E. Davidson,H. Joshua, and J. Agmon. Plasma viscosity in ischemic heartdisease. Am. Heart J. 108:435–439, 1984.
21Fung, Y. C. Biomechanics: Mechanical Properties of LivingTissues. New York: Springer, 1993.
22Gidaspow, D. Multiphase Flow and Fluidization: Continuumand Kinetic Theory Descriptions. New York: Academic Press,1994.
23Gidaspow, D., J. Jung, and R. K. Singh. Hydrodynamics of flu-idization using kinetic theory: An emerging paradigm. PowderTech. 148:123–141, 2004.
24Giddens, D. P., C. K. Zarins, and S. Glagov. Role of fluid me-chanics in the localization and detection of atherosclerosis. J.Biomech. Eng. 115:588–594, 1993.
25Gijsen, F. J. H., F. N. Van de Vosse, and J. D. Janssen. Theinfluence of the non-Newtonian properties of blood on the flowin large arteries: Steady flow in a carotid bifurcation model. J.Biomech. 32:601–608, 1999.
26Glagov, S., E. Weisenberg, C. K. Zarins, R. Stankunavicius, andG. J. Kolettis. Compensatory enlargement of human atheroscle-rotic coronary arteries. N. Engl. J. Med. 316:1371–1375,1987.
27Goldsmith, H. L., and J. C. Marlow. Flow behavior of erythro-cytes: II. Particle motions in concentrated suspensions of ghostcells. J. Coll. Interf. Sci. 71:383–407, 1979.
28Gonzales, S., and T. M. Wick. Hemodynamic modulation ofmonocytic cell adherence to vascular endothelium. Ann. Biomed.Eng. 24:382–393, 1996.
29Guenther, C., and M. Syamlal. The effect of numerical diffusionon simulation of isolated bubbles in a gas-solid fluidized bed.Powder Tech. 116:142–154, 2001.
30Hajjar, D. P., and A. C. Nicholson. Atherosclerosis: An un-derstanding of the cellular and molecular basis of the diseasepromises new approaches for its treatment in the near future.Am. Scientist 83:460–467, 1995.
31Hoi, Y., H. Meng, S. H. Woodward, B. R. Bendok, R. A. Hanel,L. R. Guterman, and L. N. Hopkins. Effect of arterial geometryon aneurysm growth: Three-dimensional computational fluiddynamics study. J. Neurosurg. 101:676–681, 2004.
32Jan, K.-M., S. Chien, and J. T. Bigger. Observations on bloodviscosity changes after acute myocardial infarction. Circulation51:1079–1084, 1975.
33Jung, J., D. Gidaspow, and I. K. Gamwo. Bubble computation,granular temperatures and Reynolds stresses. Chem. Eng. Com-mun. (in press).
34Jung, J., R. W. Lyczkowski, C. B. Panchal, and A. Hassanein.Multiphase hemodynamic simulation with pulsatile flow in acoronary artery. J. Biomechanics (in press).
35Kleinstreuer, C. Two-Phase Flow: Theory and Application. NewYork: Taylor & Francis, 2003.
36Krams, R., J. J. Wentzel, J. A. F. Oomen, R. Vinke, J. C. H.Schuurbiers, P. J. de Feyter, P. W. Serruys, and C. J. Slager.Evaluation of endothelial shear stress and 3D geometry as factorsdetermining the development of atherosclerosis and remodelingin human coronary arteries in vivo. Arterioscler. Thromb. Vasc.Biol. 17:2061–2065, 1997.
37Ku, D. Blood flow in arteries. Annu. Rev. Fluid Mech. 29:399–434, 1997.
38Leonhardt, H., H.-R. Arntz, and U. H. Klemens. Studies ofplasma viscosity in primary hyperlipoproteinaemia. Atheroscle-rosis 28:29–40, 1977.
39Lightfoot, E. N. Transport Phenomena and Living Systems:Biomedical Aspects of Momentum and Mass Transport. NewYork: Wiley, 1974.
40Longest, P. W., C. Kleinstreuer, and J. R. Buchanan. Efficientcomputation of micro-particle dynamics including wall effects.Comp. Fluids 33:577–602, 2004.
41Malek, A. M., S. L. Alper, and S. Izumo. Hemodynamicshear stress and its role in atherosclerosis. J. Am. Med. Assoc.282:2035–2042, 1999.
42Melder, R. J., L. L. Munn, S. Yamada, C. Ohkubo, and R. K.Jain. Selectin- and integrin-mediated T-lymphocyte rolling andarrest on TNF-(-activated endothelium: Augmentation by ery-throcytes. Biophys. J. 69:2131–2138, 1995.
43Munn, L. L., R. J. Melder, and R. K. Jain. Role of erythrocytesin leukocyte-endothelial interactions: Mathematical model andexperimental validation. Biophys. J. 71:466–478, 1996.
44Myers, J. G., J. A. Moore, M. Ojha, K. W. Johnston, and C.R. Ethier. Factors influencing blood flow patterns in the humanright coronary artery. Ann. Biomed. Eng. 29:109–120, 2001.
45Nichols, W. W., and M. F. O’Rourke. McDonald’s Blood Flowin Arteries. London: Arnold, 1998.
46Phillips, R. J., R. C. Amstrong, and R. A. Brown. A con-stitutive equation for concentrated suspension that accountsfor shear-induced particle migration. Phys. Fluids A 4:30–40,1992.
47Poppas, A., S. G. Shroff, C. E. Korcarz, J. U. Hibbard, D. S.Berger, M. D. Lindheimer, and R. M. Lang. Serial assessment ofthe cardiovascular system in normal pregnancy: Role of arterialcompliance and pulsatile arterial load. Circulation 95:2407–2415, 1997.
48Qiu, Y., and J. M. Tarbell. Numerical simulation of pulsatileflow in a compliant curved tube model of a coronary artery. J.Biomech. Eng. 122:77–85, 2000.
49Sinton, S. W., and A. W. Chow. NMR flow imaging of fluidsand solid suspensions in Poiseuille flow. J. Rheol. 35:735–772,1991.
50Steinman, D. A. Image-based computational fluid dynamicsmodeling in realistic arterial geometries. Ann. Biomed. Eng.30:482–497, 2002.
51Steinman, D. A., J. S. Milner, C. J. Norley, S. P. Lownie, and D.W. Holdsworth. Image-based computational simulation of flowdynamics in a giant intracranial aneurysm. Am. J. Neuroradiol.24:559–566, 2003.
52Steinman, D. A., D. A. Vorp, and C. R. Ethier. Computationalmodeling of arterial biomechanics: Insights into pathogenesisand treatment of vascular disease. J. Vasc. Surg. 37:1118–1128,2003.
53Stone, P. H., A. U. Coskun, Y. Yeghiazarians, S. Kinlay, J. J.Popma, R. E. Kuntz, and C. L. Feldman. Prediction of sites ofcoronary atherosclerosis progression: In vivo profiling of en-dothelial shear stress, lumen, and outer vessel wall characteris-tics to predict vascular behavior. Curr. Opin. Cardiol. 18:458–470, 2003.
54Stone, P. H., A. U. Coskun, S. Kinlay, M. E. Clark, M. Sonka,A. Wahle, O. J. Ilegbusi, Y. Yeghiazarians, J. J. Popma, J.Orav, R. E. Kuntz, and C. L. Feldman. Effect of endothe-lial shear stress on the progression of coronary artery dis-ease, vascular remodeling, and in-stent restenosis in humans:In vivo 6-month follow-up study. Circulation 108:438–444,2003.

Hemodynamic Computation Using Multiphase Flow Dynamics in a Right Coronary Artery 407
55Sun, C., C. Migliorini, and L. L. Munn. Red blood cells ini-tiate leukocyte rolling in postcapillary expansions: A LatticeBoltzmann analysis. Biophys. J. 85:208–222, 2003.
56Taylor, C. A., and M. T. Draney. Experimental and computa-tional methods in cardiovascular fluid mechanics. Annu. Rev.Fluid Mech. 36:197–231, 2004.
57Thubrikar, M. J., and F. Robicsek. Pressure-induced arterial wallstress and atherosclerosis. Ann. Thorac. Surg. 59:1594–1603,1995.
58Traub, O., and B. C. Berk. Laminar shear stress: Mech-anisms by which endothelial cells transduce an atheropro-tective force. Arterioscler. Thromb. Vasc. Biol. 18:677–685,1998.
59van de Vosse, F. N., F. J. H. Gijsen, and B. J. B. M. Wolters.Numerical analysis of coronary artery flow. ASME 2001 Bioeng.Conf. BED 50:17–18, 2001.
60van Langenhove, G., J. J. Wentzel, R. Krams, C. J. Slager, J.N. Hamburger, and P. W. Serruys. Helical velocity patterns ina human coronary artery: A three-dimensional computationalfluid dynamic reconstruction showing the relation with localwall thickness. Circulation 102:e22–e24, 2000.
61Wahle, A., J. J. Lopez, E. C. Pennington, S. L. Meeks, K. C.Braddy, J. M. Fox, T. M. H. Brennan, J. M. Buatti, J. D. Rossen,and M. Sonka. Effect of vessel geometry and catheter positionon dose delivery in intracoronary brachytherapy. IEEE Trans.Biomed. Eng. 50:1286–1295, 2003.
62Wahle, A., M. E. Olszewski, and M. Sonka. Interactive virtualendoscopy in coronary arteries based on multimodality fusion.IEEE Trans. Med. Imaging 23:1391–1403, 2004.
63Walpola, P. L., A. I. Gotlieb, M. I. Cybulsky, and B. L. Langille.Expression of ICAM-1 and VCAM-1 and monocyte adherencein arteries exposed to altered shear stress. Arterioscler. Thromb.Vasc. Biol. 15:2–10, 1995.
64Wasserman, S. M., F. Mehraban, L. G. Komuves, R.-B. Yang, J.E. Tomlinson, Y. Zhang, F. Spriggs, and J. N. Topper. Gene ex-pression profile of human endothelial cells exposed to sustainedfluid shear stress. Physiol. Genom. 12:13–23, 2002.
65Wentzel, J. J., E. Janssen, J. Vos, J. C. H. Schuurbiers, R. Krams,P. W. Serruys, P. J. de Feyter, and C. J. Slager. Extension ofincreased atherosclerotic wall thickness into high shear stressregions is associated with loss of compensatory remodeling.Circulation 108:17–23, 2003.
66Wojnarowski, J. Numerical study of bileaf heart valves per-formance. In: International Scientific Practical Conference: Ef-ficiency of Engineering Education in XX Century. Ukraine:Donetsk, May 29–31, 2001.
67Zeng, D., Z. Ding, M. H. Friedman, and C. R. Ethier. Effectsof cardiac motion on right coronary artery hemodynamics. Ann.Biomed. Eng. 31:420–429, 2003.
68Zhao, S. Z., B. Ariff, Q. Long, A. D. Hughes, S. A. Thom, A. V.Stanton, and X. Y. Xu. Inter-individual variations in wall shearstress and mechanical stress distributions at the carotid arterybifurcation of healthy humans. J. Biomech. 35:1367–1377,2002.
69Zhu, H., and M. H. Friedman. Relation between the dy-namic geometry and wall thickness of a human coro-nary artery. Arterioscler. Thromb. Vasc. Biol. 23:2260–2265,2003.