HELP PAGE WEIGHTED AVERAGE COST OF CAPITAL...
25
HELP PAGE WEIGHTED AVERAGE COST OF CAPITAL (WACC) Enter WACC<Go>, then press <Help> Bloomberg's commitment to reducing our environmental impact starts with you. Please help us eliminate unnecessary printing by reading this document online. This document was prepared for the exclusive use of Richard Hong and may not be redistributed. Date: 05/07/2013 >>>>>>>>>>>>>>>>>>>>>>>>>>>>>>>>>>>>>>>>>>>>>>>>>>>WEIGHTED AVERAGE COST OF CAPITAL (WACC)
Transcript of HELP PAGE WEIGHTED AVERAGE COST OF CAPITAL...

HELP PAGEWEIGHTED AVERAGECOST OF CAPITAL(WACC)Enter WACC<Go>, then press <Help>
Bloomberg's commitment to reducing our environmentalimpact starts with you. Please help us eliminateunnecessary printing by reading this document online.
This document was prepared for the exclusive use ofRichard Hong and may not be redistributed.Date: 05/07/2013
>>>>>>>>>>>>>>>>>>>>>>>>>>>>>>>>>>>>>>>>>>>>>>>>>>>WEIGHTED AVERAGE COST OF CAPITAL (WACC)

WHAT IS WEIGHTED AVERAGE COST OF CAPITAL(WACC)?Control Area 04Cost of Capital 04Capital Structure 04History 04Economic Value Added 04
USING WACCModifying Data 06Calculation Inputs 06Creating a Report 08
HistoryHistorical Charting 09Displaying History 10Outputting to Excel 12Shortcuts 13
CALCULATIONS
FAQ
LEARN MOREHistoryTransparency Options 16Transparency Default 16
DEFINITIONS
>>>>>>>>>>>>>>>>>>>>>>>>>>>>>>>>>>>>>>>>>>>>>>>>>>>WEIGHTED AVERAGE COST OF CAPITAL (WACC)
CONTENTS

WHAT IS WEIGHTED AVERAGE COSTOF CAPITAL (WACC)?WACC allows you to analyze the weighted average cost of capital, which is the rate of return that the providers of a company'scapital require, weighted according to the proportion each element bears to the total pool of capital. WACC allows you to betterassess a company's financial health, both for internal use (in capital budgeting) and external use (valuing companies on investmentmarkets). WACC gives you insight into the cost of a company's financing, can be used as a hurdle rate for investment decisions,and acts as a measure to be minimized to find the best possible capital structure for a company. You can customize defaultassumptions and data underlying the calculations to assist you in your analysis. You can also display historical WACC data tosee trends over time and generate a report of the current chart.
The screen is divided into a control area and four sections: Cost of Capital, Capital Structure, History, and Economic ValueAdded. You can click the rows that appear in the Cost of Capital and Economic Value Added sections to display details andchange component values for the calculations.
Note: The financial statement data that appears in WACC by default is from the company's most recent fiscal period (quarterly,semi-annually or annually). This data also appears in the Financial Analysis (FA) function. The beta figure used in calculations isobtained from the Historical Beta (BETA) function. The risk free rate and equity risk premium figures used in calculations are
Date printed: 05/07/2013 WHAT IS WEIGHTED AVERAGE COST OF CAPITAL (WACC)? // 03
>>>>>>>>>>>>>>>>>>>>>>>>>>>>>>>>>>>>>>>>>>>>>>>>>>>WEIGHTED AVERAGE COST OF CAPITAL (WACC)

obtained from the Equity Risk Premium (EQRP) function. For information on using FA, BETA, or EQRP, see FA <HELP>, BETA<HELP>, or EQRP <HELP>.
CONTROL AREA
The control area allows you to change the security under analysis and the time period for the data that appears. The control area'stoolbar allows you to create a report of the data for future reference or sharing with colleagues.• For information on changing the security or time period, see Modifying Data.• For information on creating a report, see Creating a Report.
COST OF CAPITAL
The Cost of Capital section displays a company's current capital structure and the component weights for all sources of capital,including equity and debt. The total capital of the company is separated into its common equity, preferred equity, long-term debt,and short-term debt weights. The weights are calculated by dividing each amount by total capital. You can display details andchange component values for the calculations used for the weighted average cost of capital data.• Depending on the item, to see a description or further instructions, position your mouse over the data item.• For information on displaying details and changing component values for calculations, see Calculation Inputs.
CAPITAL STRUCTURE
The Capital Structure section displays statistics on the company's market value, debt, and preferred equity, in both a pie chartand a table.• To see a description of any item in the table, position your mouse over the item.
HISTORY
The History section displays a chart that illustrates the value of up to four measures on the y-axis, allowing you to quickly see thetrend of weighted average cost of capital over time. You can plot up to three additional measures on the chart: economic valueadded (EVA), return on invested capital (ROIC), and EVA spread.
The History category heading is clickable, so you can see values generated from historical balance sheets both graphically andin a tabular format. You can output this data to a Microsoft® Excel spreadsheet for reference.• To see a description of any item, position your mouse over the item.• For information on historical charting and data, see the topics in History.
ECONOMIC VALUE ADDED
Economic Value Added is a measure of shareholder value creation. The section displays statistics on operating and capital costs.• Depending on the item, to see a description or further instructions, position your mouse over the data item.• For information on displaying details and changing component values for calculations, see Calculation Inputs.
Note: All calculations adjust accrual basis accounting data to be cash basis accounting data. The adjustments are based oneach specific industry. WACC supports five different calculations for six industrial formats. (The Utilities format uses the samecalculation as the Industrial format). When the latest financial statement data available is annual data, the calculation of EVA usesall annual figures. However, when the latest financial statement data available is quarterly data, EVA calculation uses trailing
Date printed: 05/07/2013 WHAT IS WEIGHTED AVERAGE COST OF CAPITAL (WACC)? // 04
>>>>>>>>>>>>>>>>>>>>>>>>>>>>>>>>>>>>>>>>>>>>>>>>>>>WEIGHTED AVERAGE COST OF CAPITAL (WACC)

twelve months data for the NOPAT and Cash Operating Taxes calculation, while using the latest quarterly balance sheet datafor Total Investment Capital.
Date printed: 05/07/2013 WHAT IS WEIGHTED AVERAGE COST OF CAPITAL (WACC)? // 05
>>>>>>>>>>>>>>>>>>>>>>>>>>>>>>>>>>>>>>>>>>>>>>>>>>>WEIGHTED AVERAGE COST OF CAPITAL (WACC)

USING WACCThe following topics explain how to use WACC to analyze weighted average cost of capital.
For a description of WACC, see What Is Weighted Average Cost of Capital (WACC)?.
MODIFYING DATA
You can change the security under analysis and the time period for the data that appears in WACC. Depending on your selections,you can also change the filing period.
From either the Weighted Average Cost of Capital or the WACC: History screen, modify the data:
• To change the security under analysis, in the security field, enter a ticker symbol, exchange code, and yellow key, thenpress <Go> or make a selection from the autocomplete menu that appears.
• To change the time period for the data that appears, from the Period drop-down menu, select a period.
Depending on your selection, additional fields may appear, where you can enter a corresponding year and/or select a filingtype for the data.
The screen updates with data corresponding to the selected security and time period.
CALCULATION INPUTS
You can display the details and change the component values of the calculations used for the weighted average cost of capitaldata (Equity, Debt, and Preferred Equity) and/or economic value-added data (Net Operating Profit, Cash Operating Taxes, andTotal Investment Capital).
Steps:
1. From either the Cost of Capital or the Economic Value Added sections of the Weighted Average Cost of Capital screen, clickany data row (in amber).
Date printed: 05/07/2013 WHAT IS WEIGHTED AVERAGE COST OF CAPITAL (WACC)? // 06
>>>>>>>>>>>>>>>>>>>>>>>>>>>>>>>>>>>>>>>>>>>>>>>>>>>WEIGHTED AVERAGE COST OF CAPITAL (WACC)

Depending on your selection, either the Weighted Average Cost of Capital Inputs or Economic Value Added Inputs windowappears with the corresponding tab selected (by default).
2. Update any component value, then press <Go>.
Date printed: 05/07/2013 WHAT IS WEIGHTED AVERAGE COST OF CAPITAL (WACC)? // 07
>>>>>>>>>>>>>>>>>>>>>>>>>>>>>>>>>>>>>>>>>>>>>>>>>>>WEIGHTED AVERAGE COST OF CAPITAL (WACC)

Note: On the Total Investment Capital tab, if you want to modify adjustments, click the magnifying glass icon correspondingto the Adjustments component, then, from the window that appears, update any value and click the Close button. To see adescription or definition for a component, position your mouse over the corresponding component name (e.g., Risk Free Rate).
The values that appear are in the fields are recalculated.
Note: If you want to reset the values at any time so you can start over, click the Reset button. If you want to changecomponent values for other calculations, click any other tab and repeat this step.
3. Click the Update button.The window closes, and the screen updates with the recalculated values.
CREATING A REPORT
You can create a formatted report of the data that appears on the Weighted Average Cost of Capital screen for future referenceor sharing with colleagues.
From the Weighted Average Cost of Capital screen toolbar, click Create Report.
Date printed: 05/07/2013 WHAT IS WEIGHTED AVERAGE COST OF CAPITAL (WACC)? // 08
>>>>>>>>>>>>>>>>>>>>>>>>>>>>>>>>>>>>>>>>>>>>>>>>>>>WEIGHTED AVERAGE COST OF CAPITAL (WACC)

The report is downloaded via Bloomberg FileLink and automatically appears on your PC desktop in an Adobe® Acrobat PDFformat.
HISTORY
The following topics describe how to display and modify WACC history for the security under analysis.
HISTORICAL CHARTING
WACC provides a chart of historical data on both the Weighted Average Cost of Capital and theWACC: History screens. Youcan add or remove the following measures to or from the chart to customize your analysis: weighted average cost of capital,economic value added (EVA), return on invested capital (ROIC), and EVA spread.
From the either the History section of the Weighted Average Cost of Capital screen or the Historical Graph section (expanded)of the WACC: History screen, to add or remove a measure, select or deselect it.
Date printed: 05/07/2013 WHAT IS WEIGHTED AVERAGE COST OF CAPITAL (WACC)? // 09
>>>>>>>>>>>>>>>>>>>>>>>>>>>>>>>>>>>>>>>>>>>>>>>>>>>WEIGHTED AVERAGE COST OF CAPITAL (WACC)

Note: For information on the measures that appear, see Definitions. For information on expanding the Historical Graph sectionof the WACC: History screen, see Displaying History.
The historical chart updates. Depending on your selections, the measure is added to or removed from the chart.
Note: For more information on using the chart, including the chart interaction toolbar (Track, Annotate, and Zoom), seeOBGO <HELP>.
DISPLAYING HISTORY
WACC allows you to focus your analysis on the trends of weighted average cost of capital over time. You can also see a historicalchart of the data and display transparency on the formulas for capital structure data.
Steps:
1. From the History section of the Weighted Average Cost of Capital screen, click History.
Date printed: 05/07/2013 WHAT IS WEIGHTED AVERAGE COST OF CAPITAL (WACC)? // 10
>>>>>>>>>>>>>>>>>>>>>>>>>>>>>>>>>>>>>>>>>>>>>>>>>>>WEIGHTED AVERAGE COST OF CAPITAL (WACC)

The WACC: History screen appears with a table of historical data for the security. By default, the data is incremented annuallyfor the previous 20 periods. The scroll bar at the bottom of the table allows you to see additional data periods.
Note: To change the security under analysis and/or the time period for the data that appears, follow the instructions inModifying Data.
2. Perform additional analysis:
• To see a chart of the historical data, click the double-arrow button.
Date printed: 05/07/2013 WHAT IS WEIGHTED AVERAGE COST OF CAPITAL (WACC)? // 11
>>>>>>>>>>>>>>>>>>>>>>>>>>>>>>>>>>>>>>>>>>>>>>>>>>>WEIGHTED AVERAGE COST OF CAPITAL (WACC)

The Historical Graph section of the screen expands with a chart. By default, all measures are charted. To remove anymeasure, follow the instructions in Historical Charting.
Note: If you want to hide the chart, re-click the double-arrow button. For information on using the chart, including thechart interaction toolbar (Track, Annotate, and Zoom), see OBGO <HELP>.
• To display transparency on the formulas for capital structure data, click any Capital Structure value. For example, click aST Borrowings value.
Depending on your default setting for opening transparency, either the Data Transparency window or the Data Transparencyscreen appears (in another window). For information on analyzing data transparency, see Transparency Options.
Both the Data Transparency window and screen show a category tree, if applicable, of the selected value's formulacomponents and their corresponding values. A minus [-] sign indicates an expanded category level; a plus [+] sign indicatesa collapsed category level. The name of the selected security is indicated at the top left of the window or screen, followedby the ticker symbol and exchange code in parentheses. For more information on exchange codes, see Exchange Codes.
Note: If you want to see data transparency in a full screen, from the Data Transparency window, click the Popout button.On the Data Transparency screen, you can set your default for showing data transparency. For more information on settingyour data transparency default, see Transparency Default.
OUTPUTTING TO EXCEL
Once you display history for the security under analysis, you can output the historical data to a Microsoft® Excel worksheet.
For information on displaying history, see Displaying History.
From the WACC: History screen toolbar, click Output to Excel.
An Excel worksheet containing the historical data downloads via Bloomberg FileLink and automatically appears on your PCdesktop.
Date printed: 05/07/2013 WHAT IS WEIGHTED AVERAGE COST OF CAPITAL (WACC)? // 12
>>>>>>>>>>>>>>>>>>>>>>>>>>>>>>>>>>>>>>>>>>>>>>>>>>>WEIGHTED AVERAGE COST OF CAPITAL (WACC)

SHORTCUTS
To access WACC, enter (ticker symbol) (exchange code) <EQUITY> WACC <Go>.
The Weighted Average Cost of Capital screen appears.
For example:
BM US <EQUITY> WACC <Go>
Once you select a security, you can use the following shortcuts to access WACC:
To specifyEnter
The WACC: History screen, by default. For more information,see Displaying History.
WACC HIST <Go>
Annual data for a specific year by default.WACC (year)Y1
Quarterly data from a specific year, where X is the quarter (1,2, 3, or 4) for which you want to see data.
WACC (year)Q(X)
Date printed: 05/07/2013 WHAT IS WEIGHTED AVERAGE COST OF CAPITAL (WACC)? // 13
>>>>>>>>>>>>>>>>>>>>>>>>>>>>>>>>>>>>>>>>>>>>>>>>>>>WEIGHTED AVERAGE COST OF CAPITAL (WACC)

CALCULATIONSEquity Risk Premium
Equity Risk Premium is the average additional return required by an investor as compensation for investing in equities rather thana risk-free instrument, calculated as:
Equity Risk Premium = Country Premium * Applied Beta.
Risk premium is a measure of the additional reward expected from the equity market above the returns available from risk-freeinvestments. It represents the added compensation that investors demand for investing in the riskier equity markets. How to defineand measure the risk-free and equity markets is up for debate, but most models use historical data or market projection comparisonsto determine the risk premium. The traditional method for calculating risk premium involves comparing the returns from Treasuriesand equities over a specified time period. This produces equity risk premiums anywhere from 2% to 9% (for the U.S. market)depending on which Treasuries are used (bonds or bills), the time frame observed, and whether arithmetic or geometric averagereturns are employed.
The computation of Equity Risk Premium consists of two parts. First, the expected market return is calculated using forecasteddata and current equity values. This reflects the risk premium in terms of forward-looking market conditions rather than historicalvaluations. The risk free rate is then subtracted from this return to obtain the country risk premium.
The second part of the calculation involves deriving the equity risk premium for a specific issue based on the country premium.This value, using the Capital Asset Pricing Model (CAPM), is simply the product of the equity's beta and the country premium.
To calculate the expected additional return (equity risk premium), use the Equity Risk Premium (EQRP) function.
Weight of Equity = Market Capitalization / Total Capital
Note: To see calculations for all available fields, enter FLDS <Go> and search for WACC. To see all the valuation model fieldsin the system, enter FLDS :VM<GO>.
Date printed: 05/07/2013 WHAT IS WEIGHTED AVERAGE COST OF CAPITAL (WACC)? // 14
>>>>>>>>>>>>>>>>>>>>>>>>>>>>>>>>>>>>>>>>>>>>>>>>>>>WEIGHTED AVERAGE COST OF CAPITAL (WACC)
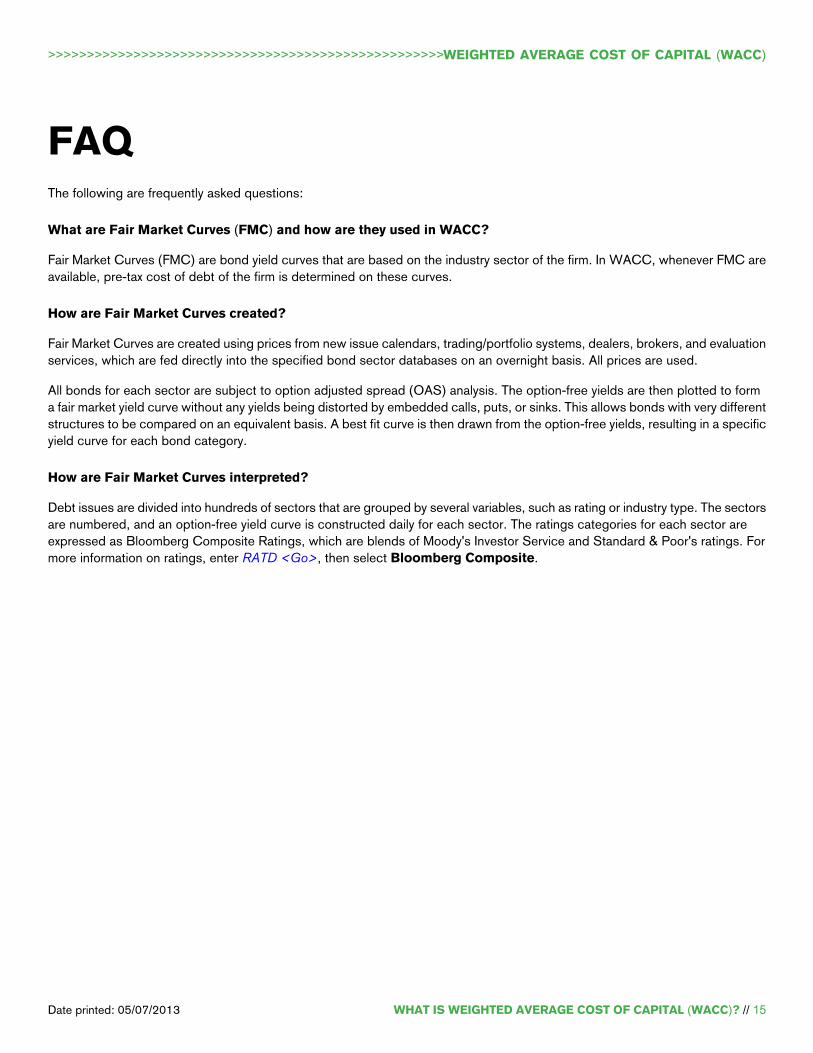
FAQThe following are frequently asked questions:
What are Fair Market Curves (FMC) and how are they used in WACC?
Fair Market Curves (FMC) are bond yield curves that are based on the industry sector of the firm. In WACC, whenever FMC areavailable, pre-tax cost of debt of the firm is determined on these curves.
How are Fair Market Curves created?
Fair Market Curves are created using prices from new issue calendars, trading/portfolio systems, dealers, brokers, and evaluationservices, which are fed directly into the specified bond sector databases on an overnight basis. All prices are used.
All bonds for each sector are subject to option adjusted spread (OAS) analysis. The option-free yields are then plotted to forma fair market yield curve without any yields being distorted by embedded calls, puts, or sinks. This allows bonds with very differentstructures to be compared on an equivalent basis. A best fit curve is then drawn from the option-free yields, resulting in a specificyield curve for each bond category.
How are Fair Market Curves interpreted?
Debt issues are divided into hundreds of sectors that are grouped by several variables, such as rating or industry type. The sectorsare numbered, and an option-free yield curve is constructed daily for each sector. The ratings categories for each sector areexpressed as Bloomberg Composite Ratings, which are blends of Moody's Investor Service and Standard & Poor's ratings. Formore information on ratings, enter RATD <Go>, then select Bloomberg Composite.
Date printed: 05/07/2013 WHAT IS WEIGHTED AVERAGE COST OF CAPITAL (WACC)? // 15
>>>>>>>>>>>>>>>>>>>>>>>>>>>>>>>>>>>>>>>>>>>>>>>>>>>WEIGHTED AVERAGE COST OF CAPITAL (WACC)

LEARN MOREHISTORY
TRANSPARENCY OPTIONS
Once you display data transparency, you can perform additional analysis.
For more information on displaying data transparency, see Displaying History.
From either the Data Transparency window or Data Transparency screen, display or hide details about data transparency:
• To display the formula for a specific component, position your mouse over any component.
The formula appears.• To expand or collapse all levels of the Component category tree, select or deselect Expand All.
A checkmark appears or is removed, and all levels are respectively expanded or collapsed.
Note: When all levels of the category tree are expanded, bottom levels (consisting of a single value that matches thevalue of the level within which it is nested) are excluded.
• To expand or collapse the Source Document Links section at the bottom of the window or screen, click the up or downarrows.
The section expands or collapses.
Note: The Source Document Links section may not always appear. When it does appear, up arrows indicates a collapsedsection. Down arrows indicate an expanded section.
• To read a source document corresponding to a component, from the Components/Value or the Source Document Linkssection (expanded) of the window or screen, click any component row.
Note: A document icon next to a component indicates that a source document is available.
The Embedded Link Browser (ELBB) function appears with the source document. For more information, see ELBB<HELP>.
TRANSPARENCY DEFAULT
Once you display the Data Transparency screen, you can set your default for displaying data transparency. This default appliesto data transparency across all functionality on the BLOOMBERG PROFESSIONAL® service, where applicable.
For information on displaying data transparency, see Displaying History.
From the Data Transparency screen, set your default:
• If you want the Data Transparency screen to appear (in another window) by default when you access data transparency,click 90 <Go> to Open Transparency Fullscreen by Default at the top of the screen, if applicable.
• If you want the Data Transparency window to appear by default when you access data transparency, click 90 <Go> toOpen Transparency in the Same Window by Default at the top of the screen, if applicable.
Date printed: 05/07/2013 WHAT IS WEIGHTED AVERAGE COST OF CAPITAL (WACC)? // 16
>>>>>>>>>>>>>>>>>>>>>>>>>>>>>>>>>>>>>>>>>>>>>>>>>>>WEIGHTED AVERAGE COST OF CAPITAL (WACC)

Note: The option that appears depends on your most recently set default.
Depending on which action you perform, the next time you display data transparency, either the Data Transparency screenappears in another window (by default) or the Data Transparency window appears (by default).
Date printed: 05/07/2013 WHAT IS WEIGHTED AVERAGE COST OF CAPITAL (WACC)? // 17
>>>>>>>>>>>>>>>>>>>>>>>>>>>>>>>>>>>>>>>>>>>>>>>>>>>WEIGHTED AVERAGE COST OF CAPITAL (WACC)

DEFINITIONSDefinitionTerm
A contra asset account that is subtracted from trade and notes receivables on the balancesheet (available for industrial format).
Allowance For Doubtful Accounts
The percentage change in the price of an equity given a 1% change in the benchmarkindex. For information about the derivation of applied beta, see BETA <HELP>.
Beta
The government long term bond rate of the country where the firm is domiciled.Bond Rate
The capital needed to satisfy interest and to amortize money invested in a company,calculated by multiplying the weighted average cost of capital percentage with the totalinvested capital. Capital Charge gives a currency equivalent for the company's cost ofcapital. Capital Charge is calculated as:
Capital Charge = Total Invested Capital * WACC.
Capital Charge
The capitalized interest expenses. For more information on calculating Capitalized InterestExpense, enter FLDI IS075 <Go>.
Capitalized Interest Expense
The capitalized research and development (R&D) expenses, as reported by the company.The account title may be standardized and slightly different from the original account titlein the company's financial statement.
Capitalized R&D
The capitalized software amount, as reported by the company. The account title may bestandardized and slightly different from the original account title in the company's financialstatement.
Capitalized Software
The cash-based measure of a firm's taxes on operating profit, derived by modifying reportedincome tax expense with adjustments from deferred tax and tax subsidies.
Cash Operating Taxes
The weighted average cost of equity, debt, or preferred equity for the security.Cost
The weighted average cost of debt for the security, calculated using government bondrates, a debt adjustment factor, and the proportions of short and long term debt to totaldebt. The debt adjustment factor represents the average yield above government bondsfor a given rating class. The lower the rating, the higher the adjustment factor. The debtadjustment factor (AF) is only used when a company does not have a fair market curve(FMC). When a company does not have a credit rating, an assumed rate of 1.38 (theequivalent rate of a BBB+ Standard & Poor's long term currency issuer rating) is used.The exact calculation of the debt adjustment factor is a Bloomberg proprietary calculation.For more information on calculating Cost of Debt, enter FLDI VM010 <Go>.
Cost of Debt
The weighted average cost of equity for the security, calculated as:
Cost of Equity = Risk-free Rate + [Beta x Country Risk Premium]
For more information on calculating Cost of Equity, enter FLDI VM008 <Go>.
Cost of Equity
Date printed: 05/07/2013 WHAT IS WEIGHTED AVERAGE COST OF CAPITAL (WACC)? // 18
>>>>>>>>>>>>>>>>>>>>>>>>>>>>>>>>>>>>>>>>>>>>>>>>>>>WEIGHTED AVERAGE COST OF CAPITAL (WACC)

DefinitionTerm
The weighted average cost of preferred (when preferred equity is part of the total capital),calculated as the amount paid in preferred dividends divided by the amount of preferredequity. For more information on calculating Cost of Preferred Equity, enterFLDI VM009 <Go>.
Cost of Preferred Equity
The expected market return value minus the risk-free rate. For more information regardingthe derivation of country premiums, see CRP <HELP>.
Country Premium
The Standard & Poor's rating on the credit worthiness of the issue. For a list of ratingsand definitions, see RATD <HELP>.
Credit Rating
The currency in which the data is calculated. The default currency is the local currency.For information on country/currency codes, see CURR <HELP>.
Cur
The calculation for the cost of debt depends on whether the appropriate reference curve-- the fair market curve (FMC) -- is available for the firm. For more information about FMC,see FMC <HELP>.
If the appropriate FMC curve is available, the after-tax cost of debt is calculated as:
Cost of Debt = ((Short Term Debt * Pre-Tax Cost of Short Term Debt + Long Term Debt* Pre-Tax Cost of Long Term Debt) / Total Debt))*(1-Tax Rate).
In this case, Pre-Tax Cost of Short Term Debt and Pre-Tax Cost of Long Term Debt arebased on the reference curve (FMC) for the firm's sector.
If the appropriate FMC is not available (or in rare cases when there is a negative Pre-TaxCost of Short Term Debt or Long Term Debt), the after-tax cost of debt calculation isbased on a rough approximation of pre-tax cost of debt. In this case, the after-tax cost ofdebt is calculated as:
Cost of Debt = ((Short Term Debt * Pre-Tax Cost of S.T. Debt) + (Long Term Debt *Pre-Tax Cost of L.T. Debt / (Total Debt))* Adjustment Factor * (1- Effective Tax Rate)
Note: In this instance, a warning message appears on the WACC screen: “Warning -rough approximation for WACC. The warning also appears if there is no debt.
Debt
The net of deferred tax assets (debit balance of deferred tax liabilities) for this year/lastyear.
Deferred Income Tax
The net of deferred tax assets (debit balance of deferred tax liabilities) for this year/lastyear. For more information on calculating Deferred Tax Liabilities, enter FLDI BS072 <Go>.
Deferred Tax Liability ThisYear/Last Year
The dividends accrued/payable, as reported by the company. The account title may bestandardized and slightly different from the original account title in the company's financialstatement.
Dividend Payable
Date printed: 05/07/2013 WHAT IS WEIGHTED AVERAGE COST OF CAPITAL (WACC)? // 19
>>>>>>>>>>>>>>>>>>>>>>>>>>>>>>>>>>>>>>>>>>>>>>>>>>>WEIGHTED AVERAGE COST OF CAPITAL (WACC)

DefinitionTerm
The measure of a company's financial performance based on the residual wealth, calculatedby deducting a currency equivalent of cost of capital (Capital Charge) from its net operatingprofit after tax (NOPAT). EVA is calculated as:
Economic Value Added = NOPAT - Capital Charge
Note: This measure reflects the absolute amount of shareholder value created or lostduring the year.
Economic Value Added (EVA)
The rate a taxpayer would be taxed if taxing was done at a constant rate, instead ofprogressively, calculated as total tax paid divided by taxable income. For more informationon calculating effective tax rate, enter FLDI RR037 <Go>.
Effective Tax Rate
The cost of equity, calculated as:
Cost of Equity = Risk Free Rate + Equity Risk Premium
Note: When there is not enough price history to calculate an accurate beta, the followingappears on the top line of the WACC screen: “Warning - rough approximation for WACC.
Equity
The average additional return required by an investor as compensation for investing inequities rather than a risk-free instrument. For information on how this value is calculated,see Calculations.
Equity Risk Premium
Allows you to plot the Economic Value Added on the historical chart.EVA
The spread of the Economic Value Added (EVA) value. EVA Spread is calculated bysubtracting the weighted average cost of capital (WACC) percentage from the return oninvested capital (ROIC) percentage.
EVA Spread
The implied return expected from the market(s) using forecasted growth rates, earnings,dividends, payout ratio, and current values. The market return is calculated by taking acapital weighted average of the internal rate of return over all the members of the country'smajor index.
For information on determining the value of an equity, see DDM <HELP>. For moreinformation on the calculation of expected market return, see CRP <HELP>.
Expected Market Return
The filing status, which indicates the reporting period of the data. You can choose todisplay the most recent, original, or preliminary filing, or display reclassified or restateddata.
Filing
The trailing 12-month foreign exchange gain or loss, calculated by adding the foreignexchange result for the most recent four quarters.
Foreign Exchange Gain (Loss)
The historical market cap, which is the total dollar market value of all of a company'soutstanding shares at the period end date stated in the fundamental currency. For moreinformation on calculating Hist Market Cap, enter FLDI RR250 <Go>.
Hist Market Cap
The trailing 12-month income before extraordinary items, calculated by adding incomebefore extraordinary items for the most recent four quarters.
Income Before XO Items andMinority Interest
Date printed: 05/07/2013 WHAT IS WEIGHTED AVERAGE COST OF CAPITAL (WACC)? // 20
>>>>>>>>>>>>>>>>>>>>>>>>>>>>>>>>>>>>>>>>>>>>>>>>>>>WEIGHTED AVERAGE COST OF CAPITAL (WACC)

DefinitionTerm
The tax expenses resulting from income (from federal, local, or foreign). For moreinformation on calculating Income Tax Expense, enter FLDI IS038 <Go>.
Income Tax Expense
The trailing 12-month interest expense, calculated by adding interest expense for the mostrecent four quarters.
Interest Expense
The interest accrued/payable, as reported by the company. The account title may bestandardized and slightly different from the original account title in the company's financialstatement.
Interest Payable
The LIFO (last-in-first-out) reserve for this year/ the previous year. LIFO reserve is thedifference between the inventory balance shown on the balance sheet and the amountthat would have been reported had the company used FIFO (first-in-first-out). Companiesusing LIFO show inventory balances that contain old and outdated costs that have littlerelationship to current costs. For information on calculating LIFO Reserve, enterFLDI BS179 <Go>.
LIFO Reserve for ThisYear/Previous Year
The LT Debt value you want to input.Long Term Debt
The long term debt, which is a debt obligation that matures longer than one year. For moreinformation on calculating LT Debt, enter FLDI BS051 <GO>.
Note: To change the long term debt value, modify the corresponding Cost of Debtcalculation input by following the instructions in Calculation Inputs. Changing the LT Debtinput also affects the percentage of long term to total capital, the pie chart, and the debtWeight in the Cost of Capital section on the Weighted Average Cost of Capital screen.
LT Debt
The market value of common equity in the company. In WACC, market capitalization iscalculated as shares outstanding at the latest period end date, multiplied by the closingprice as of the fiscal period end date.
Note: To change the market capitalization value, modify the corresponding Cost of Equitycalculation input by following the instructions in Calculation Inputs. Changing the marketcapitalization input also affects the percentage of equity to total capital, the pie chart, andthe equity Weight in the Cost of Capital section on the Weighted Average Cost of Capitalscreen.
Market Capitalization
The minority/non-controlling interest, which is accumulated earnings to common stocksowned by someone other than parent company in consolidated subsidiaries. For moreinformation on calculating Minority Interest, enter FLDI BS062 <Go>.
Minority Interest
Indicates that the data is based on the most recent filing for the selected period.MR
The trailing 12-month net other non-operating gain or loss, calculated by adding the netother non-operating gain or loss for the most recent four quarters.
Note: Net other non-operating gain or loss does not include interest expense or foreignexchange gain or loss when these are disclosed.
Net Non Operating Loss (Gain)
Date printed: 05/07/2013 WHAT IS WEIGHTED AVERAGE COST OF CAPITAL (WACC)? // 21
>>>>>>>>>>>>>>>>>>>>>>>>>>>>>>>>>>>>>>>>>>>>>>>>>>>WEIGHTED AVERAGE COST OF CAPITAL (WACC)

DefinitionTerm
The cash-based measure of a firm's operating performance, derived by modifying incomebefore tax and minority interest with adjustments that converts accrual-based operatingprofit before tax and minority interest to cash-based.
Note: Adjustments in Net Operating Profit depend on the industry format of the company,and should be aligned with adjustments in Total Invested Capital. For more informationon calculating Net Operating Profit, enter FLDI VM028 <Go>.
Net Operating Profit
The net operating profit after tax (NOPAT), which is a cash-based measure of profit aftertax before subtracting any financial charge. Unlike net income, NOPAT is a measure ofpure operating results that is not affected by temporary shift in capital structure. NOPATis calculated as:
NOPAT = Net Operating Profit - Cash Operating Taxes
NOPAT
The government short term bond rate of the country where the firm is domiciled.Note Rate
Indicates that the data is based on the original filing for the selected period.Original
The other deductible expenses value you want to input.Other
The funded status of the pension plan. Represents the difference between the fair valueof plan assets less the projected benefit obligation. The plan is overfunded if the planassets exceed the projected benefit obligation. The plan is underfunded if the plan assetsare less than the projected benefit obligation. Available for all industry types.
Overfunded (Underfunded)Pension
The trailing 12-month pension expense (income), calculated by adding the most recentfour quarters of pension expense, which is the net amount of pension cost (income) thatis recognized in the income statement.
Pension Expense
The liabilities from defined pension benefit and postretirement benefit plans (which mayinclude other type of benefit obligation, if not disclosed separately). This is as reportedby company. The account title may be standardized and slightly different from the originalaccount title in the company's financial statement.
Pension/Post RetirementLiabilities
The period for which the data is reported. The drop-down menu allows you to display themost recent data, data from a specific quarter, or annual data.
Period
The cost of Preferred Equity.Pref. Eqty
The cost of preferred equity, determined by dividing the amount paid in preferred dividendsby the amount of preferred equity. When annual (i.e., trailing one-year) preferred dividendsare not available or are not positive, the cost of the preferred equity cannot be estimated.The WACC calculation ignores the preferred component.
Preferred Equity is calculated as:
Weight of Preferred Equity = Preferred Equity / Total Capital
Preferred Equity
Indicates that the data is based on the preliminary filing for the selected period.Preliminary
The present value of the operating lease obligations, as disclosed by the company.Present Value of Operating LeaseObligation
Date printed: 05/07/2013 WHAT IS WEIGHTED AVERAGE COST OF CAPITAL (WACC)? // 22
>>>>>>>>>>>>>>>>>>>>>>>>>>>>>>>>>>>>>>>>>>>>>>>>>>>WEIGHTED AVERAGE COST OF CAPITAL (WACC)

DefinitionTerm
The pre-tax return on the company's long term (10 year) debt, derived from the fair marketcurves (FMC ), when available. If the FMC is not available, a rough approximation of pre-taxcost of debt is based on the government long term debt.
Note: Long term debt data appears only if the company is carrying debt. For moreinformation about fair market reference curves, see FMC <HELP>.
Pre-Tax Cost L.T. Debt
The pre-tax return on the company's short term (one year) debt, derived from fair marketcurves (FMC), when available. If the FMC is not available, a rough approximation of pre-taxcost of debt is based on the government short term debt.
Note: The short term debt data appears only if the company is carrying debt.
Pre-Tax Cost S.T. Debt
The trailing 12-month provision for doubtful accounts, calculated by adding the mostrecent four quarters of provision for doubtful accounts net, which is the expense madefor the expected uncollectible outstanding trade and notes receivables, with provision forwritten back during the period.
Provision for Doubtful Account
The reference curve (fair market curve) for industrials of the given currency and rating.The currency is that of the country where the security was issued.
Note: WACC does not capture inter-industry differentials.
For more information about fair market reference curves, see FMC <HELP>. Forinformation on country/currency codes, see CURR <HELP>.
Ref Curve
Indicates that the data is based on reclassified/restated data for the selected period.Restated
The cumulative undistributed earnings. For more information on calculatingRetained Earnings, enter FLDI BS065 <Go>.
Retained Earnings
The yield of the 10-year treasury security. If such a security is not available, then a long-termswap rate is used.
Note: If the country in which the security is domiciled does not have a sufficient creditrating or does not have long term debt, the 10 year U.S. risk free rate, CT10 <GOVT>,is applied.
Risk Free Rate
The return on invested capital, a gauge of how adequately a company uses the moneyinvested in its operations. ROIC is calculated as a company's earnings before interest,taxes, and depreciation divided by total capital (common and preferred stock plus long-termdebt). ROIC provides a way to compare companies based on the competency of theirmanagement and the feasibility of their products.
Note: ROIC is a more reliable measure than return on equity.
ROIC
The trailing 12-month service cost, calculated by adding the most recent four quarters ofservice cost, which is the actuarial present value of pension benefits attributed by thepension benefit formula to employee service during a specific period.
Service Cost
The ST Debt value you want to input.Short Term Debt
Date printed: 05/07/2013 WHAT IS WEIGHTED AVERAGE COST OF CAPITAL (WACC)? // 23
>>>>>>>>>>>>>>>>>>>>>>>>>>>>>>>>>>>>>>>>>>>>>>>>>>>WEIGHTED AVERAGE COST OF CAPITAL (WACC)

DefinitionTerm
The ST Debt.ST Borrowings
The short term debt, which is a debt obligation that matures in one year. ST Debt mayalso include repurchase agreements of treasury bills and other short term securities. Formore information on calculating ST Debt, enter FLDI BS047 <Go>.
Note: To change the short term debt value, modify the corresponding Cost of Debtcalculation input by following the instructions in Calculation Inputs. Changing theShort Term Debt input also affects the percentage of short term to total capital, the piechart, and the debt Weight in the Cost of Capital section on theWeighted Average Cost of Capital screen.
ST Debt
The expense for stock-based compensation, which is the excess of the fair value of theequity security received at the grant date over the amount paid by the employee for theperiod.
Stock Based Compensation
The income taxes accrued/payable, as reported by the company. The account title maybe standardized and slightly different from the original account title in the company'sfinancial statement.
Taxes Payable
The total sum value of Market Cap, ST Debt, LT Debt, and Pref. Eqty.Total
The measure of economic capital from shareholders, lenders, and other financing resourcesthat is tied up in the business for the purpose of funding the company operations.Total Invested/Investment Capital is derived by deducting non-financing accounts, suchas account payables and accrued expenses, capitalizing several types of expenses andadding off-balance sheet items to total liabilities and equity.
Note: Adjustments depend on the industry format of the company, and should be alignedwith adjustments in Net Operating Profit.
Total Invested/Investment Capital
The Weight multiplied by the Cost, expressed as a percentage.W x C
Date printed: 05/07/2013 WHAT IS WEIGHTED AVERAGE COST OF CAPITAL (WACC)? // 24
>>>>>>>>>>>>>>>>>>>>>>>>>>>>>>>>>>>>>>>>>>>>>>>>>>>WEIGHTED AVERAGE COST OF CAPITAL (WACC)

DefinitionTerm
The weighted average cost of capital (WACC), which is the rate of return that the providersof a company's capital require, weighted according to the proportion each element bearsto the total pool of capital. WACC is calculated using a mix of today's values and valuesfrom the selected period.
In the Cost of Capital section on the Weighted Average Cost of Capital screen, once thecost of Equity, Debt, and Preferred Equity have been determined, WACC can becalculated as:
WACC = (Cost of Equity * Weight of Equity) + (After Tax Cost of Debt * Weight of Debt)+ (Cost of Preferred Equity * Weight of Preferred Equity).
Note: WACC Global Rank (Calcrout VM023) is a ranking of all companies based oneach company's WACC calculation (Calcrout VM011). WACC calculations are availablevia the Field Search (FLDS) function and the Bloomberg Application Interface (API)function. Whereas the calculations in FLDS and API are performed once a day, WACCcalculations are performed in real time, however. Therefore, small discrepancies betweenFLDS, API, and WACC must be expected. For more information on data calculations,see FLDS <HELP> and API <HELP>.
WACC
The ratio of market capital, total debt, or preferred equity to total capital. For moreinformation on calculating Weight, enter FLDI VM035 <Go>, FLDI VM037 <Go>, andFLDI VM036 <Go>.
Weight (of Equity, Debt, or Pref.Equity)
>>>>>>>>>>>>>>>>>>>>>>>>>>>>>>>>>>>>>>>>>>>>>>>>>>>>>>>>>>>>>>>>>>>>>>>>>>>>>>>>>>>>>>>>>>>>SYDNEYSÃO PAULONEW YORKLONDONFRANKFURTBEIJING+61 2 9777 8600+55 11 3048 4500+1 212 318 2000+44 20 7330 7500+49 69 9204 1210+86 10 6649 7500
TOKYOSINGAPORESAN FRANCISCOMUMBAIHONG KONGDUBAI+81 3 3201 8900+65 6212 1000+1 415 912 2960+91 22 6120 3600+852 2977 6000+971 4 364 1000
bloomberg.com
The BLOOMBERG PROFESSIONAL service, BLOOMBERG Data and BLOOMBERG Order Management Systems (the “Services”) are owned and distributed locally by Bloomberg Finance L.P. (“BFLP”) and its subsidiaries in all jurisdictions other thanArgentina, Bermuda, China, India, Japan and Korea (the “BLP Countries”). BFLP is a wholly-owned subsidiary of Bloomberg L.P. (“BLP”). BLP provides BFLP with all global marketing and operational support and service for the Services and distributes theServices either directly or through a non-BFLP subsidiary in the BLP Countries. The Services include electronic trading and order-routing services, which are available only to sophisticated institutional investors and only where the necessary legal clearanceshave been obtained. BFLP, BLP and their affiliates do not provide investment advice or guarantee the accuracy of prices or information in the Services. Nothing on the Services shall constitute an offering of financial instruments by BFLP, BLP or their affiliates.© 2013 Bloomberg Finance LP. All rights reserved.
Date printed: 05/07/2013 WHAT IS WEIGHTED AVERAGE COST OF CAPITAL (WACC)? // 25
>>>>>>>>>>>>>>>>>>>>>>>>>>>>>>>>>>>>>>>>>>>>>>>>>>>WEIGHTED AVERAGE COST OF CAPITAL (WACC)