Hedge funds and their implications for financial stability ... · HEDGE FUNDS AND THEIR...
76
OCCASIONAL PAPER SERIES NO. 34 / AUGUST 2005 HEDGE FUNDS AND THEIR IMPLICATIONS FOR FINANCIAL STABILITY by Tomas Garbaravicius and Frank Dierick
Transcript of Hedge funds and their implications for financial stability ... · HEDGE FUNDS AND THEIR...
OCCAS IONAL PAPER SER IESNO. 34 / AUGUST 2005
HEDGE FUNDS AND THEIR IMPLICATIONS FORFINANCIAL STABILITY
by Tomas Garbaravicius and Frank Dierick
In 2005 all ECB publications will feature
a motif taken from the
€50 banknote.
OCCAS IONAL PAPER S ER I E SNO. 34 / AUGUST 2005
This paper can be downloaded without charge from the ECB’s website (http://www.ecb.int) or from the Social Science Research Network
electronic library at http://ssrn.com/abstract_id=752094.
HEDGE FUNDS AND THEIR IMPLICATIONS FOR
FINANCIAL STABILITY *
by Tomas Garbaravicius and Frank Dierick
* The authors work in the Directorate Financial Stability and Supervision of the ECB. They are grateful for commentsreceived from Inês Cabral, John Fell, Mauro Grande and Panagiotis Strouzas. All remaining errors and omissions arethose of the authors. The views expressed in this paper are the authors’ and do not necessarily reflect those of the
ECB or the Eurosystem.

© European Central Bank, 2005
AddressKaiserstrasse 2960311 Frankfurt am MainGermany
Postal addressPostfach 16 03 1960066 Frankfurt am MainGermany
Telephone+49 69 1344 0
Websitehttp://www.ecb.int
Fax+49 69 1344 6000
Telex411 144 ecb d
All rights reserved. Reproduction foreducational and non-commercialpurposes is permitted provided that thesource is acknowledged.
The views expressed in this paper donot necessarily reflect those of theEuropean Central Bank.
ISSN 1607-1484 (print)ISSN 1725-6534 (online)
3ECB
Occasional Paper No. 34August 2005
CONTENTSC O N T E N T SABSTRACT 4
EXECUTIVE SUMMARY 5
1 INTRODUCTION 6
2 THE CONCEPT OF HEDGE FUNDS 6
3 TYPOLOGY OF HEDGE FUNDS 8
4 CHARACTERISTICS OF THE HEDGE FUNDINDUSTRY 11
4.1 Location of hedge fundsand their managers 11
4.2 Incentive structure andfailure rates 17
4.3 Parties involved 18
4.4 Investors 19
4.5 Fund size 20
5 RECENT EVOLUTION OF THE HEDGE FUNDBUSINESS 22
6 FINANCIAL STABILITY IMPLICATIONS 25
6.1 Possible positive effects 25
6.2 Possible negative effects 27
6.2.1 Through leverage andliquidity risks of hedge funds 28
6.2.2 Through impact on creditinstitutions 35
6.2.3 Through impact on financialmarkets 43
7 REGULATORY AND SUPERVISORYIMPLICATIONS 49
7.1 Risk management practices 49
7.2 Disclosure, transparency and thevaluation of positions 50
7.3 Sound business practices 51
7.4 Regulatory issues 52
8 CONCLUSIONS 55
ANNEXES
A Evolution of the hedgefund industry 58
B Major international initiatives toaddress concerns related to hedgefunds 62
REFERENCES 64
GLOSSARY 69
Conventions used in the tables
“-” data do not exist/data are not applicable/data not available to authors
“.” data are not yet available“…” nil or negligible
4ECBOccasional Paper No. 34August 2005
ABSTRACT
The paper provides an overview of the hedgefund industry, mainly from a financial stabilityand European angle. It is primarily based on anextensive analysis of information from theTASS database. On the positive side of thefinancial stability assessment, hedge fundshave a role as providers of diversification andliquidity, and they contribute to the integrationand completeness of financial markets.Possible negative effects occur through theirimpact on financial markets (e.g. via crowdedtrades) and financial institutions (e.g. viaprime brokerage). Several initiatives have beenlaunched to address these concerns and most ofthem follow indirect regulation via banks. Ifany direct regulation were to be considered, itwould probably have to be implemented in acoordinated manner at the international level.At the EU level there is currently no commonregulatory regime, although some MemberStates have adopted national legislation.
Key words: asset management, crowded trades,financial regulation, financial stability, hedgefunds, prime brokerage, risk management.
JEL classification: G15, G18, G21, G23, G24
5ECB
Occasional Paper No. 34August 2005
EXCECUTIVESUMMARY
EXECUTIVE SUMMARY
This paper provides an overview of the hedgefund industry, mainly from a financial stabilityangle and with an emphasis on its EuropeanUnion (EU) dimension. Hedge funds stillrepresent a relatively small share of the assetmanagement industry. Nevertheless they havebeen growing impressively, with total capitalunder management now estimated to be overUSD 1 trillion globally. Their active role infinancial markets means that they are muchmore important than suggested by their sizealone. These developments have ensured thathedge funds have the continued attention ofpublic authorities and the financial community,the more so since there remains a large degreeof uncertainty regarding the implications forfinancial stability.
Although there is no common definition of whatconstitutes a hedge fund, it can be described asan unregulated or loosely regulated fund whichcan freely use various active investmentstrategies to achieve positive absolute returns.Typically, the fees of fund managers are relatedto the performance of the fund in question andmanagers often commit their own money.Although the investment strategy, by definition,varies widely, hedge funds can be broadlyclassified as directional, market neutral or eventdriven funds. Although they typically targethigh net worth individuals and institutionalinvestors, their products have recently becomeincreasingly available to retail investors due tothe development of funds investing in hedgefunds and structured financial instruments withhedge fund-linked performance. A multitude ofparties are involved in the operation of suchfunds: managers, administrators, custodianbanks, prime brokers, investors, etc. Some ofthese roles are also being assumed by banks, andmore banks are seen to be setting up their ownhedge funds.
Hedge funds are primarily domiciled inoffshore centres because of the ensuing lightregulatory treatment and favourable taxregimes. Most hedge funds are relatively small,
with capital under management of less thanUSD 100 million, although this variesaccording to the investment strategy applied.EU hedge funds, i.e. funds domiciled in the EUand/or with managers residing in the EU, aremainly established in Luxembourg and Irelandand their managers are generally based inLondon. The market share of EU hedge fundshave continued to expand, mainly at theexpense of funds managed from the UnitedStates.
It is challenging to make an unambiguousassessment of the impact of hedge funds onfinancial stability, not least because of the lackof complete information on their activity,financial structure and interaction with banks.As active market participants they often takecontrarian positions, thus contributing to marketliquidity, dampening market volatility andacting as a counterbalance to market herding. Inaddition, they offer diversification possibilitiesand allow new risk-return combinations to beachieved, leading to more complete financialmarkets. It can also be argued that byeliminating market inefficiencies hedge fundshave probably contributed to the integration offinancial markets.
The near-collapse of LTCM in 1998 highlightshow hedge fund activities can also seriouslyharm financial stability. Such negative effectsbasically occur through their impact onfinancial markets and financial institutions, inparticular via banks that act as prime brokers orthat take similar market positions as hedgefunds. The management of banks’ exposuresto hedge funds is complex and requirescontinuous improvements and vigilance tokeep up with developments. As the number ofhedge funds attempting to exploit the samemarket opportunities increases, there are alsoconcerns that this same positioning mayseriously affect certain markets in the eventof simultaneous selling. It is particularlychallenging to assess how hedge funds affectand are being affected by the interaction ofmarket risk, liquidity risk, credit risk andleverage.
6ECBOccasional Paper No. 34August 2005
Since the near-default of LTCM, several publicand private initiatives have been launched toaddress some of the concerns related to hedgefunds. Most of these initiatives recognise that itis very difficult to regulate hedge funds directlygiven the ease with which they can change theirdomicile and avoid regulation. These initiativestherefore focus on indirect regulation whichtargets the counterparties of hedge funds, inparticular banks. Such indirect regulation aimsat enhancing risk management practices inbanks and improving disclosure by hedge funds.If any direct regulation were to be considered, itwould probably have to be implemented in astrongly coordinated manner at the international(transatlantic) level. Finally, as hedge fundsbecome increasingly available to retailinvestors, though generally in an indirect way,there might also be a need to address investorprotection concerns. At present there is nocommon regulatory regime for hedge funds inthe EU, although a number of Member Stateshave adopted national legislation.
1 INTRODUCTION
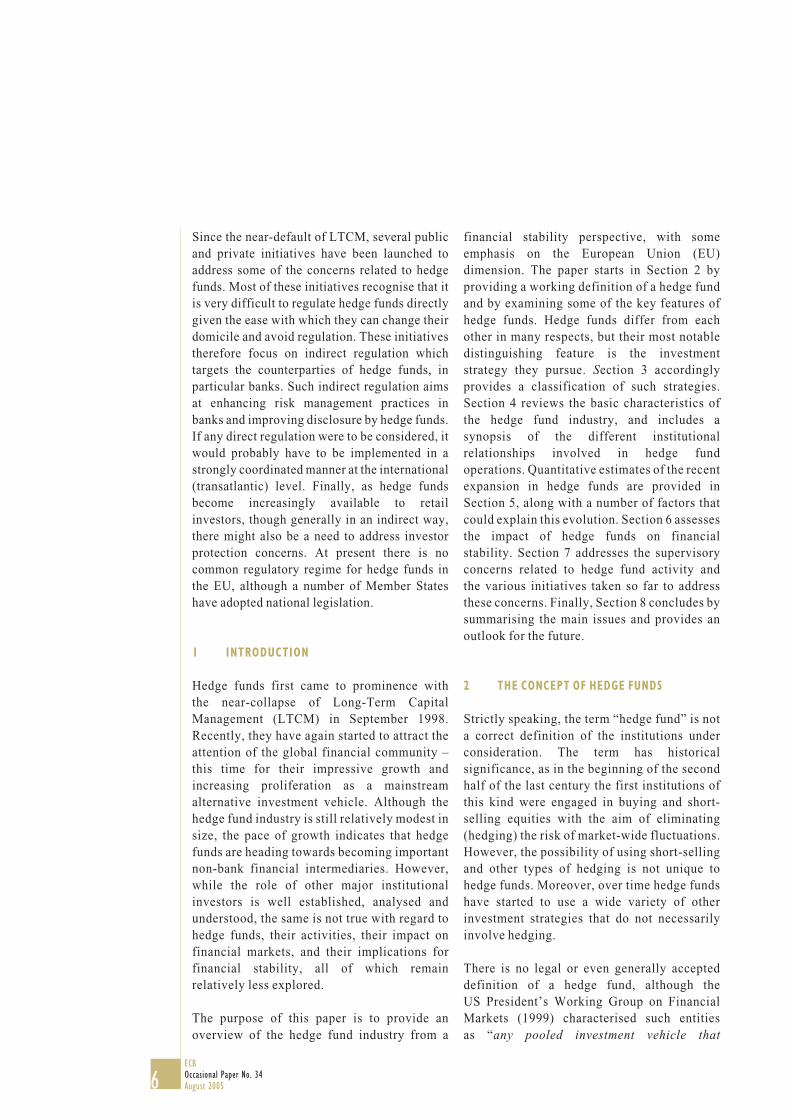
Hedge funds first came to prominence withthe near-collapse of Long-Term CapitalManagement (LTCM) in September 1998.Recently, they have again started to attract theattention of the global financial community –this time for their impressive growth andincreasing proliferation as a mainstreamalternative investment vehicle. Although thehedge fund industry is still relatively modest insize, the pace of growth indicates that hedgefunds are heading towards becoming importantnon-bank financial intermediaries. However,while the role of other major institutionalinvestors is well established, analysed andunderstood, the same is not true with regard tohedge funds, their activities, their impact onfinancial markets, and their implications forfinancial stability, all of which remainrelatively less explored.
The purpose of this paper is to provide anoverview of the hedge fund industry from a
financial stability perspective, with someemphasis on the European Union (EU)dimension. The paper starts in Section 2 byproviding a working definition of a hedge fundand by examining some of the key features ofhedge funds. Hedge funds differ from eachother in many respects, but their most notabledistinguishing feature is the investmentstrategy they pursue. Section 3 accordinglyprovides a classification of such strategies.Section 4 reviews the basic characteristics ofthe hedge fund industry, and includes asynopsis of the different institutionalrelationships involved in hedge fundoperations. Quantitative estimates of the recentexpansion in hedge funds are provided inSection 5, along with a number of factors thatcould explain this evolution. Section 6 assessesthe impact of hedge funds on financialstability. Section 7 addresses the supervisoryconcerns related to hedge fund activity andthe various initiatives taken so far to addressthese concerns. Finally, Section 8 concludes bysummarising the main issues and provides anoutlook for the future.
2 THE CONCEPT OF HEDGE FUNDS
Strictly speaking, the term “hedge fund” is nota correct definition of the institutions underconsideration. The term has historicalsignificance, as in the beginning of the secondhalf of the last century the first institutions ofthis kind were engaged in buying and short-selling equities with the aim of eliminating(hedging) the risk of market-wide fluctuations.However, the possibility of using short-sellingand other types of hedging is not unique tohedge funds. Moreover, over time hedge fundshave started to use a wide variety of otherinvestment strategies that do not necessarilyinvolve hedging.
There is no legal or even generally accepteddefinition of a hedge fund, although theUS President’s Working Group on FinancialMarkets (1999) characterised such entitiesas “any pooled investment vehicle that
7ECB
Occasional Paper No. 34August 2005
2 THE CONCEPTOF HEDGE FUNDS
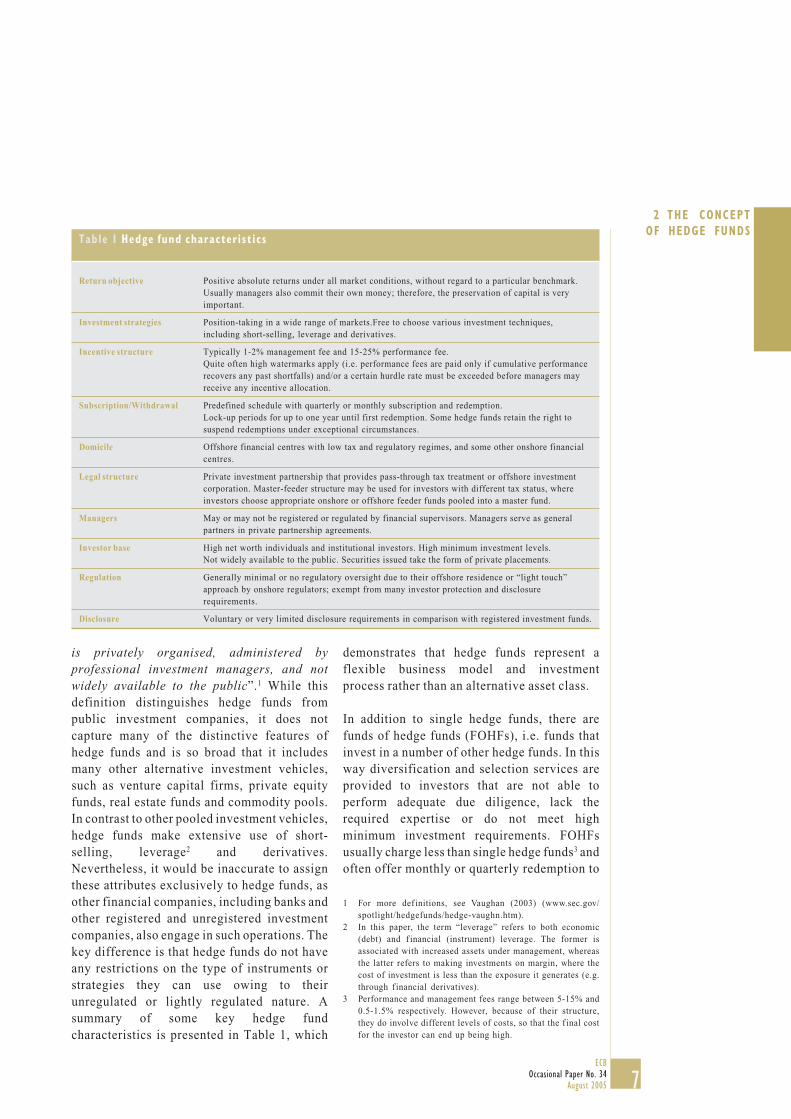
is privately organised, administered byprofessional investment managers, and notwidely available to the public”.1 While thisdefinition distinguishes hedge funds frompublic investment companies, it does notcapture many of the distinctive features ofhedge funds and is so broad that it includesmany other alternative investment vehicles,such as venture capital firms, private equityfunds, real estate funds and commodity pools.In contrast to other pooled investment vehicles,hedge funds make extensive use of short-selling, leverage2 and derivatives.Nevertheless, it would be inaccurate to assignthese attributes exclusively to hedge funds, asother financial companies, including banks andother registered and unregistered investmentcompanies, also engage in such operations. Thekey difference is that hedge funds do not haveany restrictions on the type of instruments orstrategies they can use owing to theirunregulated or lightly regulated nature. Asummary of some key hedge fundcharacteristics is presented in Table 1, which
demonstrates that hedge funds represent aflexible business model and investmentprocess rather than an alternative asset class.
In addition to single hedge funds, there arefunds of hedge funds (FOHFs), i.e. funds thatinvest in a number of other hedge funds. In thisway diversification and selection services areprovided to investors that are not able toperform adequate due diligence, lack therequired expertise or do not meet highminimum investment requirements. FOHFsusually charge less than single hedge funds3 andoften offer monthly or quarterly redemption to
1 For more def initions, see Vaughan (2003) (www.sec.gov/spotlight/hedgefunds/hedge-vaughn.htm).
2 In this paper, the term “leverage” refers to both economic(debt) and f inancial (instrument) leverage. The former isassociated with increased assets under management, whereasthe latter refers to making investments on margin, where thecost of investment is less than the exposure it generates (e.g.through financial derivatives).
3 Performance and management fees range between 5-15% and0.5-1.5% respectively. However, because of their structure,they do involve different levels of costs, so that the f inal costfor the investor can end up being high.
Return objective Positive absolute returns under all market conditions, without regard to a particular benchmark.Usually managers also commit their own money; therefore, the preservation of capital is veryimportant.
Investment strategies Position-taking in a wide range of markets.Free to choose various investment techniques,including short-selling, leverage and derivatives.
Incentive structure Typically 1-2% management fee and 15-25% performance fee.Quite often high watermarks apply (i.e. performance fees are paid only if cumulative performancerecovers any past shortfalls) and/or a certain hurdle rate must be exceeded before managers mayreceive any incentive allocation.
Subscription/Withdrawal Predefined schedule with quarterly or monthly subscription and redemption.Lock-up periods for up to one year until first redemption. Some hedge funds retain the right tosuspend redemptions under exceptional circumstances.
Domicile Offshore financial centres with low tax and regulatory regimes, and some other onshore financialcentres.
Legal structure Private investment partnership that provides pass-through tax treatment or offshore investmentcorporation. Master-feeder structure may be used for investors with different tax status, whereinvestors choose appropriate onshore or offshore feeder funds pooled into a master fund.
Managers May or may not be registered or regulated by financial supervisors. Managers serve as generalpartners in private partnership agreements.
Investor base High net worth individuals and institutional investors. High minimum investment levels.Not widely available to the public. Securities issued take the form of private placements.
Regulation Generally minimal or no regulatory oversight due to their offshore residence or “light touch”approach by onshore regulators; exempt from many investor protection and disclosurerequirements.
Disclosure Voluntary or very limited disclosure requirements in comparison with registered investment funds.
Table 1 Hedge fund characterist ics
8ECBOccasional Paper No. 34August 2005
suit institutional and retail investors.Moreover, for the even more risk-averseinvestor, there are also so-called F3 hedgefunds or funds of FOHFs, which represent thethird layer on top of single hedge funds (F1) andFOHFs (F2). To be commercially viable, F3funds have to negotiate substantial fee rebatesfrom underlying FOHFs.
Noting the inaccurate nature of the expression“hedge fund”, the European Parliament insteaddecided to use the term “SophisticatedAlternative Investment Vehicles” (SAIVs),which would also encompass other alternativeinvestment funds that differ from conventionalUCITS (Undertakings for CollectiveInvestments in Transferable Securities).4 Avariety of similar terms have elsewhere beenused by other institutions. The BaselCommittee on Banking Supervision (BCBS)opted to employ the term “highly leveragedinstitutions” (HLIs), a label covering hedgefunds as well as other institutions that aresubject to very little or no direct regulatoryoversight, have very limited disclosurerequirements, and often take on significantleverage.5 The Multidisciplinary WorkingGroup on Enhanced Disclosure (MWGED)preferred to use the term “leveraged investmentfunds”.6 Interestingly, the United Kingdom’sFinancial Services Authority (FSA) declined todefine the term because of the absence ofidentifiable commonality; more recently it hasindicated for supervisory monitoring purposesits preference to focus on the investmenttechniques of hedge funds rather than on issuesof legal structure.7
For the purpose of this paper, the marketpractice of using the term “hedge fund” will befollowed. This term denotes a fund whosemanagers receive performance-related fees andcan freely use various active investmentstrategies to achieve positive absolute returns,involving any combination of leverage,derivatives, long and short positions insecurities or any other assets in a wide range ofmarkets. This working definition stresses themost important features of hedge funds that are
likely to endure, given that all other second-tiercharacteristics, including regulation,registration, investor base and disclosure, willprobably evolve. However, this definition doesnot completely separate hedge funds fromprivate equity or venture capital funds. As arule, the latter vehicles do not pursue activestrategies that extensively employ leverage,short-selling or derivatives, and usually havemuch longer lock-up periods.
3 TYPOLOGY OF HEDGE FUNDS
As noted earlier, the first hedge funds werepredominantly engaged in market neutral or“hedged” trading, trying to insulate theirpositions against market-wide gyrations. Thisis no longer the case as hedge funds now alsopursue directional strategies. Since hedgefunds do not have any restrictions on the type ofinstruments they can use or on how to conductoperations, they are usually classified by theirinvestment style. This criterion is moreimportant for a hedge fund’s risk-return profilethan its asset class selection or sector/geographic orientation.
To simplify the analysis, it is useful to groupstrategies into four major sets: directional,market neutral, event-driven and FOHFs.Directional hedge funds generally try toanticipate market movements and offer highreturns commensurate with the high risks andleverage involved. Macro hedge funds are themost prominent example of this investmentstyle. Such funds follow a “top-down”approach, and try to profit from majoreconomic trends or events. Emerging marketsand other directional hedge funds with aregional focus, by contrast, favour a “bottom-up” approach, i.e. they tend to be asset pickersin certain markets and look for inefficiencies indeveloping markets.
4 European Parliament (2003 and 2004).5 Basel Committee on Banking Supervision (1999a).6 Multidisciplinary Working Group on Enhanced Disclosure
(2001).7 UK’s Financial Supervisory Authority (2002 and 2005b).

9ECB
Occasional Paper No. 34August 2005
3 TYPOLOGY OFHEDGE FUNDSIn contrast to directional funds, market neutral
hedge funds (also referred to as arbitrage orrelative value funds) search for arbitrage orrelative value opportunities to exploit variousprice discrepancies, and try to avoid exposureto market-wide movements. Here, the meaningof arbitrage is somewhat looser and includestrades that entail some risk of loss oruncertainty about total profits. Such strategiesare attractive due to their lower volatility, butthey require medium to high leverage in orderto benefit from small pricing distortions,particularly in fixed income markets.
Event driven strategies lie somewhere in themiddle of the volatility spectrum, withcorresponding medium volatility and low tomedium leverage. Profit opportunities arisefrom special occasions in a company’s life,such as mergers and acquisitions,reorganisations or bankruptcies. Mergerarbitrage typically involves buying the sharesof a target company and selling the shares of theacquiring company. Hedge funds investing indistressed securities try to exploit the fact that
it is difficult to value such securities, and thatmany institutional investors are prohibitedfrom investing in them.
Finally, FOHFs should have lower volatilityand attractive risk-adjusted returns due todiversification benefits.
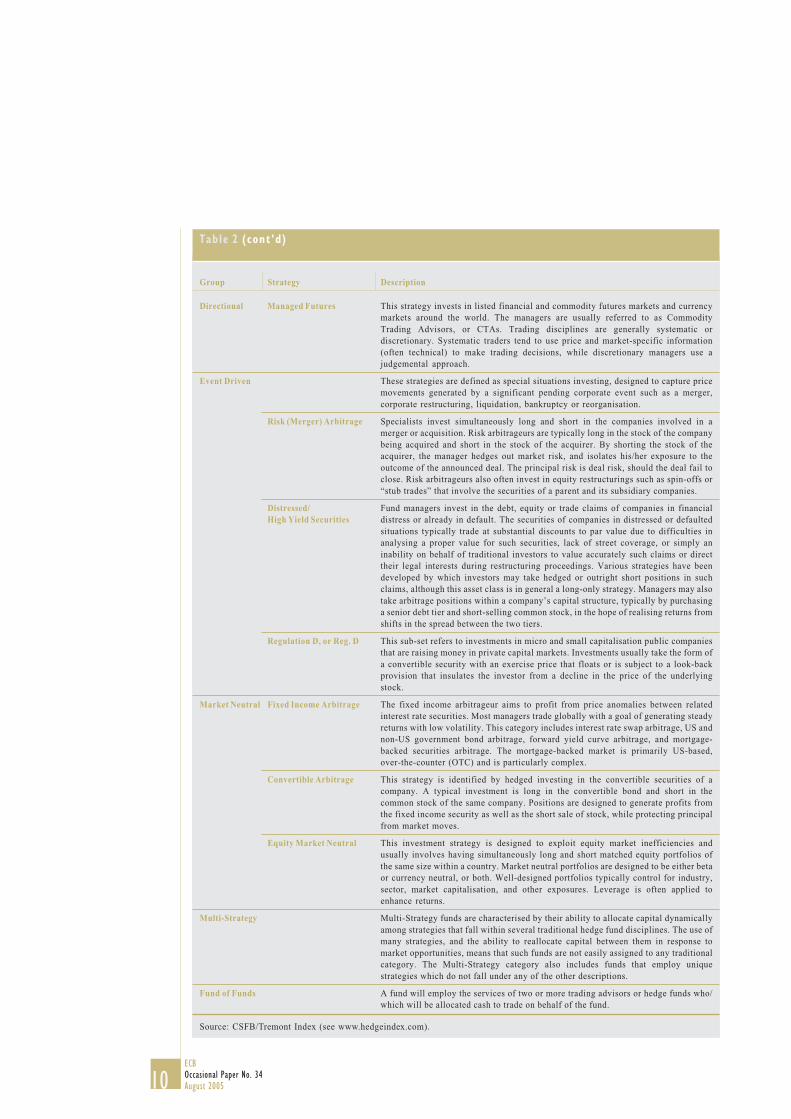
The detailed version of the classification usedin the TASS database, on which the analysisin this paper is to a large extent based, isprovided in Table 2. Other private vendorsmight use slightly different categories, butsuch differences are unlikely to be verysubstantial, as the major strategies are groupedin a broadly similar way.
Investors can access hedge funds in a number ofways, and this diversity can serve as anadditional classification criterion. Privateplacements of limited participation interests inprivate partnerships or offshore investmentfund shares are the most common ways to makedirect capital injections. In some cases (forexample, in Ireland or Luxembourg), shares of
Group Strategy Description
Directional Long/Short Equity Hedge This directional strategy involves equity-oriented investing on both the long and shortsides of the market. The objective is not to be market neutral. Managers have theability to shift from value to growth, from small to medium to large capitalisationstocks, and from a net long position to a net short position. Managers may use futuresand options to hedge. The focus may be regional, such as long/short US or Europeanequity, or sector-specific, such as long and short technology or healthcare stocks.Long/short equity funds tend to build and hold portfolios that are substantially moreconcentrated than those of traditional stock funds.
Dedicated Short Bias Dedicated short-sellers were once a robust category of hedge funds before the longbull market of the late 1990s rendered the strategy difficult to implement. A newcategory, “short biased”, has since emerged. The strategy is to maintain net short asopposed to pure short exposure. Short-biased managers take short positions in mostlyequities and derivatives. The short bias of a manager’s portfolio must be constantlygreater than zero to be classified in this category.
Global Macro Global macro managers carry long and short positions in any of the world’s majorcapital or derivative markets. These positions reflect their views on overall marketdirection as influenced by major economic trends and/or events. The portfolios ofthese funds can include stocks, bonds, currencies and commodities in the form of cashor derivatives instruments. Most funds invest globally in both developed andemerging markets.
Emerging Markets This strategy involves equity or fixed income investing in emerging markets aroundthe world. Because many emerging markets do not allow short-selling, nor offerviable futures or other derivative products with which to hedge, emerging marketinvesting often employs a long-only strategy.
Table 2 Hedge fund category def init ions
10ECBOccasional Paper No. 34August 2005
Table 2 (cont’d)
Directional Managed Futures This strategy invests in listed financial and commodity futures markets and currencymarkets around the world. The managers are usually referred to as CommodityTrading Advisors, or CTAs. Trading disciplines are generally systematic ordiscretionary. Systematic traders tend to use price and market-specific information(often technical) to make trading decisions, while discretionary managers use ajudgemental approach.
Event Driven These strategies are defined as special situations investing, designed to capture pricemovements generated by a significant pending corporate event such as a merger,corporate restructuring, liquidation, bankruptcy or reorganisation.
Risk (Merger) Arbitrage Specialists invest simultaneously long and short in the companies involved in amerger or acquisition. Risk arbitrageurs are typically long in the stock of the companybeing acquired and short in the stock of the acquirer. By shorting the stock of theacquirer, the manager hedges out market risk, and isolates his/her exposure to theoutcome of the announced deal. The principal risk is deal risk, should the deal fail toclose. Risk arbitrageurs also often invest in equity restructurings such as spin-offs or“stub trades” that involve the securities of a parent and its subsidiary companies.
Distressed/ Fund managers invest in the debt, equity or trade claims of companies in financialHigh Yield Securities distress or already in default. The securities of companies in distressed or defaulted
situations typically trade at substantial discounts to par value due to difficulties inanalysing a proper value for such securities, lack of street coverage, or simply aninability on behalf of traditional investors to value accurately such claims or directtheir legal interests during restructuring proceedings. Various strategies have beendeveloped by which investors may take hedged or outright short positions in suchclaims, although this asset class is in general a long-only strategy. Managers may alsotake arbitrage positions within a company’s capital structure, typically by purchasinga senior debt tier and short-selling common stock, in the hope of realising returns fromshifts in the spread between the two tiers.
Regulation D, or Reg. D This sub-set refers to investments in micro and small capitalisation public companiesthat are raising money in private capital markets. Investments usually take the form ofa convertible security with an exercise price that floats or is subject to a look-backprovision that insulates the investor from a decline in the price of the underlyingstock.
Market Neutral Fixed Income Arbitrage The fixed income arbitrageur aims to profit from price anomalies between relatedinterest rate securities. Most managers trade globally with a goal of generating steadyreturns with low volatility. This category includes interest rate swap arbitrage, US andnon-US government bond arbitrage, forward yield curve arbitrage, and mortgage-backed securities arbitrage. The mortgage-backed market is primarily US-based,over-the-counter (OTC) and is particularly complex.
Convertible Arbitrage This strategy is identified by hedged investing in the convertible securities of acompany. A typical investment is long in the convertible bond and short in thecommon stock of the same company. Positions are designed to generate profits fromthe fixed income security as well as the short sale of stock, while protecting principalfrom market moves.
Equity Market Neutral This investment strategy is designed to exploit equity market inefficiencies andusually involves having simultaneously long and short matched equity portfolios ofthe same size within a country. Market neutral portfolios are designed to be either betaor currency neutral, or both. Well-designed portfolios typically control for industry,sector, market capitalisation, and other exposures. Leverage is often applied toenhance returns.
Multi-Strategy Multi-Strategy funds are characterised by their ability to allocate capital dynamicallyamong strategies that fall within several traditional hedge fund disciplines. The use ofmany strategies, and the ability to reallocate capital between them in response tomarket opportunities, means that such funds are not easily assigned to any traditionalcategory. The Multi-Strategy category also includes funds that employ uniquestrategies which do not fall under any of the other descriptions.
Fund of Funds A fund will employ the services of two or more trading advisors or hedge funds who/which will be allocated cash to trade on behalf of the fund.
Source: CSFB/Tremont Index (see www.hedgeindex.com).
Group Strategy Description
11ECB
Occasional Paper No. 34August 2005
4 CHARACTER IST ICSOF THE
HEDGE FUNDINDUSTRY
Box 1
INFORMATION IN HEDGE FUND DATABASES
There are three major providers of hedge fund databases commonly used by public bodies: theTrading Advisors Selection System (TASS), the Centre for International Securities andDerivatives Markets (CISDM) (former MAR/Hedge) and Hedge Fund Research (HFR). Thedifferent databases cover only part of the global hedge fund industry and to some extentoverlap, as some hedge funds report to more than one data provider. Certain databases mayhave strong regional biases. For example, Eurekahedge focuses primarily on Asian hedgefunds. Based on the latest study of hedge fund databases by Strategic Financial Solutions, thelargest and the five largest databases would respectively account for 44% and 84% of around8,100 hedge funds identified in 12 of the best-known databases.1 Moreover, given the fact that
hedge funds are listed on the stock exchange.Rising demand from retail investors andremaining regulatory obstacles for directinvestments have led to the emergence ofindirect investment channels, such as FOHFsor various performance-linked instruments,including unit-linked insurance policies andstructured notes (so-called wrappers).
4 CHARACTERISTICS OF THE HEDGE FUNDINDUSTRY
Any information on the activities of hedgefunds is subject to shortcomings, as manyhedge funds are domiciled offshore, facerelatively few information and disclosurerequirements, and provide information onlyon a voluntary basis. Nearly every privatedatabase is imperfect, with different andusually overlapping samples and biases in thedata (see Box 1).
In the following, the term “EU hedge funds”refers to funds based (domiciled) in the EU and/or with managers residing in the EU, whichmay not necessarily invest exclusively in theEU markets.8 Sometimes the term “Europeanhedge funds” may be used by data providers toidentify hedge funds that target exclusivelyEuropean markets. This difference in meaningshould be kept in mind when analysing thevarious data provided in the text.
From a financial stability perspective, bothviews are important, because one relates tofinancial institutions, i.e. the assetmanagement industry operating in Europe, andthe second one to market impact. The firstapproach is more common in the case of banksand other financial institutions, and ismoreover probably more stable compared tothe second one, since hedge funds may changetheir geographic orientation swiftly, which isless the case for the managers’ or fund’slocation. Managers may also exhibit a domesticbias to some extent.
4.1 LOCATION OF HEDGE FUNDS AND THEIRMANAGERS
Innovative hedge fund investment strategiesrequire complete freedom and discretion overtheir implementation. Managers therefore lookfor minimum regulatory intervention andfavourable tax treatment. Offshore tax havensare ideal domiciles9 for this purpose, becausethey offer a low level of regulation and externalcontrol, and it is relatively easy to set upand operate a hedge fund there. The Cayman
8 This def inition excludes only hedge funds that are managedfrom outside the EU and not domiciled in the EU. In this way,the def inition also captures funds that are domiciled in theEU but managed from outside the EU, and which mighttherefore be labelled as non-European funds. For moredetails, see Table 5.
9 The domicile is the place where the legal entity of the fund islocated.
1 Strategic Financial Solutions (2004).
12ECBOccasional Paper No. 34August 2005
some of the largest hedge fund families do not report to any database, any individual databasewould, at best, cover only 25-30% of funds. It would probably be possible to combineinformation from several databases, but this would most likely prove very laborious for thepurpose of a deeper analysis owing to the substantial differences between databases.
Typically, data vendors collect monthly performance data and rely either upon entries by thehedge fund manager or analyst. The submission of data can lag by several months, and accuracyis another concern. Time series data include capital under management and returns, whilequalitative information mostly relates to the hedge fund’s strategy, geographic focus, types ofinstruments used, leverage, fees, lock-ups, etc.
The data in such databases typically suffer from a number of biases:2
Survivorship bias – this is the statistical bias in performance aggregates due to the inclusion ofonly live funds and the exclusion of liquidated, no longer operating, or non-reporting funds.Reporting can stop not only when a fund falters because of poor returns or excess volatility, butalso because it reaches capacity limits or enjoys good returns and becomes closed to newinvestors. According to some estimates, this bias can increase aggregate hedge fund returns byan additional 2-3%. In this paper, the analysis is based on the combined version of the TASSdatabase, including both the “Live” and “Graveyard” modules in order to minimisesurvivorship effects and to produce historical aggregate data covering both active and inactivehedge funds.
(Self) selection bias – each database represents only a sample of the whole hedge fund universe.Funds that do not report due to superior returns offset to some extent the returns of those that donot report due to poor performance, which can render the bias less important. Hedge funds joinpublic databases largely for marketing purposes in order to attract additional funds forinvestment; only 9% of active hedge funds in the TASS database indicate that they are closed tonew investment. This share has been gradually declining since 1994, when it was 19%.
Instant history or backfill bias occurs when a hedge fund is attached to the database and when apart or the entire historical performance, which is usually quite positive, is added to thedatabase. This may contribute an additional 1-3% to the recalculated aggregate returns.
Liquidation bias arises because disappearing funds may not report final periods leading up toand including their liquidation.
Many vendors publicly provide only a subset of hedge funds tracked internally. As a result, forexample, the public version of the TASS database represents only around four-fifths of fundsand more than half of capital under management of all hedge funds available internally toTremont Capital Management Ltd. (TCM), the manager of the database. The larger internalversion is used for proprietary asset management business, consulting and the calculation ofCSFB/Tremont hedge fund indices. Certain aggregate information based on the internaldatabase is regularly published by TASS Research, the suite of hedge fund research productsowned by TCM. The fact that hedge fund managers not only stop reporting, but also instruct toremove all their historical information from the public version of the database renders
2 See, for example, Hedges (2004b), Malkiel et al. (2004).
13ECB
Occasional Paper No. 34August 2005
4 CHARACTER IST ICSOF THE
HEDGE FUNDINDUSTRY
aggregate information obtained from the public database unstable.3 For this reason, it isimportant to indicate the version of the public database from which aggregate information wasextracted. In this paper, the information was extracted from the TASS database as of 30 June2005, except for the analysis in the last part of sub-section 6.2.3, which was based on the24 March 2005 version of the database.
TASS provides fund managers with online access to the fund information, and they can reviewand update the data on a daily basis. However, there is no guarantee that the qualitativeinformation represents the latest changes and some information may even refer to the datewhen the fund was included in the database. For example, it is unclear to which date theinformation on average and maximum leverage exactly refers. The user should bear this inmind as only performance and capital under management data are reported as time series. Inaddition, there are no details on how hedge funds calculate leverage, as the guidance providedby the database manager is rather broad (i.e. portfolio to equity).4 Due to high demand for theleverage data, TCM plans to introduce more informative time series data on this particularvariable.
In the TASS database there is no explicit information on master-feeder structures. Moreover,without a comparison of individual data or additional information it is difficult to distinguishdifferent classes of hedge fund shares from separate hedge fund legal entities. This paper, asmost academic studies, therefore treats all entries as individual hedge funds when calculatingaggregate numbers of (funds of) hedge funds.
Furthermore, for some dates hedge funds provide only performance figures, and capital undermanagement needs to be estimated using previous capital data and the latest returns. However,even after this estimation, approximately 1-5% of funds (or sometimes even up to 10% of fundsin the case of latest data) have no capital figures on a particular date. All the information in thispaper refers to the narrower data set that includes only funds with reported (estimated) capitalunder management. In this way, consistency between aggregate data on the number of hedgefunds and their total capital under management is ensured.
3 When a new hedge fund joins the database, the addition of backf illed data also changes historical aggregate information.4 Some hedge funds indicate that they use leverage, but state that their average or maximum leverage is zero. To accommodate for
this, in the further analysis a special data group has been created and labelled “leverage 0”.
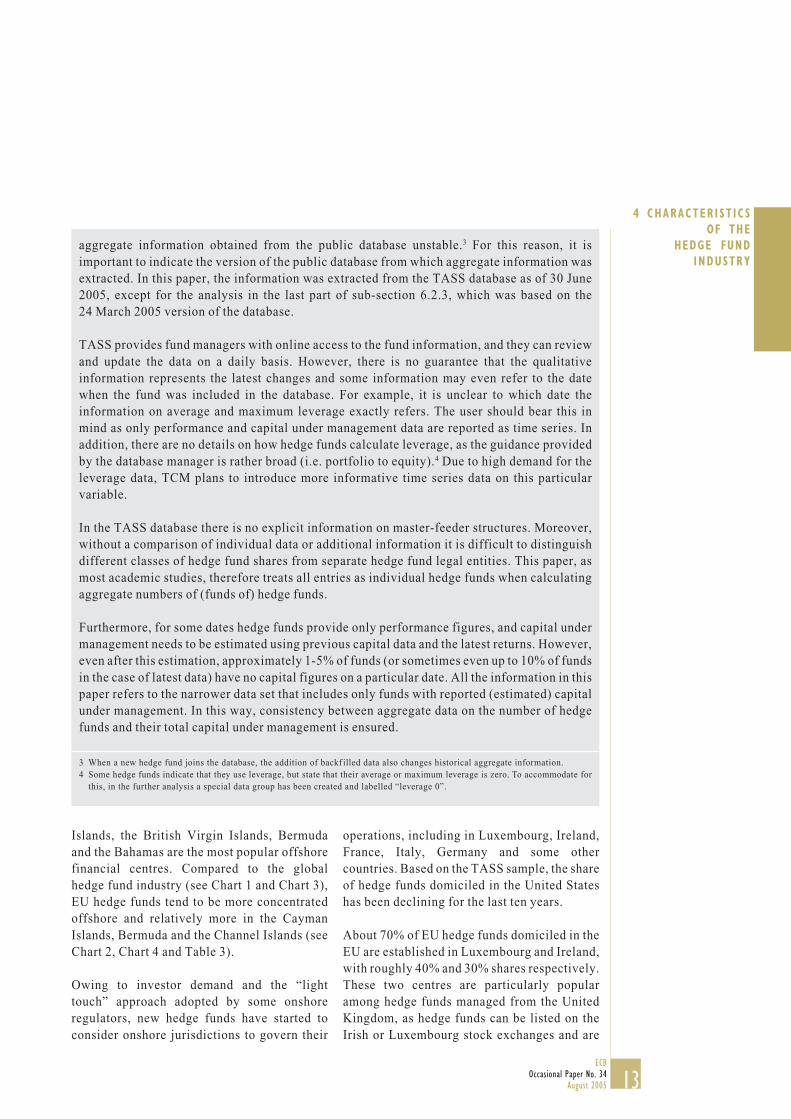
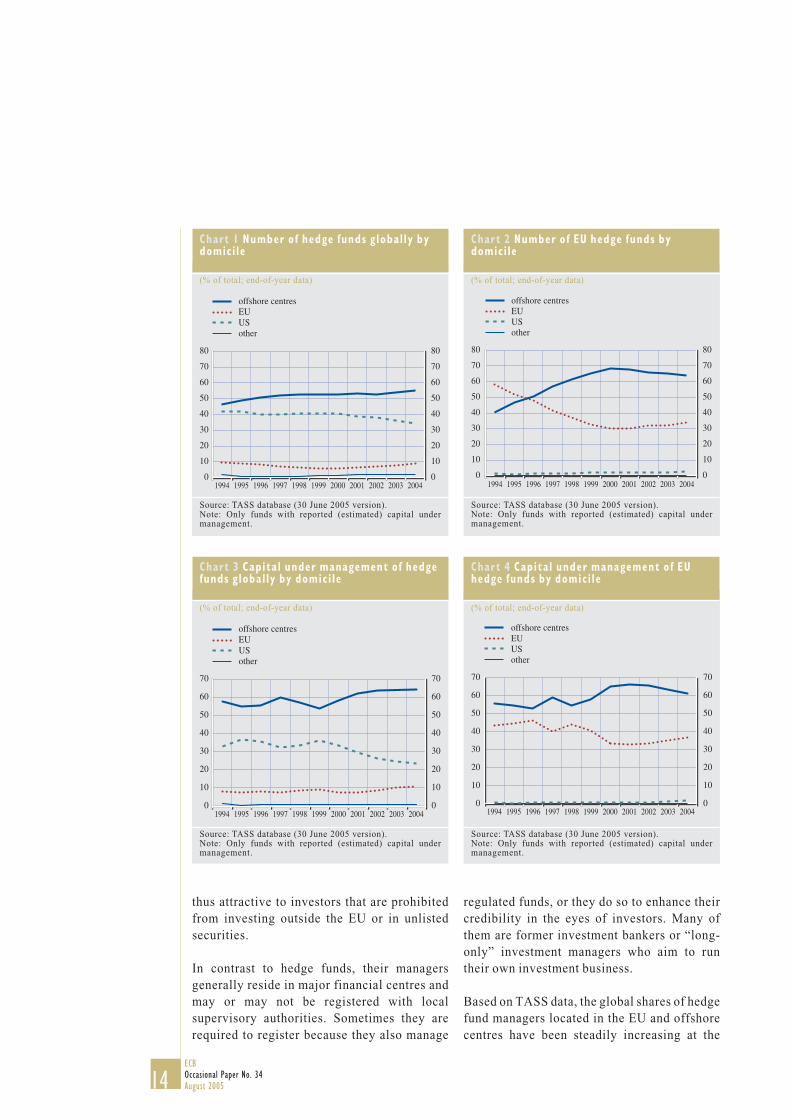
Islands, the British Virgin Islands, Bermudaand the Bahamas are the most popular offshorefinancial centres. Compared to the globalhedge fund industry (see Chart 1 and Chart 3),EU hedge funds tend to be more concentratedoffshore and relatively more in the CaymanIslands, Bermuda and the Channel Islands (seeChart 2, Chart 4 and Table 3).
Owing to investor demand and the “lighttouch” approach adopted by some onshoreregulators, new hedge funds have started toconsider onshore jurisdictions to govern their
operations, including in Luxembourg, Ireland,France, Italy, Germany and some othercountries. Based on the TASS sample, the shareof hedge funds domiciled in the United Stateshas been declining for the last ten years.
About 70% of EU hedge funds domiciled in theEU are established in Luxembourg and Ireland,with roughly 40% and 30% shares respectively.These two centres are particularly popularamong hedge funds managed from the UnitedKingdom, as hedge funds can be listed on theIrish or Luxembourg stock exchanges and are
14ECBOccasional Paper No. 34August 2005
thus attractive to investors that are prohibitedfrom investing outside the EU or in unlistedsecurities.
In contrast to hedge funds, their managersgenerally reside in major financial centres andmay or may not be registered with localsupervisory authorities. Sometimes they arerequired to register because they also manage
Chart 4 Capital under management of EUhedge funds by domici le
(% of total; end-of-year data)
Source: TASS database (30 June 2005 version).Note: Only funds with reported (estimated) capital undermanagement.
0
10
20
30
40
50
60
70
0
10
20
30
40
50
60
70
offshore centresEUUSother
1994 1995 1996 1997 1998 1999 2000 2001 2002 2003 2004
Chart 3 Capital under management of hedgefunds global ly by domici le
(% of total; end-of-year data)
Source: TASS database (30 June 2005 version).Note: Only funds with reported (estimated) capital undermanagement.
0
10
20
30
40
50
60
70
0
10
20
30
40
50
60
70
1994 1995 1996 1997 1998 1999 2000 2001 2002 2003 2004
offshore centresEUUSother
Chart 2 Number of EU hedge funds bydomici le
(% of total; end-of-year data)
Source: TASS database (30 June 2005 version).Note: Only funds with reported (estimated) capital undermanagement.
0
10
20
30
40
50
60
70
80
0
10
20
30
40
50
60
70
80
offshore centresEUUSother
1994 1995 1996 1997 1998 1999 2000 2001 2002 2003 2004
Chart 1 Number of hedge funds global ly bydomici le
(% of total; end-of-year data)
Source: TASS database (30 June 2005 version).Note: Only funds with reported (estimated) capital undermanagement.
0
10
20
30
40
50
60
70
80
1994 1995 1996 1997 1998 1999 2000 2001 2002 2003 20040
10
20
30
40
50
60
70
80
offshore centresEUUSother
regulated funds, or they do so to enhance theircredibility in the eyes of investors. Many ofthem are former investment bankers or “long-only” investment managers who aim to runtheir own investment business.
Based on TASS data, the global shares of hedgefund managers located in the EU and offshorecentres have been steadily increasing at the
15ECB
Occasional Paper No. 34August 2005
4 CHARACTER IST ICSOF THE
HEDGE FUNDINDUSTRY
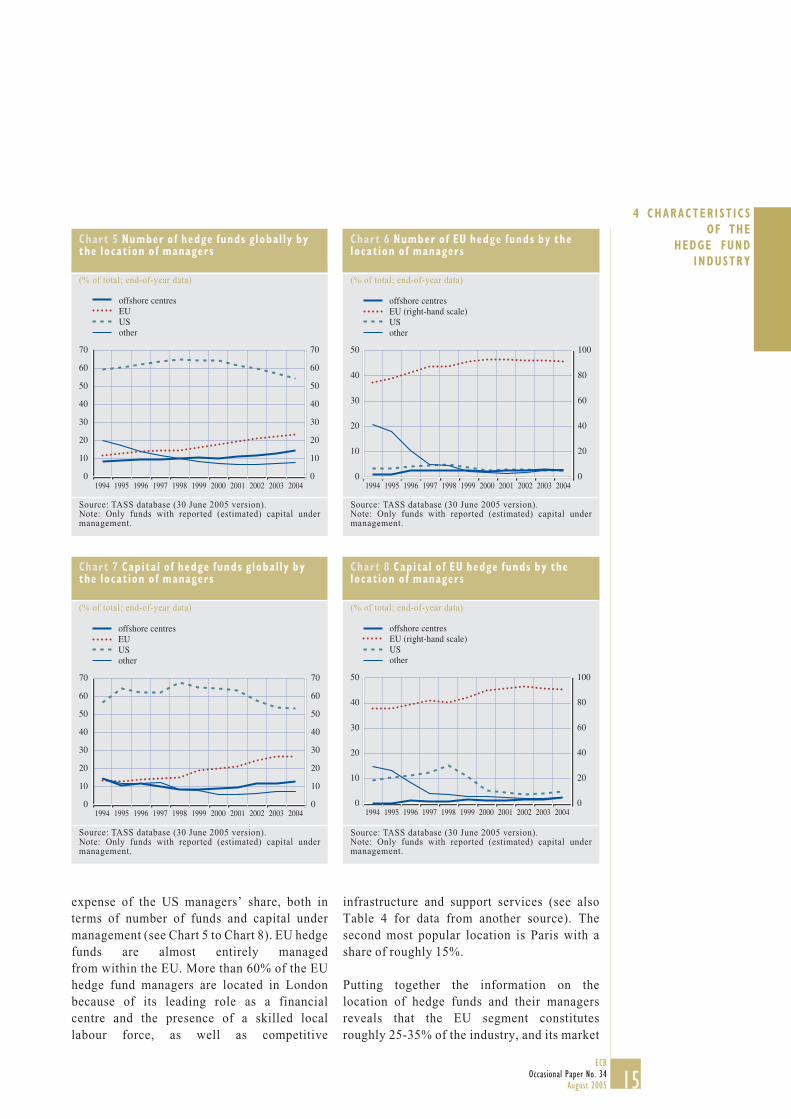
expense of the US managers’ share, both interms of number of funds and capital undermanagement (see Chart 5 to Chart 8). EU hedgefunds are almost entirely managedfrom within the EU. More than 60% of the EUhedge fund managers are located in Londonbecause of its leading role as a financialcentre and the presence of a skilled locallabour force, as well as competitive
infrastructure and support services (see alsoTable 4 for data from another source). Thesecond most popular location is Paris with ashare of roughly 15%.
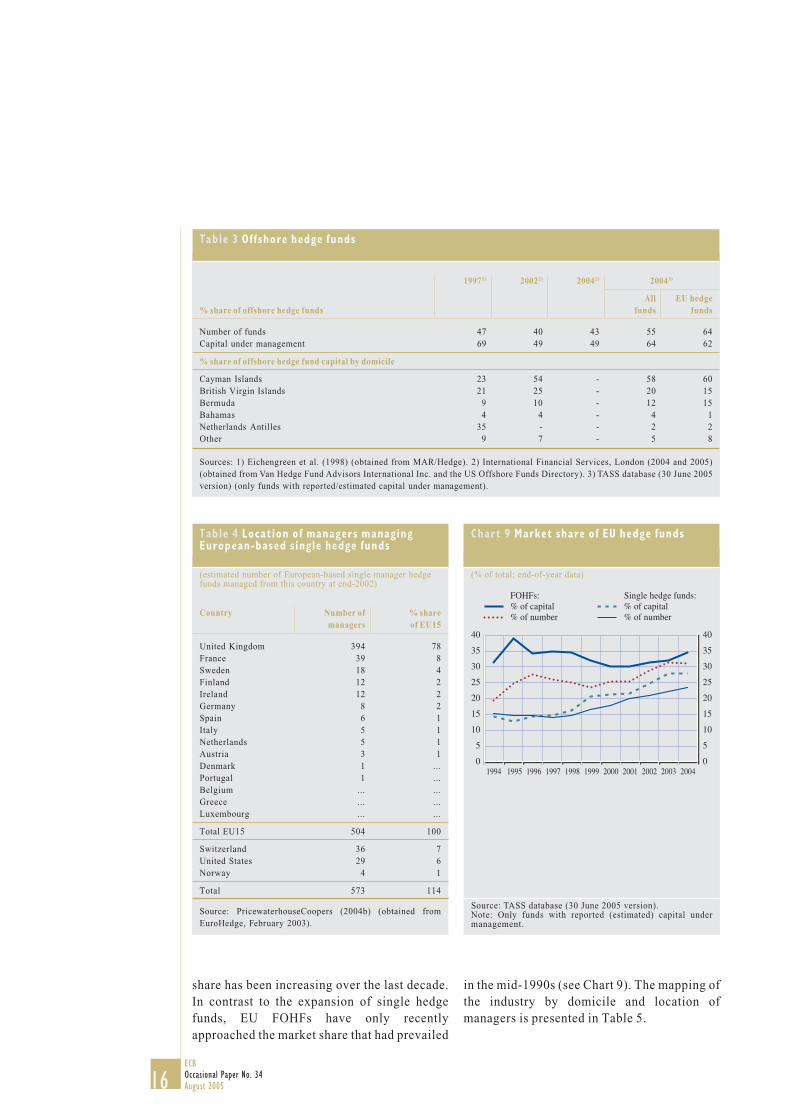
Putting together the information on thelocation of hedge funds and their managersreveals that the EU segment constitutesroughly 25-35% of the industry, and its market
Chart 6 Number of EU hedge funds by thelocation of managers
(% of total; end-of-year data)
Source: TASS database (30 June 2005 version).Note: Only funds with reported (estimated) capital undermanagement.
1994 1995 1996 1997 1998 1999 2000 2001 2002 2003 20040
10
20
30
40
50
0
20
40
60
80
100
offshore centresEU (right-hand scale)USother
Chart 5 Number of hedge funds global ly bythe location of managers
(% of total; end-of-year data)
Source: TASS database (30 June 2005 version).Note: Only funds with reported (estimated) capital undermanagement.
0
10
20
30
40
50
60
70
0
10
20
30
40
50
60
70
offshore centresEUUSother
1994 1995 1996 1997 1998 1999 2000 2001 2002 2003 2004
Chart 8 Capital of EU hedge funds by thelocation of managers
(% of total; end-of-year data)
Source: TASS database (30 June 2005 version).Note: Only funds with reported (estimated) capital undermanagement.
1994 1995 1996 1997 1998 1999 2000 2001 2002 2003 20040
10
20
30
40
50
0
20
40
60
80
100
offshore centresEU (right-hand scale)USother
Chart 7 Capital of hedge funds global ly bythe location of managers
(% of total; end-of-year data)
Source: TASS database (30 June 2005 version).Note: Only funds with reported (estimated) capital undermanagement.
1994 1995 1996 1997 1998 1999 2000 2001 2002 2003 20040
10
20
30
40
50
60
70
0
10
20
30
40
50
60
70
offshore centresEUUSother
16ECBOccasional Paper No. 34August 2005
share has been increasing over the last decade.In contrast to the expansion of single hedgefunds, EU FOHFs have only recentlyapproached the market share that had prevailed
Country Number of % sharemanagers of EU15
United Kingdom 394 78France 39 8Sweden 18 4Finland 12 2Ireland 12 2Germany 8 2Spain 6 1Italy 5 1Netherlands 5 1Austria 3 1Denmark 1 ...Portugal 1 ...Belgium ... ...Greece ... ...Luxembourg ... ...
Total EU15 504 100
Switzerland 36 7United States 29 6Norway 4 1
Total 573 114
Source: PricewaterhouseCoopers (2004b) (obtained fromEuroHedge, February 2003).
Table 4 Location of managers managingEuropean-based s ingle hedge funds
(estimated number of European-based single manager hedgefunds managed from this country at end-2002)
Chart 9 Market share of EU hedge funds
(% of total; end-of-year data)
Source: TASS database (30 June 2005 version).Note: Only funds with reported (estimated) capital undermanagement.
1994 1995 1996 1997 1998 1999 2000 2001 2002 2003 20040
5
10
15
20
25
30
35
40
0
5
10
15
20
25
30
35
40
FOHFs:% of capital% of number
Single hedge funds:% of capital% of number
in the mid-1990s (see Chart 9). The mapping ofthe industry by domicile and location ofmanagers is presented in Table 5.
19971) 20022) 20042) 20043)
All EU hedge% share of offshore hedge funds funds funds
Number of funds 47 40 43 55 64Capital under management 69 49 49 64 62
% share of offshore hedge fund capital by domicile
Cayman Islands 23 54 - 58 60British Virgin Islands 21 25 - 20 15Bermuda 9 10 - 12 15Bahamas 4 4 - 4 1Netherlands Antilles 35 - - 2 2Other 9 7 - 5 8
Sources: 1) Eichengreen et al. (1998) (obtained from MAR/Hedge). 2) International Financial Services, London (2004 and 2005)(obtained from Van Hedge Fund Advisors International Inc. and the US Offshore Funds Directory). 3) TASS database (30 June 2005version) (only funds with reported/estimated capital under management).
Table 3 Offshore hedge funds
17ECB
Occasional Paper No. 34August 2005
4 CHARACTER IST ICSOF THE
HEDGE FUNDINDUSTRY
4.2 INCENTIVE STRUCTURE AND FAILURERATES
Incentive schemes used by hedge funds arean important element of their success.Performance fees are typically asymmetric, asthey reward positive absolute returns without acorresponding penalty for negative returns.However, in instances where managers committheir own money, the preservation of capital isvery important and the motivation to takeexcessive risks is to some extent curtailed.Unlike hedge fund managers, traditional fundmanagers may lose flow income in case of poor
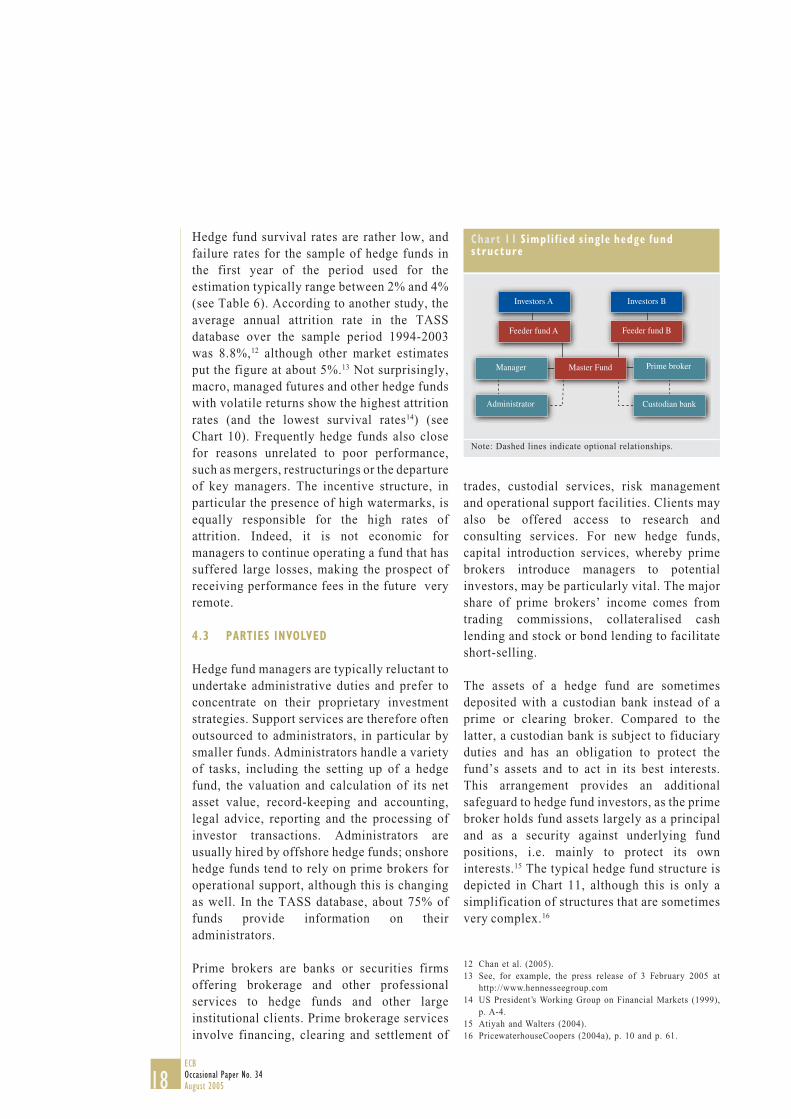
Chart 10 Attr it ion rates by strategy
(percentages; averages of annual attrition rates over1994-2003)
Source: Chan et al. (2005).
Cumulative1995-20021)
failureby capital under management
rates, % ≤≤≤≤≤ $50m $50-150m > $150m 1994-19982)
1-year 3.5 3.8 2.0 1.52-year 8.5 10.2 2.8 4.63-year 11.8 20.4 2.9 19.64-year 18.9 34.5 3.6 33.05-year 23.7 38.7 3.6 42.36-year 27.2 53.0 3.6 -7-year 32.0 66.0 3.6 -
Sources: 1) Hedges (2004a). 2) US President’s Working Groupon Financial Markets (1999), p. A-5.Note: For the methodologies applied, please consult theindicated sources.
Table 6 Hedge fund fai lure rates
fund performance, but they do not suffer animmediate loss to their existing wealth. It is notunusual for a hedge fund manager to receivehis/her first performance compensation onlyafter one or two years due to high watermarks10
and hurdle rates.11
10 A watermark is a fund valuation below which performancefees are not paid. With a high watermark, performance(incentive) fees are paid only if cumulative performancerecovers any past shortfalls. Therefore, a hedge fundmanager who loses in the f irst year and then merely regainsthat loss in the second year will not receive an incentivepayment for the second year’s gain.
11 The hurdle rate is the minimum return that must be generatedbefore fund managers may receive any performanceallocation.
Managed Futures
Global Macro
Fixed Income Arbitrage
Emerging Markets
Other (Multi-Strategy)
Dedicated Short Bias
Equity Market Neutral
Long/Short Equity
Fund of Funds
Event Driven
Convertible Arbitrage
0 5 10 15
5.2
5.4
6.9
7.6
8.0
8.0
8.2
9.2
10.6
12.6
14.4
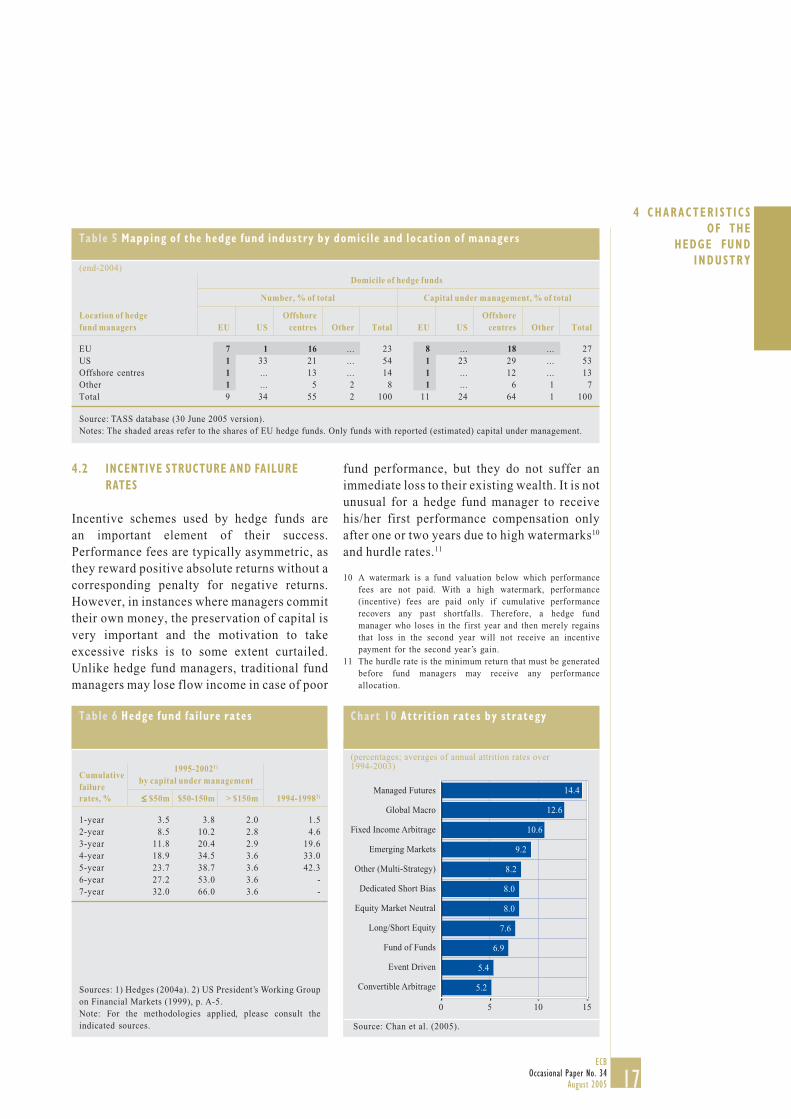
Source: TASS database (30 June 2005 version).Notes: The shaded areas refer to the shares of EU hedge funds. Only funds with reported (estimated) capital under management.
Table 5 Mapping of the hedge fund industry by domici le and location of managers
(end-2004)Domicile of hedge funds
Number, % of total Capital under management, % of total
Location of hedge Offshore Offshorefund managers EU US centres Other Total EU US centres Other Total
EU 7 1 16 ... 23 8 ... 18 ... 27US 1 33 21 ... 54 1 23 29 ... 53Offshore centres 1 ... 13 ... 14 1 ... 12 ... 13Other 1 ... 5 2 8 1 ... 6 1 7Total 9 34 55 2 100 11 24 64 1 100
18ECBOccasional Paper No. 34August 2005
Hedge fund survival rates are rather low, andfailure rates for the sample of hedge funds inthe first year of the period used for theestimation typically range between 2% and 4%(see Table 6). According to another study, theaverage annual attrition rate in the TASSdatabase over the sample period 1994-2003was 8.8%,12 although other market estimatesput the figure at about 5%.13 Not surprisingly,macro, managed futures and other hedge fundswith volatile returns show the highest attritionrates (and the lowest survival rates14) (seeChart 10). Frequently hedge funds also closefor reasons unrelated to poor performance,such as mergers, restructurings or the departureof key managers. The incentive structure, inparticular the presence of high watermarks, isequally responsible for the high rates ofattrition. Indeed, it is not economic formanagers to continue operating a fund that hassuffered large losses, making the prospect ofreceiving performance fees in the future veryremote.
4.3 PARTIES INVOLVED
Hedge fund managers are typically reluctant toundertake administrative duties and prefer toconcentrate on their proprietary investmentstrategies. Support services are therefore oftenoutsourced to administrators, in particular bysmaller funds. Administrators handle a varietyof tasks, including the setting up of a hedgefund, the valuation and calculation of its netasset value, record-keeping and accounting,legal advice, reporting and the processing ofinvestor transactions. Administrators areusually hired by offshore hedge funds; onshorehedge funds tend to rely on prime brokers foroperational support, although this is changingas well. In the TASS database, about 75% offunds provide information on theiradministrators.
Prime brokers are banks or securities firmsoffering brokerage and other professionalservices to hedge funds and other largeinstitutional clients. Prime brokerage servicesinvolve financing, clearing and settlement of
12 Chan et al. (2005).13 See, for example, the press release of 3 February 2005 at
http://www.hennesseegroup.com14 US President’s Working Group on Financial Markets (1999),
p. A-4.15 Atiyah and Walters (2004).16 PricewaterhouseCoopers (2004a), p. 10 and p. 61.
trades, custodial services, risk managementand operational support facilities. Clients mayalso be offered access to research andconsulting services. For new hedge funds,capital introduction services, whereby primebrokers introduce managers to potentialinvestors, may be particularly vital. The majorshare of prime brokers’ income comes fromtrading commissions, collateralised cashlending and stock or bond lending to facilitateshort-selling.
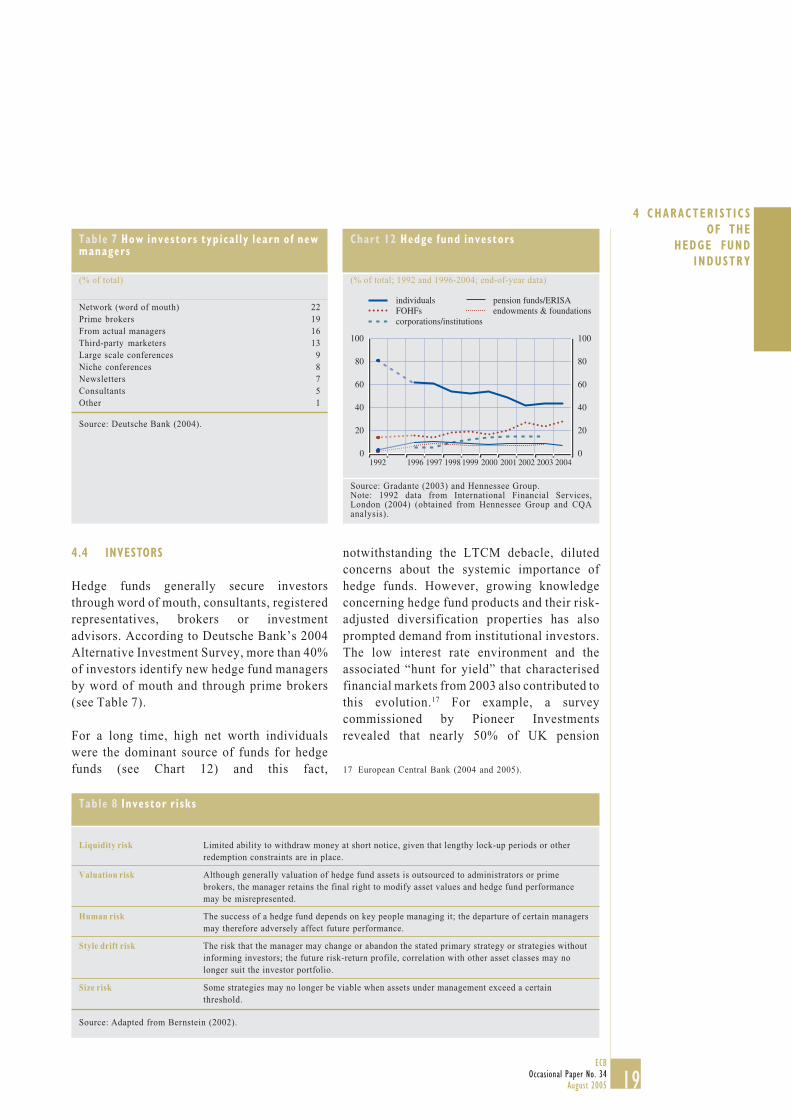
The assets of a hedge fund are sometimesdeposited with a custodian bank instead of aprime or clearing broker. Compared to thelatter, a custodian bank is subject to fiduciaryduties and has an obligation to protect thefund’s assets and to act in its best interests.This arrangement provides an additionalsafeguard to hedge fund investors, as the primebroker holds fund assets largely as a principaland as a security against underlying fundpositions, i.e. mainly to protect its owninterests.15 The typical hedge fund structure isdepicted in Chart 11, although this is only asimplification of structures that are sometimesvery complex.16
Chart 11 Simpl i f ied s ingle hedge fundstructure
Master FundManager
Administrator
Feeder fund A Feeder fund B
Investors A Investors B
Prime broker
Custodian bank
Note: Dashed lines indicate optional relationships.
19ECB
Occasional Paper No. 34August 2005
4 CHARACTER IST ICSOF THE
HEDGE FUNDINDUSTRY
4.4 INVESTORS
Hedge funds generally secure investorsthrough word of mouth, consultants, registeredrepresentatives, brokers or investmentadvisors. According to Deutsche Bank’s 2004Alternative Investment Survey, more than 40%of investors identify new hedge fund managersby word of mouth and through prime brokers(see Table 7).
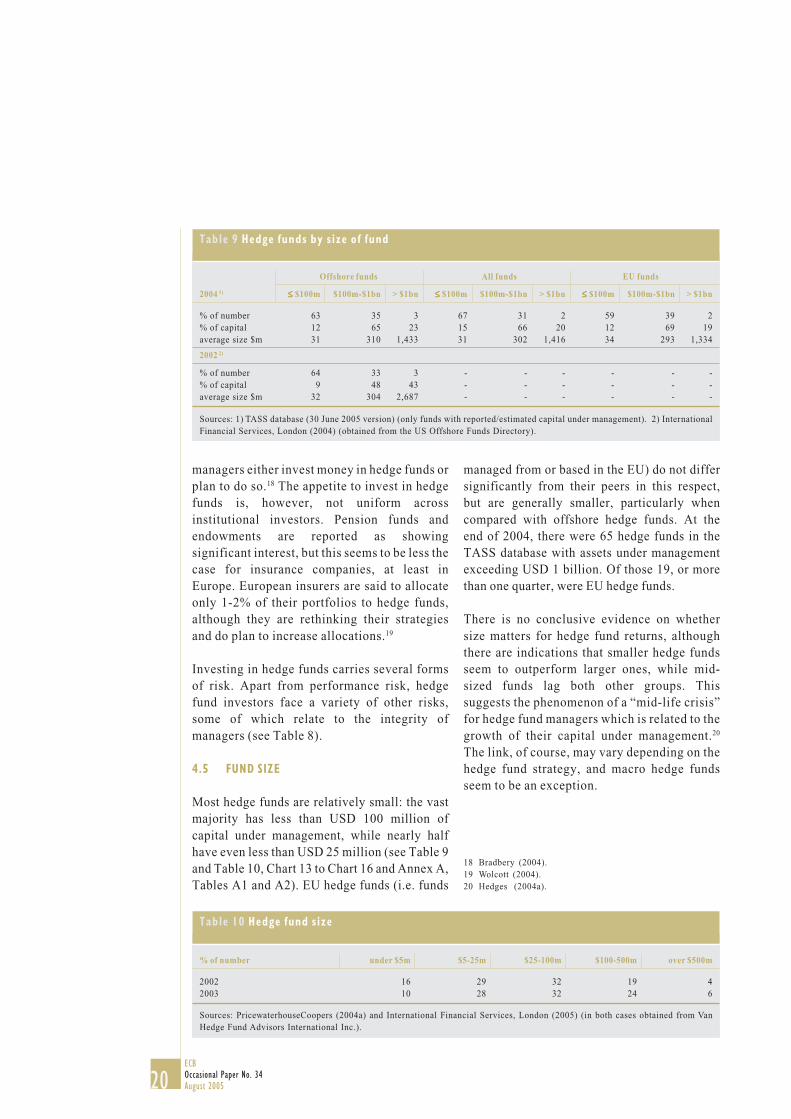
For a long time, high net worth individualswere the dominant source of funds for hedgefunds (see Chart 12) and this fact,
Network (word of mouth) 22Prime brokers 19From actual managers 16Third-party marketers 13Large scale conferences 9Niche conferences 8Newsletters 7Consultants 5Other 1
Table 7 How investors typical ly learn of newmanagers
(% of total)
Source: Deutsche Bank (2004).
Chart 12 Hedge fund investors
(% of total; 1992 and 1996-2004; end-of-year data)
Source: Gradante (2003) and Hennessee Group.Note: 1992 data from International Financial Services,London (2004) (obtained from Hennessee Group and CQAanalysis).
0
20
40
60
80
100
1992 1996 1997 1998 1999 2000 2001 2002 2003 20040
20
40
60
80
100
individualsFOHFscorporations/institutions
pension funds/ERISAendowments & foundations
notwithstanding the LTCM debacle, dilutedconcerns about the systemic importance ofhedge funds. However, growing knowledgeconcerning hedge fund products and their risk-adjusted diversification properties has alsoprompted demand from institutional investors.The low interest rate environment and theassociated “hunt for yield” that characterisedfinancial markets from 2003 also contributed tothis evolution.17 For example, a surveycommissioned by Pioneer Investmentsrevealed that nearly 50% of UK pension
Liquidity risk Limited ability to withdraw money at short notice, given that lengthy lock-up periods or otherredemption constraints are in place.
Valuation risk Although generally valuation of hedge fund assets is outsourced to administrators or primebrokers, the manager retains the final right to modify asset values and hedge fund performancemay be misrepresented.
Human risk The success of a hedge fund depends on key people managing it; the departure of certain managersmay therefore adversely affect future performance.
Style drift risk The risk that the manager may change or abandon the stated primary strategy or strategies withoutinforming investors; the future risk-return profile, correlation with other asset classes may nolonger suit the investor portfolio.
Size risk Some strategies may no longer be viable when assets under management exceed a certainthreshold.
Table 8 Investor r isks
Source: Adapted from Bernstein (2002).
17 European Central Bank (2004 and 2005).
20ECBOccasional Paper No. 34August 2005
% of number under $5m $5-25m $25-100m $100-500m over $500m
2002 16 29 32 19 42003 10 28 32 24 6
Sources: PricewaterhouseCoopers (2004a) and International Financial Services, London (2005) (in both cases obtained from VanHedge Fund Advisors International Inc.).
Table 10 Hedge fund s ize
Offshore funds All funds EU funds
2004 1) ≤≤≤≤≤ $100m $100m-$1bn > $1bn ≤≤≤≤≤ $100m $100m-$1bn > $1bn ≤≤≤≤≤ $100m $100m-$1bn > $1bn
% of number 63 35 3 67 31 2 59 39 2% of capital 12 65 23 15 66 20 12 69 19average size $m 31 310 1,433 31 302 1,416 34 293 1,334
2002 2)
% of number 64 33 3 - - - - - -% of capital 9 48 43 - - - - - -average size $m 32 304 2,687 - - - - - -
Sources: 1) TASS database (30 June 2005 version) (only funds with reported/estimated capital under management). 2) InternationalFinancial Services, London (2004) (obtained from the US Offshore Funds Directory).
Table 9 Hedge funds by s ize of fund
managers either invest money in hedge funds orplan to do so.18 The appetite to invest in hedgefunds is, however, not uniform acrossinstitutional investors. Pension funds andendowments are reported as showingsignificant interest, but this seems to be less thecase for insurance companies, at least inEurope. European insurers are said to allocateonly 1-2% of their portfolios to hedge funds,although they are rethinking their strategiesand do plan to increase allocations.19
Investing in hedge funds carries several formsof risk. Apart from performance risk, hedgefund investors face a variety of other risks,some of which relate to the integrity ofmanagers (see Table 8).
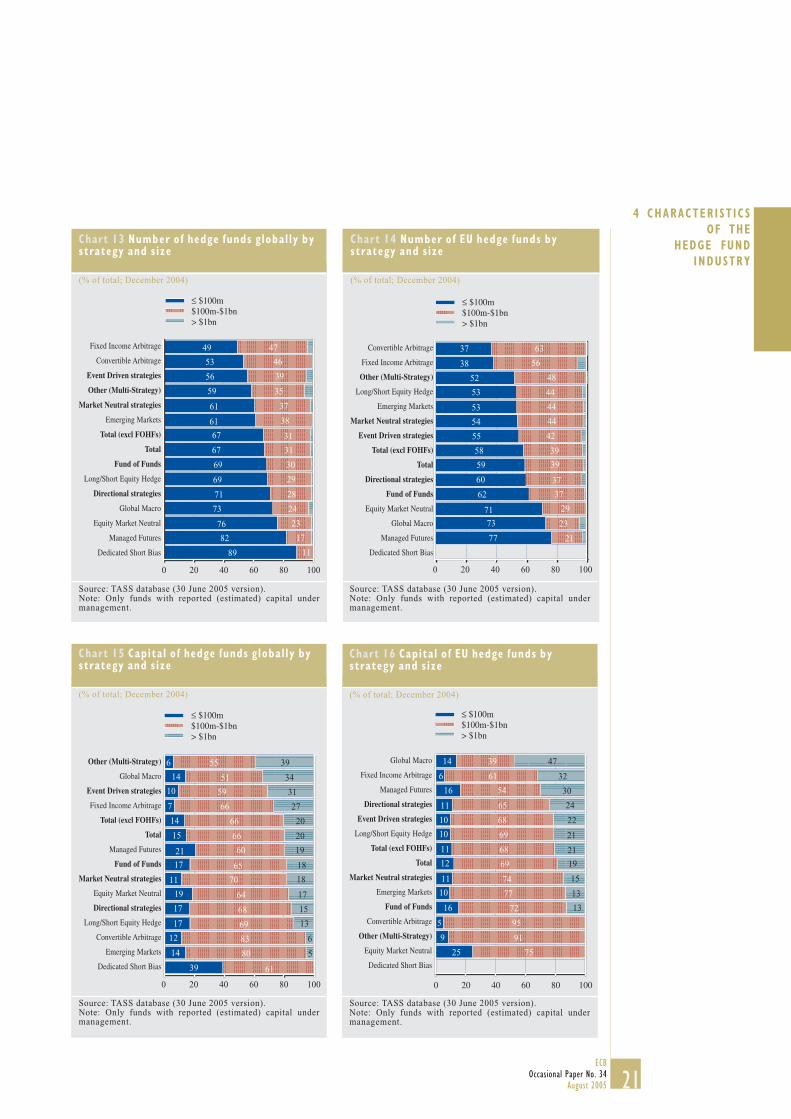
4.5 FUND SIZE
Most hedge funds are relatively small: the vastmajority has less than USD 100 million ofcapital under management, while nearly halfhave even less than USD 25 million (see Table 9and Table 10, Chart 13 to Chart 16 and Annex A,Tables A1 and A2). EU hedge funds (i.e. funds
managed from or based in the EU) do not differsignificantly from their peers in this respect,but are generally smaller, particularly whencompared with offshore hedge funds. At theend of 2004, there were 65 hedge funds in theTASS database with assets under managementexceeding USD 1 billion. Of those 19, or morethan one quarter, were EU hedge funds.
There is no conclusive evidence on whethersize matters for hedge fund returns, althoughthere are indications that smaller hedge fundsseem to outperform larger ones, while mid-sized funds lag both other groups. Thissuggests the phenomenon of a “mid-life crisis”for hedge fund managers which is related to thegrowth of their capital under management.20
The link, of course, may vary depending on thehedge fund strategy, and macro hedge fundsseem to be an exception.
18 Bradbery (2004).19 Wolcott (2004).20 Hedges (2004a).
21ECB
Occasional Paper No. 34August 2005
4 CHARACTER IST ICSOF THE
HEDGE FUNDINDUSTRY
Chart 14 Number of EU hedge funds bystrategy and s ize
(% of total; December 2004)
≤ $100m$100m-$1bn> $1bn
Convertible Arbitrage
Fixed Income Arbitrage
Other (Multi-Strategy)
Long/Short Equity Hedge
Emerging Markets
Market Neutral strategies
Event Driven strategies
Total (excl FOHFs)
Total
Directional strategies
Fund of Funds
Equity Market Neutral
Global Macro
Managed Futures
Dedicated Short Bias
37
38
52
53
53
54
55
58
59
60
62
71
73
77
63
56
48
44
44
44
42
39
39
37
37
29
23
21
100806040200
Source: TASS database (30 June 2005 version).Note: Only funds with reported (estimated) capital undermanagement.
Chart 13 Number of hedge funds global ly bystrategy and s ize
(% of total; December 2004)
49
53
56
59
61
61
67
67
69
69
71
73
76
82
89
47
46
39
35
37
38
31
31
30
29
28
24
23
17
11
≤ $100m$100m-$1bn> $1bn
100806040200
Fixed Income Arbitrage
Convertible Arbitrage
Event Driven strategies
Other (Multi-Strategy)
Market Neutral strategies
Emerging Markets
Total (excl FOHFs)
Total
Fund of Funds
Long/Short Equity Hedge
Directional strategies
Global Macro
Equity Market Neutral
Managed Futures
Dedicated Short Bias
Source: TASS database (30 June 2005 version).Note: Only funds with reported (estimated) capital undermanagement.
Chart 16 Capital of EU hedge funds bystrategy and s ize
(% of total; December 2004)
14 39
≤ $100m$100m-$1bn> $1bn
100806040200
Global Macro
Fixed Income Arbitrage
Managed Futures
Directional strategies
Event Driven strategies
Long/Short Equity Hedge
Total (excl FOHFs)
Total
Market Neutral strategies
Emerging Markets
Fund of Funds
Convertible Arbitrage
Other (Multi-Strategy)
Equity Market Neutral
Dedicated Short Bias
6 61 32
47
16
11
10
10
11
12
11
10
16
5
9
25
54
65
68
69
68
69
74
77
72
95
91
75
24
22
21
21
19
15
13
13
30
Source: TASS database (30 June 2005 version).Note: Only funds with reported (estimated) capital undermanagement.
Chart 15 Capital of hedge funds global ly bystrategy and s ize
(% of total; December 2004)
Source: TASS database (30 June 2005 version).Note: Only funds with reported (estimated) capital undermanagement.
≤ $100m$100m-$1bn> $1bn
100806040200
Other (Multi-Strategy)
Global Macro
Event Driven strategies
Fixed Income Arbitrage
Total (excl FOHFs)
Total
Managed Futures
Fund of Funds
Market Neutral strategies
Equity Market Neutral
Directional strategies
Long/Short Equity Hedge
Convertible Arbitrage
Emerging Markets
Dedicated Short Bias
6
14
10
7
14
15
21
17
11
19
17
17
12
14
39
55
51
59
66
66
66
60
65
70
64
68
69
83
80
61
39
34
31
27
20
20
19
18
18
17
15
13
6
5
22ECBOccasional Paper No. 34August 2005
5 RECENT EVOLUTION OF THE HEDGE FUNDBUSINESS
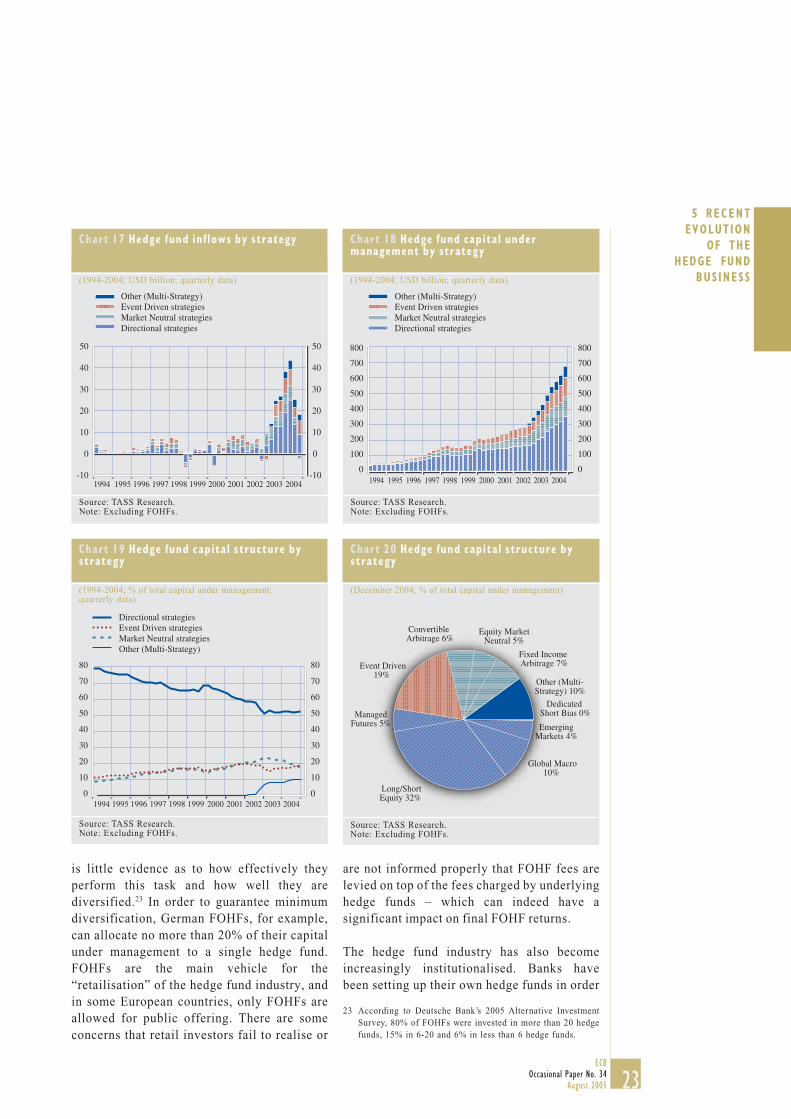
In an environment of low interest rates and lowreturns in financial markets, investors havebeen searching for alternative investments toimprove risk-adjusted returns. In this regard,hedge funds represent a natural candidate. Alldata sources confirm strong growth in thenumber of hedge funds and capital undermanagement (see Chart 18 and Annex A,Tables A1-A4). According to TASS Research,inflows into the hedge fund industry in 2004continued to surpass previous records,reaching USD 123 billion (excluding FOHFs)(see Chart 17). The latest estimates of the totalcapital under management are over USD 1trillion, a figure which furthermore does notinclude managed accounts accepted by hedgefund managers and managed using hedge fund-like strategies (totalling around USD 300billion at the end of 2004, according to TASSResearch).
Between 1993 and 2004, hedge fund capitalunder management grew at an annualisedcompound growth rate of 27%. In this periodthere were only a few quarters with negativeinflows, the most notable of which were twoconsecutive quarters starting at the end of1998, just after the near collapse of LTCM. TheLTCM episode seriously shook the industry,but proved to be only a temporary setback to anaccelerating long-term trend.
In 2004, all strategies recorded positive inflows.Funds with directional strategies preserved theirmarket share of total capital under management,although their share had been on a downwardtrend from 1994 onwards, which was largely dueto a decline of global macro funds (see Chart 19).Since 1995, long/short equity hedge funds haveremained the largest single strategy andrepresented around one-third of the industry atthe end of 2004 (see Chart 20). Event driven andmarket neutral strategies have gained inimportance during the last decade, but during thelast two years, even these strategies wereoutpaced by other (mostly multi-strategy) funds.
The last six quarters were also quite successfulfor event driven funds.
According to International Financial Services,London (IFSL) estimates, at the end of 2004most capital under management came from theUnited States (69%), although Europe (23%),Asia (5%) and other regions (3%) are becomingmore important sources of funds.21
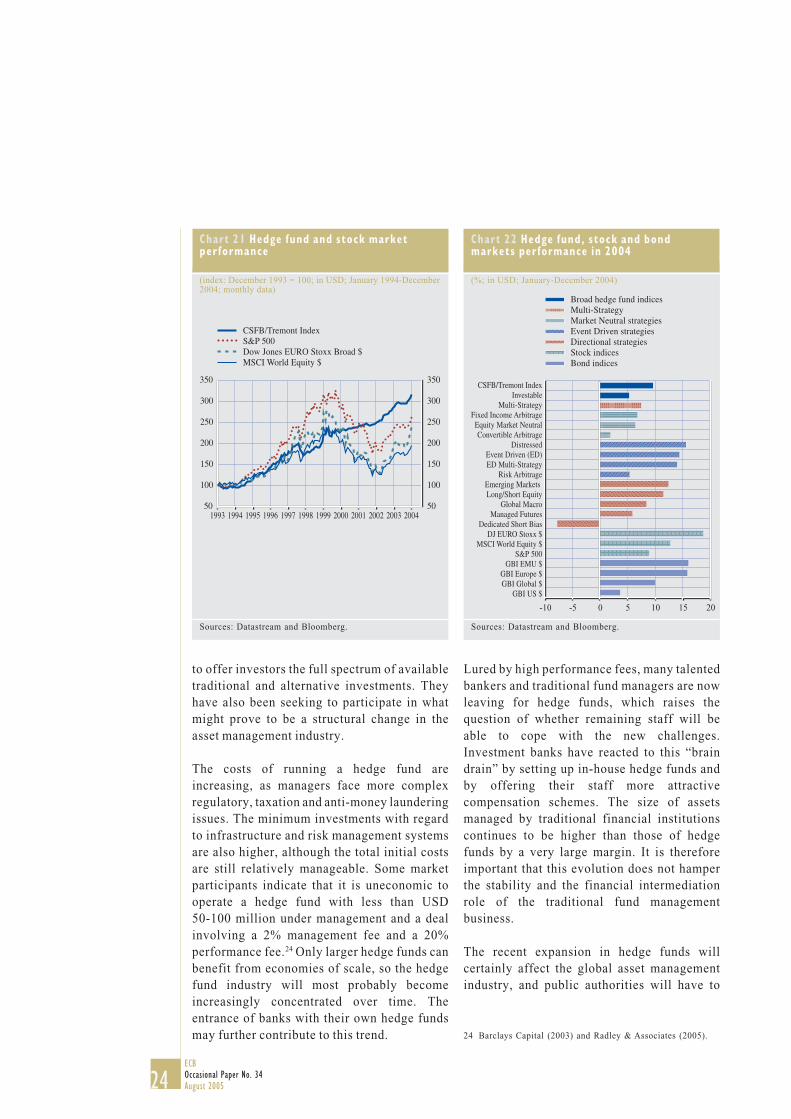
Investors bring in new funds mainly on theassumption that past returns will continue to berealised (see Chart 21 and Chart 22). However,it is questionable whether hedge funds will beable to maintain their impressive historicaltrack record as the number of new hedge fundsincreases, potentially leading to an increasingnumber of managers trying to exploit the samemarket opportunities, possibly also relyingupon similar models.
A pattern of segmentation appears amongsingle hedge funds, some of which prefer todeal only with institutional investors orFOHFs, whereas others have been trying tomaintain a more or less balanced investorstructure with high net worth individualsstill accounting for a significant share oftotal capital under management. However,according to market participants, institutionalinvestors do not look at small hedge fundsor provide seed capital. Many institutionalinvestors have a minimum size of allocation inabsolute terms and limit their investments inrelation to the total capital under managementof a target hedge fund. The current trend isthat smaller hedge funds with less thanUSD 100 million under management usuallyobtain funds from FOHFs, while the largerones with USD 1 billion take money directlyfrom institutional investors.22
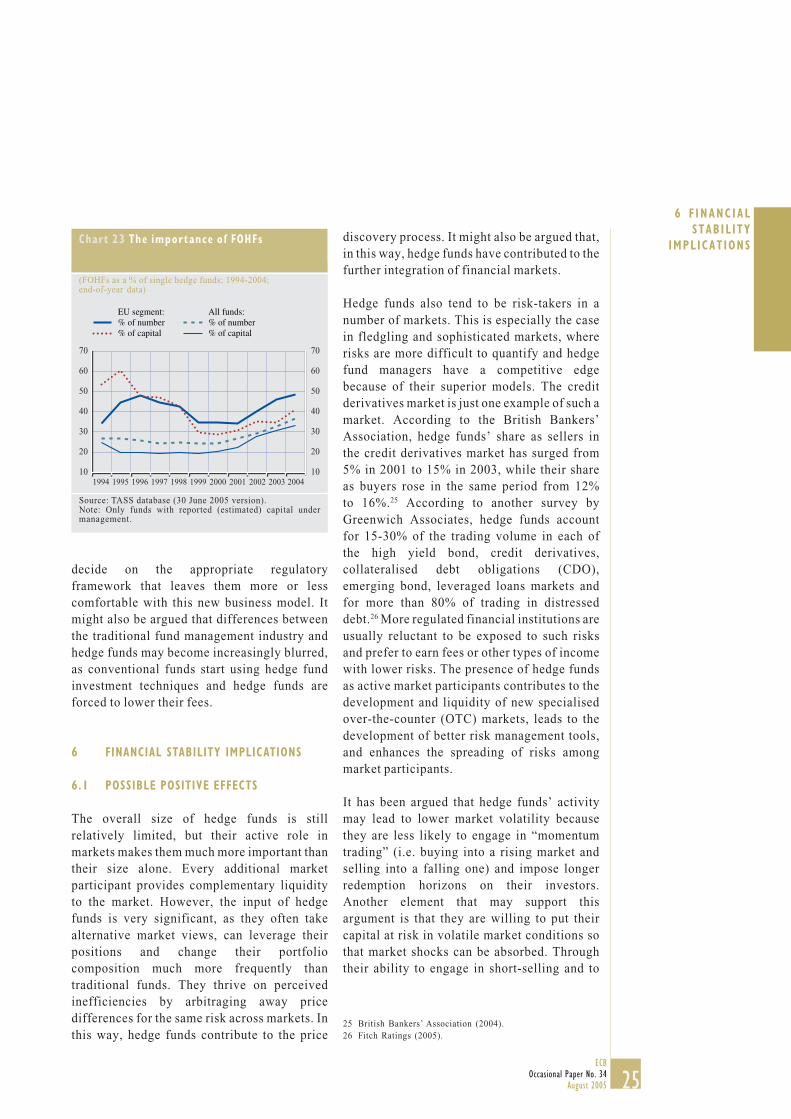
The role of FOHFs has been increasing, andthey should provide investors with anadditional layer of due diligence anddiversification (see Chart 23). However, there
21 International Financial Services, London (2005).22 Barclays Capital (2003) and Deutsche Bank (2005).
23ECB
Occasional Paper No. 34August 2005
5 RECENTEVOLUTION
OF THEHEDGE FUND
BUS INESS
is little evidence as to how effectively theyperform this task and how well they arediversified.23 In order to guarantee minimumdiversification, German FOHFs, for example,can allocate no more than 20% of their capitalunder management to a single hedge fund.FOHFs are the main vehicle for the“retailisation” of the hedge fund industry, andin some European countries, only FOHFs areallowed for public offering. There are someconcerns that retail investors fail to realise or
are not informed properly that FOHF fees arelevied on top of the fees charged by underlyinghedge funds – which can indeed have asignificant impact on final FOHF returns.
The hedge fund industry has also becomeincreasingly institutionalised. Banks havebeen setting up their own hedge funds in order
Chart 17 Hedge fund inf lows by strategy
(1994-2004; USD billion; quarterly data)
Source: TASS Research.Note: Excluding FOHFs.
-10
0
10
20
30
40
50
1994 1995 1996 1997 1998 1999 2000 2001 2002 2003 2004-10
0
10
20
30
40
50
Other (Multi-Strategy)Event Driven strategiesMarket Neutral strategiesDirectional strategies
Chart 18 Hedge fund capital undermanagement by strategy
(1994-2004; USD billion; quarterly data)
Source: TASS Research.Note: Excluding FOHFs.
Other (Multi-Strategy)Event Driven strategiesMarket Neutral strategiesDirectional strategies
1994 1995 1996 1997 1998 1999 2000 2001 2002 2003 20040
100
200
300
400
500
600
700
800
0
100
200
300
400
500
600
700
800
Chart 19 Hedge fund capital structure bystrategy
(1994-2004; % of total capital under management;quarterly data)
Source: TASS Research.Note: Excluding FOHFs.
Directional strategiesEvent Driven strategiesMarket Neutral strategiesOther (Multi-Strategy)
0
10
20
30
40
50
60
70
80
1994 1995 1996 1997 1998 1999 2000 2001 2002 2003 20040
10
20
30
40
50
60
70
80
Chart 20 Hedge fund capital structure bystrategy
(December 2004; % of total capital under management)
Other (Multi-Strategy) 10%
Event Driven19%
Long/ShortEquity 32%
ManagedFutures 5%
Convertible Arbitrage 6%
Fixed Income Arbitrage 7%
Equity MarketNeutral 5%
Global Macro10%
Dedicated Short Bias 0%
EmergingMarkets 4%
Source: TASS Research.Note: Excluding FOHFs.
23 According to Deutsche Bank’s 2005 Alternative InvestmentSurvey, 80% of FOHFs were invested in more than 20 hedgefunds, 15% in 6-20 and 6% in less than 6 hedge funds.
24ECBOccasional Paper No. 34August 2005
24 Barclays Capital (2003) and Radley & Associates (2005).
to offer investors the full spectrum of availabletraditional and alternative investments. Theyhave also been seeking to participate in whatmight prove to be a structural change in theasset management industry.
The costs of running a hedge fund areincreasing, as managers face more complexregulatory, taxation and anti-money launderingissues. The minimum investments with regardto infrastructure and risk management systemsare also higher, although the total initial costsare still relatively manageable. Some marketparticipants indicate that it is uneconomic tooperate a hedge fund with less than USD50-100 million under management and a dealinvolving a 2% management fee and a 20%performance fee.24 Only larger hedge funds canbenefit from economies of scale, so the hedgefund industry will most probably becomeincreasingly concentrated over time. Theentrance of banks with their own hedge fundsmay further contribute to this trend.
Lured by high performance fees, many talentedbankers and traditional fund managers are nowleaving for hedge funds, which raises thequestion of whether remaining staff will beable to cope with the new challenges.Investment banks have reacted to this “braindrain” by setting up in-house hedge funds andby offering their staff more attractivecompensation schemes. The size of assetsmanaged by traditional financial institutionscontinues to be higher than those of hedgefunds by a very large margin. It is thereforeimportant that this evolution does not hamperthe stability and the financial intermediationrole of the traditional fund managementbusiness.
The recent expansion in hedge funds willcertainly affect the global asset managementindustry, and public authorities will have to
Chart 21 Hedge fund and stock marketperformance
(index: December 1993 = 100; in USD; January 1994-December2004; monthly data)
Sources: Datastream and Bloomberg.
50
100
150
200
250
300
350
1993 1994 1995 1996 1997 1998 1999 2000 2001 2002 2003 200450
100
150
200
250
300
350
CSFB/Tremont IndexS&P 500Dow Jones EURO Stoxx Broad $MSCI World Equity $
Chart 22 Hedge fund, stock and bondmarkets performance in 2004
(%; in USD; January-December 2004)
-10 -5 0 5 10 15 20
Broad hedge fund indicesMulti-StrategyMarket Neutral strategies Event Driven strategiesDirectional strategiesStock indicesBond indices
CSFB/Tremont IndexInvestable
Multi-StrategyFixed Income Arbitrage
Equity Market NeutralConvertible Arbitrage
DistressedEvent Driven (ED)ED Multi-Strategy
Risk ArbitrageEmerging Markets Long/Short Equity
Global MacroManaged Futures
Dedicated Short BiasDJ EURO Stoxx $
MSCI World Equity $S&P 500
GBI EMU $GBI Europe $GBI Global $
GBI US $
Sources: Datastream and Bloomberg.
25ECB
Occasional Paper No. 34August 2005
6 F INANC IALSTABIL ITY
IMPL ICAT IONSChart 23 The importance of FOHFs
(FOHFs as a % of single hedge funds; 1994-2004;end-of-year data)
Source: TASS database (30 June 2005 version).Note: Only funds with reported (estimated) capital undermanagement.
10
20
30
40
50
60
70
10
20
30
40
50
60
70
EU segment: % of number% of capital
All funds: % of number% of capital
1994 1995 1996 1997 1998 1999 2000 2001 2002 2003 2004
decide on the appropriate regulatoryframework that leaves them more or lesscomfortable with this new business model. Itmight also be argued that differences betweenthe traditional fund management industry andhedge funds may become increasingly blurred,as conventional funds start using hedge fundinvestment techniques and hedge funds areforced to lower their fees.
6 FINANCIAL STABILITY IMPLICATIONS
6.1 POSSIBLE POSITIVE EFFECTS
The overall size of hedge funds is stillrelatively limited, but their active role inmarkets makes them much more important thantheir size alone. Every additional marketparticipant provides complementary liquidityto the market. However, the input of hedgefunds is very significant, as they often takealternative market views, can leverage theirpositions and change their portfoliocomposition much more frequently thantraditional funds. They thrive on perceivedinefficiencies by arbitraging away pricedifferences for the same risk across markets. Inthis way, hedge funds contribute to the price
discovery process. It might also be argued that,in this way, hedge funds have contributed to thefurther integration of financial markets.
Hedge funds also tend to be risk-takers in anumber of markets. This is especially the casein fledgling and sophisticated markets, whererisks are more difficult to quantify and hedgefund managers have a competitive edgebecause of their superior models. The creditderivatives market is just one example of such amarket. According to the British Bankers’Association, hedge funds’ share as sellers inthe credit derivatives market has surged from5% in 2001 to 15% in 2003, while their shareas buyers rose in the same period from 12%to 16%.25 According to another survey byGreenwich Associates, hedge funds accountfor 15-30% of the trading volume in each ofthe high yield bond, credit derivatives,collateralised debt obligations (CDO),emerging bond, leveraged loans markets andfor more than 80% of trading in distresseddebt.26 More regulated financial institutions areusually reluctant to be exposed to such risksand prefer to earn fees or other types of incomewith lower risks. The presence of hedge fundsas active market participants contributes to thedevelopment and liquidity of new specialisedover-the-counter (OTC) markets, leads to thedevelopment of better risk management tools,and enhances the spreading of risks amongmarket participants.
It has been argued that hedge funds’ activitymay lead to lower market volatility becausethey are less likely to engage in “momentumtrading” (i.e. buying into a rising market andselling into a falling one) and impose longerredemption horizons on their investors.Another element that may support thisargument is that they are willing to put theircapital at risk in volatile market conditions sothat market shocks can be absorbed. Throughtheir ability to engage in short-selling and to
25 British Bankers’ Association (2004).26 Fitch Ratings (2005).
26ECBOccasional Paper No. 34August 2005
take contrarian approaches, they may also actas a counterbalance to market herding.
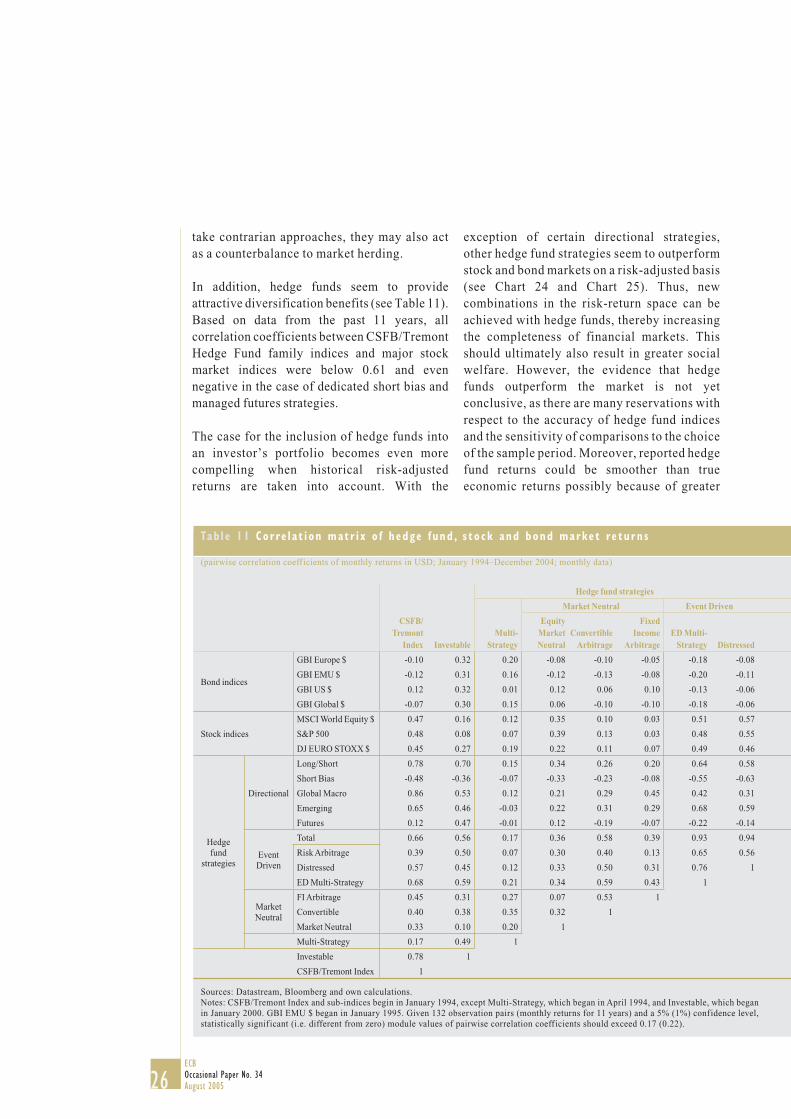
In addition, hedge funds seem to provideattractive diversification benefits (see Table 11).Based on data from the past 11 years, allcorrelation coefficients between CSFB/TremontHedge Fund family indices and major stockmarket indices were below 0.61 and evennegative in the case of dedicated short bias andmanaged futures strategies.
The case for the inclusion of hedge funds intoan investor’s portfolio becomes even morecompelling when historical risk-adjustedreturns are taken into account. With the
exception of certain directional strategies,other hedge fund strategies seem to outperformstock and bond markets on a risk-adjusted basis(see Chart 24 and Chart 25). Thus, newcombinations in the risk-return space can beachieved with hedge funds, thereby increasingthe completeness of financial markets. Thisshould ultimately also result in greater socialwelfare. However, the evidence that hedgefunds outperform the market is not yetconclusive, as there are many reservations withrespect to the accuracy of hedge fund indicesand the sensitivity of comparisons to the choiceof the sample period. Moreover, reported hedgefund returns could be smoother than trueeconomic returns possibly because of greater
Tab l e 11 Co r re l a t i on mat r i x o f h edge f und , s t o ck and bond marke t re tu r n s
(pairwise correlation coefficients of monthly returns in USD; January 1994–December 2004; monthly data)
CSFB/Tremont
Index Investable
Hedge fund strategies
Multi-
Strategy
Market Neutral Event Driven
EquityMarket Neutral
ConvertibleArbitrage
FixedIncome
ArbitrageED Multi-
Strategy Distressed
Bond indices
GBI Europe $ -0.10 0.32 0.20 -0.08 -0.10 -0.05 -0.18 -0.08
GBI EMU $ -0.12 0.31 0.16 -0.12 -0.13 -0.08 -0.20 -0.11
GBI US $ 0.12 0.32 0.01 0.12 0.06 0.10 -0.13 -0.06
GBI Global $ -0.07 0.30 0.15 0.06 -0.10 -0.10 -0.18 -0.06
Stock indices
MSCI World Equity $ 0.47 0.16 0.12 0.35 0.10 0.03 0.51 0.57
S&P 500 0.48 0.08 0.07 0.39 0.13 0.03 0.48 0.55
DJ EURO STOXX $ 0.45 0.27 0.19 0.22 0.11 0.07 0.49 0.46
Hedge fund
strategies
Directional
Long/Short 0.78 0.70 0.15 0.34 0.26 0.20 0.64 0.58
Short Bias -0.48 -0.36 -0.07 -0.33 -0.23 -0.08 -0.55 -0.63
Global Macro 0.86 0.53 0.12 0.21 0.29 0.45 0.42 0.31
Emerging 0.65 0.46 -0.03 0.22 0.31 0.29 0.68 0.59
Futures 0.12 0.47 -0.01 0.12 -0.19 -0.07 -0.22 -0.14
EventDriven
Total 0.66 0.56 0.17 0.36 0.58 0.39 0.93 0.94
Risk Arbitrage 0.39 0.50 0.07 0.30 0.40 0.13 0.65 0.56
Distressed 0.57 0.45 0.12 0.33 0.50 0.31 0.76 1
ED Multi-Strategy 0.68 0.59 0.21 0.34 0.59 0.43 1
Market Neutral
FI Arbitrage 0.45 0.31 0.27 0.07 0.53 1
Convertible 0.40 0.38 0.35 0.32 1
Market Neutral 0.33 0.10 0.20 1
Multi-Strategy 0.17 0.49 1
Investable 0.78 1
CSFB/Tremont Index 1
Sources: Datastream, Bloomberg and own calculations.Notes: CSFB/Tremont Index and sub-indices begin in January 1994, except Multi-Strategy, which began in April 1994, and Investable, which began in January 2000. GBI EMU $ began in January 1995. Given 132 observation pairs (monthly returns for 11 years) and a 5% (1%) confidence level, statistically signif icant (i.e. different from zero) module values of pairwise correlation coefficients should exceed 0.17 (0.22).
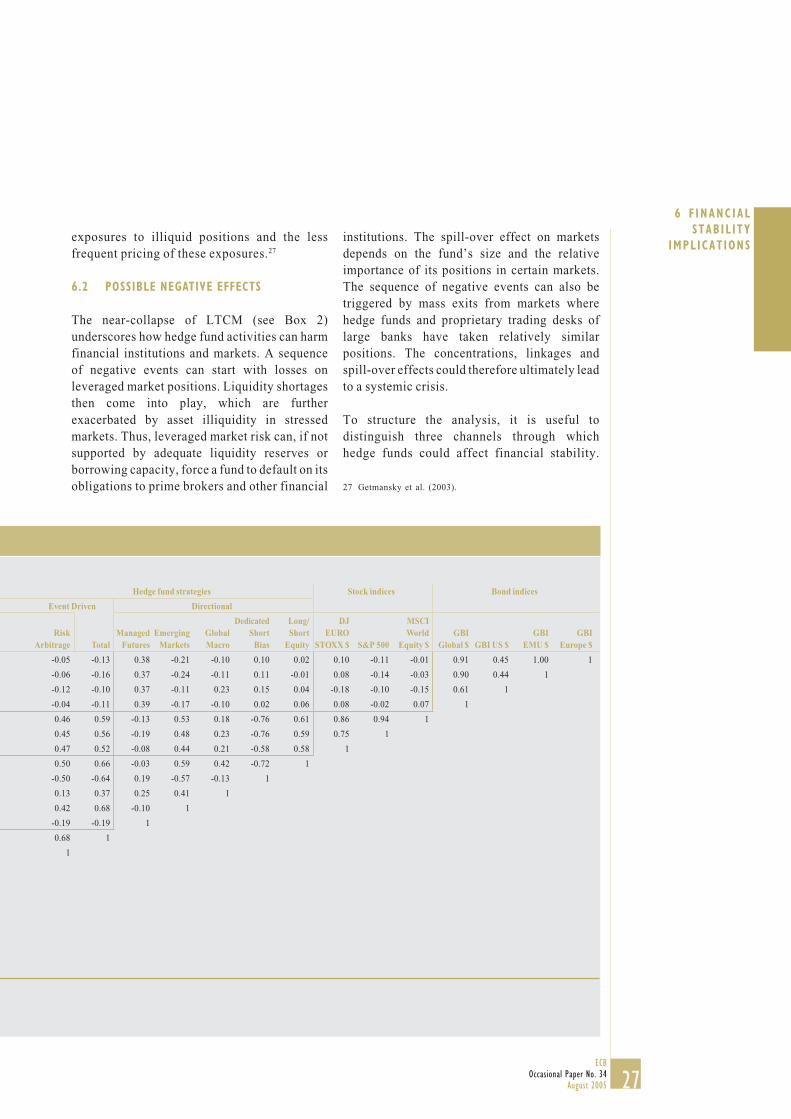
27ECB
Occasional Paper No. 34August 2005
6 F INANC IALSTABIL ITY
IMPL ICAT IONSexposures to illiquid positions and the lessfrequent pricing of these exposures.27
6.2 POSSIBLE NEGATIVE EFFECTS
The near-collapse of LTCM (see Box 2)underscores how hedge fund activities can harmfinancial institutions and markets. A sequenceof negative events can start with losses onleveraged market positions. Liquidity shortagesthen come into play, which are furtherexacerbated by asset illiquidity in stressedmarkets. Thus, leveraged market risk can, if notsupported by adequate liquidity reserves orborrowing capacity, force a fund to default on itsobligations to prime brokers and other financial
institutions. The spill-over effect on marketsdepends on the fund’s size and the relativeimportance of its positions in certain markets.The sequence of negative events can also betriggered by mass exits from markets wherehedge funds and proprietary trading desks oflarge banks have taken relatively similarpositions. The concentrations, linkages andspill-over effects could therefore ultimately leadto a systemic crisis.
To structure the analysis, it is useful todistinguish three channels through whichhedge funds could affect financial stability.
27 Getmansky et al. (2003).
Hedge fund strategies Stock indices Bond indices
Event Driven Directional
Risk Arbitrage Total
ManagedFutures
EmergingMarkets
Global Macro
DedicatedShort
Bias
Long/Short
Equity
DJ EURO
STOXX $ S&P 500
MSCI World
Equity $GBI
Global $ GBI US $GBI
EMU $GBI
Europe $
-0.05 -0.13 0.38 -0.21 -0.10 0.10 0.02 0.10 -0.11 -0.01 0.91 0.45 1.00 1
-0.06 -0.16 0.37 -0.24 -0.11 0.11 -0.01 0.08 -0.14 -0.03 0.90 0.44 1
-0.12 -0.10 0.37 -0.11 0.23 0.15 0.04 -0.18 -0.10 -0.15 0.61 1
-0.04 -0.11 0.39 -0.17 -0.10 0.02 0.06 0.08 -0.02 0.07 1
0.46 0.59 -0.13 0.53 0.18 -0.76 0.61 0.86 0.94 1
0.45 0.56 -0.19 0.48 0.23 -0.76 0.59 0.75 1
0.47 0.52 -0.08 0.44 0.21 -0.58 0.58 1
0.50 0.66 -0.03 0.59 0.42 -0.72 1
-0.50 -0.64 0.19 -0.57 -0.13 1
0.13 0.37 0.25 0.41 1
0.42 0.68 -0.10 1
-0.19 -0.19 1
0.68 1
1
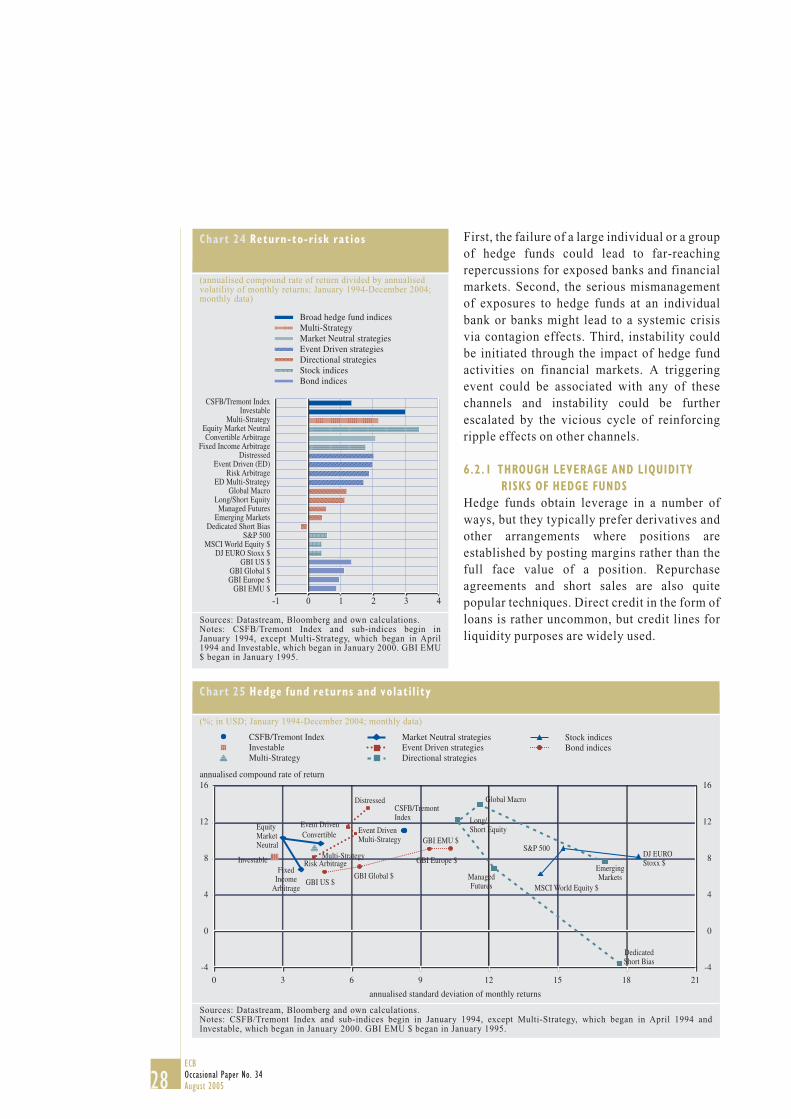
28ECBOccasional Paper No. 34August 2005
First, the failure of a large individual or a groupof hedge funds could lead to far-reachingrepercussions for exposed banks and financialmarkets. Second, the serious mismanagementof exposures to hedge funds at an individualbank or banks might lead to a systemic crisisvia contagion effects. Third, instability couldbe initiated through the impact of hedge fundactivities on financial markets. A triggeringevent could be associated with any of thesechannels and instability could be furtherescalated by the vicious cycle of reinforcingripple effects on other channels.
6.2.1 THROUGH LEVERAGE AND LIQUIDITYRISKS OF HEDGE FUNDS
Hedge funds obtain leverage in a number ofways, but they typically prefer derivatives andother arrangements where positions areestablished by posting margins rather than thefull face value of a position. Repurchaseagreements and short sales are also quitepopular techniques. Direct credit in the form ofloans is rather uncommon, but credit lines forliquidity purposes are widely used.
Chart 24 Return-to-r isk ratios
(annualised compound rate of return divided by annualisedvolatility of monthly returns; January 1994-December 2004;monthly data)
-1 0 1 2 3 4
Broad hedge fund indicesMulti-StrategyMarket Neutral strategiesEvent Driven strategiesDirectional strategiesStock indicesBond indices
CSFB/Tremont IndexInvestable
Multi-Strategy Equity Market Neutral
Convertible ArbitrageFixed Income Arbitrage
DistressedEvent Driven (ED)
Risk ArbitrageED Multi-Strategy
Global MacroLong/Short Equity
Managed FuturesEmerging Markets
Dedicated Short BiasS&P 500
MSCI World Equity $DJ EURO Stoxx $
GBI US $GBI Global $GBI Europe $
GBI EMU $
Sources: Datastream, Bloomberg and own calculations.Notes: CSFB/Tremont Index and sub-indices begin inJanuary 1994, except Multi-Strategy, which began in April1994 and Investable, which began in January 2000. GBI EMU$ began in January 1995.
Chart 25 Hedge fund returns and volati l ity
(%; in USD; January 1994-December 2004; monthly data)
Sources: Datastream, Bloomberg and own calculations.Notes: CSFB/Tremont Index and sub-indices begin in January 1994, except Multi-Strategy, which began in April 1994 andInvestable, which began in January 2000. GBI EMU $ began in January 1995.
Long/Short Equity
CSFB/TremontIndex
Investable Multi-Strategy
EquityMarketNeutral
Convertible
FixedIncome
Arbitrage
Event DrivenMulti-Strategy
Distressed
Risk Arbitrage
Event Driven
ManagedFutures
EmergingMarkets
Global Macro
DedicatedShort Bias
DJ EUROStoxx $
S&P 500
GBI Global $GBI US $
GBI EMU $
GBI Europe $
MSCI World Equity $
-4
0
4
8
12
16
0 3 6 9 12 15 18 21
-4
0
4
8
12
16
CSFB/Tremont IndexInvestableMulti-Strategy
annualised standard deviation of monthly returns
annualised compound rate of return
Market Neutral strategiesEvent Driven strategiesDirectional strategies
Stock indicesBond indices
29ECB
Occasional Paper No. 34August 2005
6 F INANC IALSTABIL ITY
IMPL ICAT IONSBox 2
THE LONG-TERM CAPITAL MANAGEMENT (LTCM) EPISODE
The near-default of LTCM in September 1998 and its fall-out on world financial marketsbrought hedge funds to the attention of the global financial community. LTCM was founded inearly 1994 as a Delaware limited liability partnership, and its main fund, Long-Term CapitalPortfolio, was domiciled in the Cayman Islands. Many prominent names from Wall Street andacademia were present among its principals and investors, including Nobel Prize laureateMyron Scholes. At the beginning of 1998, LTCM managed approximately USD 4.8 billion ofassets.
LTCM used sophisticated relative value arbitrage strategies in global fixed income and equityindex markets. These strategies relied heavily on quantitative models and past correlationsbetween financial market variables. LTCM managers were taking market positions on theassumption that liquidity, credit and volatility spreads would narrow from their historicallyhigh levels. For a long time this strategy worked well. A favourable macroeconomicenvironment, the worldwide decline in inflation and a substantial convergence in interest ratesassociated with the prospect of Economic and Monetary Union (EMU) all led to a substantialcompression of nominal yields and risk spreads in the industrial economies. These marketpositions were supported by extremely high leverage, with balance sheet assets being morethan 25 times higher than equity. Notwithstanding its limited disclosure, the fund’s impressivetrack record and reputation of its principals ensured very favourable credit terms, while thelarge trading volume made the fund a very desirable counterparty.
The Russian debt crisis, however, caused global interest rate anomalies, as investors rushedinto a “flight-to-quality” and spreads on riskier debt widened dramatically. Past correlationsbetween financial markets broke down, LTCM investments began to lose value, and the fundwas forced to unwind its positions at very unfavourable prices in order to meet margin calls andsatisfy other liquidity demands. The problems were compounded by the sheer size of the LTCMpositions in certain markets. At the end of August 1998, LTCM had already lost over 50% of itsequity. What started as a pure liquidity crisis could have led to default, but a meltdown wasavoided when the Federal Reserve coordinated a bailout by the consortium of the fund’s 14main bankers. Insolvency would have led to even larger losses to creditors and furtherdisruptions in then already very fragile markets.
Most of the resources provided by prime brokers to LTCM were collateralised and collateralagreements required frequent marking to market. Prime brokers therefore did not see the needto impose tight limits on current credit exposures. The LTCM case, however, highlighted thefact that market participants had failed to account for potential future credit exposures arisingfrom the interaction of the market, market liquidity and credit risks. None of the prime brokerswas aware of the full size and the riskiness of the LTCM portfolio. Advantageous credit termsevaporated quickly under stressed conditions, as creditors changed their stance dramatically,which further magnified the severity of the liquidity shortage.
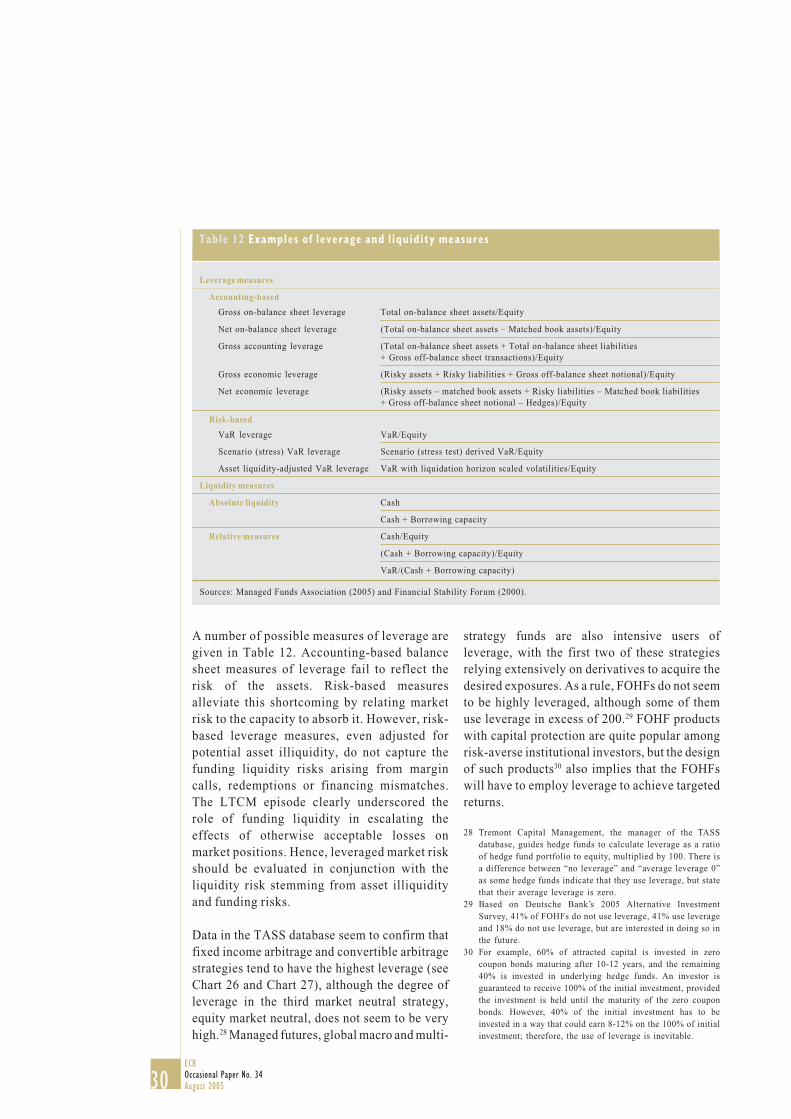
30ECBOccasional Paper No. 34August 2005
A number of possible measures of leverage aregiven in Table 12. Accounting-based balancesheet measures of leverage fail to reflect therisk of the assets. Risk-based measuresalleviate this shortcoming by relating marketrisk to the capacity to absorb it. However, risk-based leverage measures, even adjusted forpotential asset illiquidity, do not capture thefunding liquidity risks arising from margincalls, redemptions or financing mismatches.The LTCM episode clearly underscored therole of funding liquidity in escalating theeffects of otherwise acceptable losses onmarket positions. Hence, leveraged market riskshould be evaluated in conjunction with theliquidity risk stemming from asset illiquidityand funding risks.
Data in the TASS database seem to confirm thatfixed income arbitrage and convertible arbitragestrategies tend to have the highest leverage (seeChart 26 and Chart 27), although the degree ofleverage in the third market neutral strategy,equity market neutral, does not seem to be veryhigh.28 Managed futures, global macro and multi-
Leverage measures
Accounting-based
Gross on-balance sheet leverage Total on-balance sheet assets/Equity
Net on-balance sheet leverage (Total on-balance sheet assets – Matched book assets)/Equity
Gross accounting leverage (Total on-balance sheet assets + Total on-balance sheet liabilities+ Gross off-balance sheet transactions)/Equity
Gross economic leverage (Risky assets + Risky liabilities + Gross off-balance sheet notional)/Equity
Net economic leverage (Risky assets – matched book assets + Risky liabilities – Matched book liabilities+ Gross off-balance sheet notional – Hedges)/Equity
Risk-based
VaR leverage VaR/Equity
Scenario (stress) VaR leverage Scenario (stress test) derived VaR/Equity
Asset liquidity-adjusted VaR leverage VaR with liquidation horizon scaled volatilities/Equity
Liquidity measures
Absolute liquidity Cash
Cash + Borrowing capacity
Relative measures Cash/Equity
(Cash + Borrowing capacity)/Equity
VaR/(Cash + Borrowing capacity)
Table 12 Examples of leverage and l iquidity measures
Sources: Managed Funds Association (2005) and Financial Stability Forum (2000).
strategy funds are also intensive users ofleverage, with the first two of these strategiesrelying extensively on derivatives to acquire thedesired exposures. As a rule, FOHFs do not seemto be highly leveraged, although some of themuse leverage in excess of 200.29 FOHF productswith capital protection are quite popular amongrisk-averse institutional investors, but the designof such products30 also implies that the FOHFswill have to employ leverage to achieve targetedreturns.
28 Tremont Capital Management, the manager of the TASSdatabase, guides hedge funds to calculate leverage as a ratioof hedge fund portfolio to equity, multiplied by 100. There isa difference between “no leverage” and “average leverage 0”as some hedge funds indicate that they use leverage, but statethat their average leverage is zero.
29 Based on Deutsche Bank’s 2005 Alternative InvestmentSurvey, 41% of FOHFs do not use leverage, 41% use leverageand 18% do not use leverage, but are interested in doing so inthe future.
30 For example, 60% of attracted capital is invested in zerocoupon bonds maturing after 10-12 years, and the remaining40% is invested in underlying hedge funds. An investor isguaranteed to receive 100% of the initial investment, providedthe investment is held until the maturity of the zero couponbonds. However, 40% of the initial investment has to beinvested in a way that could earn 8-12% on the 100% of initialinvestment; therefore, the use of leverage is inevitable.
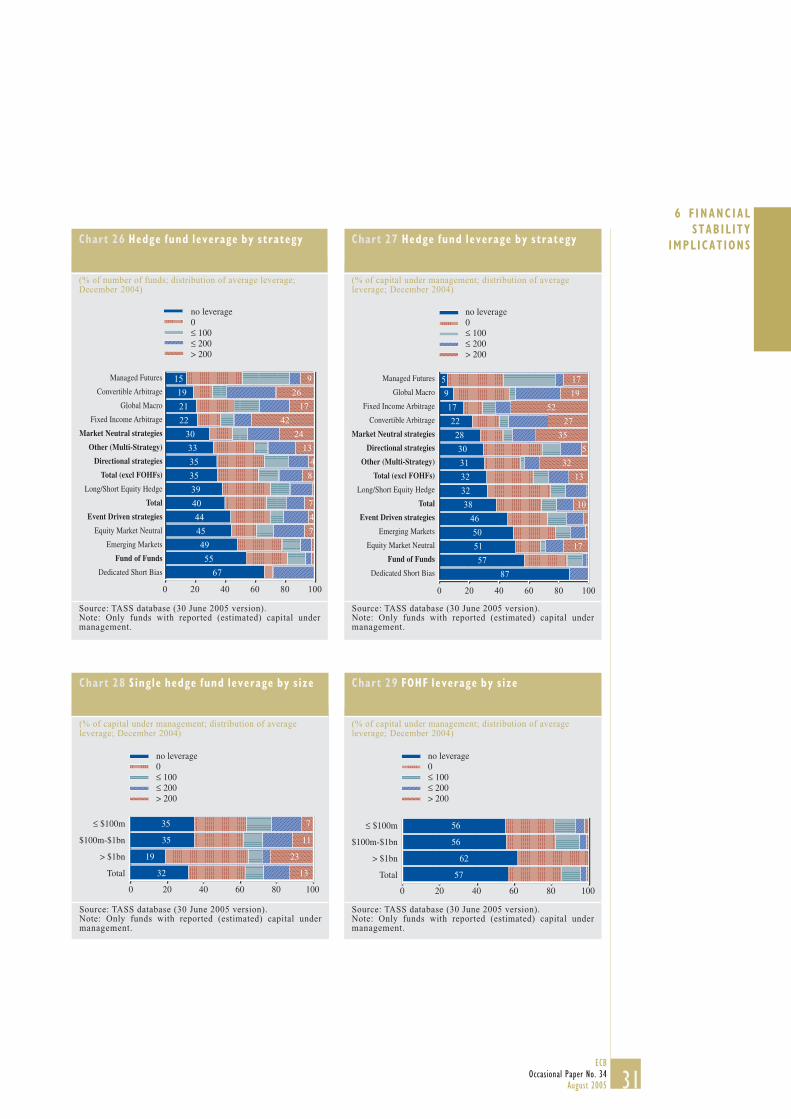
31ECB
Occasional Paper No. 34August 2005
6 F INANC IALSTABIL ITY
IMPL ICAT IONSChart 26 Hedge fund leverage by strategy
(% of number of funds; distribution of average leverage;December 2004)
Source: TASS database (30 June 2005 version).Note: Only funds with reported (estimated) capital undermanagement.
15
19
21
22
30
33
35
35
39
40
44
45
49
55
67
9
26
17
42
24
13
8
7
7
4
4
0 20 40 60 80 100
no leverage0≤ 100≤ 200> 200
Managed Futures
Convertible Arbitrage
Global Macro
Fixed Income Arbitrage
Market Neutral strategies
Other (Multi-Strategy)
Directional strategies
Total (excl FOHFs)
Long/Short Equity Hedge
Total
Event Driven strategies
Equity Market Neutral
Emerging Markets
Fund of Funds
Dedicated Short Bias
Chart 27 Hedge fund leverage by strategy
(% of capital under management; distribution of averageleverage; December 2004)
Source: TASS database (30 June 2005 version).Note: Only funds with reported (estimated) capital undermanagement.
0 20 40 60 80 100
5
9
17
22
28
30
31
32
32
38
46
50
51
57
87
17
19
52
27
35
5
32
13
10
17
no leverage0≤ 100≤ 200> 200
Managed Futures
Global Macro
Fixed Income Arbitrage
Convertible Arbitrage
Market Neutral strategies
Directional strategies
Other (Multi-Strategy)
Total (excl FOHFs)
Long/Short Equity Hedge
Total
Event Driven strategies
Emerging Markets
Equity Market Neutral
Fund of Funds
Dedicated Short Bias
Chart 28 Single hedge fund leverage by s ize
(% of capital under management; distribution of averageleverage; December 2004)
Source: TASS database (30 June 2005 version).Note: Only funds with reported (estimated) capital undermanagement.
200 40 60 80 100
32
7
11
23
13
35
35
19
no leverage0≤ 100≤ 200> 200
≤ $100m
$100m-$1bn
> $1bn
Total
Chart 29 FOHF leverage by s ize
(% of capital under management; distribution of averageleverage; December 2004)
Source: TASS database (30 June 2005 version).Note: Only funds with reported (estimated) capital undermanagement.
no leverage0≤ 100≤ 200> 200
≤ $100m
$100m-$1bn
> $1bn
Total
56
56
100806040200
62
57
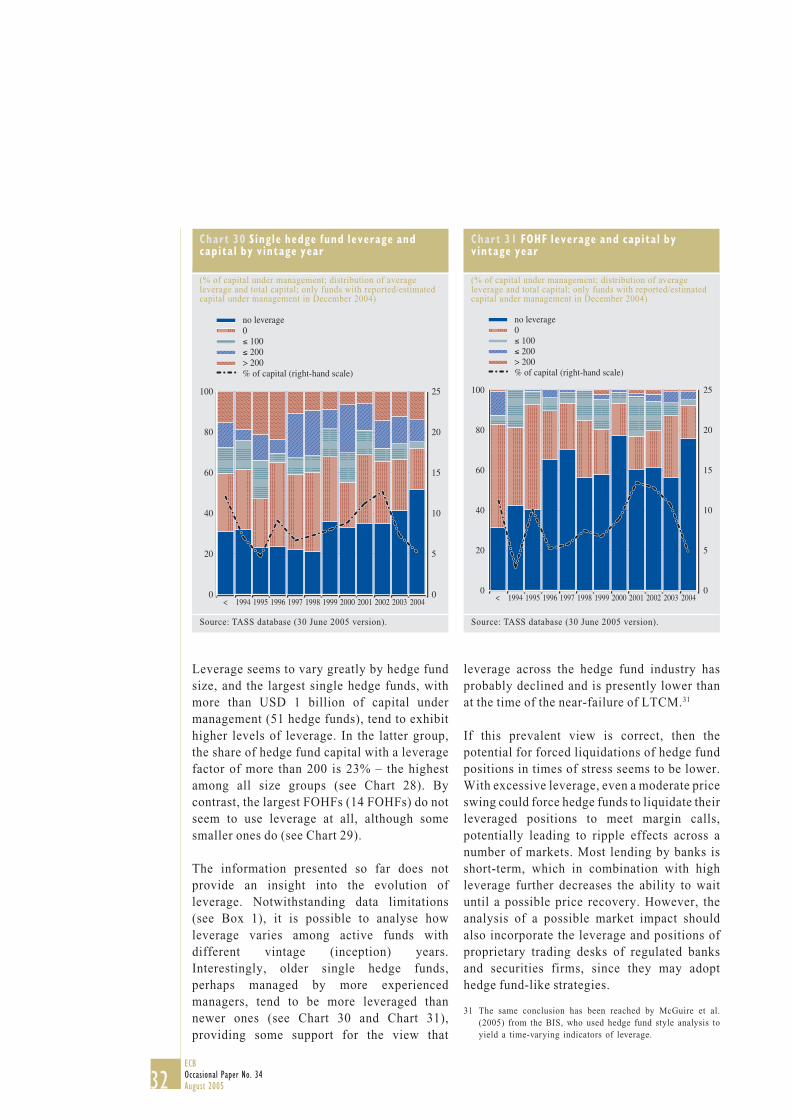
32ECBOccasional Paper No. 34August 2005
Chart 30 Single hedge fund leverage andcapital by vintage year
(% of capital under management; distribution of averageleverage and total capital; only funds with reported/estimatedcapital under management in December 2004)
Source: TASS database (30 June 2005 version).
no leverage0≤ 100≤ 200> 200% of capital (right-hand scale)
0
20
40
60
80
100
0
5
10
15
20
25
< 1994 1995 1996 1997 1998 1999 2000 2001 2002 2003 2004
Chart 31 FOHF leverage and capital byvintage year
(% of capital under management; distribution of averageleverage and total capital; only funds with reported/estimatedcapital under management in December 2004)
Source: TASS database (30 June 2005 version).
no leverage0≤ 100≤ 200> 200% of capital (right-hand scale)
0
20
40
60
80
100
< 1994 1995 1996 1997 1998 1999 2000 2001 2002 2003 20040
5
10
15
20
25
Leverage seems to vary greatly by hedge fundsize, and the largest single hedge funds, withmore than USD 1 billion of capital undermanagement (51 hedge funds), tend to exhibithigher levels of leverage. In the latter group,the share of hedge fund capital with a leveragefactor of more than 200 is 23% – the highestamong all size groups (see Chart 28). Bycontrast, the largest FOHFs (14 FOHFs) do notseem to use leverage at all, although somesmaller ones do (see Chart 29).
The information presented so far does notprovide an insight into the evolution ofleverage. Notwithstanding data limitations(see Box 1), it is possible to analyse howleverage varies among active funds withdifferent vintage (inception) years.Interestingly, older single hedge funds,perhaps managed by more experiencedmanagers, tend to be more leveraged thannewer ones (see Chart 30 and Chart 31),providing some support for the view that
leverage across the hedge fund industry hasprobably declined and is presently lower thanat the time of the near-failure of LTCM.31
If this prevalent view is correct, then thepotential for forced liquidations of hedge fundpositions in times of stress seems to be lower.With excessive leverage, even a moderate priceswing could force hedge funds to liquidate theirleveraged positions to meet margin calls,potentially leading to ripple effects across anumber of markets. Most lending by banks isshort-term, which in combination with highleverage further decreases the ability to waituntil a possible price recovery. However, theanalysis of a possible market impact shouldalso incorporate the leverage and positions ofproprietary trading desks of regulated banksand securities firms, since they may adopthedge fund-like strategies.
31 The same conclusion has been reached by McGuire et al.(2005) from the BIS, who used hedge fund style analysis toyield a time-varying indicators of leverage.
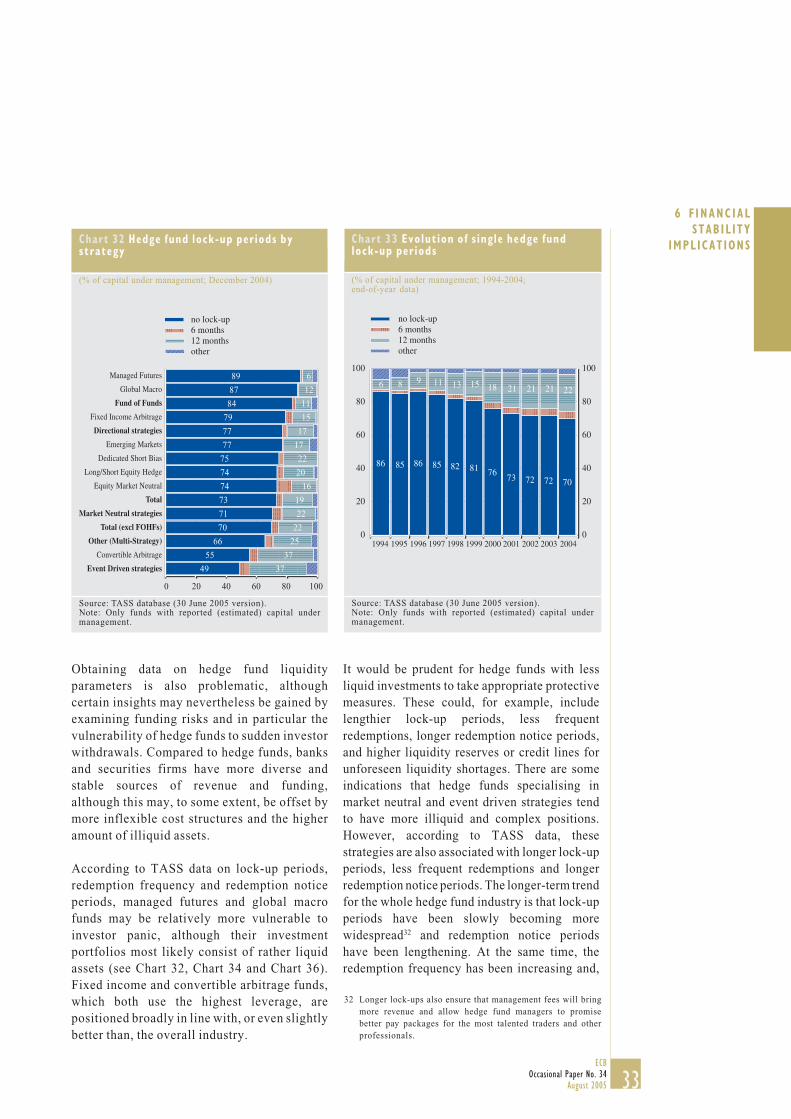
33ECB
Occasional Paper No. 34August 2005
6 F INANC IALSTABIL ITY
IMPL ICAT IONS
Obtaining data on hedge fund liquidityparameters is also problematic, althoughcertain insights may nevertheless be gained byexamining funding risks and in particular thevulnerability of hedge funds to sudden investorwithdrawals. Compared to hedge funds, banksand securities firms have more diverse andstable sources of revenue and funding,although this may, to some extent, be offset bymore inflexible cost structures and the higheramount of illiquid assets.
According to TASS data on lock-up periods,redemption frequency and redemption noticeperiods, managed futures and global macrofunds may be relatively more vulnerable toinvestor panic, although their investmentportfolios most likely consist of rather liquidassets (see Chart 32, Chart 34 and Chart 36).Fixed income and convertible arbitrage funds,which both use the highest leverage, arepositioned broadly in line with, or even slightlybetter than, the overall industry.
It would be prudent for hedge funds with lessliquid investments to take appropriate protectivemeasures. These could, for example, includelengthier lock-up periods, less frequentredemptions, longer redemption notice periods,and higher liquidity reserves or credit lines forunforeseen liquidity shortages. There are someindications that hedge funds specialising inmarket neutral and event driven strategies tendto have more illiquid and complex positions.However, according to TASS data, thesestrategies are also associated with longer lock-upperiods, less frequent redemptions and longerredemption notice periods. The longer-term trendfor the whole hedge fund industry is that lock-upperiods have been slowly becoming morewidespread32 and redemption notice periodshave been lengthening. At the same time, theredemption frequency has been increasing and,
Chart 32 Hedge fund lock-up periods bystrategy
(% of capital under management; December 2004)
Source: TASS database (30 June 2005 version).Note: Only funds with reported (estimated) capital undermanagement.
0 20 40 60 80 100
Managed Futures
Global Macro
Fund of Funds
Fixed Income Arbitrage
Directional strategies
Emerging Markets
Dedicated Short Bias
Long/Short Equity Hedge
Equity Market Neutral
Total
Market Neutral strategies
Total (excl FOHFs)
Other (Multi-Strategy)
Convertible Arbitrage
Event Driven strategies
no lock-up6 months12 monthsother
89
87
84
79
77
77
75
74
74
73
71
70
66
55
49
6
12
11
15
17
17
22
20
16
19
22
22
25
37
37
Chart 33 Evolution of s ingle hedge fundlock-up periods
(% of capital under management; 1994-2004;end-of-year data)
Source: TASS database (30 June 2005 version).Note: Only funds with reported (estimated) capital undermanagement.
no lock-up6 months12 monthsother
86 85 86 85 82 81 7673 72 72 70
6 8 9 11 13 15 18 21 21 21 22
0
20
40
60
80
100
1994 1995 1996 1997 1998 1999 2000 2001 2002 2003 20040
20
40
60
80
100
32 Longer lock-ups also ensure that management fees will bringmore revenue and allow hedge fund managers to promisebetter pay packages for the most talented traders and otherprofessionals.
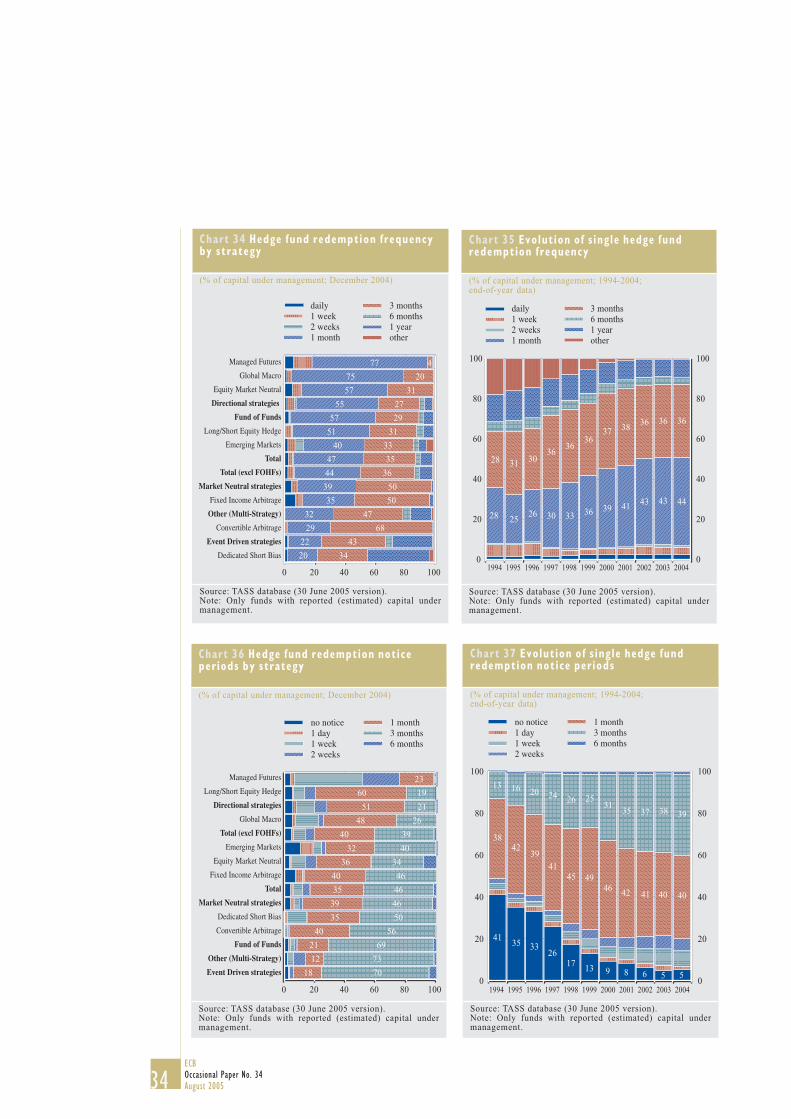
34ECBOccasional Paper No. 34August 2005
Chart 34 Hedge fund redemption frequencyby strategy
(% of capital under management; December 2004)
Source: TASS database (30 June 2005 version).Note: Only funds with reported (estimated) capital undermanagement.
77
75
57
55
57
51
40
47
44
39
35
32
29
22
20
4
20
31
27
29
31
33
35
36
50
50
47
68
43
34
0 20 40 60 80 100
daily1 week2 weeks1 month
3 months6 months1 yearother
Managed Futures
Global Macro
Equity Market Neutral
Directional strategies
Fund of Funds
Long/Short Equity Hedge
Emerging Markets
Total
Total (excl FOHFs)
Market Neutral strategies
Fixed Income Arbitrage
Other (Multi-Strategy)
Convertible Arbitrage
Event Driven strategies
Dedicated Short Bias
Chart 35 Evolution of s ingle hedge fundredemption frequency
(% of capital under management; 1994-2004;end-of-year data)
Source: TASS database (30 June 2005 version).Note: Only funds with reported (estimated) capital undermanagement.
28 2526 30 33 36 39 41 43 43 44
28 31 3036
3636
37 38 36 36 36
0
20
1994 1995 1996 1997 1998 1999 2000 2001 2002 2003 2004
40
60
80
100
0
20
40
60
80
100
daily1 week2 weeks1 month
3 months6 months1 yearother
Chart 36 Hedge fund redemption noticeperiods by strategy
(% of capital under management; December 2004)
Source: TASS database (30 June 2005 version).Note: Only funds with reported (estimated) capital undermanagement.
0 20 40 60 80 100
no notice1 day1 week2 weeks
1 month3 months6 months
Managed Futures
Long/Short Equity Hedge
Directional strategies
Global Macro
Total (excl FOHFs)
Emerging Markets
Equity Market Neutral
Fixed Income Arbitrage
Total
Market Neutral strategies
Dedicated Short Bias
Convertible Arbitrage
Fund of Funds
Other (Multi-Strategy)
Event Driven strategies
23
60
51
48
40
32
36
40
35
39
35
40
21
12
18
1
19
21
26
39
40
34
46
46
46
50
56
69
73
70
Chart 37 Evolution of s ingle hedge fundredemption notice periods
(% of capital under management; 1994-2004;end-of-year data)
Source: TASS database (30 June 2005 version).Note: Only funds with reported (estimated) capital undermanagement.
no notice1 day1 week2 weeks
1 month3 months6 months
4135 33
2617
13 9 8 6 5 5
3842
3941
45 4946 42 41 40 40
13 16 20 24 26 2531
35 37 38 39
01994 1995 1996 1997 1998 1999 2000 2001 2002 2003 2004
20
40
60
80
100
0
20
40
60
80
100
35ECB
Occasional Paper No. 34August 2005
6 F INANC IALSTABIL ITY
IMPL ICAT IONSin particular, monthly and quarterly redemptionfrequencies are becoming an industry standard,though in combination with longer three monthredemption notice periods (see Chart 33, Chart35 and Chart 37, which assume that hedge funds’redemption profiles, as indicated in the TASSdatabase, have been the same throughout theirentire operating history).
Redemption notice periods can effectively helpto lock investors’ money until the secondclosest redemption if the investor misses thedeadline in applying for the closestredemption. However, certain hedge funds alsooffer investors the opportunity to exit at shortnotice with a certain penalty (the so-called“gate” fee).
Market risk, leverage and liquidity risk mayinteract among each other, so a vulnerabilityanalysis should ideally seek to identifypossible combinations and concentrations ofhigh volatility, high leverage, higher fundingrisks and larger hedge fund size. Forillustration, a comparison of volatilities ofhedge fund, stock and bond market returns ispresented in Chart 38. It is, however, based onmonthly returns and may not represent the trueriskiness of hedge fund portfolios.
There are concerns that prolonged periods ofmediocre performance may encourage hedgefund managers to employ greater leverage ormore aggressive strategies. Capital could flowout following poor performance, so that hedgefunds would be forced to liquidate positions.This could lead to a market-wide disinvestmentspiral, potentially resulting in systemic risk.
A number of mitigating factors are, however,also at play. Institutional investors and FOHFs,which already account for half of the capitalmanaged by hedge funds, should now have abetter understanding of hedge fund operations.Hence, they may be more patient whenconfronted with temporary underperformance.Moreover, lengthy lock-up periods and lessfrequent redemption schedules could providemore time for hedge funds to recoup past
shortfalls and settle their liabilities. However,the proliferation of FOHFs, which generallyprovide the possibility of monthly redemption,could mean that more flexible redemptionprofiles may be demanded from the underlyinghedge funds. Some of the institutionalinvestors that only recently started investing inhedge funds may also be less willing to acceptlower liquidity of their allocations to hedgefunds.33 Thus, the hedge fund industry may risklosing one of its defensive features, i.e. lengthylock-up periods and infrequent redemptionpossibilities.
6.2.2 THROUGH IMPACT ON CREDITINSTITUTIONS
a. Direct risksDirect credit exposures of credit institutionsand securities firms (prime brokers) to hedgefunds are the most obvious channel wherebyhedge funds could affect the robustness of thefinancial system. Prime brokers provideleverage, issue credit lines and have tradingexposures to hedge funds in OTC and othermarkets. As credit institutions are key lendersto hedge funds, one could argue that thesystemic risk posed by hedge funds could belowered through prudent risk management. Inaddition to credit and trading exposures, othertypes of direct exposures include income flowderived from prime brokerage and other hedgefund-related services and direct market riskexposure, as banks invest their own money intohedge funds as well.
Little information on direct exposures isavailable to evaluate the impact of hedge fundson prime brokers. Publicly availableinformation provided by prime brokers is verylimited, although improved disclosure byfinancial institutions with regard to their
33 According to Deutsche Bank’s 2005 Alternative InvestmentSurvey, around 80% of FOHFs and banks, consultants,corporations and insurance companies stated that, for them,maximum preferred lock-up periods were one year or less.Family off ices/high net worth individuals, pension funds,endowments and foundations were slightly more willing toaccept longer lock-up periods.
36ECBOccasional Paper No. 34August 2005
dealings with hedge funds was one of the mostimportant recommendations after the LTCMcrisis.34 Better transparency was and still isseen as one of the main instruments to makemarket discipline effective and for preventingfuture systemic disruptions.
A very rough indication of banks’ directexposures towards hedge funds can be obtainedby examining Bank for InternationalSettlements (BIS) data on consolidated bankclaims on private non-bank borrowers inoffshore centres (see Chart 39).35 Theseexposures have been growing approximately inline with the growth of the hedge fund industry.At the end of 2004, the exposures of EU15banks to non-banks in offshore centresconstituted half of all reporting banks’exposures to non-bank borrowers in offshorefinancial centres and about 70% of total EU15banks’ exposures to offshore financial centres.
In addition to the BIS data, certain informationon prime broker exposures to hedge funds canbe obtained from commercial hedge funddatabases that provide information on primebrokers selected by hedge funds. Table 13 andTable 14 analyse the market shares andexposures of the largest prime brokers based onthe TASS database (around two-thirds of hedgefunds provide information on their primebrokers). These tables give some guidance as tothe magnitude, concentration and risk ofexposures to hedge funds by selected primebrokers, and could be used by supervisors as astarting point for the closer examination ofprime brokers’ relations with hedge funds.Some prime brokers seem to be moreconcentrated in a few hedge fund strategies andmay therefore be more vulnerable todisruptions in certain markets.
The prime brokerage business is itself highlyconcentrated. Two firms, Morgan Stanley andGoldman Sachs, control more than 40% of totalEuropean and global hedge fund clients’capital under management (see Chart 40). Theestimated global market share of Bear Stearns,the third largest prime broker, is in excess of
10%, although the firm’s market share appearsto be substantially lower if only Europeanhedge funds are considered. Other primebrokers in the European top 10, which includestwo Swiss banks and at least two EU banks,clearly lag behind the leaders. However, tightcompetition in 2004 led to a reduction in themarket shares of the largest prime brokers.
Some of the largest prime brokers, primarilythe US ones, have become very dependent onthe income stream from prime brokerageservices to hedge funds. In some cases, suchincome is reported as making up more than aquarter of their trading and commission incomeor an eighth of total revenue. Many banks havealso increased their own trading activities, asevidenced by the higher VaR numbers reportedrecently. The appetite to take on more risk isprobably related to the less volatile marketconditions and the insufficient growth of othertraditional income sources.
Strong competition for hedge fund businesssometimes results in a situation where the primebrokers have to provide seed capital for a hedgefund and its management firm in order to establisha prime brokerage relationship. However, suchinvestments can also improve the prime broker’sown profitability via higher returns and lucrativehedge fund management fees.
Furthermore, there are some signs that tightcompetition has an impact on the terms of bankcredit to hedge funds. Credit has become moreavailable and hedge funds can negotiate betteraccess to credit, both for their regular businessand for unexpected liquidity shortages. Hedgefunds have also managed to achieve morefavourable collateral terms for their tradingbusiness, as there are indications that banksmore often trade with hedge funds on a variationmargin only, i.e. without requiring an initialmargin. Moreover, established prime brokers
34 US President’s Working Group on Financial Markets (1999).35 However, this estimation is subject to reservations owing to
the fact that claims on non-banks may comprise substantialclaims on special purpose vehicles and other non-hedge fundentities domiciled offshore.
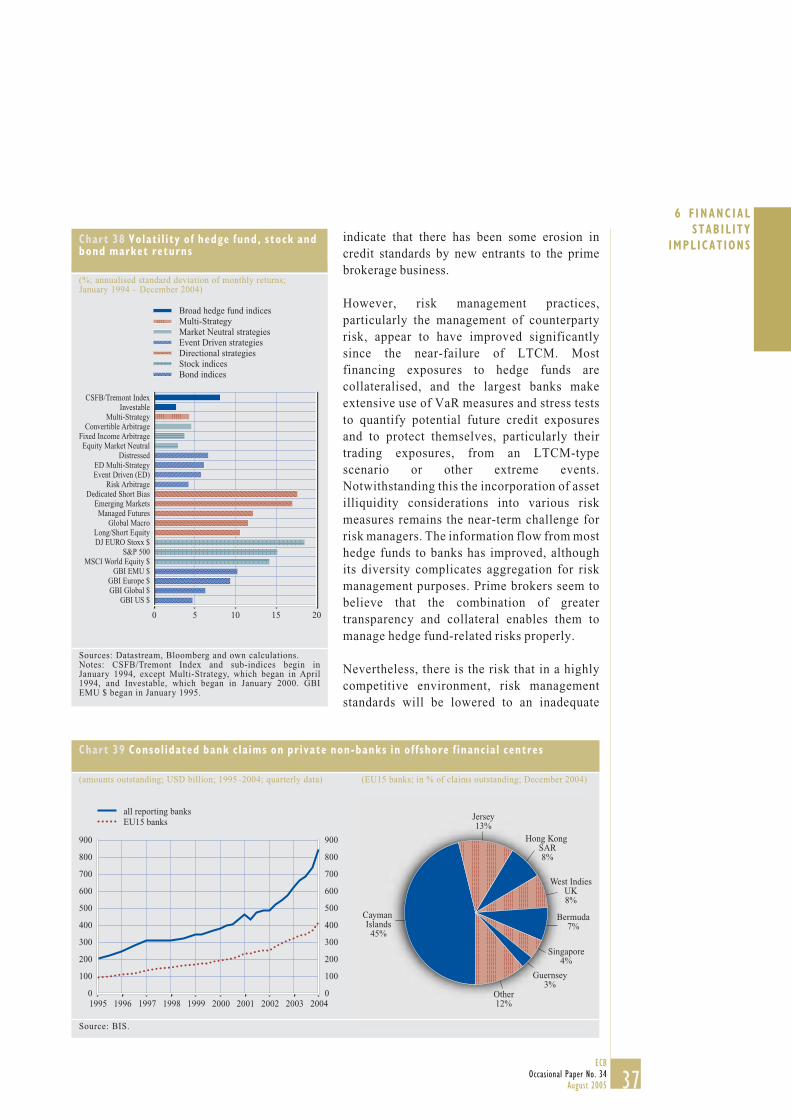
37ECB
Occasional Paper No. 34August 2005
6 F INANC IALSTABIL ITY
IMPL ICAT IONSChart 38 Volati l ity of hedge fund, stock andbond market returns
(%; annualised standard deviation of monthly returns;January 1994 – December 2004)
Sources: Datastream, Bloomberg and own calculations.Notes: CSFB/Tremont Index and sub-indices begin inJanuary 1994, except Multi-Strategy, which began in April1994, and Investable, which began in January 2000. GBIEMU $ began in January 1995.
0 5 10 15 20
CSFB/Tremont IndexInvestable
Multi-StrategyConvertible Arbitrage
Fixed Income ArbitrageEquity Market Neutral
DistressedED Multi-StrategyEvent Driven (ED)
Risk ArbitrageDedicated Short Bias
Emerging MarketsManaged Futures
Global MacroLong/Short EquityDJ EURO Stoxx $
S&P 500MSCI World Equity $
GBI EMU $GBI Europe $GBI Global $
GBI US $
Broad hedge fund indicesMulti-StrategyMarket Neutral strategiesEvent Driven strategiesDirectional strategiesStock indicesBond indices
indicate that there has been some erosion incredit standards by new entrants to the primebrokerage business.
However, risk management practices,particularly the management of counterpartyrisk, appear to have improved significantlysince the near-failure of LTCM. Mostfinancing exposures to hedge funds arecollateralised, and the largest banks makeextensive use of VaR measures and stress teststo quantify potential future credit exposuresand to protect themselves, particularly theirtrading exposures, from an LTCM-typescenario or other extreme events.Notwithstanding this the incorporation of assetilliquidity considerations into various riskmeasures remains the near-term challenge forrisk managers. The information flow from mosthedge funds to banks has improved, althoughits diversity complicates aggregation for riskmanagement purposes. Prime brokers seem tobelieve that the combination of greatertransparency and collateral enables them tomanage hedge fund-related risks properly.
Nevertheless, there is the risk that in a highlycompetitive environment, risk managementstandards will be lowered to an inadequate
Chart 39 Consol idated bank cla ims on private non-banks in of fshore f inancial centres
(amounts outstanding; USD billion; 1995–2004; quarterly data) (EU15 banks; in % of claims outstanding; December 2004)
all reporting banksEU15 banks
0
100
200
300
400
500
600
700
800
900
1995 1996 1997 1998 1999 2000 2001 2002 2003 20040
100
200
300
400
500
600
700
800
900
Cayman Islands
45%
Jersey13%
Hong Kong SAR8%
West IndiesUK8%
Bermuda7%
Singapore4%
Guernsey3%
Other12%
Source: BIS.

38ECBOccasional Paper No. 34August 2005
Table 13 Concentrat ions and exposures o f se l ected pr ime brokers by the number o f hedge funds
(number of hedge funds; December 2004)
Selected prime brokers (sorted by total capital under management of hedge funds)
groupsub sub sub sub sub
groupsub
groupsub sub sub
Long/Short
Equity Hedge
Directional strategies
Dedicated Short
BiasGlobal Macro
Emerging Markets
Managed Futures
EventDriven
strategies
Market Neutral
strategies
Fixed Income
ArbitrageConvertible
Arbitrage
Equity Market Neutral
Morgan Stanley 287 245 1 7 19 15 27 59 3 25 31
Bear Stearns 112 75 6 12 11 8 80 85 30 35 20
Goldman Sachs 230 197 3 19 5 6 40 53 3 21 29
Citigroup 20 5 5 8 2 12 32 28 1 3
ABN AMRO 48 37 2 1 7 1 18 2 2
Lehman Brothers 30 23 6 1 4 20 5 7 8
Merrill Lynch 18 14 2 2 3 10 4 1 5
Deutsche Bank 31 23 3 2 3 11 21 1 8 12
UBS 69 52 6 6 5 10 15 3 1 11
Banc of America 105 102 2 1 3 10 10
MAN Group 36 5 31 1 1 1
Crédit Agricole 27 1 7 19 2 1 1
CSFB 31 21 3 7 1 14 9 3 2
JPMorgan Chase 7 2 5 1 1
Refco 19 1 1 17 3 3
Barclays 6 3 3
SEB 4 3 1
Banque Populaire 3 3 2
HSBC
NCB 1 1 2 2
KBC 1 1
AIG 4 2 1 1 1 1
Bank of Ireland 3 1 1 1
Société Générale 26 2 1 23 2 2
ING 9 8 1 5
All selected prime brokers 1,120 817 14 80 69 140 217 340 98 103 139
Others (including undisclosed) 414 192 4 51 84 83 69 112 51 21 40
Total number of hedge funds in the database 1,534 1,009 18 131 153 223 286 452 149 124 179
Selected EU prime brokers, % 12 8 11 14 7 35 13 8 4 7 11
Selected US prime brokers, % 54 66 67 40 29 26 59 61 52 73 59
CR1 of selected prime brokers, % 19 24 33 15 20 14 28 19 20 28 17
CR3 of selected prime brokers, % 41 54 61 29 40 33 51 44 47 65 45
Volatility, % 1) - 10.6 17.7 11.6 17.0 12.2 5.8 - 3.8 4.7 3.0
Sources: TASS database (30 June 2005 version) and own calculations.Notes: Only funds with reported (estimated) capital under management. If several prime brokers were provided by a hedge fund, then only the f irst indicated prime broker was used.CR1 – the share (concentration ratio) of the largest prime broker or sub-strategy.CR3 – the share (concentration ratio) of the three largest prime brokers or sub-strategies. 1) CSFB/Tremont Hedge Fund Index and sub-indices, annualised standard deviation of monthly returns, January 1994–December 2004.

39ECB
Occasional Paper No. 34August 2005
6 F INANC IALSTABIL ITY
IMPL ICAT IONS
groupsub
groupsub sub sub
Distribution of leverage Distribution of size
average leverage maximum leverage
% % % % % % % % % % % % % %
OtherFund of
FundsTotal
number
CR1 of sub-
strategies
CR3 of sub-
strategies
Do not use
leverage 0 ≤ 100 100-200 > 200 0 ≤ 100 100-200 > 200 ≤ $100m$100m - $1bn > $1bn
15 10 398 62 76 30 37 11 16 5 24 12 19 15 64 34 2
16 6 299 27 64 31 22 16 19 11 19 15 16 19 67 29 4
12 6 341 58 78 35 27 11 22 5 18 10 23 13 63 35 2
5 69 41 70 32 22 7 7 32 17 7 7 36 67 29 4
4 72 51 86 32 31 17 21 22 15 28 3 64 35 1
6 60 38 63 37 20 7 15 22 22 8 5 28 57 42 2
4 4 39 36 59 15 28 26 18 13 26 5 36 18 59 31 10
1 3 67 34 69 37 25 16 18 3 19 12 16 15 63 37
4 98 53 74 28 40 12 15 5 22 12 20 17 80 19 1
6 4 128 80 92 41 24 13 18 3 15 14 24 5 83 17
1 15 54 57 94 17 33 39 6 6 35 30 6 13 72 26 2
5 34 56 91 12 24 50 6 9 18 56 15 56 38 6
4 3 53 40 70 36 25 8 21 11 21 4 17 23 72 28
3 11 45 91 73 9 18 9 18 55 36 9
1 4 27 63 89 4 19 41 15 22 19 44 11 22 89 11
1 7 43 100 29 14 43 14 29 14 29 29 29 71
4 75 100 75 25 25 25 50 75 25
2 7 43 100 43 57 29 29 43 57
1 14 15 93 100 13 87 60 27 67 33
4 7 57 100 86 14 14 29 71
5 6 83 100 17 17 67 17 67 33 67
5 40 80 20 40 40 20 20 60 80 20
7 10 70 90 60 30 10 30 10 60 40
5 4 37 62 86 5 38 38 11 8 35 27 14 19 97 3
14 57 100 29 29 36 7 14 43 14 79 21
77 108 1,862 44 63 31 29 15 17 8 21 14 18 16 67 31 2
39 768 1,402 55 74 53 25 10 6 5 19 11 8 8 68 31 2
116 876 3,264 31 67 40 28 13 12 7 20 13 14 13 67 31 2
8 7 10 24 66 24 33 26 13 4 27 25 13 11 66 32 2
52 5 42 48 68 32 28 13 18 9 20 12 19 17 66 31 3
14 20 12 - - - - - - - - - - - - - -
37 23 32 - - - - - - - - - - - - - -
4.4 - 8.1 - - - - - - - - - - - - - -
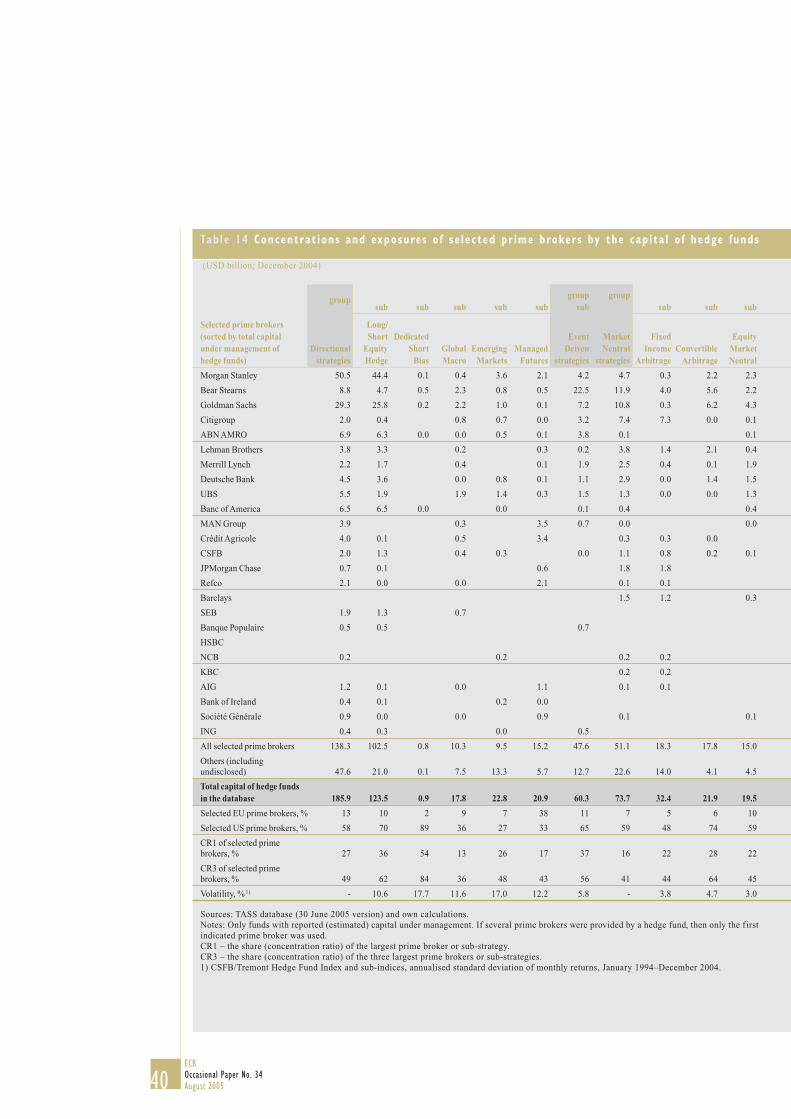
40ECBOccasional Paper No. 34August 2005
Table 14 Concentrat ions and exposures o f se l ected pr ime brokers by the cap i ta l o f hedge funds
(USD billion; December 2004)
Selected prime brokers (sorted by total capital under management of hedge funds)
groupsub sub sub sub sub
groupsub
groupsub sub sub
Long/Short
Equity Hedge
Directional strategies
Dedicated Short
BiasGlobal Macro
Emerging Markets
Managed Futures
EventDriven
strategies
Market Neutral
strategies
Fixed Income
ArbitrageConvertible
Arbitrage
Equity Market Neutral
Morgan Stanley 50.5 44.4 0.1 0.4 3.6 2.1 4.2 4.7 0.3 2.2 2.3
Bear Stearns 8.8 4.7 0.5 2.3 0.8 0.5 22.5 11.9 4.0 5.6 2.2
Goldman Sachs 29.3 25.8 0.2 2.2 1.0 0.1 7.2 10.8 0.3 6.2 4.3
Citigroup 2.0 0.4 0.8 0.7 0.0 3.2 7.4 7.3 0.0 0.1
ABN AMRO 6.9 6.3 0.0 0.0 0.5 0.1 3.8 0.1 0.1
Lehman Brothers 3.8 3.3 0.2 0.3 0.2 3.8 1.4 2.1 0.4
Merrill Lynch 2.2 1.7 0.4 0.1 1.9 2.5 0.4 0.1 1.9
Deutsche Bank 4.5 3.6 0.0 0.8 0.1 1.1 2.9 0.0 1.4 1.5
UBS 5.5 1.9 1.9 1.4 0.3 1.5 1.3 0.0 0.0 1.3
Banc of America 6.5 6.5 0.0 0.0 0.1 0.4 0.4
MAN Group 3.9 0.3 3.5 0.7 0.0 0.0
Crédit Agricole 4.0 0.1 0.5 3.4 0.3 0.3 0.0
CSFB 2.0 1.3 0.4 0.3 0.0 1.1 0.8 0.2 0.1
JPMorgan Chase 0.7 0.1 0.6 1.8 1.8
Refco 2.1 0.0 0.0 2.1 0.1 0.1
Barclays 1.5 1.2 0.3
SEB 1.9 1.3 0.7
Banque Populaire 0.5 0.5 0.7
HSBC
NCB 0.2 0.2 0.2 0.2
KBC 0.2 0.2
AIG 1.2 0.1 0.0 1.1 0.1 0.1
Bank of Ireland 0.4 0.1 0.2 0.0
Société Générale 0.9 0.0 0.0 0.9 0.1 0.1
ING 0.4 0.3 0.0 0.5
All selected prime brokers 138.3 102.5 0.8 10.3 9.5 15.2 47.6 51.1 18.3 17.8 15.0
Others (including undisclosed) 47.6 21.0 0.1 7.5 13.3 5.7 12.7 22.6 14.0 4.1 4.5
Total capital of hedge funds in the database 185.9 123.5 0.9 17.8 22.8 20.9 60.3 73.7 32.4 21.9 19.5
Selected EU prime brokers, % 13 10 2 9 7 38 11 7 5 6 10
Selected US prime brokers, % 58 70 89 36 27 33 65 59 48 74 59
CR1 of selected prime brokers, % 27 36 54 13 26 17 37 16 22 28 22
CR3 of selected prime brokers, % 49 62 84 36 48 43 56 41 44 64 45
Volatility, % 1) - 10.6 17.7 11.6 17.0 12.2 5.8 - 3.8 4.7 3.0
Sources: TASS database (30 June 2005 version) and own calculations.Notes: Only funds with reported (estimated) capital under management. If several prime brokers were provided by a hedge fund, then only the f irst indicated prime broker was used.CR1 – the share (concentration ratio) of the largest prime broker or sub-strategy.CR3 – the share (concentration ratio) of the three largest prime brokers or sub-strategies. 1) CSFB/Tremont Hedge Fund Index and sub-indices, annualised standard deviation of monthly returns, January 1994–December 2004.
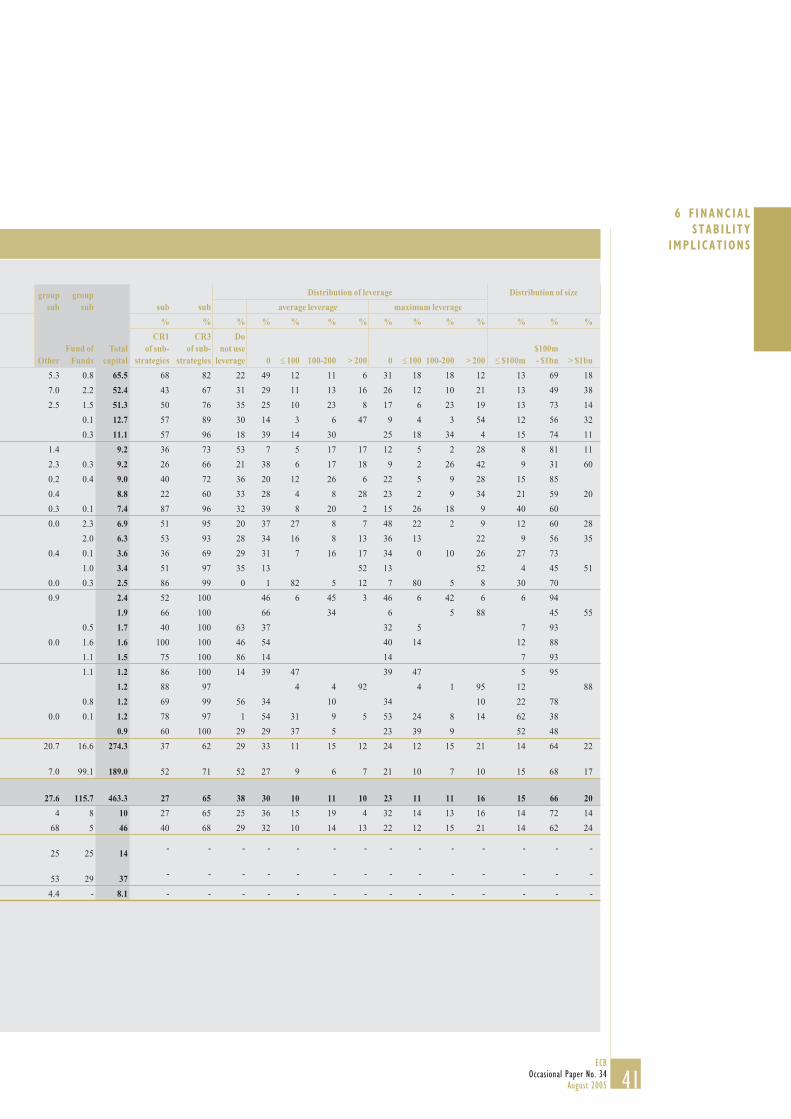
41ECB
Occasional Paper No. 34August 2005
6 F INANC IALSTABIL ITY
IMPL ICAT IONS
groupsub
groupsub sub sub
Distribution of leverage Distribution of size
average leverage maximum leverage
% % % % % % % % % % % % % %
OtherFund of
FundsTotal
capital
CR1 of sub-
strategies
CR3 of sub-
strategies
Do not use
leverage 0 ≤ 100 100-200 > 200 0 ≤ 100 100-200 > 200 ≤ $100m$100m - $1bn > $1bn
5.3 0.8 65.5 68 82 22 49 12 11 6 31 18 18 12 13 69 18
7.0 2.2 52.4 43 67 31 29 11 13 16 26 12 10 21 13 49 38
2.5 1.5 51.3 50 76 35 25 10 23 8 17 6 23 19 13 73 14
0.1 12.7 57 89 30 14 3 6 47 9 4 3 54 12 56 32
0.3 11.1 57 96 18 39 14 30 25 18 34 4 15 74 11
1.4 9.2 36 73 53 7 5 17 17 12 5 2 28 8 81 11
2.3 0.3 9.2 26 66 21 38 6 17 18 9 2 26 42 9 31 60
0.2 0.4 9.0 40 72 36 20 12 26 6 22 5 9 28 15 85
0.4 8.8 22 60 33 28 4 8 28 23 2 9 34 21 59 20
0.3 0.1 7.4 87 96 32 39 8 20 2 15 26 18 9 40 60
0.0 2.3 6.9 51 95 20 37 27 8 7 48 22 2 9 12 60 28
2.0 6.3 53 93 28 34 16 8 13 36 13 22 9 56 35
0.4 0.1 3.6 36 69 29 31 7 16 17 34 0 10 26 27 73
1.0 3.4 51 97 35 13 52 13 52 4 45 51
0.0 0.3 2.5 86 99 0 1 82 5 12 7 80 5 8 30 70
0.9 2.4 52 100 46 6 45 3 46 6 42 6 6 94
1.9 66 100 66 34 6 5 88 45 55
0.5 1.7 40 100 63 37 32 5 7 93
0.0 1.6 1.6 100 100 46 54 40 14 12 88
1.1 1.5 75 100 86 14 14 7 93
1.1 1.2 86 100 14 39 47 39 47 5 95
1.2 88 97 4 4 92 4 1 95 12 88
0.8 1.2 69 99 56 34 10 34 10 22 78
0.0 0.1 1.2 78 97 1 54 31 9 5 53 24 8 14 62 38
0.9 60 100 29 29 37 5 23 39 9 52 48
20.7 16.6 274.3 37 62 29 33 11 15 12 24 12 15 21 14 64 22
7.0 99.1 189.0 52 71 52 27 9 6 7 21 10 7 10 15 68 17
27.6 115.7 463.3 27 65 38 30 10 11 10 23 11 11 16 15 66 20
4 8 10 27 65 25 36 15 19 4 32 14 13 16 14 72 14
68 5 46 40 68 29 32 10 14 13 22 12 15 21 14 62 24
25 25 14- - - - - - - - - - - - - -
53 29 37- - - - - - - - - - - - - -
4.4 - 8.1 - - - - - - - - - - - - - -
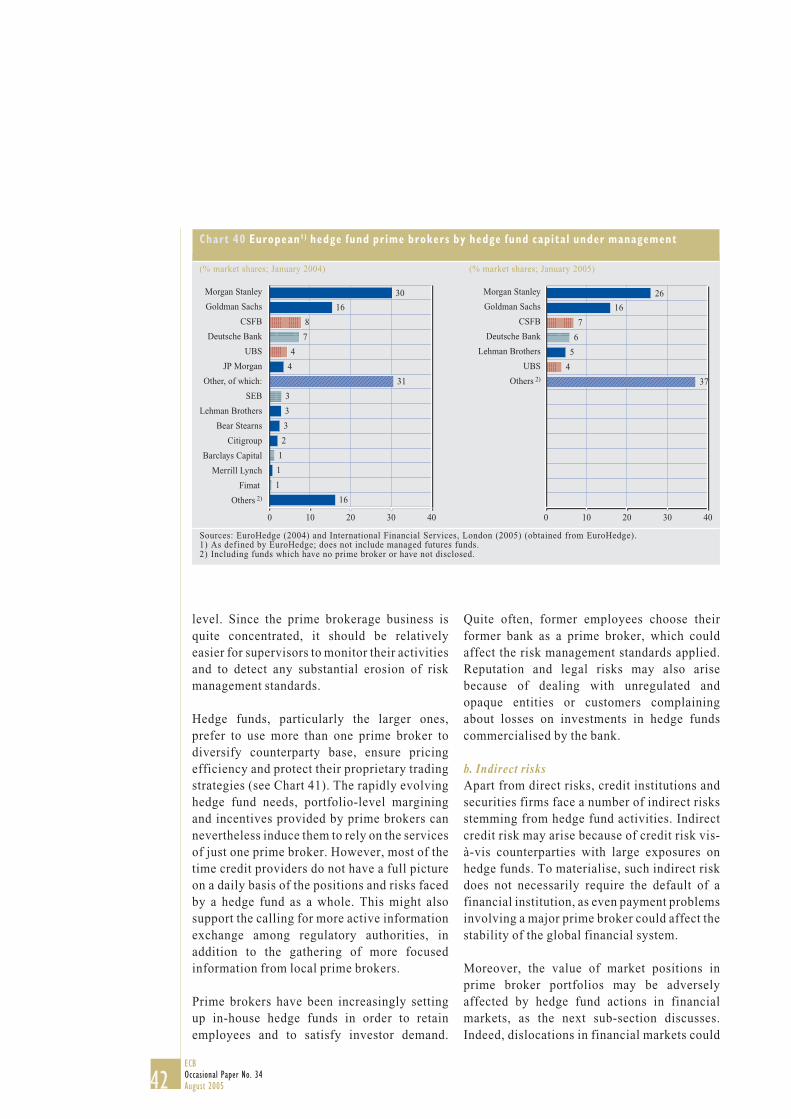
42ECBOccasional Paper No. 34August 2005
level. Since the prime brokerage business isquite concentrated, it should be relativelyeasier for supervisors to monitor their activitiesand to detect any substantial erosion of riskmanagement standards.
Hedge funds, particularly the larger ones,prefer to use more than one prime broker todiversify counterparty base, ensure pricingefficiency and protect their proprietary tradingstrategies (see Chart 41). The rapidly evolvinghedge fund needs, portfolio-level marginingand incentives provided by prime brokers cannevertheless induce them to rely on the servicesof just one prime broker. However, most of thetime credit providers do not have a full pictureon a daily basis of the positions and risks facedby a hedge fund as a whole. This might alsosupport the calling for more active informationexchange among regulatory authorities, inaddition to the gathering of more focusedinformation from local prime brokers.
Prime brokers have been increasingly settingup in-house hedge funds in order to retainemployees and to satisfy investor demand.
Quite often, former employees choose theirformer bank as a prime broker, which couldaffect the risk management standards applied.Reputation and legal risks may also arisebecause of dealing with unregulated andopaque entities or customers complainingabout losses on investments in hedge fundscommercialised by the bank.
b. Indirect risksApart from direct risks, credit institutions andsecurities firms face a number of indirect risksstemming from hedge fund activities. Indirectcredit risk may arise because of credit risk vis-à-vis counterparties with large exposures onhedge funds. To materialise, such indirect riskdoes not necessarily require the default of afinancial institution, as even payment problemsinvolving a major prime broker could affect thestability of the global financial system.
Moreover, the value of market positions inprime broker portfolios may be adverselyaffected by hedge fund actions in financialmarkets, as the next sub-section discusses.Indeed, dislocations in financial markets could
Chart 40 European1) hedge fund prime brokers by hedge fund capital under management
(% market shares; January 2004) (% market shares; January 2005)
Sources: EuroHedge (2004) and International Financial Services, London (2005) (obtained from EuroHedge).1) As def ined by EuroHedge; does not include managed futures funds.2) Including funds which have no prime broker or have not disclosed.
30
16
8
7
4
4
31
3
3
3
2
1
1
1
16
0 10 20 30 400 10 20 30 40
26
16
7
6
5
4
Morgan Stanley
Goldman Sachs
CSFB
Deutsche Bank
UBS
JP Morgan
Other, of which:
SEB
Lehman Brothers
Bear Stearns
Citigroup
Barclays Capital
Merrill Lynch
Fimat
Others 2)
Morgan Stanley
Goldman Sachs
CSFB
Deutsche Bank
Lehman Brothers
UBS
Others 2) 37
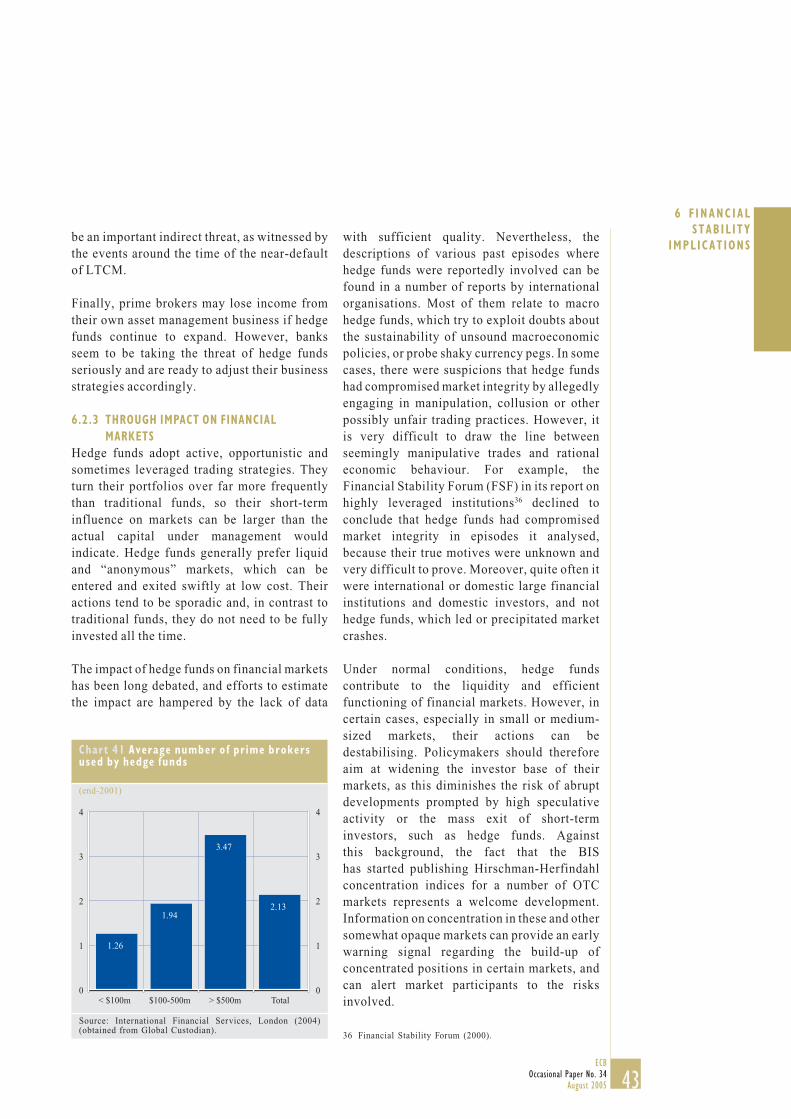
43ECB
Occasional Paper No. 34August 2005
6 F INANC IALSTABIL ITY
IMPL ICAT IONSbe an important indirect threat, as witnessed bythe events around the time of the near-defaultof LTCM.
Finally, prime brokers may lose income fromtheir own asset management business if hedgefunds continue to expand. However, banksseem to be taking the threat of hedge fundsseriously and are ready to adjust their businessstrategies accordingly.
6.2.3 THROUGH IMPACT ON FINANCIALMARKETS
Hedge funds adopt active, opportunistic andsometimes leveraged trading strategies. Theyturn their portfolios over far more frequentlythan traditional funds, so their short-terminfluence on markets can be larger than theactual capital under management wouldindicate. Hedge funds generally prefer liquidand “anonymous” markets, which can beentered and exited swiftly at low cost. Theiractions tend to be sporadic and, in contrast totraditional funds, they do not need to be fullyinvested all the time.
The impact of hedge funds on financial marketshas been long debated, and efforts to estimatethe impact are hampered by the lack of data
Chart 41 Average number of prime brokersused by hedge funds
(end-2001)
Source: International Financial Services, London (2004)(obtained from Global Custodian).
with sufficient quality. Nevertheless, thedescriptions of various past episodes wherehedge funds were reportedly involved can befound in a number of reports by internationalorganisations. Most of them relate to macrohedge funds, which try to exploit doubts aboutthe sustainability of unsound macroeconomicpolicies, or probe shaky currency pegs. In somecases, there were suspicions that hedge fundshad compromised market integrity by allegedlyengaging in manipulation, collusion or otherpossibly unfair trading practices. However, itis very difficult to draw the line betweenseemingly manipulative trades and rationaleconomic behaviour. For example, theFinancial Stability Forum (FSF) in its report onhighly leveraged institutions36 declined toconclude that hedge funds had compromisedmarket integrity in episodes it analysed,because their true motives were unknown andvery difficult to prove. Moreover, quite often itwere international or domestic large financialinstitutions and domestic investors, and nothedge funds, which led or precipitated marketcrashes.
Under normal conditions, hedge fundscontribute to the liquidity and efficientfunctioning of financial markets. However, incertain cases, especially in small or medium-sized markets, their actions can bedestabilising. Policymakers should thereforeaim at widening the investor base of theirmarkets, as this diminishes the risk of abruptdevelopments prompted by high speculativeactivity or the mass exit of short-terminvestors, such as hedge funds. Againstthis background, the fact that the BIShas started publishing Hirschman-Herfindahlconcentration indices for a number of OTCmarkets represents a welcome development.Information on concentration in these and othersomewhat opaque markets can provide an earlywarning signal regarding the build-up ofconcentrated positions in certain markets, andcan alert market participants to the risksinvolved.
1.26
1.94
3.47
2.13
< $100m0
1
2
3
4
0
1
2
3
4
$100-500m > $500m Total
36 Financial Stability Forum (2000).
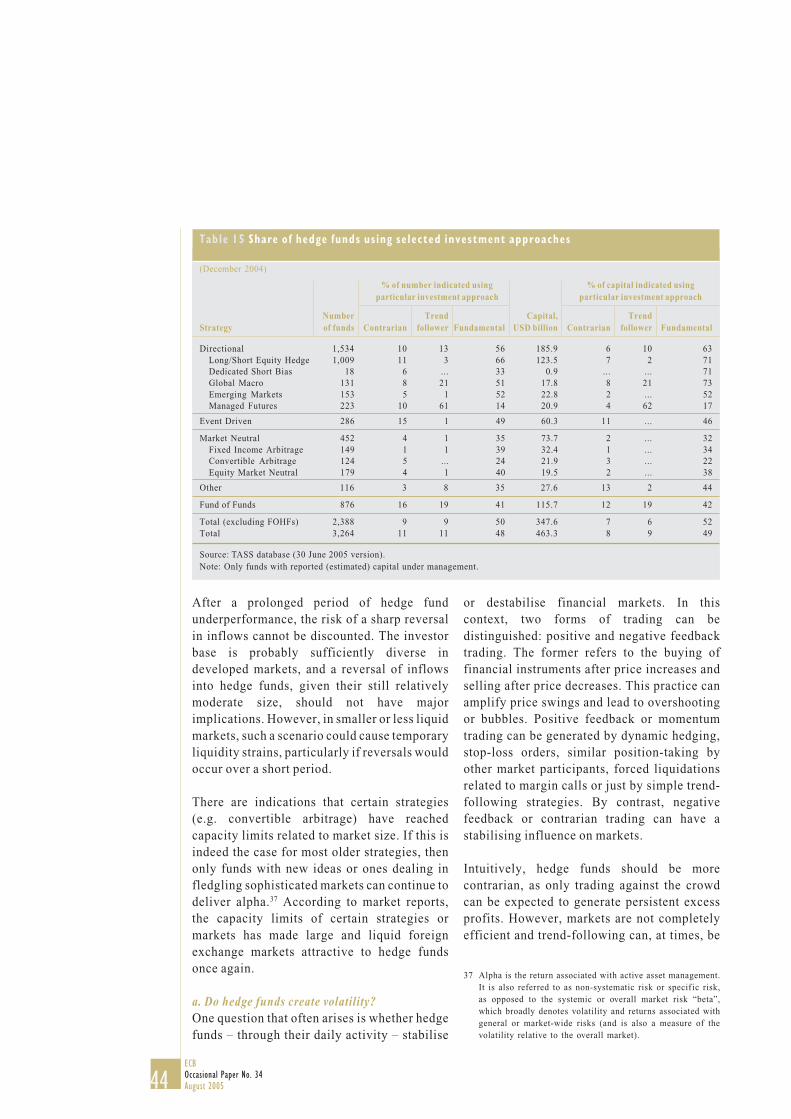
44ECBOccasional Paper No. 34August 2005
% of number indicated using % of capital indicated usingparticular investment approach particular investment approach
Number Trend Capital, TrendStrategy of funds Contrarian follower Fundamental USD billion Contrarian follower Fundamental
Directional 1,534 10 13 56 185.9 6 10 63Long/Short Equity Hedge 1,009 11 3 66 123.5 7 2 71Dedicated Short Bias 18 6 ... 33 0.9 ... ... 71Global Macro 131 8 21 51 17.8 8 21 73Emerging Markets 153 5 1 52 22.8 2 ... 52Managed Futures 223 10 61 14 20.9 4 62 17
Event Driven 286 15 1 49 60.3 11 ... 46
Market Neutral 452 4 1 35 73.7 2 ... 32Fixed Income Arbitrage 149 1 1 39 32.4 1 ... 34Convertible Arbitrage 124 5 ... 24 21.9 3 ... 22Equity Market Neutral 179 4 1 40 19.5 2 ... 38
Other 116 3 8 35 27.6 13 2 44
Fund of Funds 876 16 19 41 115.7 12 19 42
Total (excluding FOHFs) 2,388 9 9 50 347.6 7 6 52Total 3,264 11 11 48 463.3 8 9 49
Table 15 Share of hedge funds using selected investment approaches
(December 2004)
Source: TASS database (30 June 2005 version).Note: Only funds with reported (estimated) capital under management.
After a prolonged period of hedge fundunderperformance, the risk of a sharp reversalin inflows cannot be discounted. The investorbase is probably sufficiently diverse indeveloped markets, and a reversal of inflowsinto hedge funds, given their still relativelymoderate size, should not have majorimplications. However, in smaller or less liquidmarkets, such a scenario could cause temporaryliquidity strains, particularly if reversals wouldoccur over a short period.
There are indications that certain strategies(e.g. convertible arbitrage) have reachedcapacity limits related to market size. If this isindeed the case for most older strategies, thenonly funds with new ideas or ones dealing infledgling sophisticated markets can continue todeliver alpha.37 According to market reports,the capacity limits of certain strategies ormarkets has made large and liquid foreignexchange markets attractive to hedge fundsonce again.
a. Do hedge funds create volatility?One question that often arises is whether hedgefunds – through their daily activity – stabilise
or destabilise financial markets. In thiscontext, two forms of trading can bedistinguished: positive and negative feedbacktrading. The former refers to the buying offinancial instruments after price increases andselling after price decreases. This practice canamplify price swings and lead to overshootingor bubbles. Positive feedback or momentumtrading can be generated by dynamic hedging,stop-loss orders, similar position-taking byother market participants, forced liquidationsrelated to margin calls or just by simple trend-following strategies. By contrast, negativefeedback or contrarian trading can have astabilising influence on markets.
Intuitively, hedge funds should be morecontrarian, as only trading against the crowdcan be expected to generate persistent excessprofits. However, markets are not completelyefficient and trend-following can, at times, be
37 Alpha is the return associated with active asset management.It is also referred to as non-systematic risk or specif ic risk,as opposed to the systemic or overall market risk “beta”,which broadly denotes volatility and returns associated withgeneral or market-wide risks (and is also a measure of thevolatility relative to the overall market).
45ECB
Occasional Paper No. 34August 2005
6 F INANC IALSTABIL ITY
IMPL ICAT IONSlucrative. Managed futures hedge funds (5% ofthe total single hedge fund capital undermanagement, see Chart 20) are reportedly citedas utilising trend-following approaches (seeTable 15). However, researchers from the USCommodity Futures Trading Commission(CFTC), using micro trading data, have foundthat managed futures hedge funds can dampenrather than increase volatility in energymarkets by providing liquidity to other marketparticipants.38 Other directional strategies –global macro (10%)39, emerging markets (4%),long/short equity (32%) – can be on both sidesof the spectrum, while dedicated short-sellers(less than 1%) are probably more contrarians.According to TASS data, global macro fundsalso seem to employ rather extensively trend-following approaches, but at the same time theyrely more on fundamental analysis. Eventdriven (19%) and market neutral (19%)strategies probably also involve the taking ofmore contrarian views. Hence, it is verydifficult to determine whether hedge funds, onaverage, are momentum traders or contrarians.
b. Do hedge funds benefit from volatility?Conventional wisdom suggests that hedgefunds thrive in volatile financial markets. Thisis frequently put forward as a reason for thediminishing returns that were observed in therather low stock market volatility environmentin the second quarter of 2004. However, there isno conclusive evidence on this issue. Indeed,contrary to popular belief, calculationsindicate that over the past 11 years hedgefunds, on average, tended to perform betterwhen stock markets were less volatile (seeChart 42 and Chart 43).
The correlation coefficients between theannualised S&P 500, Dow Jones EUROSTOXX historical monthly volatility and theCSFB/Tremont Hedge Fund Index monthlyreturns were negative.40 In other words, highervolatility was associated with lower hedgefund returns. The results are similar acrossalmost all hedge fund strategies. Onlydedicated short-sellers and managed futuresfunds, which together account for only around
5% of total capital under management, tend toperform better in volatile markets. Thus,although short-sellers are more likely to becontrarians, their returns tend to be higher involatile markets, as volatility is usually higherin falling rather than rising markets. Theseresults suggest that many hedge funds couldactually be short in volatility owing to thenature of their strategies.
Another plausible explanation as to why lowervolatility could benefit hedge fund performanceis related to the impact of leverage. For example,a price decrease of 5% on a five times leveragedinvestment portfolio means a 25% loss forcapital under management. Hence, larger pricedeclines may force hedge funds to unwind losingleveraged positions more often due to internalrisk limits or margin calls from prime brokers. Inaddition, by selling into a falling market, hedgefunds may also further exacerbate volatility,especially if the relative size of their positions oractivity is significant for the affected markets.The lower the available liquidity buffers are andthe higher the use of leverage is, the more oftenhedge funds will be forced to liquidatepositions.41 However, hedge funds probably donot use all available leveraging possibilities andhave some capital cushion in times of stress. Inthe TASS database, about one-third of singlehedge funds provide information on average andmaximum leverage (as specified in offeringdocuments or voluntarily set by managers).42 Ofthose, about 10% have a ratio of average tomaximum leverage in excess of 0.9.
38 Haigh et al. (2005).39 For example, Tiger Fund, a prominent global macro hedge
fund, was betting against the technology bubble, but itscapital was depleted and investors withdrew before thebubble actually burst.
40 In both cases pairwise correlation coeff icients arestatistically signif icant (i.e. different from zero) at a 99%confidence level (132 observation pairs).
41 See the discussion about the implications of hedge fundleverage on credit markets by Fitch Ratings (2005).
42 Including only cases where the provided average ormaximum leverage is not zero and average leverage is nothigher than maximum leverage.
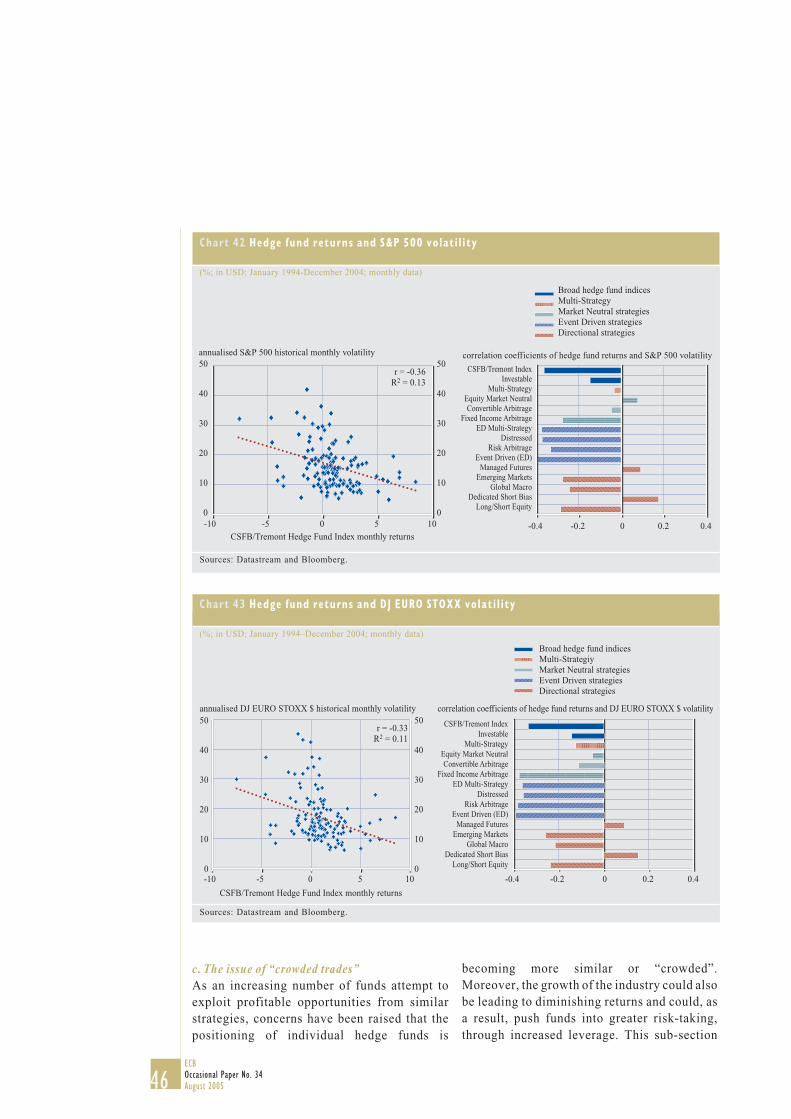
46ECBOccasional Paper No. 34August 2005
Chart 43 Hedge fund returns and DJ EURO STOXX volati l ity
(%; in USD; January 1994–December 2004; monthly data)
0
10
20
30
40
50
-0.4 -0.2 0.20 0.40-10 -5 0 5 10
10
20
30
40
50annualised DJ EURO STOXX $ historical monthly volatility
CSFB/Tremont Hedge Fund Index monthly returns
correlation coefficients of hedge fund returns and DJ EURO STOXX $ volatility
r = -0.33R2 = 0.11
CSFB/Tremont IndexInvestable
Multi-StrategyEquity Market NeutralConvertible Arbitrage
Fixed Income ArbitrageED Multi-Strategy
DistressedRisk Arbitrage
Event Driven (ED)Managed Futures
Emerging MarketsGlobal Macro
Dedicated Short BiasLong/Short Equity
Broad hedge fund indicesMulti-StrategiyMarket Neutral strategiesEvent Driven strategiesDirectional strategies
Sources: Datastream and Bloomberg.
c. The issue of “crowded trades”As an increasing number of funds attempt toexploit profitable opportunities from similarstrategies, concerns have been raised that thepositioning of individual hedge funds is
Chart 42 Hedge fund returns and S&P 500 volat i l ity
(%; in USD; January 1994-December 2004; monthly data)
Sources: Datastream and Bloomberg.
-0.4 -0.2 0.20 0.4
correlation coefficients of hedge fund returns and S&P 500 volatility
0
10
20
30
40
50
0-10 -5 0 5 10
10
20
30
40
50annualised S&P 500 historical monthly volatility
CSFB/Tremont Hedge Fund Index monthly returns
Broad hedge fund indicesMulti-StrategyMarket Neutral strategiesEvent Driven strategiesDirectional strategies
r = -0.36R2 = 0.13
CSFB/Tremont IndexInvestable
Multi-StrategyEquity Market NeutralConvertible Arbitrage
Fixed Income ArbitrageED Multi-Strategy
DistressedRisk Arbitrage
Event Driven (ED)Managed Futures
Emerging MarketsGlobal Macro
Dedicated Short BiasLong/Short Equity
becoming more similar or “crowded”.Moreover, the growth of the industry could alsobe leading to diminishing returns and could, asa result, push funds into greater risk-taking,through increased leverage. This sub-section
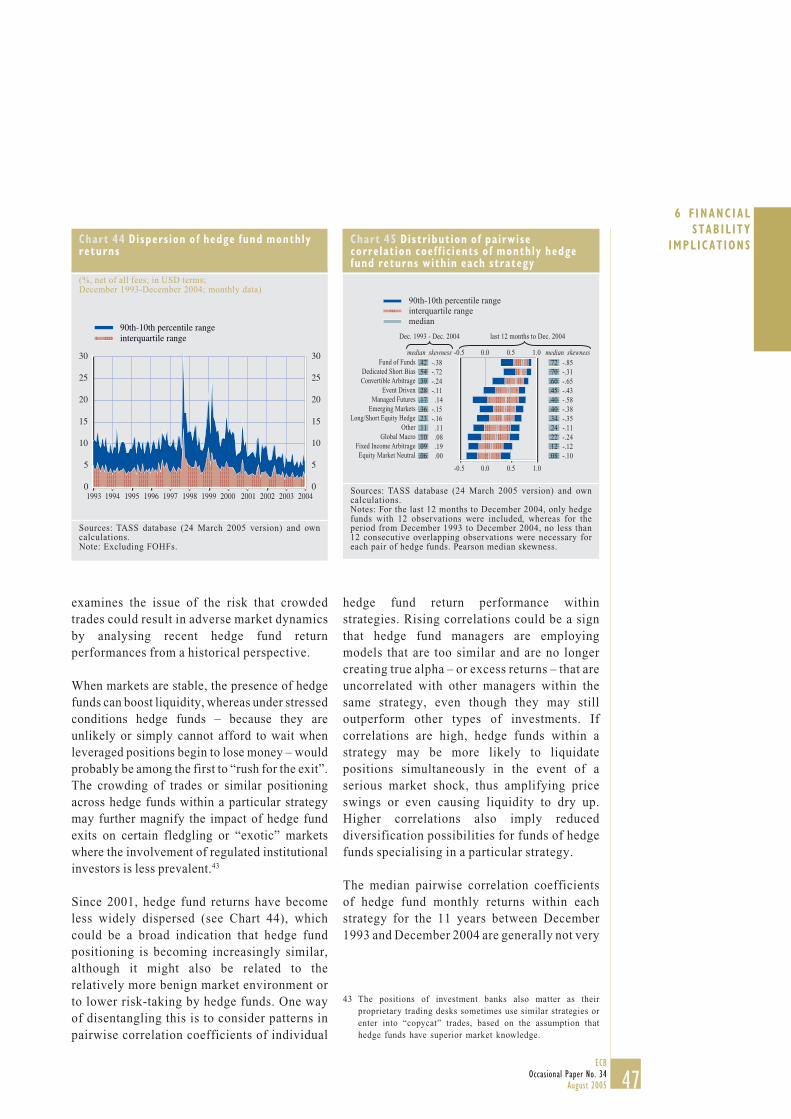
47ECB
Occasional Paper No. 34August 2005
6 F INANC IALSTABIL ITY
IMPL ICAT IONS
examines the issue of the risk that crowdedtrades could result in adverse market dynamicsby analysing recent hedge fund returnperformances from a historical perspective.
When markets are stable, the presence of hedgefunds can boost liquidity, whereas under stressedconditions hedge funds – because they areunlikely or simply cannot afford to wait whenleveraged positions begin to lose money – wouldprobably be among the first to “rush for the exit”.The crowding of trades or similar positioningacross hedge funds within a particular strategymay further magnify the impact of hedge fundexits on certain fledgling or “exotic” marketswhere the involvement of regulated institutionalinvestors is less prevalent.43
Since 2001, hedge fund returns have becomeless widely dispersed (see Chart 44), whichcould be a broad indication that hedge fundpositioning is becoming increasingly similar,although it might also be related to therelatively more benign market environment orto lower risk-taking by hedge funds. One wayof disentangling this is to consider patterns inpairwise correlation coefficients of individual
hedge fund return performance withinstrategies. Rising correlations could be a signthat hedge fund managers are employingmodels that are too similar and are no longercreating true alpha – or excess returns – that areuncorrelated with other managers within thesame strategy, even though they may stilloutperform other types of investments. Ifcorrelations are high, hedge funds within astrategy may be more likely to liquidatepositions simultaneously in the event of aserious market shock, thus amplifying priceswings or even causing liquidity to dry up.Higher correlations also imply reduceddiversification possibilities for funds of hedgefunds specialising in a particular strategy.
The median pairwise correlation coefficientsof hedge fund monthly returns within eachstrategy for the 11 years between December1993 and December 2004 are generally not very
43 The positions of investment banks also matter as theirproprietary trading desks sometimes use similar strategies orenter into “copycat” trades, based on the assumption thathedge funds have superior market knowledge.
Chart 44 Dispersion of hedge fund monthlyreturns
(%, net of all fees; in USD terms;December 1993-December 2004; monthly data)
Sources: TASS database (24 March 2005 version) and owncalculations.Note: Excluding FOHFs.
90th-10th percentile rangeinterquartile range
1994 1995 1996 1997 1998 1999 2000 2001 2002 2003 20040
5
10
15
20
25
30
0
5
10
15
20
25
30
1993
Chart 45 Distr ibution of pairwisecorrelat ion coef f ic ients of monthly hedgefund returns within each strategy
Sources: TASS database (24 March 2005 version) and owncalculations.Notes: For the last 12 months to December 2004, only hedgefunds with 12 observations were included, whereas for theperiod from December 1993 to December 2004, no less than12 consecutive overlapping observations were necessary foreach pair of hedge funds. Pearson median skewness.
-0.5 0.0 0.5 1.0
-0.5 0.0 0.5 1.0
-.10-.12-.24-.11-.35-.38-.58-.43-.65-.31-.85
90th-10th percentile rangeinterquartile rangemedian
median skewness median skewness
Dec. 1993 - Dec. 2004 last 12 months to Dec. 2004
Equity Market NeutralFixed Income Arbitrage
Global MacroOther
Long/Short Equity HedgeEmerging MarketsManaged Futures
Event DrivenConvertible ArbitrageDedicated Short Bias
Fund of Funds
.06
.09
.10
.11
.23
.36
.17
.28
.39
.54
.42 -.38-.72-.24-.11.14
-.15-.16.11.08.19.00 .08
.12
.22
.24
.34
.40
.40
.45
.60
.70
.72
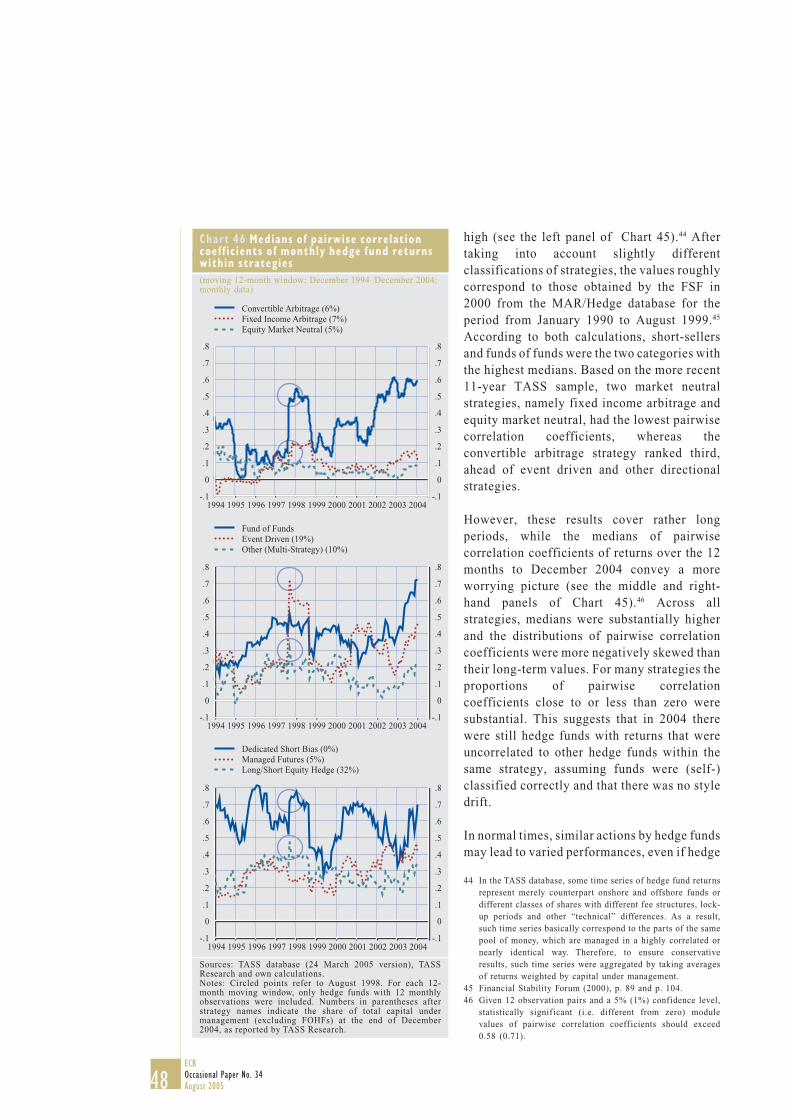
48ECBOccasional Paper No. 34August 2005
Chart 46 Medians of pairwise correlat ioncoeff ic ients of monthly hedge fund returnswithin strategies(moving 12-month window; December 1994–December 2004;monthly data)
Sources: TASS database (24 March 2005 version), TASSResearch and own calculations.Notes: Circled points refer to August 1998. For each 12-month moving window, only hedge funds with 12 monthlyobservations were included. Numbers in parentheses afterstrategy names indicate the share of total capital undermanagement (excluding FOHFs) at the end of December2004, as reported by TASS Research.
Convertible Arbitrage (6%)Fixed Income Arbitrage (7%)Equity Market Neutral (5%)
-.1
0
.1
.2
.3
.4
.5
.6
.7
.8
-.1
0
.1
.2
.3
.4
.5
.6
.7
.8
1994 1995 1996 1997 1998 1999 2000 2001 2002 2003 2004
-.1
0
.1
.2
.3
.4
.5
.6
.7
.8
-.1
0
.1
.2
.3
.4
.5
.6
.7
.8
1994 1995 1996 1997 1998 1999 2000 2001 2002 2003 2004
Fund of FundsEvent Driven (19%)Other (Multi-Strategy) (10%)
-.1
0
.1
.2
.3
.4
.5
.6
.7
.8
-.1
0
.1
.2
.3
.4
.5
.6
.7
.8
1994 1995 1996 1997 1998 1999 2000 2001 2002 2003 2004
Dedicated Short Bias (0%)Managed Futures (5%)Long/Short Equity Hedge (32%)
high (see the left panel of Chart 45).44 Aftertaking into account slightly differentclassifications of strategies, the values roughlycorrespond to those obtained by the FSF in2000 from the MAR/Hedge database for theperiod from January 1990 to August 1999.45
According to both calculations, short-sellersand funds of funds were the two categories withthe highest medians. Based on the more recent11-year TASS sample, two market neutralstrategies, namely fixed income arbitrage andequity market neutral, had the lowest pairwisecorrelation coefficients, whereas theconvertible arbitrage strategy ranked third,ahead of event driven and other directionalstrategies.
However, these results cover rather longperiods, while the medians of pairwisecorrelation coefficients of returns over the 12months to December 2004 convey a moreworrying picture (see the middle and right-hand panels of Chart 45).46 Across allstrategies, medians were substantially higherand the distributions of pairwise correlationcoefficients were more negatively skewed thantheir long-term values. For many strategies theproportions of pairwise correlationcoefficients close to or less than zero weresubstantial. This suggests that in 2004 therewere still hedge funds with returns that wereuncorrelated to other hedge funds within thesame strategy, assuming funds were (self-)classified correctly and that there was no styledrift.
In normal times, similar actions by hedge fundsmay lead to varied performances, even if hedge
44 In the TASS database, some time series of hedge fund returnsrepresent merely counterpart onshore and offshore funds ordifferent classes of shares with different fee structures, lock-up periods and other “technical” differences. As a result,such time series basically correspond to the parts of the samepool of money, which are managed in a highly correlated ornearly identical way. Therefore, to ensure conservativeresults, such time series were aggregated by taking averagesof returns weighted by capital under management.
45 Financial Stability Forum (2000), p. 89 and p. 104.46 Given 12 observation pairs and a 5% (1%) confidence level,
statistically signif icant (i.e. different from zero) modulevalues of pairwise correlation coeff icients should exceed0.58 (0.71).
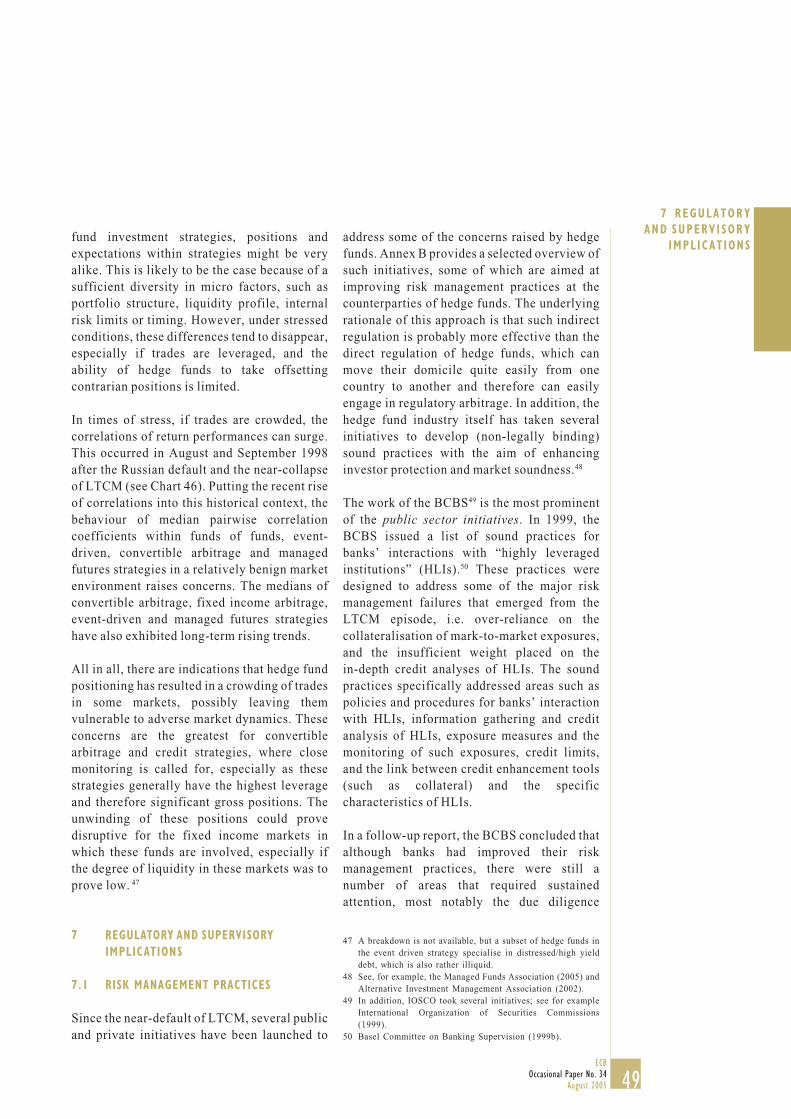
ECBOccasional Paper No. 34
August 2005
7 REGULATORYAND SUPERV ISORY
IMPL ICAT IONS
49
fund investment strategies, positions andexpectations within strategies might be veryalike. This is likely to be the case because of asufficient diversity in micro factors, such asportfolio structure, liquidity profile, internalrisk limits or timing. However, under stressedconditions, these differences tend to disappear,especially if trades are leveraged, and theability of hedge funds to take offsettingcontrarian positions is limited.
In times of stress, if trades are crowded, thecorrelations of return performances can surge.This occurred in August and September 1998after the Russian default and the near-collapseof LTCM (see Chart 46). Putting the recent riseof correlations into this historical context, thebehaviour of median pairwise correlationcoefficients within funds of funds, event-driven, convertible arbitrage and managedfutures strategies in a relatively benign marketenvironment raises concerns. The medians ofconvertible arbitrage, fixed income arbitrage,event-driven and managed futures strategieshave also exhibited long-term rising trends.
All in all, there are indications that hedge fundpositioning has resulted in a crowding of tradesin some markets, possibly leaving themvulnerable to adverse market dynamics. Theseconcerns are the greatest for convertiblearbitrage and credit strategies, where closemonitoring is called for, especially as thesestrategies generally have the highest leverageand therefore significant gross positions. Theunwinding of these positions could provedisruptive for the fixed income markets inwhich these funds are involved, especially ifthe degree of liquidity in these markets was toprove low. 47
7 REGULATORY AND SUPERVISORYIMPLICATIONS
7.1 RISK MANAGEMENT PRACTICES
Since the near-default of LTCM, several publicand private initiatives have been launched to
47 A breakdown is not available, but a subset of hedge funds inthe event driven strategy specialise in distressed/high yielddebt, which is also rather illiquid.
48 See, for example, the Managed Funds Association (2005) andAlternative Investment Management Association (2002).
49 In addition, IOSCO took several initiatives; see for exampleInternational Organization of Securities Commissions(1999).
50 Basel Committee on Banking Supervision (1999b).
address some of the concerns raised by hedgefunds. Annex B provides a selected overview ofsuch initiatives, some of which are aimed atimproving risk management practices at thecounterparties of hedge funds. The underlyingrationale of this approach is that such indirectregulation is probably more effective than thedirect regulation of hedge funds, which canmove their domicile quite easily from onecountry to another and therefore can easilyengage in regulatory arbitrage. In addition, thehedge fund industry itself has taken severalinitiatives to develop (non-legally binding)sound practices with the aim of enhancinginvestor protection and market soundness.48
The work of the BCBS49 is the most prominentof the public sector initiatives. In 1999, theBCBS issued a list of sound practices forbanks’ interactions with “highly leveragedinstitutions” (HLIs).50 These practices weredesigned to address some of the major riskmanagement failures that emerged from theLTCM episode, i.e. over-reliance on thecollateralisation of mark-to-market exposures,and the insufficient weight placed on thein-depth credit analyses of HLIs. The soundpractices specifically addressed areas such aspolicies and procedures for banks’ interactionwith HLIs, information gathering and creditanalysis of HLIs, exposure measures and themonitoring of such exposures, credit limits,and the link between credit enhancement tools(such as collateral) and the specificcharacteristics of HLIs.
In a follow-up report, the BCBS concluded thatalthough banks had improved their riskmanagement practices, there were still anumber of areas that required sustainedattention, most notably the due diligence
50ECBOccasional Paper No. 34August 2005
process for establishing credit relations withHLIs, the development of improved exposuremeasures, and the use of stress-testing.51 Theseconclusions were basically confirmed in a jointreport published by the BCBS and IOSCO ayear later.52
Significant private sector initiatives includethose of the Counterparty Risk ManagementPolicy Group (CRMPG), the InternationalSwaps and Derivatives Association (ISDA)and the Institute of International Finance (IIF).The CRMPG or “Corrigan group” is a group of12 major, internationally active banks andsecurities firms that have developed standardsfor strengthened risk management practices forfinancial firms that provide credit in thederivatives and securities markets.53 Theseimproved standards are based on the followingbroad principles: (i) enhanced information-sharing between counterparties, (ii) anintegrated framework to assess market risk,liquidity risk and leverage, (iii) stress-testingand liquidation-based estimates ofcounterparty credit exposures, (iv) the need totake into account potential liquidation costs insetting limits and collateral standards, (v)enhancements in the quality of information,and (vi) improvements in the standards ofindustry documentation. The CRMPG recentlypublished a review of its guidance, taking intoaccount the financial, regulatory andsupervisory developments that have occurredsince 1999. The Group also investigated indetail complex financial products, includinghedge funds, and their implications for riskmanagement.54
Following up on the market events of the1990s, the ISDA reviewed its collateralmanagement practices, which led to 22recommendations for enhancements.55 Therecommendations cover areas such as: (i) therelationship between collateralisation andcredit analysis, (ii) the management of risksrelated to collateralisation, (iii) disputeresolution, (iv) the length of the collateralcycle, (v) the range of collateral accepted, (vi)margining, (vii) legal and documentation
issues, (viii) cross-product netting, and (ix)substitution of collateral. Finally, the IIF, aglobal association of financial institutions,also published in 1999 a number ofrecommendations in the area of riskmanagement.56
7.2 DISCLOSURE, TRANSPARENCY AND THEVALUATION OF POSITIONS
The international supervisory and centralbanking community has become increasinglyconvinced that market discipline can play animportant role in maintaining financialstability. A precondition for market disciplineto be effective is adequate public disclosureabout the risks that financial intermediaries canincur. Following the market events of the1990s, several international initiatives werelaunched to improve disclosure by regulated aswell as unregulated (such as hedge funds)intermediaries.
The so-called “Fisher II” working group57
(2001) recommended that financialintermediaries, including hedge funds, shouldperiodically disclose, when risks are material,quantitative information related to market riskin trading activity, firm-wide exposure tomarket risk, funding liquidity risk, credit riskand insurance risk. To the extent that not allhedge funds disclose this information on avoluntary basis, the group recommended thatthe relevant authorities should considerrequiring this disclosure. The group alsoconcluded that the indicated informationshould be considered to be a minimum of whatwould be expected in bilateral disclosures to
51 Basel Committee on Banking Supervision (2000).52 Basel Committee on Banking Supervision and the
International Organization of Securities Commissions(2001).
53 Counterparty Risk Management Policy Group (1999).54 Counterparty Risk Management Group (2005).55 International Swaps and Derivatives Association (1999).56 Institute of International Finance (1999).57 Multidisciplinary Working Group on Enhanced Disclosure
(2001). This Working Group was jointly sponsored by theBCBS, the Committee on the Global Financial System(CGFS), the International Association of InsuranceSupervisors (IAIS) and IOSCO.
ECBOccasional Paper No. 34
August 2005
7 REGULATORYAND SUPERV ISORY
IMPL ICAT IONS
51
judge the adequacy of regulated firms’ riskmanagement capabilities.
As a follow-up to the recommendations, theJoint Forum58 established a working group toassess the extent to which therecommendations had been adopted.59
However, regarding hedge funds, the workinggroup was unable to obtain the necessaryinformation to provide a meaningful basis forfurther review. This was attributed to possibleconcerns about client confidentiality, theproprietary nature of the funds’ positions, and ageneral reluctance to engage in a dialogue withthe regulatory community. The working groupdid not draw any conclusions from thesefindings regarding the regulation of hedgefunds.
Inadequate disclosure and transparency are to avery large extent rooted in the largelyunregulated nature of hedge funds. Moreover,problems related to the valuation of positionsare often the direct cause of hedge fundfailures.60 Apart from the limited regulatoryand auditing standards that apply to hedgefunds, other factors that explain this type ofoperational risk are the investment strategiespursued by the funds (positions for which theremight be no readily available market prices),the small size of the hedge fund enterprise(with less scope for rigorous segregation offunctions), and performance-related fees(which create an incentive for managers tomisrepresent asset values). Anothercomplicating factor with regard to enhancingdisclosure for hedge funds is that no generallyaccepted market standard has yet emerged thatcan adequately measure leverage61, which iscrucial in assessing the level of risk faced by ahedge fund.
The effect of strong institutional demand forhedge funds on transparency is ambiguous. Onthe one hand, it reduces incentives for hedgefunds to be more transparent, yet, on the otherhand, hedge funds are forced to disclose moreinformation in order to attract funds. Theoutcome ultimately depends on the relative
negotiating strength of the two partiesinvolved. There are some indications that, overthe last years, transparency has improved fordirect investors and prime brokers, but not forother market participants. Some authors arealso sceptical about the positive financialstability effects of enhanced disclosure,stressing that it might negatively impact on theliquidity of financial markets.62
7.3 SOUND BUSINESS PRACTICES
With the growth in the hedge fund business, thenumber of hedge fund-related fraud cases hasalso increased. As discussed in the previoussub-section, the largely unregulated nature ofthe business makes it particularly vulnerable tomisrepresentation and fraud. In its recentproposed rule regarding the registration ofcertain hedge fund advisors, the Securities andExchange Commission (SEC) estimated that inthe past five years it had acted against hedgefund fraud totalling more than USD 1 billion.The SEC’s cases included the grossoverstatement of hedge fund performance, thepayment of unnecessary and undisclosedcommissions, and the misappropriation ofclient assets by hedge funds. Advisers to hedgefunds were also key participants in the recentscandals involving mutual fund late trading andinappropriate market timing.63 Since themanagement of hedge funds is veryinternational in nature, it has been argued thatthe hedge fund business is particularlyvulnerable to money laundering attempts.Hedge fund managers should therefore dulyverify, directly or indirectly (e.g. through thefund’s administrators), the identity of theinvestors in their funds.
58 The Joint Forum is an international group of technicalexperts working under the umbrella of the BCBS, the IAISand IOSCO.
59 Joint Forum (2004).60 See for example, Kundro and Feffer (2004).61 Multidisciplinary Working Group on Enhanced Disclosure
(2001). This was one of the areas which the working groupidentified where the industry could do further work.
62 Persaud (2001).63 Securities and Exchange Commission (2004).
52ECBOccasional Paper No. 34August 2005
7.4 REGULATORY ISSUES
In the United States, the SEC ruled at the end of2004 that most hedge fund advisors (i.e.managers) must register with the SEC andcomply with the regulations that apply to otherregistered investment advisors. Thisrequirement was introduced by changing therule that an investment advisor was exemptedfrom registration if, among other things, he orshe advised no more than 14 clients. Under thenew rules, an advisor to a private (hedge) fundis no longer permitted to count the fund, ratherthan its owners, as a single client (the “lookthrough” approach). The registration impliesthe need to keep written records, and that therewill be heightened scrutiny of conflicts ofinterest and their disclosure, plus thepossibility of SEC inspections, etc. Advisorsshould register before 1 February 2006. Therule followed an extensive investigation by theSEC into the implications of the growth ofhedge funds. This investigation identified anumber of concerns, including a lack ofinformation regarding unregistered advisors,which made it difficult to uncover fraud, andthe way in which advisors value hedge fundassets.64 The decision was by no meansuncontroversial – indeed, the SECcommissioners were themselves divided on theissue65, and a number of industry groupingshave already indicated that they plan tochallenge the SEC decision before the courts.66
At present, there is no common regulatoryregime in the EU for hedge funds or theirmanagers.67 At the same time, it should berecalled that, on a global basis, the greatmajority of hedge funds continue to bemanaged by US managers, although theimportance of managers located in the EU issteadily increasing (see Chart 5 and Chart 7).Because of their investment strategies, hedgefunds typically fall outside the scope of theUCITS Directives.68 One implication of this isthat they do not benefit from having a“European passport”, which prevents theirmarketing across the EU. Their EU investmentmanagers, by contrast, are already subject to
the Financial Instruments and MarketsDirective69, which recently replaced theInvestment Services Directive.70 Hence, hedgefunds in the EU are often set up where they aredistributed, although there is an increasing useof pan-European domiciles.
In January 2004, the European Parliamentadopted a resolution on hedge funds based on areport by its Economic and Monetary AffairsCommittee (EMAC).71 In this resolution, theParliament proposed to introduce a lightregulatory regime for “sophisticatedalternative investment vehicles”, whichinclude hedge funds. The purpose of thisproposal would be to bring onshore funds thatare presently offshore and to provide them withthe benefit of a European passport. Theindustry was also invited to develop a self-regulatory code of conduct.
Following the near-completion of the FinancialServices Action Plan (FSAP), the EuropeanCommission set up four expert groups ofmarket practitioners to assess the state ofintegration of European financial markets. Inits May 2004 report, the asset managementexpert group recommended inter alia that theCommission should review the EU regulatoryframework to allow currently non-harmonisedproducts, such as hedge funds, to be brought tothe market on an EU-wide basis, subject toappropriate safeguards. Current UCITSlegislation could be used as a reference for thisregulation, but adapted to the specific nature ofthe products.
For the time being, the European Commissionand the Council have not yet taken up the
64 Securities and Exchange Commission (2003).65 See Atkins (2004) for some of the arguments against the
ruling.66 Avery (2005), Maiden (2004).67 An overview of the regulation of hedge funds in Europe can
be found in PricewaterhouseCoopers (2003 and 2004b).68 See in particular the Directives 85/611/EEC, 2001/108/EC
and 2001/017/EC.69 Directive 2004/39/EC.70 Directive 93/22/EEC.71 European Parliament (2003).
ECBOccasional Paper No. 34
August 2005
7 REGULATORYAND SUPERV ISORY
IMPL ICAT IONS
53
Parliament’s proposal and therecommendations of the asset managementgroup. In its recently released Green Paper forfinancial services policy in the next fiveyears72, the Commission did not signal anyparticular initiatives planned in the area ofhedge funds. This was confirmed in the GreenPaper on asset management73 published a fewmonths later in which it was stated that therewas currently no compelling evidence for EUlegislation. Nevertheless, the Commissionconfirmed that some issues deserved furtherattention, including the growing access toretail investors, the exposures of investmentbanks and the impact on financial markets. Inthat respect, it invited responses from thepublic to these issues and also announced thecreation of an industry working group onalternative investment strategies.
The domestic regulation of hedge funds takesplace at three levels: (i) the fund manager, (ii)the fund itself, and (iii) the distribution of thefund. Table 16 provides a brief overview of thesituation in a selected number of Europeancountries for a number of key elements for eachof these three levels.
In most European countries, traditional fundmanagers are also allowed to managedomestically and/or offshore domiciled hedgefunds. For example, in the United Kingdom theFSA applies a regulatory regime to hedge fundmanagers that is similar to the one that appliesto other investment managers. Following anindustry consultation that took place last year,the FSA has confirmed that it has no intentionof introducing a special regime to regulatehedge fund managers, since the present regimewas generally deemed to be appropriate.74 Thisposition is particularly relevant for the EUhedge fund industry, since the majority of EUhedge funds are managed from London. Morerecently, however, hedge fund managers havealso started to emerge in countries such asFrance, Ireland, Italy and Sweden.
Most hedge funds are domiciled offshorebecause of the prevailing lighter regulatory
regime and for tax reasons.75 However, someEuropean jurisdictions, such as France,Ireland, Italy, Luxembourg and Sweden, havealso tried to attract hedge fund business byproviding a flexible regime. Ireland isparticularly attractive as a domicile for EUhedge funds, where they are often listed on thestock exchange. Similarly, Luxembourg hastaken a number of measures to attract the hedgefund business and is increasingly seen as analternative to Ireland. Reasons behindchoosing a European location in spite of theadvantages offered by going offshore might beto target investors that have a preference for EUfunds or that are legally restricted to investingoutside the EU. European locations might alsobenefit from the international initiativesagainst some offshore financial centres that areaccused of engaging in harmful tax competitionor that are deemed not to comply with theinternational standards to prevent moneylaundering.76
Finally, with regard to the distribution of hedgefunds, they are traditionally targeted at high networth individuals or institutional investors sothat they do not fall under the protection regimein place for retail investors. Sometimes, retailinvestors have gained indirect access to hedgefunds via so-called wrappers, which arefinancial products (such as structured notes,unit-linked insurance policies) whoseperformance is linked to that of an underlyinghedge fund or a portfolio of hedge funds.
There is a trend towards the “retailisation” ofhedge funds, and several European countrieshave recently permitted the distribution ofhedge funds to retail investors, even though,compared to the traditional funds industry,retail investments in (funds of) hedge funds are
72 European Commission (2005a).73 European Commission (2005b)74 UK’s Financial Services Authority (2003).75 Popular European offshore centres for hedge funds are
Jersey, Guernsey and the Isle of Man.76 See in this respect, for example, the different initiatives
launched by the FSF, the Organisation for Economic Co-operation and Development (OECD) and the Financial ActionTask Force (FATF).
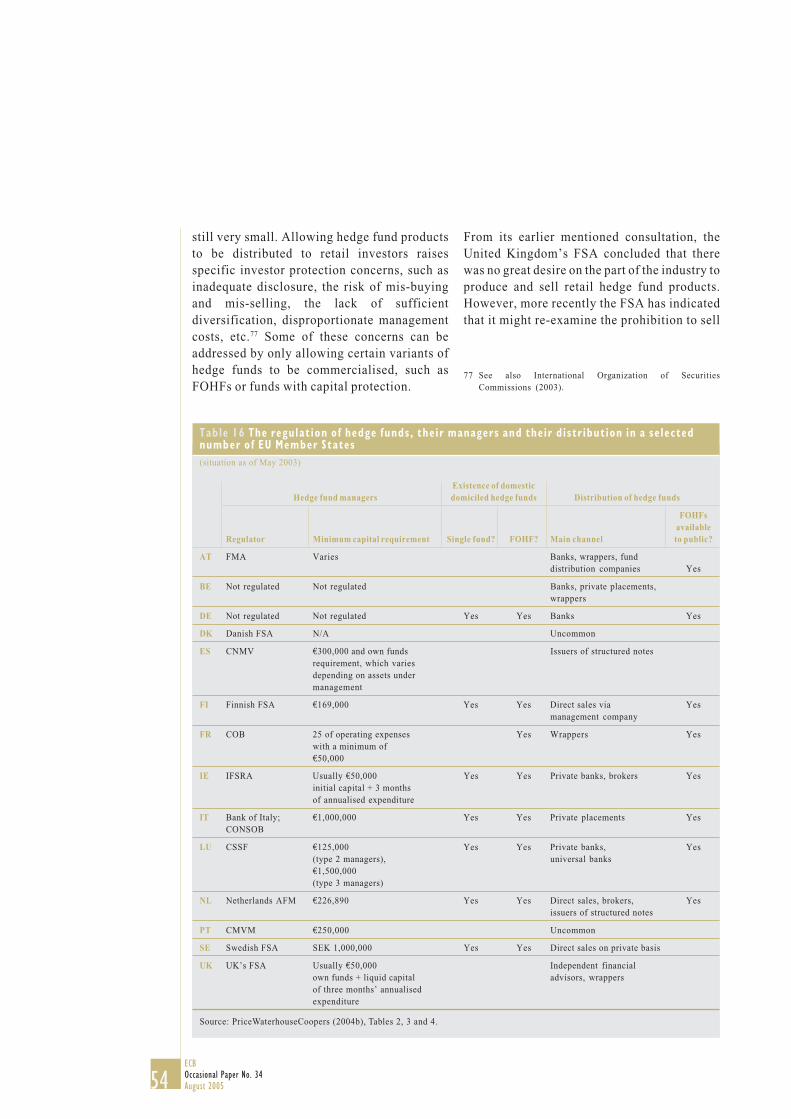
54ECBOccasional Paper No. 34August 2005
still very small. Allowing hedge fund productsto be distributed to retail investors raisesspecific investor protection concerns, such asinadequate disclosure, the risk of mis-buyingand mis-selling, the lack of sufficientdiversification, disproportionate managementcosts, etc.77 Some of these concerns can beaddressed by only allowing certain variants ofhedge funds to be commercialised, such asFOHFs or funds with capital protection.
Existence of domesticHedge fund managers domiciled hedge funds Distribution of hedge funds
FOHFsavailable
Regulator Minimum capital requirement Single fund? FOHF? Main channel to public?
AT FMA Varies Banks, wrappers, funddistribution companies Yes
BE Not regulated Not regulated Banks, private placements,wrappers
DE Not regulated Not regulated Yes Yes Banks Yes
DK Danish FSA N/A Uncommon
ES CNMV €300,000 and own funds Issuers of structured notesrequirement, which variesdepending on assets undermanagement
FI Finnish FSA €169,000 Yes Yes Direct sales via Yesmanagement company
FR COB 25 of operating expenses Yes Wrappers Yeswith a minimum of€50,000
IE IFSRA Usually €50,000 Yes Yes Private banks, brokers Yesinitial capital + 3 monthsof annualised expenditure
IT Bank of Italy; €1,000,000 Yes Yes Private placements YesCONSOB
LU CSSF €125,000 Yes Yes Private banks, Yes(type 2 managers), universal banks€1,500,000(type 3 managers)
NL Netherlands AFM €226,890 Yes Yes Direct sales, brokers, Yesissuers of structured notes
PT CMVM €250,000 Uncommon
SE Swedish FSA SEK 1,000,000 Yes Yes Direct sales on private basis
UK UK’s FSA Usually €50,000 Independent financialown funds + liquid capital advisors, wrappersof three months’ annualisedexpenditure
Table 16 The regulat ion of hedge funds, their managers and their distr ibution in a selectednumber of EU Member States(situation as of May 2003)
Source: PriceWaterhouseCoopers (2004b), Tables 2, 3 and 4.
From its earlier mentioned consultation, theUnited Kingdom’s FSA concluded that therewas no great desire on the part of the industry toproduce and sell retail hedge fund products.However, more recently the FSA has indicatedthat it might re-examine the prohibition to sell
77 See also International Organization of SecuritiesCommissions (2003).
55ECB
Occasional Paper No. 34August 2005
8 CONCLUS IONS
hedge funds to retail investors.78 Germany, bycontrast, adopted at the end of 2003 a newinvestment act that implemented a new legalframework for domestic hedge funds and themarketing of foreign funds in Germany.79 Thenew act explicitly distinguishes between singlehedge funds and FOHFs. The former are hardlysubject to any investment restrictions at all80,whereas the latter are subject to more stringentrestrictions, since they are the only hedge fundsthat can be distributed by public offer. Forexample, the latter are not allowed usingleverage or short-selling, can only invest insingle hedge funds, and are subject to certaindiversification requirements.
8 CONCLUSIONS
The near-default of LTCM proved to be only atemporary setback to the development of theglobal hedge fund industry, which has sincecontinued to grow strongly. However, theincreasing proliferation of hedge funds as analternative investment for both institutionaland retail investors raises questions about thewider financial stability implications of thisform of financial intermediation.
Although hedge funds are very muchassociated with the negative events of theLTCM period, it is important to understand thatthey have various positive effects on thefinancial system: they contribute to marketliquidity, play an important role in the pricediscovery process, contribute to theelimination of market inefficiencies, and offerdiversification benefits to investors. Moreover,their activities have probably contributed to theintegration of financial markets.
The potential threat that hedge funds pose tothe financial system comes via their impact oncredit institutions or financial markets. Thedirect exposures of credit institutions to hedgefunds are mainly the result of their role as primebroker. In this capacity they provide leverage,issue credit lines and incur trading exposures.Data seem to indicate that the prime brokerage
business is highly concentrated among alimited set of important global market players.This business also seems to have becomeincreasingly competitive over time, with anumber of second-tier players aggressivelytrying to gain market share.
Since the end of the 1990s, considerableprogress has been made by both the public andthe private sector in the further development ofrisk management standards that are designed toaddress some of the concerns related toexposures on hedge funds. However, in ahighly competitive field it is also importantthat these risk management standards areeffectively applied and not eroded. In thisrespect, banking supervisors are expected tofollow up on the earlier recommendations ofthe BCBS, possibly also in cooperation withsecurities and insurance supervisors.
The indirect links between credit institutionsand hedge funds are more difficult to gauge, butmay be significant. Market data, such as VaRfigures, for example, show that a number oflarge credit institutions (including Europeanones) have taken on more market risk and areengaging in hedge fund-like strategies. Underthese conditions, negative market events maynot only have an impact on the directrelationship between credit institutions andhedge funds (for example, through credit,trading, investment or revenue exposures), butmay also simultaneously affect the proprietarymarket positions of credit institutions.
It is very difficult to provide any conclusiveevidence on the impact of hedge funds onfinancial markets, which is at least partiallydue to the lack of good data. However, theavailable information points to a situationwhich is probably more positive than before the
78 Sants (2004); see also UK’s Financial Services Authority(2005a).
79 On the new legal framework in Germany, see for examplePütz and Schmies (2004).
80 Interestingly, however, the Minister of Finance has the powerto restrict the use of leverage and short sales to prevent abuseor to protect the integrity of f inancial markets.
56ECBOccasional Paper No. 34August 2005
81 At the international level, IOSCO is reportedly presentlyconducting a stocktaking of regulatory regimes, addressingthe access of retail investors to hedge funds. See UK’sFinancial Services Authority (2005a).
82 Trichet (2005).
LTCM crisis, for three main reasons. First,banks use more sophisticated techniques tomanage their exposures to hedge funds,although new challenges are emerging thatneed continuous monitoring. Second, as moreplayers have entered the market, positions areprobably much less concentrated in one or afew funds. Third, in general it seems that theleverage levels taken on by funds are nowlower. There is the risk, however, that as moremoney flows into hedge funds and the profitopportunities diminish commensurately, someplayers might take on more risk or leverage toachieve targeted returns. Moreover, there issome evidence that hedge funds engage in“crowded trades”, i.e. take similar positions,which could lead to market disturbance in caseof simultaneous exits in the event of a marketshock.
In addition to the need to monitor whether riskmanagement practices and techniques aresufficient for the risks involved, the mostimportant challenge for public authoritiesseems to be to increase their knowledge aboutthe impact of hedge funds on the financialsystem, both through credit institutions andfinancial markets. To a large extent, such anassessment depends on good qualityinformation – yet high-quality informationtends to be difficult to obtain, as hedge fundsthemselves have not increased their disclosureand transparency to the degree that authoritieshad hoped. It is therefore important to continueto exercise pressure, for example through therelationship between hedge funds andregulated firms, to ensure furtherimprovements in this area. At the same time,the dialogue of public authorities with the assetmanagement industry needs to be continuedand enhanced to improve further marketpractices by hedge funds.
Whether or not there is a need to regulate hedgefunds from an investor protection point of viewis not clear-cut. On the one hand, there areindications that hedge funds are becomingincreasingly available to retail investors. Onthe other hand, the amount of retail investments
is still very limited compared to the traditionalfunds. From a European perspective, it mighttherefore be worthwhile first investigatingmore closely whether, and in what form,significant “retailisation” is indeed takingplace in the EU.81At the same time, if there areindeed important financial stability concerns tobe addressed – primarily via enhancedtransparency and disclosure – this can only bedone effectively in a strongly coordinatedmanner at the international (transatlantic)level.82

A N N E X E S
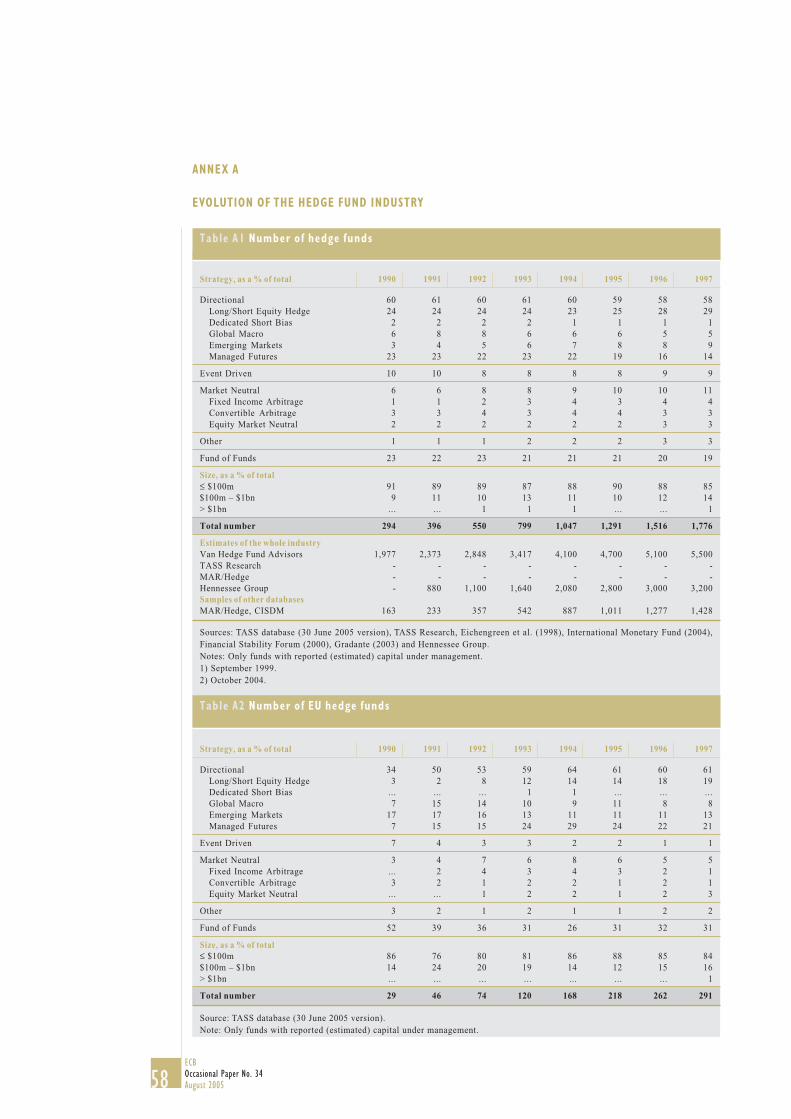
58ECBOccasional Paper No. 34August 2005
ANNEX A
EVOLUTION OF THE HEDGE FUND INDUSTRY
Sources: TASS database (30 June 2005 version), TASS Research, Eichengreen et al. (1998), International Monetary Fund (2004),Financial Stability Forum (2000), Gradante (2003) and Hennessee Group.Notes: Only funds with reported (estimated) capital under management.1) September 1999.2) October 2004.
Table A2 Number of EU hedge funds
Table A1 Number of hedge funds
Source: TASS database (30 June 2005 version).Note: Only funds with reported (estimated) capital under management.
Strategy, as a % of total 1990 1991 1992 1993 1994 1995 1996 1997
Directional 60 61 60 61 60 59 58 58Long/Short Equity Hedge 24 24 24 24 23 25 28 29Dedicated Short Bias 2 2 2 2 1 1 1 1Global Macro 6 8 8 6 6 6 5 5Emerging Markets 3 4 5 6 7 8 8 9Managed Futures 23 23 22 23 22 19 16 14
Event Driven 10 10 8 8 8 8 9 9
Market Neutral 6 6 8 8 9 10 10 11Fixed Income Arbitrage 1 1 2 3 4 3 4 4Convertible Arbitrage 3 3 4 3 4 4 3 3Equity Market Neutral 2 2 2 2 2 2 3 3
Other 1 1 1 2 2 2 3 3
Fund of Funds 23 22 23 21 21 21 20 19
Size, as a % of total≤ $100m 91 89 89 87 88 90 88 85$100m – $1bn 9 11 10 13 11 10 12 14> $1bn ... ... 1 1 1 ... ... 1
Total number 294 396 550 799 1,047 1,291 1,516 1,776
Estimates of the whole industryVan Hedge Fund Advisors 1,977 2,373 2,848 3,417 4,100 4,700 5,100 5,500TASS Research - - - - - - - -MAR/Hedge - - - - - - - -Hennessee Group - 880 1,100 1,640 2,080 2,800 3,000 3,200Samples of other databasesMAR/Hedge, CISDM 163 233 357 542 887 1,011 1,277 1,428
Strategy, as a % of total 1990 1991 1992 1993 1994 1995 1996 1997
Directional 34 50 53 59 64 61 60 61Long/Short Equity Hedge 3 2 8 12 14 14 18 19Dedicated Short Bias ... ... ... 1 1 ... ... ...Global Macro 7 15 14 10 9 11 8 8Emerging Markets 17 17 16 13 11 11 11 13Managed Futures 7 15 15 24 29 24 22 21
Event Driven 7 4 3 3 2 2 1 1
Market Neutral 3 4 7 6 8 6 5 5Fixed Income Arbitrage ... 2 4 3 4 3 2 1Convertible Arbitrage 3 2 1 2 2 1 2 1Equity Market Neutral ... ... 1 2 2 1 2 3
Other 3 2 1 2 1 1 2 2
Fund of Funds 52 39 36 31 26 31 32 31
Size, as a % of total≤ $100m 86 76 80 81 86 88 85 84$100m – $1bn 14 24 20 19 14 12 15 16> $1bn ... ... ... ... ... ... ... 1
Total number 29 46 74 120 168 218 262 291
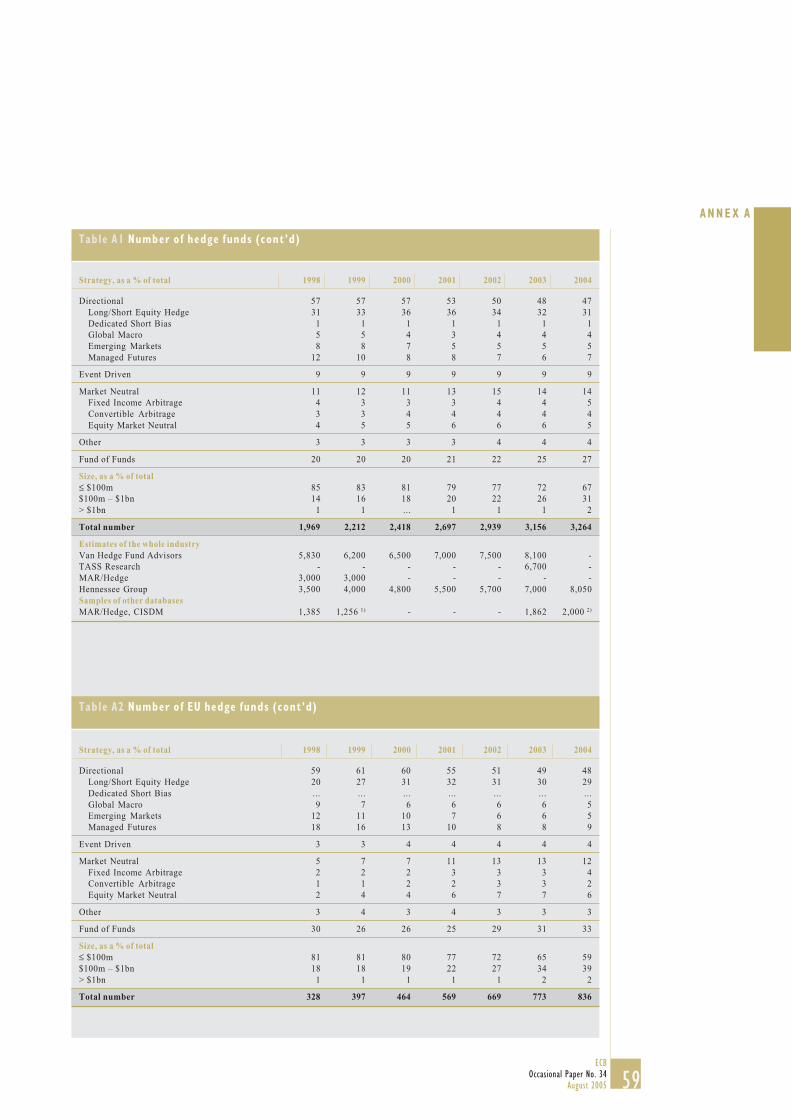
59ECB
Occasional Paper No. 34August 2005
ANNEX A
Table A2 Number of EU hedge funds (cont’d)
Table A1 Number of hedge funds (cont’d)
Strategy, as a % of total 1998 1999 2000 2001 2002 2003 2004
Directional 57 57 57 53 50 48 47Long/Short Equity Hedge 31 33 36 36 34 32 31Dedicated Short Bias 1 1 1 1 1 1 1Global Macro 5 5 4 3 4 4 4Emerging Markets 8 8 7 5 5 5 5Managed Futures 12 10 8 8 7 6 7
Event Driven 9 9 9 9 9 9 9
Market Neutral 11 12 11 13 15 14 14Fixed Income Arbitrage 4 3 3 3 4 4 5Convertible Arbitrage 3 3 4 4 4 4 4Equity Market Neutral 4 5 5 6 6 6 5
Other 3 3 3 3 4 4 4
Fund of Funds 20 20 20 21 22 25 27
Size, as a % of total≤ $100m 85 83 81 79 77 72 67$100m – $1bn 14 16 18 20 22 26 31> $1bn 1 1 ... 1 1 1 2
Total number 1,969 2,212 2,418 2,697 2,939 3,156 3,264
Estimates of the whole industryVan Hedge Fund Advisors 5,830 6,200 6,500 7,000 7,500 8,100 -TASS Research - - - - - 6,700 -MAR/Hedge 3,000 3,000 - - - - -Hennessee Group 3,500 4,000 4,800 5,500 5,700 7,000 8,050Samples of other databasesMAR/Hedge, CISDM 1,385 1,256 1) - - - 1,862 2,000 2)
Strategy, as a % of total 1998 1999 2000 2001 2002 2003 2004
Directional 59 61 60 55 51 49 48Long/Short Equity Hedge 20 27 31 32 31 30 29Dedicated Short Bias ... ... ... ... ... ... ...Global Macro 9 7 6 6 6 6 5Emerging Markets 12 11 10 7 6 6 5Managed Futures 18 16 13 10 8 8 9
Event Driven 3 3 4 4 4 4 4
Market Neutral 5 7 7 11 13 13 12Fixed Income Arbitrage 2 2 2 3 3 3 4Convertible Arbitrage 1 1 2 2 3 3 2Equity Market Neutral 2 4 4 6 7 7 6
Other 3 4 3 4 3 3 3
Fund of Funds 30 26 26 25 29 31 33
Size, as a % of total≤ $100m 81 81 80 77 72 65 59$100m – $1bn 18 18 19 22 27 34 39> $1bn 1 1 1 1 1 2 2
Total number 328 397 464 569 669 773 836
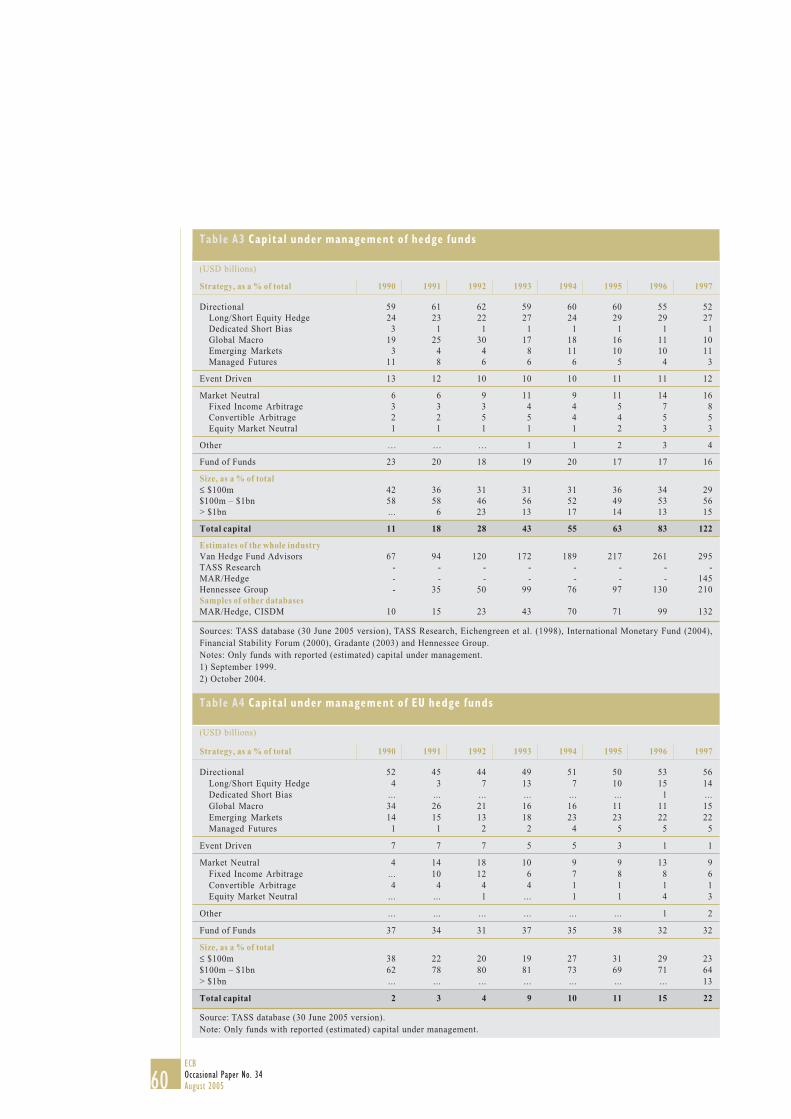
60ECBOccasional Paper No. 34August 2005
Sources: TASS database (30 June 2005 version), TASS Research, Eichengreen et al. (1998), International Monetary Fund (2004),Financial Stability Forum (2000), Gradante (2003) and Hennessee Group.Notes: Only funds with reported (estimated) capital under management.1) September 1999.2) October 2004.
Table A3 Capital under management of hedge funds
(USD billions)
Table A4 Capital under management of EU hedge funds
(USD billions)
Strategy, as a % of total 1990 1991 1992 1993 1994 1995 1996 1997
Directional 59 61 62 59 60 60 55 52Long/Short Equity Hedge 24 23 22 27 24 29 29 27Dedicated Short Bias 3 1 1 1 1 1 1 1Global Macro 19 25 30 17 18 16 11 10Emerging Markets 3 4 4 8 11 10 10 11Managed Futures 11 8 6 6 6 5 4 3
Event Driven 13 12 10 10 10 11 11 12
Market Neutral 6 6 9 11 9 11 14 16Fixed Income Arbitrage 3 3 3 4 4 5 7 8Convertible Arbitrage 2 2 5 5 4 4 5 5Equity Market Neutral 1 1 1 1 1 2 3 3
Other … … … 1 1 2 3 4
Fund of Funds 23 20 18 19 20 17 17 16
Size, as a % of total≤ $100m 42 36 31 31 31 36 34 29$100m – $1bn 58 58 46 56 52 49 53 56> $1bn ... 6 23 13 17 14 13 15
Total capital 11 18 28 43 55 63 83 122
Estimates of the whole industryVan Hedge Fund Advisors 67 94 120 172 189 217 261 295TASS Research - - - - - - - -MAR/Hedge - - - - - - - 145Hennessee Group - 35 50 99 76 97 130 210Samples of other databasesMAR/Hedge, CISDM 10 15 23 43 70 71 99 132
Strategy, as a % of total 1990 1991 1992 1993 1994 1995 1996 1997
Directional 52 45 44 49 51 50 53 56Long/Short Equity Hedge 4 3 7 13 7 10 15 14Dedicated Short Bias ... ... ... ... ... ... 1 ...Global Macro 34 26 21 16 16 11 11 15Emerging Markets 14 15 13 18 23 23 22 22Managed Futures 1 1 2 2 4 5 5 5
Event Driven 7 7 7 5 5 3 1 1
Market Neutral 4 14 18 10 9 9 13 9Fixed Income Arbitrage ... 10 12 6 7 8 8 6Convertible Arbitrage 4 4 4 4 1 1 1 1Equity Market Neutral ... ... 1 ... 1 1 4 3
Other ... ... ... ... ... ... 1 2
Fund of Funds 37 34 31 37 35 38 32 32
Size, as a % of total≤ $100m 38 22 20 19 27 31 29 23$100m – $1bn 62 78 80 81 73 69 71 64> $1bn ... ... ... ... ... ... ... 13
Total capital 2 3 4 9 10 11 15 22
Source: TASS database (30 June 2005 version).Note: Only funds with reported (estimated) capital under management.
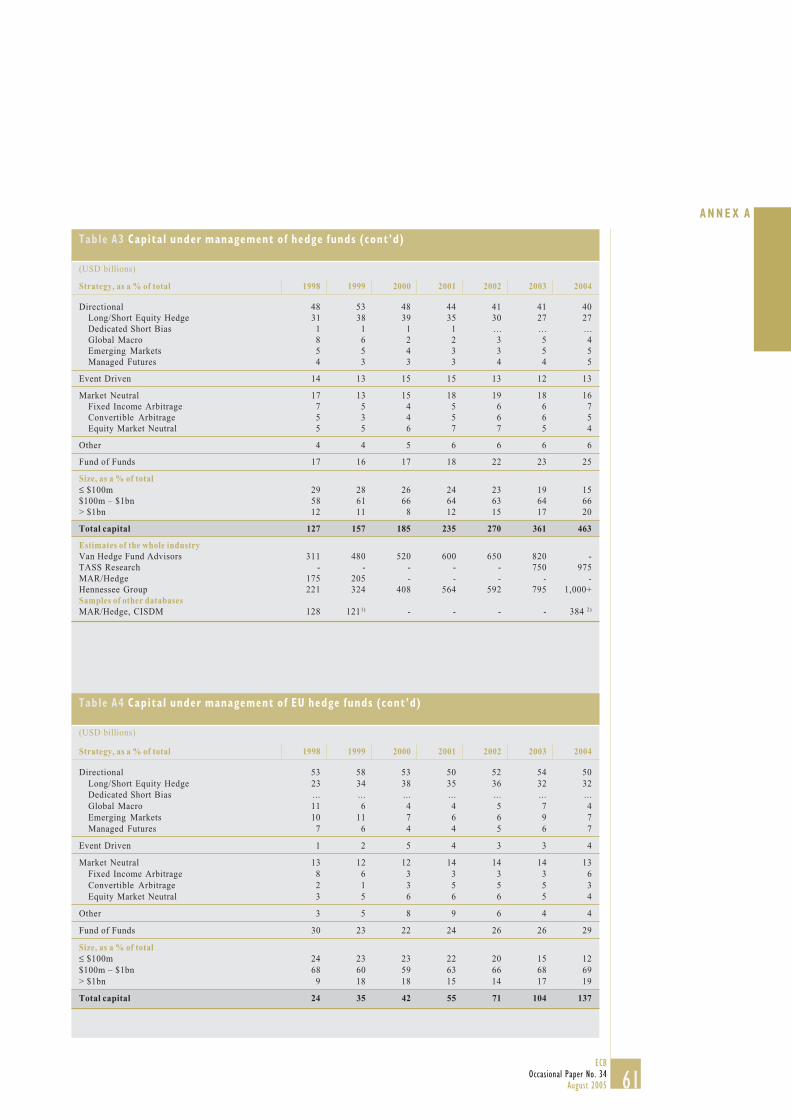
61ECB
Occasional Paper No. 34August 2005
ANNEX A
Table A4 Capital under management of EU hedge funds (cont’d)
(USD billions)
Table A3 Capital under management of hedge funds (cont’d)
(USD billions)
Strategy, as a % of total 1998 1999 2000 2001 2002 2003 2004
Directional 48 53 48 44 41 41 40Long/Short Equity Hedge 31 38 39 35 30 27 27Dedicated Short Bias 1 1 1 1 … … …Global Macro 8 6 2 2 3 5 4Emerging Markets 5 5 4 3 3 5 5Managed Futures 4 3 3 3 4 4 5
Event Driven 14 13 15 15 13 12 13
Market Neutral 17 13 15 18 19 18 16Fixed Income Arbitrage 7 5 4 5 6 6 7Convertible Arbitrage 5 3 4 5 6 6 5Equity Market Neutral 5 5 6 7 7 5 4
Other 4 4 5 6 6 6 6
Fund of Funds 17 16 17 18 22 23 25
Size, as a % of total≤ $100m 29 28 26 24 23 19 15$100m – $1bn 58 61 66 64 63 64 66> $1bn 12 11 8 12 15 17 20
Total capital 127 157 185 235 270 361 463
Estimates of the whole industryVan Hedge Fund Advisors 311 480 520 600 650 820 -TASS Research - - - - - 750 975MAR/Hedge 175 205 - - - - -Hennessee Group 221 324 408 564 592 795 1,000+Samples of other databasesMAR/Hedge, CISDM 128 1211) - - - - 384 2)
Strategy, as a % of total 1998 1999 2000 2001 2002 2003 2004
Directional 53 58 53 50 52 54 50Long/Short Equity Hedge 23 34 38 35 36 32 32Dedicated Short Bias ... ... ... ... ... ... ...Global Macro 11 6 4 4 5 7 4Emerging Markets 10 11 7 6 6 9 7Managed Futures 7 6 4 4 5 6 7
Event Driven 1 2 5 4 3 3 4
Market Neutral 13 12 12 14 14 14 13Fixed Income Arbitrage 8 6 3 3 3 3 6Convertible Arbitrage 2 1 3 5 5 5 3Equity Market Neutral 3 5 6 6 6 5 4
Other 3 5 8 9 6 4 4
Fund of Funds 30 23 22 24 26 26 29
Size, as a % of total≤ $100m 24 23 23 22 20 15 12$100m – $1bn 68 60 59 63 66 68 69> $1bn 9 18 18 15 14 17 19
Total capital 24 35 42 55 71 104 137
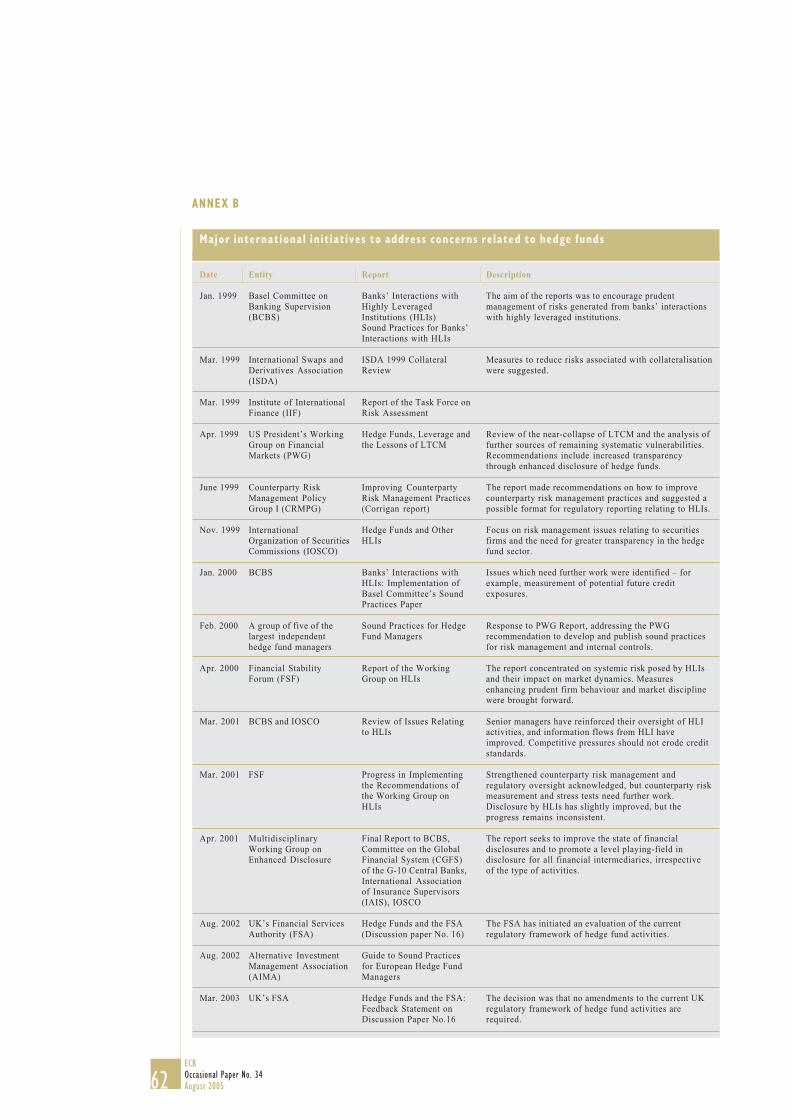
62ECBOccasional Paper No. 34August 2005
ANNEX B
Date Entity
Jan. 1999 Basel Committee onBanking Supervision(BCBS)
Mar. 1999 International Swaps andDerivatives Association(ISDA)
Mar. 1999 Institute of InternationalFinance (IIF)
Apr. 1999 US President’s WorkingGroup on FinancialMarkets (PWG)
June 1999 Counterparty RiskManagement PolicyGroup I (CRMPG)
Nov. 1999 InternationalOrganization of SecuritiesCommissions (IOSCO)
Jan. 2000 BCBS
Feb. 2000 A group of five of thelargest independenthedge fund managers
Apr. 2000 Financial StabilityForum (FSF)
Mar. 2001 BCBS and IOSCO
Mar. 2001 FSF
Apr. 2001 MultidisciplinaryWorking Group onEnhanced Disclosure
Aug. 2002 UK’s Financial ServicesAuthority (FSA)
Aug. 2002 Alternative InvestmentManagement Association(AIMA)
Mar. 2003 UK’s FSA
Report
Banks’ Interactions withHighly LeveragedInstitutions (HLIs)Sound Practices for Banks’Interactions with HLIs
ISDA 1999 CollateralReview
Report of the Task Force onRisk Assessment
Hedge Funds, Leverage andthe Lessons of LTCM
Improving CounterpartyRisk Management Practices(Corrigan report)
Hedge Funds and OtherHLIs
Banks’ Interactions withHLIs: Implementation ofBasel Committee’s SoundPractices Paper
Sound Practices for HedgeFund Managers
Report of the WorkingGroup on HLIs
Review of Issues Relatingto HLIs
Progress in Implementingthe Recommendations ofthe Working Group onHLIs
Final Report to BCBS,Committee on the GlobalFinancial System (CGFS)of the G-10 Central Banks,International Associationof Insurance Supervisors(IAIS), IOSCO
Hedge Funds and the FSA(Discussion paper No. 16)
Guide to Sound Practicesfor European Hedge FundManagers
Hedge Funds and the FSA:Feedback Statement onDiscussion Paper No.16
Description
The aim of the reports was to encourage prudentmanagement of risks generated from banks’ interactionswith highly leveraged institutions.
Measures to reduce risks associated with collateralisationwere suggested.
Review of the near-collapse of LTCM and the analysis offurther sources of remaining systematic vulnerabilities.Recommendations include increased transparencythrough enhanced disclosure of hedge funds.
The report made recommendations on how to improvecounterparty risk management practices and suggested apossible format for regulatory reporting relating to HLIs.
Focus on risk management issues relating to securitiesfirms and the need for greater transparency in the hedgefund sector.
Issues which need further work were identified – forexample, measurement of potential future creditexposures.
Response to PWG Report, addressing the PWGrecommendation to develop and publish sound practicesfor risk management and internal controls.
The report concentrated on systemic risk posed by HLIsand their impact on market dynamics. Measuresenhancing prudent firm behaviour and market disciplinewere brought forward.
Senior managers have reinforced their oversight of HLIactivities, and information flows from HLI haveimproved. Competitive pressures should not erode creditstandards.
Strengthened counterparty risk management andregulatory oversight acknowledged, but counterparty riskmeasurement and stress tests need further work.Disclosure by HLIs has slightly improved, but theprogress remains inconsistent.
The report seeks to improve the state of financialdisclosures and to promote a level playing-field indisclosure for all financial intermediaries, irrespectiveof the type of activities.
The FSA has initiated an evaluation of the currentregulatory framework of hedge fund activities.
The decision was that no amendments to the current UKregulatory framework of hedge fund activities arerequired.
Major international init iat ives to address concerns related to hedge funds
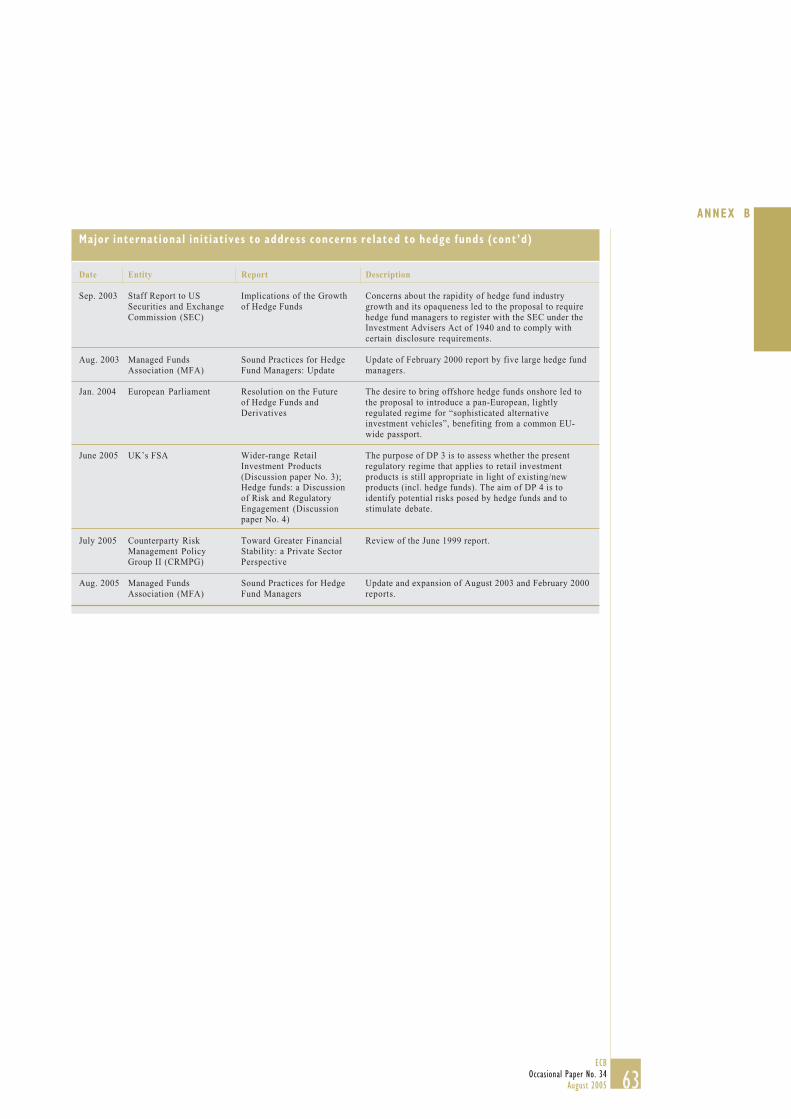
63ECB
Occasional Paper No. 34August 2005
ANNEX B
Date Entity
Sep. 2003 Staff Report to USSecurities and ExchangeCommission (SEC)
Aug. 2003 Managed FundsAssociation (MFA)
Jan. 2004 European Parliament
June 2005 UK’s FSA
July 2005 Counterparty RiskManagement PolicyGroup II (CRMPG)
Aug. 2005 Managed FundsAssociation (MFA)
Report
Implications of the Growthof Hedge Funds
Sound Practices for HedgeFund Managers: Update
Resolution on the Futureof Hedge Funds andDerivatives
Wider-range RetailInvestment Products(Discussion paper No. 3);Hedge funds: a Discussionof Risk and RegulatoryEngagement (Discussionpaper No. 4)
Toward Greater FinancialStability: a Private SectorPerspective
Sound Practices for HedgeFund Managers
Description
Concerns about the rapidity of hedge fund industrygrowth and its opaqueness led to the proposal to requirehedge fund managers to register with the SEC under theInvestment Advisers Act of 1940 and to comply withcertain disclosure requirements.
Update of February 2000 report by five large hedge fundmanagers.
The desire to bring offshore hedge funds onshore led tothe proposal to introduce a pan-European, lightlyregulated regime for “sophisticated alternativeinvestment vehicles”, benefiting from a common EU-wide passport.
The purpose of DP 3 is to assess whether the presentregulatory regime that applies to retail investmentproducts is still appropriate in light of existing/newproducts (incl. hedge funds). The aim of DP 4 is toidentify potential risks posed by hedge funds and tostimulate debate.
Review of the June 1999 report.
Update and expansion of August 2003 and February 2000reports.
Major international init iat ives to address concerns related to hedge funds (cont’d)

64ECBOccasional Paper No. 34August 2005
REFERENCES
1. Alternative Investment Management Association (2002), “Guide to Sound Practices forEuropean Hedge Fund Managers”, August.
2. Asset Management Expert Group (2004), “Financial Services Action Plan: Progress andProspects, Final Report by the Asset Management Expert Group”, May.
3. Atiyah, S. and A. Walters (2004), “Hedge Funds – An Overview”, Butterworths Journal ofInternational Banking and Financial Law, May, pp. 173-77.
4. Atkins, P. S. (2004), “Open Meeting to Consider the Registration of Hedge Fund Advisors”,speech, 26 October.
5. Avery, H. (2005), “Hedge Funds Register Scorn at SEC Ruling”, Euromoney, March,pp. 36-39.
6. Barclays Capital (2003), “Observations on the Rapid Growth of the Hedge Fund Industry”,December.
7. Basel Committee on Banking Supervision (1999a), “Banks’ Interactions with HighlyLeveraged Institutions”, January.
8. Basel Committee on Banking Supervision (1999b), “Sound Practices for Banks’ Interactionswith Highly Leveraged Institutions”, January.
9. Basel Committee on Banking Supervision (2000), “Banks’ Interactions with HighlyLeveraged Institutions: Implementation of the Basel Committee’s Sound Practices Paper”,January.
10. Basel Committee on Banking Supervision and the International Organization of SecuritiesCommissions (2001), “Review of Issues Relating to Highly Leveraged Institutions (HLIs)”,March.
11. Bernstein, P. J. (2002), “The Hedge Fund Mystique”, Journal of Accountancy, May, p. 55.
12. Bradbery, A. (2004), “U.K. Pension Managers Turn to Hedge Funds”, Wall Street Journal,18 August.
13. British Bankers’ Association (2004), “Credit Derivatives Report – 2003/04”, September.
14. Chan, N., M. Getmansky, S. M. Haas and A. W. Lo (2005), “Systemic Risk and HedgeFunds”, NBER, WP 11200, March.
15. Counterparty Risk Management Policy Group (1999), “Improving Counterparty RiskManagement Practices”, June.
16. Counterparty Risk Management Policy Group (2005), “Toward Greater Financial Stability: aPrivate Sector Perspective”, July.
65ECB
Occasional Paper No. 34August 2005
REFERENCES
17. Deutsche Bank (2004), “2004 Alternative Investment Survey. Hedge Funds: Full SpeedAhead”, February.
18. Deutsche Bank (2005), “2005 Alternative Investment Survey”, July.
19. Economist (2005), “The New Money Men”, 19 February, pp. 59-61.
20. Eichengreen, B., D. Mathieson, B. Chadha, A. Jansen, L. Kodres and S. Sharma (1998),“Hedge Funds and Financial Market Dynamics”, International Monetary Fund OccasionalPaper, No 166, May.
21. Eichengreen, B. and D. Mathieson (1999), “Hedge Funds: What Do We Really Know?”,Economic Issues, No 19, International Monetary Fund, September.
22. EuroHedge (2004), “Chasing Pack Continue to Close Gap on the Big Two”, March, pp. 19-21.
23. European Central Bank (2004), Financial Stability Review, December.
24. European Central Bank (2005), Financial Stability Review, June.
25. European Commission (2005a), “Green Paper on Financial Services Policy (2005-2010)”,COM(2005) 177, May.
26. European Commission (2005b), “Green Paper on the Enhancement of the EU Framework forInvestment Funds”, COM(2005) 314, July.
27. European Parliament (2003), “Report on the Future of Hedge Funds and Derivatives”,Committee on Economic and Monetary Affairs, 17 December.
28. European Parliament (2004), “Resolution on the Future of Hedge Funds and Derivatives”,January.
29. Financial Stability Forum (2000), “Report of the Working Group on Highly LeveragedInstitutions”, April.
30. Financial Stability Forum (2002), “Recommendations and Concerns Raised by HighlyLeveraged Institutions: An Assessment”, March.
31. Fitch Ratings (2005), “Hedge Funds: An Emerging Force in the Global Credit Markets”, July.
32. Getmansky, M., A. W. Lo and I. Makarov (2003), “Serial Correlation and Illiquidity in HedgeFund Returns”, April.
33. Gradante, C. J. (2003), “Comments of Hennessee Group LLC for the U.S. SEC Roundtable onHedge Funds”, May.
34. Haigh, M. S., J. Hranaiova and J. A. Overdahl (2005), “Price Dynamics, Price Discovery andLarge Futures Trader Interactions in the Energy Complex”, CFTC, April.
66ECBOccasional Paper No. 34August 2005
35. Hedges, J. R. IV (2004a), “Size vs. Performance in the Hedge Fund Industry”, Journal ofFinancial Transformation, Vol. 10, Capco Institute, April.
36. Hedges, J. R. IV (2004b), “Hedge Fund Indices”, Journal of Financial Transformation,Vol. 11, Capco Institute, August.
37. Institute of International Finance (1999), “Report of the Task Force on Risk Assessment”.
38. International Financial Services, London (2004), “Hedge Funds”, City Business Series, June.
39. International Financial Services, London (2005), “Hedge Funds”, City Business Series,April.
40. International Monetary Fund (2004), “Global Financial Stability Report”, September.
41. International Organization of Securities Commissions (1999), “Hedge Funds and OtherHighly Leveraged Institutions”, November.
42. International Organization of Securities Commissions (2003), “Regulatory and InvestorProtection Issues Arising from the Participation by Retail Investors”, February.
43. International Swaps and Derivatives Association (1999), “ISDA 1999 Collateral Review”,March.
44. Joint Forum (2004), “Financial Disclosure in the Banking, Insurance and Securities Sectors:Issues and Analysis”, May.
45. Kundro, C. and S. Feffer (2004), “Valuation Issues and Operational Risk in Hedge Funds”,Journal of Financial Transformation, Vol. 11, Capco Institute, August, pp. 41-47.
46. Maiden, B. (2004), “SEC Faces Challenges to Authority on Fund Rules”, InternationalFinancial Law Review, October.
47. Malkiel, B. G. and A. Saha (2004), “Hedge Funds: Risk and Return”, October.
48. Managed Funds Association (2000), “Sound Practices for Hedge Fund Managers”, February.
49. Managed Funds Association (2003), “Sound Practices for Hedge Fund Managers: Update”,August.
50. Managed Funds Association (2005), “MFA’s 2005 Sound Practices for Hedge FundManagers”, August.
51. McGuire, P., E. Remolona and K. Tsatsaronis (2005), “Time-varying exposures and leveragein hedge funds”, BIS Quarterly Review, March.
52. Multidisciplinary Working Group on Enhanced Disclosure (2001), “Final Report to BCBS,CGFS, IAIS and IOSC”, April.
67ECB
Occasional Paper No. 34August 2005
REFERENCES
53. Osterberg, W. and J. Thomson (1999), “The Truth about Hedge Funds”, Federal ReserveBank of Cleveland, May.
54. Persaud, A. (2001), “The Puzzling Decline in Financial Market Liquidity” and “Sending theHerd Off the Cliff Edge: the Disturbing Interaction between Herding and Market-SensitiveRisk Management Practices”, published in “Market Liquidity: Proceedings of a WorkshopHeld at the BIS”, BIS Papers, No. 2, April.
55. PricewaterhouseCoopers (2004a), “Investment Management Perspectives”, March.
56. PricewaterhouseCoopers (2004b), “The Regulation and Distribution of Hedge Funds inEurope, Changes and Challenges: Update”, May.
57. Pütz, A. and C. Schmies (2004), “Hedge Fund Regulation in Germany”, Journal ofInternational Banking Law and Regulation, No 5, pp. 177-83.
58. Radley & Associates (2005), “The Hedge Fund Industry and the City”, June.
59. Sants, H. (2004), “FSA’s Outlook on Asset Management Risks, Priorities and Challenges”,speech, 28 September.
60. Securities and Exchange Commission (2003), “Implications of the Growth of Hedge Funds”,staff report to the United States Securities and Exchange Commission, September.
61. Securities and Exchange Commission (2004), “Registration under the Advisers Act ofCertain Hedge Fund Advisers – 17 CFR Parts 275 and 279”, Federal Register, Vol. 69,No 144, 28 July.
62. Strategic Financial Solutions (2004), “Database Study 2004: Executive Summary”,10 November.
63. Trichet, J.-C. (2005), “European Financial Integration: the Views of the ECB”, Speech at theEUROPLACE, International Financial Forum, 6 July.
64. UK’s Financial Services Authority (2002), “Hedge Funds and the FSA”, Discussion Paper,No 16, August.
65. UK’s Financial Services Authority (2003), “Hedge Funds and the FSA: Feedback Statementon Discussion Paper 16”, March.
66. UK’s Financial Services Authority (2005a), “Wider-range Retail Investment Products”,Discussion Paper, No. 3, June.
67. UK’s Financial Services Authority (2005b), “Hedge Funds: a Discussion of Risk andRegulatory Engagement”, Discussion Paper, No. 4, June.
68. US President’s Working Group on Financial Markets (1999), “Hedge Funds, Leverage, andthe Lessons of Long-term Capital Management”, April.
68ECBOccasional Paper No. 34August 2005
69. US Securities and Exchange Commission (2003), “Implications of the Growth of HedgeFunds”, September.
70. Vaughan, D. A. (2003), “Selected Definitions of Hedge Fund”, comments for the US SECRoundtable on Hedge Funds, 14-15 May.
71. Wolcott, R. (2004), “Insurers Consider Alternative Route”, Risk, August, pp. 23-25.
69ECB
Occasional Paper No. 34August 2005
1 INTRODUCT ION
GLOSSARY
Absolute return – portfolio return without subtracting any benchmark return.
Alpha – return associated with active asset management. Also referred to as non-systematic riskor specific risk, as opposed to systemic or overall market risk.
Alternative investments – a broad category of investments, other than stocks and bonds,including venture capital, private equity, real estate, precious metals, collectibles and hedgefunds.
Arbitrage – in theory, a transaction that produces risk-free profit by exploiting mis-pricedsecurities or any other assets while hedging all risk. In practice, arbitrage strategies do noteliminate all risk and do entail some risk of loss or uncertainty about total profits.
Beta – broadly denotes volatility and returns associated with general or market-wide risks. Ameasure of the volatility relative to the overall market.
Carry trade – involves borrowing funds in a low-yielding currency and investing in a high-yielding one, or purchasing one security with more yield, or carry, than that which is sold.
Crowded trade – a crowded trade could be defined as multiple parties entering into correlatedtrading strategies across one or more markets, where the aggregate volume of trades in themarket(s) is sufficient to constrain the ability of traders to exit from the position on asimultaneous basis without significantly impacting prevailing prices.
Derivative – a financial instrument whose value depends upon the value of an underlyingsecurity. Options, forwards and futures are examples of derivatives.
Domicile of a fund – the location of the legal entity of the fund.
Fund of hedge funds – a fund that invests in other hedge funds for diversification.
Hedge fund – a fund, whose managers generally have no or very limited restrictions on the use ofvarious active investment strategies to achieve positive absolute returns, and receiveperformance-related fees. Such strategies often involve leverage, derivatives, long and shortpositions in securities or any other assets in a wide range of markets.
Herding – A situation in which traders emulate or follow the actions of other traders.
Hurdle rate – the minimum return that must be generated before fund managers may receive anyperformance allocation.
Leverage – economic (debt) leverage is associated with increased assets under management,whereas financial (investment) leverage refers to making investments on margin, where the costof investment is less than the exposure it generates (e.g. through the use of financial derivatives).
Lock-up period – the time during which an investor cannot withdraw invested money.

70ECBOccasional Paper No. 34August 2005
Management fee – an annual fee calculated as a percentage of average capital undermanagement.
Performance fee – the percentage that the hedge fund manager takes of the return of the fund.
Short-selling – the sale of borrowed assets that a seller does not own.
VaR (Value at Risk) – the estimated maximum potential loss to a portfolio over a given timeperiod at a given level of confidence. For example, if a ten-day VaR at 99 confidence level is€100,000, then we can conclude that 99% of the time the portfolio will not decline more than€100,000 in value within 10 days.
Watermark – a fund valuation below which performance fees are not paid. With a highwatermark, performance (incentive) fees are paid only if cumulative performance recovers anypast shortfalls. For example, a hedge fund manager who loses in the first year and then merelyregains that loss in the second year will not receive an incentive payment for the second year’sgain.
Wrappers – performance-linked instruments, including unit-linked insurance policies andstructured notes, which mimic the performance of a hedge fund.
71ECB
Occasional Paper No. 34August 2005
REFERENCES
EUROPEAN CENTRAL BANKOCCASIONAL PAPER SERIES
1 “The impact of the euro on money and bond markets” by J. Santillán, M. Bayle andC. Thygesen, July 2000.
2 “The effective exchange rates of the euro” by L. Buldorini, S. Makrydakis and C. Thimann,February 2002.
3 “Estimating the trend of M3 income velocity underlying the reference value for monetarygrowth” by C. Brand, D. Gerdesmeier and B. Roffia, May 2002.
4 “Labour force developments in the euro area since the 1980s” by V. Genre andR. Gómez-Salvador, July 2002.
5 “The evolution of clearing and central counterparty services for exchange-tradedderivatives in the United States and Europe: a comparison” by D. Russo,T. L. Hart and A. Schönenberger, September 2002.
6 “Banking integration in the euro area” by I. Cabral, F. Dierick and J. Vesala,December 2002.
7 “Economic relations with regions neighbouring the euro area in the ‘Euro Time Zone’” byF. Mazzaferro, A. Mehl, M. Sturm, C. Thimann and A. Winkler, December 2002.
8 “An introduction to the ECB’s survey of professional forecasters” by J. A. Garcia,September 2003.
9 “Fiscal adjustment in 1991-2002: stylised facts and policy implications” by M. G. Briotti,February 2004.
10 “The acceding countries’ strategies towards ERM II and the adoption of the euro:an analytical review” by a staff team led by P. Backé and C. Thimann and includingO. Arratibel, O. Calvo-Gonzalez, A. Mehl and C. Nerlich, February 2004.
11 “Official dollarisation/euroisation: motives, features and policy implications of currentcases” by A. Winkler, F. Mazzaferro, C. Nerlich and C. Thimann, February 2004.
12 “Understanding the impact of the external dimension on the euro area: trade, capital flows andother international macroeconomic linkages“ by R. Anderton, F. di Mauro and F. Moneta,March 2004.
13 “Fair value accounting and financial stability” by a staff team led by A. Enria and includingL. Cappiello, F. Dierick, S. Grittini, A. Maddaloni, P. Molitor, F. Pires and P. Poloni,April 2004.
14 “Measuring Financial Integration in the Euro Area” by L. Baele, A. Ferrando, P. Hördahl,E. Krylova, C. Monnet, April 2004.
72ECBOccasional Paper No. 34August 2005
15 “Quality adjustment of European price statistics and the role for hedonics” by H. Ahnert andG. Kenny, May 2004.
16 “Market dynamics associated with credit ratings: a literature review” by F. Gonzalez, F. Haas,R. Johannes, M. Persson, L. Toledo, R. Violi, M. Wieland and C. Zins, June 2004.
17 “Corporate ‘Excesses’ and financial market dynamics” by A. Maddaloni and D. Pain, July 2004.
18 “The international role of the euro: evidence from bonds issued by non-euro area residents” byA. Geis, A. Mehl and S. Wredenborg, July 2004.
19 “Sectoral specialisation in the EU a macroeconomic perspective” by MPC task force of theESCB, July 2004.
20 “The supervision of mixed financial services groups in Europe” by F. Dierick, August 2004.
21 “Governance of securities clearing and settlement systems” by D. Russo, T. Hart,M. C. Malaguti and C. Papathanassiou, October 2004.
22 “Assessing potential output growth in the euro area: a growth accounting perspective”by A. Musso and T. Westermann, January 2005.
23 “The bank lending survey for the euro area” by J. Berg, A. van Rixtel, A. Ferrando,G. de Bondt and S. Scopel, February 2005.
24 “Wage diversity in the euro area: an overview of labour cost differentials acrossindustries” by V. Genre, D. Momferatou and G. Mourre, February 2005.
25 “Government debt management in the euro area: recent theoretical developments and changesin practices” by G. Wolswijk and J. de Haan, March 2005.
26 “The analysis of banking sector health using macro-prudential indicators” by L. Mörttinen,P. Poloni, P. Sandars and J. Vesala, March 2005.
27 “The EU budget – how much scope for institutional reform?” by H. Enderlein, J. Lindner,O. Calvo-Gonzalez, R. Ritter, April 2005.
28 “Reforms in selected EU network industries” by R. Martin, M. Roma, I. Vansteenkiste,April 2005.
29 “Wealth and asset price effects on economic activity”, by F. Altissimo, E. Georgiou,T. Sastre, M. T. Valderrama, G. Sterne, M. Stocker, M. Weth, K. Whelan, A. Willman,June 2005.
30 “Competitiveness and the export performance of the euro area”, by a Task Force of theMonetary Policy Committee of the European System of Central Banks, June 2005.

73ECB
Occasional Paper No. 34August 2005
REFERENCES
31 “Regional monetary integration in the member states of the Gulf Cooperation Council(GCC)” by M. Sturm and N. Siegfried, June 2005.
32 “Managing Financial Crises in Emerging Market Economies: Experience with theInvolvement of Private Sector Creditors”, by an International Relations Committee taskforce, July 2005.
33 “Integration of securities market infrastructures in the euro area”, by H. Schmiedel,A. Schönenberger, July 2005.
34 “Hedge funds and their implications for financial stability”, by T. Garbaravicius andF. Dierick, August 2005.