Hedge Fund Investment Strategies -Final
19
HEDGE FUNDS AN OVERVIEW AND INVESTMENT STRATEGIES Maniranjan Kumar
-
Upload
killmyklone -
Category
Documents
-
view
218 -
download
0
Transcript of Hedge Fund Investment Strategies -Final

8/13/2019 Hedge Fund Investment Strategies -Final
http://slidepdf.com/reader/full/hedge-fund-investment-strategies-final 1/20
HEDGE FUNDSAN OVERVIEW AND INVESTMENT STRA
Maniranjan Kumar

8/13/2019 Hedge Fund Investment Strategies -Final
http://slidepdf.com/reader/full/hedge-fund-investment-strategies-final 2/20
Hedge Funds aren’t hedged. On the contrary, they are illiquid, quite leverag
and failure prone. However, most Hedge Funds do produce returns at lower s
exhibit low tail risk and low correlations with bond portfolios, in particular.
Despite negative publicity and lack of transparency, Hedge Funds have mushr
continued to attract assets. There’re about 8,000 of them with $2.25 trilliothese funds are normally classified in four buckets, namely Relative Value, Eve
Hedge and Tactical Trading. Of these, Fundamental Value strategy in Equity
Situations and Distressed/Restructuring in Event Driven, Discretionary Themati
Diversified in Tactical Trading, and Fixed Income Arbitrage in Relative Value a
As examples, BHEL can be a case study for a Fundamental Value trade, S
Situations, Indian Rupee for Discretionary Thematic, and India VIX inde
Arbitrage. However, most Hedge Fund strategies are difficult to employ in Ind
liquidity, leverage needs, regulations, public scrutiny or an unavailability of ins
However, Hedge Funds can be evil, very evil. Amaranth, Tiger and LTCM are p

8/13/2019 Hedge Fund Investment Strategies -Final
http://slidepdf.com/reader/full/hedge-fund-investment-strategies-final 3/20
Hedge Funds are leveraged, illiquid, unregula
likely-to-fail but can produce returns at lower
Hedge Funds Mutual Funds Private Equity Venture Capital
Leverage Highly levered up
to 20-30 times
Unlevered almost
always
Except LBO deals,
others unlevered
Unlevered
Liquidity 1 day to many
years
Daily 8-10 years except
exits
3-8 years except
exits
Investment
Horizon
1 day to many
years
Medium-to-long
term, in general
Long-term Long-term
Public or Private Private Public Private Private
Return
Expectations
Uncorrelated and
lower sharpe
Track the market
benchmark
Between 10-25% Around 25%
Active or Passive Active trading but
passive investments
Mostly passive
investments
Mostly active
investments
Very active
investments
Risks Unregulated, very
risky, many fail
Highly regulated,
low returns
Long gestation,
mediocre returns
Long gestation,
7-2-1 model

8/13/2019 Hedge Fund Investment Strategies -Final
http://slidepdf.com/reader/full/hedge-fund-investment-strategies-final 4/20
Hedge Funds outperform stocks, bonds and co
with higher Sharpe ratio and lower tail risk
Source: S&P, Barclays, Dow Jones, HFRI
0%
2%
4%
6%
8%
10%
12%
0% 5% 10% 15% 20%
A n n u a l i z e d R e t u r n
Annualized Standard Deviation
Jan 92 –
Jun 12
S&P 500 Total Return IndexBarclays Capital Global Aggregate Bond IndexDow Jones UBS Commodity (TR) Index
HFRI Fund Weighted Composite Index
S&P 500
Total
Return
BarclaCapita
Globa
Aggre
Bond
Cumulative Return 493% 3
Annualized Return 8%
Annualized Std Deviation 15%
Sharpe Ratio 0.27
Max monthly drawdown -17%
Date max mthly
drawdown 31 Oct 08 30 No
% Positive returns 64%
Skew -0.67 -
Kurtosis 1.18
VaR 99% (Historical) 27%

8/13/2019 Hedge Fund Investment Strategies -Final
http://slidepdf.com/reader/full/hedge-fund-investment-strategies-final 5/20
There are diversification benefits with Hedge
particularly low correlations with bond portfo
Source: NBER, S&P, Barclays, Dow Jones, HFRI
-0.6
-0.4
-0.2
0.0
0.2
0.4
0.6
0.8
1.0
J a n 9 5
J a n 9 6
J a n 9 7
J a n 9 8
J a n 9 9
J a n 0 0
J a n 0 1
J a n 0 2
J a n 0 3
J a n 0 4
J a n 0 5
J a n 0 6
J a n 0 7
J a n 0 8
3 year rolling correlation with HFRI fund weighted composite index from Dec 1991 thr
S&P 500 Total Return Index Barclays Capital Global Aggregate Bond Index Dow Jones U
Shaded a
(Mar 01-
8/13/2019 Hedge Fund Investment Strategies -Final
http://slidepdf.com/reader/full/hedge-fund-investment-strategies-final 6/20
There are selection and survivorship biases in
but evidences do prove that Hedge Funds out
Source: NBER, S&P, Barclays, Dow Jones, HFRI, KPMG
0
100
200
300
400
500
600
700
800
900
D e c 9 1
D e c 9 2
D e c 9 3
D e c 9 4
D e c 9 5
D e c 9 6
D e c 9 7
D e c 9 8
D e c 9 9
D e c 0 0
D e c 0 1
D e c 0 2
D e c 0 3
D e c 0 4
D e c 0 5
D e c 0 6
D e c 0 7
D e c 0 8
D e c 0 9
D e c 1 0
D e c 1 1
Cumulative Returns of asset classes from Dec 1991 through Jun 2012
S&P 500 Total Return Index Barclays Capital Global Aggregate Bond Index
Dow Jones UBS Commodity (TR) Index HFRI Fund Weighted Composite Index
Shaded areas include US recessions
(Mar 01-Nov 01 & Dec 07-Jun 09)

8/13/2019 Hedge Fund Investment Strategies -Final
http://slidepdf.com/reader/full/hedge-fund-investment-strategies-final 7/20
The industry has grown consistently and is now
consolidating and commoditizing, to an exten
Source: HFRI
(5,00,000)
0
5,00,000
10,00,000
15,00,000
20,00,000
25,00,000Estimated Asset Flow ($ mm)
Estimated Assets ($ mm)
Estimated # of Funds (ex FoFs)

8/13/2019 Hedge Fund Investment Strategies -Final
http://slidepdf.com/reader/full/hedge-fund-investment-strategies-final 8/20
It is difficult to classify Hedge Funds due to a
range of styles and strategies that are deplo
Relative Value Event Driven Equity Hedge Ta
FIXED INCOME
Sovereign
Corporates
Asset Backed
Convertible Arbitrage
EQUITY
Merger Arbitrage
Special Situations
Activist
Private Issue/ Regulation D
FUNDAMENTAL
Equity Market Neutral
Long-Only / Long-Bias
Long / Short
Short-Only / Short-Bias
Geography-Specific
Sector-Specific
Dis
Sy
VOLATILITY
ConvertiblesDerivatives
MULTI-STRATEGY MULTI-STRATEGY MULTI-STRATEGY M
CREDIT
Credit Arbitrage
Distressed / Restructuring
QUANTITATIVE
Statistical Arbitrage
Factor
Diversified Equity
Multi-model
YIELD ALTERNATIVE
Energy Infrastructure
Insurance
Real Estate
MAN
Source: Credit Suisse, HFRI, Russell

8/13/2019 Hedge Fund Investment Strategies -Final
http://slidepdf.com/reader/full/hedge-fund-investment-strategies-final 9/20
Value (EH), Special Situations (ED), Systematic
Multi-strategy (RV) are the most sought strate
Source: HFRI
0
50,000
1,00,000
1,50,000
2,00,000
2,50,000
3,00,0003,50,000
4,00,000
I n m i l l i o n d o l l a
r s
As of June 30, 2012
1 2 3
2 3

8/13/2019 Hedge Fund Investment Strategies -Final
http://slidepdf.com/reader/full/hedge-fund-investment-strategies-final 10/20
Fundamental Value, classified under Equity
very popular, and it encompasses many distin
1
Passive Contrarian Activist
- Screening for market mistakes
- Low risk and high quality earnings
- P/BV < 2/3rd of BV
- P/E < 40% of 5yr average
- P/E < 1/Yield on AAA corp. bond
- Dividend yield > 2/3rd of yield on
AAA corp. bond- D/E < 1
- P < 2/3rd of Net Current Assets
- Growth in EPS in a business cycle
- Quality management
- Consistent operating history
- High and stable profit margins
- High return on equity and capital
employed
Investing in stocks where market
has overreacted
- Stocks that have had bad earnings
declines or deals that have gone
bad are likely to be under valued
- Significant negative serial
correlation in returns (bad yearsfollow good years)
Investing in bad companies
- Markets underestimate the value
of the firm quality
- On the other hand, markets
overpay for good quality firms
- Creating valu
management a
or redeployme
- Divestiture va
value of the ba
- If losing mone
down and sell - ROC < WAC
- Debt and eq
- Cost-cutting m
- Build on comp
and find new b

8/13/2019 Hedge Fund Investment Strategies -Final
http://slidepdf.com/reader/full/hedge-fund-investment-strategies-final 11/20
As an example, BHEL might be a good fund
value candidate, as market has most likely ov
1
2012-13* 2011-12 2010-11 2009-10 2008-09 2007-08
Average price 224.71 331.50 468.98 441.48 302.62 387.47
Price / Sales 1.14 1.70 2.78 3.06 2.57 4.91
Price / BV 1.80 3.19 5.70 6.79 5.72 8.80
Price / Earning 8.22 11.45 19.10 25.07 23.60 33.17
YoY EPS growth -5.56% 17.90% 39.47% 37.35% 9.76% 18.43%
Debt / Equity 0.09 0.01 0.01 0.01 0.01 0.01
EV / EBITDA 5.25 7.51 11.02 13.96 12.33 20.94
Dividend Yield 2.41% 1.93% 1.33% 1.06% 1.12% 0.79%
Net Profit Margin 13.91% 14.89% 14.56% 12.21% 10.87% 14.81%
ROCE / ROE 20% / 22% 28% / 28% 30% / 30% 27% / 27% 24% / 24% 26% / 27%
Order book (Rs. Cr) 1,15,200 1,27,700 1,55,100 1,44,300 1,17,000 85,200
Market Share Decreasing from about 70% in new equipment orders to 50%
Revenue growth 1.07% 15.25% 17.01% 22.30% 49.51% 11.99% * Estimated

8/13/2019 Hedge Fund Investment Strategies -Final
http://slidepdf.com/reader/full/hedge-fund-investment-strategies-final 12/20
Distressed Restructuring and Special Situatio
classified under Event Driven, are very similar
2
Distressed Restructuring Special Situations
- Opportunities in corporate and sovereign fixed
income instruments such as bonds, notes, loans, leases
and unpaid bills
- Instruments trading at significant discounts to FV either
due to bankruptcy proceedings or such an expectation
- Concentrate on sound companies that have taken on
too much debt (‘good company but bad balance sheet’)and that have no operational issue
- Focus on assets selling for 75 cents a dollar or less
- Typically, 60-70% of assets are successfully
restructured and target of 25-25% IRR
- Employ fundamental credit processes focused on
valuation, asset coverage and recovery and not on
actively managing turnaround
- Opportunities in equity and equi
- Employ an investment process foc
wide spectrum of corporate life cy
but not limited to distressed, bank
bankruptcy security issuance, anno
and corporate division spin-offs, a
security issuance/repurchase or co- Merger Arbitrage is a niche in its
separately
- Realization of shareholder value
occurrence of some identifiable ca
- Focus on assets about to appreci
catalyst

8/13/2019 Hedge Fund Investment Strategies -Final
http://slidepdf.com/reader/full/hedge-fund-investment-strategies-final 13/20
Suzlon acquired RE Power, an excellent busi
too big for the belly, now it faces a Special S
2
P&L Statement (In Cr except per share data)
Revenue 18,913.53
Net Income -4,723.96
Earnings per Share -26.58
Share Price 13.65
P/E -0.51
EBITDA Calculatio
Net Income
+ Taxes
+ Interest Expen
+ Dep. & Amor
EBITDA
Balance Sheet (In Cr except per share data)
Current Assets 14,690.89
Property, Plant & Equipment 6,588.42
Goodwill on consolidation 7,727.59
Total Assets 29,006.90
Current Liabilities 13,415.94
Other Liabilities & Provisions 912.48
Debt 13,692.35
Total Shareholder's Funds 986.13
Total Liabilities & Equity 29,006.90
Number of Shares 178
Selected Data
EBITDA/Revenue % -9.41%
Debt/EBITDA -7.70x
EBIDTA/Share -10.01
Interest Rate 13.55%
Tax Rate Consolidated
Revenue/Assets 65.20%
Enterprise Value (
Equity Market Cap
+ Debt
- Cash
Enterprise Value
EV/EBITDA
[(LTM EBITDA*6) - No of Shares

8/13/2019 Hedge Fund Investment Strategies -Final
http://slidepdf.com/reader/full/hedge-fund-investment-strategies-final 14/20
By lengthening the amortization of debt an
the capital, a good return can be made
2
Period
1 2 3 4 5 6 7 8
EBITDA - Capex 1,500 1,575 1,654 1,737 1,824 1,915 2011 21
Interest 700 630 560 490 420 350 280 2
Available 800 945 1,094 1,247 1,404 1,565 1,731 1,90
Beginning Debt 7,000 6,300 5,600 4,900 4,200 3,500 2,800 2,10
Amortization 700 700 700 700 700 700 700 70
For equity owners 100 245 394 547 704 865 1,031 1,20
EBITDA – Capex 1,500 Crores
Growth Rate % 5%
Debt
Amortizat
Infuse equity worth 6,692 Crores and retire debt, and economic cycle turns expansionary
8/13/2019 Hedge Fund Investment Strategies -Final
http://slidepdf.com/reader/full/hedge-fund-investment-strategies-final 15/20
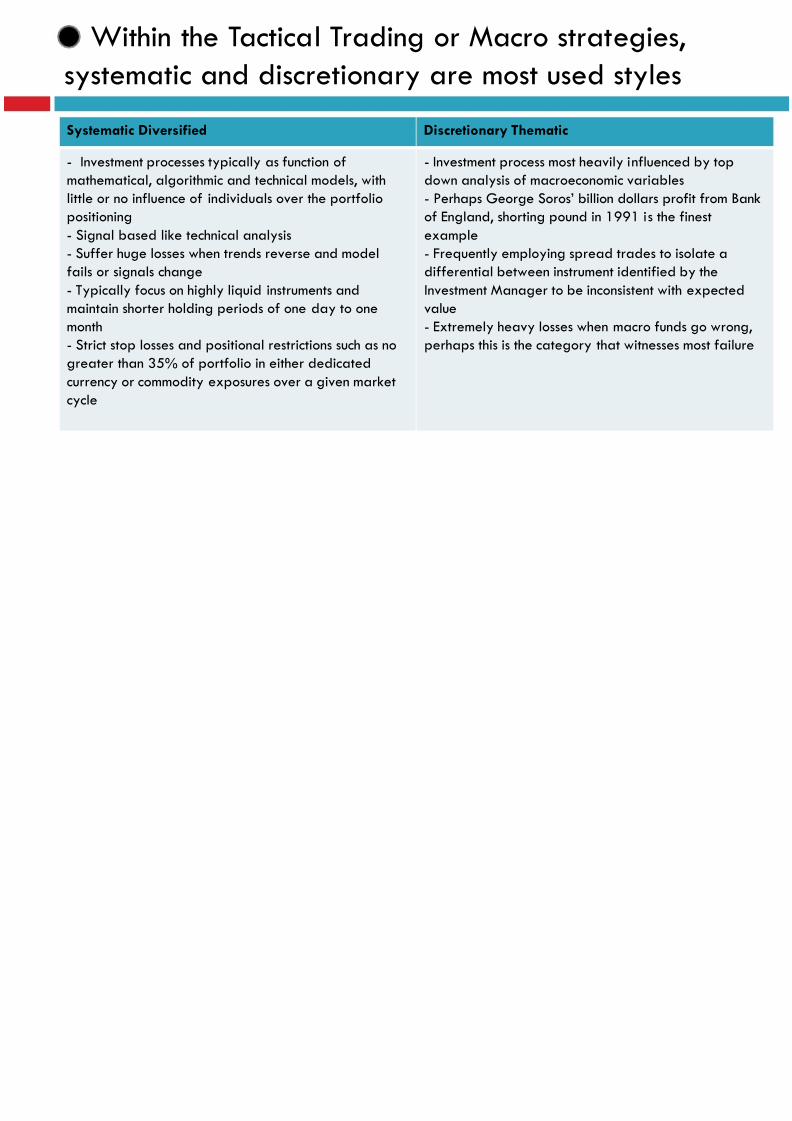
Within the Tactical Trading or Macro strate
systematic and discretionary are most used st
3
Systematic Diversified Discretionary Thematic
- Investment processes typically as function of
mathematical, algorithmic and technical models, with
little or no influence of individuals over the portfolio
positioning
- Signal based like technical analysis
- Suffer huge losses when trends reverse and model
fails or signals change
- Typically focus on highly liquid instruments and
maintain shorter holding periods of one day to one
month
- Strict stop losses and positional restrictions such as no
greater than 35% of portfolio in either dedicated
currency or commodity exposures over a given market
cycle
- Investment process most heavily i
down analysis of macroeconomic v
- Perhaps George Soros’ billion do
of England, shorting pound in 199
example
- Frequently employing spread tra
differential between instrument ide
Investment Manager to be inconsis
value
- Extremely heavy losses when ma
perhaps this is the category that w

8/13/2019 Hedge Fund Investment Strategies -Final
http://slidepdf.com/reader/full/hedge-fund-investment-strategies-final 16/20
A possible discretionary macro trade was b
since 2008 credit crisis to short Indian Rupee
3
0
500
1000
1500
2000
2500
2000 2001 2002 2003 2004 2005 2006 2007 2008 2009 2010 20
Gross domestic product, current prices USD Billions Total External Debt USD BillioCurrent account balance % of GDP Inflation, average consumer p
Source: IMF, World Bank, Ministry of Finance, Reserve Bank of India

8/13/2019 Hedge Fund Investment Strategies -Final
http://slidepdf.com/reader/full/hedge-fund-investment-strategies-final 17/20
Shorting of Rupee could be combined with
NIFTY long, as they appear inversely uncorre
3
50
52
54
56
58
60
62
64
5000
5200
5400
5600
5800
6000
6200
6400
01-Jan-13 01-Feb-13 01-Mar-13 01-Apr-13 01-May-13 01-Jun-13
Nifty
USD-INR
Source: National Stock Exchange, Reserve Bank of India
1. OnNIFTY
rollov
2. Sel
3. Ap
5% in
3. In t
may b
far-of
liquid
and m

8/13/2019 Hedge Fund Investment Strategies -Final
http://slidepdf.com/reader/full/hedge-fund-investment-strategies-final 18/20
Relative Value trades are predicated on re
of a spread between related yield instrumen
4
- One or multiple components of the spread typically contains a fixed income or volatility ins
- Fixed Income instruments include Asset Backed financial obligations, Convertible Bonds (for carbitrage), Sovereign Debt and Corporate Debt
- Volatility instruments are both listed and unlisted, and typically maintain characteristic sensit
implied and realized volatilities
0
10
20
30
40
50
60
70
0
1000
2000
3000
4000
5000
6000
7000
02-Mar-09 02-Mar-10 02-Mar-11 02-Mar-12 02-Mar-13
CNX Nifty
Market’s ex
short-term v
indicated nemarket since
has stayed i
Selling VIX a
could have
short volatil
trade for po
Source: National Stock Exchange
India VIX is a volatility index based on the NIFTY Index Option prices. From the best bid-ask prices of NIFTY Options contracts, acalculated which indicates the expected market volatility over the next 30 calendar days

8/13/2019 Hedge Fund Investment Strategies -Final
http://slidepdf.com/reader/full/hedge-fund-investment-strategies-final 19/20
Hedge Funds or not, investing in particular, or
as such, are very humbling
Amaranth Advisors
(Managed Futures) 2006 Lost$6bn of
$9bn
1. Long natural gas futures in expectation of eithestrong hurricane season
2. Energy trader Brian Hunter had made $100mm
on natural gas prices on back of hurricane Katr
Tiger Funds
(Fundamental Value)
2000 Lost
$2bn of
$22bn
1. Its not the losses but Julian Robertson’s bullishne
made him famous or rather look miserable
2. Also, his shorting of tech stocks became an irony
highs before bursting
3. He lost about $2bn on a single day move in ye
Long-term Capital
Management
(FI Sovereign)
1998 Lost
$4bn of
$4.8bn
1. The failure is even more remarkable because o
celebrated partners, Myron Scholes and Rober
prize winners of economics
2. Leverage and short volatility positions were the
$4.8bn in equity and $124.5bn in borrowings)
3. Russian default was the nail in the coffin

8/13/2019 Hedge Fund Investment Strategies -Final
http://slidepdf.com/reader/full/hedge-fund-investment-strategies-final 20/20
Thank you